Racial/Ethnic Composition South Hayward, 2010
|
|
|
- Barbara Tate
- 5 years ago
- Views:
Transcription


")
1 South Hayward Data Alameda County Public Health Department Community Assessment, Planning, Education, and Evaluation (CAPE) Epidemiology Team May 7, 2014
2
3 Racial/Ethnic Composition South Hayward, 2010 South Hayward Alameda County Asian 23.4% American Multirace Indian 3.9% 0.3% Other 0.3% Pacific Islander 4.4% Latino 44.3% Asian 25.9% Multirace 4.0% American Pacific Indian Islander 0.3% 0.8% Other 0.3% Latino 22.5% African American 8.1% White 15.3% African American 12.2% White 34.1% Population=37,971 Population=1,510,271 Source: Census, 2010
4 Population Change by Race/Ethnicity South Hayward, Race/Ethnicity Segments growing Latino (+20%), Pacific Islander (+ 72%) Segments declining White (-34%) American Indian(-23%) Source: Census, 2000 and 2010
5 Population by Age and Sex South Hayward, 2010 South Hayward Age Group <5 Female Male 5% 4% 3% 2% 1% 0% 1% 2% 3% 4% 5% Percentage of Total Population Source: Census, 2010
6 Demographic Overview for South Hayward Population Size and Change Area Population 2010 % Population Change (2000 to 2010) South Hayward 37, % Hayward 144, % Oakland 390, % Alameda County 1,510, % Source: Census, 2000 and 2010
7 Limited English Proficiency Area % Limited English Proficiency South Hayward 32.7% Hayward 28.0% Oakland 21.7% Alameda County 18.9% Rate higher than the County rate Source: American Community Survey,
8 Languages Spoken at Home Area English only Spanish Other Indo- European Language Asian and Pacific Islander Language Other Language South Hayward 33.8% 36.9% 9.2% 18.5% 0.7% Hayward 42.0% 32.8% 7.2% 17.1% 0.9% Oakland 59.8% 21.9% 2.8% 13.8% 1.7% Alameda County 57.2% 16.7% 7.1% 18.0% 1.1% Rate higher than the County rate Source: American Community Survey,
9 Household Type and Size Area Family Nonfamily South Hayward Single Head of Household with Children < 18 yrs Single Head of Household 65 Years of Age Average # Persons per Household 78.4% 21.6% 27.4% 10.4% 3.8 Hayward 71.7% 28.2% 34.1% 9.3% 3.2 Oakland 53.3% 46.7% 42.4% 12.2% 2.5 Alameda County 64.7% 35.3% 27.9% 10.7% 2.8 Rate higher than the County rate Source: American Community Survey,
10 Health Outcomes

11 Life Expectancy by Census Tract
12 All-Cause Mortality by City/Place Cherryland Sunol Ashland Hayward Fairview Oakland Emeryville San Lorenzo Alameda County San Leandro Castro Valley Livermore Alameda Newark Union City Fremont Pleasanton Dublin Berkeley Albany Piedmont Rate in South Hayward = Rate per 100,000 Source: Alameda County Vital Statistics
13 Leading Causes of Death South Hayward Diseases of Heart 23.1% Cancer 21.6% Stroke 6.4% Chronic Lower Respiratory Diseases 5.8% Diabetes 4.0% Alzheimers 3.2% Unintentional Injuries Influenza and Pneumonia 3.1% 3.1% 0% 5% 10% 15% 20% 25% Source: Alameda County Vital Statistics Note that 29.6% deaths are from all other causes.
14 All-Cause Mortality by Race/Ethnicity 1,200 South Hayward Hayward Oakland Alameda County 1,000 1, Rate per 100, All Races AfrAmer/ Black Asian Latino/ Hispanic White Source : Alameda County Vital Statistics Files,
15
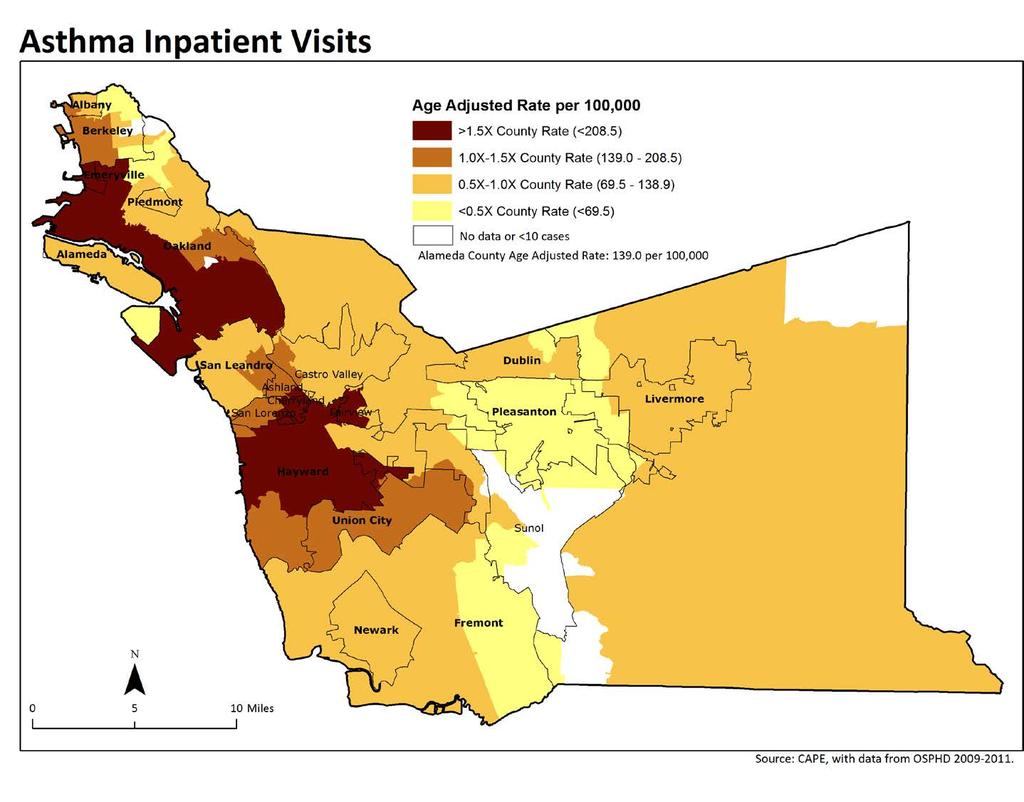
16 Asthma Inpatient Visits by City/Place Oakland Hayward San Lorenzo Rate in South Hayward- 213 Union City Alameda County Newark San Leandro Berkeley Sunol 97.1 Castro Valley 92.8 Alameda 92.5 Fremont 84.6 Livermore 79.7 Albany 77.6 Dublin 69.6 Pleasanton Rate per 100,000 Source: CAPE, with data from OSHPD
17
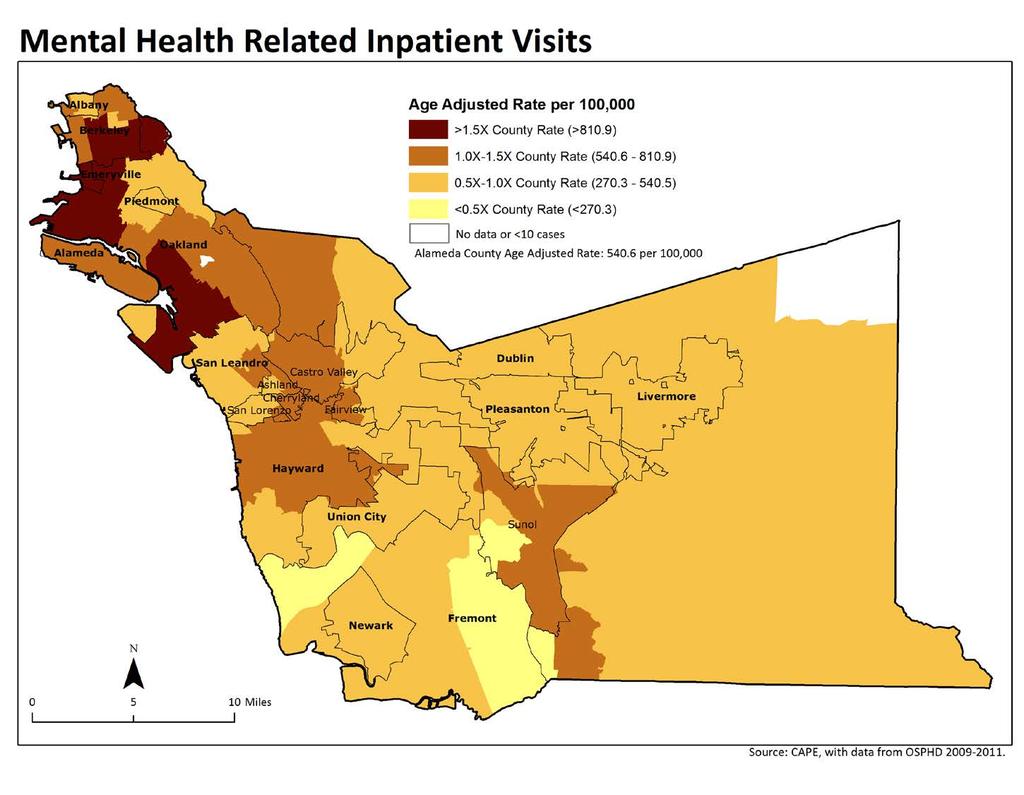
18 Mental Health Related Inpatient Visits by City/Place Oakland Berkeley Sunol Hayward San Leandro Alameda County Alameda Castro Valley Pleasanton Livermore San Lorenzo Albany Newark Dublin Union City Fremont Rate in South Hayward Rate per 100,000 Source: CAPE, with data from OSHPD
19
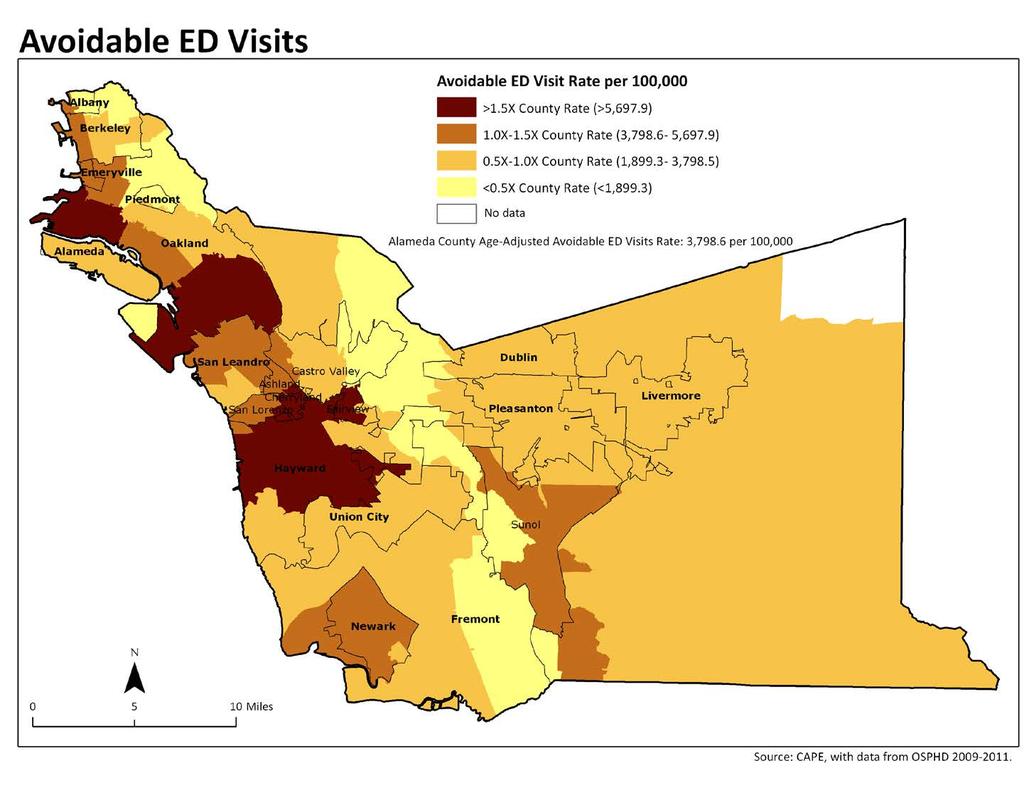
20 Avoidable ED Visits by City/Place Hayward Sunol Oakland 5, , ,019.7 Rate in South Hayward- 6,601 San Leandro 4,278.8 Newark 3,918.2 San Lorenzo 3,898.5 Alameda County 3,798.6 Union City 3,672.4 Castro Valley 3,063.1 Alameda 3,013.2 Fremont 2,683.9 Berkeley 2,229.4 Livermore 2,177.5 Dublin 1,974.0 Pleasanton 1,970.1 Albany 1, ,000 2,000 3,000 4,000 5,000 6,000 7,000 Rate per 100,000 Source: CAPE, with data from OSHPD

21 Heart Failure Preventable Hospitalizations
22 Heart Failure Preventable Hospitalizations by City/Place Hayward Oakland San Leandro Rate in South Hayward- 437 Newark Union City Alameda Alameda County San Lorenzo Livermore Fremont Dublin Castro Valley Berkeley Pleasanton Albany Rate per 100,000 Source: CAPE, with data from OSHPD
 0.75-1.0x County Rate (274.6-366.1) D <0.75 x County Rate (<274.")
23 COP I D/Asthma Pr,ev,entabl,e! Hospitalizations, Ag,es 40+ COPD/Asthma Rate per 100,000 - >1.5 x County Rate {>549.2) x County Rate ( '9..2) x County Rate ( ) D <0.75 x County Rate (<274.6) N 0 10 Miles Source: CAPE, with data from OSHPD,
24 COPD/Asthma Preventable Hospitalizations for Adults Ages 40+ by City/Place Hayward Oakland Newark Union City Alameda County San Leandro San Lorenzo Fremont Livermore Alameda Castro Valley Berkeley Dublin Pleasanton Albany Rate per 100,000 Rate in South Hayward- 672 Source: CAPE, with data from OSHPD
25 % Overweight or Obese Weight Status Among School Age Children 60.0% 53% 50% 50.0% 47% 46% 45% 44% 44% 44% 40% 41% 40% 40.0% 35% 37% 35% 32% 35% 30.0% 20.0% 10.0% 0.0% South Hayward Hayward Oakland Alameda County
26 Maternal and Child Health Indicators South Hayward Hayward Oakland Alameda County % Low Birth Weight 6.3% 6.9% 7.8% 7.2% Teen Birth Rate % 1st Trimester Prenatal Care 79% 81% 88% 88% Infant Mortality Rate n/a Rate higher than the County rate Rate lower than the County rate Source: Alameda County Vital Statistics Records Infant mortality rates are for All other data are for
27 Sexually Transmitted Disease Rates Rate per 100,000 2,500 2,000 1,500 1, Chlamydia Rate among Females years 2,121 2,285 Rate per 100, Overall Gonorrhea Rate South Hayward Alameda County 0 South Hayward Alameda County Source: ACPHD through CDPHD
28 Social and Economic Indicators

29 Neighborhood Poverty Level by Census Tract Very high poverty neighborhoods Affluent neighborhoo ds
30 Percentage Below Federal Poverty Level Cherryland Oakland Berkeley Ashland Hayward Albany Emeryville Alameda San Lorenzo San Leandro Castro Valley Fairview Livermore Pleasanton Dublin Sunol Piedmont 22.0% 20.3% 18.1% 12.1% 16.3% 23.2% 13.5% 18.3% 10.4% 14.1% 9.8% 13.2% 9.4% 11.9% 9.2% 9.6% 8.5% 11.3% 7.3% 8.8% 6.3% 7.6% 5.3% 6.4% 4.6% 5.2% 4.1% 3.1% 2.7% 0.0% 1.8% 0.0% 28.7% 29.4% South Hayward % Below FPL: 19.6% (population <18 years old) 13.3% (total population) Total population Population <18 years old 0% 5% 10% 15% 20% 25% 30% 35% Source: American Community Survey,
31 % of population 60% 50% 40% 30% 20% 10% Unemployment by Age 51.7% 46.6% 40.7% 32.1% 23.8% 22.1% 18.3% 17.3% 12.1% 12.0% 10.1% 8.7% 0% South Hayward Hayward Oakland Alameda County year olds year olds year olds Source: American Community Survey,
32 Household Income Distribution 100% 90% 80% 70% 26.0% 26.8% 25.0% 35.9% 60% 50% 36.1% 33.4% 26.4% 28.1% $100,000 $50,000-$99,999 40% <$50,000 30% 20% 37.8% 39.8% 48.6% 35.9% 10% 0% South Hayward Hayward Oakland Alameda County Source: American Community Survey,
33 Educational Attainment 100% 90% 80% 70% 60% 50% 40% 30% 20% 10% 0% 86.2% 75.3% 79.5% 79.8% 37.9% 41.1% 23.3% 16.8% South Hayward Hayward Oakland Alameda County High School Graduate/GED Bachelor's Degree Source: American Community Survey,
34 Academic Performance 3 rd Grade English Language Arts Proficiency 60% 54.0% 50% % at or above proficient 40% 30% 20% 19.8% 27.0% 42.0% 10% 0% South Hayward Hayward Oakland Alameda County Source: California Department of Education Dataquest
35
36 Housing and Transportation Indicators Housing Transportation Area South Hayward % Housing Units Renter- Occupied % Paying 30% Household Income on Rent % Households with > 1 Occupant per Room % Zero Vehicle Households % Walked or Took Public Transit to Work 36.4% 58.8% 17.3% 4.7% 5.9% Hayward 46.5% 57.6% 11.4% 7.3% 7.9% Oakland 59.0% 55.3% 6.7% 17.9% 17.9% Alameda County 46.3% 51.8% 5.6% 10. 5% 11.9%` Rate higher than the County rate Source: American Community Survey,

37 SSA Benefits Usage Medical MediCal Rate Rate is per 1,000 residents Miles Source: CAPE, with data from AC SSA, FY0910.


38 SSA Benefits Usage: Medical MediCal Rate Rate is per 1000 residents Sunol A Miles Source: CAPE, with data from SSA FY0910.
39 MediCal Usage Cherryland Ashland Oakland Hayward Alameda County Remainder of San Leandro Union City Newark San Lorenzo Fairview Alameda Fremont Livermore Emeryville Castro Valley Berkeley Albany Sunol Dublin Pleasanton Piedmont Rate per 1,000 Source: CAPE, with data from SSA FY0910
40
41
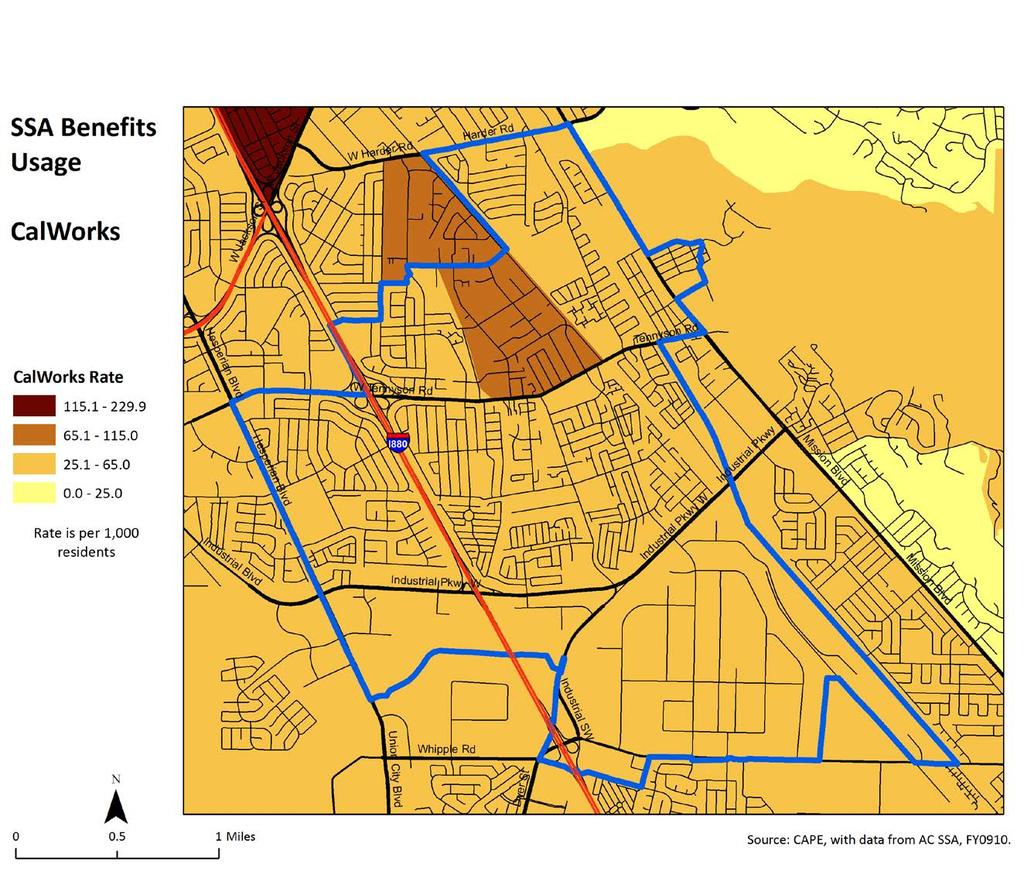
42 CalWorks Usage Oakland Cherryland Ashland Hayward Alameda County Remainder of County San Leandro Union City San Lorenzo Newark Alameda Fairview Emeryville Fremont Castro Valley Livermore Berkeley Dublin Albany Sunol Pleasanton Piedmont Rate per 1,000 Source: CAPE, with data from SSA FY0910
43
44
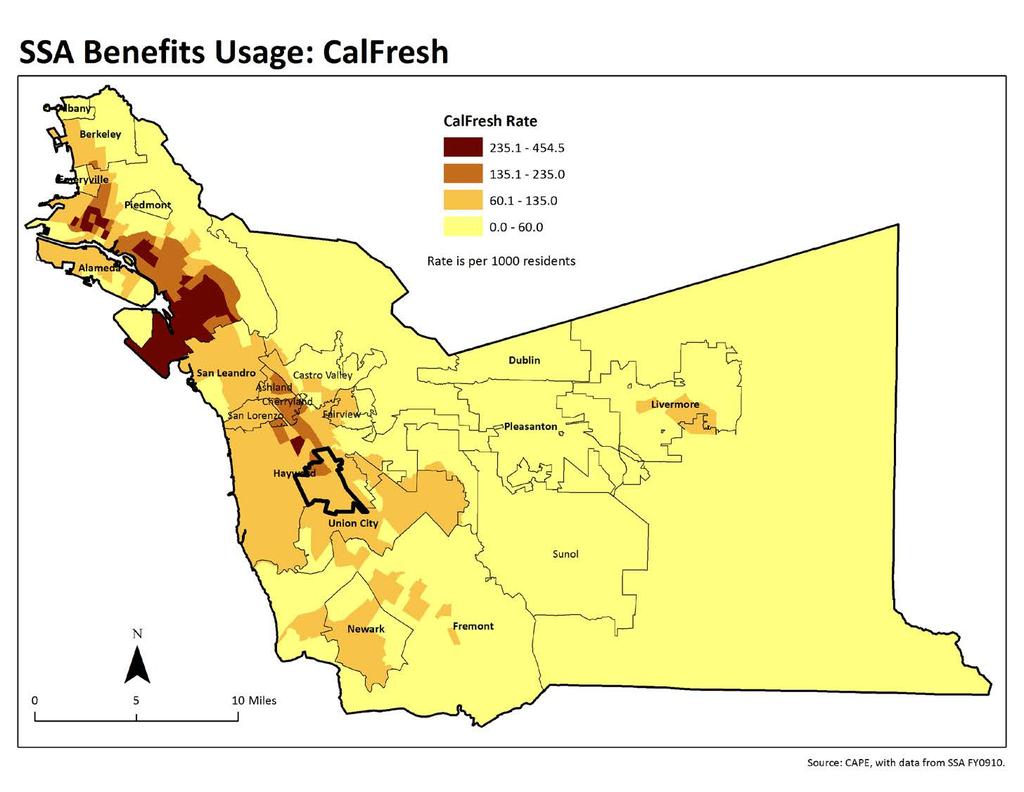
45 CalFresh Usage per 1,000 Residents Cherryland Oakland Ashland Hayward Alameda County Remainder of County San Leandro Union City San Lorenzo Newark Alameda Fairview Emeryville Fremont Livermore Castro Valley Berkeley Albany Dublin Pleasanton Sunol Piedmont Rate per 1,000 Source: CAPE, with data from SSA FY0910
46 Environmental Indicators
47 All Liquor Licenses
48 Off-Sale Liquor Outlets Area Number Liquor Outlets Density (Outlets per 100,000 population) South Hayward Hayward Oakland Alameda County Source: California ABC (Alcohol and Beverage Control), April 2014.

49 BAAQMD Impacted Communities and Communities of Concern Mobile Sources Air Toxics Emission Density* 2006 Communities of Concern 5.92 Remainder of Bay Area 2.26 Total Region 2.94 *includes Diesel Particulates, Benzene, and Butadiene: Kg per average weekday per square mile Rate higher than the overall region rate Source: BAAQMD 2009, MTC 2009
50
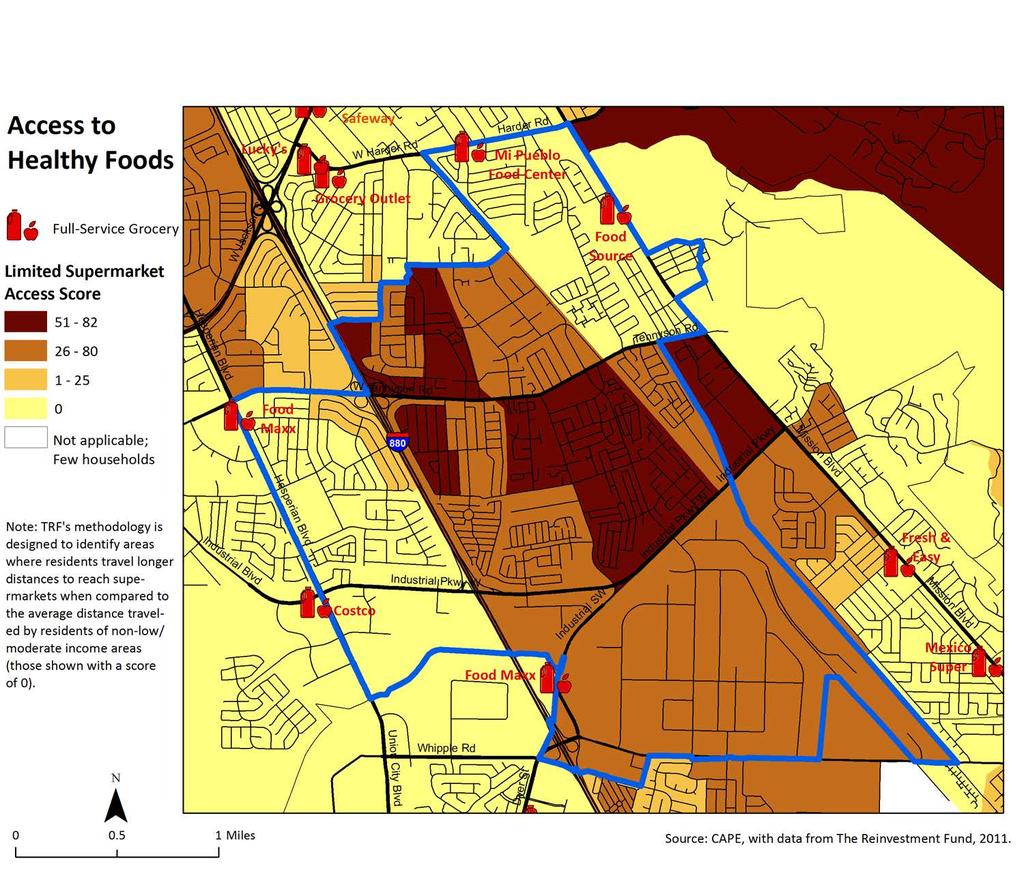
51 Full Service Grocery Stores Area Number Full Service Grocery Stores Density (Stores per 100,000 population) South Hayward 3 8 Hayward Oakland 30 8 Alameda County Source: CAPE, with data from Alameda County Environmental Health Services, June 2013.
52
53
54 Crime and Arrests Data
55 Crime and Arrests South Hayward, January December ,000 Number of Incidents/Cases Violent Crimes Child Abuse and Neglect Juvenile Arrests Drug Arrests Remainder of Hayward South Hayward Source: Hayward Police Department
56 Juvenile and Drug Arrests City of Hayward, January December 2012 Juvenile Arrests (Total=359) Drug Arrests (Total=443) 34.5% 35.7% 65.5% 64.3% Felony Misdemeanor Source: Hayward Police Department
57 Violent Crime Rate by Jurisdiction Oakland Police Dept Emeryville Police Dept Alameda County San Leandro Police Dept Berkeley Police Dept Hayward Police Dept Newark Police Dept Livermore Police Dept Union City Police Dept Alameda Police Dept Albany Police Dept Dublin Fremont Police Dept Piedmont Police Dept Pleasanton Police Dept , , ,000 1,500 2,000 2, Rate per 100,000 Source: FBI Uniform Crime Reporting 2012

58 Homicides Source: Alameda County Vital Statistics
59 Homicide by City/Place Oakland 18.7 Hayward San Leandro Alameda County Newark Union City Berkeley Fremont Rate per 100, Source: Alameda County Vital Statistics
60 60 Spouse/Partner Assault Rate, Female Victims years N=396 ; Includes 2 fatalities
61 Assault Emergency Department Visits Oakland Hayward San Leandro Rate in South Hayward- 502 Alameda County San Lorenzo Castro Valley Alameda Sunol Newark Union City Berkeley Livermore Fremont Dublin Pleasanton Albany ED visits per 100,000 population Source: OSHPD ED Data,

62 Questions/Comments? Alameda County Health Care Services Agency Roxanna Guide Epidemiologist
63 Additional Information
64 Racial/Ethnic Composition Hayward, 2010 Pacific Islander 3.0% American Indian 0.3% Multirace 4.0% Other 0.2% n=144,186 Asian 21.6% Latino 40.7% African American 11.3% White 18.8%
65 Racial/Ethnic Composition Oakland, 2010 Pacific Islander 0.5% Asian 16.0% Multirace 3.5% Other 0.3% Latino 27.5% n=390,724 African American 26.1% White 26.1% CAPE, with data from Census 2010
66 Asthma Preventable Hospitalizations for Adults Ages by City/Place Castro Valley 75.7 Oakland 68.1 San Leandro 45.6 Hayward 43.6 Alameda County Alameda Rate in South Hayward- 32 Union City Berkeley Livermore Fremont Source: CAPE, with data from OSHPD
67 Percentage Below Federal Poverty Level 35% 30% 29.4% 25% 20% 19.6% 18.3% 20.3% 15% 13.3% 13.5% 12.0% 15.1% 10% 5% 0% South Hayward Hayward Oakland Alameda County Total Population Population < 18 Years of Age Source: American Community Survey,
68 Individuals Receiving Alameda County Aid by City of Residence, February 2014 Individuals* CalWorks MediCal Food Stamps General Assistance IHSS Location City Population % of County Clients % of Population Clients % of Population Clients % of Population Clients % of Population Clients % of Population Clients % of Population North County 616,402 41% 130,082 21% 22,961 4% 109,254 18% 71,324 12% 5,501 1% 11,221 2% Oakland 390,724 26% 109,553 28% 20,466 5% 91,728 23% 61,865 16% 4,869 1% 9,142 2% Berkeley 112,580 7% 8,506 8% 1,087 1% 6,887 6% 4,093 4% 388 0% 1,122 1% Alameda 73,812 5% 8,862 12% 1,066 1% 7,900 11% 4,049 5% 169 0% 717 1% Albany 18,539 1% 1,633 9% 182 1% 1,480 8% 600 3% 18 0% 73 0% Piedmont 10,667 1% 201 2% 9 0% 174 2% 66 1% 6 0% 25 0% Emeryville 10,080 1% 1,327 13% 151 1% 1,085 11% 651 6% 51 1% 142 1% Tri-City 326,178 22% 41,317 13% 4,322 1% 37,579 12% 15,608 5% 727 0% 3,264 1% Fremont 214,089 14% 23,005 11% 2,161 1% 20,805 10% 8,311 4% 472 0% 1,864 1% Union City 69,516 5% 11,669 17% 1,353 2% 10,715 15% 4,641 7% 151 0% 981 1% Newark 42,573 3% 6,643 16% 808 2% 6,059 14% 2,656 6% 104 0% 419 1% Central County 313,976 21% 76,842 24% 10,146 3% 68,512 22% 34,295 11% 1,611 1% 3,976 1% Hayward 144,186 10% 44,794 31% 6,399 4% 39,855 28% 20,881 14% 1,059 1% 2,181 2% San Leandro 84,950 6% 21,738 26% 2,636 3% 19,431 23% 9,359 11% 395 0% 1,199 1% Castro Valley 61,388 4% 5,552 9% 587 1% 4,933 8% 2,197 4% 82 0% 322 1% San Lorenzo 23,452 2% 4,758 20% 524 2% 4,293 18% 1,908 8% 75 0% 274 1% Valley 197,289 13% 14,303 7% 1,490 1% 12,983 7% 5,361 3% 195 0% 753 0% Livermore 80,968 5% 8,149 10% 882 1% 7,339 9% 3,332 4% 115 0% 294 0% Pleasanton 70,285 5% 3,362 5% 289 0% 3,123 4% 970 1% 39 0% 197 0% Dublin 46,036 3% 2,792 6% 319 1% 2,521 5% 1,059 2% 41 0% 262 1% Other 56,426 4% 5,777 10% 372 1% 2,972 5% 1,131 2% 61 0% 135 0% County Total 1,510, % 268,321 18% 39,291 3% 231,300 15% 127,719 8% 8,095 1% 19,349 1% These are individuals receiving aid from one or more county program, listed by city of residence. This total does not include Adult and Aging, or add up to the total of all four programs. Source: California Department of Finance, Demographic Research Unit, California State Census Data, City/County Population Estimates 2010; Alameda County Social Services Agency, Extract MR0009E, Geographic Information and Census Tract Extract.
The following three slides provide a brief overview of the demographics characteristics of residents of Alameda County. For additional demographic
 This slide set was produced by the Alameda County Public Health Department (ACPHD) Community Assessment, Planning, and Evaluation (CAPE) Unit. One way that we work to achieve the ACPHD mission is to monitor
This slide set was produced by the Alameda County Public Health Department
 This slide set was produced by the Alameda County Public Health Department Community Assessment Planning an Evaluation (CAPE) Unit. One way that we work to achieve the ACPHD mission and vision is to monitor
Alameda County Public Health Department. Adult Preventable Hospitalizations: Examining Impacts, Trends, and Disparities by Group
 Adult Preventable Hospitalizations: Examining Impacts, Trends, and Disparities by Group Abstract Preventable hospitalizations occur when persons are hospitalized for a medical condition that could have
Overview of Trends in Alzheimer s Disease and Other Dementias Among Older Adults in Alameda County
 Overview of Trends in Alzheimer s Disease and Other Dementias Among Older Adults in Alameda County A Community Conversation about Alzheimer s Disease and Other Dementias Convening Sponsored by Alameda
Mental Health and Alcohol Use
 Mental Health and Alcohol Use Mental Health Mental health has been defined as a state of successful performance of mental function resulting in productive activities, fulfilling relationships with other
Tuberculosis in Alameda County, 2009
 Tuberculosis in Alameda County, 29 Alameda County Public Health Department Tuberculosis Overview Tuberculosis (TB) is a communicable disease caused by the bacteria Mycobacterium tuberculosis. TB is spread
AIR POLLUTION RISK & VULNERABILITY TO HEALTH IMPACTS: A LOOK AT WEST OAKLAND
 AIR POLLUTION RISK & VULNERABILITY TO HEALTH IMPACTS: A LOOK AT WEST OAKLAND AB 617 Community Air Protection Program Consultation Group Meeting March 26, 2018 Muntu Davis, MD, MPH Alameda County Health
2018 Community Health Assessment
 2018 Community Health Assessment Community Health Status Assessment Linn County, IA Prepared by Amy Hockett, PhD, MPH, CHES Epidemiologist Linn County Public Health August 9, 2018 Community Health Status
M.A.P. II. Monitoring and Assessment Project Executive Summary. Infectious Diseases. Chronic Diseases. Tarrant County Public Health
 M.A.P. II Monitoring and Assessment Project 2002-2004 Environmental Health Social & Mental Health Injuries Chronic Diseases County Maternal & Child Health Infectious Diseases County Public Health Safeguarding
Understanding The Root Causes of Poor Health In Alameda County
 Understanding The Root Causes of Poor Health In Alameda County The Challenge of Achieving Equity Anthony Iton, M.D., J.D., MPH Alameda County Health Officer Fremont Community Meeting May 19, 2007 Tri-City
Walworth County Health Data Report. A summary of secondary data sources
 Walworth County Health Data Report A summary of secondary data sources 2016 This report was prepared by the Design, Analysis, and Evaluation team at the Center for Urban Population Health. Carrie Stehman,
WASHINGTON STATE COMPARISONS TO: KITSAP COUNTY CORE PUBLIC HEALTH INDICATORS May 2015
 WASHINGTON STATE COMPARISONS TO: KITSAP COUNTY CORE PUBLIC HEALTH INDICATORS This is a companion document to the Core Public Health Indicators that provides a comparison of to Washington State for the
San Diego County Health Briefs North Coastal Region
 Non-Communicable Disease This brief contains 2009 chronic disease health data for the of San Diego County. Data are provided from the Community Health Statistics Unit and the 2009 California Health Interview
Pierce County Health Indicators
 Pierce County Health Indicators 3629 S. D. St., Tacoma WA 98418-6813 Phone: 253-798-7668 email: oapi@tpchd.org Demographics Characteristics Latest Year count Percent WA State count Percent Data Source
Community Youth Meetings 2007
 Community Youth Meetings 2007 Health Status of Youth: Roxbury November 7, 2007 Presented by the Boston Public Health Commission Roxbury Charlestown Allston- Brighton Back Bay Fenway Roxbury South End East
Pierce County Health Indicators
 Pierce County Health Indicators Updated 11/10/2016 Demographics Characteristics Latest Year count Percent WA State count Percent Total Population 2015 830,120 7,061,408 2015 Total Percent Total Percent
Community Health Status Assessment
 Community Health Status Assessment EXECUTIVE SUMMARY The Community Health Status Assessment (CHSA) is one of four assessments completed as part of the 2015-2016 Lane County Community Health Needs Assessment
The site provides a special request area for materials that cannot be found on the website.
 APPENDIX II-B CALIFORNIA COUNTY DATA RESOURCES ON THE WEB CHRONIC DISEASES Asthma Prevalence from CHIS. http://www.chis.ucla.edu/asthma052002.html. The site has asthma prevalence by race/ethnicity. California
Platte Valley Medical Center Page 0
 Platte Valley Medical Center Page 0 Table of Contents Introduction 4 Background and Purpose... 4 Service Area... 4 Map of the Service Area...5 Project Oversight...5 Consultants... 6 Identification of Community
Community Health Needs Assessment
 Community Health Needs Assessment Gratiot County Community Health Assessment Community Health Assessment Data Sources Primary Data (new data collected first-hand) Community Opinion Survey Provider Opinion
Report on Older Adult Falls Alameda County EMS Alameda County Emergency Medical Services Senior Injury Prevention
 Report on Older Adult Falls Alameda County EMS 2014-2016 Alameda County Emergency Medical Services Senior Injury Prevention About This Report This report was created using EMS call records from 2014-2016
Jackson Hospital Community Health Needs Assessment. Fiscal Year 2016
 Jackson Hospital Community Health Needs Assessment Fiscal Year 2016 JACKSON HOSPITAL AT A GLANCE Jackson Hospital, located in Montgomery, Alabama, is a not-for-profit organization committed to improving
Community Health Needs Assessment (CHNA)
") Community Health Needs Assessment (CHNA) Pierce ; St. Croix Contents Demographics... 3 Total Population... 4 Median Age... 6 Population Under Age 18... 8 Population Age 65+... 9 Population with Any Disability...
Community Health Needs Assessment (CHNA) Pierce ; St. Croix Contents Demographics... 3 Total Population... 4 Median Age... 6 Population Under Age 18... 8 Population Age 65+... 9 Population with Any Disability...
FLHealthCHARTS.com Update List
 Released = New data, statistical brief, or analytic report not previously posted on FLHealthCHARTS. Added = New features or indicators not previously posted on FLHealthCHARTS. Updated = Change to data
Sierra County Community Health Profile
 Sierra County Community Health Profile Introduction This profile describes the current health status of the county. With this information, the community can complete an assessment and begin to address
Luna County Community Health Profile
 Luna County Community Health Profile Introduction This profile describes the current health status of the county. With this information, the community can complete an assessment and begin to address specific
JOINING HANDS: SHARING RESOURCES AND DATA ACROSS SECTORS TO IMPROVE POPULATION HEALTH
 JOINING HANDS: SHARING RESOURCES AND DATA ACROSS SECTORS TO IMPROVE POPULATION HEALTH Virginia Population Health Summit Charlottesville, Virginia March 29, 2017 Steven H. Woolf, MD, MPH Director, Center
Taos County Community Health Profile
 Taos County Community Health Profile Introduction This profile describes the current health status of the county. With this information, the community can complete an assessment and begin to address specific
MARICOPA COUNTY COMMUNITY HEALTH ASSESSMENT. Maricopa County Board of Health July 23, 2012 Eileen Eisen-Cohen, PhD
 MARICOPA COUNTY COMMUNITY HEALTH ASSESSMENT Maricopa County Board of Health July 23, 2012 Eileen Eisen-Cohen, PhD 1 What? Why? We Are Here 2 Local Public Health System Faith Instit. Military Dentists Labs
PHACS County Profile Report for Searcy County. Presented by: Arkansas Center for Health Disparities and Arkansas Prevention Research Center
 PHACS County Profile Report for Searcy County Presented by: Arkansas Center for Health Disparities and Arkansas Prevention Research Center Contents Introduction... Page 2 Demographics...Page 3 Social Environment
Maryland SHIP Anne Arundel Baseline Data 10/26/2011. MD Baseline. County Baseline. National Baseline
 Arundel Data 10/26/2011 Increase life expectancy in Arundel 1 Reduce infant Arundel 2 deaths Arundel 3 Arundel 4 Arundel 6 Reduce low birth weight (LBW) & very low birth weight (VLBW) Reduce sudden unexpected
Tuscarawas County Health Department
 Tuscarawas County Health Department Community Health Needs Assessment 214 TUSCARAWAS COUNTY HEALTH DEPARTMENT Community Health Needs Assessment 214 Assessment Commissioned by: Dr. James Hubert D.O Health
Community Youth Meetings 2007
 Community Youth Meetings 2007 Health Status of Youth: Fenway November 8, 2007 Presented by the Boston Public Health Commission Fenway Charlestown Allston Brighton Back Bay Fenway Roxbury South End East
Mora County Community Health Profile
 Mora County Community Health Profile Introduction This profile describes the current health status of the county. With this information, the community can complete an assessment and begin to address specific
Los Alamos County Community Health Profile
 Los Alamos County Community Health Profile Introduction This profile describes the current health status of the county. With this information, the community can complete an assessment and begin to address
In Health Matters, Place Matters - The Health Opportunity Index (HOI) Virginia Department of Health Office of Health Equity
 Virginia Department of Health Office of Health Equity") In Health Matters, Place Matters - The Health Opportunity Index (HOI) Virginia Department of Health Office of Health Equity 1 Identifying the Problem America s Health Rankings United Health Foundation
In Health Matters, Place Matters - The Health Opportunity Index (HOI) Virginia Department of Health Office of Health Equity 1 Identifying the Problem America s Health Rankings United Health Foundation
Racial and Ethnic Health Disparities Report Card
 Racial and Ethnic Health Disparities Report Card August 2010 Acknowledgements Many individuals contributed to the production of this report card. The Division of Policy and Performance wishes to particularly
Health Profile Chartbook 2016 Kalkaska County
 Health Profile Chartbook 2016 Kalkaska County 2016 Chartbooks The 2016 Chartbooks provide a snapshot of the health status of the District Health Department #10 jurisdiction. Information is presented by
Health Profile Chartbook 2016 Mecosta County
 Health Profile Chartbook 2016 Mecosta County 2016 Chartbooks The 2016 Chartbooks provide a snapshot of the health status of the District Health Department #10 jurisdiction. Information is presented by
Cascade Pacific Action Alliance Regional Health Assessment
 Cascade Pacific Action Alliance Regional Health Assessment Cowlitz, Grays Harbor, Lewis, Mason, Pacific, Thurston and Wahkiakum County December, 2014 V.4 Thematic Areas Demographics and Socioeconomic Status
Demographics and Health Data
 Demographics and Health Data Information for Local Planners City of Puyallup, WA Demographic Characteristics Environmental Health Division 3629 South D Street, Tacoma, WA 98418 (253) 798-6470 Table 1 presents
Demographics and Health Data
 Demographics and Health Data Information for Local Planners City of Lakewood, WA Demographic Characteristics Environmental Health Division 3629 South D Street, Tacoma, WA 98418 (253) 798-6470 Table 1 presents
Community Health Status Assessment: High Level Summary
 Community Health Status Assessment: High Level Summary This summary provides a general overview of Community Health Status Assessment (CHSA) results as part of the Health Improvement Partnership (HIP-C)
Health of the City & Community Health Improvement Planning. Raynard Washington, PhD, MPH Chief Epidemiologist
 Health of the City & Community Health Improvement Planning Raynard Washington, PhD, MPH Chief Epidemiologist What is the Community Health Assessment (CHA)? An annual assessment of population health in
HealtheCNY Indicator List by Data Source
 American Community Survey 23 Adults with Health Insurance Children Living Below Poverty Level Children with Health Insurance Families Living Below Poverty Level Homeowner Vacancy Rate Homeownership Households
Oakwood Healthcare Community Health Needs Assessment Indicators
 POPULATION Sub-Category Education Socioeconomic Violence High School High School Dropouts Graduation Rate (Percent) Some College Births to Unmarried Women Children in Poverty Children in Singleparent Households
Eddy County Community Health Profile
 Eddy County Community Health Profile Introduction This profile describes the current health status of the county. With this information, the community can complete an assessment and begin to address specific
Hospitalizations of females ages 13 and older due to assaultive injuries by spouse or partner
 DOMESTIC VIOLENCE DOMESTIC VIOLENCE TEMPLATES INDICATOR: DEFINITION: NUMERATOR: DENOMINATOR: Hospitalizations of females ages 13 and older due to assaultive injuries by spouse or partner The rate of hospitalizations
Asian and Pacific Islander Health Assessment
 Asian and Pacific Islander Health Assessment Santa Clara County 2017 S. JOSEPH SIMITIAN SANTA CLARA COUNTY SUPERVISOR, DISTRICT FIVE COUNTY GOVERNMENT CENTER, EAST WING 70 WEST HEDDING STREET, 10 TH FLOOR
Bernalillo County Community Profile
 County Community Profile Introduction This profile describes the current health status of the county. With this information, the community can complete an assessment and begin to address specific issues
The Elimination of Racial and Ethnic Disparities A Public Health Priority
 Massachusetts Department of Public Health The Elimination of Racial and Ethnic Disparities A Public Health Priority September, 2009 The Elimination of Racial and Ethnic Disparities is a Core Public Health
Community Health Needs Assessment
 Community Health Needs Assessment Scott County, Missouri This assessment will identify the health needs of the residents of Scott County, Missouri, and those needs will be prioritized and recommendations
San Francisco County 2010
 Indicators of Alcohol and Other Drug Risk and Consequences for California Counties County 21 Indicators of Alcohol and Other Drug Risk and Consequences for California Counties County 21 TABLE OF CONTENTS
The Health of the Santa Barbara County Community
 The Health of the Santa Barbara County Community WHAT IS OUR COMMUNITY S CURRENT HEALTH? WHAT ARE PRIORITY AREAS TO FOCUS FOR IMPROVEMENT? HOW CAN WE IMPROVE HEALTH IN OUR COMMUNITY? What is Health? Health
San Bernardino County 2010
 Indicators of Alcohol and Other Drug Risk and Consequences for California Counties County 21 Indicators of Alcohol and Other Drug Risk and Consequences for California Counties County 21 TABLE OF CONTENTS
San Joaquin County 2010
 Indicators of Alcohol and Other Drug Risk and Consequences for California Counties County 21 Indicators of Alcohol and Other Drug Risk and Consequences for California Counties County 21 TABLE OF CONTENTS
Jackson County Community Health Assessment
 2016 Jackson County Community Health Assessment With Collaboration from Black River Memorial Hospital and Jackson County Public Health Wisconsin Population Health Institute Table of Contents Structure
San Luis Obispo County 2010
 Indicators of Alcohol and Other Drug Risk and Consequences for California Counties County 21 Indicators of Alcohol and Other Drug Risk and Consequences for California Counties County 21 TABLE OF CONTENTS
New Mexico Department of Health. Racial and Ethnic Health Disparities Report Card
 New Mexico Department of Health Racial and Ethnic Health Disparities Report Card August 30, 2006 Acknowledgments Many individuals contributed to the production of this report card and the Office of Policy
Racial disparities in health outcomes and factors that affect health: Findings from the 2011 County Health Rankings
 Racial disparities in health outcomes and factors that affect health: Findings from the 2011 County Health Rankings Author: Nathan R. Jones, PhD University of Wisconsin Carbone Cancer Center Introduction
Hospitalizations of females ages 13 and older due to assaultive injuries by spouse or partner
 DOMESTIC VIOLENCE DOMESTIC VIOLENCE TEMPLATES INDICATOR: DEFINITION: NUMERATOR: DENOMINATOR: HEALTHY PEOPLE 2010 OBJECTIVE: Hospitalizations of females ages 13 and older due to assaultive injuries by spouse
DRUG AND ALCOHOL USE
 DRUG AND ALCOHOL USE Alcohol and drug use by adolescents can have immediate as well as long-term health and social consequences. Alcohol and illicit drug use by adolescents are risk-taking behaviors which
Measuring Equitable Care to Support Quality Improvement
 Measuring Equitable Care to Support Quality Improvement Berny Gould RN, MNA Sr. Director, Quality, Hospital Oversight, and Equitable Care Prepared by: Sharon Takeda Platt, PhD Center for Healthcare Analytics
2014 Healthy Community Study Executive Summary
 2014 Healthy Community Study Executive Summary BACKGROUND The Rockford Health Council (RHC) exists to build and improve community health in the region. To address this mission, RHC conducts a Healthy Community
Tuberculosis in Alameda County, 2011
 Tuberculosis in Alameda County, 211 Alameda County Public Health Department Tuberculosis Overview Tuberculosis (TB) is a preventable and curable disease that remains one of the leading causes of death
CITY OF EL CERRITO HOUSING ELEMENT UPDATE. Community Workshop #1
 CITY OF EL CERRITO 2015 2023 HOUSING ELEMENT UPDATE Community Workshop #1 July 19, 2014 Agenda Introductions Presentation 1. Housing Element Overview 2. Regional Housing Needs Allocation (RHNA) 3. Key
SAN FRANCISCO S VISITACION VALLEY NEIGHBORHOOD
 SAN FRANCISCO S VISITACION VALLEY NEIGHBORHOOD: NEIGHBORHOOD CONDITIONS AND HEALTH STATUS Wayne Enanoria-7.18.17 Framework for Assessing Neighborhood Health 2 Using a social determinants of health model,
Contra Costa County 2010
 Indicators of Alcohol and Other Drug Risk and Consequences for California Counties County 21 Indicators of Alcohol and Other Drug Risk and Consequences for California Counties County 21 TABLE OF CONTENTS
Indicators of Alcohol and Other Drug Risk and Consequences for California Counties
 Indicators of Alcohol and Other Drug Risk and Consequences for California Counties Imperial County 21 Indicators of Alcohol and Other Drug Risk and Consequences for California Counties Imperial County
Indicators of Alcohol and Other Drug Risk and Consequences for California Counties
 Indicators of Alcohol and Other Drug Risk and Consequences for California Counties Orange County 21 Indicators of Alcohol and Other Drug Risk and Consequences for California Counties Orange County 21 TABLE
El Dorado County 2010
 Indicators of Alcohol and Other Drug Risk and Consequences for California Counties El Dorado County 21 Indicators of Alcohol and Other Drug Risk and Consequences for California Counties El Dorado County
Indicators of Alcohol and Other Drug Risk and Consequences for California Counties
 Indicators of Alcohol and Other Drug Risk and Consequences for California Counties Tulare County 21 Indicators of Alcohol and Other Drug Risk and Consequences for California Counties Tulare County 21 TABLE
Santa Clara County 2010
 Indicators of Alcohol and Other Drug Risk and Consequences for California Counties Santa Clara County 21 Indicators of Alcohol and Other Drug Risk and Consequences for California Counties Santa Clara County
Indicators of Alcohol and Other Drug Risk and Consequences for California Counties
 Indicators of Alcohol and Other Drug Risk and Consequences for California Counties Butte County 21 Indicators of Alcohol and Other Drug Risk and Consequences for California Counties Butte County 21 TABLE
Riverside County 2010
 Indicators of Alcohol and Other Drug Risk and Consequences for California Counties Riverside County 21 Indicators of Alcohol and Other Drug Risk and Consequences for California Counties Riverside County
Indicators of Alcohol and Other Drug Risk and Consequences for California Counties
 Indicators of Alcohol and Other Drug Risk and Consequences for California Counties Nevada County 21 Indicators of Alcohol and Other Drug Risk and Consequences for California Counties Nevada County 21 TABLE
Stanislaus County 2010
 Indicators of Alcohol and Other Drug Risk and Consequences for California Counties Stanislaus County 21 Indicators of Alcohol and Other Drug Risk and Consequences for California Counties Stanislaus County
Alameda County Pharmacy Directory - Pharmacies offering Tdap vaccine to pregnant women
 Alameda County Pharmacy Directory - Pharmacies offering Tdap vaccine to pregnant women Updated 1/15/2019 The Centers for Disease Control and Prevention (CDC) recommends that pregnant women receive the
Food Waste Issues Among Alameda County Residents
 Food Waste Issues Among Alameda County Residents Key Findings of a Survey Conducted September 15-24, 2018 320-817 Methodology 519 interviews with adult Alameda County residents Interviews conducted September
Mendocino County 2010
 Indicators of Alcohol and Other Drug Risk and Consequences for California Counties Mendocino County 21 Indicators of Alcohol and Other Drug Risk and Consequences for California Counties Mendocino County
2017 PRC Community Health Needs Assessment
 2017 PRC Community Needs Assessment Obici care Foundation Service Area Western Tidewater, Virginia Prepared for: OBICI HEALTHCARE FOUNDATION By Professional Research Consultants, Inc. The PRC Community
HIV in Alameda County,
 HIV in Alameda County, 2014-2016 Alameda County Public Health Department HIV Epidemiology & Surveillance Unit HIV in Alameda County, 2014-2016 March 2018 HIV Epidemiology and Surveillance Unit HIV STD
Developing Health Equity Indicators from a Place based Perspective Corina Chung, MS Epidemiologist Heather Arata, PhD Health Equity Consultant
 Developing Health Equity Indicators from a Place based Perspective Corina Chung, MS Epidemiologist Heather Arata, PhD Health Equity Consultant Deborah van Olst, MPH Epidemiologist What is Health Equity?
Indicators of Alcohol and Other Drug Risk and Consequences for California Counties
 Indicators of Alcohol and Other Drug Risk and Consequences for California Counties Fresno County 21 Indicators of Alcohol and Other Drug Risk and Consequences for California Counties Fresno County 21 TABLE
Industrial Report. Bay Area Fourth Quarter 2015
 Industrial Report Bay Area Fourth Quarter 2015 Market Summary Submarket Building Available Space Avg. Asking Asking Rate Base Direct Sublease Total Q4-15 Q4-14 Rate (NNN) Range (NNN) San Francisco County
2014 Edition RHODE ISLAND
 214 RHODE ISLAND America's Health Rankings is the longest running comparative health index of states. It uses measures of behavior, community and environment, policy, clinical care, and health outcomes
Office Report. Bay Area Fourth Quarter 2015
 Office Report Bay Area Fourth Quarter 2015 Office Market Summary Area Building Available Space Rate Avg Asking Sq.Ft. Direct Sublease Total Q4-15 Q4-14 Rate (FS) Marin County 10,440,183 847,312 104,996
Overview of Health Disparities in Arkansas
 Overview of Health Disparities in Arkansas Annual Critical Access Hospital Conference August 9, 2018 Joyce Biddle, MPH, MPA Chronic Disease Epidemiologist Office of Minority Health and Health Disparities
Asthma-Related Hospitalization and Emergency Room Visits in Oakland
 McNair Research Journal SJSU Volume 13 Spring 2017 Article 12 2017 Asthma-Related Hospitalization and Emergency Room Visits in Oakland Alondra Varela San Jose State University Follow this and additional
REVISED. Stanislaus County 2007
 Indicators of Alcohol and Other Drug Risk and Consequences for California Counties REVISED Stanislaus County 2007 Indicators of Alcohol and Other Drug Risk and Consequences for California Counties Stanislaus
Rockford Health Council
 2010 Healthy Community Study Rockford Area Early Learning Council Becky Cook Kendall April 12, 2011 Rockford Health Council Community-based healthy community collaborative Formed in 1982 as the Rockford
Geospatial Targeting of Young HIV-infected Men who have Sex with Men (YMSM) in CNICS
 in CNICS") Geospatial Targeting of Young HIV-infected Men who have Sex with Men (YMSM) in CNICS Patrick Loose, Chief, SDHHS HIV, STD, and Hepatitis Branch Sheldon Morris M.D., M.P.H. University of California, San
Geospatial Targeting of Young HIV-infected Men who have Sex with Men (YMSM) in CNICS Patrick Loose, Chief, SDHHS HIV, STD, and Hepatitis Branch Sheldon Morris M.D., M.P.H. University of California, San
2016 Collier County Florida Health Assessment Executive Summary
 2016 Florida Health Assessment Executive Summary Prepared by: The Health Planning Council of Southwest Florida, Inc. www.hpcswf.com Executive Summary To access the report in its entirety, visit http://www.hpcswf.com/health-planning/health-planningprojects/.
Indicators of Alcohol and Other Drug Risk and Consequences for California Counties
 Indicators of Alcohol and Other Drug Risk and Consequences for California Counties Glenn County 21 Indicators of Alcohol and Other Drug Risk and Consequences for California Counties Glenn County 21 TABLE
Nutrition and Physical Activity
 Nutrition and Physical Activity Lifestyle choices made early in life have a significant impact on the patterns of chronic disease developed in adulthood. In the U.S., poor diet and physical inactivity
Health Disparities in Snohomish County
 Health Disparities in Snohomish County Table of Contents BACKGROUND What Are Health Disparities?... 3 How Do We Address Health Disparities?... 3 Why Release a Health Disparities Report?... 3 SOCIODEMOGRAPHICS
Prepared by Southern Illinois University School of Medicine s Center for Clinical Research And Office of Community Health and Service
 Hospital Sisters Health System Community Health Needs Assessment (FY2015-FY2018) Quantitative and Secondary Data Analysis Report For St. Anthony s Hospital Effingham, Prepared by Southern University School
Tuberculosis in Alameda County, 2014 Alameda County Public Health Department
 Tuberculosis in Alameda, 214 Alameda Public Health Department Tuberculosis (TB) is a preventable and curable disease that remains one of the leading causes of death worldwide. TB is a communicable disease
Tuberculosis in Alameda County, 2012
 Tuberculosis in Alameda County, 212 Alameda County Public Health Department Tuberculosis Overview Tuberculosis (TB) is a preventable and curable disease that remains one of the leading causes of death
Clark County Community Health Status Assessment
 2012 Clark County Community Health Status Assessment Southern Nevada Health District Office of Epidemiology 5/29/2012 Authors Nancy Williams, MD, MPH Patricia Rowley, BS Contributors Brian Labus, MPH Zuwen