Cancer Informatics Lecture
|
|
|
- Scot Murphy
- 5 years ago
- Views:
Transcription
1 Cancer Informatics Lecture Mayo-UIUC Computational Genomics Course June 22, 2018 Krishna Rani Kalari Ph.D. Associate Professor 2017 MFMER
2 Outline The Cancer Genome Atlas (TCGA) Genomic Data Commons (GDC) COSMIC database (mutations database) cbioportal for cancer genomics GTEX Precision Medicine in Cancer Single-cell RNA-Seq Design of experiments (GEO) 2017 MFMER

3 The Cancer Genome Atlas (TCGA) Reusing the slides from Kenna Shaw s presentation 2017 MFMER
4 TCGA core objectives 2017 MFMER

5 TCGA multiple data types 2017 MFMER
6 Rare tumors projects initiated in MFMER
7 Genomic Data Commons A NCI repository for The Cancer Genome Atlas and Genomics data. It consists of data from 61 primary sites >32000 cases Three million mutations 356,381 files 2017 MFMER

8 Genomic data commons 2017 MFMER

9 Projects 2017 MFMER

10 Exploration 2017 MFMER
11 Analysis 2017 MFMER

12 Repository 2017 MFMER
13 COSMIC COSMIC, the Catalogue Of Somatic Mutations In Cancer, is the world's largest and most comprehensive resource for exploring the impact of somatic mutations in human cancer MFMER
14 Expert curated database 2017 MFMER

15 2017 MFMER

16 2017 MFMER

17 2017 MFMER

18 Drug Resistance 2017 MFMER
19 Cell Lines Project 2017 MFMER
20 Cell lines project Mutation profiles of over 1,000 cell lines used in cancer research MCF MFMER
21 COSMIC-3D 2017 MFMER
22 COSMIC-3D A platform for understanding cancer mutations in the context of 3D protein structure MFMER
23 COSMIC 2017 MFMER
24 Gene Tiers in Cancer Gene Census Census tiers 719 genes Tier 1 A gene must possess a documented activity relevant to cancer, along with evidence of mutations in cancer which change the activity of the gene product in a way that promotes oncogenic transformation. Tier 2 - Consists of genes with strong indications of a role in cancer but with less extensive available evidence MFMER
25 Breakdown of Genes/mutations 2017 MFMER
26 cbioportal 2017 MFMER
27 Public cancer genomics data for mining Cbioportal Barrowed slides from cbioportal website Walkthrough an example using BRCA1, BRCA2 genes MFMER
28 Overview of Tabs in a Single Study Query Note that depending on the data available for a particular study, not all of these will be present (e.g. a study without outcome data will not have a Survival tab) OncoPrint: Overview of genetic alterations per sample in each query gene Cancer Types Summary: Frequency of alteration in each query gene in the detailed cancer types included in this study Mutual Exclusivity: Statistical analysis to determine if query genes are mutually exclusively altered Plots: explore the relationships among genetic alterations, gene expression, protein levels, DNA methylation and available clinical features Mutations: Details about mutations called in each query gene Co-Expression: Explore which genes have mrna/protein levels correlated with query genes Enrichments: Explore which genes are altered in the set of samples with query gene alterations or in the set of samples without query gene alterations Survival: Compare survival of patients with alterations in query genes to the rest of the cohort Network: Explore gene networks centered on the query genes CN Segments: Explore copy number changes with the Integrated Genomics Viewer (IGV) Download: Download data or copy sample lists Bookmark: Link to save the query MFMER
29 Query overview Browse available datasets and initiate queries Search studies Click here for a drop-down menu with some common searches and examples of advanced search features Number of studies for each organ system (click to filter) List of all studies, organized by organ system MFMER
30 Single study query 1. Start typing tumor type of interest to filter the list of studies. 2. Check the box for study of interest. 3. This section will update to include all data types available for the selected study. Select data types to query. 4. Select sample set. For some studies, an appropriate sample set will be automatically selected given the data types selected in Step Submit 5. Type gene(s) or select from pre-defined gene lists. cbioportal will confirm that all entries are valid gene symbols MFMER
 of samples with an alteration in any of the query genes http://www.cbioportal.org/index.")
31 Summary of alterations per sample. Each sample is a column. Each gene is a row. Different kinds of genetic alterations are highlighted with different colors. The percentage of samples with an alteration in each query gene The number (percentage) of samples with an alteration in any of the query genes MFMER

32 OncoPrint: Advanced Features Add clinical tracks (options will vary depending on the data available for each study) Add a heatmap with RNA or protein levels Chang e the sampl e sortin g order Customize visualizatio n Download figure as PNG, PDF or SVG. Download patient/sample IDs in same order as OncoPrint. When your mouse hovers, this toolbar appears with options to customize OncoPrint MFMER

33 To change the order, click on a gene name and drag, or click on the. Samples will re-sort based on this new order MFMER

34 MFMER

35 Mutual Exclusivity All pairwise combinations of query genes analyzed for mutual exclusivity or co-occurrence in the queried samples. A positive value here suggests that alterations in these genes co-occur in the same samples, while a negative value suggests that alterations in these genes are mutually exclusive and occur in different samples. On the OncoPrint tab we could see visually that alterations in these three query genes tended to be mutually exclusive. Here we can address that same question with a statistical analysis. p-value comes from Fisher Exact Test. Note that this is an unadjusted p-value and may need to be corrected for multiple hypothesis testing. odds of alteration in B given alteration in A log 2 ( ) odds of alteration in B given lack of alteration in A Click on any column header to sort. Hover over the column names for more details about how values are calculated MFMER
36 Plots Choose genetic or clinical Select a query gene Select data type and processing Swap horizontal & vertical axis If checked, vertical axis will automatically show the same gene as horizontal axis. Depending on available data types for a given study, this tab allows for plots comparing copy number, gene expression, protein levels and DNA methylation of query genes, along with any available clinical attributes. Each dot is a sample, colorcoded by mutation status MFMER
37 Mutations Q: What are the hotspots for EGFR mutation in glioma?a: Look at the lollipop diagram: G598V is the most common alteration. The Furin-like domain also appears to be frequently mutated MFMER
38 Mutations Download figure as SVF or PDF Adjust y-axis Mutations are drawn as lollipops along the domain structure of the gene. The height of the lollipop reflects how many times that mutation was detected. This plot will update based on any filters applied to the table below. Hover over any lollipop for additional details MFMER
39 Mutations This mutation is in OncoKB as a Level 3 variant. Hover over this symbol to see additional information, including that this is a known oncogenic mutation. This mutation is a recurrent hotspot based on a statistical analysis of mutation frequency. You may also see this symbol which means the mutation is a recurrent hotspot based on a statistical analysis of 3D protein conformation. This mutation is annotated in CIViC. Hover over this symbol for additional information. This mutation is in My Cancer Genome MFMER

40 Select from available data types Each gene appears on a separate tab Click on a gene name to see correlation plot Co-Expression Compares mrna/protein level expression of your query genes against all other genes. Only genes with Pearson and Spearman correlations >0.3 or <-0.3 are shown. Check boxes to colorcode sample dots by mutation status or change x- or y-axis to log scale MFMER
41 MFMER
42 MFMER
 or in the set of samples without query gene alterations (mutually exclusive). Filter table with these options Click on any column header to sort.")
43 Enrichments Select type of data to examine Hover over a dot to see the gene name This tab takes samples with alterations in any query gene as a set and looks to see whether other genes are frequently altered in the same set of samples (cooccurring) or in the set of samples without query gene alterations (mutually exclusive). Filter table with these options Click on any column header to sort. Hover over the for more details about how values are calculated MFMER
44 Enrichments Tab MFMER

45 MFMER

46 Enrichment Tab (CNV) 2017 MFMER

47 Enrichments mrna overexpressed 2017 MFMER

48 Network Change zoom and move around network Visualize biological interaction networks centered on your query genes, with color-coding and filter options based on the frequency of genomic alterations in each gene. Click on the Help tab for a more detailed explanation. View or modify the nodes included in the network (e.g. add drugs, filter genes by alteration frequency) View or modify the types of interactions (edges) utilized in the plot Click on any node to see detailed information about the gene here Link to this page 2017 MFMER
49 BRCA1/2 string PPI network 2017 MFMER
.")

50 CN Segments Plots for each gene appear on a separate tab. View copy number for each sample at each query gene via the Integrated Genomics Viewer (IGV). Toggle track labels, a vertical line marking the center of the viewing screen, and a vertical line that moves with your cursor. Use to zoom in or out. Click for track settings, including expanding the height of each sample (see below) Each row is a single sample Gene structures Link to this page Click on a read for sample ID and copy number value 2017 MFMER
51 Download Download data or copy lists of samples. Frequency of gene alteration for each gene in the query Download mutations and copy number Link to this page List of all samples with status of each query gene (blank = no alteration) List of samples that have an alteration in one or more query genes List of all samples with summary classification: 0 = no alteration in any query gene 1 = alteration in one or more query genes Advanced feature: use this list as a custom sample list to run a new query in only the subset of samples with a particular genetic alteration MFMER

52 Bookmark Save a link to the current session. Useful for sharing with others or returning to a query at a later date. Link to this page 2017 MFMER
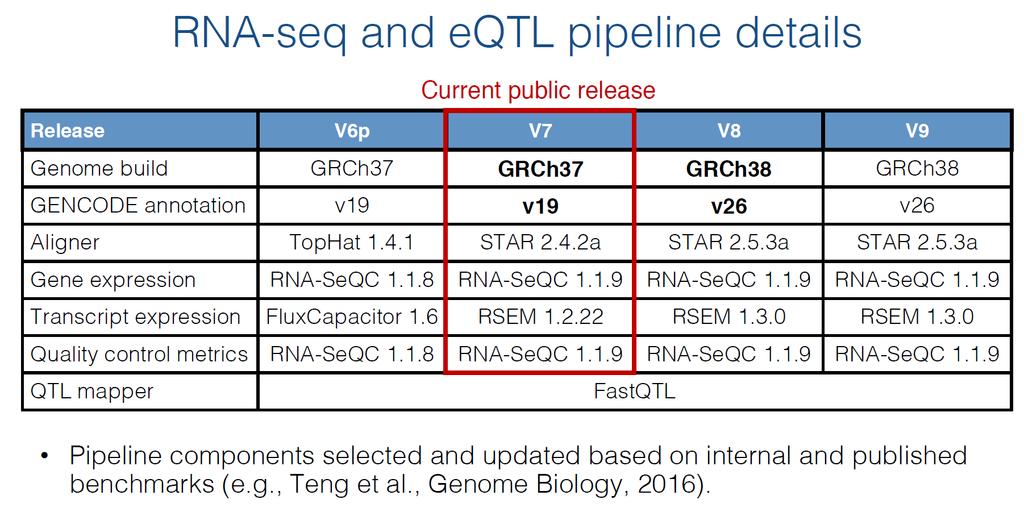
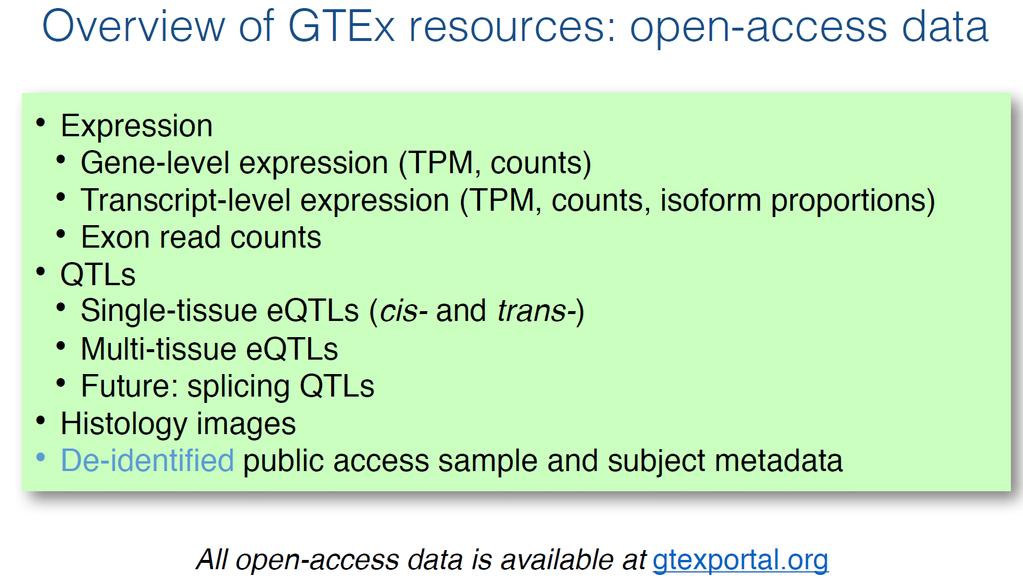
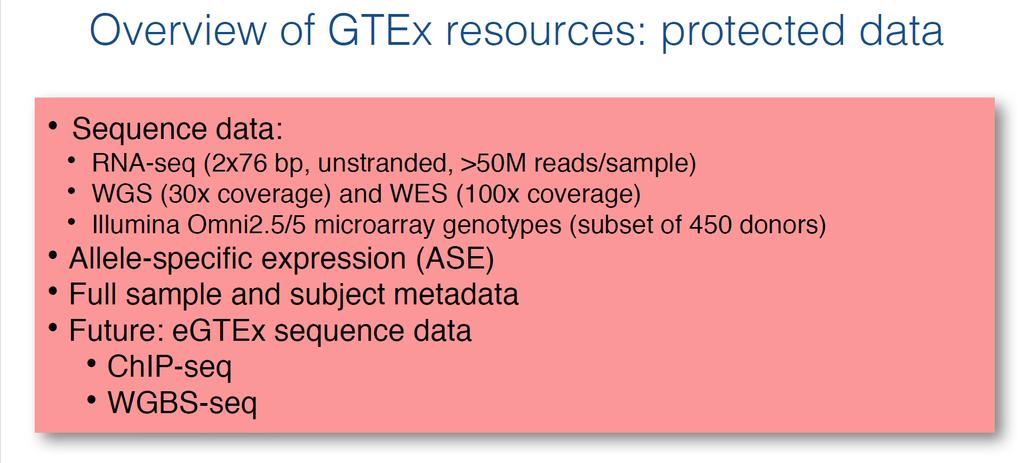
53 GTEX 2017 MFMER
54 Genotype Tissue-Expression Project Genome-wide association studies (GWAS) Cases vs controls ~95% of SNPs located in non-coding regions 53 tissue sites 2017 MFMER

55 2017 MFMER
56 MFMER
57 MFMER
58 MFMER
59 MFMER
60 ESR1 query 2017 MFMER

61 Exon expression 2017 MFMER
62 ESR1 - eqtls 2017 MFMER
63 No splice QTLs and protein truncating variants found for ESR MFMER
64 WebQTL software 2017 MFMER

65 GeneNetwork WebQTL 2017 MFMER
66 Precision medicine for cancer patients using clinical and molecular data 2017 MFMER

67 Multi-dimensional data to individual patient 2017 MFMER

68 PANOPLY Precision cancer genomics report: single sample inventory 2017 MFMER
69 Integration of multi-omics data for precision medicine PANOPLY- Precision Cancer Genomic Report: Single Sample Inventory / oply_patients/index3.html Clean051.pdf 2017 MFMER


70 Integration of 17 non-responder PANOPLY reports 2017 MFMER
71 Oncomatch matching best cancer cell line to a patient 2017 MFMER


72 CCLE Database Sanger Drug Sensitivity Database Matching Algorithms Best match based on CNA, RNA, DNA combined Surgery Biopsy Patient derived Tumor Seq data OncoMatch Mining the most sensitive and resistant drug for the cell-line/patient 2017 MFMER
73 Non-coding reads 2017 MFMER

74 Unmapped host reads Under review 2017 MFMER
75 Single-cell RNA-Sequencing 2017 MFMER

76 Single Cell vs. Bulk Samples - Important for answering biological questions where cell-specific changes in transcriptome are important - New protocols and lower sequencing cost David Cook, SlideShare, MFMER
 (non-umi) UMI=Unique")


77 Two scrna-seq Platforms at MGF Fluidigm C1 (fluidic circuits) (non-umi) UMI=Unique Molecular Identifier MAPRSeq pipeline Chromium Controller Chromium 10X Genomics Single cell gene expression (Droplet) (UMI) Sequencing Tertiary analysis 10X Genomics Pipeline 2017 MFMER
78 Fluidigm C1 vs. Chromium 10X Genomics Instrument Fluidigm C1 Chromium 10x Genomics Launched in /2016 Principles (Reference) Integrated fluidic circuits Droplet-based RNA-Seq solution Full transcript 3 -tag Throughput (# of cells analyzed) Low-medium (48-800) High (100-10,000+) Visual Inspection Yes No Cell Selection Yes (C1 size based) No Starting Amount of Cells Medium-low High Flexibility (Own Protocols) Yes No Advantage Limitation Allows visual inspection of captured cells customizable protocols Size-based cell selection (C1) (5-10, 10-17, µm) High cell capture efficiency, cell size <50µm, nuclei suspensions can be studied, lower system cost High initial cell concentration required, no users modification possible 2017 MFMER
79 Customized Tertiary Analysis Bushra Arif, SlideShare, MFMER

80 Unsupervised clustering Unsupervised hierarchical clustering after gene expression analysis of single blood cells isolated from the whole kidney marrow. Heat map shows high transcript expression in red and low/absent expression in blue. Four major clusters were identified, including the following: erythroid (red), myeloid (green), B cells (light blue), and T cells (dark blue) MFMER

81 Unsupervised clustering Violin plots show the distribution of gene expression of single cells. Cells types were assigned based on hierarchical clustering and assessed for transcript expression of well-known blood cell lineage genes MFMER


82 Impact 2017 MFMER
83 Questions & Discussion 2017 MFMER
Session 4 Rebecca Poulos
 The Cancer Genome Atlas (TCGA) & International Cancer Genome Consortium (ICGC) Session 4 Rebecca Poulos Prince of Wales Clinical School Introductory bioinformatics for human genomics workshop, UNSW 20
Session 4 Rebecca Poulos
 The Cancer Genome Atlas (TCGA) & International Cancer Genome Consortium (ICGC) Session 4 Rebecca Poulos Prince of Wales Clinical School Introductory bioinformatics for human genomics workshop, UNSW 28
The Cancer Genome Atlas & International Cancer Genome Consortium
 The Cancer Genome Atlas & International Cancer Genome Consortium Session 3 Dr Jason Wong Prince of Wales Clinical School Introductory bioinformatics for human genomics workshop, UNSW 31 st July 2014 1
Hands-On Ten The BRCA1 Gene and Protein
 Hands-On Ten The BRCA1 Gene and Protein Objective: To review transcription, translation, reading frames, mutations, and reading files from GenBank, and to review some of the bioinformatics tools, such
Data mining with Ensembl Biomart. Stéphanie Le Gras
 Data mining with Ensembl Biomart Stéphanie Le Gras (slegras@igbmc.fr) Guidelines Genome data Genome browsers Getting access to genomic data: Ensembl/BioMart 2 Genome Sequencing Example: Human genome 2000:
Nature Methods: doi: /nmeth.3115
 Supplementary Figure 1 Analysis of DNA methylation in a cancer cohort based on Infinium 450K data. RnBeads was used to rediscover a clinically distinct subgroup of glioblastoma patients characterized by
OncoPPi Portal A Cancer Protein Interaction Network to Inform Therapeutic Strategies
 OncoPPi Portal A Cancer Protein Interaction Network to Inform Therapeutic Strategies 2017 Contents Datasets... 2 Protein-protein interaction dataset... 2 Set of known PPIs... 3 Domain-domain interactions...
Analysis with SureCall 2.1
 Analysis with SureCall 2.1 Danielle Fletcher Field Application Scientist July 2014 1 Stages of NGS Analysis Primary analysis, base calling Control Software FASTQ file reads + quality 2 Stages of NGS Analysis
Tutorial: RNA-Seq Analysis Part II: Non-Specific Matches and Expression Measures
 : RNA-Seq Analysis Part II: Non-Specific Matches and Expression Measures March 15, 2013 CLC bio Finlandsgade 10-12 8200 Aarhus N Denmark Telephone: +45 70 22 55 09 Fax: +45 70 22 55 19 www.clcbio.com support@clcbio.com
Titrations in Cytobank
 The Premier Platform for Single Cell Analysis (1) Titrations in Cytobank To analyze data from a titration in Cytobank, the first step is to upload your own FCS files or clone an experiment you already
Module 3: Pathway and Drug Development
 Module 3: Pathway and Drug Development Table of Contents 1.1 Getting Started... 6 1.2 Identifying a Dasatinib sensitive cancer signature... 7 1.2.1 Identifying and validating a Dasatinib Signature... 7
User Guide. Association analysis. Input
 User Guide TFEA.ChIP is a tool to estimate transcription factor enrichment in a set of differentially expressed genes using data from ChIP-Seq experiments performed in different tissues and conditions.
MODULE 4: SPLICING. Removal of introns from messenger RNA by splicing
 Last update: 05/10/2017 MODULE 4: SPLICING Lesson Plan: Title MEG LAAKSO Removal of introns from messenger RNA by splicing Objectives Identify splice donor and acceptor sites that are best supported by
Introduction. Introduction
 Introduction We are leveraging genome sequencing data from The Cancer Genome Atlas (TCGA) to more accurately define mutated and stable genes and dysregulated metabolic pathways in solid tumors. These efforts
Use Case 9: Coordinated Changes of Epigenomic Marks Across Tissue Types. Epigenome Informatics Workshop Bioinformatics Research Laboratory
 Use Case 9: Coordinated Changes of Epigenomic Marks Across Tissue Types Epigenome Informatics Workshop Bioinformatics Research Laboratory 1 Introduction Active or inactive states of transcription factor
Nature Genetics: doi: /ng Supplementary Figure 1. SEER data for male and female cancer incidence from
 Supplementary Figure 1 SEER data for male and female cancer incidence from 1975 2013. (a,b) Incidence rates of oral cavity and pharynx cancer (a) and leukemia (b) are plotted, grouped by males (blue),
Journal: Nature Methods
 Journal: Nature Methods Article Title: Network-based stratification of tumor mutations Corresponding Author: Trey Ideker Supplementary Item Supplementary Figure 1 Supplementary Figure 2 Supplementary Figure
Supplementary Figures
 Supplementary Figures Supplementary Figure 1. Heatmap of GO terms for differentially expressed genes. The terms were hierarchically clustered using the GO term enrichment beta. Darker red, higher positive
Integrated Analysis of Copy Number and Gene Expression
 Integrated Analysis of Copy Number and Gene Expression Nexus Copy Number provides user-friendly interface and functionalities to integrate copy number analysis with gene expression results for the purpose
Variant Classification. Author: Mike Thiesen, Golden Helix, Inc.
 Variant Classification Author: Mike Thiesen, Golden Helix, Inc. Overview Sequencing pipelines are able to identify rare variants not found in catalogs such as dbsnp. As a result, variants in these datasets
Nature Medicine: doi: /nm.4439
 Figure S1. Overview of the variant calling and verification process. This figure expands on Fig. 1c with details of verified variants identification in 547 additional validation samples. Somatic variants
BlueBayCT - Warfarin User Guide
 BlueBayCT - Warfarin User Guide December 2012 Help Desk 0845 5211241 Contents Getting Started... 1 Before you start... 1 About this guide... 1 Conventions... 1 Notes... 1 Warfarin Management... 2 New INR/Warfarin
The North Carolina Health Data Explorer
 The North Carolina Health Data Explorer The Health Data Explorer provides access to health data for North Carolina counties in an interactive, user-friendly atlas of maps, tables, and charts. It allows
CNV PCA Search Tutorial
 CNV PCA Search Tutorial Release 8.1 Golden Helix, Inc. March 18, 2014 Contents 1. Data Preparation 2 A. Join Log Ratio Data with Phenotype Information.............................. 2 B. Activate only
SUPPLEMENTARY FIGURES: Supplementary Figure 1
 SUPPLEMENTARY FIGURES: Supplementary Figure 1 Supplementary Figure 1. Glioblastoma 5hmC quantified by paired BS and oxbs treated DNA hybridized to Infinium DNA methylation arrays. Workflow depicts analytic
A Practical Guide to Integrative Genomics by RNA-seq and ChIP-seq Analysis
 A Practical Guide to Integrative Genomics by RNA-seq and ChIP-seq Analysis Jian Xu, Ph.D. Children s Research Institute, UTSW Introduction Outline Overview of genomic and next-gen sequencing technologies
Genetic alterations of histone lysine methyltransferases and their significance in breast cancer
 Genetic alterations of histone lysine methyltransferases and their significance in breast cancer Supplementary Materials and Methods Phylogenetic tree of the HMT superfamily The phylogeny outlined in the
SUPPLEMENTARY METHODS
 SUPPLEMENTARY METHODS Data Contents and Sources OASIS captured sample-level annotations and three omics data types - somatic mutation, copy number variation (CNV) and gene expression based on microarray
A Versatile Algorithm for Finding Patterns in Large Cancer Cell Line Data Sets
 A Versatile Algorithm for Finding Patterns in Large Cancer Cell Line Data Sets James Jusuf, Phillips Academy Andover May 21, 2017 MIT PRIMES The Broad Institute of MIT and Harvard Introduction A quest
Whole Genome and Transcriptome Analysis of Anaplastic Meningioma. Patrick Tarpey Cancer Genome Project Wellcome Trust Sanger Institute
 Whole Genome and Transcriptome Analysis of Anaplastic Meningioma Patrick Tarpey Cancer Genome Project Wellcome Trust Sanger Institute Outline Anaplastic meningioma compared to other cancers Whole genomes
User Instruction Guide
 User Instruction Guide Table of Contents Logging In and Logging Out of MMSx 1 Creating a TPN (Terminal Profile Number) 2 Single Merchant 2 From Navigation Bar 2 From Home Page Link 4 Multiple Merchants
R2 Training Courses. Release The R2 support team
 R2 Training Courses Release 2.0.2 The R2 support team Nov 08, 2018 Students Course 1 Student Course: Investigating Intra-tumor Heterogeneity 3 1.1 Introduction.............................................
SSM signature genes are highly expressed in residual scar tissues after preoperative radiotherapy of rectal cancer.
 Supplementary Figure 1 SSM signature genes are highly expressed in residual scar tissues after preoperative radiotherapy of rectal cancer. Scatter plots comparing expression profiles of matched pretreatment
AVENIO family of NGS oncology assays ctdna and Tumor Tissue Analysis Kits
 AVENIO family of NGS oncology assays ctdna and Tumor Tissue Analysis Kits Accelerating clinical research Next-generation sequencing (NGS) has the ability to interrogate many different genes and detect
TCGA. The Cancer Genome Atlas
 TCGA The Cancer Genome Atlas TCGA: History and Goal History: Started in 2005 by the National Cancer Institute (NCI) and the National Human Genome Research Institute (NHGRI) with $110 Million to catalogue
Broad H3K4me3 is associated with increased transcription elongation and enhancer activity at tumor suppressor genes
 Broad H3K4me3 is associated with increased transcription elongation and enhancer activity at tumor suppressor genes Kaifu Chen 1,2,3,4,5,10, Zhong Chen 6,10, Dayong Wu 6, Lili Zhang 7, Xueqiu Lin 1,2,8,
Supplementary Tables. Supplementary Figures
 Supplementary Files for Zehir, Benayed et al. Mutational Landscape of Metastatic Cancer Revealed from Prospective Clinical Sequencing of 10,000 Patients Supplementary Tables Supplementary Table 1: Sample
Computational Analysis of UHT Sequences Histone modifications, CAGE, RNA-Seq
 Computational Analysis of UHT Sequences Histone modifications, CAGE, RNA-Seq Philipp Bucher Wednesday January 21, 2009 SIB graduate school course EPFL, Lausanne ChIP-seq against histone variants: Biological
Nature Genetics: doi: /ng Supplementary Figure 1. Somatic coding mutations identified by WES/WGS for 83 ATL cases.
 Supplementary Figure 1 Somatic coding mutations identified by WES/WGS for 83 ATL cases. (a) The percentage of targeted bases covered by at least 2, 10, 20 and 30 sequencing reads (top) and average read
Supplementary Figure 1: High-throughput profiling of survival after exposure to - radiation. (a) Cells were plated in at least 7 wells in a 384-well
 Cells were plated in at least 7 wells in a 384-well") Supplementary Figure 1: High-throughput profiling of survival after exposure to - radiation. (a) Cells were plated in at least 7 wells in a 384-well plate at cell densities ranging from 25-225 cells in
Supplementary Figure 1: High-throughput profiling of survival after exposure to - radiation. (a) Cells were plated in at least 7 wells in a 384-well plate at cell densities ranging from 25-225 cells in
Dementia Direct Enhanced Service
 Vision 3 Dementia Direct Enhanced Service England Outcomes Manager Copyright INPS Ltd 2015 The Bread Factory, 1A Broughton Street, Battersea, London, SW8 3QJ T: +44 (0) 207 501700 F:+44 (0) 207 5017100
Supplementary Figure 1: Attenuation of association signals after conditioning for the lead SNP. a) attenuation of association signal at the 9p22.
 attenuation of association signal at the 9p22.") Supplementary Figure 1: Attenuation of association signals after conditioning for the lead SNP. a) attenuation of association signal at the 9p22.32 PCOS locus after conditioning for the lead SNP rs10993397;
Supplementary Figure 1: Attenuation of association signals after conditioning for the lead SNP. a) attenuation of association signal at the 9p22.32 PCOS locus after conditioning for the lead SNP rs10993397;
Introduction to Systems Biology of Cancer Lecture 2
 Introduction to Systems Biology of Cancer Lecture 2 Gustavo Stolovitzky IBM Research Icahn School of Medicine at Mt Sinai DREAM Challenges High throughput measurements: The age of omics Systems Biology
Computer Science, Biology, and Biomedical Informatics (CoSBBI) Outline. Molecular Biology of Cancer AND. Goals/Expectations. David Boone 7/1/2015
 Outline. Molecular Biology of Cancer AND. Goals/Expectations. David Boone 7/1/2015") Goals/Expectations Computer Science, Biology, and Biomedical (CoSBBI) We want to excite you about the world of computer science, biology, and biomedical informatics. Experience what it is like to be a
Goals/Expectations Computer Science, Biology, and Biomedical (CoSBBI) We want to excite you about the world of computer science, biology, and biomedical informatics. Experience what it is like to be a
The 16th KJC Bioinformatics Symposium Integrative analysis identifies potential DNA methylation biomarkers for pan-cancer diagnosis and prognosis
 The 16th KJC Bioinformatics Symposium Integrative analysis identifies potential DNA methylation biomarkers for pan-cancer diagnosis and prognosis Tieliu Shi tlshi@bio.ecnu.edu.cn The Center for bioinformatics
Golden Helix s End-to-End Solution for Clinical Labs
 Golden Helix s End-to-End Solution for Clinical Labs Steven Hystad - Field Application Scientist Nathan Fortier Senior Software Engineer 20 most promising Biotech Technology Providers Top 10 Analytics
Supplementary Materials for
 www.sciencemag.org/content/355/6332/eaai8478/suppl/dc1 Supplementary Materials for Decoupling genetics, lineages, and microenvironment in IDH-mutant gliomas by single-cell RNA-seq Andrew S. Venteicher,
Supplementary Figures
 Supplementary Figures Supplementary Figure 1. Pan-cancer analysis of global and local DNA methylation variation a) Variations in global DNA methylation are shown as measured by averaging the genome-wide
The Hospital Anxiety and Depression Scale Guidance and Information
 The Hospital Anxiety and Depression Scale Guidance and Information About Testwise Testwise is the powerful online testing platform developed by GL Assessment to host its digital tests. Many of GL Assessment
MethylMix An R package for identifying DNA methylation driven genes
 MethylMix An R package for identifying DNA methylation driven genes Olivier Gevaert May 3, 2016 Stanford Center for Biomedical Informatics Department of Medicine 1265 Welch Road Stanford CA, 94305-5479
Nature Genetics: doi: /ng Supplementary Figure 1. Mutational signatures in BCC compared to melanoma.
 Supplementary Figure 1 Mutational signatures in BCC compared to melanoma. (a) The effect of transcription-coupled repair as a function of gene expression in BCC. Tumor type specific gene expression levels
Fully Automated IFA Processor LIS User Manual
 Fully Automated IFA Processor LIS User Manual Unless expressly authorized, forwarding and duplication of this document is not permitted. All rights reserved. TABLE OF CONTENTS 1 OVERVIEW... 4 2 LIS SCREEN...
OneTouch Reveal Web Application. User Manual for Healthcare Professionals Instructions for Use
 OneTouch Reveal Web Application User Manual for Healthcare Professionals Instructions for Use Contents 2 Contents Chapter 1: Introduction...4 Product Overview...4 Intended Use...4 System Requirements...
Multi-omics data integration colon cancer using proteogenomics approach
 Dept. of Medical Oncology Multi-omics data integration colon cancer using proteogenomics approach DTL Focus meeting, 29 August 2016 Thang Pham OncoProteomics Laboratory, Dept. of Medical Oncology VU University
University of Pittsburgh Cancer Institute UPMC CancerCenter. Uma Chandran, MSIS, PhD /21/13
 University of Pittsburgh Cancer Institute UPMC CancerCenter Uma Chandran, MSIS, PhD chandran@pitt.edu 412-648-9326 2/21/13 University of Pittsburgh Cancer Institute Founded in 1985 Director Nancy Davidson,
SIEVE 2.1 Proteomics Example
 SIEVE 2.1 Proteomics Example Software Overview What is SIEVE? SIEVE is Thermo Scientific s differential software solution. SIEVE will continue to enhance our current product for label-free differential
Precision Medicine Knowledgebase (PMKB)
") Precision Medicine Knowledgebase (PMKB) https://pmkb.weill.cornell.edu/ https://academic.oup.com/jamia/article/24/ 3/513/2418181/The-cancer-precisionmedicine-knowledge-base-for Click on this to expand/collapse
Precision Medicine Knowledgebase (PMKB) https://pmkb.weill.cornell.edu/ https://academic.oup.com/jamia/article/24/ 3/513/2418181/The-cancer-precisionmedicine-knowledge-base-for Click on this to expand/collapse
Nature Structural & Molecular Biology: doi: /nsmb Supplementary Figure 1
 Supplementary Figure 1 Frequency of alternative-cassette-exon engagement with the ribosome is consistent across data from multiple human cell types and from mouse stem cells. Box plots showing AS frequency
Getting Started.
 Getting Started www.scientificbraintrainingpro.com Summary 1. First steps... 2 2. Log in... 2 3. Create an account for a patient... 3 4. Access an exercise with this patient... 4 5. Viewing the results
IPA Advanced Training Course
 IPA Advanced Training Course October 2013 Academia sinica Gene (Kuan Wen Chen) IPA Certified Analyst Agenda I. Data Upload and How to Run a Core Analysis II. Functional Interpretation in IPA Hands-on Exercises
Relationship between genomic features and distributions of RS1 and RS3 rearrangements in breast cancer genomes.
 Supplementary Figure 1 Relationship between genomic features and distributions of RS1 and RS3 rearrangements in breast cancer genomes. (a,b) Values of coefficients associated with genomic features, separately
MYGLOOKO USER GUIDE. June 2017 IM GL+ A0003 REV J
 MYGLOOKO USER GUIDE June 2017 IM GL+ A0003 REV J TABLE OF CONTENTS TABLE OF CONTENTS GENERAL INFORMATION...1 Product Description...1 Intended Use...1 Supported Software...1 Warnings...2 Contraindications...2
Section B. Comparative Genomics Analysis of Influenza H5N2 Viruses. Objective
 Section B. Comparative Genomics Analysis of Influenza H5N2 Viruses Objective Upon completion of this exercise, you will be able to use the Influenza Research Database (IRD; http://www.fludb.org/) to: Search
SUPPLEMENTARY APPENDIX
 SUPPLEMENTARY APPENDIX 1) Supplemental Figure 1. Histopathologic Characteristics of the Tumors in the Discovery Cohort 2) Supplemental Figure 2. Incorporation of Normal Epidermal Melanocytic Signature
Chapter 8: ICD-10 Enhancements in Avalon
 Chapter 8: ICD-10 Enhancements in Avalon This chapter describes how ICD-10 specific workflows have been incorporated in the different components of the Avalon application to ensure that the users transition
Mutation Detection and CNV Analysis for Illumina Sequencing data from HaloPlex Target Enrichment Panels using NextGENe Software for Clinical Research
 Mutation Detection and CNV Analysis for Illumina Sequencing data from HaloPlex Target Enrichment Panels using NextGENe Software for Clinical Research Application Note Authors John McGuigan, Megan Manion,
Nature Genetics: doi: /ng Supplementary Figure 1. PCA for ancestry in SNV data.
 Supplementary Figure 1 PCA for ancestry in SNV data. (a) EIGENSTRAT principal-component analysis (PCA) of SNV genotype data on all samples. (b) PCA of only proband SNV genotype data. (c) PCA of SNV genotype
38 Int'l Conf. Bioinformatics and Computational Biology BIOCOMP'16
 38 Int'l Conf. Bioinformatics and Computational Biology BIOCOMP'16 PGAR: ASD Candidate Gene Prioritization System Using Expression Patterns Steven Cogill and Liangjiang Wang Department of Genetics and
COSMIC - Catalogue of Somatic Mutations in Cancer
 COSMIC - Catalogue of Somatic Mutations in Cancer http://cancer.sanger.ac.uk/cosmic https://academic.oup.com/nar/articl e-lookup/doi/10.1093/nar/gkw1121 Data In Large-scale systematic screens Detailed
Case Studies on High Throughput Gene Expression Data Kun Huang, PhD Raghu Machiraju, PhD
 Case Studies on High Throughput Gene Expression Data Kun Huang, PhD Raghu Machiraju, PhD Department of Biomedical Informatics Department of Computer Science and Engineering The Ohio State University Review
Supplementary Information
 Supplementary Information Guided Visual Exploration of Genomic Stratifications in Cancer Marc Streit 1,6, Alexander Lex 2,6, Samuel Gratzl¹, Christian Partl³, Dieter Schmalstieg³, Hanspeter Pfister², Peter
Expanded View Figures
 Solip Park & Ben Lehner Epistasis is cancer type specific Molecular Systems Biology Expanded View Figures A B G C D E F H Figure EV1. Epistatic interactions detected in a pan-cancer analysis and saturation
PedCath IMPACT User s Guide
 PedCath IMPACT User s Guide Contents Overview... 3 IMPACT Overview... 3 PedCath IMPACT Registry Module... 3 More on Work Flow... 4 Case Complete Checkoff... 4 PedCath Cath Report/IMPACT Shared Data...
EXPression ANalyzer and DisplayER
 EXPression ANalyzer and DisplayER Tom Hait Aviv Steiner Igor Ulitsky Chaim Linhart Amos Tanay Seagull Shavit Rani Elkon Adi Maron-Katz Dorit Sagir Eyal David Roded Sharan Israel Steinfeld Yossi Shiloh
HALLA KABAT * Outreach Program, mircore, 2929 Plymouth Rd. Ann Arbor, MI 48105, USA LEO TUNKLE *
 CERNA SEARCH METHOD IDENTIFIED A MET-ACTIVATED SUBGROUP AMONG EGFR DNA AMPLIFIED LUNG ADENOCARCINOMA PATIENTS HALLA KABAT * Outreach Program, mircore, 2929 Plymouth Rd. Ann Arbor, MI 48105, USA Email:
SEQUENCE FEATURE VARIANT TYPES
 SEQUENCE FEATURE VARIANT TYPES DEFINITION OF SFVT: The Sequence Feature Variant Type (SFVT) component in IRD (http://www.fludb.org) is a relatively novel approach that delineates specific regions, called
Knowledge networks of biological and medical data An exhaustive and flexible solution to model life sciences domains
 Knowledge networks of biological and medical data An exhaustive and flexible solution to model life sciences domains Dr. Sascha Losko, Dr. Karsten Wenger, Dr. Wenzel Kalus, Dr. Andrea Ramge, Dr. Jens Wiehler,
MA 151: Using Minitab to Visualize and Explore Data The Low Fat vs. Low Carb Debate
 MA 151: Using Minitab to Visualize and Explore Data The Low Fat vs. Low Carb Debate September 5, 2018 1 Introduction to the Data We will be working with a synthetic data set meant to resemble the weight
Expanded View Figures
 EMO Molecular Medicine Proteomic map of squamous cell carcinomas Hanibal ohnenberger et al Expanded View Figures Figure EV1. Technical reproducibility. Pearson s correlation analysis of normalised SILC
Guide to Use of SimulConsult s Phenome Software
 Guide to Use of SimulConsult s Phenome Software Page 1 of 52 Table of contents Welcome!... 4 Introduction to a few SimulConsult conventions... 5 Colors and their meaning... 5 Contextual links... 5 Contextual
ShadeVision v Color Map
 Kevin Aamodt Page 1 7/1/2004 ShadeVision v.3.01 Color Map The ShadeVision v.3.01 color map will allow the user to custom select the lookup regions of the Gingival, Middle, and Incisal areas of a tooth.
Supplementary Figure 1. Metabolic landscape of cancer discovery pipeline. RNAseq raw counts data of cancer and healthy tissue samples were downloaded
 Supplementary Figure 1. Metabolic landscape of cancer discovery pipeline. RNAseq raw counts data of cancer and healthy tissue samples were downloaded from TCGA and differentially expressed metabolic genes
genomics for systems biology / ISB2020 RNA sequencing (RNA-seq)
") RNA sequencing (RNA-seq) Module Outline MO 13-Mar-2017 RNA sequencing: Introduction 1 WE 15-Mar-2017 RNA sequencing: Introduction 2 MO 20-Mar-2017 Paper: PMID 25954002: Human genomics. The human transcriptome
RNA sequencing (RNA-seq) Module Outline MO 13-Mar-2017 RNA sequencing: Introduction 1 WE 15-Mar-2017 RNA sequencing: Introduction 2 MO 20-Mar-2017 Paper: PMID 25954002: Human genomics. The human transcriptome
Nature Neuroscience: doi: /nn Supplementary Figure 1
 Supplementary Figure 1 Illustration of the working of network-based SVM to confidently predict a new (and now confirmed) ASD gene. Gene CTNND2 s brain network neighborhood that enabled its prediction by
Pathway Exercises Metabolism and Pathways
 1. Find the metabolic pathway for glycolysis. For this exercise use PlasmoDB.org Pathway Exercises Metabolism and Pathways a. Navigate to the search page for Identify Metabolic Pathways based on Pathway
Core Technology Development Team Meeting
 Core Technology Development Team Meeting To hear the meeting, you must call in Toll-free phone number: 1-866-740-1260 Access Code: 2201876 For international call in numbers, please visit: https://www.readytalk.com/account-administration/international-numbers
Accessing and Using ENCODE Data Dr. Peggy J. Farnham
 1 William M Keck Professor of Biochemistry Keck School of Medicine University of Southern California How many human genes are encoded in our 3x10 9 bp? C. elegans (worm) 959 cells and 1x10 8 bp 20,000
Warfarin Help Documentation
 Warfarin Help Documentation Table Of Contents Warfarin Management... 1 iii Warfarin Management Warfarin Management The Warfarin Management module is a powerful tool for monitoring INR results and advising
Contents New Features 2 JustGiving Integration 2
 Contents 7.44.0 New Features 2 JustGiving Integration 2 Step One: Basic settings 2 Step Two: Events Mapping 3 Step Three: Import Historical Data 4 Step Four: Finish 5 Edit the JustGiving import 5 JustGiving
SMPD 287 Spring 2015 Bioinformatics in Medical Product Development. Final Examination
 Final Examination You have a choice between A, B, or C. Please email your solutions, as a pdf attachment, by May 13, 2015. In the subject of the email, please use the following format: firstname_lastname_x
Cleaning Up and Visualizing My Workout Data With JMP Shannon Conners, PhD JMP, SAS Abstract
 Cleaning Up and Visualizing My Workout Data With JMP Shannon Conners, PhD JMP, SAS Abstract I began tracking weight training workouts in notebooks in middle school. However, training notes did not give
Cerner COMPASS ICD-10 Transition Guide
 Cerner COMPASS ICD-10 Transition Guide Dx Assistant Purpose: To educate Seton clinicians regarding workflow changes within Cerner COMPASS subsequent to ICD-10 transition. Scope: Basic modules and functionality
SUPPLEMENTARY FIGURES
 SUPPLEMENTARY FIGURES Figure S1. Clinical significance of ZNF322A overexpression in Caucasian lung cancer patients. (A) Representative immunohistochemistry images of ZNF322A protein expression in tissue
User Manual. RaySafe i2 dose viewer
 User Manual RaySafe i2 dose viewer 2012.03 Unfors RaySafe 5001048-A All rights are reserved. Reproduction or transmission in whole or in part, in any form or by any means, electronic, mechanical or otherwise,
White Paper Estimating Complex Phenotype Prevalence Using Predictive Models
 White Paper 23-12 Estimating Complex Phenotype Prevalence Using Predictive Models Authors: Nicholas A. Furlotte Aaron Kleinman Robin Smith David Hinds Created: September 25 th, 2015 September 25th, 2015
Gene-microRNA network module analysis for ovarian cancer
 Gene-microRNA network module analysis for ovarian cancer Shuqin Zhang School of Mathematical Sciences Fudan University Oct. 4, 2016 Outline Introduction Materials and Methods Results Conclusions Introduction
Broad GDAC. Lung Adenocarcinoma AWG Run 2013_02_07. Dan DiCara Hailei Zhang Michael Noble
 Broad GDAC Lung Adenocarcinoma AWG Run 2013_02_07 Dan DiCara Hailei Zhang Michael Noble Copyright 2013 Broad Institute. All rights reserved. gdac@broadinstitute.org http://gdac.broadinstitute.org GDAC
Exercises: Differential Methylation
 Exercises: Differential Methylation Version 2018-04 Exercises: Differential Methylation 2 Licence This manual is 2014-18, Simon Andrews. This manual is distributed under the creative commons Attribution-Non-Commercial-Share
Use the following checklist to ensure that video captions are compliant with accessibility guidelines.
 Table of Contents Purpose 2 Objective 2 Scope 2 Technical Background 2 Video Compliance Standards 2 Section 508 Standards for Electronic and Information Technology... 2 Web Content Accessibility Guidelines
Figure S2. Distribution of acgh probes on all ten chromosomes of the RIL M0022
 96 APPENDIX B. Supporting Information for chapter 4 "changes in genome content generated via segregation of non-allelic homologs" Figure S1. Potential de novo CNV probes and sizes of apparently de novo