Nature Methods: doi: /nmeth.3115
|
|
|
- Miles Lane
- 5 years ago
- Views:
Transcription


1
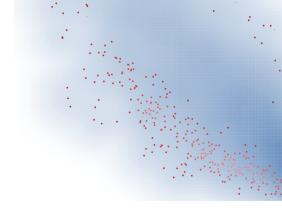
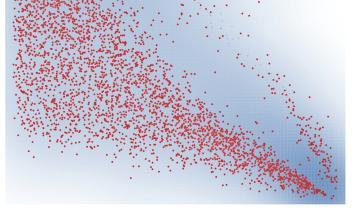
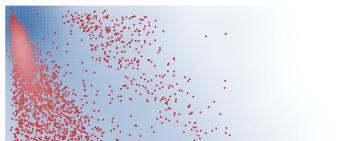
2 Supplementary Figure 1 Analysis of DNA methylation in a cancer cohort based on Infinium 450K data. RnBeads was used to rediscover a clinically distinct subgroup of glioblastoma patients characterized by increased DNA methylation levels (termed G-CIMP+), and to predict the G-CIMP status for a total of 124 patients using Infinium 450k data obtained from the TCGA project ( (a) Detection of genetic duplicates among the patient samples (columns) using a clustered heatmap of intensity values for the genotyping probes that are present on the Infinium microarray (rows). The inset shows that two samples exhibit a high level of genetic identity, and they are indeed derived from tumors of the same patient. (b) Quality control plot summarizing the outcome of the data filtering. The bar plots on the top left show that the majority of CpG sites (top) and samples (bottom) are of good quality and can be retained. The relatively straight line in the quantile-quantile plot indicates that the probe filtering does not have a major impact on the distribution of DNA methylation in the dataset. (c) Identification of a small but clearly distinguished cluster of G-CIMP+ glioblastoma samples with elevated DNA methylation levels especially in CpG-rich genomic regions (light blue in the leftmost column). In the heatmap, blue colors denote high levels of DNA methylation, red indicates low levels and grey represents intermediate levels. For visualization purposes, only the 100 gene promoters (rows) with the highest levels of inter-sample variation in DNA methylation are shown (columns), but the hierarchical clustering is based on the full set of promoters. (d) Global assessment of the similarity between the DNA methylation profiles, plotting all glioblastoma samples according to their second and third principal components. The samples exhibit strong separation according to the G-CIMP status (denoted by point shape) and IDH1 mutation status (denoted by point color). (e) Analysis of significant associations between all user-provided sample annotations. Significant p-values (<0.05) are highlighted in the left triangle, and the corresponding statistical tests are annotated in the right triangle (orange: Pearson correlation followed by permutation-based estimation of the p-value; green: Fisher s exact test; blue: Wilcoxon rank sum test; violet: Kruskal-Wallis one-way analysis of variance). (f) Genome-scale comparison between the DNA methylation levels of G-CIMP positive (y-axis) and G-CIMP negative (x-axis) tumor samples, focusing on CpG islands (left scatterplot) and on 5-kilobase tiling regions with a CpG content in the bottom quartile (right scatterplot), respectively. Genomic regions that are differentially methylated with an FDR below 0.05 are presented as red points. All other regions are displayed in blue, and color brightness denotes point density.
, which makes large DNA methylation datasets more readily available for follow-up research.")
3 Supplementary Figure 2 RnBeads-based Methylome Resource of reference epigenome data sets. Screenshot of the Methylome Resource ( which makes large DNA methylation datasets more readily available for follow-up research. On the one hand, it provides detailed analysis reports for publicly available methylome datasets that can be explored interactively. On the other hand, the Methylome Resource website lets RnBeads users download all data and configurations that are needed to re-run all or part of the DNA methylation analyses in their local or cloud-based computing environment. These re-runnable analysis configurations make it straightforward for RnBeads users to analyze their own DNA methylation data in the context of publicly available reference epigenome maps.
4 Comprehensive analysis of DNA methylation data with RnBeads Yassen Assenov, Fabian Müller, Pavlo Lutsik, Jörn Walter, Thomas Lengauer & Christoph Bock Supplementary Note As an example for RnBeads-based analysis of Infinium 450k data, we performed a reanalysis of a publicly available glioblastoma dataset generated by The Cancer Genome Atlas (TCGA) project (Weisenberger, 2014). Glioblastoma multiforme is an aggressive type of brain cancer with a median survival time of little more than a year and substantial variation between patients (Wen and Kesari, 2008). In an attempt to stratify patients according to the molecular characteristics of the tumors, recent research has identified a subtype that is characterized by elevated levels of DNA methylation, prolonged survival and high frequency of mutations in the IDH1 gene (Noushmehr et al., 2010). The discovery of this glioblastoma CpG island methylator phenotype positive (G-CIMP+) subtype was based on Illumina s Infinium 27k assay, prompting us to validate this observation using RnBeads and an extended dataset of Infinium 450k profiles for 124 glioblastoma patients. We downloaded the raw microarray signal intensity files in IDAT format from the TCGA website ( created a sample annotation file that contains the available patient data including IDH1 mutation status and then launched RnBeads. The software identifies the data directory and input file format from the annotation file and normalizes the raw intensity data using SWAN (Makismovic et al., 2012) (other normalization algorithms are supported as well, as described in the Online Methods). CpG-specific DNA methylation levels are obtained from the normalized data and collected in an RnBSet object that is the basis for all subsequent analyses. During quality control, RnBeads performs clustering of all samples based on genotype fingerprinting probes included on the Infinium microarray (Supplementary Figure 1a), which is an effective method for identifying sample mix-ups and duplications. Here, we identified two samples with identical SNP patterns, in concordance with their TCGA annotation as primary and recurrent tumors from the same patient. All other samples were taken from genetically unrelated patients. RnBeads provides flexible features for data filtering as part of the preprocessing module (Supplementary Figure 1b), which are useful for excluding measurements that could bias the analysis (e.g., due to low signal quality, overlap with SNPs, or X-chromosome association in case of different sex ratios between cases and controls). Based on the filtered and quality-controlled dataset, RnBeads performs hierarchical clustering to facilitate data exploration and outlier detection. In the clustered heatmap, we observe a small and distinct group of samples with increased promoter hypermethylation suggestive of the G-CIMP+ subtype (Supplementary Figure 1c). These putative G-CIMP+ samples indeed exhibit the characteristic enrichment of IDH1 mutations and a clear separation with respect to their global DNA methylation levels patterns that are particularly evident from a low-dimensional projection of the entire dataset that has been annotated with IDH1 mutation status and G- CIMP subtype information (Supplementary Figure 1d). The significance of this association is also confirmed by pairwise statistical tests for associations that RnBeads performs between all sample annotations (Supplementary Figure 1e). Furthermore, RnBeads calculates groupwise comparisons between the mean DNA methylation levels in the G-CIMP positive versus negative samples for CpG islands and for genome-wide tiling regions (Supplementary Figure 1f). The resulting scatterplots show that the gain of DNA methylation among the G-CIMP+ samples is more pronounced in CpG islands than in genomic regions exhibiting low CpG content. These automated, exploratory analyses provide a starting point for dissecting the patterns and mechanisms of epigenetic deregulation that may affect DNA methylation in G-CIMP+ tumors. Follow-up analyses can be performed directly in R, most conveniently by using the precalculated RnBSet data object that RnBeads prepares as part of the initial analysis. Furthermore, RnBeads makes it easy to export the data and results in a variety of formats and to hand them over to stand-alone or web-based bioinformatic tools for further analysis.
5 Supplementary Tables Supplementary Table 1: Comparison between software tools for DNA methylation analysis <Large table available as a separate file> Supplementary Table 2: Performance benchmark for large DNA methylation analyses with RnBeads Data type 1 No. of Samples 2 No. of CpGs 3 No. of Annotations 4 No. of Comparisons 5 Runtime (node) 6 Runtime (cluster) 7 Infinium 450k , h 12min 1h 9min Infinium 450k , h 2min 7h 29min Infinium 450k , d 13h 51min 20h 15min Infinium 450k 4034* 482, d 7h 21min 6d 18h 40min RRBS 10 1,804, h 56min 49min RRBS 50 2,169, h 32min 1h 54min RRBS 100 2,221, h 13min 2h 57min RRBS 216* 2,295, d 8h 50min 14h 27min WGBS 5 28,132, h 43min 8h 23min WGBS 10 28,150, d 10h 23min 20h 5min WGBS 20 28,154, d 12h 21min 1d 15h 34min WGBS 41* 28,158, d 4h 54min 1d 9h 27min 1 Data from the following sources were included in the analysis: TCGA (Infinium 450k), ENCODE (RRBS), Ziller et al. (WGBS) 2 Subsets of the full datasets were randomly generated in order to assess the effect of sample size on runtime 3 Number of CpG sites present in at least one sample. For RRBS/WGBS, low coverage sites are removed prior to counting 4 Adding more columns to the sample annotation table increases the complexity and runtime of the analysis 5 Including more pairwise comparisons in the analysis strongly increases runtime but can be parallelized effectively 6 Serial runtime measured on a scientific computing cluster (16 nodes), summing up the runtime of all contributing nodes 7 Parallel runtime / time to completion on a scientific computing cluster (16 nodes) with optimal use of job parallelization * The analysis results for the full datasets are available as part of the Methylome Resource on the RnBeads website
6
SUPPLEMENTARY FIGURES: Supplementary Figure 1
 SUPPLEMENTARY FIGURES: Supplementary Figure 1 Supplementary Figure 1. Glioblastoma 5hmC quantified by paired BS and oxbs treated DNA hybridized to Infinium DNA methylation arrays. Workflow depicts analytic
SUPPLEMENTARY INFORMATION
 doi:10.1038/nature10866 a b 1 2 3 4 5 6 7 Match No Match 1 2 3 4 5 6 7 Turcan et al. Supplementary Fig.1 Concepts mapping H3K27 targets in EF CBX8 targets in EF H3K27 targets in ES SUZ12 targets in ES
Expanded View Figures
 Solip Park & Ben Lehner Epistasis is cancer type specific Molecular Systems Biology Expanded View Figures A B G C D E F H Figure EV1. Epistatic interactions detected in a pan-cancer analysis and saturation
Supplementary Figures
 Supplementary Figures Supplementary Figure 1. Pan-cancer analysis of global and local DNA methylation variation a) Variations in global DNA methylation are shown as measured by averaging the genome-wide
The 16th KJC Bioinformatics Symposium Integrative analysis identifies potential DNA methylation biomarkers for pan-cancer diagnosis and prognosis
 The 16th KJC Bioinformatics Symposium Integrative analysis identifies potential DNA methylation biomarkers for pan-cancer diagnosis and prognosis Tieliu Shi tlshi@bio.ecnu.edu.cn The Center for bioinformatics
SUPPLEMENTARY APPENDIX
 SUPPLEMENTARY APPENDIX 1) Supplemental Figure 1. Histopathologic Characteristics of the Tumors in the Discovery Cohort 2) Supplemental Figure 2. Incorporation of Normal Epidermal Melanocytic Signature
Nature Genetics: doi: /ng Supplementary Figure 1. SEER data for male and female cancer incidence from
 Supplementary Figure 1 SEER data for male and female cancer incidence from 1975 2013. (a,b) Incidence rates of oral cavity and pharynx cancer (a) and leukemia (b) are plotted, grouped by males (blue),
MethylMix An R package for identifying DNA methylation driven genes
 MethylMix An R package for identifying DNA methylation driven genes Olivier Gevaert May 3, 2016 Stanford Center for Biomedical Informatics Department of Medicine 1265 Welch Road Stanford CA, 94305-5479
Cancer Informatics Lecture
 Cancer Informatics Lecture Mayo-UIUC Computational Genomics Course June 22, 2018 Krishna Rani Kalari Ph.D. Associate Professor 2017 MFMER 3702274-1 Outline The Cancer Genome Atlas (TCGA) Genomic Data Commons
Nature Medicine: doi: /nm.3967
 Supplementary Figure 1. Network clustering. (a) Clustering performance as a function of inflation factor. The grey curve shows the median weighted Silhouette widths for varying inflation factors (f [1.6,
Nature Neuroscience: doi: /nn Supplementary Figure 1
 Supplementary Figure 1 Illustration of the working of network-based SVM to confidently predict a new (and now confirmed) ASD gene. Gene CTNND2 s brain network neighborhood that enabled its prediction by
Assignment 5: Integrative epigenomics analysis
 Assignment 5: Integrative epigenomics analysis Due date: Friday, 2/24 10am. Note: no late assignments will be accepted. Introduction CpG islands (CGIs) are important regulatory regions in the genome. What
Broad H3K4me3 is associated with increased transcription elongation and enhancer activity at tumor suppressor genes
 Broad H3K4me3 is associated with increased transcription elongation and enhancer activity at tumor suppressor genes Kaifu Chen 1,2,3,4,5,10, Zhong Chen 6,10, Dayong Wu 6, Lili Zhang 7, Xueqiu Lin 1,2,8,
Epigenetics. Jenny van Dongen Vrije Universiteit (VU) Amsterdam Boulder, Friday march 10, 2017
 Amsterdam Boulder, Friday march 10, 2017") Epigenetics Jenny van Dongen Vrije Universiteit (VU) Amsterdam j.van.dongen@vu.nl Boulder, Friday march 10, 2017 Epigenetics Epigenetics= The study of molecular mechanisms that influence the activity of
Epigenetics Jenny van Dongen Vrije Universiteit (VU) Amsterdam j.van.dongen@vu.nl Boulder, Friday march 10, 2017 Epigenetics Epigenetics= The study of molecular mechanisms that influence the activity of
Epigenetic programming in chronic lymphocytic leukemia
 Epigenetic programming in chronic lymphocytic leukemia Christopher Oakes 10 th Canadian CLL Research Meeting September 18-19 th, 2014 Epigenetics and DNA methylation programming in normal and tumor cells:
DNA methylation signatures for 2016 WHO classification subtypes of diffuse gliomas
 Paul et al. Clinical Epigenetics (2017) 9:32 DOI 10.1186/s13148-017-0331-9 RESEARCH Open Access DNA methylation signatures for 2016 WHO classification subtypes of diffuse gliomas Yashna Paul, Baisakhi
ARTICLE RESEARCH. Macmillan Publishers Limited. All rights reserved
 Extended Data Figure 6 Annotation of drivers based on clinical characteristics and co-occurrence patterns. a, Putative drivers affecting greater than 10 patients were assessed for enrichment in IGHV mutated
Journal: Nature Methods
 Journal: Nature Methods Article Title: Network-based stratification of tumor mutations Corresponding Author: Trey Ideker Supplementary Item Supplementary Figure 1 Supplementary Figure 2 Supplementary Figure
DiffVar: a new method for detecting differential variability with application to methylation in cancer and aging
 Genome Biology This Provisional PDF corresponds to the article as it appeared upon acceptance. Fully formatted PDF and full text (HTML) versions will be made available soon. DiffVar: a new method for detecting
Comparison of open chromatin regions between dentate granule cells and other tissues and neural cell types.
 Supplementary Figure 1 Comparison of open chromatin regions between dentate granule cells and other tissues and neural cell types. (a) Pearson correlation heatmap among open chromatin profiles of different
Supplementary Figures
 Supplementary Figures Supplementary Figure 1. Heatmap of GO terms for differentially expressed genes. The terms were hierarchically clustered using the GO term enrichment beta. Darker red, higher positive
Use Case 9: Coordinated Changes of Epigenomic Marks Across Tissue Types. Epigenome Informatics Workshop Bioinformatics Research Laboratory
 Use Case 9: Coordinated Changes of Epigenomic Marks Across Tissue Types Epigenome Informatics Workshop Bioinformatics Research Laboratory 1 Introduction Active or inactive states of transcription factor
Supplementary Materials for
 www.sciencetranslationalmedicine.org/cgi/content/full/7/283/283ra54/dc1 Supplementary Materials for Clonal status of actionable driver events and the timing of mutational processes in cancer evolution
Supplementary Information
 Supplementary Information Guided Visual Exploration of Genomic Stratifications in Cancer Marc Streit 1,6, Alexander Lex 2,6, Samuel Gratzl¹, Christian Partl³, Dieter Schmalstieg³, Hanspeter Pfister², Peter
Integrated Analysis of Copy Number and Gene Expression
 Integrated Analysis of Copy Number and Gene Expression Nexus Copy Number provides user-friendly interface and functionalities to integrate copy number analysis with gene expression results for the purpose
OncoPPi Portal A Cancer Protein Interaction Network to Inform Therapeutic Strategies
 OncoPPi Portal A Cancer Protein Interaction Network to Inform Therapeutic Strategies 2017 Contents Datasets... 2 Protein-protein interaction dataset... 2 Set of known PPIs... 3 Domain-domain interactions...
SUPPLEMENTAL INFORMATION
 SUPPLEMENTAL INFORMATION GO term analysis of differentially methylated SUMIs. GO term analysis of the 458 SUMIs with the largest differential methylation between human and chimp shows that they are more
Nature Immunology: doi: /ni Supplementary Figure 1. Transcriptional program of the TE and MP CD8 + T cell subsets.
 Supplementary Figure 1 Transcriptional program of the TE and MP CD8 + T cell subsets. (a) Comparison of gene expression of TE and MP CD8 + T cell subsets by microarray. Genes that are 1.5-fold upregulated
Expert-guided Visual Exploration (EVE) for patient stratification. Hamid Bolouri, Lue-Ping Zhao, Eric C. Holland
 for patient stratification. Hamid Bolouri, Lue-Ping Zhao, Eric C. Holland") Expert-guided Visual Exploration (EVE) for patient stratification Hamid Bolouri, Lue-Ping Zhao, Eric C. Holland Oncoscape.sttrcancer.org Paul Lisa Ken Jenny Desert Eric The challenge Given - patient clinical
Expert-guided Visual Exploration (EVE) for patient stratification Hamid Bolouri, Lue-Ping Zhao, Eric C. Holland Oncoscape.sttrcancer.org Paul Lisa Ken Jenny Desert Eric The challenge Given - patient clinical
Discovery of Novel Human Gene Regulatory Modules from Gene Co-expression and
 Discovery of Novel Human Gene Regulatory Modules from Gene Co-expression and Promoter Motif Analysis Shisong Ma 1,2*, Michael Snyder 3, and Savithramma P Dinesh-Kumar 2* 1 School of Life Sciences, University
38 Int'l Conf. Bioinformatics and Computational Biology BIOCOMP'16
 38 Int'l Conf. Bioinformatics and Computational Biology BIOCOMP'16 PGAR: ASD Candidate Gene Prioritization System Using Expression Patterns Steven Cogill and Liangjiang Wang Department of Genetics and
ASMS 2015 ThP 459 Glioblastoma Multiforme Subtype Classification: Integrated Analysis of Protein and Gene Expression Data
 ASMS 2015 ThP 459 Glioblastoma Multiforme Subtype Classification: Integrated Analysis of Protein and Gene Expression Data Durairaj Renu 1, Vadiraja Bhat 2, Mona Al-Gizawiy 3, Carolina B. Livi 2, Stephen
Tissue of origin determines cancer-associated CpG island promoter hypermethylation patterns
 RESEARCH Open Access Tissue of origin determines cancer-associated CpG island promoter hypermethylation patterns Duncan Sproul 1,2, Robert R Kitchen 1,3, Colm E Nestor 1,2, J Michael Dixon 1, Andrew H
Expanded View Figures
 EMO Molecular Medicine Proteomic map of squamous cell carcinomas Hanibal ohnenberger et al Expanded View Figures Figure EV1. Technical reproducibility. Pearson s correlation analysis of normalised SILC
Supplementary Materials for
 www.sciencetranslationalmedicine.org/cgi/content/full/7/303/303ra139/dc1 Supplementary Materials for Magnetic resonance image features identify glioblastoma phenotypic subtypes with distinct molecular
Supplementary Figure 1. Metabolic landscape of cancer discovery pipeline. RNAseq raw counts data of cancer and healthy tissue samples were downloaded
 Supplementary Figure 1. Metabolic landscape of cancer discovery pipeline. RNAseq raw counts data of cancer and healthy tissue samples were downloaded from TCGA and differentially expressed metabolic genes
Agilent GeneSpring/MPP Metadata Analysis Framework
 Agilent GeneSpring/MPP Metadata Analysis Framework Technical Overview Authors Srikanthi R., Pritha Aggarwal, Durairaj R., Maria Kammerer, and Pramila Tata Strand Life Sciences Bangalore, India Michael
Abstract. Optimization strategy of Copy Number Variant calling using Multiplicom solutions APPLICATION NOTE. Introduction
 Optimization strategy of Copy Number Variant calling using Multiplicom solutions Michael Vyverman, PhD; Laura Standaert, PhD and Wouter Bossuyt, PhD Abstract Copy number variations (CNVs) represent a significant
EXPression ANalyzer and DisplayER
 EXPression ANalyzer and DisplayER Tom Hait Aviv Steiner Igor Ulitsky Chaim Linhart Amos Tanay Seagull Shavit Rani Elkon Adi Maron-Katz Dorit Sagir Eyal David Roded Sharan Israel Steinfeld Yossi Shiloh
Figure S2. Distribution of acgh probes on all ten chromosomes of the RIL M0022
 96 APPENDIX B. Supporting Information for chapter 4 "changes in genome content generated via segregation of non-allelic homologs" Figure S1. Potential de novo CNV probes and sizes of apparently de novo
Supplementary Figure 1. General strategy to classify genes and identify TSGs.
 Supplementary Figure 1. General strategy to classify genes and identify TSGs. Supplementary Figure 2. EE patterns of validated EECTPs (7 novel) in our 24 LUAD samples. Red indicates extremely highly expressed
Supplementary Materials for
 www.sciencemag.org/content/355/6332/eaai8478/suppl/dc1 Supplementary Materials for Decoupling genetics, lineages, and microenvironment in IDH-mutant gliomas by single-cell RNA-seq Andrew S. Venteicher,
IMPaLA tutorial.
 IMPaLA tutorial http://impala.molgen.mpg.de/ 1. Introduction IMPaLA is a web tool, developed for integrated pathway analysis of metabolomics data alongside gene expression or protein abundance data. It
Introduction to LOH and Allele Specific Copy Number User Forum
 Introduction to LOH and Allele Specific Copy Number User Forum Jonathan Gerstenhaber Introduction to LOH and ASCN User Forum Contents 1. Loss of heterozygosity Analysis procedure Types of baselines 2.
Supplemental Information. Molecular, Pathological, Radiological, and Immune. Profiling of Non-brainstem Pediatric High-Grade
 Cancer Cell, Volume 33 Supplemental Information Molecular, Pathological, Radiological, and Immune Profiling of Non-brainstem Pediatric High-Grade Glioma from the HERBY Phase II Randomized Trial Alan Mackay,
White Paper Estimating Complex Phenotype Prevalence Using Predictive Models
 White Paper 23-12 Estimating Complex Phenotype Prevalence Using Predictive Models Authors: Nicholas A. Furlotte Aaron Kleinman Robin Smith David Hinds Created: September 25 th, 2015 September 25th, 2015
chapter 1 - fig. 2 Mechanism of transcriptional control by ppar agonists.
 chapter 1 - fig. 1 The -omics subdisciplines. chapter 1 - fig. 2 Mechanism of transcriptional control by ppar agonists. 201 figures chapter 1 chapter 2 - fig. 1 Schematic overview of the different steps
Phenotype prediction based on genome-wide DNA methylation data
 Wilhelm BMC Bioinformatics 2014, 15:193 METHODOLOGY ARTICLE Open Access Phenotype prediction based on genome-wide DNA methylation data Thomas Wilhelm Abstract Background: DNA methylation (DNAm) has important
Case Studies on High Throughput Gene Expression Data Kun Huang, PhD Raghu Machiraju, PhD
 Case Studies on High Throughput Gene Expression Data Kun Huang, PhD Raghu Machiraju, PhD Department of Biomedical Informatics Department of Computer Science and Engineering The Ohio State University Review
SSM signature genes are highly expressed in residual scar tissues after preoperative radiotherapy of rectal cancer.
 Supplementary Figure 1 SSM signature genes are highly expressed in residual scar tissues after preoperative radiotherapy of rectal cancer. Scatter plots comparing expression profiles of matched pretreatment
Session 4 Rebecca Poulos
 The Cancer Genome Atlas (TCGA) & International Cancer Genome Consortium (ICGC) Session 4 Rebecca Poulos Prince of Wales Clinical School Introductory bioinformatics for human genomics workshop, UNSW 20
Expanded View Figures
 Molecular Systems iology Tumor CNs reflect metabolic selection Nicholas Graham et al Expanded View Figures Human primary tumors CN CN characterization by unsupervised PC Human Signature Human Signature
Nature Genetics: doi: /ng.2995
 Supplementary Figure 1 Kaplan-Meier survival curves of patients with brainstem tumors. (a) Comparison of patients with PPM1D mutation versus wild-type PPM1D. (b) Comparison of patients with PPM1D mutation
A fully Bayesian approach for the analysis of Whole-Genome Bisulfite Sequencing Data
 A fully Bayesian approach for the analysis of Whole-Genome Bisulfite Sequencing Data Leonardo Bottolo 1,2,3 1 Department of Medical Genetics, University of Cambridge, UK 2 The Alan Turing Institute, London,
Nature Genetics: doi: /ng Supplementary Figure 1. Workflow of CDR3 sequence assembly from RNA-seq data.
 Supplementary Figure 1 Workflow of CDR3 sequence assembly from RNA-seq data. Paired-end short-read RNA-seq data were mapped to human reference genome hg19, and unmapped reads in the TCR regions were extracted
Integrative DNA methylome analysis of pan-cancer biomarkers in cancer discordant monozygotic twin-pairs
 Roos et al. Clinical Epigenetics (2016) 8:7 DOI 10.1186/s13148-016-0172-y RESEARCH Integrative DNA methylome analysis of pan-cancer biomarkers in cancer discordant monozygotic twin-pairs Open Access Leonie
Exercises: Differential Methylation
 Exercises: Differential Methylation Version 2018-04 Exercises: Differential Methylation 2 Licence This manual is 2014-18, Simon Andrews. This manual is distributed under the creative commons Attribution-Non-Commercial-Share
Module 3: Pathway and Drug Development
 Module 3: Pathway and Drug Development Table of Contents 1.1 Getting Started... 6 1.2 Identifying a Dasatinib sensitive cancer signature... 7 1.2.1 Identifying and validating a Dasatinib Signature... 7
EPIGENETIC RE-EXPRESSION OF HIF-2α SUPPRESSES SOFT TISSUE SARCOMA GROWTH
 EPIGENETIC RE-EXPRESSION OF HIF-2α SUPPRESSES SOFT TISSUE SARCOMA GROWTH Supplementary Figure 1. Supplementary Figure 1. Characterization of KP and KPH2 autochthonous UPS tumors. a) Genotyping of KPH2
SUPPLEMENTARY INFORMATION
 Supplementary text Collectively, we were able to detect ~14,000 expressed genes with RPKM (reads per kilobase per million) > 1 or ~16,000 with RPKM > 0.1 in at least one cell type from oocyte to the morula
Nature Medicine: doi: /nm.4439
 Figure S1. Overview of the variant calling and verification process. This figure expands on Fig. 1c with details of verified variants identification in 547 additional validation samples. Somatic variants
List of Figures. List of Tables. Preface to the Second Edition. Preface to the First Edition
 List of Figures List of Tables Preface to the Second Edition Preface to the First Edition xv xxv xxix xxxi 1 What Is R? 1 1.1 Introduction to R................................ 1 1.2 Downloading and Installing
An annotated list of bivalent chromatin regions in human ES cells: a new tool for cancer epigenetic research
 An annotated list of bivalent chromatin regions in human ES cells: a new tool for cancer epigenetic research Franck Court, Philippe Arnaud To cite this version: Franck Court, Philippe Arnaud. An annotated
Nature Genetics: doi: /ng Supplementary Figure 1. PCA for ancestry in SNV data.
 Supplementary Figure 1 PCA for ancestry in SNV data. (a) EIGENSTRAT principal-component analysis (PCA) of SNV genotype data on all samples. (b) PCA of only proband SNV genotype data. (c) PCA of SNV genotype
SubLasso:a feature selection and classification R package with a. fixed feature subset
 SubLasso:a feature selection and classification R package with a fixed feature subset Youxi Luo,3,*, Qinghan Meng,2,*, Ruiquan Ge,2, Guoqin Mai, Jikui Liu, Fengfeng Zhou,#. Shenzhen Institutes of Advanced
Supplementary Figure 1: Attenuation of association signals after conditioning for the lead SNP. a) attenuation of association signal at the 9p22.
 attenuation of association signal at the 9p22.") Supplementary Figure 1: Attenuation of association signals after conditioning for the lead SNP. a) attenuation of association signal at the 9p22.32 PCOS locus after conditioning for the lead SNP rs10993397;
Supplementary Figure 1: Attenuation of association signals after conditioning for the lead SNP. a) attenuation of association signal at the 9p22.32 PCOS locus after conditioning for the lead SNP rs10993397;
Session 4 Rebecca Poulos
 The Cancer Genome Atlas (TCGA) & International Cancer Genome Consortium (ICGC) Session 4 Rebecca Poulos Prince of Wales Clinical School Introductory bioinformatics for human genomics workshop, UNSW 28
Gene Ontology and Functional Enrichment. Genome 559: Introduction to Statistical and Computational Genomics Elhanan Borenstein
 Gene Ontology and Functional Enrichment Genome 559: Introduction to Statistical and Computational Genomics Elhanan Borenstein The parsimony principle: A quick review Find the tree that requires the fewest
RNA-SEQUENCING APPLICATIONS: GENE EXPRESSION QUANTIFICATION AND METHYLATOR PHENOTYPE IDENTIFICATION
 Texas Medical Center Library DigitalCommons@TMC UT GSBS Dissertations and Theses (Open Access) Graduate School of Biomedical Sciences 8-2013 RNA-SEQUENCING APPLICATIONS: GENE EXPRESSION QUANTIFICATION
Nature Genetics: doi: /ng Supplementary Figure 1. Assessment of sample purity and quality.
 Supplementary Figure 1 Assessment of sample purity and quality. (a) Hematoxylin and eosin staining of formaldehyde-fixed, paraffin-embedded sections from a human testis biopsy collected concurrently with
Vega: Variational Segmentation for Copy Number Detection
 Vega: Variational Segmentation for Copy Number Detection Sandro Morganella Luigi Cerulo Giuseppe Viglietto Michele Ceccarelli Contents 1 Overview 1 2 Installation 1 3 Vega.RData Description 2 4 Run Vega
The Cancer Genome Atlas & International Cancer Genome Consortium
 The Cancer Genome Atlas & International Cancer Genome Consortium Session 3 Dr Jason Wong Prince of Wales Clinical School Introductory bioinformatics for human genomics workshop, UNSW 31 st July 2014 1
Supplementary Materials Extracting a Cellular Hierarchy from High-dimensional Cytometry Data with SPADE
 Supplementary Materials Extracting a Cellular Hierarchy from High-dimensional Cytometry Data with SPADE Peng Qiu1,4, Erin F. Simonds2, Sean C. Bendall2, Kenneth D. Gibbs Jr.2, Robert V. Bruggner2, Michael
Supplementary Note. Nature Genetics: doi: /ng.2928
 Supplementary Note Loss of heterozygosity analysis (LOH). We used VCFtools v0.1.11 to extract only singlenucleotide variants with minimum depth of 15X and minimum mapping quality of 20 to create a ped
CNV PCA Search Tutorial
 CNV PCA Search Tutorial Release 8.1 Golden Helix, Inc. March 18, 2014 Contents 1. Data Preparation 2 A. Join Log Ratio Data with Phenotype Information.............................. 2 B. Activate only
Session 6: Integration of epigenetic data. Peter J Park Department of Biomedical Informatics Harvard Medical School July 18-19, 2016
 Session 6: Integration of epigenetic data Peter J Park Department of Biomedical Informatics Harvard Medical School July 18-19, 2016 Utilizing complimentary datasets Frequent mutations in chromatin regulators
Large conserved domains of low DNA methylation maintained by Dnmt3a
 Supplementary information Large conserved domains of low DNA methylation maintained by Dnmt3a Mira Jeong# 1, Deqiang Sun # 2, Min Luo# 1, Yun Huang 3, Grant A. Challen %1, Benjamin Rodriguez 2, Xiaotian
S1 Appendix: Figs A G and Table A. b Normal Generalized Fraction 0.075
 Aiello & Alter (216) PLoS One vol. 11 no. 1 e164546 S1 Appendix A-1 S1 Appendix: Figs A G and Table A a Tumor Generalized Fraction b Normal Generalized Fraction.25.5.75.25.5.75 1 53 4 59 2 58 8 57 3 48
PREPARED FOR: U.S. Army Medical Research and Materiel Command Fort Detrick, Maryland
 AD Award Number: W81XWH-12-1-0298 TITLE: MTHFR Functional Polymorphism C677T and Genomic Instability in the Etiology of Idiopathic Autism in Simplex Families PRINCIPAL INVESTIGATOR: Xudong Liu, PhD CONTRACTING
Supplementary Figure S1. Gene expression analysis of epidermal marker genes and TP63.
 Supplementary Figure Legends Supplementary Figure S1. Gene expression analysis of epidermal marker genes and TP63. A. Screenshot of the UCSC genome browser from normalized RNAPII and RNA-seq ChIP-seq data
Nature Immunology: doi: /ni Supplementary Figure 1. RNA-Seq analysis of CD8 + TILs and N-TILs.
 Supplementary Figure 1 RNA-Seq analysis of CD8 + TILs and N-TILs. (a) Schematic representation of the tumor and cell types used for the study. HNSCC, head and neck squamous cell cancer; NSCLC, non-small
Package MethPed. September 1, 2018
 Type Package Version 1.8.0 Date 2016-01-01 Package MethPed September 1, 2018 Title A DNA methylation classifier tool for the identification of pediatric brain tumor subtypes Depends R (>= 3.0.0), Biobase
A quick review. The clustering problem: Hierarchical clustering algorithm: Many possible distance metrics K-mean clustering algorithm:
 The clustering problem: partition genes into distinct sets with high homogeneity and high separation Hierarchical clustering algorithm: 1. Assign each object to a separate cluster. 2. Regroup the pair
NEpiC: a network-assisted algorithm for epigenetic studies using mean and variance combined signals
 Published online 14 June 2016 Nucleic Acids Research, 2016, Vol. 44, No. 16 e134 doi: 10.1093/nar/gkw546 NEpiC: a network-assisted algorithm for epigenetic studies using mean and variance combined signals
Metabolomic and Proteomics Solutions for Integrated Biology. Christine Miller Omics Market Manager ASMS 2015
 Metabolomic and Proteomics Solutions for Integrated Biology Christine Miller Omics Market Manager ASMS 2015 Integrating Biological Analysis Using Pathways Protein A R HO R Protein B Protein X Identifies
Meta-analysis of IDH-mutant cancers identifies EBF1 as a novel interaction partner for
 Meta-analysis of IDH-mutant cancers identifies EBF1 as a novel interaction partner for TET2 Paul Guilhamon 1, Malihe Eskandarpour 2, Dina Halai 3, Gareth A. Wilson 1, Andrew Feber 1, Andrew E. Teschendorff
T. R. Golub, D. K. Slonim & Others 1999
 T. R. Golub, D. K. Slonim & Others 1999 Big Picture in 1999 The Need for Cancer Classification Cancer classification very important for advances in cancer treatment. Cancers of Identical grade can have
Supplemental Figure 1. Genes showing ectopic H3K9 dimethylation in this study are DNA hypermethylated in Lister et al. study.
 mc mc mc mc SUP mc mc Supplemental Figure. Genes showing ectopic HK9 dimethylation in this study are DNA hypermethylated in Lister et al. study. Representative views of genes that gain HK9m marks in their
Supplementary Tables. Supplementary Figures
 Supplementary Files for Zehir, Benayed et al. Mutational Landscape of Metastatic Cancer Revealed from Prospective Clinical Sequencing of 10,000 Patients Supplementary Tables Supplementary Table 1: Sample
Cancer outlier differential gene expression detection
 Biostatistics (2007), 8, 3, pp. 566 575 doi:10.1093/biostatistics/kxl029 Advance Access publication on October 4, 2006 Cancer outlier differential gene expression detection BAOLIN WU Division of Biostatistics,
Canadian Bioinforma1cs Workshops
 5/12/16 Canadian Bioinforma1cs Workshops www.bioinforma1cs.ca Module #: Title of Module 2 1 Module 3 Introduc1on to WGBS and analysis Guillaume Bourque Learning Objec/ves of Module Know the different technologies
Introduction to Gene Sets Analysis
 Introduction to Svitlana Tyekucheva Dana-Farber Cancer Institute May 15, 2012 Introduction Various measurements: gene expression, copy number variation, methylation status, mutation profile, etc. Main
Supplementary Figure 1
 Supplementary Figure 1 Supplementary Fig. 1: Quality assessment of formalin-fixed paraffin-embedded (FFPE)-derived DNA and nuclei. (a) Multiplex PCR analysis of unrepaired and repaired bulk FFPE gdna from
Figure S1. Analysis of endo-sirna targets in different microarray datasets. The
 Supplemental Figures: Figure S1. Analysis of endo-sirna targets in different microarray datasets. The percentage of each array dataset that were predicted endo-sirna targets according to the Ambros dataset
Nature Getetics: doi: /ng.3471
 Supplementary Figure 1 Summary of exome sequencing data. ( a ) Exome tumor normal sample sizes for bladder cancer (BLCA), breast cancer (BRCA), carcinoid (CARC), chronic lymphocytic leukemia (CLLX), colorectal
Supplement to SCnorm: robust normalization of single-cell RNA-seq data
 Supplement to SCnorm: robust normalization of single-cell RNA-seq data Supplementary Note 1: SCnorm does not require spike-ins, since we find that the performance of spike-ins in scrna-seq is often compromised,
SUPPLEMENTARY INFORMATION In format provided by Javier DeFelipe et al. (MARCH 2013)
") Supplementary Online Information S2 Analysis of raw data Forty-two out of the 48 experts finished the experiment, and only data from these 42 experts are considered in the remainder of the analysis. We
Supplementary Online Information S2 Analysis of raw data Forty-two out of the 48 experts finished the experiment, and only data from these 42 experts are considered in the remainder of the analysis. We
New Enhancements: GWAS Workflows with SVS
 New Enhancements: GWAS Workflows with SVS August 9 th, 2017 Gabe Rudy VP Product & Engineering 20 most promising Biotech Technology Providers Top 10 Analytics Solution Providers Hype Cycle for Life sciences
Clustered mutations of oncogenes and tumor suppressors.
 Supplementary Figure 1 Clustered mutations of oncogenes and tumor suppressors. For each oncogene (red dots) and tumor suppressor (blue dots), the number of mutations found in an intramolecular cluster
7SK ChIRP-seq is specifically RNA dependent and conserved between mice and humans.
 Supplementary Figure 1 7SK ChIRP-seq is specifically RNA dependent and conserved between mice and humans. Regions targeted by the Even and Odd ChIRP probes mapped to a secondary structure model 56 of the