Mitosis. Single Nano Micro Milli Macro. Primary. PCNA expression
|
|
|
- Christina King
- 5 years ago
- Views:
Transcription


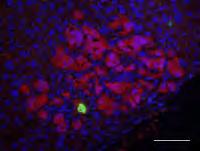
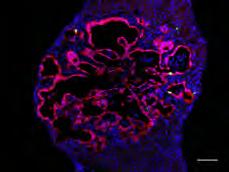
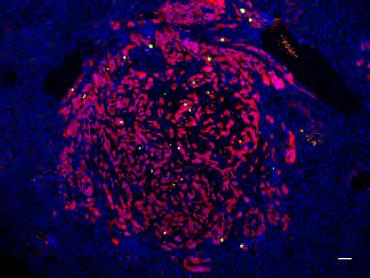


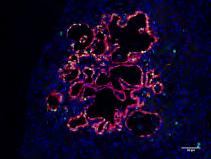


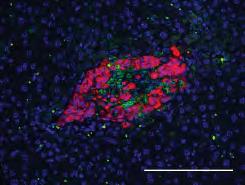
1 a b c DAPI YFP CC3 DAPI YFP PCNA DAPI YFP ph3 DAPI YFP KI67 e 6 Mitosis f 1 PCNA expression %ph3 + /YFP + n= n= %PCNA+/YFP+ 8 6 Supplementary Figure 1. Proliferation/apoptosis rates of metastatic lesions. (a) Proliferation. tumor an metastases were staine for YFP (re), DAPI (blue) an Ki67 (green). (b) Mitosis. tumor an metastases were staine for YFP (re), DAPI (blue) an ph3 (green). (c) PCNA expression. tumor an metastases were staine for YFP (re), DAPI (blue) an PCNA (green). () Apoptosis. tumor an metastases were staine for YFP (re), DAPI (blue) an CC3 (green). (e) Quantification of ph3 staining; p= (f) Quantification of PCNA staining; p=.6. Bars represent means ± SD. Scale bars, 5 μm.
 Representative images of a micrometastatic lesion (a), gross metastasis (b)")
, gross")
, five fiels were average")
2 D A B C Supplementary Figure. Proliferation in human PDAC tumors an metastases. (a-c) Representative images of a micrometastatic lesion (a), gross metastasis (b) an primary tumor (c) staine for Ki67 by IHC. () Quantification of Ki67 staining. The percentage of Ki67 + cells was etermine for micrometastases (n=16), gross metastases (n=11) an primary tumors (n=7); p=.389. For large lesions (gross metastases an primary tumors), five fiels were average together. Bars represent means ± SD;, p<.1.
3 % positive cells per lesion % positive a b c ECAD ECAD ZEB1 ZEB1 % positive cells per lesion ECAD ECAD e # % positive cells per lesion # ZEB1 ZEB1 % positive cells per lesion %positive cells f ECAD ECAD # ZEB1 ZEB1 Supplementary Figure 3. Skewing of epithelial to mesenchymal cell ratio within primary tumor an metastatic lesions. (a-f) Comparison of epithelial (ECAD+, +) an mesenchymal (+, ZEB1+) cell frequency within each size category. Bars represent means ± SD;, p<.5;, p<.1; #, p<.1;, p<.1.

 Representative images of human microscopic liver metastasis (n=11),")
 Quantification of + area per X fiel for gross metastases an primary")
 Representative images of human microscopic liver metastasis (e),")
 Quantification of + area per X fiel for gross metastases (n=18) an")
, five fiels were")
4 a liver met b Gross liver met c %+ area Met Gross Met e f g h %+ area Met Gross Met Supplementary Figure. Epithelial an mesenchymal features of human PDAC tumors an metastases. (a-c) Representative images of human microscopic liver metastasis (n=11), gross liver metastasis (n=) an primary PDAC tumors (n=6) staine for by IHC. () Quantification of + area per X fiel for gross metastases an primary tumors or within one cell iameter for micro-metastases. (e-g) Representative images of human microscopic liver metastasis (e), gross liver metastasis (f) an primary PDAC tumors (g) staine for by IHC. (h) Quantification of + area per X fiel for gross metastases (n=18) an primary tumors (n=6) or within one cell iameter for micro-metastases (n=57). For large lesions (gross metastases an primary tumors), five fiels were average together. Bars represent means ± SD;, p<.5;, p<.1; #, p<.1;, p<.1.


5 a Contact with myofibroblasts 1 %oflesions Number of cells 9 1 b c e DAPI YFP FN DAPI YFP SPARC DAPI YFP HABP DAPI YFP COL1 Supplementary Figure 5. Myofibroblast contact with nano-metastases epens on cell size an representative images of ECM stains. (a) Contact between nano-metastases an myofibroblasts by cell number. Data are shown as mean ± SD. P values were calculate by one sample t-tests against single cell mean;, p<.5. (b-e) Representative images of primary tumor an metastases staine for YFP (re), DAPI (blue) an (b) Collagen 1 (COL1); (c) Hyaluronic aci bining protein (HABP); () Secrete protein aciic an rich in cysteine (SPARC); an (e) Fibronectin (FN) in green. Scale bars, 5μm.

 Representative images of human microscopic liver metastasis")


6 a liver met b Gross liver met c %FN+ area 3 1 Fibronectin Met Gross Met Supplementary Figure 6. Fibronectin eposition in human PDAC tumors an metastases. (a-c) Representative images of human microscopic liver metastasis (n=5), gross liver metastasis (n=18) an primary PDAC tumors (n=6) staine for FN by IHC. () Quantification of FN+ area per X fiel for gross metastases an primary tumors or within one cell iameter for micrometastases. For large lesions (gross metastases an primary tumors), five fiels were average together. Bars represent means ± SD;, p<.5.


,")
 staining")
 in uninvolve")
")

 Quantification")


7 CY liver KPCY liver a b c DAPI CD5 DAPI F/8 DAPI Gr-1 H DAPI CD3 e % positive area Leukocytes in uninvolve areas CD5 F/8 Gr-1 CD3 CY liver # KPCY liver f g h j DAPI/YFP/CD3 DAPI/YFP/Gr-1 DAPI/YFP/F/8 DAPI/YFP/CD5 % CD5+ area k l m n Leukocytes phages MDSCs %F/8+ area 8 6 %Gr-1+ area 3 1 % CD3+ area T Lymphocytes Supplementary Figure 7. Leukocytes accumulate in metastatic livers. (a-) Representative images of CD5 (a), F/8 (b), Gr-1 (c) an CD3 () staining (green) an DAPI (blue) in uninvolve areas of control (Px1-cre, Rosa Y/Y ) an metastatic (KPCY) livers. Scale bars, 5μm. (e) Quantification of leukocyte ensity in uninvolve areas of liver (CD5, p=.; F/8, p<.1; Gr-1, p<.1; CD3, p=.33). (f-j) Representative images of leukocyte ensity at metastatic lesions. Metastases an primary tumor were staine for YFP (re), DAPI (blue) an (f), CD5 (leukocytes); (g), F/8 (macrophages); (h), Gr-1 (MDSCs); an (j), CD3 (T cells) in green. Scale bars, 5μm. (k-n) Quantification of leukocyte ensity at metastatic lesions. The percent positive area for each leukocyte stain was quantifie within one cell iameter of metastatic lesions. Data are presente as mean ± SD. Data are presente as mean of the percent positive area within a X fiel ± SD. n 5 mice, 5 lesions for each stain. P values were calculate by one-way ANOVA an unpaire Stuent s t-test with Welch s correction;, p<.5;, p<.1; #, p<.1;, p<.1.

 Age at eath (a) an tumor weight (b) for untreate historical controls")
 CTCs in untreate (n=3) an treate (n=8) mice;, p <.5.")
 Representative images of untreate an treate metastatic lesions staine")
8 a Age at eath b Tumor weight 3 ays 1 grams 3 1 CTCs per ml c Circulating tumor cells DAPI YFP CC3 Supplementary Figure 8. Circulating tumor cells (CTCs) are ecrease after long-term chemotherapy. (a-b) Age at eath (a) an tumor weight (b) for untreate historical controls an treate animals. Lines represent mean ± SD. P value by Stuent s t-test. (c) CTCs in untreate (n=3) an treate (n=8) mice;, p <.5. Lines represent the mean. P value by Stuent s t- test. () Representative images of untreate an treate metastatic lesions staine for CC3 (green), YFP (re) an DAPI (blue). Scale bars, 5μm.


 Representative images of untreate an treate")
, YFP")
 Quantification of ECAD- tumor cells in")

, YFP () Quantification of + tumor")


 primary tumor an liver metastasis")

 Quantification of CC3 staining in ECAD+ an")

9 DAPI YFP ECAD a DAPI YFP c % ECAD- of YFP+ cells e ECAD- tumor cells Fsp1+ tumor cells % + of YFP+ cells b 1 6 / Liver met 8 Apoptosis after short-term treatment f 5 % CC3+ / Eca+ Eca- 3 1 Mets Supplementary Figure 9. Mesenchymal tumor cells are eplete after chemotherapy. (a) Representative images of untreate an treate (GEM/PTX for - weeks) primary tumors an small metastatic lesions staine for ECAD (green), YFP (re) an DAPI (blue). (b) Quantification of ECAD- tumor cells in untreate an treate primary tumors an small metastatic lesions. (c) Representative images of untreate an treate primary tumors an small metastatic lesions for (green), YFP (re) an DAPI (blue). () Quantification of + tumor cells in untreate an treate primary tumors an small metastatic lesions. n 7 mice for each conition. Bars represent means ± SD. Statistical significance was etermine by Stuent s t-test with Welch s correction. (e) Representative images of treate (1 ose GEM/PTX) primary tumor an liver metastasis staine for CC3 (green), ECAD (cyan), YFP (re) an DAPI (blue). Arrows enote YFP+/ECAD+/CC3+ cells, arrowheas enote YFP+/ECAD-/CC3+ cells. (f) Quantification of CC3 staining in ECAD+ an ECAD- tumor cells (n mice). Bars represent means ± SD. Statistical significance was etermine by Mann-Whitney test. Scale bars, 5 um., p<.5;, p<.1; #, p<.1;, p <.1.
10 Mouse ID Total PD1 1 1 PD1 1 1 PD PD PD PD PD PD PD PD PD PD PD PD PD PD PD PD PD PD PD PD PD Supplementary Table 1. Metastatic buren (raw counts) for each animal use in Figure 1b.
11 Antiboy Concentration Company Catalog # Goat an Chicken α GFP 1:5 Abcam ab6673 Rabbit α CK19 1:1 In house N/A Rabbit α Phospho-Histone H3 1: Cell Signaling DC8 Rat α Ki67 1:1 DAKO M79 Rabbit α PCNA 1:1 Cell Signaling D3H8P Rabbit α Cleave Caspase-3 1: Cell Signaling 966 Rat α E-caherin 1:1 Invitrogen 1319 Rabbit α Clauin-7 1:1 Abcam ab787 Rabbit α Fsp1 1:5 DAKO A511 Rabbit α Zeb1 1:1 Santa Cruz sc-5388 Rabbit α αsma 1:1 Abcam ab569 Rabbit α Collagen I 1: Abcam ab371 Biotinylate bovine hyaluronic 1: Calbiochem aci bining protein Goat α SPARC 1:1 R&D Systems AF9 Rabbit α Fibronectin 1:3 Abcam ab13 Rat α CD5 1:5 BD Biosciences Rat α F/8 1:5 Ebioscience 1-81 Rat α Gr-1 1:5 Ebioscience Rat α CD3 1:5 Ebioscience 1-3 Goat α VE-caherin 1:1 R&D Systems AF1 Supplementary Table. Antiboies use for immunofluorescence an IHC.
12 Average age ± SD 61.6 ± 11.3 Average OS, mo ± SD 1.5 ± 9. Average tumor size, cm ± SD 5.6 ± 3. Sex, n (%) Male 18 (6) Female 1 () Location, n (%) Hea 18 (6) Boy 7 (3.3) Tail (13.3) Unknown, n (%) 1 (3.) Stage at iagnosis, n (%) IIB (6.7) III 7 (3.3) IV 1 (7) Surgery, n (%) (13.3) Chemotherapy, n (%) 3 (76.7) Raiation, n (%) 1 (33.3) Metastatic buren, n (%) 1 (6.7) (33.3) >1 18 (6) Differentation, n (%) Well/Moerate 1 (3.3) Moerate 1 (33.3) Moerate/Poor 1 () Poor 6 () KRAS status, n (%) Mutant 9 (96.7) WT 1 (3.3) TP53 status, n (%) Mutant 6 (86.7) WT (13.3) Supplementary Table 3. Clinicopathological characteristics of patients. Abbreviations: stanar eviation (SD); overall survival (OS); month (mo); number of patients (n); wiltype (WT).
(a) Significant biological processes (upper panel) and disease biomarkers (lower panel)
 Significant biological processes (upper panel) and disease biomarkers (lower panel)") Supplementary Figure 1. Functional enrichment analyses of secretomic proteins. (a) Significant biological processes (upper panel) and disease biomarkers (lower panel) 2 involved by hrab37-mediated secretory
Supplementary Figure 1. Functional enrichment analyses of secretomic proteins. (a) Significant biological processes (upper panel) and disease biomarkers (lower panel) 2 involved by hrab37-mediated secretory
Supplemental figure 1. PDGFRα is expressed dominantly by stromal cells surrounding mammary ducts and alveoli. A) IHC staining of PDGFRα in
 IHC staining of PDGFRα in") Supplemental figure 1. PDGFRα is expressed dominantly by stromal cells surrounding mammary ducts and alveoli. A) IHC staining of PDGFRα in nulliparous (left panel) and InvD6 mouse mammary glands (right
Supplemental figure 1. PDGFRα is expressed dominantly by stromal cells surrounding mammary ducts and alveoli. A) IHC staining of PDGFRα in nulliparous (left panel) and InvD6 mouse mammary glands (right
Supplementary Table 1. Characterization of HNSCC PDX models established at MSKCC
 Supplementary Table 1. Characterization of HNSCC PDX models established at MSKCC Supplementary Table 2. Drug content and loading efficiency estimated with F-NMR and UV- Vis Supplementary Table 3. Complete
SHREE ET AL, SUPPLEMENTAL MATERIALS. (A) Workflow for tumor cell line derivation and orthotopic implantation.
 Workflow for tumor cell line derivation and orthotopic implantation.") SHREE ET AL, SUPPLEMENTAL MATERIALS SUPPLEMENTAL FIGURE AND TABLE LEGENDS Supplemental Figure 1. Derivation and characterization of TS1-TGL and TS2-TGL PyMT cell lines and development of an orthotopic
SHREE ET AL, SUPPLEMENTAL MATERIALS SUPPLEMENTAL FIGURE AND TABLE LEGENDS Supplemental Figure 1. Derivation and characterization of TS1-TGL and TS2-TGL PyMT cell lines and development of an orthotopic
Supplementary Figure (OH) 22 nanoparticles did not affect cell viability and apoposis. MDA-MB-231, MCF-7, MCF-10A and BT549 cells were
 22 nanoparticles did not affect cell viability and apoposis. MDA-MB-231, MCF-7, MCF-10A and BT549 cells were") Supplementary Figure 1. Gd@C 82 (OH) 22 nanoparticles did not affect cell viability and apoposis. MDA-MB-231, MCF-7, MCF-10A and BT549 cells were treated with PBS, Gd@C 82 (OH) 22, C 60 (OH) 22 or GdCl
Supplementary Figure 1. Gd@C 82 (OH) 22 nanoparticles did not affect cell viability and apoposis. MDA-MB-231, MCF-7, MCF-10A and BT549 cells were treated with PBS, Gd@C 82 (OH) 22, C 60 (OH) 22 or GdCl
SUPPLEMENTAL TEXT AND FIGURES
 SUPPLEMENTAL TEXT AND FIGURES Prrx1 isoform switching regulates pancreatic cancer invasion and metastatic colonization Shigetsugu Takano, Maximilian Reichert, Basil Bakir, Koushik K. Das, Takahiro Nishida,
Suppl Video: Tumor cells (green) and monocytes (white) are seeded on a confluent endothelial
 and monocytes (white) are seeded on a confluent endothelial") Supplementary Information Häuselmann et al. Monocyte induction of E-selectin-mediated endothelial activation releases VE-cadherin junctions to promote tumor cell extravasation in the metastasis cascade
Supplementary Information Häuselmann et al. Monocyte induction of E-selectin-mediated endothelial activation releases VE-cadherin junctions to promote tumor cell extravasation in the metastasis cascade
Supplementary Figure 1. HOPX is hypermethylated in NPC. (a) Methylation levels of HOPX in Normal (n = 24) and NPC (n = 24) tissues from the
 Methylation levels of HOPX in Normal (n = 24) and NPC (n = 24) tissues from the") Supplementary Figure 1. HOPX is hypermethylated in NPC. (a) Methylation levels of HOPX in Normal (n = 24) and NPC (n = 24) tissues from the genome-wide methylation microarray data. Mean ± s.d.; Student
Supplementary Figure 1. HOPX is hypermethylated in NPC. (a) Methylation levels of HOPX in Normal (n = 24) and NPC (n = 24) tissues from the genome-wide methylation microarray data. Mean ± s.d.; Student
Supplemental Information. Otic Mesenchyme Cells Regulate. Spiral Ganglion Axon Fasciculation. through a Pou3f4/EphA4 Signaling Pathway
 Neuron, Volume 73 Supplemental Information Otic Mesenchyme Cells Regulate Spiral Ganglion Axon Fasciculation through a Pou3f4/EphA4 Signaling Pathway Thomas M. Coate, Steven Raft, Xiumei Zhao, Aimee K.
SUPPLEMENTARY INFORMATION
 DOI: 10.1038/ncb2607 Figure S1 Elf5 loss promotes EMT in mammary epithelium while Elf5 overexpression inhibits TGFβ induced EMT. (a, c) Different confocal slices through the Z stack image. (b, d) 3D rendering
Supplementary Figure 1: Hsp60 / IEC mice are embryonically lethal (A) Light microscopic pictures show mouse embryos at developmental stage E12.
 Light microscopic pictures show mouse embryos at developmental stage E12.") Supplementary Figure 1: Hsp60 / IEC mice are embryonically lethal (A) Light microscopic pictures show mouse embryos at developmental stage E12.5 and E13.5 prepared from uteri of dams and subsequently genotyped.
Supplementary Figure 1: Hsp60 / IEC mice are embryonically lethal (A) Light microscopic pictures show mouse embryos at developmental stage E12.5 and E13.5 prepared from uteri of dams and subsequently genotyped.
Supplementary Figure 1: si-craf but not si-braf sensitizes tumor cells to radiation.
 Supplementary Figure 1: si-craf but not si-braf sensitizes tumor cells to radiation. (a) Embryonic fibroblasts isolated from wildtype (WT), BRAF -/-, or CRAF -/- mice were irradiated (6 Gy) and DNA damage
a) Primary cultures derived from the pancreas of an 11-week-old Pdx1-Cre; K-MADM-p53
 Primary cultures derived from the pancreas of an 11-week-old Pdx1-Cre; K-MADM-p53") 1 2 3 4 5 6 7 8 9 10 Supplementary Figure 1. Induction of p53 LOH by MADM. a) Primary cultures derived from the pancreas of an 11-week-old Pdx1-Cre; K-MADM-p53 mouse revealed increased p53 KO/KO (green,
1 2 3 4 5 6 7 8 9 10 Supplementary Figure 1. Induction of p53 LOH by MADM. a) Primary cultures derived from the pancreas of an 11-week-old Pdx1-Cre; K-MADM-p53 mouse revealed increased p53 KO/KO (green,
Supplementary Figure 1. Double-staining immunofluorescence analysis of invasive colon and breast cancers. Specimens from invasive ductal breast
 Supplementary Figure 1. Double-staining immunofluorescence analysis of invasive colon and breast cancers. Specimens from invasive ductal breast carcinoma (a) and colon adenocarcinoma (b) were staining
SUPPLEMENTARY INFORMATION
 doi:1.138/nature1554 a TNF-α + in CD4 + cells [%] 1 GF SPF 6 b IL-1 + in CD4 + cells [%] 5 4 3 2 1 Supplementary Figure 1. Effect of microbiota on cytokine profiles of T cells in GALT. Frequencies of TNF-α
Supplementary Figure 1. Characterization of NMuMG-ErbB2 and NIC breast cancer cells expressing shrnas targeting LPP. NMuMG-ErbB2 cells (a) and NIC
 and NIC") Supplementary Figure 1. Characterization of NMuMG-ErbB2 and NIC breast cancer cells expressing shrnas targeting LPP. NMuMG-ErbB2 cells (a) and NIC cells (b) were engineered to stably express either a LucA-shRNA
Supplementary Figure 1. Characterization of NMuMG-ErbB2 and NIC breast cancer cells expressing shrnas targeting LPP. NMuMG-ErbB2 cells (a) and NIC cells (b) were engineered to stably express either a LucA-shRNA
Supplementary Figure 1
 Supplementary Figure 1 a Percent of body weight! (%) 4! 3! 1! Epididymal fat Subcutaneous fat Liver SD Percent of body weight! (%) ** 3! 1! SD Percent of body weight! (%) 6! 4! SD ** b Blood glucose (mg/dl)!
Impact of Sox9 Dosage and Hes1-mediated Notch Signaling in Controlling the Plasticity of Adult Pancreatic Duct Cells in Mice
 Impact of Sox9 Dosage and Hes1-mediated Notch Signaling in Controlling the Plasticity of Adult Pancreatic Duct Cells in Mice Shinichi Hosokawa 1,3,Kenichiro Furuyama 1,3, Masashi Horiguchi 1,3,Yoshiki
Dual reporter genetic mouse models of pancreatic cancer identify an epithelial to mesenchymal transition independent metastasis program
 Dual reporter genetic mouse models of pancreatic cancer identify an epithelial to mesenchymal transition independent metastasis program Yang Chen, Valerie S. LeBleu, Julienne L. Carstens, Hikaru Sugimoto,
Supplemental Materials. Stromal Modulation Reverses Primary Resistance to Immune Checkpoint Blockade in. Pancreatic Cancer.
 Supplemental Materials Stromal Modulation Reverses Primary Resistance to Immune Checkpoint Blockade in Pancreatic Cancer Jun Zhao 1, Zhilan Xiao 2, 3, Tingting Li 1, 4, Huiqin Chen 5, Ying Yuan 5, Alan
Supplemental Table 1. Primer sequences for transcript analysis
 Supplemental Table 1. Primer sequences for transcript analysis Primer Sequence (5 3 ) Primer Sequence (5 3 ) Mmp2 Forward CCCGTGTGGCCCTC Mmp15 Forward CGGGGCTGGCT Reverse GCTCTCCCGGTTTC Reverse CCTGGTGTGCCTGCTC
SUPPLEMENTARY DATA. Supplementary Table 2. Antibodies used for Immunofluoresence. Supplementary Table 3. Real-time PCR primer sequences.
 Supplementary Table 2. Antibodies used for Immunofluoresence. Antibody Dilution Source Goat anti-pdx1 1:100 R&D Systems Rabbit anti-hnf6 1:100 Santa Cruz Biotechnology Mouse anti-nkx6.1 1:200 Developmental
Supplementary Figure 1. A. Bar graph representing the expression levels of the 19 indicated genes in the microarrays analyses comparing human lung
 Supplementary Figure 1. A. Bar graph representing the expression levels of the 19 indicated genes in the microarrays analyses comparing human lung immortalized broncho-epithelial cells (AALE cells) expressing
Supplementary Figure 1.
 Supplementary Figure 1. Increased β cell mass and islet diameter in βtsc2 -/- mice up to 35 weeks A: Reconstruction of multiple anti-insulin immunofluorescence images showing differences in β cell mass
Supplementary Information Supplementary Fig. 1. Elevated Usp9x in melanoma and NRAS mutant melanoma cells are dependent on NRAS for 3D growth.
 Supplementary Information Supplementary Fig. 1. Elevated Usp9x in melanoma and NRAS mutant melanoma cells are dependent on NRAS for 3D growth. a. Immunoblot for Usp9x protein in NRAS mutant melanoma cells
Loss of RhoA promotes skin tumor formation. Supplementary Figure 1. Loss of RhoA does not impair F-actin organization.
 Supplementary Figure Legends Supplementary Figure 1. Loss of RhoA does not impair F-actin organization. a. Representative IF images of F-actin staining of big and small control (left) and RhoA ko tumors
PKCζ Promotes Breast Cancer Invasion by Regulating Expression of E-cadherin and Zonula Occludens-1 (ZO-1) via NFκB-p65
 via NFκB-p65") SUPPLEMENTARY INFORMATION TITLE: PKCζ Promotes Breast Cancer Invasion by Regulating Expression of E-cadherin and Zonula Occludens-1 (ZO-1) via NFκB-p65 RUNNING TITLE: PKCζ-NFκB Signaling in Breast Cancer
SUPPLEMENTARY INFORMATION TITLE: PKCζ Promotes Breast Cancer Invasion by Regulating Expression of E-cadherin and Zonula Occludens-1 (ZO-1) via NFκB-p65 RUNNING TITLE: PKCζ-NFκB Signaling in Breast Cancer
Supplemental Figure 1. Western blot analysis indicated that MIF was detected in the fractions of
 Supplemental Figure Legends Supplemental Figure 1. Western blot analysis indicated that was detected in the fractions of plasma membrane and cytosol but not in nuclear fraction isolated from Pkd1 null
(a) Schematic diagram of the FS mutation of UVRAG in exon 8 containing the highly instable
 Schematic diagram of the FS mutation of UVRAG in exon 8 containing the highly instable") Supplementary Figure 1. Frameshift (FS) mutation in UVRAG. (a) Schematic diagram of the FS mutation of UVRAG in exon 8 containing the highly instable A 10 DNA repeat, generating a premature stop codon
Supplementary Figure 1. Frameshift (FS) mutation in UVRAG. (a) Schematic diagram of the FS mutation of UVRAG in exon 8 containing the highly instable A 10 DNA repeat, generating a premature stop codon
Real-time imaging reveals the single steps of brain metastasis fo mation r
 Real-time imaging reveals the single steps of brain metastasis fo mation r Yvonne Kienast, Louisa von Baumgarten, Martin Fuhrmann, Wolfgang E.F. Klinkert, Roland Goldbrunner, Jochen Herms and Frank Winkler
(A) Cells grown in monolayer were fixed and stained for surfactant protein-c (SPC,
 Cells grown in monolayer were fixed and stained for surfactant protein-c (SPC,") Supplemental Figure Legends Figure S1. Cell line characterization (A) Cells grown in monolayer were fixed and stained for surfactant protein-c (SPC, green) and co-stained with DAPI to visualize the nuclei.
Supplemental Figure Legends Figure S1. Cell line characterization (A) Cells grown in monolayer were fixed and stained for surfactant protein-c (SPC, green) and co-stained with DAPI to visualize the nuclei.
EPIGENETIC RE-EXPRESSION OF HIF-2α SUPPRESSES SOFT TISSUE SARCOMA GROWTH
 EPIGENETIC RE-EXPRESSION OF HIF-2α SUPPRESSES SOFT TISSUE SARCOMA GROWTH Supplementary Figure 1. Supplementary Figure 1. Characterization of KP and KPH2 autochthonous UPS tumors. a) Genotyping of KPH2
marker. DAPI labels nuclei. Flies were 20 days old. Scale bar is 5 µm. Ctrl is
 Supplementary Figure 1. (a) Nos is detected in glial cells in both control and GFAP R79H transgenic flies (arrows), but not in deletion mutant Nos Δ15 animals. Repo is a glial cell marker. DAPI labels
Nature Immunology: doi: /ni.3631
 Supplementary Figure 1 SPT analyses of Zap70 at the T cell plasma membrane. (a) Total internal reflection fluorescent (TIRF) excitation at 64-68 degrees limits single molecule detection to 100-150 nm above
Nature Methods: doi: /nmeth Supplementary Figure 1
 Supplementary Figure 1 Finite-element analysis of cell cluster dynamics in different cluster trap architectures. (a) Cluster-Chip (b) Filter (c) A structure identical to the Cluster-Chip except that one
Supplementary Figure 1: Neuregulin 1 increases the growth of mammary organoids compared to EGF. (a) Mammary epithelial cells were freshly isolated,
 Mammary epithelial cells were freshly isolated,") 1 2 3 4 5 6 7 8 9 10 Supplementary Figure 1: Neuregulin 1 increases the growth of mammary organoids compared to EGF. (a) Mammary epithelial cells were freshly isolated, embedded in matrigel and exposed
1 2 3 4 5 6 7 8 9 10 Supplementary Figure 1: Neuregulin 1 increases the growth of mammary organoids compared to EGF. (a) Mammary epithelial cells were freshly isolated, embedded in matrigel and exposed
Tumor suppressor Spred2 interaction with LC3 promotes autophagosome maturation and induces autophagy-dependent cell death
 www.impactjournals.com/oncotarget/ Oncotarget, Supplementary Materials 2016 Tumor suppressor Spred2 interaction with LC3 promotes autophagosome maturation and induces autophagy-dependent cell death Supplementary
Supplementary Figure 1
 Supplementary Figure 1 The average sigmoid parametric curves of capillary dilation time courses and average time to 50% peak capillary diameter dilation computed from individual capillary responses averaged
Postn MCM Smad2 fl/fl Postn MCM Smad3 fl/fl Postn MCM Smad2/3 fl/fl. Postn MCM. Tgfbr1/2 fl/fl TAC
 A Smad2 fl/fl Smad3 fl/fl Smad2/3 fl/fl Tgfbr1/2 fl/fl 1. mm B Tcf21 MCM Tcf21 MCM Smad3 fl/fl Tcf21 MCM Smad2/3 fl/fl Tcf21 MCM Tgfbr1/2 fl/fl αmhc MCM C 1. mm 1. mm D Smad2 fl/fl Smad3 fl/fl Smad2/3
A263 A352 A204. Pan CK. pstat STAT3 pstat3 STAT3 pstat3. Columns Columns 1-6 Positive control. Omentum. Rectosigmoid A195.
 pstat3 75 Pan CK A A263 A352 A24 B Columns 1-6 Positive control A195 A22 A24 A183 Rectal Nodule STAT3 pstat3 STAT3 pstat3 Columns 7-12 Omentum Rectosigmoid Left Ovary Right Ovary Omentum Uterus Uterus
SUPPLEMENTARY FIGURES
 SUPPLEMENTARY FIGURES 1 Supplementary Figure 1, Adult hippocampal QNPs and TAPs uniformly express REST a-b) Confocal images of adult hippocampal mouse sections showing GFAP (green), Sox2 (red), and REST
Supplemental Figure 1
 Supplemental Figure 1 A S100A4: SFLGKRTDEAAFQKLMSNLDSNRDNEVDFQEYCVFLSCIAMMCNEFFEGFPDK Overlap: SF G DE KLM LD N D VDFQEY VFL I M N FF G PD S100A2: SFVGEKVDEEGLKKLMGSLDENSDQQVDFQEYAVFLALITVMCNDFFQGCPDR
Boucher et al NCOMMS B
 1 Supplementary Figure 1 (linked to Figure 1). mvegfr1 constitutively internalizes in endothelial cells. (a) Immunoblot of mflt1 from undifferentiated mouse embryonic stem (ES) cells with indicated genotypes;
Supplemental Material
 Supplemental Material Supplementary Fig. 1. EETs stimulate primary tumor growth. a) Schematic presentation of genetic and pharmacological tools used to manipulate endogenous EET levels. b) Endothelial
Programmed necrosis, not apoptosis, is a key mediator of cell loss and DAMP-mediated inflammation in dsrna-induced retinal degeneration
 Programmed necrosis, not apoptosis, is a key mediator of cell loss and DAMP-mediated inflammation in dsrna-induced retinal degeneration The Harvard community has made this article openly available. Please
LPS CD40 + IL-4. Vorinostat (24 Hours) Vorinostat (24 Hours) Panobinostat (24 Hours) Panobinostat (24 Hours) Romidepsin (48 Hours)
 Vorinostat (24 Hours) Panobinostat (24 Hours) Panobinostat (24 Hours) Romidepsin (48 Hours)") A) CD + IL- B) LPS ( Hours) ( Hours) Cell number (x1-3 ) 1 1 3.7 M 1. M. M.1 M Cell number (x1 - ) 1 1 3. M 1. M.7 M.38 M Cell number (x1-3 ) Cell number (x1-3 ) 3 1 1 1 ( Hours) 7.nM.nM 1.7nM.nM Romidepsin
A) CD + IL- B) LPS ( Hours) ( Hours) Cell number (x1-3 ) 1 1 3.7 M 1. M. M.1 M Cell number (x1 - ) 1 1 3. M 1. M.7 M.38 M Cell number (x1-3 ) Cell number (x1-3 ) 3 1 1 1 ( Hours) 7.nM.nM 1.7nM.nM Romidepsin
Supplementary Figure 1
 Supplementary Figure 1 Supplementary Figure 1. Neither the activation nor suppression of the MAPK pathway affects the ASK1/Vif interaction. (a, b) HEK293 cells were cotransfected with plasmids encoding
Supplemental Information. Induction of Expansion and Folding. in Human Cerebral Organoids
 Cell Stem Cell, Volume 20 Supplemental Information Induction of Expansion and Folding in Human Cerebral Organoids Yun Li, Julien Muffat, Attya Omer, Irene Bosch, Madeline A. Lancaster, Mriganka Sur, Lee
Supplementary Table 1. List of primers used in this study
 Supplementary Table 1. List of primers used in this study Gene Forward primer Reverse primer Rat Met 5 -aggtcgcttcatgcaggt-3 5 -tccggagacacaggatgg-3 Rat Runx1 5 -cctccttgaaccactccact-3 5 -ctggatctgcctggcatc-3
Supplementary Information
 Supplementary Information Title Degeneration and impaired regeneration of gray matter oligodendrocytes in amyotrophic lateral sclerosis Authors Shin H. Kang, Ying Li, Masahiro Fukaya, Ileana Lorenzini,
Fig 1 CD163. CD11b S100A9. Sirius Red. 100μm ** ** CD163. CD11b S100A9 ** Sirius Red (PL) Sirius Red SUM Mo.
 Sirius Red SUM Mo.") T47D T47D + o SU-59 Fig SU-59 + o IHC score (-3) IHC score (-2) CD63 3 2 IHC score (-3) CD63 3 ** 2 CDb CDb * * SA9 SA9 ** * 2 IHC score (-4) αsa αsa 4 ** ** 2 Sirius Red μm IHC score (%) Sirius Red 8
T47D T47D + o SU-59 Fig SU-59 + o IHC score (-3) IHC score (-2) CD63 3 2 IHC score (-3) CD63 3 ** 2 CDb CDb * * SA9 SA9 ** * 2 IHC score (-4) αsa αsa 4 ** ** 2 Sirius Red μm IHC score (%) Sirius Red 8
Figure S1: Effects on haptotaxis are independent of effects on cell velocity A)
") Supplemental Figures Figure S1: Effects on haptotaxis are independent of effects on cell velocity A) Velocity of MV D7 fibroblasts expressing different GFP-tagged Ena/VASP family proteins in the haptotaxis
Supplemental Figures Figure S1: Effects on haptotaxis are independent of effects on cell velocity A) Velocity of MV D7 fibroblasts expressing different GFP-tagged Ena/VASP family proteins in the haptotaxis
a b c periosteum parietal bone bone marrow dura periosteum suture mesenchyme osteogenic front suture mesenchyme 1
 coronary suture sagittal suture DOI: 10.1038/ncb3139 a b c e parietal bone suture mesenchyme parietal bone bone marrow ura ura ura f parietal bone ura suture mesenchyme bone g ura osteogenic front suture
Supplemental Figure 1. Intracranial transduction of a modified ptomo lentiviral vector in the mouse
 Supplemental figure legends Supplemental Figure 1. Intracranial transduction of a modified ptomo lentiviral vector in the mouse hippocampus targets GFAP-positive but not NeuN-positive cells. (A) Stereotaxic
Alternatively Activated Macrophages Determine the Repair of the Infarcted
 Alternatively Activated Macrophages Determine the Repair of the Infarcted Adult Murine Heart (Shiraishi et al.) List of Supplemental Materials Supplemental Methods Supplemental Figure 1. Cardiac CD206
Supplementary Materials. for Garmy-Susini, et al, Integrin 4 1 signaling is required for lymphangiogenesis and tumor metastasis
 Supplementary Materials for Garmy-Susini, et al, Integrin 4 1 signaling is required for lymphangiogenesis and tumor metastasis 1 Supplementary Figure Legends Supplementary Figure 1: Integrin expression
Endocannabinoid-activated Nlrp3 inflammasome in infiltrating macrophages mediates β- cell loss in type 2 diabetes
 Endocannabinoid-activated Nlrp3 inflammasome in infiltrating macrophages mediates β- cell loss in type 2 diabetes T Jourdan, G Godlewski, R Cinar, A Bertola, G Szanda, J Liu, J Tam, T Han, B Mukhopadhyay,
Supplementary Figure 1 ITGB1 and ITGA11 increase with evidence for heterodimers following HSC activation. (a) Time course of rat HSC activation
 Time course of rat HSC activation") Supplementary Figure 1 ITGB1 and ITGA11 increase with evidence for heterodimers following HSC activation. (a) Time course of rat HSC activation indicated by the detection of -SMA and COL1 (log scale).
Supplementary Figure 1 ITGB1 and ITGA11 increase with evidence for heterodimers following HSC activation. (a) Time course of rat HSC activation indicated by the detection of -SMA and COL1 (log scale).
SUPPORTING INFORMATIONS
 SUPPORTING INFORMATIONS Mice MT/ret RetCD3ε KO α-cd25 treated MT/ret Age 1 month 3 mnths 6 months 1 month 3 months 6 months 1 month 3 months 6 months 2/87 Survival 87/87 incidence of 17/87 1 ary tumor
Supplementary Figure 1.TRIM33 binds β-catenin in the nucleus. a & b, Co-IP of endogenous TRIM33 with β-catenin in HT-29 cells (a) and HEK 293T cells
 and HEK 293T cells") Supplementary Figure 1.TRIM33 binds β-catenin in the nucleus. a & b, Co-IP of endogenous TRIM33 with β-catenin in HT-29 cells (a) and HEK 293T cells (b). TRIM33 was immunoprecipitated, and the amount of
Supplementary Figure 1.TRIM33 binds β-catenin in the nucleus. a & b, Co-IP of endogenous TRIM33 with β-catenin in HT-29 cells (a) and HEK 293T cells (b). TRIM33 was immunoprecipitated, and the amount of
Supplementary Figures
 Supplementary Figures Supplementary Figure 1 DOT1L regulates the expression of epithelial and mesenchymal markers. (a) The expression levels and cellular localizations of EMT markers were confirmed by
Supplementary Table 1. Antibodies and dilutions used in the immunohistochemical study
 Supplementary Table 1. Antibodies and dilutions used in the immunohistochemical study Antigen Species Clone Source Dilution Insulin Guinea pig - Dako, Carpinteria, 1:200 Glucagon Rabbit - Dako, Carpinteria,
SOPten flox/flox (KO) Pten flox/flox (WT) flox allele 6.0 kb. Pten. Actin. ! allele 2.3 kb. Supplementary Figure S1. Yanagi, et al.
 Pten flox/flox (WT) flox allele 6.0 kb. Pten. Actin. ! allele 2.3 kb. Supplementary Figure S1. Yanagi, et al.") s1 A Pten flox/flox () SOPten flox/flox () flox allele 6. kb B Pten flox/flox () SOPten flox/flox () Pten Actin! allele 2.3 kb Supplementary Figure S1. Yanagi, et al. A B BrdU BrdU positive cells ( ) 3
s1 A Pten flox/flox () SOPten flox/flox () flox allele 6. kb B Pten flox/flox () SOPten flox/flox () Pten Actin! allele 2.3 kb Supplementary Figure S1. Yanagi, et al. A B BrdU BrdU positive cells ( ) 3
Supplementary Figures
 Supplementary Figures Supplementary Fig. 1. Galectin-3 is present within tumors. (A) mrna expression levels of Lgals3 (galectin-3) and Lgals8 (galectin-8) in the four classes of cell lines as determined
Nature Immunology: doi: /ni eee Supplementary Figure 1
 eee Supplementary Figure 1 Hyphae induce NET release, but yeast do not. (a) NET release by human peripheral neutrophils stimulated with a hgc1 yeast-locked C. albicans mutant (yeast) or pre-formed WT C.
Nature Medicine doi: /nm.3957
 Supplementary Fig. 1. p38 alternative activation, IL-21 expression, and T helper cell transcription factors in PDAC tissue. (a) Tissue microarrays of pancreatic tissue from 192 patients with pancreatic
Supplemental Table S1
 Supplemental Table S. Tumorigenicity and metastatic potential of 44SQ cell subpopulations a Tumorigenicity b Average tumor volume (mm ) c Lung metastasis d CD high /4 8. 8/ CD low /4 6./ a Mice were injected
F-actin VWF Vinculin. F-actin. Vinculin VWF
 a F-actin VWF Vinculin b F-actin VWF Vinculin Supplementary Fig. 1. WPBs in HUVECs are located along stress fibers and at focal adhesions. (a) Immunofluorescence images of f-actin (cyan), VWF (yellow),
SUPPLEMENTARY FIGURES
 SUPPLEMENTARY FIGURES Supplementary Figure S1: Fibroblast-induced elongation of cancer cells requires direct contact with living fibroblasts. A. Representative images of HT29-GFP cultured in the presence
Supplementary Figure S1 Expression of mir-181b in EOC (A) Kaplan-Meier
 Kaplan-Meier") Supplementary Figure S1 Expression of mir-181b in EOC (A) Kaplan-Meier curves for progression-free survival (PFS) and overall survival (OS) in a cohort of patients (N=52) with stage III primary ovarian
Supplementary Figure S1 Expression of mir-181b in EOC (A) Kaplan-Meier curves for progression-free survival (PFS) and overall survival (OS) in a cohort of patients (N=52) with stage III primary ovarian
Supplementary Figure 1
 CD31 FN Supplementary Figure 1 a Multivariate Cox regression analysis of predicting factors for disease-free and overall survival in 435 HNSCC patients b FN staining in whole sections of HNSCC c FN expression
Supplementary Figure 1. EC-specific Deletion of Snail1 Does Not Affect EC Apoptosis. (a,b) Cryo-sections of WT (a) and Snail1 LOF (b) embryos at
 Cryo-sections of WT (a) and Snail1 LOF (b) embryos at") Supplementary Figure 1. EC-specific Deletion of Snail1 Does Not Affect EC Apoptosis. (a,b) Cryo-sections of WT (a) and Snail1 LOF (b) embryos at E10.5 were double-stained for TUNEL (red) and PECAM-1 (green).
Supplementary Figure 1. EC-specific Deletion of Snail1 Does Not Affect EC Apoptosis. (a,b) Cryo-sections of WT (a) and Snail1 LOF (b) embryos at E10.5 were double-stained for TUNEL (red) and PECAM-1 (green).
AP VP DLP H&E. p-akt DLP
 A B AP VP DLP H&E AP AP VP DLP p-akt wild-type prostate PTEN-null prostate Supplementary Fig. 1. Targeted deletion of PTEN in prostate epithelium resulted in HG-PIN in all three lobes. (A) The anatomy
Supplementary Figures
 Supplementary Figures Supplementary Figure 1 Correlation between LKB1 and YAP expression in human lung cancer samples. (a) Representative photos showing LKB1 and YAP immunohistochemical staining in human
PHENOTYPIC DYNAMICS OF MICROGLIAL AND MONOCYTE-DERIVED CELLS IN GLIOBLASTOMA-BEARING MICE.
 SUPPLEMENTARY FIGURES, TABLES AND VIDEOS PHENOTYPIC DYNAMICS OF MICROGLIAL AND MONOCYTE-DERIVED CELLS IN GLIOBLASTOMA-BEARING MICE. Clément Ricard 1,2,3,4, Aurélie Tchoghandjian 2,4, Hervé Luche 5, Pierre
Canberra, Australia). CD11c-DTR-OVA-GFP (B6.CD11c-OVA), B6.luc + and. Cancer Research Center, Germany). B6 or BALB/c.FoxP3-DTR-GFP mice were
. CD11c-DTR-OVA-GFP (B6.CD11c-OVA), B6.luc + and. Cancer Research Center, Germany). B6 or BALB/c.FoxP3-DTR-GFP mice were") Supplemental Materials and Methods Mice Female C57BL/6 (B6, I-E null, H-2 b ), BALB/c (H-2 d ) + ), FVB/N (H-2 q, I-E null, CD45.1 + ), and B6D2F1 (H-2 b/d ) mice were purchased from the Animal Resources
Supplemental Materials and Methods Mice Female C57BL/6 (B6, I-E null, H-2 b ), BALB/c (H-2 d ) + ), FVB/N (H-2 q, I-E null, CD45.1 + ), and B6D2F1 (H-2 b/d ) mice were purchased from the Animal Resources
Nature Biotechnology: doi: /nbt Supplementary Figure 1
 Supplementary Figure 1 Overview of the transplant procedure and supplementary data to Figure 1. a. Under isofluorane anesthesia, the lumen of the colon is washed by a gentle PBS enema. b. Using a p200
a 10 4 Link et al. Supplementary Figure 1 Nature Immunology: doi: /ni.1842 Cells per mouse ( 10 5 ) TRPV2KO anti-gr1 anti-gr anti-f4/80
 TRPV2KO anti-gr1 anti-gr anti-f4/80") a 10 4 WT 10 4 TRPV2KO 10 3 10 3 anti-gr1 10 2 10 1 anti-gr1 10 2 10 1 10 0 10 0 10 1 10 2 10 3 10 4 anti-f4/80 42.3 45.2 10 0 10 0 10 1 10 2 10 3 10 4 anti-f4/80 10 4 10 4 40 42.5 anti-cd11b 10 3 10 2
a 10 4 WT 10 4 TRPV2KO 10 3 10 3 anti-gr1 10 2 10 1 anti-gr1 10 2 10 1 10 0 10 0 10 1 10 2 10 3 10 4 anti-f4/80 42.3 45.2 10 0 10 0 10 1 10 2 10 3 10 4 anti-f4/80 10 4 10 4 40 42.5 anti-cd11b 10 3 10 2
Supplementary Figure 1. Nature Neuroscience: doi: /nn.4547
 Supplementary Figure 1 Characterization of the Microfetti mouse model. (a) Gating strategy for 8-color flow analysis of peripheral Ly-6C + monocytes from Microfetti mice 5-7 days after TAM treatment. Living
Supplementary Information
 Supplementary Information Figure S1: Follicular melanocytes in the wound peripheral area migrate to the epidermis in response to wounding stimuli. Dorsal skin of Trp2-LacZ mice stained with X-gal and analyzed
Supplementary Table 1
 Supplementary Table 1 Flow Cytometry Antibodies Antibody Fluorochrome Clone Vendor CD45 PE-cyanine 7 30-F11 D ioscience CD3 Pacific lue 17A2 iolegend (San Diego, CA) CD11b APC M1/70 iolegend (San Diego,
Evaluation of directed and random motility in microslides Assessment of leukocyte adhesion in flow chambers
 Evaluation of directed and random motility in microslides Motility experiments in IBIDI microslides, image acquisition and processing were performed as described. PMN, which ended up in an angle < 180
Supplemental Figure S1. RANK expression on human lung cancer cells.
 Supplemental Figure S1. RANK expression on human lung cancer cells. (A) Incidence and H-Scores of RANK expression determined from IHC in the indicated primary lung cancer subgroups. The overall expression
Supplementary Figure 1. Validation of astrocytes. Primary astrocytes were
 Supplementary Figure 1. Validation of astrocytes. Primary astrocytes were separated from the glial cultures using a mild trypsinization protocol. Anti-glial fibrillary acidic protein (GFAP) immunofluorescent
Supplementary Materials for
 www.sciencesignaling.org/cgi/content/full/8/385/ra70/dc1 Supplementary Materials for The interaction of heparan sulfate proteoglycans with endothelial transglutaminase-2 limits VEGF 165 -induced angiogenesis
Supplementary Figure 1. Satellite cell contribution to myofibers in whole. gastrocnemius/plantaris/soleus, diaphragm, and EOM of 12 or 20 month
 Keefe et al. p. 1 Supplementary Figure 1. Satellite cell contribution to myofibers in whole muscles. (a-l) Representative cross-sections through whole TA/EDL, gastrocnemius/plantaris/soleus, diaphragm,
Multiple mechanisms underlying acquired resistance to taxanes in selected docetaxelresistant MCF-7 breast cancer cells
 Wang et al. BMC Cancer 2014, 14:37 RESEARCH ARTICLE Multiple mechanisms underlying acquired resistance to taxanes in selected docetaxelresistant MCF-7 breast cancer cells Harris Wang 1, The Vo 1, Ali Hajar
MATERIALS AND METHODS. Neutralizing antibodies specific to mouse Dll1, Dll4, J1 and J2 were prepared as described. 1,2 All
 MATERIALS AND METHODS Antibodies (Abs), flow cytometry analysis and cell lines Neutralizing antibodies specific to mouse Dll1, Dll4, J1 and J2 were prepared as described. 1,2 All other antibodies used
* * * * Supplementary Figure 1. DS Lv CK HSA CK HSA. CK Col-3. CK Col-3. See overleaf for figure legend. Cancer cells
 Supplementary Figure 1 Cancer cells Desmoplastic stroma Hepatocytes Pre-existing sinusoidal blood vessel New blood vessel a Normal liver b Desmoplastic HGP c Pushing HGP d Replacement HGP e f g h i DS
SUPPLEMENTARY FIG. S2. Representative counting fields used in quantification of the in vitro neural differentiation of pattern of dnscs.
 Supplementary Data SUPPLEMENTARY FIG. S1. Representative counting fields used in quantification of the in vitro neural differentiation of pattern of anpcs. A panel of lineage-specific markers were used
Supplemental Information. Tissue-Resident Macrophages in Pancreatic. Ductal Adenocarcinoma Originate from Embryonic
 Immunity, Volume 7 Supplemental Information Tissue-Resident Macrophages in Pancreatic Ductal Adenocarcinoma Originate from Embryonic Hematopoiesis and Promote Tumor Progression Yu Zhu, John M. Herndon,
Supplemental Figures:
 Supplemental Figures: Figure 1: Intracellular distribution of VWF by electron microscopy in human endothelial cells. a) Immunogold labeling of LC3 demonstrating an LC3-positive autophagosome (white arrow)
Blocking antibodies and peptides. Rat anti-mouse PD-1 (29F.1A12, rat IgG2a, k), PD-
, PD-") Supplementary Methods Blocking antibodies and peptides. Rat anti-mouse PD-1 (29F.1A12, rat IgG2a, k), PD- L1 (10F.9G2, rat IgG2b, k), and PD-L2 (3.2, mouse IgG1) have been described (24). Anti-CTLA-4 (clone
Supplementary Methods Blocking antibodies and peptides. Rat anti-mouse PD-1 (29F.1A12, rat IgG2a, k), PD- L1 (10F.9G2, rat IgG2b, k), and PD-L2 (3.2, mouse IgG1) have been described (24). Anti-CTLA-4 (clone
Nature Medicine: doi: /nm.4078
 Supplementary Figure 1. Cetuximab induces ER stress response in DiFi cells. (a) Scheme of SILAC proteome. (b) MS-base read out of SILAC experiment. The histogram of log 2 -transformed normalized H/L ratios
Supplemental Table 1. Primers used for RT-PCR analysis of inflammatory cytokines Gene Primer Sequence
 Supplemental Table 1. Primers used for RT-PCR analysis of inflammatory cytokines Gene Primer Sequence IL-1α Forward primer 5 -CAAGATGGCCAAAGTTCGTGAC-3' Reverse primer 5 -GTCTCATGAAGTGAGCCATAGC-3 IL-1β
SSM signature genes are highly expressed in residual scar tissues after preoperative radiotherapy of rectal cancer.
 Supplementary Figure 1 SSM signature genes are highly expressed in residual scar tissues after preoperative radiotherapy of rectal cancer. Scatter plots comparing expression profiles of matched pretreatment
Supplementary Figure 1: STAT3 suppresses Kras-induced lung tumorigenesis
 Supplementary Figure 1: STAT3 suppresses Kras-induced lung tumorigenesis (a) Immunohistochemical (IHC) analysis of tyrosine 705 phosphorylation status of STAT3 (P- STAT3) in tumors and stroma (all-time
Supplementary Figure 1: Fn14 is upregulated in the epidermis and dermis of mice
 Supplementary Figure 1: Fn14 is upregulated in the epidermis and dermis of mice undergoing AD- and psoriasis-like disease. Immunofluorescence staining for Fn14 (green) and DAPI (blue) in skin of naïve
Supplementary Figure S1. PTPN2 levels are not altered in proliferating CD8+ T cells. Lymph node (LN) CD8+ T cells from C57BL/6 mice were stained with
 CD8+ T cells from C57BL/6 mice were stained with") Supplementary Figure S1. PTPN2 levels are not altered in proliferating CD8+ T cells. Lymph node (LN) CD8+ T cells from C57BL/6 mice were stained with CFSE and stimulated with plate-bound α-cd3ε (10µg/ml)
Supplementary Figure S1. PTPN2 levels are not altered in proliferating CD8+ T cells. Lymph node (LN) CD8+ T cells from C57BL/6 mice were stained with CFSE and stimulated with plate-bound α-cd3ε (10µg/ml)
(A) PCR primers (arrows) designed to distinguish wild type (P1+P2), targeted (P1+P2) and excised (P1+P3)14-
 PCR primers (arrows) designed to distinguish wild type (P1+P2), targeted (P1+P2) and excised (P1+P3)14-") 1 Supplemental Figure Legends Figure S1. Mammary tumors of ErbB2 KI mice with 14-3-3σ ablation have elevated ErbB2 transcript levels and cell proliferation (A) PCR primers (arrows) designed to distinguish
1 Supplemental Figure Legends Figure S1. Mammary tumors of ErbB2 KI mice with 14-3-3σ ablation have elevated ErbB2 transcript levels and cell proliferation (A) PCR primers (arrows) designed to distinguish