The Electrocardiography of Myocardial Infarction and Ischemia
|
|
|
- Louisa Hensley
- 5 years ago
- Views:
Transcription
1 The Electrocardiography of Myocardial Infarction and Ischemia Pai-Feng Kao MD Cardiology division Taipei Medical University-Wan Fang Hospital Date:

2 Schema of the ischemic cascade

3 Acute Myocardial Infarction

4
5 The 12-Leads The 12-leads include: 3 Limb leads (I, II, III) 3 Augmented leads (avr, avl, avf) 6 Precordial leads (V 1 - V 6 )

6 Electrocardiogram (ECG) Composite of all action potentials of nodal and myocardial cells detected, amplified and recorded by electrodes on arms, legs and chest

7
8
9
10

11
12
13
14
15 Significance of ECG waveforms P-wave: signature of atrial excitation QRS-complex: signature of ventricular excitation T-wave: signature of ventricular repolarization Atrial repolarization is buried in QRS-complex and thus not detectable

16

17

18

19

20

21

22
23
24
 myocardial injury 也可分為 1. subendocardial injury 2.")
25 myocardial ischemia 可分為 1. subendocardial ischemia 2. subepicardial ischemia (=transmural ischemia) myocardial injury 也可分為 1. subendocardial injury 2. subepicardial injury (=transmural injury)
26 Myocardial ischemia and ST-T changes 正常狀況下, 心室去極化是由 endocardium 到 epicardium, 再極化剛好相反, 由 epi 到 endocardium, 但再極化跟去極化電性相反, 所以心室去極化跟再極化的電氣方向 (polarity) 大致相同 ( 所以 QRS 方向跟 T 的方向大多相近 ) 但 ischemia 時, Na-K pump 失去活性 (reduced ATP production), 所以再極化的速度減慢, 或根本形成 partial depolarization status, 於是 ST segment and/or T wave 會有變化
27 其心電圖特徵為 : Subendocardial ischemia: prolonged QT interval or increased amplitude of the T wave or both Subepicardial or transmural ischemia: inversion of the T waves Subendocardial injury: ST segment depression Subepicardial or transmural injury: ST segment elevation

28

29
30 Two cause of ST segment deviation during myocardial ischemia Shortening and decreased amplitude of the action potential Depolarization (i.e. a less negative resting membrane potential) ----Potential differences ----Systolic current of injury
31 Depolarization creates potential differences, resulting in a diastolic current of injury
32
33

34

35
36 Ischemia 時為何 T wave 會 inversion (I) 正常狀況下, 心室去極化是由 endocardium 到 epicardium, 再極化剛好相反, 由 epi 到 endocardium, 但再極化跟去極化電性相反, 所以心室去極化跟再極化的電氣方向 (polarity) 大致相同 ( 所以 QRS 方向跟 T 的方向大多相近 ) Ischemia 時, Na-K pump 失去活性 (reduced ATP production), 所以再極化的速度減慢, 或根本形成 partial depolarization status, 於是 ST segment and/or T wave 會有變化
37 Ischemia 時為何 T wave 會 inversion (II) Recovery is more delayed in the subepicardial layers, and the subendocardial muscle fibers seem to recover first----transmural 或是 subepicardial ischemia 時為何 T wave 會 inversion

38

39
40 Electrocardiography of Myocardial Ischemia

41 T wave changes associated with ischaemia

42 Tall T waves in leads V2 and V3 in patient with recent inferoposterior myocardial infarction, indicating posterior ischaemia Copyright 2002 BMJ Publishing Group Ltd. Channer, K. et al. BMJ 2002;324:

43 Tall T waves in myocardial ischaemia

44 Arrowhead T wave inversion in patient with unstable angina

45 Biphasic T waves in man aged 26 with unstable angina
 ST segment depression (C); and downsloping ST segment depression")
46 ST changes with ischaemia showing normal wave form (A); flattening of ST segment (B), making T wave more obvious; horizontal (planar) ST segment depression (C); and downsloping ST segment depression (D)
 and when in pain")
47 Subtle ST segment change in patient with ischaemic chest pain: when no pain is present (top) and when in pain (bottom)

48 Substantial ST segment depression in patient with ischaemic chest pain

49 Widespread ST segment depression in patient with unstable angina
 and in patient with left ventricular hypertrophy")
50 Non-ischaemic ST segment changes: in patient taking digoxin (top) and in patient with left ventricular hypertrophy (bottom)

51 Different Kinds of ST-T Changes

52 Normalisation of longstanding inverted T waves in patient with chest pain

53 Reversible ST segment changes in patient with chest pain; the ST segment elevation returns to normal as the chest pain settles

54 R on T, giving rise to ventricular fibrillation

55 Acute myocardial infarction with complete heart block
56 Electrocardiography of Myocardial Infarction
57 Acute injury pattern Abnormal ST levation in 2 or more adjacent leads (except lead avr) The term derived from an injury current flowing between an injred (i.e. depolarized ) tissue and a normally polarized tissue. Most common cause of injury current and the corresponding injury pattern Acute myocardial ischemia (During thrombotic, embolic, or spastic coronary occlusion
58 Transient injury current producing a similar ECG injury pattern may result from pressure exerted by pericardial fluid during acute pericarditis
59 Long lasting or permanent under various circumstances Myocardial dyskinesis or ventricular aneurysm Pressure exerted by fibrin or calcification during chronic pericarditis Pressure exerted by a cardiac tumor Variant pattern in a normal heart with excessive asynchrony of early repolarization
60 Pericarditis The presence of effusion Injury of the superficial myocardium by pressure of fluid or fibrin Superficial myocarditis
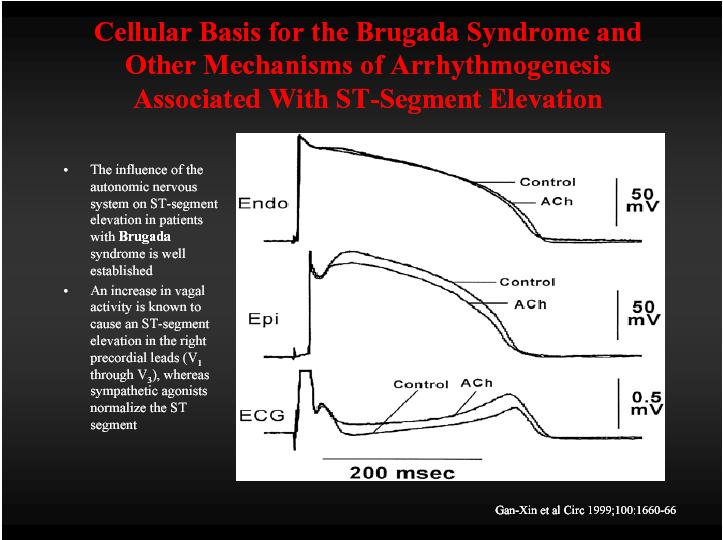
61 Action potentials in a model cardiac cell simulating Brugada syndrome and conduction disease.

62
63

64 Diagnostic Criteria of AMI by ECG 1. ST elevation > 1.0 mm 2 adjacent limb leads V4-V6 2. ST elevation > 2.0 mm V1-V3
65 One way to diagnose an acute MI is to look for elevation of the ST segment. ST Elevation

66 Elevation of the ST segment (greater than 1 small box) in 2 leads is consistent with a myocardial infarction. ST Elevation (cont)

67 Sequence of changes seen during evolution of myocardial infarction Morris, F. et al. BMJ 2002;324: Copyright 2002 BMJ Publishing Group Ltd.
68 Myocardial Infarction 1. Evolution * Hyperacute: Tall, peaked T- wave * Injury: ST elevation * Necrosis: Pathologic Q - wave (Q 0.04 sec and 25% R) * Ischemia: T inversion

69 Hyperacute T waves Morris, F. et al. BMJ 2002;324: Copyright 2002 BMJ Publishing Group Ltd.

70 Sometimes the QRS complex, the ST segment, and the T wave fuse to form a single monophasic deflection, called a giant R wave or tombstone Morris, F. et al. BMJ 2002;324: Copyright 2002 BMJ Publishing Group Ltd.


71 Pathological Q waves in inferior and anterior leads
 Morris, F. et al.")
72 Long standing ST segment elevation and T wave inversion associated with a previous anterior myocardial infarction (echocardiography showed a left ventricular aneurysm) Morris, F. et al. BMJ 2002;324: Copyright 2002 BMJ Publishing Group Ltd.

73 An inferolateral myocardial infarction with reciprocal changes in leads I, avl, V1, and V2 Morris, F. et al. BMJ 2002;324: Copyright 2002 BMJ Publishing Group Ltd.
74 Reciprocal changes: presence of widespread ST segment depression in the anterolateral leads strongly suggests that the subtle inferior ST segment elevation is due to acute infarction Morris, F. et al. BMJ 2002;324: Copyright 2002 BMJ Publishing Group Ltd.

75 Coronary Vessels Anterior ---LAC RPM---

76 Coronary Vessels Posterior ---LAC RPM---
77 Left coronary artery Coronary Circulation 1. anterior interventricular artery supplies interventricular septum + anterior walls of ventricles 2. circumflex artery passes around left side of heart in coronary sulcus, supplies left atrium and posterior wall of left ventricle Right coronary artery 1. posterior interventricular artery supplies posterior walls of ventricles 2. marginal artery supplies lateral R atrium + ventricle Remember: a heart that doesn t work will- LAC RPM Cornory arteries- Left Anterior Interventricular, circumflex and Posterior Interventricular and marginal Right
78 Location Anatomical relationship of leads Inferior wall Leads II, III, and avf Anterior wall Leads V1 to V4 Lateral wall Leads I, avl, V5, and V6 Nonstandard leads Right ventricle Right sided chest leads V1R to V6R Posterior wall Leads V7 to V9
79 Views of the Heart Some leads get a good view of the: Lateral portion of the heart Anterior portion of the heart Inferior portion of the heart
80 Salient Features of Acute Myocardial Infarction 1. Indicative changes (Q, ST elevation) in leads 2. Reciprocal changes in leads 3. Progressive changes in pattern from day to day
81 Anterior View of the Heart The anterior portion of the heart is best viewed using leads V 1 - V 4.
82 Other MI Locations First, take a look again at this picture of the heart. Lateral portion of the heart Anterior portion of the heart Inferior portion of the heart
83 Other MI Locations Second, remember that the 12-leads of the ECG look at different portions of the heart. The limb and augmented leads see electrical activity moving inferiorly (II, III and avf), to the left (I, avl) and to the right (avr). Whereas, the precordial leads see electrical activity in the posterior to anterior direction. Limb Leads Augmented Leads Precordial Leads
84 Other MI Locations Now, using these 3 diagrams let s figure where to look for a lateral wall and inferior wall MI. Limb Leads Augmented Leads Precordial Leads
85 Anterior MI Remember the anterior portion of the heart is best viewed using leads V 1 - V 4. Limb Leads Augmented Leads Precordial Leads

86 Acute anteroseptal wall MI

87 Acute anterior wall MI

88 Acute anterior wall MI
89 Lateral MI So what leads do you think the lateral portion of the heart is best viewed? Leads I, avl, and V 5 - V 6 Limb Leads Augmented Leads Precordial Leads
 and the lateral wall (V 5 -V 6, I, and avl)!")
90 Anterolateral MI This person s MI involves both the anterior wall (V 2 -V 4 ) and the lateral wall (V 5 -V 6, I, and avl)!
91 Inferior MI Now how about the inferior portion of the heart? Leads II, III and avf Limb Leads Augmented Leads Precordial Leads

92 Acute inferior wall MI

93 Acute inferior and septal wall MI
94 Acute inferior wall MI with RV infarct

95 Copyright 2002 BMJ Publishing Group Ltd. Morris, F. et al. BMJ 2002;324:
96 Posterior AMI a. V1 & V2 - tall R wave - tall & wide T-wave - ST depression b. ± inferior changes of AMI c. absence of other cause for V1R
 Morris, F. et al.")
97 Isolated posterior infarction with no associated inferior changes (note ST segment depression in leads V1 to V3) Morris, F. et al. BMJ 2002;324: Copyright 2002 BMJ Publishing Group Ltd.

98 Position of V7, V8, and V9 on posterior chest wall Morris, F. et al. BMJ 2002;324: Copyright 2002 BMJ Publishing Group Ltd.

99 ST segment elevation in posterior chest leads V8 and V9 Morris, F. et al. BMJ 2002;324: Copyright 2002 BMJ Publishing Group Ltd.
100 RV Infarction NB: ST elevation > 1mm in any of V4-6R ~ 90% specific in the presence of inferior AMI

101 Placement of right sided chest leads

102 Acute inferior myocardial infarction with associated right ventricular infarction Morris, F. et al. BMJ 2002;324: Copyright 2002 BMJ Publishing Group Ltd.
103 Acute inferior wall MI with RV infarct
104 AMI & LBBB Data from the GUSTO I trial factors independently predictive of AMI with LBBB, 1. ST elevation concordant with QRS > 1 mm 5 pts 2. ST depression in V1-2-3 > 1 mm 3 pts 3. ST elevation discordant with QRS > 5 mm 2 pts

105 Left bundle branch block

106

107 Inferior MI + RBBB (note Q's in II, III, avf and rsr' in lead V1)

108 Anteroseptal MI with RBBB (note Q's in leads V1- V3, terminal R wave in V1, fat S wave in V6)

109 Timetable of ECG Change In AMI

110
111 Secondary ST-T change WPW syndrome Hypertrophic cardiomyopathy Left Ventricular Hypertrophy Right Ventricular Hypertrophy Complete or incomplete LBBB
112 Secondary ST-T change Pneumothorax Pulmonary emphysema and cor pulmonale Left anterior fascicular block Acute pericarditis Central nervous system disease
113 Factors affecting the ST-T and U wave configuration include:i Intrinsic myocardial disease (e.g., myocarditis, ischemia, infarction, infiltrative or myopathic processes) Drugs (e.g., digoxin, quinidine, tricyclics, and many others) Electrolyte abnormalities of potassium, magnesium, calcium
114 Factors affecting the ST-T and U wave configuration include:ii Neurogenic factors (e.g., stroke, hemorrhage, trauma, tumor, etc.) Metabolic factors (e.g., hypoglycemia, hyperventilation) Atrial repolarization (e.g., at fast heart rates the atrial T wave may pull down the beginning of the ST segment) Ventricular conduction abnormalities and rhythms originating in the ventricles

115 Electrocardiograms Showing Normal ST-Segment Elevation and Normal Variants.

116 Electrocardiograms Showing ST-Segment Elevation in Various Conditions. 1 LVH 2 LBBB 3 Acute pericarditis 4 hyperkalemia 5 acute ASMI 6 acute ASMI with RBBB 7 Brugada syndrome

117 Ventricular tachycardia

118

119 Hyperkalemia

120 Hyperkalemia

121 Hyperkalemia

122 Hyperkalemia

123 Digoxin effect

124 Pericarditis

125 Thanks for Your Attention
Basic electrocardiography reading. R3 lee wei-chieh
 Basic electrocardiography reading R3 lee wei-chieh The Normal Conduction System Lead Placement avf Limb Leads Precordial Leads Interpretation Rate Rhythm Interval Axis Chamber abnormality QRST change What
Electrocardiography for Healthcare Professionals. Chapter 14 Basic 12-Lead ECG Interpretation
 Electrocardiography for Healthcare Professionals Chapter 14 Basic 12-Lead ECG Interpretation 2012 The Companies, Inc. All rights reserved. Learning Outcomes 14.1 Discuss the anatomic views seen on a 12-lead
12 Lead ECG. Presented by Rebecca Sevigny BSN, RN Professional Practice & Development Dept.
 12 Lead ECG Presented by Rebecca Sevigny BSN, RN Professional Practice & Development Dept. Two Main Coronary Arteries RCA LCA which branches into Left Anterior Descending Circumflex Artery Two Main Coronary
By the end of this lecture, you will be able to: Understand the 12 lead ECG in relation to the coronary circulation and myocardium Perform an ECG
 By the end of this lecture, you will be able to: Understand the 12 lead ECG in relation to the coronary circulation and myocardium Perform an ECG recording Identify the ECG changes that occur in the presence
Section V. Objectives
 Section V Landscape of an MI Objectives At the conclusion of this presentation the participant will be able to Outline a systematic approach to 12 lead ECG interpretation Demonstrate the process for determining
12 Lead ECG Interpretation: Color Coding for MI s
 12 Lead ECG Interpretation: Color Coding for MI s Anna E. Story, RN, MS Director, Continuing Professional Education Critical Care Nurse Online Instructional Designer 2004 Anna Story 1 Objectives review
Myocardial Infarction. Reading Assignment (p66-78 in Outline )
") Myocardial Infarction Reading Assignment (p66-78 in Outline ) Objectives 1. Why do ST segments go up or down in ischemia? 2. STEMI locations and culprit vessels 3. Why 15-lead ECGs? 4. What s up with avr?
Myocardial Infarction Reading Assignment (p66-78 in Outline ) Objectives 1. Why do ST segments go up or down in ischemia? 2. STEMI locations and culprit vessels 3. Why 15-lead ECGs? 4. What s up with avr?
ECG CONVENTIONS AND INTERVALS
 1 ECG Waveforms and Intervals ECG waveforms labeled alphabetically P wave== represents atrial depolarization QRS complex=ventricular depolarization ST-T-U complex (ST segment, T wave, and U wave)== V repolarization.
402 Index. B β-blockers, 4, 5 Bradyarrhythmias, 76 77
 Index A Acquired immunodeficiency syndrome (AIDS), 126, 163 Action potentials, 1, 5, 27 Acute coronary syndromes, 123t, 129 Adenosine, intravenous, 277 Alcohol abuse, as T wave inversion cause, 199 Aneurysm,
Ekg pra pr c a tice D.HAMMOUDI.MD
 Ekg practice D.HAMMOUDI.MD Anatomy Revisited RCA (Right Coronary Artery) Right ventricle Inferior wall of LV Posterior wall of LV (75%) SA Node (60%) AV Node (>80%) LCA (Left Coronary Artery) Septal wall
Please check your answers with correct statements in answer pages after the ECG cases.
 ECG Cases ECG Case 1 Springer International Publishing AG, part of Springer Nature 2018 S. Okutucu, A. Oto, Interpreting ECGs in Clinical Practice, In Clinical Practice, https://doi.org/10.1007/978-3-319-90557-0
12 LEAD EKG BASICS. By: Steven Jones, NREMT P CLEMC
 12 LEAD EKG BASICS By: Steven Jones, NREMT P CLEMC ECG Review Waves and Intervals P wave: the sequential activation (depolarization) of the right and left atria QRS complex: right and left ventricular
Preface: Wang s Viewpoints
 AHA/ACCF/HRS Recommendations for the Standardization and Interpretation of the Electrocardiogram: Part IV, Ischemia and Infarction Presented by: WANG, TZONG LUEN, MD, PhD, JM, FACC, FESC, FCAPSC Professor,
Acute Coronary Syndromes Unstable Angina Non ST segment Elevation MI (NSTEMI) ST segment Elevation MI (STEMI)
 ST segment Elevation MI (STEMI)") Leanna R. Miller, RN, MN, CCRN-CSC, PCCN-CMC, CEN, CNRN, CMSRN, NP Education Specialist LRM Consulting Nashville, TN Objectives Evaluate common abnormalities that mimic myocardial infarction. Identify
Leanna R. Miller, RN, MN, CCRN-CSC, PCCN-CMC, CEN, CNRN, CMSRN, NP Education Specialist LRM Consulting Nashville, TN Objectives Evaluate common abnormalities that mimic myocardial infarction. Identify
Relax and Learn At the Farm 2012
 Relax and Learn At the Farm 2012 Session 2: 12 Lead ECG Fundamentals 101 Cynthia Webner DNP, RN, CCNS, CCRN-CMC, CHFN Though for Today Mastery is not something that strikes in an instant, like a thunderbolt,
The Fundamentals of 12 Lead EKG. ECG Recording. J Point. Reviewing the Cardiac Conductive System. Dr. E. Joe Sasin, MD Rusty Powers, NRP
 The Fundamentals of 12 Lead EKG Dr. E. Joe Sasin, MD Rusty Powers, NRP SA Node Intranodal Pathways AV Junction AV Fibers Bundle of His Septum Bundle Branches Purkinje System Reviewing the Cardiac Conductive
12-Lead ECG Interpretation. Kathy Kuznar, RN, ANP
 12-Lead ECG Interpretation Kathy Kuznar, RN, ANP The 12-Lead ECG Objectives Identify the normal morphology and features of the 12- lead ECG. Perform systematic analysis of the 12-lead ECG. Recognize abnormalities
All About STEMIs. Presented By: Brittney Urvand, RN, BSN, CCCC. Essentia Health Fargo Cardiovascular Program Manager.
 All About STEMIs Presented By: Brittney Urvand, RN, BSN, CCCC Essentia Health Fargo Cardiovascular Program Manager Updated 10/2/2018 None Disclosures Objectives Identify signs and symptoms of a heart attack
A few new tools for better detection and understanding of STEMIs in the field.
 A few new tools for better detection and understanding of STEMIs in the field. Let s talk, prep and placement. Try to shoot for quality, consistency and no artifact! (looking sometimes for 1 or 2 mm changes)
DR QAZI IMTIAZ RASOOL OBJECTIVES
 PRACTICAL ELECTROCARDIOGRAPHY DR QAZI IMTIAZ RASOOL OBJECTIVES Recording of electrical events in heart Established electrode pattern results in specific tracing pattern Health of heart i. e. Anatomical
Acute Coronary Syndromes. Disclosures
 Acute Coronary Syndromes Disclosures I work for Virginia Garcia Memorial Health Center, Beaverton, OR. Jon Tardiff, BS, PA-C OHSU Clinical Assistant Professor And I am a medical editor for Jones & Bartlett
Family Medicine for English language students of Medical University of Lodz ECG. Jakub Dorożyński
 Family Medicine for English language students of Medical University of Lodz ECG Jakub Dorożyński Parts of an ECG The standard ECG has 12 leads: six of them are considered limb leads because they are placed
also aid the clinician in recognizing both the obvious and subtle abnormalities that may help guide therapy.
 Karen Lieberman, MS, CRNP f the many diagnostic tools used to screen for and evaluate cardiac abnormalities, the 12-lead electrocardiogram (ECG) is among the most basic. This inexpensive and noninvasive
ECG ABNORMALITIES D R. T AM A R A AL Q U D AH
 ECG ABNORMALITIES D R. T AM A R A AL Q U D AH When we interpret an ECG we compare it instantaneously with the normal ECG and normal variants stored in our memory; these memories are stored visually in
12 Lead EKG. The Basics
 12 Lead EKG The Basics Objectives Demonstrate proper 12 EKG lead placement Determine electrical axis Identify ST and T wave changes as they relate to myocardial ischemia Describe possible complications
Introduction to Electrocardiography
 Introduction to Electrocardiography Class Objectives: Introduction to ECG monitoring Discuss principles of interpretation Identify the components and measurements of the ECG ECG analysis ECG Monitoring
12 Lead ECG Skills: Building Confidence for Clinical Practice. Presented By: Cynthia Webner, BSN, RN, CCRN-CMC. Karen Marzlin, BSN, RN,CCRN-CMC
 12 Lead ECG Skills: Building Confidence for Clinical Practice NTI 2009 Preconference Session 803 Presented By: Karen Marzlin, BSN, RN,CCRN-CMC 1 12 Lead ECG Fundamentals: The Starting Place for Linking
12 Lead ECG Interpretation
 12 Lead ECG Interpretation Julie Zimmerman, MSN, RN, CNS, CCRN Significant increase in mortality for every 15 minutes of delay! N Engl J Med 2007;357:1631-1638 Who should get a 12-lead ECG? Also include
About T waves
 About T waves - 2014 Dr. Andres R. Pérez Riera The T waves is a positive deflection after each QRS complex. It represents ventricular repolarization The T wave represents the unconcealed potential differences
ECG Basics Sonia Samtani 7/2017 UCI Resident Lecture Series
 ECG Basics Sonia Samtani 7/2017 UCI Resident Lecture Series Agenda I. Introduction II.The Conduction System III.ECG Basics IV.Cardiac Emergencies V.Summary The Conduction System Lead Placement avf Precordial
Left posterior hemiblock (LPH)/
/") ECG OF THE MONTH Left Postero-inferior Depolarization Delay Keywords Electrocardiography Intraventricular conduction delay, Inferoposterior hemiblock, Left posterior fascicular block, Left posterior hemiblock
ECG OF THE MONTH Left Postero-inferior Depolarization Delay Keywords Electrocardiography Intraventricular conduction delay, Inferoposterior hemiblock, Left posterior fascicular block, Left posterior hemiblock
ECGs: Everything a finalist needs to know. Dr Amy Coulden As part of the Simply Finals series
 ECGs: Everything a finalist needs to know Dr Amy Coulden As part of the Simply Finals series Aims and objectives To be able to interpret basic ECG abnormalities To be able to recognise commonly tested
Electrocardiography Abnormalities (Arrhythmias) 7. Faisal I. Mohammed, MD, PhD
 7. Faisal I. Mohammed, MD, PhD") Electrocardiography Abnormalities (Arrhythmias) 7 Faisal I. Mohammed, MD, PhD 1 Causes of Cardiac Arrythmias Abnormal rhythmicity of the pacemaker Shift of pacemaker from sinus node Blocks at different
Electrocardiography Abnormalities (Arrhythmias) 7 Faisal I. Mohammed, MD, PhD 1 Causes of Cardiac Arrythmias Abnormal rhythmicity of the pacemaker Shift of pacemaker from sinus node Blocks at different
Introduction to ECG Gary Martin, M.D.
 Brief review of basic concepts Introduction to ECG Gary Martin, M.D. The electrical activity of the heart is caused by a sequence of rapid ionic movements across cell membranes resulting first in depolarization
Appendix D Output Code and Interpretation of Analysis
 Appendix D Output Code and Interpretation of Analysis 8 Arrhythmia Code No. Description 8002 Marked rhythm irregularity 8110 Sinus rhythm 8102 Sinus arrhythmia 8108 Marked sinus arrhythmia 8120 Sinus tachycardia
3/4/2018. March Martina Frost, PA C Desert Cardiology. Electricity moving towards/away from electrode create downward/upward directions of waves
 March 2018 Martina Frost, PA C Desert Cardiology Electricity moving towards/away from electrode create downward/upward directions of waves Frontal view Limb leads: I, II, III, avl, avf, (avr) Horizontal
Other 12-Lead ECG Findings
 Other 12-Lead ECG Findings Left Atrial Enlargement Left atrial enlargement is illustrated by increased P wave duration in lead II, top ECG, and by the prominent negative P terminal force in lead V1, bottom
REtrive. REpeat. RElearn Design by. Test-Enhanced Learning based ECG practice E-book
 Test-Enhanced Learning Test-Enhanced Learning Test-Enhanced Learning Test-Enhanced Learning based ECG practice E-book REtrive REpeat RElearn Design by S I T T I N U N T H A N G J U I P E E R I Y A W A
Relax and Learn at the FARM 2012: Session 8: 12 Lead ECG 401: ECG Variants
 Relax and Learn at the FARM 2012: Session 8: 12 Lead ECG 401: ECG Variants A Ship in the Harbor is Safe But that is not what ships are built for. Karen Marzlin DNP, RN, CCNS, CCRN-CMC, CHFN Cardiovascular
Electrical System Overview Electrocardiograms Action Potentials 12-Lead Positioning Values To Memorize Calculating Rates
 Electrocardiograms Electrical System Overview James Lamberg 2/ 74 Action Potentials 12-Lead Positioning 3/ 74 4/ 74 Values To Memorize Inherent Rates SA: 60 to 100 AV: 40 to 60 Ventricles: 20 to 40 Normal
12 Lead Electrocardiogram (ECG) PFN: SOMACL17. Terminal Learning Objective. References
 PFN: SOMACL17. Terminal Learning Objective. References") 12 Lead Electrocardiogram (ECG) PFN: SOMACL17 Slide 1 Terminal Learning Objective Action: Communicate knowledge of 12 Lead Electrocardiogram (ECG) Condition: Given a lecture in a classroom environment
12 Lead Electrocardiogram (ECG) PFN: SOMACL17 Slide 1 Terminal Learning Objective Action: Communicate knowledge of 12 Lead Electrocardiogram (ECG) Condition: Given a lecture in a classroom environment
Pennsylvania Academy of Family Physicians Foundation & UPMC 43rd Refresher Course in Family Medicine CME Conference March 10-13, 2016
 Pennsylvania Academy of Family Physicians Foundation & UPMC 43rd Refresher Course in Family Medicine CME Conference March 10-13, 2016 Disclosures: EKG Workshop Louis Mancano, MD Speaker has no disclosures
The Electrocardiogram part II. Dr. Adelina Vlad, MD PhD
 The Electrocardiogram part II Dr. Adelina Vlad, MD PhD Basic Interpretation of the ECG 1) Evaluate calibration 2) Calculate rate 3) Determine rhythm 4) Determine QRS axis 5) Measure intervals 6) Analyze
ECG Interpretation Cat Williams, DVM DACVIM (Cardiology)
") ECG Interpretation Cat Williams, DVM DACVIM (Cardiology) Providing the best quality care and service for the patient, the client, and the referring veterinarian. GOAL: Reduce Anxiety about ECGs Back to
ECG Interpretation Cat Williams, DVM DACVIM (Cardiology) Providing the best quality care and service for the patient, the client, and the referring veterinarian. GOAL: Reduce Anxiety about ECGs Back to
ECG Practice Strips Discussion part 1:
 ECG Practice Strips Discussion part 1: The first 20 strips are for teaching various abnormalities of the morphology of the waves of the ECG. Strips 21 and following are for teaching some abnormalities
Preface: Wang s Viewpoints
 AHA/ACCF/HRS Recommendations for the Standardization and Interpretation of the Electrocardiogram: Ischemia and Infarction 103.10.07 Presented by: WANG, TZONG LUEN, MD, PhD, JM, FACC, FESC, FCAPSC Professor,
ECG. Prepared by: Dr.Fatima Daoud Reference: Guyton and Hall Textbook of Medical Physiology,12 th edition Chapters: 11,12,13
 ECG Prepared by: Dr.Fatima Daoud Reference: Guyton and Hall Textbook of Medical Physiology,12 th edition Chapters: 11,12,13 The Concept When the cardiac impulse passes through the heart, electrical current
ECG Cases and Questions. Ashish Sadhu, MD, FHRS, FACC Electrophysiology/Cardiology
 ECG Cases and Questions Ashish Sadhu, MD, FHRS, FACC Electrophysiology/Cardiology 32 yo female Life Insurance Physical 56 yo male with chest pain Terminology Injury ST elevation Ischemia T wave inversion
ELECTROCARDIOGRAPH. General. Heart Rate. Starship Children s Health Clinical Guideline
 General Heart Rate QRS Axis T Wave Axis PR Interval according to Heart Rate & Age P Wave Duration and Amplitude QRS Duration according to Age QT Interval R & S voltages according to Lead & Age R/S ratio
12 LEAD EKG & CXR INTERPRETATION.
 12 LEAD EKG & CXR INTERPRETATION www.cherylherrmann.com cherrmann@frontier.com Audio Product Recording discount for participants $60 Nonparticipants = $190 o Get CEs and manual https://catalog.vyne.com
ECG Workshop. Nezar Amir
 ECG Workshop Nezar Amir Myocardial Ischemia ECG Infarct ECG in STEMI is dynamic & evolving Common causes of ST shift Infarct Localisation Left main artery occlusion: o diffuse ST-depression with ST elevation
This presentation will deal with the basics of ECG description as well as the physiological basics of
 Snímka 1 Electrocardiography basics This presentation will deal with the basics of ECG description as well as the physiological basics of Snímka 2 Lecture overview 1. Cardiac conduction system functional
Acute chest pain and ECG need for immediate coronary angiography?
 Acute chest pain and ECG need for immediate coronary angiography? Kjell Nikus, MD, PhD Heart Center, Tampere University Hospital, Finland and Samuel Sclarovsky, MD, PhD Tel Aviv University, Israel There
Electrocardiography Normal 5. Faisal I. Mohammed, MD, PhD
 Electrocardiography Normal 5 Faisal I. Mohammed, MD, PhD 1 Objectives 2 1. Describe the different waves in a normal electrocardiogram. 2. Recall the normal P-R and Q-T interval time of the QRS wave. 3.
Electrocardiogram ECG. Hilal Al Saffar FRCP FACC College of medicine,baghdad University
 Electrocardiogram ECG Hilal Al Saffar FRCP FACC College of medicine,baghdad University Tuesday 29 October 2013 ECG introduction Wednesday 30 October 2013 Abnormal ECG ( ischemia, chamber hypertrophy, heart
Chapter 2 Practical Approach
 Chapter 2 Practical Approach There are beginners in electrocardiogram (ECG) analysis who are fascinated by a special pattern (e.g., a bundle-branch block or a striking Q wave) and thereby overlook other
10 ECGs No Practitioner Can Afford to Miss. Objectives
 10 ECGs No Practitioner Can Afford to Miss Mary L. Dohrmann, MD Professor of Clinical Medicine Division of Cardiovascular Medicine University of Missouri School of Medicine No disclosures Objectives 1.
Masqueraders of STEMI
 Masqueraders of STEMI Steven M. Costa, M.D. Assistant Professor Department of Medicine Division of Cardiology Scott & White Memorial Hospital and Clinic Texas A&M University Health Science Center Disclosures
CASE 10. What would the ST segment of this ECG look like? On which leads would you see this ST segment change? What does the T wave represent?
 CASE 10 A 57-year-old man presents to the emergency center with complaints of chest pain with radiation to the left arm and jaw. He reports feeling anxious, diaphoretic, and short of breath. His past history
General Introduction to ECG. Reading Assignment (p2-16 in PDF Outline )
") General Introduction to ECG Reading Assignment (p2-16 in PDF Outline ) Objectives 1. Practice the 5-step Method 2. Differential Diagnosis: R & L axis deviation 3. Differential Diagnosis: Poor R-wave progression
General Introduction to ECG Reading Assignment (p2-16 in PDF Outline ) Objectives 1. Practice the 5-step Method 2. Differential Diagnosis: R & L axis deviation 3. Differential Diagnosis: Poor R-wave progression
EKG. Danil Hammoudi.MD
 EKG Danil Hammoudi.MD What is an EKG? The electrocardiogram (EKG) is a representation of the electrical events of the cardiac cycle. Each event has a distinctive waveform, the study of which can lead to
Cardiology Flash Cards
 Cardiology Flash Cards EKG in a nut shell www.brain101.info Conduction System www.brain101.info 2 Analyzing EKG Step by step Steps in Analyzing ECG'S 1. Rhythm: - Regular _ Sinus, Junctional or Ventricular.
MICS OF MYOCARDIAL ISCHEMIA AND INFARCTION REVISED FOR LAS VEGAS
 ECG MIMICS OF MYOCARDIAL ISCHEMIA AND INFARCTION 102.06.05 Tzong-Luen Wang MD, PhD, JM, FESC, FACC Professor. Medical School, Fu-Jen Catholic University Chief, Emergency Department, Shin-Kong Wu Ho-Su
Paediatric ECG Interpretation
 Paediatric ECG Interpretation Dr Sanj Fernando (thanks to http://lifeinthefastlane.com/ecg-library/paediatric-ecginterpretation/) 3 yo boy complaining of abdominal pain and chest pain Child ECG vs Adult
12 Lead ECGs: Ischemia, Injury & Infarction. Kevin Handke NRP, FP-C, CCP, CMTE STEMI Coordinator Flight Paramedic
 12 Lead ECGs: Ischemia, Injury & Infarction Kevin Handke NRP, FP-C, CCP, CMTE STEMI Coordinator Flight Paramedic None Disclosures Objectives Upon completion of this program the learner will be able to
ECG pre-reading manual. Created for the North West Regional EMET training program
 ECG pre-reading manual Created for the North West Regional EMET training program Author:- Dr Juan Carlos Ascencio-Lane juan.ascencio-lane@ths.tas.gov.au 1 Disclaimer This handbook has been created for
Electrocardiography. Hilal Al Saffar College of Medicine,Baghdad University
 Electrocardiography Hilal Al Saffar College of Medicine,Baghdad University Which of the following is True 1. PR interval, represent the time taken for the impulse to travel from SA node to AV nose. 2.
Case 1. Case 2. Case 3
 Case 1 The correct answer is D. Occasionally, the Brugada syndrome can present similar morphologies to A and also change depending on the lead position but in the Brugada pattern the r is wider and ST
Section 3 and 4. Objectives. Bundle Branches 10/9/2018. LBBB, RBBB Bifascicular, Trifascicular Block
 Section 3 and 4 LBBB, RBBB Bifascicular, Trifascicular Block Objectives At the conclusion of this presentation the participant will be able to Outline a systematic approach to 12 lead ECG interpretation
December 2018 Tracings
 Tracings Tracing 1 Tracing 4 Tracing 1 Answer Tracing 4 Answer Tracing 2 Tracing 5 Tracing 2 Answer Tracing 5 Answer Tracing 3 Tracing 6 Tracing 3 Answer Tracing 6 Answer Questions? Contact Dr. Nelson
Foundations EKG I - Unit 1 Summary
 Foundations EKG I - Unit 1 Summary The accurate diagnosis of ST elevation myocardial infarction (STEMI) is one of the most time critical duties in the practice of EM. Diagnosis is not always easy so guidelines
2017 EKG Workshop Advanced. Family Medicine Review Course Lou Mancano, MD, FAAFP Reading Health System Family and Community Medicine Reading, PA
 2017 EKG Workshop Advanced Family Medicine Review Course Lou Mancano, MD, FAAFP Reading Health System Family and Community Medicine Reading, PA Part II - Objective Describe a useful approach to interpreting
ECG Interpretation Made Easy
 ECG Interpretation Made Easy Dr. A Tageldien Abdellah, MSc MD EBSC Lecturer of Cardiology- Hull University Hull York Medical School 2007-2008 ECG Interpretation Made Easy Synopsis Benefits Objectives Process
Understanding the 12-lead ECG, part II
 Bundle-branch blocks Understanding the 12-lead ECG, part II Most common electrocardiogram (ECG) abnormality Appears as a wider than normal S complex Occurs when one of the two bundle branches can t conduct
, David Stultz, MD.
 http://www.dilbert.com EKG Rounds Handouts available at http://www.drstultz.com January 5, 2004 David Stultz, MD Cardiology Fellow, PGY 4 Overview of Topics How to read an EKG Normal EKG Determination
ELECTROCARDIOGRAPHY KEVIN REBECK PA-C. For more presentations
 ELECTROCARDIOGRAPHY KEVIN REBECK PA-C For more presentations www.medicalppt.blogspot.com Objectives ECG History Pathophysiology Basics Case Historys Electrical activation of the heart In the heart
INTERPRETAZIONE ECG NEL PAZIENTE CON SOSPETTO STEMI
 INTERPRETAZIONE ECG NEL PAZIENTE CON SOSPETTO STEMI Giacomo Veronese Scuola di Specializzazione Medicina d Emergenza e Urgenza Università Milano-Bicocca Siete d accordo se vi propongo per una relazione..
Diploma in Electrocardiography
 The Society for Cardiological Science and Technology Diploma in Electrocardiography The Society makes this award to candidates who can demonstrate the ability to accurately record a resting 12-lead electrocardiogram
ECG in coronary artery disease. By Sura Boonrat Central Chest Institute
 ECG in coronary artery disease By Sura Boonrat Central Chest Institute EKG P wave = Atrium activation PR interval QRS = Ventricle activation T wave= repolarization J-point EKG QT interval Abnormal repolarization
Determining Axis and Axis Deviation on an ECG
 Marquette University e-publications@marquette Physician Assistant Studies Faculty Research and Publications Health Sciences, College of 7-15-2010 Determining Axis and Axis Deviation on an ECG Patrick Loftis
SIMPLY ECGs. Dr William Dooley
 SIMPLY ECGs Dr William Dooley Content Basic ECG interpretation pattern Some common (examined) abnormalities Presenting ECGs in context Setting up an ECG Setting up an ECG 1 V1-4 th Right intercostal space
15 th Sukaman Memorial Lecture ST Segment Elevation: New Electrocardiographic Insights in 2014
 DOI 10.7603/s40602-016-0006-3 ASEAN Heart Journal http://www.globalsciencejournals.com/journal/40602 Vol. 24, no.1, 98 105 (2016) ISSN: 2315-4551 15 th Sukaman Memorial Lecture ST Segment Elevation: New
12 Lead Acquisition and Interpretation APRIL 23 11:00 AM
 12 Lead Acquisition and Interpretation APRIL 23 11:00 AM Presented by : Jennifer Robson, Prehospital Care Specialist Dr. Don Eby, Local Medical Director Objectives Upon completion of this webinar, you
ELECTROCARDIOGRAPHY: A DIAGNOSTIC TOOL IN PANCHAKARMA
 INTERNATIONAL AYURVEDIC MEDICAL JOURNAL International Ayurvedic Medical Journal, (ISSN: 2320 5091) (October, 2017) 5(10) ELECTROCARDIOGRAPHY: A DIAGNOSTIC TOOL IN PANCHAKARMA Rosy Malik 1, Swati S. Deshpande
ELECTROCARDIOGRAPHY (ECG)
") ELECTROCARDIOGRAPHY (ECG) The heart is a muscular organ, which pumps blood through the blood vessels of the circulatory system. Blood provides the body with oxygen and nutrients, as well as assists in
ELECTROCARDIOGRAPHY (ECG) The heart is a muscular organ, which pumps blood through the blood vessels of the circulatory system. Blood provides the body with oxygen and nutrients, as well as assists in
ECG SIGNS OF HYPERTROPHY OF HEART ATRIUMS AND VENTRICLES
 Ministry of Health of Ukraine Kharkiv National Medical University ECG SIGNS OF HYPERTROPHY OF HEART ATRIUMS AND VENTRICLES Methodical instructions for students Рекомендовано Ученым советом ХНМУ Протокол
Normal ECG And ECHO Findings in Athletes
 Normal ECG And ECHO Findings in Athletes Dr.Yahya Kiwan Consultant Interventional Cardiologist Head Of Departement Of Cardiology Canadian Specialist Hospital Sinus Bradycardia The normal heartbeat is initiated
5- The normal electrocardiogram (ECG)
") 5- The (ECG) Introduction Electrocardiography is a process of recording electrical activities of heart muscle at skin surface. The electrical current spreads into the tissues surrounding the heart, a small
5- The (ECG) Introduction Electrocardiography is a process of recording electrical activities of heart muscle at skin surface. The electrical current spreads into the tissues surrounding the heart, a small
ECG Interpretation. Best to have a system to methodically evaluate ECG (from Dubin) * Rate * Rhythm * Axis * Intervals * Hypertrophy * Infarction
 * Rate * Rhythm * Axis * Intervals * Hypertrophy * Infarction") ECG to save Babies ECG Interpretation Best to have a system to methodically evaluate ECG (from Dubin) * Rate * Rhythm * Axis * Intervals * Hypertrophy * Infarction Electrical Activity in the heart 5 events
ECG to save Babies ECG Interpretation Best to have a system to methodically evaluate ECG (from Dubin) * Rate * Rhythm * Axis * Intervals * Hypertrophy * Infarction Electrical Activity in the heart 5 events
Office ECG Interpretation
 Office ECG Interpretation Jason Evanchan, DO Assistant Professor of Medicine Division of Cardiovascular Medicine The Ohio State University Wexner Medical Center Outline of topics High risk ischemia T wave
Study methodology for screening candidates to athletes risk
 1. Periodical Evaluations: each 2 years. Study methodology for screening candidates to athletes risk 2. Personal history: Personal history of murmur in childhood; dizziness, syncope, palpitations, intolerance
Appendix. Table 1: Causes for abnormal axis deviation Left axis deviation
 Appendix Table 1: Causes for abnormal axis deviation Left axis deviation Normal variant (2 5%) Left anterior fascicular block Left ventricular hypertrophy Inferior wall myocardial infarction Primum atrial
Understanding basics of EKG
 Understanding basics of EKG By Alula A.(R III) www.le.ac.uk Topic for discussion Understanding of cellular electrophysiology Basics Rate Rhythm Axis Intervals P wave QRS ST/T wave Abnormal EKGs Understanding
PATIENT S NAME, DATE/TIME,
 ECG and Arrhythmias Dec, 1 st 2014 Doctor Mohammad Jarrah References: - Lecture and Slides - ECG Made Easy - Davidson Principles of Medicine - First Aid Cases for the USMLE Step 1 - Mini-OSCE Archive ECG
12 Lead Interpretation
 12 Lead Interpretation Objectives Ischemia, injury and infarction ECG complex review J point ST segment STEMI recognition Ischemia to Infarct Infarction is an evolving process As the infarct evolves ECG
ECG (MCQs) In the fundamental rules of the ECG all the following are right EXCEP:
 In the fundamental rules of the ECG all the following are right EXCEP:") ECG (MCQs) 2010 1- In the fundamental rules of the ECG all the following are right EXCEP: a- It is a biphasic record of myocardial action potential fluctuations. b- Deflection record occurs only during
ECG (MCQs) 2010 1- In the fundamental rules of the ECG all the following are right EXCEP: a- It is a biphasic record of myocardial action potential fluctuations. b- Deflection record occurs only during
A Review of Cardiac Pathophysiology and EKG. Jamie Dyson PT, DPT Kathy Swanick PT, DPT, OCS
 A Review of Cardiac Pathophysiology and EKG Jamie Dyson PT, DPT Kathy Swanick PT, DPT, OCS Cardiac Pathophysiology Coronary Artery Disease Congestive Heart Failure Valvular Heart Disease Athletic Heart
The Normal Electrocardiogram
 C H A P T E R 1 1 The Normal Electrocardiogram When the cardiac impulse passes through the heart, electrical current also spreads from the heart into the adjacent tissues surrounding the heart. A small
Bundle Branch & Fascicular Blocks. Reading Assignment (p53-58 in Outline )
") Bundle Branch & Fascicular Blocks Reading Assignment (p53-58 in Outline ) Objectives 1. QRS analysis of Right and Left BBB 2. Uncomplicated vs complicated BBB 3. Diagnosis of RBBB with LAFB and LPFB 4.
Bundle Branch & Fascicular Blocks Reading Assignment (p53-58 in Outline ) Objectives 1. QRS analysis of Right and Left BBB 2. Uncomplicated vs complicated BBB 3. Diagnosis of RBBB with LAFB and LPFB 4.
12 Lead ECG Workshop. Virginia Hass, DNP, FNP-C, PA-C Kim Newlin, CNS, ANP-C, FPCNA. California Association of Nurse Practitioners March 18, 2016
 12 Lead ECG Workshop Virginia Hass, DNP, FNP-C, PA-C Kim Newlin, CNS, ANP-C, FPCNA California Association of Nurse Practitioners March 18, 2016 Learning Objectives Identify key changes on the ECG which