The developmental regulator Gon4-like functions within the transcriptional networks that control B lymphopoiesis and CD4+ T cell responses
|
|
|
- Ernest Mills
- 5 years ago
- Views:
Transcription


1 University of Iowa Iowa Research Online Theses and Dissertations Fall 2011 The developmental regulator Gon4-like functions within the transcriptional networks that control B lymphopoiesis and CD4+ T cell responses Isaiah Luke Hankel University of Iowa Copyright 2011 Isaiah Luke Hankel This dissertation is available at Iowa Research Online: Recommended Citation Hankel, Isaiah Luke. "The developmental regulator Gon4-like functions within the transcriptional networks that control B lymphopoiesis and CD4+ T cell responses." PhD (Doctor of Philosophy) thesis, University of Iowa, Follow this and additional works at: Part of the Cell Anatomy Commons
2 THE DEVELOPMENTAL REGULATOR GON4-LIKE FUNCTIONS WITHIN THE TRANSCRIPTIONAL NETWORKS THAT CONTROL B LYMPHOPOIESIS AND CD4 + T CELL RESPONSES by Isaiah Luke Hankel An Abstract Of a thesis submitted in partial fulfillment of the requirements for the Doctor of Philosophy degree in Anatomy and Cell Biology in the Graduate College of The University of Iowa December 2011 Thesis Supervisor: Assistant Professor John D. Colgan
3 1 ABSTRACT B and T lymphocytes are critical to the adaptive immune response against invading microorganisms. B and T cells develop in the bone marrow and thymus, respectively, and initiate a series of proliferative responses once they encounter their cognate antigen in the peripheral lymphoid organs. These developmental and functional processes are controlled by different networks of transcriptional regulators that repress and activate gene expression. Identifying proteins that activate or repress specific genes and integrating these proteins into their transcriptional networks is critical to understanding lymphocyte development and function. The study of B lymphopoiesis and CD4 + T cell functional responses has greatly increased our understanding of how transcriptional regulators and other proteins cooperate to specify cell fates and responses. While many of the key components of these protein networks have been defined, several factors have yet to be described. Chemically induced random mutagenesis is a powerful tool for identifying genes that have critical biological functions. Justy mutant mice were generated by injecting wild-type mice with of N-Ethyl-N-Nitrosourea (ENU), a mutagen, which generated a unique point mutation in the mouse Gon4-like (Gon4l) gene. This mutation was found to specifically blunt B cell development and impair the functional responses of CD4 + T cells. Given that the Gon4l protein contains domains implicated in transcriptional regulation and B lymphopoiesis and T cell responses are regulated transcriptionally, the aim of this project was to characterize T and B lymphocyte populations from Justy mice and provide insights into the mechanisms underlying the regulation of gene expression during these biological processes. The work presented in this dissertation demonstrates that the protein encoded by Gon4l is essential for B lymphopoiesis, likely through the repression of alternate lineage genes. This work also shows that in CD4 + T cells, decreased Gon4l protein expression results in reduced levels of proliferation in response to exogenous IL-2
4 2 or T cell receptor (TCR) engagement. Additionally, Justy mutant CD4 + T cells display a reduced ability to generate IFNγ-producing cells in response to Th1 polarization in vitro. Collectively, these defects correlate with elevated levels of genes known to specifically inhibit the above developmental and functional processes. Thus, this dissertation proposes that Gon4l acts as a transcriptional repressor within the protein networks controlling B lymphopoiesis and CD4 + T cell responses. Abstract Approved: Thesis Supervisor Title and Department Date
5 THE DEVELOPMENTAL REGULATOR GON4-LIKE FUNCTIONS WITHIN THE TRANSCRIPTIONAL NETWORKS THAT CONTROL B LYMPHOPOIESIS AND CD4 + T CELL RESPONSES by Isaiah Luke Hankel A thesis submitted in partial fulfillment of the requirements for the Doctor of Philosophy degree in Anatomy and Cell Biology in the Graduate College of The University of Iowa December 2011 Thesis Supervisor: Assistant Professor John D. Colgan
6 Graduate College The University of Iowa Iowa City, Iowa CERTIFICATE OF APPROVAL PH.D. THESIS This is to certify that the Ph.D. thesis of Isaiah Luke Hankel has been approved by the Examining Committee for the thesis requirement for the Doctor of Philosophy degree in Anatomy and Cell Biology at the December 2011 graduation. Thesis Committee: John D. Colgan, Thesis Supervisor Robert Cornell Adam Dupuy Paul B. Rothman Thomas Waldschmidt
7 To John Robert Hankel ii
8 ACKNOWLEDGMENTS My pursuit of a Ph.D. was an intensely personal journey that would not have been completed without constant guidance and support from numerous individuals in my life. I leaned heavily on my mentors, teachers, coaches, friends and family members during my tenure at the University of Iowa. It would be impossible for me to fully acknowledge the commitment and relentless effort that these individuals put towards my education and my personal growth. First, I want to thank my Ph.D. mentor, Dr. John Colgan, for his passionate engagement in my development as a scientist and as a person. I have held positions in both industry and academia and have played on high caliber collegiate sports teams, yet I know very few people, if anyone, who work as hard as Dr. Colgan. I truly admire his work ethic and his uncompromising dedication to scientific excellence. I also appreciate his willingness to take a chance on a first-year Graduate student that knew very little about biology and knew even less about working in a laboratory. Dr. Colgan pushed me to a level of thinking that I would not have been able to obtain without him. I am deeply grateful for his guidance and support. Next, I want to thank Dr. Paul Rothman, who despite his numerous duties as the Dean of the Carver College of Medicine, made it a priority to participate in joint lab meetings between his lab and Dr. Colgan s lab. I enjoyed our many discussions together, scientific and otherwise, and I am very appreciative that he always made himself available when I needed his support. I also want to thank Dr. Thomas Waldchmidt for his support and for his commitment to my scientific progress. I did a rotation in Dr. Waldschmidt s lab at a very critical time during my first-year as a Graduate student. During that time, Dr. Waldschmidt s expertise, sense of humor and incredible communication skills greatly enhanced my development as a scientist. iii
9 I would like to extend my appreciation to both Dr. Robert Cornell and Dr. Adam Dupuy. Dr. Cornell and Dr. Dupuy supported me as faculty members of the Department of Anatomy and Cell Biology. I am very thankful for their dedicated interest in my research and for their active participation in my thesis committee meetings and Anatomy and Cell Biology Departmental presentations. I would like to give special thanks to Dr. Cornell for stepping in to complete my thesis committee half way through my Graduate school career. My education benefited greatly from the support and guidance provided by all the members of the Department of Anatomy and Cell Biology. I am extremely grateful for the individuals that held administrative positions crucial to the completion of my degree, including Julie Stark, Dr. Charles Yeaman and Dr. John Engelhardt. I am truly thankful for all of the friends that I made at the University of Iowa over the last several years. I was very fortunate to have worked with Dr. Ping Lu, who not only advanced my understanding of complex scientific topics, but also broadened my cultural and sociological horizons. Dr. Lu is a great scientist and has a unique ability to teach me, help me relax and make me laugh. I am also thankful for the friends that I made prior to my admission into the University of Iowa. I would not have made it through the daily grind of Graduate school without constant inspiration from my life-long friend Josh Birt. I relied heavily on Josh s friendship over the last few years and would have been lost without his perspective on my life. I was blessed with an incredibly supportive family that constantly showered me with praise and love. I want to thank my beautiful mother, Karen Hankel, for her continuous encouragement and love. I also want to thank my gorgeous sister, Jessica, and my superhuman brother, Noah, for their undying support and love. Finally, I want to thank my father, John Hankel, for supporting me and loving me in a way that few sons will ever know. My journey towards of Ph.D. would have stopped short if my father was not their to pick me up and set me straight time and time again. I am forever grateful for his unconditional loyalty and love. iv
10 ABSTRACT B and T lymphocytes are critical to the adaptive immune response against invading microorganisms. B and T cells develop in the bone marrow and thymus, respectively, and initiate a series of proliferative responses once they encounter their cognate antigen in the peripheral lymphoid organs. These developmental and functional processes are controlled by different networks of transcriptional regulators that repress and activate gene expression. Identifying proteins that activate or repress specific genes and integrating these proteins into their transcriptional networks is critical to understanding lymphocyte development and function. The study of B lymphopoiesis and CD4 + T cell functional responses has greatly increased our understanding of how transcriptional regulators and other proteins cooperate to specify cell fates and responses. While many of the key components of these protein networks have been defined, several factors have yet to be described. Chemically induced random mutagenesis is a powerful tool for identifying genes that have critical biological functions. Justy mutant mice were generated by injecting wild-type mice with of N-Ethyl-N-Nitrosourea (ENU), a mutagen, which generated a unique point mutation in the mouse Gon4-like (Gon4l) gene. This mutation was found to specifically blunt B cell development and impair the functional responses of CD4 + T cells. Given that the Gon4l protein contains domains implicated in transcriptional regulation and B lymphopoiesis and T cell responses are regulated transcriptionally, the aim of this project was to characterize T and B lymphocyte populations from Justy mice and provide insights into the mechanisms underlying the regulation of gene expression during these biological processes. The work presented in this dissertation demonstrates that the protein encoded by Gon4l is essential for B lymphopoiesis, likely through the repression of alternate lineage genes. This work also shows that in CD4 + T cells, decreased Gon4l protein expression results in reduced levels of proliferation in response v
11 to exogenous IL-2 or T cell receptor (TCR) engagement. Additionally, Justy mutant CD4 + T cells display a reduced ability to generate IFNγ-producing cells in response to Th1 polarization in vitro. Collectively, these defects correlate with elevated levels of genes known to specifically inhibit the above developmental and functional processes. Thus, this dissertation proposes that Gon4l acts as a transcriptional repressor within the protein networks controlling B lymphopoiesis and CD4 + T cell responses. vi
12 TABLE OF CONTENTS LIST OF FIGURES...x LIST OF ABBREVIATIONS... xii CHAPTER I GENERAL INTRODUCTION...1! Transcriptional Control of Complex Biological Processes...1! Mechanisms That Drive B Lymphopoiesis...2! Activation of B Lineage Genes...3! Repression of Alternate Lineage Genes...5! V(D)J Rearrangement...5! Functional Responses of CD4 + T Cells...7! Development of Mature CD4 + T Cells...7! T Cell Receptor Signaling...8! IL-2/IL-2 Receptor Signaling...10! Differentiation of Th Cell Subsets...13! Activation of Th1 Cell Development...14! Inhibition of Th1 Differentiation...16! Th1 Cell Function...16! CHAPTER II THE JUSTY MUTATION DISRUPTS THE LYMPHOID VERSUS MYELOID TRANSCRPTION FACTOR NETWORK AND PROFOUNDLY ARRESTS B CELL DEVELOPMENT...18! Abstract...18! Introduction...18! Methods...20! Mice...20! Mutagenesis of Mice and Positional Cloning...20! Bone Marrow Transplantation...21! Flow Cytometric Analysis and Cell Sorting...21! Flow Antibodies...22! Isolation of Lineage-negative Cells...23! RT-PCR Analysis...23! Immunoblot Analysis...24! Immunoblot Antibodies...24! Immunofluorescent Confocal Microscopy...24! Results...25! Justy Mice are Devoid of B Cells...25! The Effect of the Justy Mutation is Intrinsic to Bone Marrow B Cell Progenitors...25! B Cell Progenitors are Decreased in Justy Mice from the Fraction B Progenitor Stage Onward...26! The Justy Mutation Disrupts Expression of Gon4l RNA and the Encoded Protein...27! Wild-type Gon4l RNA Levels are Decreased in Justy B Cell Progenitors...29! The Gon4l Protein Co-localizes with Sin3a and HDAC1...30! Justy B Cell Progenitors Fail to Repress Expression of Genes That Antagonize B Lymphopoiesis...31! vii
13 Aberrant Regulation of IgH Expression is Not the Dominant Mechanism Causing the Arrest in B Cell Development in Justy Mice...32! Gon4l and Ebf1 Functionally Cooperate to Promote B Cell Development...33! Discussion...34! CHAPTER III LOSS OF GON4L EXPRESSION IMPAIRS PROLIFERATIVE RESPONSES OF PERIPHERAL CD4 + T LYMPHOCYTES...58! Abstract...58! Introduction...58! Methods...61! Peripheral CD4 + T cell Isolation and Cell Culture...61! Flow Cytometric Analysis and Cell Sorting...61! Flow Antibodies...62! Microarray Analysis...62! RT-PCR Analysis...63! Immunoblot Analysis...63! Immunoblot Antibodies...64! Proliferation Assays...64! Cell Death Analysis...64! ELISAs...64! Results...65! The Justy Mutation Results in Decreased Levels of Gon4l Expression in T Cell Progenitors...65! Major Aspects of Thymic T Cell Development is Normal in Justy Mice...65! The Justy Mutation Impairs Peripheral CD4 + T Cell Proliferation...66! Mutant Peripheral CD4 + T Cells From Justy Mice Display Decreased Levels of I B Degradation and IL-2 Production...67! Loss of Gon4l Expression Impairs IL-2R/Stat5 Signaling in Peripheral CD4 + T Cells...68! The Justy Mutation Dysregulates the Expression of Stat5 Target Genes...69! Discussion...70! CHAPTER IV GON4L IS ESSENTIAL FOR THE DIFFERENTIATION OF CD4 + TH1 EFFECTOR CELLS...90! Abstract...90! Introduction...90! Methods...93! Mice...93! Peripheral CD4 + T Cell Isolation and Cell Culture...93! Flow Cytometric Analysis and Cell Sorting...93! Flow Antibodies...94! RT-PCR Analysis...94! Immunoblot Analysis...95! Immunoblot Antibodies...95! ELISAs...96! Differentiation Assays...96! Bacteria and Infection of Mice...96! Peptides and Determination of the Number of Antigen-Specific CD4 + T Cells...97! Transduction Experiments...97! viii
14 Results...98! The Justy Mutation Specifically Impairs the Development of CD4 + Th1 Effector Cells...98! Justy Mice Clear Listeria Monocytogenes Infection Similar to MT Mice...99! ShRNA-Mediated Knockdown of Gon4l Impairs IFNγ Production in CD4 + Th1 Effector Cells...101! Loss of Gon4l Expression Disrupts Socs3 Expression and Cyclin D2 Induction in CD4 + Th1 Effector Cells...101! The Justy Mutation Disrupts Expression of CD4 + Th1 Cell- Specific Transcription Factors...102! Discussion...103! CHAPTER V GENERAL DISCUSSION...121! The Role of Gon4l in the Transcriptional Network that Controls B Cell Development...122! Gon4l and the Regulation of Signaling Pathways that Activate Peripheral CD4 + T Cells...124! Gon4l Regulates Cytokine Signaling and Gene Expression During Th1 Differentiation...126! Understanding the Gon4l Protein and Its Function in Immune Cells...129! REFERENCES...132! ix
15 LIST OF FIGURES Figure 1. Justy mice lack B cells....38! 2. The Justy mutation intrinsically affects hematopoietic progenitors....40! 3. B lymphopoiesis in Justy mice arrests at the early Fraction B cell stage....42! 4. The Justy mutation disrupts synthesis of RNA and protein from the Gon4l gene....44! 5. The Justy mutation affects wild-type Gon4l expression in B cell progenitors....46! 6. Gon4l co-localizes with the corepressors Sin3a and HDAC ! 7. Decreased expression of Gon4l impairs gene repression in B cell progenitors....50! 8. Neither preventing nor enforcing expression of rearranged IgH protein rescues B cell development in Justy mice....52! 9. B cell development is impaired in Ebf1 +/- Gon4l +/Jsty mice....54! 10. Compound haploinsufficiencies of Ebf1 and Gon4l impairs repression of non- B lineage genes....56! 11. The Justy mutation reduces Gon4l expression in T lineage cells....72! 12. Thymic T cell development in Justy mice appears grossly normal....74! 13. The Justy mutation perturbs the peripheral CD4 + T cell compartment....76! 14. Justy mutant CD4 T cells have altered responses to activation of T cell receptor signaling pathways....78! 15. The Justy mutation impairs IκBα degradation in peripheral CD4 + T cells....80! 16. Justy mutant CD4 + T cells have altered responses to activation of T cell receptor signaling pathways....82! 17. Impaired responses by Justy mutant CD4 + T cell to IL-2 stimulation....84! 18. Decreased Gon4l expression results in dysregulation of Stat5 target genes....86! 19. Proposed model of Gon4l-mediated repression of Socs3 expression....88! 20. Peripheral CD4 + T lymphocytes lacking Gon4l are defective in the ability to generate Th1-type effector cells ! 21. Justy mutant CD4 T cells express normal levels of TCR and show normal responses to conditions that direct Th2 or Th17 differentiation ! x
16 22. Development of mature CD4 + T cells in a B cell deficient host does not impair CD4 + T proliferation in vitro ! 23. Gon4l expression is essential to the development of Th1-type effector cells ! 24. Decreased Gon4l expression in Th1-type cells disrupts regulation of Cyclin D2 and Socs3 expression ! 25. The protein network that controls Th1 differentiation is perturbed in Justy mutant CD4+ T cells ! 26. Proposed model of the role of Gon4l in the repression of genes that promote alternate fates and functions of lymphocytes during critical phases of development and activation ! xi
17 LIST OF ABBREVIATIONS 7-AAD AP-1 APC BCR Cebpα CIS CLP CPM Csf1r DAG DN DP EBF ELISA Emb ENU GAPDH GAS Gon4l-p HDAC HPRT HSC 7-amino-actinomycin D Activating protein-1 Antigen-presenting cell B cell receptor CCAAT/enhancer binding protein gene Cytokine-inducible SH2-containing Common lymphoid progenitor Counts per minute Colony stimulating factor 1 receptor gene Diacylglycerol Double negative Double positive Early B cell factor (also known as Ebf-1) Enzyme-linked immunosorbent assay Embigin N-ethyl-n-nitrosourea Glyceraldehyde 3-phosphate dehydrogenase Gamma-activated site Gon4l-paralog Histone deacetylase complex Hypoxanthine phosphoribosyltransferase Hematopoietic stem cell xii
18 3 H-TTP Tritiated thymidine triphosphate Id2 IFNγ IgH IgL IKK IL Jak Jnk Lin - MAPK MHC MiR NFAT NF-κB NK PAH PAIR pdc PMA Pre-BCR Q RT-PCR RAG RSS Inhibitor of DNA binding-2 Interferon-gamma Immunoglobulin heavy chain Immunoglobulin light chain IκB kinase Interleukin Janus kinase c-jun N-terminal kinase Lineage marker negative Mitogen-associate protein kinase Major histocompatibility complex Micro-RNA Nuclear factor of activated T cells Nuclear factor kappa-light-chain-enhancer of activated B cells Natural killer Paired amphipathic helix Pax5-activated intergenic repeat Plasmacytoid dendritic cells Phorbol 12-myristate 13-acetate Pre-B cell receptor Quantitative RT-PCR Recombinase activating genes Recombination signal sequences xiii
19 SANT SOCS SP SSLP Stat TCR Th Treg Udu UTR V(D)J WB WCL WT YY1 SWI3, ADA2, N-CoR, TFIIIB Suppressors of cytokine signaling Single positive Simple sequence length polymorphism Signaling transducer and activator of transcription T cell receptor T-helper T regulatory Ugly duckling (Gon4l ortholog in zebrafish) Untranslated region Variable (Diversity) Joining Western blog Whole cell lysate Wild-type Yin-yang-1 xiv
20 1 CHAPTER I GENERAL INTRODUCTION Transcriptional Control of Complex Biological Processes Over the past decade, major scientific efforts have shifted from mapping the entire human genome to determining which genes encode which proteins and which proteins control gene expression (1). Understanding when, why and how a gene is expressed has now become a necessity toward defining the regulatory pathways that mediate cellular processes. Regulation of gene transcription is a process that is primarily under the influence of nuclear-located transcription factors. Transcription factors are sequence-specific DNA-binding proteins that regulate the developmental and functional processes of a cell. For many transcription factors, binding motifs are found adjacent to the promoter regions of their target genes, requiring mechanisms that confer binding specificity in any given cell type. These mechanisms include association of the factor with other proteins and modulation of DNA packaging at the binding sequence to either inhibit or facilitate binding (1, 2). Once bound to DNA, these proteins and their functional partners mediate transcriptional activation or repression. Adding another layer of complexity, each transcription factor is part of a larger regulatory network that is carefully balanced to maintain precise levels of gene expression. Identifying proteins that activate or repress specific genes and integrating these proteins into their transcriptional networks is a prerequisite for understanding cell fate and function. Analysis of the kinetics of RNA and protein synthesis and the response of the cis-regulatory elements to transcription factor expression levels is crucial in this regard (2, 3). Finally, advancing the field of molecular and cellular biology will likely include continued efforts to transition from characterizing these transcription factor networks to fitting these networks into the complex cell signaling pathways they influence.
21 2 Mechanisms That Drive B Lymphopoiesis The study of hematopoiesis has yielded enormous insights into the complex circuitry of numerous transcription factor networks and how these networks control cell fate and cell function. Hematopoiesis requires progression of multipotent cells through pathways that restrict developmental potential and promote commitment to a specific lineage fate (4, 5). These processes are driven by the remodeling of gene expression patterns as orchestrated by a network of transcription factors (5-7). Among hematopoietic developmental pathways, B lymphopoiesis has been well defined experimentally. During the early stages of B lymphopoiesis, expression of B cell-specific transcription factors results in the suppression of developmental plasticity and commitment to a B lineage fate (7, 8). This process is accompanied by the activation of lymphoid and B lineage genes and the repression of genes associated with the myeloid and T cell lineages. Coinciding with these transcriptional events, early B cell development is associated with ordered non-homologous rearrangement of the immunoglobulin heavy (IgH) and light (IgL) chain genes (9-11). A key checkpoint in this process is the ability of a newly generated IgH chain to associate with the surrogate light chains (encoded by VpreB and λ5) and the Ig-associated signaling molecules, Igα and Igβ (encoded by Cd79a and Cd79b, respectively) to form a signal-transducing pre-b cell receptor (pre-bcr). Successful rearrangement of the immunoglobulin genes is required for the generation of functional BCRs and for the progression of B lymphopoiesis (12-14). Thus, distinct and intensive gene expression reprogramming at each developmental stage and the ordered recombination of the IgH and IgL chain genes is crucial to the development of mature B- cells.
22 3 Activation of B Lineage Genes Hematopoietic stem cells (HSC) progressively give rise to common lymphoid progenitors (CLPs), which have the potential to differentiate into B cells, T cells, natural killer (NK) cells and dendritic cells. Two processes, B lineage specification and B lineage commitment, must occur for CLPs to develop into mature B lymphocytes. The earliest identifiable B lineage-specified precursors are Hardy Fraction A progenitors, which express the B lineage specific cell-surface marker, B220 (3,4). Hardy Fraction A progenitors give rise to Hardy Fraction B progenitors, which express the B lineage specific cell-surface marker, CD19. These developmental changes are enforced by the combined function of the critical B lineage transcription factors E2A, EBF and Pax5 (15-21). E2A is a basic helix-loop-helix protein encoded by Tcfe2a that is made as two splice variants, E12 and E47. B cell progenitors in Tcfe2a -/- mice do not mature past the Fraction A stage of development (22-24). It has been shown that E2A is required for initiating and maintaining the expression of EBF, Pax5 and the overall B cell specification program (25). E2A collaborates with EBF to activate B lineage genes and to help initiate V(D)J recombination at the IgH locus (26). However, ectopic expression of EBF does not induce E2A, indicating that E2A functions upstream of EBF (27). EBF is encoded by the Ebf1 gene and its expression is essential for the development of functional B cells. EBF has been shown to regulate many genes involved in B cell development, including Cd79a (mb-1 or Igα), Cd79b (Igβ), λ5, VpreB1, and Pax5 (22, 28, 29). At the epigenetic level, EBF initiates chromatin remodeling events necessary for the binding of Pax5 to the Cd79a promoter (30). Similar to B cell progenitors in Tcfe2a -/- mice, progenitors from Ebf1 -/- mice are arrested at the Fraction A stage of B lymphopoiesis. Ebf1 transcription is induced at its distal α-promoter by E47, EBF (via autoregulatory mechanisms) and IL-7/Stat5 signaling. Pax5, PU.1 and Ets1 induce Ebf1 expression at its proximal β-promoter, thus creating a positive feedback loop between Pax5 activation and EBF upregulation (31, 32). Several labs have utilized
23 4 mutant mice strains that are haploinsufficient for Ebf1 and other B lineage transcription factors in order to determine the functional relationship between these proteins (33-35). Analyses of mice that are haploinsufficient for both Ebf1 and Tcfe2a have shown that B cell progenitors in these mice do not progress past the Fraction B stage and fail to express Cd79a, λ5 and VpreB. Other studies have confirmed that E2A and EBF proteins functionally cooperate at the promoter level to activate the expression of Cd79a, λ5 and VpreB (36-38). Analyses of mice happloinsufficient for both Ebf1 and Runx1, a gene that is required for the expression of PU.1, have shown that B lymphopoiesis is impaired in these mice from the Fraction B stage onward. Reasons for this impeded development include reduced or delayed expression of the EBF and Runx1 target genes, Ikzf3 (Aiolos), Cd25 (CD25) and Cd2 (CD2) (34, 35). Thus, the coordinate regulation of EBF and its functional partners are critical to initiating the expression of key B lineage genes. Expression of E2A and EBF is critical to the B cell specification program, but it is not sufficient to restrict progenitors to a B cell fate. B cell commitment requires the transcription factor Pax5, which is capable of activating or repressing gene expression (22, 39, 40). Progenitors from Pax5 -/- mice do not develop past the Fraction B stage but express normal levels of Cd79b, λ5 and VpreB and can be propagated in culture by the presence of IL-7 and stromal cells (22, 41). Moreover, ectopic expression of EBF was able to rescue the generation of B cells from Pax5 -/- progenitors, while blocking promiscuous differentiation (42). However, ectopic expression of Pax5 cannot rescue B lymphopoiesis in Ebf1 -/- deficient cells, likely due to the role EBF plays in repressing proteins that inhibit E2A expression (43). Conditional inactivation of Pax5 in mature peripheral B cells resulted in their de-differentiation to uncommitted progenitor cells, likely due to the role Pax5 plays in modulating chromatin structure (44, 45).
24 5 Repression of Alternate Lineage Genes E2A, EBF and Pax5 are all key components of the transcription factor network that controls B lymphopoiesis. In addition to regulating the expression of lymphoid and B lineage genes, the B cell transcription factor network functions to repress alternate lineage genes that thus facilitate commitment. These alternate lineage genes include the transcription factors PU.1 and CAAT enhancer binding protein (C/EBPα), which can both inhibit B lymphopoiesis and bias cells toward macrophage development when expressed at inappropriately high levels in certain cells (46-48). Pax5 -/- Fraction B progenitors express high levels c-fms and Notch1, indicating that Pax5 acts to repress myeloid and T cell lineage genes during B lymphopoiesis (49, 50). Ebf1 -/- progenitors maintain myeloid cell potential and express high levels of Id2, PU.1 and C/EBPα (42, 43). Repression of Id2 by EBF and other transcriptional regulators has been shown to be essential to B lineage specification (43, 51). Both Pax5 and EBF have been shown to strongly repress Emb, the gene encoding Embigin, during B lymphopoiesis (42, 52). Embigin is important for cell adhesion and is expressed at high levels in myeloid lineage cells. Thus, the transcription factor network that regulates B lymphopoiesis relies not only on the activation of lymphoid and B lineage genes, but also on the repression of genes associated with alternate lineages. V(D)J Rearrangement E2A, EBF and Pax5 are also implicated in a vital step of B cell maturation called V(D)J rearrangement. The immunoglobulin heavy chain gene consists of the variable (V), diversity (D) and joining (J) segments while the light chain gene contains only V and J segments. These V, D, and J gene segments are flanked by recombination signal sequences (RSSs). RSSs are recognized by the recombinase enzymes, RAG1 and RAG2, which generate double-stranded DNA breaks at RSSs sites (9, 11, 53, 54). Mutations in RAG2 result in a dramatic defect in V H to DJ H rearrangement, along with a lesser but
25 6 significant disruption of D H to J H rearrangement (55, 56). However, mutations in the RAG1 gene caused an overall decreased in efficiency of rearrangement, without any obvious differential effect on D H to J H versus V H to DJ H joining (57, 58). Following RAG-induced DNA breakage, additional nucleotides are randomly added or cleaved by Terminal deoxynucleotidyl transferase (Tdt) or exonucleases at the DNA ends and then joined by DNA ligase IV(. D H to J H gene segments are recombined within the CLP and Hardy Fraction B stage of B lymphopoiesis. The arranged DJ H segments are then joined by the V H region at the Fraction B stage of development (59, 60). Upon an in-frame V(D)J rearrangement at the IgH chain, a pre-bcr comprising the heavy chain protein, the surrogate light chains (VpreB and λ5) and the Igα/Igβ dimer is expressed on the cell surface (61, 62). Only those cells that express a functional pre-bcr can progress further down the developmental pathway. IgH transgenic mice have been used extensively to study recombination and B cell selection (63-65). Mice harboring a deletion of the exons encoding the transmembrane region of the IgH chain (µmt mice) display a developmental arrest at the Fraction B to Fraction C stage transition (66). IgH gene rearrangement is also regulated by the coordinate control of the B cell transcription factor network. E2A and EBF both induce the expression of RAG proteins. Moreover, ectopic expression of E2A and EBF together with RAG recombinases can induce IgH recombination in a nonlymphoid cell line (67, 68). E2A binding sites have been found in the immunoglobulin Eµ enhancer and the protein has been shown to be essential for V(D)J rearrangement (54, 69). Pax5-activated intergenic repeat (PAIR) sequences have been identified in the distal V H gene cluster, indicating that these elements are involved in the regulation of distal V H - DJ H recombination at the IgH locus (70, 71). Altogether, E2A, EBF and Pax5 coordinate V(D)J rearrangement by directly influencing gene expression and by regulating chromatin accessibility (72, 73).
26 7 Functional Responses of CD4 + T Cells The study of peripheral CD4 + T lymphocyte function has been crucial to the understanding of how complex transcriptional pathways are coordinated to control cellular responses to invading microorganisms. CD4 + T cells are activated to proliferate and differentiate once they encounter their cognate antigen on the surface of an antigenpresenting cell (APC). The peripheral CD4 + T cell response is initiated by the binding of the TCR to a major histocompatability complex-ii (MHCII)-antigen structure and the binding of a myriad of coreceptors to their respective ligands on antigen presenting cells (74, 75). Subsequently, these signals are transmitted through the cytoplasm by protein mediators leading to activation of several tightly regulated transcription factors, including nuclear factor of activated T cells (NFAT), nuclear factor kappa-light-chain-enhancer of activated B cells (NF-κB) and activating protein (AP-1) (76-80). These proteins rapidly transcribe interleukin-2 (IL-2), which acts as a cell cycle progression factor to enhance cellular proliferation and promote functional differentiation into CD4 + T-helper (Th) cell subsets (81-85). Th effector cell development has been extensively characterized and is a prime model for studying how transcription factors interact within complex networks to carefully alter gene expression and direct lymphocyte function. The decision for a naïve CD4 + T cell to differentiate into a Th1-cell versus other effector cell types involves upregulation of the transcription factor, T-bet, and increased activation of Stat1 and Stat4 (86). Concurrently, this process requires strong suppression of factors promoting the development of alternate effector lineages, such as the Th2 master regulator Gata3 and the anti-inflammatory cytokine IL-10 (87). Development of Mature CD4 + T Cells Mammalian T cells originate from pluripotent precursors in the bone marrow and fetal liver and develop into several different functional types (88). T cell precursors migrate from the bone marrow into the thymus where they undergo a series of well-
27 8 documented differentiation steps. These events are typically defined based on the cellsurface expression of CD4 and CD8, with thymocytes first starting as CD4 - CD8 - double negative (DN), then becoming CD4 + CD8 + double positive (DP), and lastly maturing into CD4 + or CD8 + single-positive T cells (89-91). During maturation, thymocytes undergo TCR gene rearrangements to assemble TCR:CD3 complexes that will determine their future survival and function (92). Following maturation in the thymus, mature CD4 + and CD8 + T cells migrate into the peripheral lymphoid organs where they circulate in search of their antigenic ligand. T Cell Receptor Signaling The T cell receptor (TCR) consists of antigen-specific α and β chains associated with the CD4 co-receptor and the CD3 complex. Receptor engagement induces phosphorylation of ITAMs in the cytoplasmic tails of CD3ζ subunits by the Src family kinase, Lck, resulting in recruitment of the Syk family kinase Zap-70 (75, 93). Cross- and auto-phosphorylation upregulates Zap-70 kinase activity, which, together with Lck and the Tec kinase Itk, mediates phosphorylation of LAT and SLP-76 (94, 95). LAT and SLP-76 support the formation of a complex containing PLCγ1. The resulting increases in calcium flux and mitogen-associated protein kinase (MAPK) activity induced by PLCγ1 and other pathways lead to the induction of multiple transcription factors that drive the production of numerous cytokines. At least three different families of transcription factors are activated by TCR signaling and their binding to the Il2 promoter upregulates expression of IL-2 protein (84). These factors include the NFAT family of proteins, the NF-κB family and the AP-1 family (96, 97). The activation of each of these transcription factors is stringently controlled in resting CD4 + T cells (96, 98). Prior to TCR engagement, NFAT proteins are sequestered in the cytosol in a highly phosphorylated state with their nuclear localization signals masked. NF-κB proteins are held in the cytosol through their tight association with a
28 9 family of inhibitory proteins, the IκBs, while AP-1 heterodimers are completely absent in resting T cells. Following TCR ligation, intracellular Ca 2+ levels rapidly increase and the phosphatase calcineurin is activated. Activated calcineurin molecules desphosphorylate NFAT proteins, allowing them to translocate into the nucleus (75, 99). TCR signaling events also result in the degradation of the IκB family members that keep NF-κB from moving into the nucleus. Upon activation, IκB proteins are phosphorylated by the IκB kinase (IKK) complex, ubiquitinylated and then trafficked to the proteasome (77, 100). Finally, TCR engagement activates the MAPK pathway that upregulates both c-jun N- terminal kinase-1/2 (Jnk1/2) and p38, which activate c-jun and c-fos, respectively (101). The interaction of c-jun and c-fos proteins results in the formation and activation of AP- 1 (79, 102). TCR-induced production of diacylglycerol (DAG) activates the guanine nucleotide-binding protein Ras, which is required for the activation of the serinethreonine kinase Raf-1. Raf-1 functions to activate the extracellular signal-regulated kinase-1/2 (Erk-1/2). Erk1/2 kinase activity results in the activation of the transcription factor Elk1, which contributes to the activation of AP-1 (75, ). Signaling solely through the TCR results in a non-responsive state called anergy where CD4 + T cells are unable to respond to restimulation (107, 108). Co-ligation of other cell surface receptors such as CD28 provides additional signals required to avoid anergy and elicit a productive CD4 + T cell response (109, 110). Following the binding of CD28 to its ligands CD80 or CD86 on APCs, the protein Akt is activated. Activation of Akt enhances NF-κB nuclear translocation and prolongs NFAT activity at the IL-2 locus (75, 100, 111, 112). The pathways that activate NFAT, NF-B and AP-1 are all induced by TCR ligation alone, but their induction is substantially increased with CD28 coligation. Indeed, CD28-deficient mice exhibit dampened immune responses to a variety of infectious agents ( ). Co-ligation of CD28 molecules on the CD4 + T cell surface during TCR engagement is critical for anergy avoidance and for enhancing the activation of key transcription factors such as NF-κB and AP-1. Thus, multiple signaling
29 10 pathways downstream of TCR ligation orchestrate the induction of key IL-2 transcription factors that will ultimately help determine the fate and function of the peripheral CD4 + T cell. IL-2/IL-2 Receptor Signaling Transcription of IL-2 is rapidly increased in peripheral CD4 + T cells following activation (116). Secreted IL-2 protein binds the IL-2 receptor (IL-2R), which consists of three transmembrane proteins, IL-2Rα, IL-2Rβ and IL-2Rγ (117, 118). Intracellular signaling is mediated by IL-2Rβ and IL-2Rγ, which undergo IL-2-induced heterodimerization followed by activation of the associated tyrosine kinases Jak1 and Jak3 (119). Cell surface expression of the high affinity IL-2Rα subunit is dramatically increased following the initial engagement of the IL-2Rβ and IL-2Rγ subunits (120). Downstream signals arise from Jak1- and Jak3-mediated phosphorylation of tyrosine residues on IL-2Rβ, which creates docking sites for the transcription factor signaling transducer and activator of transcription-5 (Stat5) (121). Stat5, which refers to two highly homologous proteins Stat5a and Stat5b, activates gene expression and promotes peripheral CD4 + T cell proliferation (122, 123). Upon tyrosine phosphorylation, Stat5 dimerizes via its SH2 domain and translocates into the nucleus where it directly transactivates several target genes (124, 125). T cells rendered genetically deficient in Stat5 are unable to proliferate upon TCR and IL-2 stimulation, suggesting that Stat5 is absolutely required for peripheral CD4 + T cell expansion (126). Stat5 Stat5 proteins are activated by a variety of cytokines that affect lymphoid lineages, including IL-2, IL-4, IL-7, IL-9, IL-13 and IL-15. Stat5 is best characterized as a transcription factor that induces expression of c-myc, cyclin D2, cyclin D1, Bcl-x L, bcl- 2, p21 waf1, pim-1, CIS and Il2ra through its C-terminal trans-activation domain (116, 125, ). In the nucleus, Stat5 interacts directly with specific DNA elements through a
30 11 centrally located DNA-binding domain. Studies of Stat5-responsive gene promoters have shown that Stat5 recognizes and binds to canonical interferon gamma-activated site (GAS) sites with the consensus sequence TTCNNNGA (123). Mice lacking expression of both Stat5 proteins display profound defects in peripheral CD4 + T cell survival, growth and proliferation. The inability of CD4 + T cells from Stat5-deficient mice to enter the cell cycle and proliferate is associated with decreased expression of the D-type cyclins and the cyclin-dependent kinase, Cdk6 (126). In addition, loss of IL-2/Stat5 signaling impairs the activation of the Shc/Akt pathway, which is also activated downstream of the IL-2R and plays an important role in promoting CD4 + T cell proliferation (116). Stat5 signaling through the IL-2R regulates IL-2Rα expression, thereby regulating expression of the high affinity IL-2R (120, 122, 130, 131). Therefore, IL-2 controls cellular responsiveness to itself in peripheral CD4 + T cells through the phosphorylation and activation of Stat5. There are two consensus GAS motifs located in two different regulatory elements in the IL-2 enhancer region. Mutation to any one of these binding sites has been shown to diminish the activity of the respective regulatory element. Moreover, IL-2 treatment has been shown to increase the binding of Stat5 proteins to these sites (84). Tight control of Il2ra gene transcription is critical to regulating the peripheral CD4 + T cell responses, as demonstrated by experiments performed on IL-2Rα-deficient mice. Similar to Stat5-deficient mice, mice lacking expression of IL-2Rα display impaired CD4 + T cell proliferative responses and effector functions (132, 133). Thus, Stat5 proteins are an essential part of the positive feedback loop between IL-2R engagement and Il2ra transcription. Socs3 Cytokine receptor pathways are regulated by a family of intracellular cytokineinducible negative feedback regulators called suppressors of cytokine signaling (Socs) proteins. Socs proteins 1-7 and cytokine-inducible SH2-containing protein (CIS)
31 12 comprise the eight members of the Socs family of proteins. All members of the family have a similar tripartite domain organization, composed of a variable N-terminal region, followed by an extended SH2 domain and a conserved C-terminal Socs box domain (134). The Socs box is critical for binding to an E3 ligase complex that targets certain cargo for ubiquitin-mediated degradation (135). Socs proteins can directly interact with either Jak proteins or cytokine receptor subunits to prevent the recruitment and phosphorylation of Stat molecules (136, 137). IL-2/Stat5 signaling has been shown to induce expression of Socs3, which is important for controlling CD4 + T cell activation and modulating CD4 + Th effector cell differentiation (134, 138). The minimal functional Socs3 promoter contains two Stat responsive elements and an AP-1 enhancer region (139). Activation of this promoter through IL-2R signaling involves Stat5 binding to the proximal Stat responsive element (140, 141). Thus, Stat5 and Socs3 interact as part of a tightly regulated negative feedback loop. Stat5, once activated, translocates into the nucleus and drives the expression of Socs3, which acts to inhibit Stat5 phosphorylation and thus, the extent of its transcription. Socs3 has also been shown to interact with phosphorylated CD28 through its SH2 domain, thereby reducing responsiveness to CD28 signaling and inhibiting IL-2 production (138, 142). Socs3 can modulate Th1/Th2 differentiation, mainly through inhibition of Stat4 phosphorylation, favoring the induction of Th2 responses. Thus, high levels of Socs3 expression disrupt the development of CD4 + Th1 effector cells in vitro, resulting in decreased interferon-γ (IFNγ) secretion by these cells (143). However, analysis of Socs3 conditional knockout mice demonstrated normal Th1/Th2 differentiation but revealed an increase in the induction of Th17 cells due to hyperactive Stat3 signaling (144). Cyclin D2 One of the hallmarks of TCR signaling is the production of IL-2, which is largely responsible for CD4 + T cell proliferation and clonal expansion through the autocrine and
32 13 paracrine signaling loop activated by the binding of IL-2 to the high affinity IL-2R. IL- 2/Stat5 signaling is critical to the induction of D-type cyclins, which play a major role in driving cell cycle progression in peripheral CD4 + T cells (126, 145). D-type cyclins are among the first regulatory proteins to appear in the G 1 phase of the cell cycle in response to mitogens. Of the three D-type cyclins, only cyclin D2 and cyclin D3 are expressed in lymphocytes. Cyclin D2 and cyclin D3 protein expression is upregulated in CD4 + T cells stimulated with anti-cd3 or IL-2, but not in CD4 + T cells derived from Stat5-deficient mice. (146, 147). The Cyclin D2 promoter contains a Stat5 binding site that is responsive to IL-2R signaling in T cells (148). The binding of Stat5 to this site is required to achieve full activity of the promoter (147). Cyclin D2 forms a complex with and functions as a regulatory subunit of Cdk4 and Cdk6, whose activity is required for the G 1 /S transition and cell cycle progression (149). Impaired Stat5 activity through the IL-2R results in decreased levels of cyclin D2 induction and perturbs the functional responses of peripheral CD4 + T cells. Differentiation of Th Cell Subsets Upon engagement of the TCR by peptide-mhcii complexes, naive CD4 + T cells proliferate and differentiate into effector cells that can be classified into 4 groups: Th1 cells that produce IFNγ; Th2 cells, which generate IL-4, IL-5, IL-13, and IL-25; Th17 cells that secrete IL-17A, IL-17F, IL-21 and IL-22; and T regulatory (Treg) cells, which produce suppressive cytokines (86, 150). Additional effector CD4+ T cell subsets, such as Th9 and T follicular helper cells, have also been described (151, 152). Th1 cells are important for protective immune responses to intracellular viral and bacterial infection while Th2 cells are critical for host defense against extracellular parasites such as helminths (153). Th17 cells mediate extracellular bacteria and fungi and are responsible for, or participate in, the induction of many organ-specific autoimmune diseases (81, 153).
33 14 Each Th effector subset is associated with a key transcriptional regulator that is either specifically expressed or dramatically upregulated in each of the lineages. The transcription factor, T-bet, is the Th1 master regulator; Gata3 is the Th2 master regulator; Rorγt expression is critical for Th17 differentiation; and, FoxP3 is essential for maintaining the suppressive activity of Treg cells ( ). A major product of CD4 + Th effector cells during the early stages of differentiation is an activating cytokine, such as IFNγ, that provides a strong positive feedback signal enforcing the development of a particular effector subset. For example, during the Th1 differentiation program, CD4 + T cells secrete IFNγ, which activates Stat4 and Th1-specific transcription factors that function to upregulate IFNγ. Jak/Stat signaling pathways are essential to the differentiation process and a specific Stat protein is associated with each of the 4 major transcription factors, T-bet, Gata3, Rorγt, and FoxP3 (81). The study of how these master regulators are orchestrated to reprogram gene expression and how this process fits into the larger network of cytokine receptor signaling is essential to understanding how CD4 + Th cells mount an effective immune response. Activation of Th1 Cell Development The following is a review of the current literature on the transcriptional regulation of Th1 effector cell development focusing on transcription factors that are relevant to this thesis: Stat5 signaling through the IL-2R is crucial for priming the IFNγ locus for transcription (158). Studies have demonstrated that Stat5 binds to several IFNγ regulatory elements and is able to directly induce expression of IFNγ protein ( ). Moreover, it has been shown that Th1 cell development is impaired in both IL-2 -/- and Stat5 -/- T cells (161). These cells also displayed reduced levels of T-bet expression. T- bet protein further upregulates IFNγ expression by binding directly to the primed IFNγ promoter. Engagement of the IFNγ receptor by IFNγ protein results in the phosphorylation and activation of Stat1, which is the major activator of T-bet expression
34 15 (159, 160, 162, 163). Thus, a positive feedback loop between IFNγ and T-bet expression is critical to Th1 differentiation. In the absence of IL-2/Stat5 signaling, T-bet binding to the IFNγ promoter is greatly diminished, as is chromatin remodeling of the IFNγ locus (158, 164). T-bet also induces IFNγ expression indirectly by activating two other Th1 cell-specific transcription factors, Runx3 and Hlx (165, 166). Runx3 drives IFNγ transcription independent of T-bet and has been shown to physically interact with Stat5 (167). Moreover, both T-bet and Runx3 have been shown to support Th1 differentiation by negatively regulating expression of the Th2 cell-specific transcription factor, Gata3 ( ). Overexpression of T-bet in Th2 cells induces them to produce IFNγ and inhibits their production of IL-4. Finally, T-bet-deficient mice display severe defects in Th1 differentiation but still produce some IFNγ (81). APCs produce copious amounts of IL-12 as a result of their activation. Signaling through the IL-12 receptor of the surface of CD4 + T cells activates Stat4, which is important for amplifying Th1 responses ( ). IL-12Rβ2 expression is induced by TCR activation and then maintained by both IL-12 and IFNγ stimulation. In contrast, IL- 12Rβ1 is constitutively expressed on peripheral CD4 + T cells. Stat4 directly induces IFNγ production in activated CD4 + T cells, thereby initiating a feed-forward loop in which IFNγ, acting through T-bet, induces more IFNγ production. Thus, IL-12, through activation of Stat4, induces IFNγ production and sustains IL-12Rβ2 expression (81, 153). Stat4 and T-bet both bind to the IFNγ promoter and optimal binding of one factor requires the presence of the other. In addition, Stat4 and T-bet are required for the chromatin remodeling of the IFNγ locus (86, 162, 175). Consistent with these observations, enforced expression of T-bet in T-bet -/- Stat4 -/- mice did not restore the induction of Th1-specific genes including IFNγ (86, 176).
35 16 Inhibition of Th1 Differentiation Several proteins have been shown to impede the development of Th1 effector cells. Socs3 is a potent inhibitor of both IL-2/Stat5 activity and Stat4 activation through the IL-12R. Consistent with this, elevated levels of Socs3 expression have been shown to inhibit Th1 differentiation in vitro (143, 177). Gata3, the Th2 master regulator, has also been shown to suppress Th1 development via the downregulation of Stat4 (178). In addition, Gata3 has been shown to inhibit the generation of IFNγ-producing cells by repressing the function of Runx3 (170). The anti-inflammatory cytokine, IL-10, has profound effects on CD4 + T cell activation and Th1 cell differentiation. IL-10 inhibits the production of IL-2 and IFNγ by Th1-type effector cells and induces the expression of Socs3 (179, 180). Upon CD4 + T cell activation in vitro, the presence of IL-10 causes these cells to develop a regulatory phenotype (181). Finally, the protein Twist1 has been shown to interfere with the transcriptional network that promotes Th1 cell development (182). Overexpression of this protein correlates with reduced levels of T-bet expression and decreased production of IFNγ in Th1 effector cells. Th1 Cell Function CD4 + Th1 cells mediate immune responses against intracellular pathogens and, in humans, play a key role in resistance to mycobacterial infections. The signature cytokine produced by Th1 cells upon antigen re-encounter is IFNγ, which is important for activating macrophages to increase their microbicidal activity (86). IFNγ has been shown to affect the differentiation of immature myeloid precursors into mature monocytes (183). The cytokine promotes antigen-presenting activity in macrophages by inducing MHC class II expression and increasing levels of intracellular enzymes that are important for antigen processing (184, 185). IFNγ has also been shown to regulate isotype switching and antagonize IL-4-induced MHC class II expression in mature B cells (186, 187). In addition to IFNγ, Th1 effectors secrete lymphotoxin-α (LTα) and IL-2. LTα-deficient
36 17 mice are resistant to experimental autoimmune encephalomyelitis (188). IL-2 production has been shown to be important for the development of CD4 + T memory cells and IL- 2 + IFNγ + cells are regarded as precursors for this memory population (189). In summary, B cell development and CD4 + T cell activation and differentiation are effective models for the study of how transcription factor networks reprogram gene expression to influence cell fate and function. B lymphopoiesis is tightly regulated by E2A, EBF and Pax5, whose expression is precisely orchestrated to activate B lineage genes while repressing alternate lineage genes. The functional responses of peripheral CD4 + T cells require the initiation of several signaling pathways that ultimately activate the key transcriptional regulators NFAT, NF-κB and AP-1. These proteins rapidly transcribe IL-2, which acts as a cell cycle progression factor to enhance cellular proliferation and promote the development of CD4 + Th1 cells. Activation of the Th1 cell transcriptional program involves the upregulation of T-bet and other Th1 cell-specific transcription factors and the concomitant downregulation of proteins that promote alternate Th lineages. These models have been extensively characterized and have helped define how transcription factor networks fit into the larger signaling architecture of each system. However, exactly how these factors are coordinated to influence the overall regulation of each network remains unclear. The characterization of new proteins that function with known transcriptional regulators will help advance the current knowledge of these model systems. Consistent with this aim, a novel mutant strain of mice (Justy mice) displaying defects in B cell development and CD4 + T cell functional responses was studied. Justy mice lack expression of a protein called Gon4l, which is transcribed from the Gon4l gene. The purpose of this dissertation work is to explore the molecular function of Gon4l and determine how loss of this protein influences the transcriptional regulation of B lymphopoiesis and peripheral CD4 + T cell function.
37 18 CHAPTER II THE JUSTY MUTATION DISRUPTS THE LYMPHOID VERSUS MYELOID TRANSCRPTION FACTOR NETWORK AND PROFOUNDLY ARRESTS B CELL DEVELOPMENT Abstract A chemically induced recessive mutation named Justy was identified that specifically abolishes B lymphopoiesis. Transplantation experiments demonstrated that homozygosity for Justy prevented hematopoietic progenitors from generating B cells but did not affect the ability of bone marrow stroma to support B lymphopoiesis. In bone marrow from homozygous Justy mice, Fraction A progenitors appeared normal but cells at subsequent, lineage-committed stages of B lymphopoiesis were dramatically reduced in number. Genetic and molecular analysis demonstrated that Justy is a point mutation within the Gon4l gene, which encodes a protein with homology to transcriptional corepressors. This mutation was found to disrupt Gon4l RNA splicing, which dramatically reduced the expression of wild-type Gon4l RNA and protein. Gon4l was found to interact with the transcriptional co-repressor Sin3a. Consistent with a role for Gon4l in transcriptional repression, the levels of RNA encoding EBF and Pax5 target genes were abnormally high in Justy B cell progenitors. Moreover, haploinsufficiency for Ebf1 in combination with heterozygosity for the Justy mutation disrupted B cell development and impaired repression of non-b lineage genes. Our findings indicate that Gon4l expression is required for B lymphopoiesis and that the Gon4l protein may functionally cooperate with EBF to repress genes that antagonize this process. Introduction Hematopoiesis requires progression of multipotent cells through pathways that restrict developmental potential and promote commitment to a specific lineage fate (4,
38 19 5). These processes are driven by the remodeling of gene expression patterns as orchestrated by a network of transcription factors (5-7). Many components of this network are known but the molecular pathways that coordinate global changes in gene expression, and thus commitment to a specific developmental pathway, are poorly understood. Moreover, disruption of the hematopoietic transcription factor network is intimately linked to proliferative disorders and oncogenesis (190, 191). Thus, further characterization of the mechanisms that regulate hematopoietic lineage fate decisions may lead to a better understanding of how the hematopoietic system is generated and what sustains neoplastic growth in this compartment. Among hematopoietic developmental pathways, B lymphopoiesis has been well defined experimentally (12, 192). During the early stages of B lymphopoiesis, expression of B cell-specific transcription factors results in the suppression of developmental plasticity and commitment to a B-lineage fate (7, 8). This process is accompanied by the activation of lymphoid and B lineage genes and the repression of genes associated with the myeloid and T cell lineages. These changes are enforced by the combined function of the B lineage transcription factors E2A, EBF and Pax5 (15-21). Once bound to DNA, these proteins likely function to recruit protein complexes that mediate transcriptional activation or repression. Transcriptional activation by EBF and Pax5 is facilitated by the chromatin-remodeling complex SWI/SNF (193), while Pax5- mediated repression may involve the co-repressor protein Grg4 (194). However, despite these important insights, the factors and mechanisms that enforce gene activation or repression during the lineage commitment phase of B lymphopoiesis are not well characterized. Analysis of mice bearing random mutations has proven to be an effective approach for identifying genes necessary for immune system development and function (195, 196). The Justy mutation is a chemically induced recessive mutation that profoundly blocks B cell development but has no apparent effect on myeloid or T cell
39 20 development. The mutation profoundly impairs the generation of lineage-committed B cell progenitors and results in unresponsiveness to conditions that promote B- lymphopoiesis and cell proliferation (197). The causal lesion is a point mutation that greatly reduces expression of the Gon4l gene, which encodes a protein capable of modulating transcription in vitro (198). In mutant B cell progenitors, B lineage gene expression was unaffected but regulation of genes that are normally repressed during lineage commitment was perturbed. The aim of the experiments presented in this chapter was to determine the functional relationship between Gon4l and the transcription factor networks that reprogram gene expression during B cell development. Methods Mice C3HeB/FeJ (C3H) and C57BL/6 (B6) wild-type mice. C3H and B6 Justy mice. B6.129S7-Rag1 tm1mom /J (Rag1KO) mice were obtained from Jackson Laboratory (stock #002216). C57BL/6-Tg (IghelMD 4 ) 4 Ceg/J (IgHel) mice were also obtained from Jackson Laboratory (stock #002595). Mutagenesis of Mice and Positional Cloning Introduction of point mutations in the male germline via injection of N-ethyl-Nnitrosourea and the strategy used for positional cloning of mutations have been described previously ( ). Male C3HeB/FeJ (C3H) mice were injected with a dose of n- ethyl-n-nitrosourea (ENU) that, on average, introduces 1 mutation per 2.7 megabasepairs of DNA. These mice were mated to wild-type C3H females and the resulting F1 males were screened by flow cytometric analysis to identify those that lacked peripheral blood abnormalities and were thus potential carriers of recessive mutations. These mice were mated with wild-type C3H females and F2 females were crossed to the F1 founder male to generate F3 progeny that were homozygous for any recessive mutations. Flow
40 21 cytometric analysis identified F3 progeny mice that lacked peripheral blood cells expressing the B lineage marker CD45R/B220 (B220). These mice were backcrossed to wild-type C3H mice and the progeny were used for brother-sister matings. Offspring lacking peripheral blood B220 + cells were again backcrossed to wild-type C3H mice and the progeny were used for a second round of brother-sister matings to recover mice that were homozygous for the mutation (Justy) responsible for the blood phenotype. Bone Marrow Transplantation Adult recipient mice were given 1100 rads of irradiation in a split dose (600 rads followed by 500 rads). 1 hr after the final dose of radiation, 1 x 10 7 red blood celldepleted donor bone marrow cells in 50 ul of sterile PBS were injected into the retroorbital plexus. Transplant recipients were given drinking water containing antibiotic (Baytril) for 3 wks after the transplantation. Recipient lymphoid organs were collected and cell populations analyzed by flow cytometry 8 wks after transplantation. Flow Cytometric Analysis and Cell Sorting Single cell suspensions were prepared from spleen, thymus or bone marrow by removing red blood cells and debris using lympholyte (Cedarlane Laboratories). Cells were resuspended in stain buffer (PBS containing 3% FBS) and incubated with antimouse CD16/32 (ebioscience) to prevent nonspecific antibody binding. Cells were incubated with fluorochrome- or biotin-conjugated antibodies for 30 min on ice and then washed 3 times with ice-cold stain buffer. Optimal antibody concentrations for staining were determined by titration experiments. To label biotin-conjugated antibodies, cells were resuspended in stain buffer plus the appropriate concentration of streptavidin- or avidin-conjugated fluorophore, incubated for an additional 30 min on ice and then washed 3 times with stain buffer. Flow cytometric analysis was performed using an LSR II, FACSDiVa or Aria II (Becton Dickinson) and collected data were analyzed using FlowJo (TreeStar). Cell yields for different fractions were calculated from post-sort
41 22 analysis of collected data. Total events in the appropriate gate were divided by the total events in the forward scatter versus side scatter gate; this percentage was multiplied by the total yield of cells as determined using a hemacytometer. Cell populations were sorted using a FACSDiVa or Aria II. For isolation of splenic follicular and marginal zone B cells or Fraction C, Fraction D and Fraction F cells, total splenocytes or bone marrow cells were stained with the appropriate combinations of antibodies and then sorted. To isolate Fraction A and Fraction B progenitors from bone marrow, a negative selection step was performed prior to sorting. Cells were pre-incubated with CD16/32 and incubated with rat monoclonal antibodies (Ter-119, anti-cd5, anti-ly6c and anti-igm generated in the Waldschmidt or Colgan labs from hybridoma cultures), washed and then incubated with magnetic beads coated with sheep anti-rat antibodies (Dynal). Beads and unwanted cells were removed and remaining cells were stained with antibodies and then sorted. For sort purification, antibodies specific for the following cell-surface markers were used: splenic follicular and marginal zone B cells: B220, CD21 and CD23; Fraction C, Fraction D and Fraction F bone marrow B cells: B220, CD43, IgM and BP-1; Fraction A and Fraction B cells: B220, CD43, CD11c, CD49b, CD19, HSA and BP-1; myeloid, granulocytes and erythroid cells: CD11b, Ter119 and Gr-1. Intracellular staining for phospho-stat5 was performed using a PE-labeled mouse anti-stat5 antibody specific for phosphorylated tyrosine 694 according to the protocol supplied by the manufacturer (Becton Dickinson). Flow Antibodies The following fluorochrome-conjugated antibodies were purchased from the listed sources or generated in the lab of Thomas Waldschmidt (University of Iowa). BioLegend: APC-CD24/HSA (M1/69); ebioscience: APC conjugates: B220 (RA3-6B2), CD3ε (145-2C11); FITC conjugates: CD11b, CD11c (N418), CD49b (DX5); PE conjugates: BP-1 (6C3), CD25 (PC61.5), Ter119; PE-Cy7 conjugates: CD11c (N418),
42 23 CD19 (1D3), BD Biosciences: APC-Thy-1.2 (53-2.1), APC-Cy7-B220 (RA3-6B2), PE-Gr-1 (RB6-8C5), PerCP-B220 (RA3-6B2), Biotin-CD11b/Mac-1 (M1/70), Biotin- CD43 (S7), Biotin-CD49b (DX5); Avidin-Texas Red, Streptavidin Per-CP; Waldschmidt Lab: Cy5-, FITC-, PE- and PE-Cy7-B220 (RA3-6B2), Cy5-Gr-1, FITC- CD3ε (145-2C11), PE-CD4 (GK1.5), Cy5-CD8α (53-6.7), FITC-CD21 (7E9), PE- CD23 (B3B4), Cy5-IgM (B76), FITC-Ly6C. Isolation of Lineage-negative Cells Bone marrow cells from 2-6 mice were depleted of red blood cells and resuspended in PBS containing 1% FBS and 2mM EDTA (PBS/FBS/EDTA). Cells were pre-incubated with anti-cd16/32 and then incubated with rat antibodies specific for mouse B220, CD5, CD19, Gr-1, IgM, Ly6C and Ter-119. Cells were washed twice with PBS/FBS/EDTA and magnetic beads coated with sheep anti-rat antibodies were added (Dynal). Cells bound to beads were removed using a magnet and unbound cells were recovered as lineage-negative (Lin - ) cells. RT-PCR Analysis RNA was isolated using TriZol (Invitrogen) and reverse-transcribed using the SuperScript III First-strand cdna Synthesis Kit (Invitrogen). Conventional PCR was performed using AmpliTaq Gold (Applied Biosystems) and a BioRad MyCycler thermal cycler according to the manufacturers instructions. Quantitative real-time PCR was performed using POWER SYBR Green Master Mix and the ABI PRISM 7700 Detection system (Applied Biosystems) to obtain cycle threshold (Ct) values for target and internal reference cdnas. Ct values correspond to the PCR cycle at which a fluorescent signal due to product accumulation was distinguishable from baseline fluorescence; baseline was determined using fluorescence readings collected during the first cycles of PCR amplification. Target cdna levels were normalized to an internal reference cdna (Hprt) using the equation 2 -[ Ct] Δ, where ΔCt is defined as Ct target Ct internal reference. All
43 24 values shown were derived from the average of 3 or more replicate pairs of PCR reactions (target and internal reference) for each of at least 3 cdna preparations generated from independent cell or tissue samples. Immunoblot Analysis Protein lysates were prepared by resuspending cells in a buffer containing 50mM Tris-HCl ph 8.0, 120 mm NaCl, 0.5% NP-40, 0.2mM sodium orthovanadate, 100mM NaF, 50µg/ml PMSF and protease inhibitors (Roche). After incubation on ice for 30 min, insoluble material was removed by centrifugation and the supernatant was recovered. Proteins were separated by electrophoresis through 7% or 3-8% Nu-PAGE gels (Invitrogen) and transferred to PVDF (Millipore). Membranes were blocked with Tris-buffered saline (TBS with Tween) containing 5% milk. Membranes were then probed with the appropriate antibodies and visualized by chemiluminescence (SuperSignal West Pico, Thermo Scientific). Immunoblot Antibodies Affinity-purified polyclonal anti-gon4l antibodies, anti-flag (Sigma), anti- YY1, anti-myc, anti-hdac1, anti- msin3a and anti-gapdh (Santa Cruz). Donkey antimouse or anti- rabbit IgG HRP (Santa Cruz) was used as secondary antibody. Immunofluorescent Confocal Microscopy 293T cells were transfected, re-plated 24 hrs later onto poly-l-lysine-coated coverslips, and cultured overnight. Cells were fixed with ice-cold methanol and permeabilized with 0.2% Triton X-100 in PBS. After incubation with 5% normal goat serum (Sigma), cells were incubated overnight at 4C with primary antibodies diluted in blocking solution. Cells were washed and incubated with goat anti-rabbit antibodies conjugated to Alexa Fluor 568 and/or goat anti-mouse antibodies conjugated to Alexa Fluor 488, washed and stained with TO-PRO-3 to visualize nuclei. Images were acquired
44 25 using a Zeiss 510 confocal microscope attached to a digital camera. Primary antibodies used were: anti-flag (Sigma, clone M2 or polyclonal F7425) and anti-myc (Santa Cruz, sc-40, clone 9E10). Results Justy Mice are Devoid of B Cells Dr. John Colgan and other members of the laboratories of Drs. John Colgan and Paul Rothman provided all or part of the data presented in Figure 1 and Figures 3-7. These data are annotated within their respective figure legends. The spleens from Justy mice were abnormally small, which correlated with hypoplasia of white pulp regions (Figure 1A). These organs yielded significantly fewer cells (Figure 1B) and flow cytometric analysis demonstrated that the frequency and total number of CD19 + cells obtained from Justy spleens were dramatically lower compared to wild-type (Figure 1C and 1D). These data demonstrate that Justy mice essentially lack peripheral B cells. The total number of CD3 + cells in Justy spleens was decreased by a significant but modest factor of 2. The composition of the bone marrow compartment in Justy mice was also assessed. The average yields of cells obtained from Justy bone marrow was normal (Figure 1E) but the frequency of lymphoid cells in this compartment was decreased concomitant with an increase in the percentage of myeloid cells (Figure 1F), which suggested that bone marrow B lymphopoiesis was impaired by the mutation. The Effect of the Justy Mutation is Intrinsic to Bone Marrow B Cell Progenitors Reciprocal bone marrow transplants were performed to determine whether the absence of B cells in Justy mice is due to a defect that is intrinsic to B cell progenitors or is caused by impairment of a progenitor cell-extrinsic factor such as stromal cell function. Wild-type bone marrow restored hematopoiesis when transplanted into lethally irradiated
45 26 Justy mice. Donor-derived B220 + IgM + cells were detected in bone marrow and spleen, demonstrating that Justy bone marrow stroma supported B cell development (Figure 2A and 2B). The minor host-derived fraction detected in bone marrow lacked B220 + IgM + cells, indicating that the presence of wild-type cells failed to elicit B lymphopoiesis from Justy progenitor cells. Transplantation of Justy bone marrow rescued lethally irradiated wild-type mice. However, the donor-derived bone marrow fraction lacked B220 + IgM + cells, indicating that a wild-type stromal environment could not elicit B lymphopoiesis from Justy progenitors (Figure 2C and 2D). B220 + IgM + cells were detected in the minor host-derived bone marrow compartment, suggesting that Justy cells did not suppress B lymphopoiesis from wild-type progenitors. These data demonstrate that the developmental defect caused by the Justy mutation is intrinsic to B cell progenitors. B Cell Progenitors are Decreased in Justy Mice from the Fraction B Progenitor Stage Onward Comprehensive flow cytometric analysis of bone marrow was performed to define how B lymphopoiesis is affected by the Justy mutation. Surface B220 expression provides a marker for distinguishing B lineage cells from most other cell types in bone marrow. The B220 + subset that expresses low levels of CD43 (B220 + CD43 - ) contains Fraction D, Fraction E and Fraction F progenitor cells. This compartment was decreased by a factor of 300 in Justy bone marrow relative to wild type (Figure 3A and 3B). The B220 + CD43 + bone marrow fraction normally contains Fraction A and Fraction B cells but also includes natural killer (NK) cell precursors and plasmacytoid dendritic cells (pdc). The frequency and total number of B220 + CD43 + cells in Justy were each reduced by a factor of ~2 relative to wild type (Figure 3A and 3B), but these decreases were not statistically significant. To distinguish the 4 populations that comprise the B220 + CD43 + compartment, expression of CD19, the NK marker CD49b (clone DX5) and the pdc markers CD11c and Ly6C was evaluated (Figure 3C). The CD49b - CD11c - Ly6C - CD19 +
46 27 fraction represents Fraction B progenitors while the quadruple-negative fraction consists of Fraction A cells. Relative to wild type, the frequency and total number of Fraction B cells in Justy bone marrow were dramatically decreased, but the frequency and total number of Fraction A progenitors were normal (Figure 3C and 3D). Surface levels of IL-7 receptor α and AA4.1/CD93 on Justy Fraction cells were similar to those on wildtype cells (Figure 3E), indicating that the development of Fraction A progenitors in Justy bone marrow was not grossly perturbed. Collectively, these data demonstrate that B lymphopoiesis in Justy mice is disrupted beginning at the Fraction B stage, which is the point in development at which progenitors become committed to a B lineage fate. The Justy Mutation Disrupts Expression of Gon4l RNA and the Encoded Protein To associate a genetic locus with the disruption of B lymphopoiesis, C3H Justy mice were crossed to wild-type B6 mice and the resulting F1 progeny were interbred. F2 mice were screened for the absence of peripheral B cells and genomic DNA from these mice and control siblings was screened with a panel of PCR primers that amplify simple sequence length polymorphisms (SSLPs) between C3H and B6 and thus define the strain of origin for discrete genomic intervals. This analysis revealed a complete association between the absence of B cells and a 617 kilobase-pair (kb) region on mouse chromosome 3 between SSLPs D3Mit49 and D3Mit175 (positions and in chromosome 3; UCSC assembly, July 2007). These SSLPs were utilized to transfer the candidate region into the B6 background via serial backcrossing. B6 mice at backcross 10 were intercrossed, generating offspring that were homozygous for the candidate region with Mendelian frequency. Flow cytometric analysis of bone marrow from these mice showed that B lymphopoiesis was blocked in a manner identical to that seen in the original mutant strain (data not shown), demonstrating that the causal mutation was within the transferred region.
47 28 The candidate region contains 13 genes (Figure 4A). Q RT-PCR analysis of RNA from lineage-negative (Lin - ) cells isolated from bone marrow showed that all these genes were expressed at normal levels in Justy cells except for the Gon4l gene, which was expressed at ~2-fold lower levels in Justy cells relative to wild-type (Figure 4B). Sequence analysis showed that the Gon4l promoter (-2 kb through exon 1) was not altered in the Justy genome. RT-PCR analysis was used to define the structure of Gon4l mrnas expressed in wild-type and Justy cells, which revealed a striking difference (Figure 4C). Primers targeting exons 24 and 26 amplified a 446 base-pair (bp) product from wild-type cdna that had the expected sequence. The same product was amplified from Justy cdna but the amount obtained was generally lower. In addition, PCR amplification of Justy cdna gave rise to a prominent and unique 527 bp product that contained an 81 bp sequence inserted between exons 24 and 25. BLAT analysis (UCSC Genome Browser) showed that the insertion was derived from the intron between Gon4l exons 24 and 25 (i.e. intron 24). The data described above posited that intron 24 of Gon4l in Justy mice contains a mutation that causes the 81 bp sequence to be recognized as an exon. Sequence analysis of the Justy genome identified a T to A substitution immediately downstream of the 81 nt sequence that increases homology between the adjoining region and the consensus donor pre-mrna splice site (Figure 4D). The sequence of the 527 bp Justy-specific PCR product confirmed that this region is used as a donor splice site, causing the 81 nt sequence to be fused to exon 25. The sequence of the 527 bp product also showed that a cryptic acceptor splice site in intron 24 mediates fusion of the 81 nt sequence to exon 24 during splicing of Gon4l pre-mrna. Notably, inclusion of the 81 nt sequence into Gon4l mrna places two premature termination codons into the open reading frame. However, the encoded protein was not detected by immunoblot analysis of Justy cell lysates using antibodies capable of recognizing it (data not shown). This result suggests that inclusion of the 81 nt sequence and thus the premature termination codons activates
48 29 the nonsense-mediated decay RNA surveillance pathway (202), which would prevent translation of the encoded protein and decrease the level of aberrantly spliced Gon4l mrna to some extent. How aberrant splicing of Gon4l mrna affects protein expression in Justy cells was evaluated. Because it was not feasible to assess Gon4l protein levels in Justy B- lineage cells another cell type that expresses Gon4l was sought. Immunoblot analysis of thymocyte lysates using antibodies raised against the C-terminus of Gon4l showed that wild-type cells express the Gon4l protein and that level of this protein expressed in Justy cells was greatly reduced (Figure 4E). To correlate this effect with aberrant Gon4l RNA splicing, Q RT-PCR analysis of thymocyte RNA was performed using a primer pair specific for Gon4l RNA containing the 81 nt insertion and a pair specific for wild-type Gon4l RNA (Figure 4F). Aberrantly spliced RNA was expressed at robust levels in Justy thymocytes but was not detectable in wild type. Expression of wild-type Gon4l RNA was observed in both wild-type and Justy thymocytes but the level detected in Justy cells was 10-fold lower than that in wild type. These data demonstrate that the Justy mutation results in aberrant splicing of Gon4l mrna, which consequently greatly reduces expression of wild-type Gon4l mrna and thus the encoded protein. Wild-type Gon4l RNA Levels are Decreased in Justy B Cell Progenitors Whether Gon4l RNA and protein are expressed in B cell progenitors was determined. Q RT-PCR analysis of RNA from sort-purified wild-type cells showed that Gon4l RNA is expressed at all stages of B lymphopoiesis and at elevated levels in cells at the later stages of development (Figure 5A). In contrast, monocytes, granulocytes and erythroid cells expressed low levels of Gon4l RNA. To assess Gon4l protein expression, wild-type pro-b cells were generated in culture and lysate from these cells was immunoblotted with anti-gon4l antibodies (Figure 5B), which demonstrated that Gon4l
49 30 was present. Q RT-PCR analysis was performed to determine the levels of wild-type and aberrantly spliced Gon4l RNA in sort purified Fraction A and Fraction B progenitors (Figure 5C). Similar to thymocytes, aberrantly spliced Gon4l RNA was detected only in Justy B cells. Wild-type Gon4l RNA was detected in both wild-type and Justy cells but the levels in Justy Fraction A and Fraction B cells were reduced by factors of 40 and 20, respectively, relative to wild-type. These data indicate that the Justy mutation dramatically reduces the levels of wild-type Gon4l mrna expressed in Justy B cell progenitors, an effect demonstrated to greatly decrease Gon4l protein expression. The Gon4l Protein Co-localizes with Sin3a and HDAC1 Two regions near the C terminus of Gon4l bear strong homology (E values of 2.2 and 3.4 x ) to the consensus paired amphipathic helix (PAH) repeat sequence, which forms a 4-helix bundle with a hydrophobic cleft (203) (Figure 6A). The mammalian transcriptional co-repressors Sin3a and Sin3b each contain 4 PAH repeats, which mediate interactions with chromatin-modifying factors or DNA-binding proteins (204). It has been shown that the lack of Gon4l impairs gene repression in B cell progenitors (197). Because protein complexes containing HDACs are critical for gene repression, it was determined whether Gon4l, Sin3a, and HDAC1 expressed in M12 cells could interact. Nuclear extracts were prepared from M12 cells and used to perform coimmunoprecipitation experiments with control IgG and Sin3a antibodies (Figure 6B). As expected, HDAC1 was specifically recovered with Sin3a. In addition, Gon4l was recovered with Sin3a, indicating the two proteins associate in M12 cells. Next, it was determined whether Sin3a and Gon4l could interact when expressed from plasmids in transfected cells. An expression plasmid encoding Myc-Sin3a was cotransfected into 293T cells together with that encoding FLAG-Gon4l. Lysates were prepared from transfected cells and used to perform IPs with control IgG and anti-flag antibodies. Immunoblot analysis of recovered material demonstrated that Sin3a was co-
50 31 immunoprecipitated with Gon4l (Figure 6C). We also determined whether Gon4l and Sin3a co-localize in cells. Expression plasmids encoding FLAG-Gon4l or Myc-Sin3a were transiently co-transfected into 293T cells, which were then stained with antibodies that recognize the FLAG or Myc epitope tags. Immunofluorescent confocal microscopy analysis showed that both Sin3a and Gon4l localized almost exclusively to the nucleus (Figure 6D). These data show that there is substantial overlap between the localization patterns of Gon4l, Sin3a and HDAC1. Further analyses have shown that the Gon4l protein forms a complex with Sin3a, HDAC1 and YY1 and is able to repress transcription of nearby promoter when tethered to DNA (198). Justy B Cell Progenitors Fail to Repress Expression of Genes That Antagonize B Lymphopoiesis Q RT-PCR analysis was performed to assess the impact of the Justy mutation on gene expression in B cell progenitors. The development of lineage-committed Fraction B progenitors requires the transcription factors E2A, EBF and Pax5. Justy Fraction A and Fraction B cells expressed normal levels of E12, E47 and EBF RNA, while Pax5 RNA levels were normal in Justy Fraction A cells and modestly elevated in Justy Fraction B cells (Figure 7A). These data suggest that decreased expression of E2A, EBF or Pax5 is not responsible for the Justy phenotype. B lineage commitment also coincides with repression of genes encoding factors that antagonize B lymphopoiesis; these include the genes encoding the transcription factors PU.1 and C/EBPα, which can both inhibit B lymphopoiesis and bias cells toward macrophage development when expressed at inappropriately high levels in certain cells (46-48, 205). Q RT-PCR analysis showed that, in Justy Fraction A cells, the level of RNA encoding PU.1 was normal while the level of RNA encoding C/EBPα was significantly elevated (~3.5-fold; p value < 0.025) relative to that in wild type cells (data not shown). In Justy Fraction B progenitors, the level of RNA encoding either PU.1 or C/EBPα was significantly elevated relative to
51 32 wild-type cells, with C/EBPα RNA being increased by a relative factor of ~20 (Figure 7B). Consistent with these data, RNA encoded by the PU.1 and C/EBPα target gene Csf1r (c-fms) was expressed at abnormally high levels in Justy Fraction B cells (Figure 7B). The level of RNA encoding the HLH proteins Id2, Stra13 (also called Dec1) and Mist1 were increased in Justy cells relative to wild-type (Figure 7C). Studies of Id2 have demonstrated that this protein antagonizes B cell development and can strongly suppress this process when overexpressed (43). In addition, both Stra13 and Mist1 have been shown to interfere with B lymphopoiesis (206, 207). Finally, the level of RNA encoding the cell adhesion protein Embigin, defined as a key myeloid lineage marker (52), was dramatically higher in Justy Fraction B progenitor cells relative to wild-type cells (Figure 7D). These data show that Justy Fraction B cells express abnormally high levels of several RNAs encoding proteins known to perturb B lymphopoiesis and/or be myeloid lineage markers. Thus, loss of Gon4l expression likely impairs mechanisms required for gene repression during B lineage commitment. Aberrant Regulation of IgH Expression is Not the Dominant Mechanism Causing the Arrest in B Cell Development in Justy Mice Developing B cells must productively rearrange the IgH locus to generate functional BCRs. This process is controlled in part by the B cell transcription factor network (12-14). In the first phase of IgH gene rearrangement, D and J H segments are joined and are detectable in Fraction-A progenitor cells. Ming-Yi Chiang from the lab of Dr. John Colgan characterized DJ H joints of sort-purified wild-type and Justy Pro-B cells using standard non-quantitative PCR analysis. Her analysis revealed that DJ H joints were formed in Justy cells, but analysis of cloned PCR products showed that the sequence diversity was greatly restricted in these joints, relative to wild-type (data not
52 33 shown). In fact, the sequence of each PCR product was identical. However, cloned PCR products from wild-type cells each encoded a unique sequence. This suggests that Gon4l plays a role in regulating the IgH locus. To determine if dysregulation of the IgH locus has a role in the Justy phenotype, B6 Justy mice were crossed to either B6 IgHel transgenic mice or B6 Rag1-deficient mice to enforce or prevent expression of functionally rearranged IgH protein. Flow analysis of total bone marrow cells from Justy/IgHel mice demonstrated that enforced expression of rearranged IgH molecules did not rescue the developmental defect caused by the Justy mutation, as determined by the frequency of B220 + IgM + cells in Justy/IgHel and control bone marrow preparations (Figure 8A). Flow analysis of total bone marrow from Justy/Rag1-deficient mice showed that preventing IgH recombination did not rescue the Justy phenotype, as determined by B220 versus CD43 expression in Justy/Rag1-deficient and control bone marrow preparations (Figure 8B). These data show that neither enforcing nor preventing recombination affects the Justy phenotype. Thus, aberrant regulation of IgH expression is not the dominant mechanism for the developmental defects caused by the Justy mutation. Gon4l and Ebf1 Functionally Cooperate to Promote B Cell Development Studies by others have identified genes that are targets for regulation by EBF (19, 33, 35, 43). Comparison of data from these studies and gene expression analysis from Justy B cell progenitors identified several non-b lineage genes expressed at abnormally high levels in both Justy and Ebf1-deficient Fraction B cells (197). In addition, genes that are direct targets for repression by EBF are expressed at elevated levels in Justy mutant Fraction B progenitor cells. Comparison of published data and data from our lab support the hypothesis that EBF and Gon4l function together to repress expression of non-b lineage genes during B lymphopoiesis. Haploinsufficiency for Ebf1 alone or in
53 34 combination with haploinsufficiency for Runx1 has been shown to impair B cell development and gene regulation (34, 35). Ebf1 +/- Gon4l +/Jsty mice were generated to determine how B lymphopoiesis was affected by combining haploinsufficiency for Ebf1 (Ebf1 +/- ) with heterozygosity for the Justy mutation (Gon4l +/Jsty ). Bone marrow cell yields from Ebf1 +/- Gon4l +/Jsty mice were significantly reduced compared to those from wild-type mice or singly haploinsufficient mice, correlating with significant reductions in the frequencies and number of B220 + CD43 - progenitors (Figure 9A and 9C). Further analysis demonstrated a dramatic and significant decrease in the total number of Fraction E progenitor cells from Ebf1 +/- Gon4l +/Jsty mice relative to the other tree genotypes (Figure 9B and 9D). To determine how expression of genes predicted to be targets for both EBF and Gon4l was affected by compound haploinsufficiency, Q RT-PCR analysis was performed on RNA from sort-purified Fraction E progenitors. The analysis showed that expression of RNAs encoding C/EBPα and Embigin were elevated in compound haploinsufficient Fraction E cells compared to cells from mice of the other three genotypes (Figure 10B). Importantly, singular haploisufficiency for Ebf1 or Gon4l reduced levels of RNA for the encoded protein, but combining the mutations did not exacerbate these effects (Figure 10A). These data indicate that impaired regulation of EBF target genes is not secondary to disruption of cross-regulation between Ebf1 and Gon4l. Rather, these data suggest that Gon4l and EBF functionally cooperate to regulate gene expression during B cell development. Discussion The cellular and molecular phenotypes caused by the Justy mutation support the conclusion that decreased Gon4l expression disrupts mechanisms required for B lineage commitment. Chemical induced mutagenesis introduced a point mutation into intron 24 of the Gon4l gene, resulting in aberrant spliced Gon4l RNA reduced expression of the
54 35 encoded protein. Loss of Gon4l expression correlated with a developmental arrest at the Fraction A to Fraction B transition of B lymphopoiesis. The Justy mutation caused an insertion of two in-frame pre-mature stop codons into Gon4l RNA; however, a truncated version of the Gon4l protein was not detected. This suggests that the Justy phenotype is not due to expression of a dominant negative form of the Gon4l protein, which is consistent with the recessive inheritance pattern of the mutation. Altogether, increased levels of aberrantly spliced Gon4l RNA correlated with decreased levels of wild-type Gon4l RNA and Gon4l protein in Justy cells. Orthologs of the Gon4l gene can be identified in vertebrate genomes and in some plant and invertebrate genomes, suggesting that the gene arose in higher eukaryotes and has been conserved with evolution (208). Genetic studies of the zebrafish Gon4l homolog Udu showed that homozygosity for loss-of function Udu alleles results in morphologic abnormalities during embryogenesis and death within 10 days after conception (209, 210). In addition, loss of Udu was shown to disrupt primitive erythropoiesis in a cell-intrinsic manner. Analysis of zebrafish, rat and human tissues suggests that Gon4l RNA has a broad expression pattern (208, ). While Gon4l RNA and protein are expressed in B-lineage cells in mice, it seems likely that Gon4l is not strictly a B lineage-specific factor. This possibility raises the question of why the effect of the Justy mutation appears restricted to the B cell compartment. One possibility is that the relative importance or functional role of Gon4l varies between different cell lineages and tissues. Another factor that could contribute to the specificity of the phenotype is the variable penetrance of the mutation between tissues. Consistent with this idea, the extent of aberrantly spliced Gon4l RNA and thus the relative decrease in wild-type Gon4l RNA is different in C3H mouse brain, heart, lung, kidney, liver, spleen, thymus and bone marrow (197). Thus, the Justy mutation has likely created a conditional loss-of function allele of Gon4l rather than one with complete and constitutive loss of function.
55 36 The progression of B cell development requires the activation of key B lineage genes. Surprisingly, E2A, EBF and Pax5 RNA were all expressed at normal or slightly elevated levels in Justy Fraction A and Fraction B bone marrow progenitor cells. This suggests that the developmental block observed in Justy mice is not due to abnormal expression of B lineage transcription factors and that expression of these factors may not be sufficient to drive B lymphopoiesis. In addition to regulating the expression of B lineage genes, the B cell transcription factor network functions to repress alternate lineage genes and thus facilitate lineage commitment. Overexpression of several of these genes, including PU.1, Cebpα and Id2, has been shown to promote myeloid development and suppress B lymphopoiesis (43, 46-48, 51). Consistent with the idea that Gon4l is important for the repression of non-b lineage genes, the Gon4l protein co-localizes with the transcriptional co-repressor Sin3a. Moreover, Gon4l has been shown to form a complex with Sin3a, HDAC1 and YY1 and is able to repress transcription in an in vitro system (198). Thus, Gon4l likely mediates the repression of non-b lineage genes at least in part as a component of protein complexes that contain Sin3a Genetic crosses of mutant mouse strains is a powerful tool for exploring how two genes functionally cooperate with each other in a living animal. Ebf1 +/- Gon4l +/Jsty mice were generated to determine how B lymphopoiesis was affected by decreasing the dosage of Ebf1 and Gon4l. The analysis showed that expression of RNAs encoding C/EBPα and Embigin were elevated in compound haploinsufficient progenitor cells relative to wildtype or singly haploisufficient cells. Thus, Gon4l and EBF likely cooperate during B cell development, further establishing a role for both proteins in within the transcription factor networks that control gene expression during B lymphopoiesis. Finally, Justy mice were crossed with either IgHel transgenic mice or Rag1-deficient mice to determine if preventing or enforcing recombination would rescue or alter the Justy phenotype. However, analysis of bone marrow and splenocytes from Justy IgHel mice or Justy Rag1-
56 37 deficient mice showed that B lymphopoiesis did not progress beyond the Faction-A stage. Thus, whether or not Gon4l plays a role in regulation the IgH locus remains unclear.
57 38 Figure 1. Justy mice lack B cells. (A) Spleens and hematoxylin/eosin-stained spleen sections (100 magnification). Bars: (left) 1 cm; (right) 225 µm. (B) Cell yields from wild-type and Justy spleens. (C) Flow cytometric analysis of splenocytes. (D) CD19 + cell yields from splenocyte preparations. (E) Leukocyte yields from bone marrow cell preparations. (F) Flow cytometric analysis of bone marrow cells. Horizontal bars in B, D, and E indicate mean cell count. Data in C and F are representative of five independent experiments. All data presented in this figure were provided by Dr. John Colgan and other members of the laboratories of Drs. John Colgan and Paul Rothman.


58 39
59 40 Figure 2. The Justy mutation intrinsically affects hematopoietic progenitors. (A and C) Diagrams of bone marrow transplants performed. (B) Flow cytometric analysis of bone marrow from a Justy mouse that received CD45.1+ wild-type bone marrow. (D) Flow cytometric analysis of bone marrow from a wild-type mouse that received CD45.2+ Justy bone marrow. Data in B and D are representative of two independent transplantation experiments, each involving three recipients that received pooled bone marrow from two donors. Special thanks to Dr. Thomas Waldschmidt and the members of his laboratory that trained me and guided me through the experiments that helped generate these data.

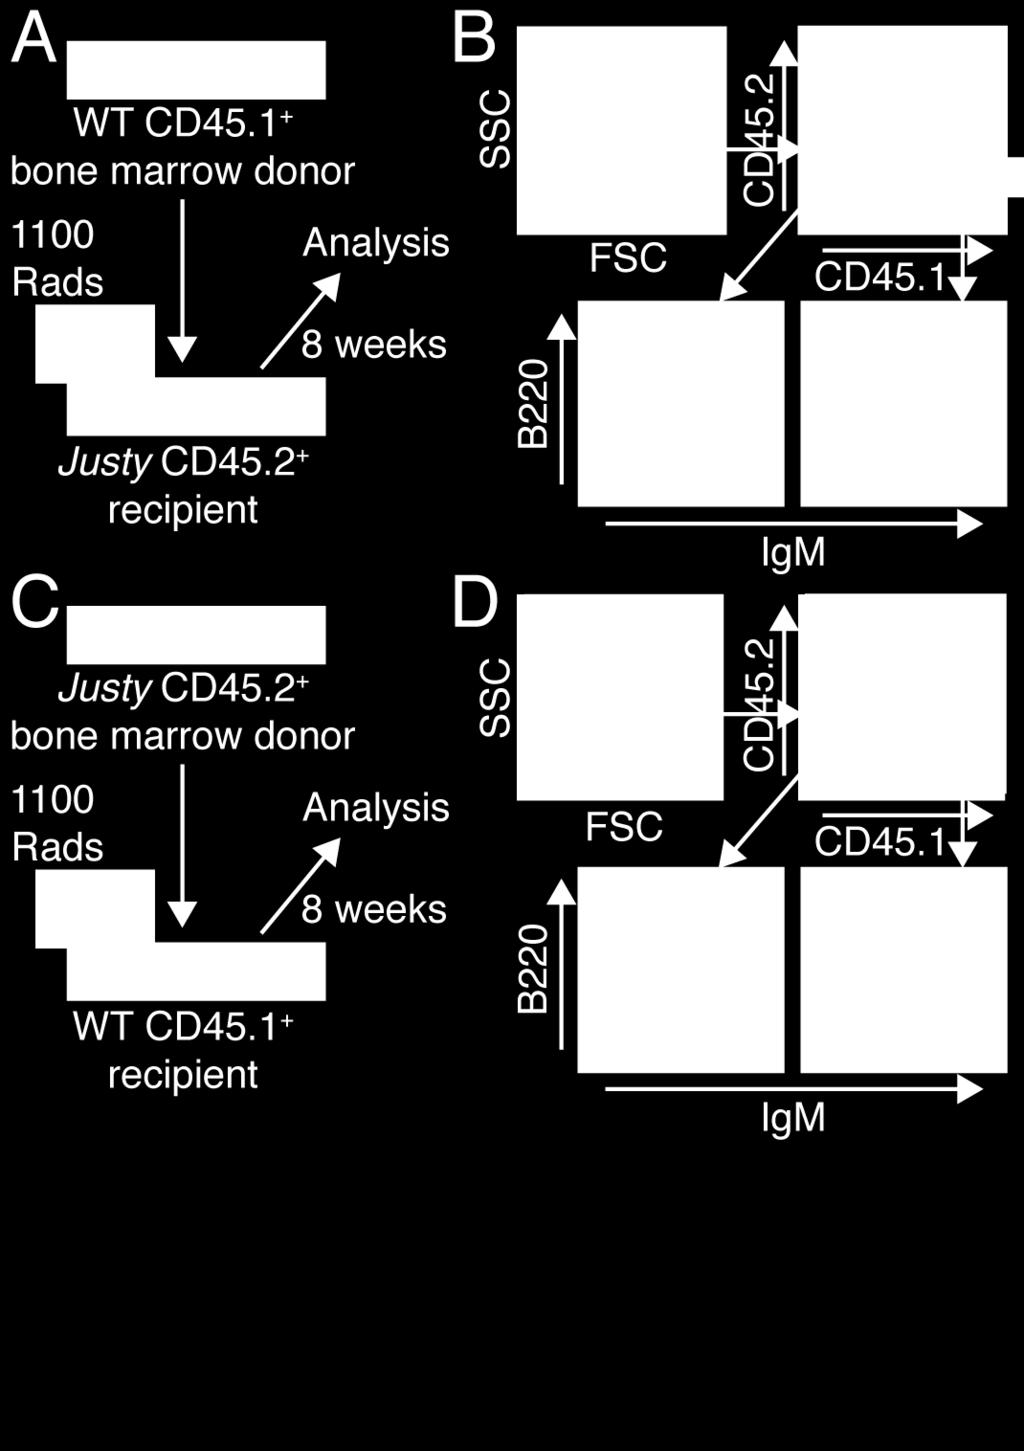
60 41
61 42 Figure 3. B lymphopoiesis in Justy mice arrests at the early Fraction B cell stage. (A) Flow cytometric analysis of bone marrow. The B220 + CD43 gate contains Fraction D and Fraction E cells; the B220 + CD43 + gate contains Fraction A, Fraction B and Fraction C progenitors, NK cell precursors, and pdcs. (B) Yields of B220 + CD43 and B220 + CD43 + cells from bone marrow. (C) Flow cytometric analysis of B220 + CD43 + cells (right gate in A). Fraction B cells are in the CD19 + Ly6C CD11c CD49b gate; Fraction A cells are in the quadruple-negative gate. (D) Yields of Fraction B and Fraction A cells from bone marrow. (E) Flow cytometric analysis of Fraction A cells (from gate in C). All of the data in A-D and part of the data in E were provided by other members of the laboratories of Drs. John Colgan and Paul Rothman.

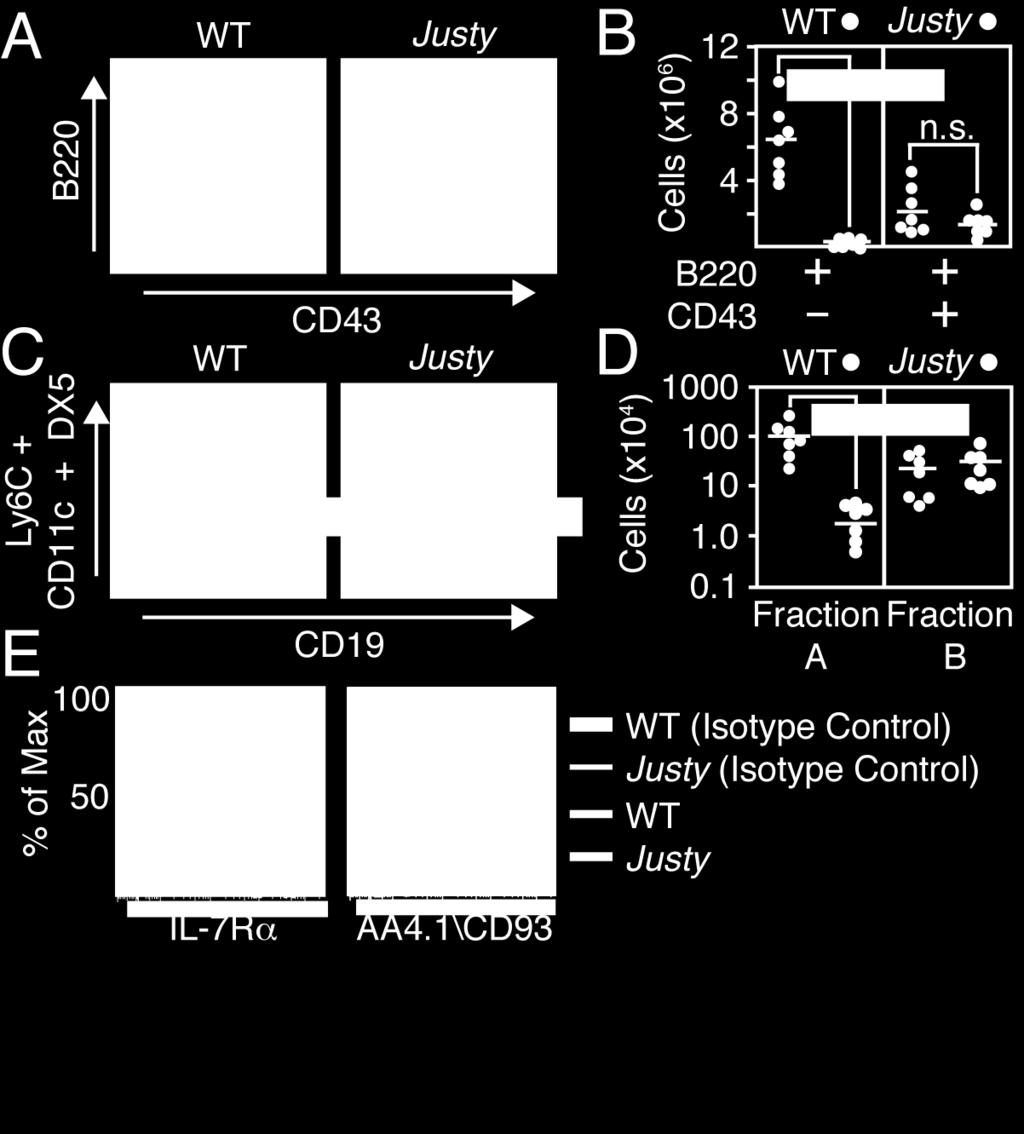
62 43
63 44 Figure 4. The Justy mutation disrupts synthesis of RNA and protein from the Gon4l gene. (A) Schematic showing the region of mouse chromosome 3 containing the Justy mutation. (B) Q RT-PCR analysis of gene expression in lineage-negative bone marrow cells. Three independent sets of wild-type and Justy cells were analyzed and values for each RNA were normalized to that for Hprt. Ratios between Justy and wild-type values (Justy/WT) were calculated for all RNAs. Shown are the ratio means and standard deviations from the three sets. (C) Schematic (top) of a portion of the Gon4l gene and the primers used for RT-PCR. The red asterisk denotes the Justy mutation. The black box represents the 81-bp insertion found in the 527-bp Justy-specific PCR product. Agarose gel (center) shows products from PCR amplification of cdna from the indicated organs. BM, bone marrow. Structures of the Gon4l products seen are diagrammed (bottom). Hprt cdna amplification indicated that all samples contained similar amounts of total cdna. (D) Schematic shows that the Justy mutation (labeled) increases homology to the consensus donor splice site sequence. The same region from wild-type Gon4l is shown. Red ovals denote matches to the consensus splice site sequence. (E) Immunoblot of thymocyte lysates using Gon4l antibodies. Immunoblot for β-actin confirmed equal protein loading. Lysates from 293T cells transfected with a Gon4l expression plasmid (+) or empty vector ( ) were used as controls. (F) Q RT-PCR analysis of aberrantly spliced and wild-type forms of Gon4l RNA in thymocytes. Diagrams at the top show the location of the PCR primers used relative to the Gon4l cdna that was amplified. In the left graph, the wild-type value is relative to the Justy value, which was set at 1. In the right graph, the Justy value is relative to the wild-type value, which was set at 1. Error bars indicate standard error of the mean. All data are representative of three independent. All of the data in C-E and part of the data in F were provided by other members of the laboratories of Drs. John Colgan and Paul Rothman.


64 45
65 46 Figure 5. The Justy mutation affects wild-type Gon4l expression in B cell progenitors. (A) Q RT-PCR analysis of Gon4l RNA in B cell fractions. PCR primers used targeted exon 33 and the 3 UTR of Gon4l RNA. Values shown are normalized to Hprt values. (B) Immunoblot of wild-type Fraction B cell lysate probed with Gon4l antibodies. Asterisk denotes full-length Gon4l. Lysate from the mouse B cell line M12 was included as a control. Probing for GAPDH confirmed equal protein loading. (C) Q RT-PCR analysis of aberrantly spliced and wild-type forms of Gon4l RNA in B cell progenitors. For the left graph, each value is relative to the Justy Fraction A cell value, which was set at 1. For the right graph, each value is relative to the wild-type Fraction A cell value, which was set at 1. All of the data in B and C were provided by other members of the laboratories of Drs. John Colgan and Paul Rothman.


66 47
67 48 Figure 6. Gon4l co-localizes with the corepressors Sin3a and HDAC1. (A) Schematic of the Gon4l protein. Structural motifs noted are described in the introduction of this dissertation. (B) Co-immunoprecipitation of Gon4l, Sin3a, and HDAC1 from M12 cell nuclear extracts (NE). Sin3a antibodies and nonspecific IgG were used to IP proteins from M12 NE. Recovered material was immunoblotted with antibodies specific for Gon4l (top panel), Sin3a (middle panel), or HDAC1 (bottom panel). M12 NE was used as a positive control for immunoblots. (C) Coimmunoprecipitation of FLAG-Gon4l and Myc-tagged Sin3a (Myc-Sin3a) expressed in transfected 293T cells. Anti-FLAG and nonspecific IgG were used to immunoprecipitate proteins from 293T WCLs. Recovered material was immunoblotted with antibodies specific for the FLAG or Myc epitopes to detect FLAG-Gon4l (top panel) and Myc- Sin3a (bottom panel), respectively. The wedges at the top of the blots signify that serially increased amounts of sample were loaded. 293T WCLs were used as control for immunoblots. (D) Co-localization of Gon4l and Sin3a in the nucleus. The images shown were obtained by immunofluorescent confocal microscopy of 293T cells expressing FLAG-Gon4l and Myc-Sin3a from transfected plasmids. 293T cells transfected with expression plasmid lacking a cdna insert were used as a control (data not shown). The cells were stained with anti-flag and anti-myc antibodies and then with the nuclear stain TO-PRO-3 as noted at the top of the panel. Yellow color in the merged images signifies co-localization of FLAG-Gon4l and Myc-Sin3a. The upper and lower sets of panels are each from an independent experiment. All of the data shown are representative of at least three independent experiments. MW, molecular mass. All of the data in B and C were provided by other members of the laboratories of Drs. John Colgan and Paul Rothman.


68 49
69 50 Figure 7. Decreased expression of Gon4l impairs gene repression in B cell progenitors. (A) Q RT-PCR analysis of RNA encoding the indicated proteins in B cell progenitors. For all RNAs, values are plotted relative to the wild-type Fraction A cell value, which was set at 1. (B-D) Q RT-PCR analysis of the indicated RNAs in early Fraction B cells. Each Justy value is relative to the wild-type value, which was set at 1. All data are representative of three independent experiments. Error bars indicate standard error of the mean. All of the data in A and B were provided by other members of the laboratories of Drs. John Colgan and Paul Rothman.

70 51
71 52 Figure 8. Neither preventing nor enforcing expression of rearranged IgH protein rescues B cell development in Justy mice. Flow cytometric analysis of total bone marrow cells from femurs and tibias of (A) wild-type, Justy, IgHel and Justy/IgHel mice; or (B), wild-type, Justy, Rag1- deficient (Rag1 -/- )and Justy/Rag1-deficient mice. The B220 + IgM + gate contains Fraction E progenitors, also known as immature B cells; the B220 hi CD43 gate contains Fraction F cells, the B220 + CD43 gate contains Fraction D and Fraction E cells; the B220 + CD43 + gate contains Fraction A, Fraction B and Fraction C progenitors, NK cell precursors, and pdcs. Frequencies of cells in each gate are shown. Data in A is from one experiment and data in B is representative of two independent experiments. WT is wild type.


72 53
73 54 Figure 9. B cell development is impaired in Ebf1 +/- Gon4l +/Jsty mice. Flow cytometric analysis of bone marrow cells from mice of the genotypes shown. (A) The B220 hi CD43 gate contains Fraction F cells, the B220 + CD43 gate contains Fraction D and Fraction E cells; the B220 + CD43 + gate contains Fraction A, Fraction B and Fraction C progenitors, NK cell precursors, and pdcs. (B) The B220 + IgM + gate contains Fraction E progenitors; the B220 + IgM - gate contains Fraction A through Fraction D progenitors. Frequencies of cells in each gate are shown. (C) B220 hi CD43, B220 + CD43 and B220 + CD43 + cell yields from bone marrow preparations. (D) Fraction D and Fraction E cell yields from bone marrow preparations. Horizontal bars in C and E indicate mean cell count. Data in A are representative of five independent experiments. Data in B are representative of 3 independent experiments. * denotes P value equal to or less than 0.05; ** denotes P value equal to or less than P values shown were obtained using Student s t test. WT is wild type.

74 55
75 56 Figure 10. Compound haploinsufficiencies of Ebf1 and Gon4l impairs repression of non- B lineage genes. Q RT-PCR analysis of EBF and Gon4l transcripts (A) or transcripts predicted to be common targets for EBF and Gon4l (B) from sort-purified Fraction E cells isolated from mice of the indicated genotype. Data in A are the average of three independent experiments. Data in B are representative of three independent experiments. Each value in B is relative to the wild-type value, which was set at 1. WT is wild type.

76 57
77 58 CHAPTER III LOSS OF GON4L EXPRESSION IMPAIRS PROLIFERATIVE RESPONSES OF PERIPHERAL CD4 + T LYMPHOCYTES Abstract Analysis of the Justy mutation revealed that the protein Gon4l is required for B lymphopoiesis and gene repression. However, the role of Gon4l in other immune cell types was not determined. The Justy mutation was found to affect the maintenance and function of the mouse CD4 + T cell compartment. Expression of Gon4l protein and RNA is dramatically decreased in Justy mutant peripheral CD4 + T cells. Functional analyses demonstrate that these cells display multiple signaling defects that perturb their proliferative responses. Decreased Gon4l protein expression in CD4 + T cells correlated with impaired activation of Stat5 following stimulation through the IL-2 receptor and decreased levels of IL-2 production following stimulation through the TCR:CD3 complex. These defects resulted in a reduced induction of the Stat5 target gene Cyclin D2, which is necessary for cell cycle entry by CD4 + T cells. Consistent with the proposed role of Gon4l as a transcriptional repressor, loss of Gon4l protein resulted in elevated levels of Socs-3 expression in CD4 + T cells. High levels of Socs-3 expression have been shown to inhibit Stat5 activation and impede CD4 + T cell proliferation. Together, our data suggest that Gon4l plays a role in the regulation of Socs-3 expression in CD4 + T cells, and thus indirectly regulates the extent of IL-2-induced Stat5 activation and proliferation. Introduction Lymphocyte proliferation and differentiation following antigen stimulation lie at the center of the adaptive immune response (75). An initial phase of clonal expansion is essential for generating adequate numbers of specific effector cells to defend against the
78 59 early stages of an infection (213). This is followed by a contraction phase, where cell numbers are reduced by apoptosis, leaving behind memory cell populations to protect against future infections (97, 214). The process involves a complex array of signaling events that are initiated by engagement of cell surface receptors and result in the activation of numerous transcriptional regulators (75). The expression and activity of the proteins that mediate these events determine the number of cells that are activated to go into the cell cycle as well as the rates at which the cells divide and die (215, 216). Small changes in any one or combination of these parameters may result in substantial changes in the number of cells produced and thus the number of differentiated effector cells (217). CD4 + T cells originate from pluripotent precursors in the bone marrow and then migrate into the thymus where they undergo a series well-characterized of differentiation steps (89-91). Following maturation in the thymus, CD4 + T cells migrate into the peripheral lymphoid organs where they circulate in search of their antigenic ligand. In the periphery, APCs process and present antigen for CD4 + T cell recognition in the context of major histocompatibility complex class II (218, 219). Upon activation of the TCR:CD3 complex, proximal signaling events lead to the activation of numerous downstream pathways, including the Ras-Erk pathway and the protein kinase C (PKC) inhibitor of κb kinase (IKK) pathway (75, 220, 221). Activation of Ras leads to the activation of the mitogen-activated protein kinases, c-jun N-terminal kinase-1 (Jnk1) and p38, which activate c-jun and c-fos, respectively (101). The interaction of c-jun and c- Fos proteins leads to the formation of the transcriptional regulator AP-1 ( ). The IKK complex functions to phosphorylate inhibitor of κb-α (IκBα) proteins, leading to their degradation and the release of NF-κB (100, 225). Once activated, AP-1 and NF-κB translocate into the nucleus where they directly regulate the transcription of numerous genes critical to CD4 + T cell proliferation, including the T cell growth factor Il2 (82). Secreted IL-2 protein engages the IL-2R and further drives CD4 + T cell proliferative responses by activating Stat5. Once in the nucleus, Stat5 activates several
79 60 genes, including cyclin D2, Il2ra, Ifng and Socs-3 (120, 124, 125, 160). Importantly, expression of the high-affinity IL-2R is contingent on upregulation of the receptor s α- subunit. Thus, a positive feedback loop exists between IL-2R engagement and Stat5- mediated activation of Il2ra. IL-2-induced Stat5 activation also results in increased expression of Cyclin D2, which is critical to cell cycle progression by peripheral CD4 + T cells (146, 147). Finally, IL-2-induced Stat5 phosphorylation induces transcription of Socs3, which functions to suppress Stat5 activation and T cell proliferation (138, 141, 142). Thus, activation of the IL-2R/Stat5 pathway drives CD4 + T cell proliferation via Cyclin D2 induction and is balanced by Stat5-mediated upregulation of IL-2Rα and Socs3 (81, 226). Justy is a chemically induced recessive mutation that profoundly disrupts B lymphopoiesis. This developmental defect is caused by a point mutation that disrupts splicing of RNA transcribed from the Gon4l gene, which results in substantially reduced levels of the encoded protein. Wild-type Gon4l RNA and protein expression is dramatically reduced in Justy thymocytes. This chapter shows that wild-type Gon4l RNA expression is ~2 fold higher in peripheral CD4 + and CD8 + T cell populations than in mature follicular and marginal zone B cell populations. The Justy mutation had a dramatic effect on the level of aberrantly spliced Gon4l RNA in peripheral CD4 + T cells, correlating with decreased levels of wild-type Gon4l RNA and protein expression in these cells. Analysis of peripheral T cell responses demonstrated that IL-2 and TCRinduced proliferation by Justy mutant CD4 + T cells was compromised, and that these effects coincided with reduced Stat5 activation and less IL-2 production, respectively. This defect correlated with abnormally elevated levels of Socs3 RNA expression in Justy cells coupled to an inability to upregulate CyclinD2 RNA expression in response to stimulation. Together, these observations indicate that Gon4l has a role in regulating antigen-driven proliferation by CD4 + T cells.
80 61 Methods Peripheral CD4 + T cell Isolation and Cell Culture Lymphoid organs were harvested from wild-type and Justy C3Heb/FeJ mice, or from wild-type, Justy and µmt C57Bl/6 mice. Single cell suspensions were prepared from total splenocytes and lymph node cells and red blood cells were removed using Pharm Lyse (BD Biosciences). Peripheral CD4 + T cells were isolated from the suspension using a Dynal Mouse CD4 Negative Isolation Kit (Invitrogen) according to the manufacturers specifications. For cell culture experiments, T cells were incubated in T cell medium: RPMI media (GIBCO) containing 10% FBS, 1% L-glutamine, 1% penicillin/streptomycin, and 50 µm β-mercaptoethanol. Flow Cytometric Analysis and Cell Sorting Single cell suspensions were prepared from spleen, thymus or bone marrow by removing red blood cells and debris using lympholyte (Cedarlane Laboratories). Cells were resuspended in stain buffer (PBS containing 3% FBS) and incubated with antimouse CD16/32 (ebioscience) to prevent nonspecific antibody binding. Cells were incubated with fluorochrome- or biotin-conjugated antibodies for 30 min on ice and then washed 3 times with ice-cold stain buffer. Optimal antibody concentrations for staining were determined by titration experiments. To label biotin-conjugated antibodies, cells were resuspended in stain buffer plus the appropriate concentration of streptavidin- or avidin-conjugated fluorophore, incubated for an additional 30 min on ice and then washed 3 times with stain buffer. Flow cytometric analysis was performed using an LSR II, FACSDiVa or Aria II (Becton Dickinson) and collected data were analyzed using FlowJo (TreeStar). Cell yields for different fractions were calculated from post-sort analysis of collected data. Total events in the appropriate gate were divided by the total events in the forward scatter versus side scatter gate; this percentage was multiplied by the total yield of cells as determined using a hemacytometer. Cell populations were
81 62 sorted using a FACSDiVa or Aria II. For isolation of peripheral and thymic T cell populations, total splenocytes and lymph node cells or total bone marrow cells were stained with the appropriate combinations of antibodies and then sorted.). Antibodies specific for the following cell-surface markers were used: DN thymic populations: CD44, CD127, CD4, CD19, B220, CD3, CD8, CD25; DP and SP thymocytes: B220, CD3, CD4, CD8; peripheral T cells: B220, CD3, CD4, CD8. Flow Antibodies The following fluorochrome-conjugated antibodies were purchased from the listed sources. ebioscience: APC conjugates: B220 (RA3-6B2), CD3ε (145-2C11), CD4 (L3T4), CD25 (PC61.5); FITC conjugates: CD44, CD69, CD4 (L3T4); PE conjugates: CD25 (PC61.5), CD127, CD62L; PE-Cy7 conjugates: B220, CD8; PerCP- Cy5.5 conjugates: CD4. BD Biosciences: FITC conjugates: CD8a (53-6.7), CD122 (TM-β1); PE conjugates: CD4 (L3T4), CD8 (53-6.7), CD132 (Cat#18445B), CD127. Microarray Analysis Total peripheral CD4 + T cells were isolated with negative selection kits (Invitrogen) and resuspended in TriZol and RNA isolated using a standard protocol. The concentration and integrity of recovered RNA was determined using a Nanodrop spectrophotometer and Agilent 2100 Bioanalyzer, respectively. The Ovation Biotin RNA Amplification and Labeling System (NuGen) was used to generate biotin-labeled cdna from 50 ng of RNA template. The Affymetrix GeneChip System was employed for detection and analysis of cdna hybridization to microarrays. The Affymetrix Mouse Genome Gene 1.0 ST Array was used for hybridizations and the Affymetrix Analysis Suite will be used to perform absolute and comparative analyses of data. The Affymetrix Power Tools, Bioconductor and University of Iowa Microarray Database System was used to statistically analyze expression data.
82 63 RT-PCR Analysis RNA was isolated using TriZol (Invitrogen) and reverse-transcribed using the SuperScript III First-strand cdna Synthesis Kit (Invitrogen). Conventional PCR was performed using AmpliTaq Gold (Applied Biosystems) and a BioRad MyCycler thermal cycler according to the manufacturers instructions. Quantitative real-time PCR was performed using POWER SYBR Green Master Mix and the ABI PRISM 7700 Detection system (Applied Biosystems) to obtain cycle threshold (Ct) values for target and internal reference cdnas. Ct values correspond to the PCR cycle at which a fluorescent signal due to product accumulation was distinguishable from baseline fluorescence; baseline was determined using fluorescence readings collected during the first cycles of PCR amplification. Target cdna levels were normalized to an internal reference cdna (Hprt) using the equation 2-[DCt], where DCt is defined as Ct target Ct internal reference. All values shown were derived from the average of 3 or more replicate pairs of PCR reactions (target and internal reference) for each of at least 3 cdna preparations generated from independent cell or tissue samples. Immunoblot Analysis Protein lysates were prepared by resuspending cells in a buffer containing 50mM Tris-HCl ph 8.0, 120 mm NaCl, 0.5% NP-40, 0.2mM sodium orthovanadate, 100mM NaF, 50µg/ml PMSF and protease inhibitors (Roche). After incubation on ice for 30 min, insoluble material was removed by centrifugation and the supernatant was recovered. Proteins were separated by electrophoresis through 7% or 3-8% Nu-PAGE gels (Invitrogen) and transferred to PVDF (Millipore). Membranes were blocked with Tris-buffered saline (TBS with Tween) containing 5% milk. Membranes were then probed with the following antibodies: affinity-purified polyclonal anti-gon4l antibodies, anti-flag (Sigma), anti-yy1, anti-myc, anti-hdac1, anti- msin3a and anti-gapdh (Santa Cruz). Donkey anti-mouse or anti- rabbit IgG HRP (Santa Cruz) was used as
83 64 secondary antibody. Membrane-bound antibody complexes were visualized by chemiluminescence (SuperSignal West Pico, Thermo Scientific). Immunoblot Antibodies Antibodies against Gon4l were prepared as previously described. The following antibodies were used for immunoblot analysis: GAPDH, JNK1/2 (Santa Cruz), p- JNK1/2, Stat5, p-stat5, Cyclin D2, p38, p-p38 MAPK, Erk1/2, p-erk1/2 and IkBα (Cell Signaling). Proliferation Assays Total peripheral CD4 + T cells were incubated with either increasing doses of anti- CD3 antibody (ebioscience) with or without 10µg/mL of anti-cd28 antibody (ebioscience), increasing doses of ril-2 (ebioscience), or 50ng/mL PMA and 500ng/mL of ionomycin. Cells were cultured for 48 hours at 37 C and then pulsed for 8 hours with 3 H-TTP (Perkin Elmer). A cell harvester was used to calculate levels of 3 H-TTP incorporation. Cell Death Analysis Total peripheral CD4 + T cells were incubated with or without 10µg/mL of platebound anti-cd3 antibody for 72 hours. Cell populations were isolated at 24, 48 and 72 hours and stained for Annexin V and 7AAD using the PE Annexin V Apoptosis Detection Kit 1 (BD Pharmingen) according to the manufacturer s specifications. ELISAs Supernatants were collected from peripheral CD4 + T cells and Ready-SET-Go! kits (ebioscience) were used according to the manufacturers specifications to determine levels of IL-2.
84 65 Results The Justy Mutation Results in Decreased Levels of Gon4l Expression in T Cell Progenitors Analysis of B cell progenitors from Justy mice revealed that Gon4l expression is present at all stages of B cell lymphopoiesis and at elevated levels in mature B cells (197). To assess Gon4l expression in T cell progenitors, Q RT-PCR analysis was performed on thymic and splenic T cell populations. The analysis demonstrated that Gon4l RNA is expressed throughout T cell development and its expression is highest in peripheral CD4 + and CD8 + T lymphocytes (Figure 11A). Q RT-PCR analysis was performed to determine the levels of wild-type and aberrantly spliced Gon4l RNA in sortpurified thymic and peripheral T cells (Figure 11B and 11C). As expected, aberrantly spliced Gon4l RNA was detected only in Justy mutant CD4 + T cells but not in wild-type CD4 + T cells. Wild-type Gon4l RNA was detected in both wild-type and Justy cells but the levels in Justy cells were significantly reduced. The Justy mutation was shown to dramatically decrease Gon4l protein expression in the thymus (197). To determine the effect of the mutation in the periphery, immunoblot analysis was performed on lysates prepared from CD4 + T cells isolated from wild-type and Justy spleens and lymph nodes. The analysis showed that Gon4l protein expression was substantially decreased in this T cell population (Figure 11D). These data show that the Justy mutation dramatically reduces expression of wild-type Gon4l RNA and protein in peripheral CD4 + T cells. Major Aspects of Thymic T Cell Development is Normal in Justy Mice To define the impact of the Justy mutation on T lymphopoiesis, CD3 + thymocyte populations from wild-type and Justy mice were analyzed by flow cytometry. The total number of thymocytes and the frequency of CD4 - CD8 - DN, CD4 + CD8 + DP, CD4 + and CD8 + thymocyte populations were similar between wild-type and Justy mice (Figure
85 66 12A and 12B). Importantly, analysis of CD3 versus B220 expression showed that Justy thymocytes completely lacked expression of B220 + cells (Figure 12C). To further analyze the DN compartment, wild-type and Justy total thymocytes were incubated with an antibody panel that included fluorochrome-conjugated antibodies against CD44 and CD25. The analysis showed that the frequency of DN1, DN2, DN3 and DN4 thymocyte populations was normal in Justy mice (Figure 12D). Analysis of CD3 + splenocyte populations from Justy mice revealed that the ratio of CD4 + T cells to CD8 + T cells was decreased from ~3:1 to ~1:1 and the total number of peripheral CD4 + T cells was decreased 2-fold relative to wild-type CD4 + T cells (Figure 13A and 13C). Analysis of CD44 and CD62L surface expression revealed that the Justy mutation does not alter the ratio of naïve to memory CD4 + T cells in the periphery (Figure 13B). Finally, the total number of CD3 + splenic T cells was significantly decreased relative to wild-type cells. These data suggest that the Justy mutation does not impair T lymphopoiesis in the thymus but may affect the maintenance of peripheral CD4 + T cells in the periphery. The Justy Mutation Impairs Peripheral CD4 + T Cell Proliferation Given the decreased numbers of CD4 + T cells in the spleens of Justy mice, it was hypothesized that the Justy mutation perturbed CD4 + T cell function. To assess the proliferative responses of wild-type and Justy peripheral CD4 + T cells, experiments were performed to measure the total level of tritiated thymidine ( 3 H-TTP) uptake in these cells. Following 48 hours of stimulation with increasing doses of anti-cd3, Justy mutant CD4 + T cells displayed a 2-3-fold decrease in 3 H-TTP uptake levels relative to wild-type cells (Figure 14A). Wild-type and Justy peripheral CD4 + T cells were stimulated with anti-cd3 in the presence of anti-cd28 to determine if activation of the co-stimulatory pathway would rescue the defect. However, incubation with high levels of both anti-cd3
86 67 and anti-cd28 did not rescue the defect (Figure 14B). Wild-type and Justy peripheral CD4 + T cells were also stimulated with PMA and ionomycin to bypass proximal TCR signaling events; however, total levels of 3 H-TTP uptake remained impaired in Justy cells (Figure 14C). The defect in 3 H-TTP uptake indicated either reduced proliferation or increased cell death in Justy mutant CD4 + T cells. Annexin V and 7-AAD staining revealed that the Justy mutation does not affect activation-induced cell death in response to anti-cd3 (Figure 14D). These data show that proliferative responses of Justy peripheral CD4 + T cells are impaired following activation of the TCR and CD28 signaling pathways. Mutant Peripheral CD4 + T Cells From Justy Mice Display Decreased Levels of IκBα Degradation and IL-2 Production Experiments were performed to evaluate the activation of signaling pathways critical to TCR-mediated proliferation. Immunoblot analysis was performed on lysates prepared from wild-type and Justy CD4 + T cells following stimulation with PMA and ionomycin. Levels of phosphorylated Erk1/2 (p) and total Erk1/2 protein were similar between wild-type and Justy CD4 + T cell populations (Figure 15A). Additionally, levels of phosphorylated Jnk1/2 (p), total Jnk1/2, phosphorylated p38 (p) and total p38 were similar between all wild-type and Justy CD4 + T cell populations (Figure 15B). However, Justy CD4 + T cells displayed increased levels of IkBα protein relative to activated wild-type cells following stimulation with PMA/I. (Figure 15C). These data demonstrate that the Justy mutation impairs IkBα degradation in CD4 + T cells. It was hypothesized that the proliferative defect resulted from impaired induction of genes normally upregulated in response to TCR engagement. ELISAs were performed to measure total IL-2 protein in wild-type and Justy peripheral CD4 + T cell supernatants. Justy CD4 + T cells secreted decreased levels of IL-2 protein following stimulation with anti-cd3 (Figure 16A). Q RT-PCR analysis demonstrated that IL-2 induction was also
87 68 disrupted at the RNA level (Figure 16B). Moreover, TCR-mediated induction of the key cell cycle gene Ccnd2, which encodes Cyclin D2, was impaired (Figure 16C). These data show that the Justy mutation impairs activation of genes that are critical to driving peripheral CD4 + T cell proliferation. This defect may be due to decreased levels of IkBα degradation and thus, reduced activity of the NF-kB pathway. Loss of Gon4l Expression Impairs IL-2R/Stat5 Signaling in Peripheral CD4 + T Cells Cyclin D2 upregulation is initiated by the transcription factor Stat5 in response to IL-2R signaling and is a key step in driving cell cycle progression and proliferation in peripheral CD4 + T cells (147, 148). To determine if the defects in peripheral CD4 + T cell proliferation were due to impaired IL-2R/Stat5 activity, immunoblot analysis was performed on wild-type and Justy CD4 + T cells incubated with IL-2 for for 5, 10 and 15 minutes. The analysis revealed that levels of phosphorylated Stat5 (p) protein were decreased in Justy CD4 + T cells relative to wild-type cells at all time points following stimulation (Figure 17A). In contrast, levels of Stat5 phosphorylation were similar in wild-type and Justy peripheral CD4 + T cells following stimulation with IL-7, indicating that the defect was specific to the IL-2R pathway (Figure 17B). Total Stat5 expression was normal in Justy CD4 + T cells relative to wild-type cells. The α-subunit of the IL-2R is a direct target of Stat5 and, as part of a positive feedback loop, is transcribed downstream of IL-2R signaling (84, 120, 131). Flow cytometric analysis revealed a defect in IL-2Rα upregulation in Justy mutant CD4 + T cells incubated with IL-2 for 48 hours (Figure 17C). This defect was confirmed by Q RT-PCR analysis, which showed decreased levels of IL-2Rα RNA expression in Justy CD4 + T cells following stimulation with IL-2 (Figure 17D). The surface expression of IL-2Rα, IL-2Rβ and the γc subunit were similar on resting wild-type and Justy CD4 + T cells (Figure 17E). To determine if the defects in Stat5 activation and IL-2Rα
88 69 upregulation could account for the observed defect in 3 H-TTP uptake, wild-type and Justy CD4 + T cells were stimulated with increasing doses of IL-2. Justy mutant CD4 + T cells displayed reduced levels of 3 H-TTP uptake in response to IL-2 (Figure 17F), suggesting that the Justy mutation impairs CD4 + T cell proliferation by disrupting the IL- 2R pathway. This defect likely explains the decreased levels of Cyclin D2 induction observed in Justy CD4 + T cells following stimulation with anti-cd3. The Justy Mutation Dysregulates the Expression of Stat5 Target Genes To determine if the proliferative defect was due in part to a failure to induce Cyclin D2 expression through the IL-2R, Q RT-PCR analysis was performed on wildtype and Justy peripheral CD4 + T cells before and after incubation with IL-2. There was no significant difference between Cyclin D2 levels in wild-type and Justy peripheral CD4 + T cells prior to stimulation; however, treatment with IL-2 significantly increased Cyclin D2 expression in wild-type cells but not in Justy cells (Figure 18A). These data correlated with the defect in Cyclin D2 induction in Justy mutant CD4 + T cells following stimulation with anti-cd3. Stat5 has been shown to upregulate the expression of both Socs1 and Socs3. These proteins have been shown to help control CD4 + T cell activation and the development of T helper cells (134, 138). Socs3 expression levels were significantly elevated in Justy mutant CD4 + T cells, as compared to wild-type cells (Figure 18B). Socs1 expression levels were also elevated in Justy CD4 + T cells relative to wild-type; however, this difference did not reach statistical significance (Figure 18C). IL-2R/Stat5 activity also increases the expression of IFNγ. Experiments utilizing Q RT- PCR mini-arrays demonstrated that Justy CD4 + T cells do not induce IFNγ RNA expression to wild-type levels following IL-2 stimulation (Figure 18D). Together, these data suggest that loss of Gon4l expression results in elevated levels of Socs3 expression
89 70 and reduced upregulation of the Stat5 target genes Cyclin D2, Socs1, Socs3 and IFNγ in peripheral CD4 + T cells. Discussion Analysis of Gon4l RNA expression in thymic T cell precursors and mature splenic T cells demonstrated that Gon4l expression is developmentally regulated and expressed at high levels in the periphery. Gon4l protein expression was completely abrogated in Justy mutant CD4 + T cells, which correlated with decreased levels of the wild-type transcript and increased levels of the aberrantly spliced transcript. Loss of Gon4l expression did not impair major aspects of T lymphopoiesis, including the development of DN1, DN2, DN3, DN4, DP, and CD4 + and CD8 + thymic progenitors. However, homeostasis of the peripheral CD4 + T cell compartment was perturbed in these mice. Further analyses demonstrated that Justy mutant CD4 + T cells have reduced proliferative responses due to impaired TCR-mediated IL-2 production and decreased levels of IL-2R/Stat5 activity. Peripheral CD4 + T cells from Justy mice displayed increased levels of Socs1 and Socs3 expression, correlating with decreased levels of IL-2-induced Stat5 phosphorylation and Cyclin D2 induction. These results are consistent with a model where Gon4l functions to repress the expression of Socs proteins (Figure 19). Thus, in this model, decreased levels of Gon4l expression result in elevated levels of Socs3 transcription. Abnormally high levels of Socs3 expression inhibit IL-2-induced Stat5 activation and result in impaired induction of the Stat5 target genes Cyclin D2, Socs1, Socs3, IL-2Rα and IFNγ. Maintaining careful control of Cyclin D2 RNA levels is critical to the regulation of cell cycle progression in peripheral CD4 + T cells (227). In addition, increased expression of IL-2Rα protein is required to generate high affinity IL-2 receptors on the surface of peripheral CD4 + T cells (120). Thus, loss of Cyclin D2 and
90 71 IL-2Rα upregulation may be responsible, in part, for the proliferative defect observed in Justy mutant CD4 + T cells. The Justy mutation disrupted the production of IL-2 following stimulation through the TCR. Therefore, in response to anti-cd3, the reduced level of 3 H-TTP uptake by Justy CD4 + T cells is likely due to both a defect in IL-2 production and a defect in IL-2R/Stat5 activity. Separating TCR-mediated responses from the IL-2R pathway by incubating wild-type and Justy CD4 + T cells with IL-2 alone did not rescue the defect in 3 H-TTP uptake. This indicated that impaired IL-2R signaling was sufficient to disrupt proliferation in Justy CD4 + T cells. It is not yet known if defect in IL-2 production is sufficient to perturb proliferation in these cells. Experiments neutralizing the IL-2R pathway may provide insight into the importance of TCR-mediated IL-2 production to Justy CD4 + T cell proliferation. Reduced levels of IκBα degradation in these cells suggest that the Justy mutation impairs pathways downstream of TCR signaling but upstream of IL-2R/Stat5 activation. Adding another layer of complexity, deficiencies in different NF-κB family members can result in either decreased or increased production of IL-2. For example, IL-2 secretion is defective in c-rel-deficient T cells, but IL-2 expression is dramatically increased in NF-κB1-deficient mice (228, 229). Further analysis examining the presence or absence of key NF-κB family members in the nuclei of Justy CD4 + T cells following anti-cd3 stimulation may provide insight into the role that Gon4l plays in regulating TCR-mediated responses.
91 72 Figure 11. The Justy mutation reduces Gon4l expression in T lineage cells. For all panels, WT indicates wild type. (A-C) Q RT-PCR analysis of Gon4l RNA expression in T-lineage cells. Cells were purified by flow cytometry and used to prepare cdna. Samples were amplified by PCR using primers specific for Gon4l and Hprt cdna. Gon4l values were normalized to those for Hprt. Shown are the mean and standard error of data from 3 independent experiments. (A) Gon4l RNA is expressed throughout the T cell lineage. Graph shows values obtained using a primer pair that amplifies a sequence spanning exon 33 and the 3 UTR of Gon4l RNA. Each value shown was normalized to that obtained from CD4-CD8- thymocytes, which was set at one. (B) Gon4l RNA is aberrantly spliced in Justy T cells. Graph shows values obtained using a primer pair specific for aberrantly spliced Gon4l RNA (represented in the schematic above the graph). ND signifies not detectable. (C) Wild-type Gon4l RNA levels are reduced in Justy T cells. Graph shows values obtained using a primer pair specific for normally spliced Gon4l RNA (represented in the schematic above the graph). Each Justy value shown was normalized to that for the corresponding wild-type sample, which was set at one. (D) Gon4l protein levels are greatly reduced in Justy T cells. Shown are immunoblots of protein lysates from splenic CD4 + T cells probed with antibodies specific for Gon4l and Gapdh; blotting with the latter confirmed equal protein loading. Data are representative of 4 independent experiments.

92 73
93 74 Figure 12. Thymic T cell development in Justy mice appears grossly normal. (A) Yields of thymocytes from Justy mice are normal. Thymocyte suspensions were prepared from thymi and cell yields determined using a hemocytometer. Each circle in the graph represents the cell yield from one organ. Horizontal line represents the mean for the values shown. (B-D) Flow cytometric analysis of thymocytes from wild-type and Justy mice stained with antibodies for the indicated surface proteins. Numbers in the plots are the frequencies of cells in the nearest gate (red boxes). Data shown are representative of at least 3 independent experiments. (B) Normal frequencies of major cell populations in Justy thymocytes. Plots show analysis of CD4 and CD8 expression on thymocytes. (C) Cells expressing B220 are absent from Justy thymocytes. Plots show analysis of B220 and CD3 expression by cells in the CD4 - CD8 - gate in panel B. (D) Early T cell progenitors from Justy mice appear normal. Plots show analysis of CD44 and CD25 expression on cells from the CD3 - B220 - gate in panel C. These cells are also CD4 - CD8 -. P values shown were obtained using Student s t test.


94 75
95 76 Figure 13. The Justy mutation perturbs the peripheral CD4 + T cell compartment. (A,B) Flow cytometric analysis of splenic T cells from wild-type and Justy mice stained with antibodies for the indicated surface proteins. Numbers in the plots are the frequencies of cells in the nearest gate (red boxes). Data shown are representative of at least 3 independent experiments. (A) The ratio of CD4 + to CD8 + cells is reduced in Justy splenocytes. Plots show data obtained by flow cytometric analysis of CD4 and CD8 expression on CD3 + splenocytes. (B) Justy CD4 + T cell populations contain normal frequencies of naïve and effector/memory cells. Plots show data obtained by flow cytometric analysis of CD44 and CD62L expression by CD4 + splenocytes. (C) Justy splenocytes contain fewer CD4 + T cells compared to wild type. Graph shows the yield of the indicated populations from splenocyte preparations. Each circle in the graph represents the cell yield from one spleen. Horizontal line represents the mean for the values shown. P values shown were obtained using Student s t test.

96 77
97 78 Figure 14. Justy mutant CD4 T cells have altered responses to activation of T cell receptor signaling pathways. (A-C) Reduced proliferative responses by Justy CD4 + T cells exposed to agents that mimic T cell receptor (TCR) engagement. CD4 + T cells were isolated and plated onto wells containing the indicated stimuli (x-axes). Cultures were pulsed with 3 H-TTP during the last 8-hr of a 48-hr culture, after which cellular DNA was isolated and analyzed by scintillation counting. Graphs show tritiated thymidine levels (in counts per minute (CPM); y-axes) taken up by wild-type and Justy cells in response to increasing amounts of anti-cd3 (A), increasing amounts of anti-cd3 together with a constant amount of anti-cd28 (B), or the phorbol 12-myristate 13-acetate (PMA) together with the calcium ionophore ionomycin (C). Each point represents the average and standard deviation (error bars) of triplicate values. (D) Normal levels of apoptosis by stimulated Justy CD4 + T cells. Plot shows flow cytometric analysis of cells for surface levels of Annexin V and intracellular levels of the vital dye 7-amino-actinomycin D (7-AAD). Cells were plated onto wells coated with anti-cd3 and harvested for analysis 48 hr later. Data are representative of 4 independent experiments.

98 79
99 80 Figure 15. The Justy mutation impairs IκBα degradation in peripheral CD4 + T cells. Wild-type and Justy mutant CD4 + T cells were incubated with PMA and Ionomycin (I) for 15 minutes. Cells were harvested at 5 minute intervals, lysed and probed with antibodies against Phospho-Erk1/2 and total Erk1/2 (A); Phospho-Jnk1/2, total Jnk1/2, Phospho-p38, and total p38 (B); or total IκBα and Gapdh (C). Blots were incubated with phospho-specific antibodies first, then they were stripped and incubated with antibodies against total levels of the respective proteins (A,B). In C, the blot was incubated with antibodies against IκBα and then stripped and incubated with antibodies against Gapdh, which was used to confirm equal protein loading. Data in A is from one experiment, data in B is representative of 2 independent experiments and data in C is representative of at least 4 independent experiments.


100 81
101 82 Figure 16. Justy mutant CD4 + T cells have altered responses to activation of T cell receptor signaling pathways. Decreased induction of IL-2 (A,B) and Cyclin D2 (C) by Justy CD4 + T cells in response to TCR engagement. (A) Graph shows IL-2 protein levels in culture supernatant as determined by ELISA. Cells were stimulated as indicated (x-axis) and supernatants collected 48 hrs later for analysis. Shown are the means and standard deviations of triplicate samples. Data are representative of 3 independent experiments. (B,C) Graphs show data obtained by Q RT-PCR analysis of IL-2 RNA (B) or Cyclin D2 RNA (C) levels in cells stimulated with plate-bound anti-cd3 for 12 hrs. Values on y- axis are normalized to those for Hprt RNA. Shown are the means and standard errors of data from 4 independent experiments. P-values were obtained from Student s t-test.

102 83
103 84 Figure 17. Impaired responses by Justy mutant CD4 + T cell to IL-2 stimulation. Stat5 phosphorylation induced by incubation with IL-2 (A) or IL-7 (B) in wildtype and Justy CD4 + T cells. Purified CD4 + T cells were incubated for the indicated times in medium containing IL-2 at 50ng/mL. Lysates were prepared and immunoblotted using antibodies specific for Stat5a/b phosphorylated at tyrosine 694 (upper blot) or for total Stat5a/b protein (lower blot). Results obtained with the latter antibody confirmed equal protein loading. (C) Reduced surface expression of IL-2 receptor a protein by Justy CD4 + T cells in response to IL-2 stimulation. Purified CD4 + T cells were cultured in medium lacking (-IL-2) or containing IL-2 at 200 U/mL (+IL-2). After 48 hours, cells were harvested and surface expression of CD4 and IL-2 receptor a was determined by flow cytometry. (D) Reduced expression of IL-2 receptor a RNA in Justy CD4 + T cells stimulated with IL-2. Purified CD4 + T cells were cultured for 12 hrs in medium containing the indicated amounts of IL-2 (x-axis), and harvested for Q-RT-PCR analysis. Graph shows IL-2Rα RNA levels normalized to those for Hprt RNA as plotted on the y- axis. The means and standard errors of data from 3 independent experiments are shown. The P value was obtained using Student s t test. (E) Flow cytometric analysis of peripheral CD4 + T cells from wild-type and Justy mice. Cells were stained with fluorochrome-conjugated antibodies against IL-2Rα, IL-2Rβ, and IL-2Rγ before and after stimulation with 10µg/mL of anti-cd3 antibody. Data are representative of 3 independent experiments. (F) Reduced proliferation by Justy mutant CD4 + T cells in response to exogenous IL-2. Purified CD4 + T cells were cultured in medium containing different amounts of IL-2. Cultures were pulsed with 3 H-TTP during the last 8-hr of a 48- hr culture, after which cellular DNA was isolated and analyzed by scintillation counting. Graphs show tritiated thymidine levels (in counts per minute (CPM); y-axis) taken up by wild-type and Justy CD4 + T cells in response to the indicated concentrations of IL-2 (x-axis). Each point represents the average and standard deviation (error bars) of triplicate samples.

104 85
105 86 Figure 18. Decreased Gon4l expression results in dysregulation of Stat5 target genes. Q RT-PCR analysis of Cyclin D2 (A) Socs3 (B) Socs1 (C) and IFNγ (D) RNA levels in wild-type and Justy peripheral CD4 + T cells. RNA was isolated from resting cells and cells incubated with 200 U/mL of IL-2 for 6 hours. Data in A-D is the average of 3 independent experiments. P-values were obtained from Student s t-test.

106 87
107 88 Figure 19. Proposed model of Gon4l-mediated repression of Socs3 expression. In the model, Gon4l mediates repression of Socs3 expression. Thus, loss of Gon4l expression would result in increased levels of Socs3 expression. High levels of Socs3 would inhibit IL-2-induced Stat5 phosphorylation and disrupt the induction of Cyclin D2.

108 89
109 90 CHAPTER IV GON4L IS ESSENTIAL FOR THE DIFFERENTIATION OF CD4 + TH1 EFFECTOR CELLS Abstract CD4 + Th1 effector cells mediate immune responses against intracellular pathogens by secreting cytokines that activate other immune cell types including macrophages and B lymphocytes. Upregulation of IFNγ through the IL-2R/Stat5 pathway is crucial to priming the development of CD4 + Th1 cells. Loss of Gon4l protein expression has been shown to increase levels of Socs-3 expression in Justy mutant CD4 + T cells, correlating with impaired IL-2-induced Stat5 activation and reduced induction of Cyclin D2 and IFNγ in these cells. Consistent with this, shrna-mediated knockdown of Gon4l protein in wild-type CD4 + T cells incubated under Th1 conditions resulted in elevated levels of Socs3 expression and defective Th1 effector function, as indicated by reduced levels of Cyclin D2 and IFNγ induction following stimulation through the TCR:CD3 complex. Moreover, Justy CD4 + T cells generated decreased numbers of IFNγ-producing Th1 effector cells, relative to wild-type CD4 + T cells, and secreted reduced levels of total IFNγ upon restimulation. Gene expression analysis demonstrated that levels of the Th1 cell-specific master regulator, T-bet, were significantly decreased in Justy CD4 + Th1 effectors. Thus, Gon4l is required for the development of CD4 + Th1 cells and likely has a role in reprogramming gene expression during this process. Introduction Upon engagement of the TCR by peptide-mhcii complexes, naive CD4 + T cells proliferate and differentiate into various subsets of Th effector cells that elicit specific responses to various invading microorganisms. These responses are mediated by cytokines that are secreted by the Th cells and function to recruit and activate other immune cells. Upon antigen re-encounter, fully developed CD4 + Th1 effector cells
110 91 secrete high levels of IFNγ that functions to activate macrophages and B cells to defend against the infection. The development of Th1 effector cells requires the induction of numerous cytokine signaling pathways and the upregulation of several Th1 cell-specific transcription factors. These factors are part of a larger transcriptional network that is carefully balanced in order to reprogram gene expression and direct Th cell fate. CD4 + Th1 differentiation is initiated by IL-2 production and IL-2R/Stat5 signaling. Studies have demonstrated that Stat5 binds to several IFNγ regulatory elements and is able to directly induce expression of IFNγ protein ( ). Moreover, reports have shown that IL-2 secretion and IL-2R/Stat5 activation are essential to T-bet induction (161). T-bet protein further upregulates IFNγ expression directly by binding to the IFNγ promoter and indirectly by activating two other Th1 cell-specific IFNγ transcriptional regulators, Runx3 and Hlx (165, 166). CD4 + Th1 differentiation is impaired in T-bet deficient mice; however, these cells still produce low levels of IFNγ protein (81). Th1 development also requires the repression of factors that promote alternate Th lineage fates, including the Th2 cell-specific transcriptional regulator, Gata3. T-bet and Runx3 have been shown to negatively regulate Gata3 expression during Th1 differentiation ( ). Signaling through the IL-12 receptor (IL-12R) further amplifies the Th1 response ( ). IL-12Rβ2 expression is induced by TCR activation and then maintained by both IL-12 and IFNγ stimulation. Signaling through the IL-12R activates Stat4 and upregulates IFNγ expression, thereby creating feedfoward loop of IFNγ induction (81, 153). IFNγ protein is important for driving the differentiation of myeloid lineage cells and for regulating isotype switching in mature B cells (183, 186, 187) Socs3 regulates the phosphorylation of Stat4 and Stat5 at the IL-12R and the IL- 2R, respectively, thereby inhibiting Th1 effector cell development (143, 177). In the absence of IL-2-induced Stat5 activation, T-bet RNA expression and binding of T-bet protein to the IFNγ promoter is greatly diminished (158, 161). Thus, proper regulation of Socs3 expression is critical to CD4 + Th1 differentiation. Indeed, elevated levels of Socs3
111 92 expression have been shown to inhibit the differentiation process in vitro, resulting in impaired development of IFNγ-producing CD4 + Th1 effectors (143). However, elevated Socs3 expression has yet to produce any defects in Th1 differentiation in vivo (144). The minimal functional Socs3 promoter contains two Stat responsive elements and an AP-1 enhancer region (139). Activation of this promoter through IL-2R signaling involves Stat5 binding to the proximal Stat responsive element (140, 141). Thus, Stat5 and Socs3 interact as part of a tightly regulated negative feedback loop. Socs3 activity is controlled at the transcriptional level as well as at the post-translational level via tyrosine phosphorylation (141). While many of the factors that regulate Socs3 expression and function have been characterized, identification of novel proteins that affect Socs3 activity would increase understanding of Socs3-mediated inhibition of CD4 + Th1 differentiation. Previous studies have described a recessive mutation named Justy that dramatically reduces expression of a protein called Gon4l and causes a profound arrest in B cell development and dramatically impairs CD4 + T cell proliferative responses. Gon4l bears homology to non-dna-binding regulators of gene transcription and interacts with proteins important for transcriptional repression (198), suggesting this protein has a role in controlling gene expression. Justy mutant CD4 + T cells display elevated levels of Socs3 expression, correlating with impaired IL-2/Stat5 signaling and impaired Cyclin D2 induction in these cells. Here, Gon4l expression is demonstrated to be required for Th1 differentiation by peripheral CD4 + T cells. Justy mutant CD4 + T cells generated decreased numbers of IFNγ-producing effector cells, correlating with reduced T-bet expression in these cells. Specific knockdown of Gon4l expression during Th1 differentiation resulted in elevated levels of Socs3 expression and decreased levels of Cyclin D2 induction following restimulation. These observations confirm the Gon4l plays a role in regulating Socs3 expression and suggest that this role is important for driving CD4 + Th1 differentiation.
112 93 Methods Mice B6.129S2-Ighmtm1Cgn/J (µmt) mice (66) were obtained from Jackson Laboratory (stock #002288). Peripheral CD4 + T Cell Isolation and Cell Culture Lymphoid organs were harvested from wild-type and Justy C3Heb/FeJ mice, or from wild-type, Justy and µmt C57Bl/6 mice. Single cell suspensions were prepared from total splenocytes and lymph node cells and red blood cells were removed using Pharm Lyse (BD Biosciences). Peripheral CD4 + T cells were isolated from the suspension using a Dynal Mouse CD4 Negative Isolation Kit (Invitrogen) according to the manufacturers specifications. For cell culture experiments, T cells were incubated in T cell medium: RPMI media (GIBCO) containing 10% FBS, 1% L-glutamine, 1% penicillin/streptomycin, and 50 µm β-mercaptoethanol. Flow Cytometric Analysis and Cell Sorting Single cell suspensions were prepared from spleen, thymus or bone marrow by removing red blood cells and debris using lympholyte (Cedarlane Laboratories). Cells were resuspended in stain buffer (PBS containing 3% FBS) and incubated with antimouse CD16/32 (ebioscience) to prevent nonspecific antibody binding. Cells were incubated with fluorochrome- or biotin-conjugated antibodies for 30 min on ice and then washed 3 times with ice-cold stain buffer. Optimal antibody concentrations for staining were determined by titration experiments. To label biotin-conjugated antibodies, cells were resuspended in stain buffer plus the appropriate concentration of streptavidin- or avidin-conjugated fluorophore, incubated for an additional 30 min on ice and then washed 3 times with stain buffer. Flow cytometric analysis was performed using an LSR II, FACSDiVa or Aria II (Becton Dickinson) and collected data were analyzed using
113 94 FlowJo (TreeStar). Cell yields for different fractions were calculated from post-sort analysis of collected data. Total events in the appropriate gate were divided by the total events in the forward scatter versus side scatter gate; this percentage was multiplied by the total yield of cells as determined using a hemacytometer. Cell populations were sorted using a FACSDiVa or Aria II. For isolation of peripheral and thymic T cell populations, total splenocytes and lymph node cells or total bone marrow cells were stained with the appropriate combinations of antibodies and then sorted.). Flow Antibodies The following fluorochrome-conjugated antibodies were purchased from the listed sources. ebioscience: APC conjugates: B220 (RA3-6B2), CD3ε (145-2C11), CD4 (L3T4), CD25 (PC61.5); FITC conjugates: CD4 (L3T4); PE conjugates: CD25 (PC61.5), CD127; PE-Cy7 conjugates: B220, CD8; PerCP-Cy5.5 conjugates: CD4. R&D Systems: PE conjugates: IL-12Rβ2 (Cat#FAB1959P). BD Biosciences: FITC conjugates: Thy1.2, CD8a (53-6.7), CD122 (TM-β1), IFNγ (XMG1.2); PE conjugates: Thy1.2, CD4 (L3T4), CD8 (53-6.7), CD132 (Cat#18445B), CD127, IFNγ (XMG1.2); PerCP conjugates: CD4 (RM4-5), CD8 (53-6.7); PerCP-Cy5.5 conjugates: T-bet (ebio4b10). BioLegend: PE conjugates: TCRβ (H57-597). RT-PCR Analysis RNA was isolated using TriZol (Invitrogen) and reverse-transcribed using the SuperScript III First-strand cdna Synthesis Kit (Invitrogen). Conventional PCR was performed using AmpliTaq Gold (Applied Biosystems) and a BioRad MyCycler thermal cycler according to the manufacturers instructions. Quantitative real-time PCR was performed using POWER SYBR Green Master Mix and the ABI PRISM 7700 Detection system (Applied Biosystems) to obtain cycle threshold (Ct) values for target and internal reference cdnas. Ct values correspond to the PCR cycle at which a fluorescent signal due to product accumulation was distinguishable from baseline fluorescence; baseline
114 95 was determined using fluorescence readings collected during the first cycles of PCR amplification. Target cdna levels were normalized to an internal reference cdna (Hprt) using the equation 2-[DCt], where DCt is defined as Cttarget Ctinternal reference. All values shown were derived from the average of 3 or more replicate pairs of PCR reactions (target and internal reference) for each of at least 3 cdna preparations generated from independent cell or tissue samples. Immunoblot Analysis Protein lysates were prepared by resuspending cells in a buffer containing 50mM Tris-HCl ph 8.0, 120 mm NaCl, 0.5% NP-40, 0.2mM sodium orthovanadate, 100mM NaF, 50µg/ml PMSF and protease inhibitors (Roche). After incubation on ice for 30 min, insoluble material was removed by centrifugation and the supernatant was recovered. Proteins were separated by electrophoresis through 7% or 3-8% Nu-PAGE gels (Invitrogen) and transferred to PVDF (Millipore). Membranes were blocked with Tris-buffered saline (TBS with Tween) containing 5% milk. Membranes were then probed with the following antibodies: affinity-purified polyclonal anti-gon4l antibodies, anti-flag (Sigma), anti-yy1, anti-myc, anti-hdac1, anti- msin3a and anti-gapdh (Santa Cruz). Donkey anti-mouse or anti- rabbit IgG HRP (Santa Cruz) was used as secondary antibody. Membrane-bound antibody complexes were visualized by chemiluminescence (SuperSignal West Pico, Thermo Scientific). Immunoblot Antibodies Antibodies against Gon4l were prepared as previously described (197). The following antibodies were used for immunoblot analysis: GAPDH, JNK1/2 (Santa Cruz), p-jnk1/2, Stat5, p-stat5, Cyclin D2, p38, p-p38 MAPK, Erk1/2, p-erk1/2 and IkBα (Cell Signaling).
115 96 ELISAs Supernatants were collected from CD4 + Th1, Th2, or Th17 cells. Ready-SET-Go! kits (ebioscience) were used according to the manufacturers specifications to determine levels of IFNγ, IL-4 and IL-17F, respectively. Differentiation Assays Total peripheral CD4+ T cells were incubated with 10µg/mL of anti-cd3 antibody (ebioscience), 10µg/mL of anti-cd28 antibody (ebioscience) and 20U/mL of ril-2 (BD Pharmigen). Th0 conditions included no other cytokines or antibodies. Th1 differentiation conditions: 4ng/ml ril-12 (BD Pharmingen) 2 ug/ml anti-il-4 (ebioscience); Th2 differentiation conditions: 1000U/ml ril-4 (BD Pharmingen), 2µg/ml anti-ifnγ (ebioscience); Th17 differentiation conditions: 10ng/ml ril-6 (BD Pharmingen), 5ng/ml rtgf-beta (BD Pharmingen), 2µg/ml anti-il-4 (ebioscience) and 2µg/ml anti-ifnγ (ebioscience). Cells were cultured for 5-7 days at 37 C, harvested, washed twice with T cell medium and then restimulated for 6 hours (for Q RT-PCR experiments) or 48 hours (for ELISA experiments) with 4ng/ml ril-12 and 10µg/mL of anti-cd3 antibody. Bacteria and Infection of Mice L. monocytogenes engineered to express ovalbumin (OVA) was a gift from John Harty (University of Iowa). An attenuated version of this strain was created by introducing an in-frame deletion in the acta gene as previously described (230). This was the only strain of L. monocytogenes used in these experiments. Bacteria were grown and quantified as previously described (231). All infections were via intravenous injection. The number of bacteria injected was determined by plate count.
116 97 Peptides and Determination of the Number of Antigen- Specific CD4 + T Cells LLO (NEKYAQAYPNVS) peptides were obtained from John Harty (University of Iowa). Antigen-specific CD4 + T cells were detected by surface staining for CD4 and Thy1.2 together with intracellular staining for IFN-γ as previously described after a 5.5-h stimulation with 5 µm LLO peptide diluted 1:1000. The total number of Antigen-specific T cells per spleen was calculated by multiplying the frequency of CD4 + Thy1.2 + IFN-γ + cells after stimulation with specific peptide by the total number of splenocytes. The number of cells producing cytokine in unstimulated samples was subtracted. Transduction Experiments ShRNAs against Gon4l and Socs3 were generated and cloned into the LMP retroviral vector (Thermo Scientific). Day-1: Retroviral vectors expressing Luciferase or shrnas were transfected into 293T cells and wild-type peripheral CD4+ T cells were isolated and incubated under Th1 conditions. Day-2 and Day-3: CD4+ T cell populations were loaded with virus-containing 293T cell media and spun at 2200 rpm for 2 hours at 25C. The 293T media was removed following each spinfection and CD4+ T cell populations were again incubated under Th1 differentiation conditions. Day-7: Th1 cells were harvested and a subset of each population was restimulated with 4ng/ml ril-2 and 10µg/mL of anti-cd3 antibody. A second subset of each population was used gene expression analysis on cells prior to restimulation.
117 98 Results The Justy Mutation Specifically Impairs the Development of CD4 + Th1 Effector Cells Upregulation of IFNγ through the IL-2R/Stat5 pathway is crucial to priming the development of CD4 + Th1 effector cells. Socs3 has been shown to potently inhibit Stat5 activation through the IL-2R and repress the development of CD4 + Th1 effectors (134, 138, 143). Given the elevated expression of Socs3 in Justy mutant CD4 + T cells, it was hypothesized that these cells would exhibit defects in Th1 differentiation. To test this hypothesis, peripheral CD4 + T cells were isolated from wild-type and Justy C3H mice and incubated under Th1 conditions. Flow cytometric analysis of intracelluar IFNγ protein levels demonstrated that Justy mutant CD4 + T cells generated fewer IFNγproducing Th1 effectors, relative to wild-type cells (Figure 20A). To test the function of Justy Th1 effectors, fully differentiated wild-type and Justy CD4 + Th1 cells were restimulated by incubating each population with anti-cd3 and IL-2. Antibodies against anti-cd28 were not added to ensure that only Th1 effector responses were measured, as naïve responses require stimulation through the CD28 co-receptor. ELISAs demonstrated that Justy mutant CD4 + Th1 effector cells secreted reduced levels of total IFNγ protein following stimulation with anti-cd3 and IL-2 (Figure 20B). These results were confirmed by Q RT-PCR analysis showing decreased levels of IFNγ induction in Justy CD4 + Th1 effector cells relative to wild-type effectors (Figure 20C). Although impaired IL-2/Stat5 activity and elevated levels of Socs3 expression were likely responsible for the defects in proliferation and Th1 cell development, a second possibility was that the Justy mutation perturbed expression of the TCR on the surface of CD4 + T cells. However, flow cytometric analysis of the dominant TCR chain, TCRβ, demonstrated similar levels of TCR expression on the surface of wild-type and Justy peripheral CD4 + T cells (Figure 21A). These data show that the defect in Th1
118 99 differentiation is not due to decreased expression of the TCR. A third possibility for the observed defects in Th1 cell development was that Justy CD4 + T cells were biased towards an alternate Th lineage fate. This hypothesis was tested by incubating wild-type and Justy CD4 + T cells under Th2 and Th17 conditions and restimulating each effector population in order to measure levels of IL-4 and IL-17 protein secretion, respectively. The analysis showed that Th2 and Th17 effectors derived from Justy peripheral CD4 + T cells produce normal levels of their respective signature cytokines, relative to wild-type. (Figure 21B and 21C). These data show that the Justy mutation does not impair the development or function of CD4 + Th2 and Th17 effector cells. Together, the above results suggest that the Justy mutation specifically disrupts the Th1 developmental program. Justy Mice Clear Listeria Monocytogenes Infection Similar to µmt Mice An in vivo Listeria monocytogenes infection model was used to determine if the defect in Th1 effector cell development exhibited by Justy mutant CD4 + T cells disrupted the generation of IFNγ-producing CD4 + Th1 cells. L. monocytogenes is a Gram-positive bacterium responsible for listeriosis, a foodborne infection characterized by systemic dissemination of ingested bacteria from the intestine into the blood stream and various organs including the spleen. A hallmark of L. monocytogenes infection of host cells is its ability to enter the cell cytosol by escaping from the hydrolytic phagosome. It does so by means of a pore-forming toxin, listeriolysin O (LLO) (232). This infection model was chosen because there is a well-defined MHC class II epitope derived from the LLO protein that is presented in B6 mice (233). Thus, the kinetics of expansion and contraction of antigen-specific CD4 + T cells could easily be tracked. During the course of L. monocytogenes infection, Th1 effector cells that are thought to contribute to clearance of the infection by producing large amounts of IFNγ.
119 100 To ensure that any abnormalities observed in Justy mice were not due to the absence of B cells, B6 µmt mice were used as controls. These mice were generated by a targeted disruption of the membrane exon of the immunoglobulin µ chain gene and thus, similar to Justy mice, lack mature B cells (66). B6 µmt and Justy mice were injected with attenuated L. monocytogenes and 7 days later total splenocytes were isolated, restimulated with LLO (NEKYAQAYPNVS) peptides and stained with fluorochrome-conjuaged antibodies against Thy1.2, CD4 and IFNγ. Statistical analysis showed that µmt and Justy CD4 + T cells generated similar numbers of peptide-specific IFNγ-producing Th1 effector cells (Figure 22A). To evaluate the secondary responses CD4 + Th1 effector cells, total splenocytes were isolated from B6 µmt and Justy mice 40 days post-infection. These cells were also restimulated with peptide and stained with fluorochrome-conjuaged antibodies against Thy1.2, CD4 and IFNγ. Statistical analysis demonstrated that µmt and Justy mice maintained similar numbers of peptide-specific IFNγ-producing CD4 + Th1 cells (Figure 22B). These data show that Justy mice clear L. monocytogenes infection similar to µmt mice. One possibility for the above results is that the defects present in Justy CD4 + T cells are due to their development in a B cell-deficient host. This would explain the similarity in B6 µmt and Justy CD4 + Th1 cell responses. 3 H-TTP uptake experiments were performed to determine if the impaired proliferative responses displayed in Justy CD4 + T cells were related to the arrest in B cell development in Justy mice. Peripheral CD4 + T cells were isolated from B6 wild-type, µmt and Justy mice and incubated with anti-cd3. Surprisingly, the analysis showed that CD4 + T cells from µmt mice displayed the highest levels of 3 H-TTP uptake (Figure 22C). Indeed, it has been shown that the functional responses of µmt CD4 + T cells are not disrupted compared to wild-type cells ( ). Consistent with analyses of the proliferative responses of C3H Justy mutant CD4 + T cells, 3 H-TTP uptake levels were also impaired in B6 Justy CD4 + cells relative to wild-type cells. Thus, the disruption in B lymphopoiesis in Justy mice likely does not
120 101 explain the impaired functional responses observed in Justy CD4 + T cells, nor does it provide understanding of why Justy and µmt mice clear L. monocytogenes infection similarly. ShRNA-Mediated Knockdown of Gon4l Impairs IFNγ Production in CD4 + Th1 Effector Cells Previous studies have shown that elevated levels of Socs3 expression perturb the generation of CD4 + Th1 effector cells (143). To connect the loss of Gon4l expression with increased levels of Socs3 expression and impaired Th1 differentiation, wild-type peripheral CD4 + T cells were incubated under Th1 conditions and infected with a retroviral vector expressing either luciferase or Gon4l-shRNAs. Wild-type CD4 + T cells were infected twice on days 2 and 3 during the course of their differentiation into Th1 effectors. On day 7 of the differentiation, Gon4l protein expression levels were found to be dramatically decreased in wild-type CD4 + Th1 cells transduced with Gon4l-shRNAs, relative to Th1 cells transduced with retroviral vectors expressing luciferase (Figure 23A). Q RT-PCR analysis confirmed reduced levels of Gon4l expression in cells transduced with Gon4l-shRNAs (Figure 23B). Wild-type CD4 + Th1 cells transduced with Gon4l-shRNAs secreted reduced levels of IFNγ protein following restimulation, relative to control cells (Figure 23C). Additionally, induction of IFNγ RNA expression was impaired in wild-type Th1 cells transduced with Gon4l-shRNAs (Figure 23D). These data demonstrate that CD4 + Th1 effector cell development requires Gon4l protein expression. Loss of Gon4l Expression Disrupts Socs3 Expression and Cyclin D2 Induction in CD4 + Th1 Effector Cells Justy peripheral CD4 + T cells displayed elevated levels of Socs3 expression relative to wild-type CD4 + T cells. Following stimulation through the IL-2R, Justy CD4 + T cells exhibited reduced levels of Cyclin D2 induction compared to wild-type cells.
121 102 Therefore, it was hypothesized that loss of Gon4l expression would also affect the regulation of Socs3 and Cyclin D2 in CD4 + Th1 effector cells. Q RT-PCR analyses demonstrated that Th1 effector cells derived from Justy mutant CD4 + T cells display decreased levels of Cyclin D2 expression (Figure 24A). Consistent with this, wild-type CD4 + Th1 cells transduced with Gon4l-shRNAs failed to induce Cyclin D2 following restimulation (Figure 24B). Moreover, knockdown of Gon4l expression in these cells resulted in increased Socs3 RNA levels, suggesting that Gon4l plays a role in suppressing Socs3 expression (Figure 24C). Collectively, the above analyses demonstrated that loss of Gon4l results in increased Socs3 expression and impaired induction of IFNγ and Cyclin D2. These results further establish a role for Gon4l in the regulation of Socs3 expression levels and in the induction of Stat5 target genes in CD4 + T cells. The Justy Mutation Disrupts Expression of CD4 + Th1 Cell- Specific Transcription Factors IL-2-induced Stat5 activation induces the expression of T-bet and is required for normal Th1 differentiation (161). The Justy mutation disrupts IL-2 production and IL- 2R/Stat5 signaling in peripheral CD4 + T cells. Thus, it was hypothesized that Justy mutant CD4 + Th1 effector cells express reduced levels of T-bet, resulting in impaired Th1 differentiation. To test this, wild-type and Justy CD4 + T cells were incubated under Th1 conditions for 5 days and Q RT-PCR analysis was performed to determine the expression levels of T-bet RNA. These experiments showed that T-bet RNA levels were significantly lower in Justy mutant CD4 + Th1 effector cells, relative to wild-type CD4 + Th1 effectors (Figure 25A). In addition to upregulating Th1 cell-specific factors, CD4 + Th1 differentiation requires the downregulation of proteins that drive the development of alternative Th lineages. Gata3 is the master regulator of Th2 differentiation and functions to promote this process by inhibiting expression of T-bet. Thus, it is possible that elevated levels of Gata3 are responsible for the reduced levels of T-bet expression
122 103 observed in Justy mutant CD4 + Th1 effector cells. However, Q RT-PCR analysis demonstrated that downregulation of Gata3 occurred normally in Justy CD4 + Th1 effectors, relative to wild-type (Figure 25B). These data show that the Justy mutation impairs the expression of T-bet in CD4 + Th1 effectors. One possibility is that the decreased levels of Th1-specific transcription factors displayed in Justy mutant CD4 + T cells result from impaired levels of IL-2 production and IL-2R/Stat5 activity in these cells. Indeed, IL-2-deficient and Stat5-deficient CD4 + T cells have been shown to express reduced levels of T-bet relative to wild-type cells (161). However, another possibility is that the Justy mutation impairs the repression of proteins that inhibit Th1 differentiation. Chapter III of this dissertation established that inhibitory Socs proteins are derepressed in Justy mutant CD4 + T cells. However, several other proteins have been shown to impede the development of Th1 effector cells, including the cytokine IL-10 and the transcriptional regulator Twist1. IL-10 inhibits the production of IFNγ by Th1 effector cells and induces the expression of Socs3 (179, 180), while overexpression of Twist1 correlates with reduced levels of T-bet expression and decreased production of IFNγ by Th1 effector cells (182). Q RT-PCR analysis demonstrated that IL-10 and Twist1 expression levels were elevated in Justy mutant CD4 + Th1 effector cells, as compared to wild-type Th1 cells (Figure 25C and 25D). These data suggest that Gon4l plays a role in repressing several genes that impede Th1 differentiation. This is consistent with the proposed role of Gon4l as a repressor of genes that promote alternate pathways during specific developmental and functional processes. Discussion The above data demonstrate that Th1 differentiation by CD4 + T cells was impaired when Gon4l expression was decreased, resulting in the generation of fewer IFN-γ-producing cells. Acquisition of the ability to express IFN-γ by CD4 + T cells depends on IL-2 signaling. Consistent with the defect in Th1 differentiation, IL-2-
123 104 induced Stat5 phosphorylation and induction of Cyclin D2 is impaired in Justy mutant CD4 + T cells. Elevated levels of Socs3 RNA expression in naïve and Th-1-differentiated Justy mutant CD4 + T cells accompanied these abnormalities. Increased expression of Socs3 RNA and the inability to upregulate Cyclin D2 RNA expression were also observed in wild-type cells in which Gon4l expression was knocked down, confirming the specificity of effect. Taken together, these data suggest that, in CD4 + T cells, Gon4l functions to regulate expression of Socs3, and perhaps other proteins, that regulate T cell differentiation. In addition to driving proliferation, the IL-2/Stat5 signaling pathway is a key regulator of Th1 differentiation by CD4 + T cells. Similar to that observed with Justy mutant CD4 + T cells, Th1 differentiation by IL-2-deficient or Stat5-deficient CD4+ T cells is strongly impaired (161). In the absence of IL-2-induced Stat5 phosphorylation, expression of the key Th1 transcription factor T-bet and its ability to bind to the IFNγ promoter are substantially diminished, resulting in decreased IFNγ promoter accessibility and histone acetylation (158, 237). These data, and those presented here, suggest that impaired IL-2/Stat5 signaling is one of the underlying causes for the inability of Justy mutant CD4 + T cells to generate normal numbers of IFNγ-producing cells in response to Th1 polarizing conditions. A second underlying cause may be the increased levels of IL- 10 expression displayed in Justy mutant CD4 + T cells following stimulation under Th1 conditions. IL-10 has been shown to inhibit the cytokine synthesis of peripheral CD4 + T cells, including the production of IL-2 and IFNγ (179). IL-10 does not suppress IL-17 production by Th17 cells (180); thus, impaired IL-10 production in Justy cells may explain, in part, the specificity of the defect in Th1 development. However, IL-10 also inhibits IL-4 production by Th2 effector cells, yet Th2 effectors generated from Justy CD4 + T cells produce normal levels of IL-4 protein (179). Given Th1, Th2, Th17 and Treg cells are all capable of producing IL-10, it would be interesting to determine the
124 105 amount of IL-10 protein secreted by each of these effector subsets both during the differentiation process and following restimulation. Data from both Chapter III and Chapter IV of this dissertation demonstrate that expression of Socs3 RNA is significantly elevated whenever Gon4l expression is lacking. Thus, these data suggest that Gon4l is required to repress Socs3 transcription and allow for normal levels of Stat5 activation and target gene induction. Further, in the absence of the necessary level or extent of Stat5 function, Th1 differentiation by CD4 + T cells would be diminished. This explanation is supported by previous studies showing that increased Socs3 expression represses Th1 differentiation by CD4 + T cells (143). Further studies may provide insight into how Socs3 expression is precisely balanced in order to influence the development of Th cell lineages, as well as help determine the nature of the interaction between Gon4l and Socs3. In addition to Justy mutant CD4 + T cells displaying increased levels of Socs3; these cells also displayed increased levels of Twist1 RNA. Overexpression of Twist1 protein has been shown to inhibit IL-2 and IFNγ production in Th1 cells (182). Studies that have been published characterizing Justy mice and examining the function of Gon4l suggest that Gon4l is a co-repressor that plays a key role in transcriptional networks that control important biological processes. Consistent with this, CD4 + T cells lacking expression of Gon4l display increased levels of Twist1 RNA. Similar to the proposed role of Gon4l as a repressor of genes that inhibit B cell development and CD4 + T cell proliferation, data from this chapter suggests that Gon4l represses Twist1, a potent inhibitor of Th1 development. This strengthens the argument that decreased Gon4l expression results in increased levels of genes that impede developmental and functional processes within the immune system. However, several questions remain, including whether Gon4l directly inhibits Twist1 gene transcription or whether Gon4l perturbs the expression of other genes in the Th1 transcriptional network that regulates Twist1 expression. For example, little is known about Twist1 and it is possible that Twist1
125 106 levels increase in response to decreased levels of T-bet. Thus, the reduced levels of T-bet RNA in Justy mutant CD4 + T cells may result in increased levels of Twist1 RNA in these cells. Future studies will help differentiate genes that are direct targets of Gon4l from genes that are indirectly influenced by Gon4l expression.
126 107 Figure 20. Peripheral CD4 + T lymphocytes lacking Gon4l are defective in the ability to generate Th1-type effector cells. (A-C) Decreased IFNγ expression by Justy CD4 + T cells following Th1 differentiation. All data were obtained using the following method: purified CD4 + T cells were differentiated under Th1 polarizing conditions and harvested. To restimulate and elicit IFNγ expression, cells were replated on wells coated with anti-cd3. Samples were collected at times stated below. (A) Justy CD4 + T cells generate fewer IFNγproducing cells under Th1-polarizing conditions. Cells were differentiated, harvested and restimulated. After 5 hours, cells were analyzed for surface CD4 and intracellular IFNγ expression by flow cytometry. Data are representative of 5 independent experiments. (B) Graph shows IFNγ protein levels in culture supernatants collected after 48 hrs of restimulation. Shown are the means and standard deviations of values from triplicate samples as obtained by ELISA. Data are representative of 3 independent experiments. (C) Graph shows data from Q RT-PCR analysis of IFNγ RNA in cells following restimulation for 6 hrs. Graphs show levels for the RNA analyzed as normalized to Hprt RNA levels. The means and standard errors of data from at least three independent experiments are shown. P-values shown were obtained from Student s t-test.
127 108
128 109 Figure 21. Justy mutant CD4 T cells express normal levels of TCR and show normal responses to conditions that direct Th2 or Th17 differentiation. (A) Shown is flow cytometric analysis of TCRβ expression on the surface of wild-type and Justy mutant CD4 + T cells. Data are representative of 3 independent experiments. (B,C) Purified CD4 + T cells from wild-type and Justy mice were cultured either under unbiased, or Th0, conditions or those that promote differentiation into Th2 or Th17 effector cells as denoted on the x-axes of the graphs. After differentiation, cells were harvested and restimulated with anti-cd3 for 48 hrs. Culture supernatant was then collected and subjected to ELISA to determine the levels of IL-4 (B) or IL-17A present (C). Data are representative of at least 3 independent experiments.

129 110
130 111 Figure 22. Development of mature CD4 + T cells in a B cell deficient host does not impair CD4 + T proliferation in vitro. (A,B) Peripheral CD4 + T cells from Justy and µmt mice generate similar numbers of IFNγ-producing cells in vivo. Antigen-specific CD4 + T cells were detected by surface staining for CD4 and Thy1.2 together with intracellular staining for IFN-γ after a 5.5-h stimulation with 5 µm LLO (NEKYAQAYPNVS) peptide diluted 1:1000. The total number of Antigen-specific T cells per spleen was calculated by multiplying the frequency of CD4 + Thy1.2 + IFNγ + cells after stimulation with specific peptide by the total number of splenocytes. The number of cells producing cytokine in unstimulated samples was subtracted. B6 µmt and Justy mice were injected with attenuated L. monocytogenes and 7 days (A) or 40 days (B) later total splenocytes were isolated, restimulated with LLO peptides and stained with the above antibodies. Horizontal bars indicate mean cell count. Each point on the graph represents total IFNγproducing splenocytes generated from a single mouse that was independently injected with L. monocytogenes. (C) Reduced proliferative responses by CD4 + T cells isolated from B6 wild-type, Justy or µmt mice and incubated with increasing amounts of anti- CD3. Cultures were pulsed with 3 H-TTP during the last 8-hr of a 48-hr culture, after which cellular DNA was isolated and analyzed by scintillation counting. Graphs show tritiated thymidine levels (in counts per minute (CPM); y-axes) taken up by wild-type, Justy and µmt cells. WT is wild type. *One Justy mouse perished during the injection process and as a result only 3 Justy mouse spleens were analyzed on day-40.

131 112
132 113 Figure 23. Gon4l expression is essential to the development of Th1-type effector cells. (A-D) MicroRNA-mediated knockdown of Gon4l expression. Wild-type CD4 + T cells were transduced with the indicated microrna (mir)-expressing retroviral vectors during Th1 differentiation. The vector expressing the Luciferase mir served as a negative control. (A) After differentiation, cell lysates were prepared and analyzed by immunoblot using the indicated antibodies. Blotting with the Gapdh antibody confirmed equal protein loading. (B) Q RT-PCR analysis of Gon4l expression in transduced with the indicated mir-expressing retroviral vectors. (C,D) Graphs show IFNγ protein (C) or IFNγ RNA (D) levels in culture supernatants collected 48 hrs after restimulating cells transduced with the indicated mir-expressing retroviral vectors. Shown are the means and standard deviations of values from triplicate samples. Data are representative of 3 independent experiments.

133 114
134 115 Figure 24. Decreased Gon4l expression in Th1-type cells disrupts regulation of Cyclin D2 and Socs3 expression. Purified CD4 + T cells were subjected to the conditions described below and the levels of RNA encoding Cyclin D2 (A,B) and Socs3 (C) were determined by Q RT-PCR analysis. All graphs show values obtained after first normalizing to Hprt RNA levels and then normalizing each value relative to that represented by the left-most bar, which was set at 1. The means and standard errors of Q RT-PCR data from at least three independent experiments are shown. P-values were obtained from Student s t-test. (A) Th1 effectors generated from Justy mutant CD4 + T cells fail to increase Cyclin D2 RNA levels in response to stimuli. Shown is Q RT-PCR data obtained from wild-type (WT) and Justy mutant Th1 effector cells. (B) Knockdown of Gon4l expression in Th1 cells prevents upregulation of Cyclin D2 RNA expression in response to secondary TCR stimulation. Wild-type CD4 + T cells were transduced with the indicated microrna (mir)-expressing retroviral vectors during Th1 differentiation. After differentiation, cells were restimulated with anti-cd3 for 6 hrs and then harvested for Q RT-PCR analysis. (C) Knockdown of Gon4l expression results in elevated levels of Socs3 RNA in Th1 cells. Wild-type CD4 + T cells were transduced with the indicated microrna (mir)-expressing retroviral vectors during Th1 differentiation and then harvested for Q RT-PCR analysis. Data are representative of 3 independent experiments.

135 116
136 117 Figure 25. The protein network that controls Th1 differentiation is perturbed in Justy mutant CD4+ T cells. All data were obtained using purified CD4 + T cells incubated under Th1 polarizing conditions and harvested after 5 days of incubation. Graphs show data from Q RT-PCR analysis of RNAs (indicated on the y-axis) isolated immediately after differentiation. Values for each RNA were normalized to that for Hprt. (A) Reduced T- bet mrna levels in Th1-differentiated Justy CD4 + T cells. (B) Downregulation of Gata3 RNA expression levels in wild-type and Justy mutant Th1 effectors relative to respective naïve populations. Graph shows values obtained after first normalizing to Hprt RNA levels and then normalizing each value relative to that of the respective naïve population, which was set at 1. Elevated IL-10 (C) and Twist1 (D) mrna levels in Th1-differentiated Justy CD4 + T cells. (A, C, D) The means and standard errors of Q RT-PCR data from at least three independent experiments are shown. P-values were obtained from Student s t-test.

137 118
138 119 Figure 26. Proposed model of the role of Gon4l in the repression of genes that promote alternate fates and functions of lymphocytes during critical phases of development and activation. Data presented in this dissertation suggests that Gon4l functions to repress key genes involved in B cell development and the functional responses of peripheral CD4 + T cells. Gon4l likely mediates this repression by recruiting and/or interacting with other proteins and thereby, regulating chromatin remodeling events. The Justy mutation results in elevated levels of C/EBPα RNA, as well as PU.1 and Id2 RNA, in Fraction B bone marrow progenitors; this correlates with a complete block in the development of B lymphocytes. In peripheral CD4 + T lymphocytes, decreased levels of Gon4l expression result in elevated levels of Socs3 RNA, as well as Socs1 RNA; this correlates with impaired IL-2/Stat5 signaling and reduced proliferation by these cells. The differentiation of CD4 + T lymphocytes into Th1-type effectors is disrupted by the Justy mutation. Decreased Gon4l expression in Th1 effector cells results in elevated levels of Twist1 RNA, as well as Socs3 and IL-10 RNA, correlating with an impaired ability to produce IFNγ by these cells.


139 120
T cell maturation. T-cell Maturation. What allows T cell maturation?
 T-cell Maturation What allows T cell maturation? Direct contact with thymic epithelial cells Influence of thymic hormones Growth factors (cytokines, CSF) T cell maturation T cell progenitor DN DP SP 2ry
Development of B and T lymphocytes
 Development of B and T lymphocytes What will we discuss today? B-cell development T-cell development B- cell development overview Stem cell In periphery Pro-B cell Pre-B cell Immature B cell Mature B cell
Chapter 11. B cell generation, Activation, and Differentiation. Pro-B cells. - B cells mature in the bone marrow.
 Chapter B cell generation, Activation, and Differentiation - B cells mature in the bone marrow. - B cells proceed through a number of distinct maturational stages: ) Pro-B cell ) Pre-B cell ) Immature
Introduction. Introduction. Lymphocyte development (maturation)
") Introduction Abbas Chapter 8: Lymphocyte Development and the Rearrangement and Expression of Antigen Receptor Genes Christina Ciaccio, MD Children s Mercy Hospital January 5, 2009 Lymphocyte development
Introduction Abbas Chapter 8: Lymphocyte Development and the Rearrangement and Expression of Antigen Receptor Genes Christina Ciaccio, MD Children s Mercy Hospital January 5, 2009 Lymphocyte development
Lecture 7: Signaling Through Lymphocyte Receptors
 Lecture 7: Signaling Through Lymphocyte Receptors Questions to Consider After recognition of its cognate MHC:peptide, how does the T cell receptor activate immune response genes? What are the structural
T Cell Activation. Patricia Fitzgerald-Bocarsly March 18, 2009
 T Cell Activation Patricia Fitzgerald-Bocarsly March 18, 2009 Phases of Adaptive Immune Responses Phases of T cell responses IL-2 acts as an autocrine growth factor Fig. 11-11 Clonal Expansion of T cells
T Cell Receptor & T Cell Development
 T Cell Receptor & T Cell Development Questions for the next 2 lectures: How do you generate a diverse T cell population with functional TCR rearrangements? How do you generate a T cell population that
T Cell Effector Mechanisms I: B cell Help & DTH
 T Cell Effector Mechanisms I: B cell Help & DTH Ned Braunstein, MD The Major T Cell Subsets p56 lck + T cells γ δ ε ζ ζ p56 lck CD8+ T cells γ δ ε ζ ζ Cα Cβ Vα Vβ CD3 CD8 Cα Cβ Vα Vβ CD3 MHC II peptide
The development of T cells in the thymus
 T cells rearrange their receptors in the thymus whereas B cells do so in the bone marrow. The development of T cells in the thymus The lobular/cellular organization of the thymus Immature cells are called
The Adaptive Immune Responses
 The Adaptive Immune Responses The two arms of the immune responses are; 1) the cell mediated, and 2) the humoral responses. In this chapter we will discuss the two responses in detail and we will start
T Cell Development. Xuefang Cao, MD, PhD. November 3, 2015
 T Cell Development Xuefang Cao, MD, PhD November 3, 2015 Thymocytes in the cortex of the thymus Early thymocytes development Positive and negative selection Lineage commitment Exit from the thymus and
T cell development October 28, Dan Stetson
 T cell development October 28, 2016 Dan Stetson stetson@uw.edu 441 Lecture #13 Slide 1 of 29 Three lectures on T cells (Chapters 8, 9) Part 1 (Today): T cell development in the thymus Chapter 8, pages
CYTOKINE RECEPTORS AND SIGNAL TRANSDUCTION
 CYTOKINE RECEPTORS AND SIGNAL TRANSDUCTION What is Cytokine? Secreted popypeptide (protein) involved in cell-to-cell signaling. Acts in paracrine or autocrine fashion through specific cellular receptors.
Adaptive immune responses: T cell-mediated immunity
 MICR2209 Adaptive immune responses: T cell-mediated immunity Dr Allison Imrie allison.imrie@uwa.edu.au 1 Synopsis: In this lecture we will discuss the T-cell mediated immune response, how it is activated,
Structure and Function of Antigen Recognition Molecules
 MICR2209 Structure and Function of Antigen Recognition Molecules Dr Allison Imrie allison.imrie@uwa.edu.au 1 Synopsis: In this lecture we will examine the major receptors used by cells of the innate and
Scott Abrams, Ph.D. Professor of Oncology, x4375 Kuby Immunology SEVENTH EDITION
 Scott Abrams, Ph.D. Professor of Oncology, x4375 scott.abrams@roswellpark.org Kuby Immunology SEVENTH EDITION CHAPTER 11 T-Cell Activation, Differentiation, and Memory Copyright 2013 by W. H. Freeman and
5/1/13. The proportion of thymus that produces T cells decreases with age. The cellular organization of the thymus
 T cell precursors migrate from the bone marrow via the blood to the thymus to mature 1 2 The cellular organization of the thymus The proportion of thymus that produces T cells decreases with age 3 4 1
CELL BIOLOGY - CLUTCH CH THE IMMUNE SYSTEM.
 !! www.clutchprep.com CONCEPT: OVERVIEW OF HOST DEFENSES The human body contains three lines of against infectious agents (pathogens) 1. Mechanical and chemical boundaries (part of the innate immune system)
Signaling Through Immune System Receptors (Ch. 7)
") Signaling Through Immune System Receptors (Ch. 7) 1. General principles of signal transduction and propagation. 2. Antigen receptor signaling and lymphocyte activation. 3. Other receptors and signaling
Signaling Through Immune System Receptors (Ch. 7) 1. General principles of signal transduction and propagation. 2. Antigen receptor signaling and lymphocyte activation. 3. Other receptors and signaling
T cell and Cell-mediated immunity
 T cell and Cell-mediated immunity ( 第十章 第十二章第十二章 ) Lu Linrong ( 鲁林荣 ) PhD Laboratory of Immune Regulation Institute of Immunology Zhejiang University, School of Medicine Medical Research Building B815-819
The Development of Lymphocytes: B Cell Development in the Bone Marrow & Peripheral Lymphoid Tissue Deborah A. Lebman, Ph.D.
 The Development of Lymphocytes: B Cell Development in the Bone Marrow & Peripheral Lymphoid Tissue Deborah A. Lebman, Ph.D. OBJECTIVES 1. To understand how ordered Ig gene rearrangements lead to the development
Effector T Cells and
 1 Effector T Cells and Cytokines Andrew Lichtman, MD PhD Brigham and Women's Hospital Harvard Medical School 2 Lecture outline Cytokines Subsets of CD4+ T cells: definitions, functions, development New
Molecular Cell Biology - Problem Drill 19: Cell Signaling Pathways and Gene Expression
 Molecular Cell Biology - Problem Drill 19: Cell Signaling Pathways and Gene Expression Question No. 1 of 10 1. Which statement about cell signaling is correct? Question #1 (A) Cell signaling involves receiving
PATHOGEN INNOCUOUS ANTIGEN. No Danger- very low expression of costimulatory ligands Signal One Only
 Harvard-MIT Division of Health Sciences and Technology HST.176: Cellular and Molecular Immunology Course Director: Dr. Shiv illai AICD Naive Activated Effector Memory Activated Effector Naive AICD Activated
The Adaptive Immune Response. T-cells
 The Adaptive Immune Response T-cells T Lymphocytes T lymphocytes develop from precursors in the thymus. Mature T cells are found in the blood, where they constitute 60% to 70% of lymphocytes, and in T-cell
Examples of questions for Cellular Immunology/Cellular Biology and Immunology
 Examples of questions for Cellular Immunology/Cellular Biology and Immunology Each student gets a set of 6 questions, so that each set contains different types of questions and that the set of questions
B Lymphocyte Development and Activation
 Harvard-MIT Division of Health Sciences and Technology HST.176: Cellular and Molecular Immunology Course Director: Dr. Shiv Pillai 09/26/05; 9 AM Shiv Pillai B Lymphocyte Development and Activation Recommended
membrane form secreted form 13 aa 26 aa K K V V K K 3aa
 Harvard-MIT Division of Health Sciences and Technology HST.176: Cellular and Molecular Immunology Course Director: Dr. Shiv Pillai secreted form membrane form 13 aa 26 aa K K V V K K 3aa Hapten monosaccharide
Major Histocompatibility Complex (MHC) and T Cell Receptors
 and T Cell Receptors") Major Histocompatibility Complex (MHC) and T Cell Receptors Historical Background Genes in the MHC were first identified as being important genes in rejection of transplanted tissues Genes within the MHC
Major Histocompatibility Complex (MHC) and T Cell Receptors Historical Background Genes in the MHC were first identified as being important genes in rejection of transplanted tissues Genes within the MHC
Follicular Lymphoma. ced3 APOPTOSIS. *In the nematode Caenorhabditis elegans 131 of the organism's 1031 cells die during development.
 Harvard-MIT Division of Health Sciences and Technology HST.176: Cellular and Molecular Immunology Course Director: Dr. Shiv Pillai Follicular Lymphoma 1. Characterized by t(14:18) translocation 2. Ig heavy
Tolerance, autoimmunity and the pathogenesis of immunemediated inflammatory diseases. Abul K. Abbas UCSF
 Tolerance, autoimmunity and the pathogenesis of immunemediated inflammatory diseases Abul K. Abbas UCSF Balancing lymphocyte activation and control Activation Effector T cells Tolerance Regulatory T cells
The T cell receptor for MHC-associated peptide antigens
 1 The T cell receptor for MHC-associated peptide antigens T lymphocytes have a dual specificity: they recognize polymporphic residues of self MHC molecules, and they also recognize residues of peptide
Chapter 13: Cytokines
 Chapter 13: Cytokines Definition: secreted, low-molecular-weight proteins that regulate the nature, intensity and duration of the immune response by exerting a variety of effects on lymphocytes and/or
all of the above the ability to impart long term memory adaptive immunity all of the above bone marrow none of the above
 1. (3 points) Immediately after a pathogen enters the body, it faces the cells and soluble proteins of the innate immune system. Which of the following are characteristics of innate immunity? a. inflammation
T cell and Cell-mediated immunity
 T cell and Cell-mediated immunity Lu Linrong ( 鲁林荣 ) PhD Laboratory of Immune Regulation Institute of Immunology Zhejiang University, it School of Medicine i Medical Research Building B815-819 Email: Lu.Linrong@gmail.com
RAS Genes. The ras superfamily of genes encodes small GTP binding proteins that are responsible for the regulation of many cellular processes.
 ۱ RAS Genes The ras superfamily of genes encodes small GTP binding proteins that are responsible for the regulation of many cellular processes. Oncogenic ras genes in human cells include H ras, N ras,
B cell development in the bone marrow.
 development in the bone. s develop from multipotent haematopoietic stem s in the bone that produce lymphoid progenitors which in turn generate s. s with a unique antibody specificity develop by initial
T-cell activation T cells migrate to secondary lymphoid tissues where they interact with antigen, antigen-presenting cells, and other lymphocytes:
 Interactions between innate immunity & adaptive immunity What happens to T cells after they leave the thymus? Naïve T cells exit the thymus and enter the bloodstream. If they remain in the bloodstream,
Andrea s SI Session PCB Practice Test Test 3
 Practice Test Test 3 READ BEFORE STARTING PRACTICE TEST: Remember to please use this practice test as a tool to measure your knowledge, and DO NOT use it as your only tool to study for the test, since
Cytokines modulate the functional activities of individual cells and tissues both under normal and pathologic conditions Interleukins,
 Cytokines http://highered.mcgraw-hill.com/sites/0072507470/student_view0/chapter22/animation the_immune_response.html Cytokines modulate the functional activities of individual cells and tissues both under
T cell Receptor. Chapter 9. Comparison of TCR αβ T cells
 Chapter 9 The αβ TCR is similar in size and structure to an antibody Fab fragment T cell Receptor Kuby Figure 9-3 The αβ T cell receptor - Two chains - α and β - Two domains per chain - constant (C) domain
Enzyme-coupled Receptors. Cell-surface receptors 1. Ion-channel-coupled receptors 2. G-protein-coupled receptors 3. Enzyme-coupled receptors
 Enzyme-coupled Receptors Cell-surface receptors 1. Ion-channel-coupled receptors 2. G-protein-coupled receptors 3. Enzyme-coupled receptors Cell-surface receptors allow a flow of ions across the plasma
G-Protein Signaling. Introduction to intracellular signaling. Dr. SARRAY Sameh, Ph.D
 G-Protein Signaling Introduction to intracellular signaling Dr. SARRAY Sameh, Ph.D Cell signaling Cells communicate via extracellular signaling molecules (Hormones, growth factors and neurotransmitters
Autoimmunity. Autoimmunity arises because of defects in central or peripheral tolerance of lymphocytes to selfantigens
 Autoimmunity Autoimmunity arises because of defects in central or peripheral tolerance of lymphocytes to selfantigens Autoimmune disease can be caused to primary defects in B cells, T cells and possibly
Andrea s Final Exam Review PCB 3233 Spring Practice Final Exam
 NOTE: Practice Final Exam Although I am posting the answer key for this practice exam, I want you to use this practice to gauge your knowledge, and try to figure out the right answer by yourself before
Effector mechanisms of cell-mediated immunity: Properties of effector, memory and regulatory T cells
 ICI Basic Immunology course Effector mechanisms of cell-mediated immunity: Properties of effector, memory and regulatory T cells Abul K. Abbas, MD UCSF Stages in the development of T cell responses: induction
Generation of the Immune Response
 Generation of the Immune Response Sheet 18 immunity I only added extra notes that were explained in the lecture, refer back to the slides. SLIDE 3: In the generation of Immune response whether by B or
COURSE: Medical Microbiology, MBIM 650/720 - Fall TOPIC: Antigen Processing, MHC Restriction, & Role of Thymus Lecture 12
 COURSE: Medical Microbiology, MBIM 650/720 - Fall 2008 TOPIC: Antigen Processing, MHC Restriction, & Role of Thymus Lecture 12 FACULTY: Dr. Mayer Office: Bldg. #1, Rm B32 Phone: 733-3281 Email: MAYER@MED.SC.EDU
FOCiS. Lecture outline. The immunological equilibrium: balancing lymphocyte activation and control. Immunological tolerance and immune regulation -- 1
 1 Immunological tolerance and immune regulation -- 1 Abul K. Abbas UCSF FOCiS 2 Lecture outline Principles of immune regulation Self-tolerance; mechanisms of central and peripheral tolerance Inhibitory
As we know, T cell precursors (pro-t cells) originate in the bone marrow and migrate to the thymus via the blood.
 originate in the bone marrow and migrate to the thymus via the blood.") Immunology Dr. John J. Haddad Chapter 10 T Cell Maturation, Activation and Differentiation T Cell Maturation As we know, T cell precursors (pro-t cells) originate in the bone marrow and migrate to the
Immunology Dr. John J. Haddad Chapter 10 T Cell Maturation, Activation and Differentiation T Cell Maturation As we know, T cell precursors (pro-t cells) originate in the bone marrow and migrate to the
Test Bank for Basic Immunology Functions and Disorders of the Immune System 4th Edition by Abbas
 Test Bank for Basic Immunology Functions and Disorders of the Immune System 4th Edition by Abbas Chapter 04: Antigen Recognition in the Adaptive Immune System Test Bank MULTIPLE CHOICE 1. Most T lymphocytes
Supplemental Figure 1. Signature gene expression in in vitro differentiated Th0, Th1, Th2, Th17 and Treg cells. (A) Naïve CD4 + T cells were cultured
 Naïve CD4 + T cells were cultured") Supplemental Figure 1. Signature gene expression in in vitro differentiated Th0, Th1, Th2, Th17 and Treg cells. (A) Naïve CD4 + T cells were cultured under Th0, Th1, Th2, Th17, and Treg conditions. mrna
Supplemental Figure 1. Signature gene expression in in vitro differentiated Th0, Th1, Th2, Th17 and Treg cells. (A) Naïve CD4 + T cells were cultured under Th0, Th1, Th2, Th17, and Treg conditions. mrna
White Blood Cells (WBCs)
") YOUR ACTIVE IMMUNE DEFENSES 1 ADAPTIVE IMMUNE RESPONSE 2! Innate Immunity - invariant (generalized) - early, limited specificity - the first line of defense 1. Barriers - skin, tears 2. Phagocytes - neutrophils,
YOUR ACTIVE IMMUNE DEFENSES 1 ADAPTIVE IMMUNE RESPONSE 2! Innate Immunity - invariant (generalized) - early, limited specificity - the first line of defense 1. Barriers - skin, tears 2. Phagocytes - neutrophils,
Regulation of Gene Expression in Eukaryotes
 Ch. 19 Regulation of Gene Expression in Eukaryotes BIOL 222 Differential Gene Expression in Eukaryotes Signal Cells in a multicellular eukaryotic organism genetically identical differential gene expression
mirna Dr. S Hosseini-Asl
 mirna Dr. S Hosseini-Asl 1 2 MicroRNAs (mirnas) are small noncoding RNAs which enhance the cleavage or translational repression of specific mrna with recognition site(s) in the 3 - untranslated region
LESSON 2: THE ADAPTIVE IMMUNITY
 Introduction to immunology. LESSON 2: THE ADAPTIVE IMMUNITY Today we will get to know: The adaptive immunity T- and B-cells Antigens and their recognition How T-cells work 1 The adaptive immunity Unlike
Computational Biology I LSM5191
 Computational Biology I LSM5191 Aylwin Ng, D.Phil Lecture 6 Notes: Control Systems in Gene Expression Pulling it all together: coordinated control of transcriptional regulatory molecules Simple Control:
Supplementary Figure 1. Normal T lymphocyte populations in Dapk -/- mice. (a) Normal thymic development in Dapk -/- mice. Thymocytes from WT and Dapk
 Normal thymic development in Dapk -/- mice. Thymocytes from WT and Dapk") Supplementary Figure 1. Normal T lymphocyte populations in Dapk -/- mice. (a) Normal thymic development in Dapk -/- mice. Thymocytes from WT and Dapk -/- mice were stained for expression of CD4 and CD8.
Supplementary Figure 1. Normal T lymphocyte populations in Dapk -/- mice. (a) Normal thymic development in Dapk -/- mice. Thymocytes from WT and Dapk -/- mice were stained for expression of CD4 and CD8.
Cell Signaling part 2
 15 Cell Signaling part 2 Functions of Cell Surface Receptors Other cell surface receptors are directly linked to intracellular enzymes. The largest family of these is the receptor protein tyrosine kinases,
Ig light chain rearrangement: Rescue pathway
 B Cell Development Ig light chain rearrangement: Rescue pathway There is only a 1:3 chance of the join between the V and J region being in frame Vk Jk Ck Non-productive Rearrangement Light chain has a
MHC class I MHC class II Structure of MHC antigens:
 MHC class I MHC class II Structure of MHC antigens: MHC class I antigens consist of a transmembrane heavy chain (α chain) that is non-covalently associated with β2- microglobulin. Membrane proximal domain
Antibodies and T Cell Receptor Genetics Generation of Antigen Receptor Diversity
 Antibodies and T Cell Receptor Genetics 2008 Peter Burrows 4-6529 peterb@uab.edu Generation of Antigen Receptor Diversity Survival requires B and T cell receptor diversity to respond to the diversity of
SUPPLEMENTARY INFORMATION
 doi: 1.138/nature89 IFN- (ng ml ) 5 4 3 1 Splenocytes NS IFN- (ng ml ) 6 4 Lymph node cells NS Nfkbiz / Nfkbiz / Nfkbiz / Nfkbiz / IL- (ng ml ) 3 1 Splenocytes IL- (ng ml ) 1 8 6 4 *** ** Lymph node cells
Principles of Adaptive Immunity
 Principles of Adaptive Immunity Chapter 3 Parham Hans de Haard 17 th of May 2010 Agenda Recognition molecules of adaptive immune system Features adaptive immune system Immunoglobulins and T-cell receptors
Immune Regulation and Tolerance
 Immune Regulation and Tolerance Immunoregulation: A balance between activation and suppression of effector cells to achieve an efficient immune response without damaging the host. Activation (immunity)
Supplementary Table S1. Primers used for quantitative real-time polymerase chain reaction. Marker Sequence (5 3 ) Accession No.
 Accession No.") Supplementary Tables Supplementary Table S1. Primers used for quantitative real-time polymerase chain reaction Marker Sequence (5 3 ) Accession No. Angiopoietin 1, ANGPT1 A CCCTCCGGTGAATATTGGCTGG NM_001146.3
Supplementary Tables Supplementary Table S1. Primers used for quantitative real-time polymerase chain reaction Marker Sequence (5 3 ) Accession No. Angiopoietin 1, ANGPT1 A CCCTCCGGTGAATATTGGCTGG NM_001146.3
Recommended reading: Abbas et al. 5th edition, chapters 7 and 10; Janeway and Travers, 5th edition, chapter 7.
 Harvard-MIT Division of Health Sciences and Technology HST.176: Cellular and Molecular Immunology Course Director: Dr. Shiv Pillai 10/05/05; 11 AM Shiv Pillai T Lymphocyte Development Recommended reading:
Supplemental Table I.
 Supplemental Table I Male / Mean ± SEM n Mean ± SEM n Body weight, g 29.2±0.4 17 29.7±0.5 17 Total cholesterol, mg/dl 534.0±30.8 17 561.6±26.1 17 HDL-cholesterol, mg/dl 9.6±0.8 17 10.1±0.7 17 Triglycerides,
Pre-B and pre-t-cell receptors: conservation of strategies in regulating early lymphocyte development
 Stefan A. Muljo Mark S. Schlissel Pre-B and pre-t-cell receptors: conservation of strategies in regulating early lymphocyte development Authors addresses Stefan A. Muljo 1, Mark S. Schlissel 2, 1Graduate
Signaling. Dr. Sujata Persad Katz Group Centre for Pharmacy & Health research
 Signaling Dr. Sujata Persad 3-020 Katz Group Centre for Pharmacy & Health research E-mail:sujata.persad@ualberta.ca 1 Growth Factor Receptors and Other Signaling Pathways What we will cover today: How
Scott Abrams, Ph.D. Professor of Oncology, x4375 Kuby Immunology SEVENTH EDITION
 Scott Abrams, Ph.D. Professor of Oncology, x4375 scott.abrams@roswellpark.org Kuby Immunology SEVENTH EDITION CHAPTER 13 Effector Responses: Cell- and Antibody-Mediated Immunity Copyright 2013 by W. H.
Immunology Basics Relevant to Cancer Immunotherapy: T Cell Activation, Costimulation, and Effector T Cells
 Immunology Basics Relevant to Cancer Immunotherapy: T Cell Activation, Costimulation, and Effector T Cells Andrew H. Lichtman, M.D. Ph.D. Department of Pathology Brigham and Women s Hospital and Harvard
Adaptive Immune System
 Short Course on Immunology Adaptive Immune System Bhargavi Duvvuri Ph.D IIIrd Year (Immunology) bhargavi@yorku.ca Supervisor Dr.Gillian E Wu Professor, School of Kinesiology and Health Sciences York University,
Stage I Stage II Stage III Stage IV
 Harvard-MIT Division of Health Sciences and Technology HST.176: Cellular and Molecular Immunology Course Director: Dr. Shiv Pillai Stage I Stage II Stage III Stage IV Receptor gene Rearrangement Elimination
Introduction to Cancer Biology
 Introduction to Cancer Biology Robin Hesketh Multiple choice questions (choose the one correct answer from the five choices) Which ONE of the following is a tumour suppressor? a. AKT b. APC c. BCL2 d.
Immunology - Lecture 2 Adaptive Immune System 1
 Immunology - Lecture 2 Adaptive Immune System 1 Book chapters: Molecules of the Adaptive Immunity 6 Adaptive Cells and Organs 7 Generation of Immune Diversity Lymphocyte Antigen Receptors - 8 CD markers
SPECIFIC IMMUNITY = ACQUIRED IMMUNITY = ADAPTIVE IMMUNITY SPECIFIC IMMUNITY - BASIC CHARACTERISTIC
 SPECIFIC IMMUNITY - BASIC CHARACTERISTIC SPECIFIC IMMUNITY = ACQUIRED IMMUNITY = ADAPTIVE IMMUNITY BASIC TERMINOLOGY SPECIFIC IMMUNITY humoral mediated with antibodies cellular mediated with T lymphocytes
Newly Recognized Components of the Innate Immune System
 Newly Recognized Components of the Innate Immune System NOD Proteins: Intracellular Peptidoglycan Sensors NOD-1 NOD-2 Nod Protein LRR; Ligand Recognition CARD RICK I-κB p50 p65 NF-κB Polymorphisms in Nod-2
Central tolerance. Mechanisms of Immune Tolerance. Regulation of the T cell response
 Immunoregulation: A balance between activation and suppression that achieves an efficient immune response without damaging the host. Mechanisms of Immune Tolerance ACTIVATION (immunity) SUPPRESSION (tolerance)
Mechanisms of Immune Tolerance
 Immunoregulation: A balance between activation and suppression that achieves an efficient immune response without damaging the host. ACTIVATION (immunity) SUPPRESSION (tolerance) Autoimmunity Immunodeficiency
1. Overview of Adaptive Immunity
 Chapter 17A: Adaptive Immunity Part I 1. Overview of Adaptive Immunity 2. T and B Cell Production 3. Antigens & Antigen Presentation 4. Helper T cells 1. Overview of Adaptive Immunity The Nature of Adaptive
Chapter 7 Conclusions
 VII-1 Chapter 7 Conclusions VII-2 The development of cell-based therapies ranging from well-established practices such as bone marrow transplant to next-generation strategies such as adoptive T-cell therapy
IMMUNE CELL SURFACE RECEPTORS AND THEIR FUNCTIONS
 LECTURE: 07 Title: IMMUNE CELL SURFACE RECEPTORS AND THEIR FUNCTIONS LEARNING OBJECTIVES: The student should be able to: The chemical nature of the cellular surface receptors. Define the location of the
Adaptive Immunity: Humoral Immune Responses
 MICR2209 Adaptive Immunity: Humoral Immune Responses Dr Allison Imrie 1 Synopsis: In this lecture we will review the different mechanisms which constitute the humoral immune response, and examine the antibody
Supplementary Figure 1 CD4 + T cells from PKC-θ null mice are defective in NF-κB activation during T cell receptor signaling. CD4 + T cells were
 Supplementary Figure 1 CD4 + T cells from PKC-θ null mice are defective in NF-κB activation during T cell receptor signaling. CD4 + T cells were isolated from wild type (PKC-θ- WT) or PKC-θ null (PKC-θ-KO)
Tolerance 2. Regulatory T cells; why tolerance fails. Abul K. Abbas UCSF. FOCiS
 1 Tolerance 2. Regulatory T cells; why tolerance fails Abul K. Abbas UCSF FOCiS 2 Lecture outline Regulatory T cells: functions and clinical relevance Pathogenesis of autoimmunity: why selftolerance fails
Helminth worm, Schistosomiasis Trypanosomes, sleeping sickness Pneumocystis carinii. Ringworm fungus HIV Influenza
 Helminth worm, Schistosomiasis Trypanosomes, sleeping sickness Pneumocystis carinii Ringworm fungus HIV Influenza Candida Staph aureus Mycobacterium tuberculosis Listeria Salmonella Streptococcus Levels
Immunology Lecture 4. Clinical Relevance of the Immune System
 Immunology Lecture 4 The Well Patient: How innate and adaptive immune responses maintain health - 13, pg 169-181, 191-195. Immune Deficiency - 15 Autoimmunity - 16 Transplantation - 17, pg 260-270 Tumor
Allergy and Immunology Review Corner: Chapter 1 of Immunology IV: Clinical Applications in Health and Disease, by Joseph A. Bellanti.
 Allergy and Immunology Review Corner: Chapter 1 of Immunology IV: Clinical Applications in Health and Disease, by Joseph A. Bellanti. Chapter 1: Overview of Immunology Prepared by David Scott, MD, Scripps
Defensive mechanisms include :
 Acquired Immunity Defensive mechanisms include : 1) Innate immunity (Natural or Non specific) 2) Acquired immunity (Adaptive or Specific) Cell-mediated immunity Humoral immunity Two mechanisms 1) Humoral
Structure and Function of Fusion Gene Products in. Childhood Acute Leukemia
 Structure and Function of Fusion Gene Products in Childhood Acute Leukemia Chromosomal Translocations Chr. 12 Chr. 21 der(12) der(21) A.T. Look, Science 278 (1997) Distribution Childhood ALL TEL-AML1 t(12;21)
Chapter 22: The Lymphatic System and Immunity
 Bio40C schedule Lecture Immune system Lab Quiz 2 this week; bring a scantron! Study guide on my website (see lab assignments) Extra credit Critical thinking questions at end of chapters 5 pts/chapter Due
The Adaptive Immune Response: T lymphocytes and Their Functional Types *
 OpenStax-CNX module: m46560 1 The Adaptive Immune Response: T lymphocytes and Their Functional Types * OpenStax This work is produced by OpenStax-CNX and licensed under the Creative Commons Attribution
number Done by Corrected by Doctor Maha Shomaf
 number 19 Done by Waseem Abo-Obeida Corrected by Abdullah Zreiqat Doctor Maha Shomaf Carcinogenesis: the molecular basis of cancer. Non-lethal genetic damage lies at the heart of carcinogenesis and leads
Haematopoietic stem cells
 Haematopoietic stem cells Neil P. Rodrigues, DPhil NIH Centre for Biomedical Research Excellence in Stem Cell Biology Boston University School of Medicine neil.rodrigues@imm.ox.ac.uk Haematopoiesis: An
T Cell Activation, Costimulation and Regulation
 1 T Cell Activation, Costimulation and Regulation Abul K. Abbas, MD University of California San Francisco 2 Lecture outline T cell antigen recognition and activation Costimulation, the B7:CD28 family
The Adaptive Immune Response. B-cells
 The Adaptive Immune Response B-cells The innate immune system provides immediate protection. The adaptive response takes time to develop and is antigen specific. Activation of B and T lymphocytes Naive
7.012 Quiz 3 Answers
 MIT Biology Department 7.012: Introductory Biology - Fall 2004 Instructors: Professor Eric Lander, Professor Robert A. Weinberg, Dr. Claudette Gardel Friday 11/12/04 7.012 Quiz 3 Answers A > 85 B 72-84