Thesis. Reference. Deciphering the code for retroviral integration site selection. SANTONI, Federico
|
|
|
- Ruby Sharp
- 6 years ago
- Views:
Transcription


1 Thesis Deciphering the code for retroviral integration site selection SANTONI, Federico Abstract Upon cell invasion, retroviruses integrate the retroviral cdna within the host chromosomal DNA. Integration occurs throughout the host cell genome but little is known about how integration sites are selected. The approach we propose is to identify markers predictive of retroviral integration. ChIPSeq datasets for more than 60 factors were compared with 14 retroviral integration data sets. By combining peaks from ChIPSeq datasets, a supermarker was identified that localized within 2 kb of 75% of gamma-proviruses and detected differences in integration preferences among different cell types. Thus we applied these findings to study viral sequences acquired by the human genome over the course of evolution. Indeed, HERV-H gamma-proviruses were found to be highly associated with one retroviral marker but only in embryonic and induced stem cells. We also discovered that HERV-H is also highly and specifically transcribed in this kind of cells, suggesting a role for these viral elements during embryonic development. Reference SANTONI, Federico. Deciphering the code for retroviral integration site selection. Thèse de doctorat : Univ. Genève, 2011, no. Sc URN : urn:nbn:ch:unige DOI : /archive-ouverte/unige:16772 Available at: Disclaimer: layout of this document may differ from the published version.
2 Université de Genève Département d'informatique Institut Suisse de Bioinformatique Professeur Bastien Chopard Faculté de Médicine Département de Microbiologie et Médicine Moléculaire Professeur Jeremy Luban Deciphering the code for retroviral integration site selection THESE présentée a la Faculté des Sciences de l Université de Genève pour obtenir le grade de Docteur ès Sciences, mention Bioinformatique par Federico Andrea SANTONI de Sassari (Italie) Thèse N Genève 2011
3 2
4 NOTE Part of the results presented in this manuscript have been published on peer-reviewed ournals and referenced in the text: Leo S, Santoni FA, Zanetti G (2009) Biodoop: Bioinformatics on Hadoop. Proceedings of ICPP Workshops, Vienna. pp Santoni FA, Hartley O, Luban J (2010) Deciphering the code for retroviral integration target site selection. PLoS Computational Biology 6: e Pertel T, Hausmann S, Morger D, Zuger S, Guerra J, Lascano J, Rehinard C, Santoni FA et al. (2011) TRIM5 is an innate immune sensor for the retrovirus capsid lattice. Nature 472:
5 A Giulio, Micol ed Eveline "He that can have patience can have what he will". BENJAMIN FRANKLIN 4
6 CONTENTS 1 Introduction Development of tools for detection and display of associations between retroviral integration sites and chromatin features Statistics tools for Association measures F score Chromosome proection mandala Association of retroviral integration sites with ChIPSeq datasets Setting the Window size HIV/MLV chimera associates with gammaretroviral markers STAT1 association with gammaretroviruses The F score is robust and highly discriminating Comparison of Precision/Recall-based methods with other methods, applied to the analysis of provirus datasets Generation of a supermarker for retrovirus integration Deriving The supermarker Validation of the supermarker Expectation-Maximization based algorithm for the evaluation of the Supermarker Map-reduce based Parallel Version The F score detects differences between cell types Use of the supermarker to predict the likelihood of integration at specific loci within specific cell types HIV integration site selection Discovering marker for endogenous retroviral integration site selection Association with Homo Sapiens and mus musculus endogenous retroviruses Human endogenous retroviruses Endogenous retroviruses in mice Does HERV-H maintain the memory of ancestral epigenetic factors? HERV-H expression in human Embryonic and differentiated cells RNASeq data analysis Probabilistic Alignment of multiple mapping reads Specificity HERV-H expression HERV-H expression is specific in hesc HERV-H expression in human ES during differentiation What is the HERV-H specific transcription factor? Expression of other repetitive elements Possible roles of HERV-H in embryonic stem cells Hypothesis 1: HERV-H as a coding sequence Hypothesis 2: microrna Reservoir Hypothesis 3: microrna Decoy Hypothesis 4: Antiviral factor Discussion
7 5.1 Advantages of the F score Significance of the supermarker Mechanistic implications Epigenetic association with Endogenous retroviruses Retroviruses modeled the shape and the behavior of human genome Appendix A Appendix B Bibliography
8 ABSTRACT Upon cell invasion, retroviruses generate a DNA copy (cdna) of their RNA genome and integrate the retroviral cdna within the host chromosomal DNA. Integration occurs throughout the host cell genome but target site selection is not random. The integration of each subgroup of retroviruses is distinguished by attraction to particular features on the host chromosomes. Despite extensive efforts to identify host factors that interact with retrovirion components or chromosome features predictive of integration, little is known about how integration sites are selected. The approach we propose is to identify markers predictive of retroviral integration by exploiting Precision-Recall methods for extracting information from highly skewed datasets to derive robust and discriminating measures of association. ChIPSeq datasets for more than 60 factors were compared with 14 retroviral integration data sets. Among all retroviral subgroups, we found gamma-retroviruses to be highly associated with some of the factors. When compared with Murine Leukemia Virus (MLV), Porcine Endogenous Retrovirus (PERV) or Xenotropic Murine Leukimia related Retrovirus (XMRV) integration sites, strong association was observed with STAT1, acetylation of H3 and H4 at several positions, and methylation of H2AZ, H3K4, and K9. By combining peaks from ChIPSeq datasets, a supermarker was identified that localized within 2 kb of 75% of MLV proviruses and detected differences in integration preferences among different cell types. The supermarker predicted the likelihood of integration within specific chromosomal regions in a cell-type specific manner, yielding probabilities for integration into proto-oncogene LMO2 identical to experimentally determined values. The supermarker thus identifies chromosomal features highly favored for retroviral integration, provides clues to the mechanism by which retrovirus integration sites are selected, and offers a tool for predicting cell-type specific proto-oncogene activation by retroviruses. As a possible field of application of these findings, we applied them to study viral sequences that have been acquired by the vertebrate genome over the course of evolution. With the exception of rare examples, these viral sequences are likely derived from retroviral cdna that had integrated into host germ cells or embryonic tissues in the distant past. These fossils are called endogenous retroviruses. In the human genome, retroviral DNA accounts for at least 8% 7
9 of the total DNA. Three main classes of human endogenous retroviruses (HERV) - gamma, beta and delta - have been identified by comparison with DNA sequences of known exogenous retroviruses. HERV-K, a betaretrovirus, and HERV-H, a gammaretrovirus, are the most recent entries into the primate genome, 10 and 25 million years ago, respectively. Though many endogenous retroviral RNAs are transcribed, few encode functional proteins, and replication competent endogenous retroviruses have not been detected in the human genome. Having identified cell-type specific chromosomal markers (including H3K4me3) that predict the site of integration of all exogenous gamma-retroviruses for which provirus sequencing data is available, we hypothesized that these same markers would be associated with the chromosomal locations of the endogenous gammaretrovirus HERV-H. Indeed, HERV-H proviruses were found to be highly associated with H3K4me3, but only in embryonic stem cells and, to a lesser extent, in induced pluripotent stem cells. No significant association was observed in more differentiated cells types and no association was observed with any other endogenous retrovirus, such as HERV-K. Additionally, strong association was observed between HERV-H LTR (Long Terminal Repeats) promoters and transcription factors, such as NANOG, that are required for pluripotency. Moreover, examining previously published whole-genome RNASeq datasets, we found that HERV-H RNA levels are extremely high in ES cells and decrease in differentiated cells, indicating that HERV-H could be used as a sensitive marker for differentiation. Being HERV-H a primate-specific virus, we speculate possible functions of these transcripts, which could either contribute to the maintenance of the undifferentiated state of human embryonic stem cells or provide an antiviral defense mechanism which prevents novel retrovirus infections of human hematopoietic stem cells. 8
10 1 INTRODUCTION Retroviruses and retrotransposons are of profound importance to eukaryotic biology, evolution, and medicine. These retroelements constitute at least 40% of the mass of the mammalian genomes [1] and 75% of the maize genome [2]. When retroelements are transcribed, they remodel eukaryotic genomes by generating a cdna and integrating it into locations scattered throughout the host cell genome [3,4]. By doing so, retroelements have the potential to influence local gene expression or to promote recombination and generate deletion mutations [5,6,7]. In some cases they act in trans to catalyze retrotransposition of cellular RNAs, generating pseudogenes or new exons within existing genes [8,9]. Since retrotransposon enhancer elements influence local gene expression, and retrotransposon silencing can vary from cell to cell, it has been proposed that retrotransposons contribute to the phenotypic variation that distinguishes genetically identical individuals [10]. Additionally, it has been suggested that programmed release from retroelement silencing accompanies metazoan development and leads to hypermutation in complex somatic tissues like the brain [11,12]. Among retroelements, retroviruses have received much attention, in part due to their association with human disease. Roughly speaking, the life cycle of these elements can be divided into two distinct phases. The early phase refers to the steps that lead to viral cdna integration into the host genome. First the viral particle is acknowledged by cell surface receptors, binds the cell and enters into the cytoplasm. The viral RNA is then released, protected by a coating Capsid (CA) lattice. Reverse Transcriptase (RT) process the RNA generating the double stranded cdna that is driven to the nucleus and integrated into the host DNA (Figure 1). The late phase begins with the exploitation the transcriptional machinery of the host cell. Indeed the viral promoter embedded in the Long Terminal Repeat (LTR) recruits transcription factors to start the production of viral mrna in an efficient way. The mrna is exported to cytoplasm and part of it is translated into viral proteins that localize in proximity of the cell surface. There viral particles assemble by encapsidating (i.e. enclosing into the 9
11 nascent capsid) two copies of viral RNA and bud out from the cellular membrane towards new target cells [3]. It is noteworthy that, in comparison with the later events of retrovirus infection, the comprehension of early steps is still poorly developed. Basic studies concerning retroviral replication have greatly advanced understanding of the biochemistry of retrotransposition [4,13]. A tetramer of the viral integrase protein (IN) [14] cleaves the ends of the viral cdna to produce recessed 3 OH and free CA dinucleotides at the terminus of each long terminal repeat (LTR) [15]. IN catalyzes nucleophilic attack of host chromosomal DNA by the two free 3'-OH viral DNA ends, resulting in covalent attachment of the retroviral DNA strands to the host DNA [16,17,18]. The remaining free ends of the viral DNA are then repaired by host enzymes [19,20,21](Figure 1). Study of HIV-1, the retrovirus that causes AIDS, has led to the development of drugs that block retrotransposition and alter progression to AIDS [22,23]. Attempts to develop better therapies for HIV-1 would benefit from a deeper understanding of the integration mechanism. Gene therapy vectors based on another retrovirus, MLV, dramatically rescued children from a life-threatening illness, but a large percentage of the patients suffered from insertional activation of proto-oncogenes [24,25,26,27,28]. This lethal complication further emphasizes the need to better understand retroviral integration site selection in host chromosomal DNA. Retroviruses establish copies of their DNA (proviruses) at sites throughout the host cell genome, but integration is not random. Some regions are favored hundreds of times over others [29,30]. For some retroviruses, transcribed regions are preferred [31,32], though high-level, concurrent transcription at a given target gene inhibits integration [33]. Nucleosome-bearing DNA is targeted more efficiently than free DNA in vitro [34,35,36,37] perhaps because the integration machinery preferentially targets bent DNA [38]. Indeed, high-throughput sequencing experiments analyzing over 40,000 HIV-1 integration sites in cells show periodic distribution on predicted nucleosome positions, consistent with favored integration into outward-facing DNA maor grooves in chromatin [39]. 10
12 Figure 1. Schematic view of retroviral cell infection. The viral particle envelope fuses with cell membrane and release its viral RNA. Reverse transcription happens in cytoplasm yielding the viral double stranded DNA (dsdna) that is transported into the nucleus in a Pre-Integration Complex (PIC). The Integrase (IN) cleaves the host DNA and catalyzes the covalent attachment of two of the viral DNA free ends. The process is completed by host DNA repairing enzymes. The retrotransposition mechanism, and integration site selection on a genomic scale, differs considerably from one class of retrovirus to another. HIV-1 infects non-dividing cells [40,41] and integrates preferentially into transcriptionally active genes, all along the length of the gene [32,42,43]. In contrast, MLV integration requires mitosis [41,44] and has a tendency to localize near promoters, 20% of the time within 2 kb of transcriptional start sites [31,42]. Retroviral 11
13 capsid (CA) is sufficient to determine whether a given virus infects non-dividing cells [45,46] but both CA and IN contribute to integration site selection: an HIV-1 vector in which IN-coding sequences and a fragment of gag encompassing CA were replaced by the homologous MLV sequences exhibits the retrotransposition behavior of MLV [43]. Of the many host factors reported to interact with retroviral CA or IN [47,48,49,50,51,52], the lentiviral IN-interacting protein PSIP1/LEDGF/p75 [53,54,55] is the most informative regarding integration site selection. LEDGF promotes the infectivity of HIV-1 and related lentiviruses and influences integration site selection [56,57,58,59] perhaps by acting as a physical tether directing integration to the chromosomal sites this protein naturally occupies. In support of this model, fusion of heterogeneous chromatin binding domains to the part of LEDGF that binds IN redirected the site of HIV-1 integration [60,61]. The mechanism by which gammaretroviruses such as MLV preferentially target promoter regions is unknown. One of the aim of this proect is to identify chromatin features predictive of retroviral integration site selection by exploiting ChIPSeq datasets. Compared to previous methods, this technology has brought profiles of human DNA binding factors and histone epigenetic modifications closer to genome-wide saturation [62,63,64,65,66,67]. In Chapter 2 we report how over 60 ChIPSeq datasets were compared with 14 endogenous retroviral integration data sets. Nonetheless a detailed statistical study has performed in order to set up robust tools for quantify the degree of association and to combine relevant factors to predict viral integration sites throughout the genome with maximal predictive power. Here we demonstrate that some gammaretrovirus, Murine Leukemia Virus (MLV), Xenotropic Murinelike Related Virus (XMRV) and Porcine Endogenous Retrovirus (PERV) share a common epigenetic pattern around their insertion sites into the host chromosomes (also published in [68]). In particular we identified some highly associated epigenetic markers for integrations and developed a computational methodology to calculate the insertional probability on the whole human genome. More importantly, we demonstrated that this association is cell type dependent. On these bases, we hypothesized that these findings could be extended to all gammaretroviruses, thus including the endogenous HERV-H. 12
14 Indeed, investigating the reasons leading to retroviral integration is important to increase our knowledge about the formation and the evolution of the genomic code. Actually vertebrate genomes host several copies of viral sequences acquired over the course of evolution. Except few rare and remarkable exceptions [69], all this sequences are fragments of retroviral DNA. Necessarily, viral infection of host germ or embryonic stem cells with the consequent DNA integration induced a permanent modification of the genetic patrimony of the host that was further transmitted to subsequent lineages. These fossils are commonly defined as endogenous retroviruses (ERV). Several researches demonstrated the positive effect of some of these intrusions on the evolution of the species by providing new functions to the infected cells. [3,70,71,72]. Other studies suggest that some retroviral families could be involved in the development of serious diseases, as for example HERV-K in melanoma and HERV-W in excessive autoimmune responses and psychiatric disorder [73,74,75,76,77]. As a matter of fact, retroviral DNA accounts for at least 8% of the total human DNA. Three main classes of human endogenous retroviruses (HERV) gamma, beta and delta has been identified by comparison with DNA sequences of known exogenous retroviral families. Phylogenetic analyses indicate HERV-K, a betaretrovirus, and HERV-H, a gammaretrovirus, as the latest entries in the primate genome, respectively 10 and 25 million years ago [78]. Almost all retroviral sequences in the human genome are corrupted by mutations or successive insertions by non-retroviral transposable elements; therefore they seem to be not capable of producing viral proteins. In any case it has already been shown that some of these fragments have transcriptional activity, especially in cancer cells, but nothing is known about effective functionality. In chapter 3 we applied our statistical tools to determine whether some endogenous retroviral fragments retain the association with the position of the putative integration markers for the gammaretroviral family at the moment of the germ cells infection. According to this hypothesis, we demonstrate the specific and exclusive association between HERV-H and the marker H3K4me3 in embryonic stem cell and, to a lesser extent, in induced pluripotent stem cells. 13
15 In chapter 4 we show that this association implies a high level of transcription of specific HERV- H fragments stirred by main stem cell specific factors NANOG, OCT4 and SOX2 and that these transcription levels are correlated with the time of differentiation. At the moment we don t know yet whether HERV-H has acquired some functional role but some intriguing hypotheses are discussed. 14
16 2 DEVELOPMENT OF TOOLS FOR DETECTION AND DISPLAY OF ASSOCIATIONS BETWEEN RETROVIRAL INTEGRATION SITES AND CHROMATIN FEATURES The DNA is the definitive reservoir of life heredity but the complexity of eukaryotic organisms is rather difficult to explain by the number of the relatively few genes present in their genome (i.e. ~25000 in human). One maor branch of the epigenetic theory tries to fill the gap by introducing a new layer of codification at the level of DNA-packaging proteins. Histones are the main components of an octameric structure onto which the DNA wind by wrapping 147 base pairs. This histone complex with DNA is called nucleosome and it is the fundamental brick of higher order structures that permit the efficient packaging of the DNA into the cell [79]. Emerging evidence indicates that an histone code might exists and extend the information capacity of the genetic code [80,81]. Indeed, modifications of the histone chemical structure by the addition of a methyl or acetyl groups at specific locations are associated with primary nuclear functions. For example, post-translational modification of histone tails as the 3- methylation of Lysine 4 of histone 3 (H3K4me3) has been found associated with active transcriptional initiation. Conversely H3K27me3 and H3K9me3 are associated with silenced or inactive promoters [63]. The main idea is then to investigate whether retroviral integration site selection is somehow related with the position of specific histone modification on the genome. In other words, we asked if retroviruses are able to decipher and exploit the epigenetic code. To this aim, stringent associations were sought between ChIPSeq profiles for more than 60 chromatin-associated factors (Table 1) and 14 retroviral integration site datasets (Table 2). Following a common convention in the retrovirus integration literature [82], association with a given marker was defined as integration within 2 kb (wi2kb) of the nearest marker on the linear sequence of the chromosome. 15
17 The proviruses in the datasets used here (Table 2) were cloned from host genomic DNA using restriction enzymes, each of which has the potential to introduce a bias [83]. Therefore, as described in the literature [42,43,82,84], each integration site was matched to ten control sites designed to exhibit the same bias as the experimental set (see Appendix A). No distortion of the results by the control datasets was evident, in that identical values for provirus association with a given chromatin feature were obtained using 10 different randomly-generated control datasets. Table 1. ChIPSeq datasets from human cells used in this chapter Cell type ChIP Target Reference HeLa STAT1 [62] h3k4m1 [62] h3k4m3 [62] CD4+ T CD4+ T a Histone methylations [63] b Histone acetylations [85] HeLa POLR2 [65] HeLa CTCF [66] CD4+ T CBP [64] MOF [64] P300 [64] TIP60 [64] PCAF [64] HDAC1 [64] HDAC2 [64] HDAC3 [64] HDAC6 [64] HeLa h3k9ac [64] h3k16ac [64] a 25 different ChIPSeq profiles have been reported in this paper b 18 different ChIPSeq profiles have been reported in this paper 16
18 Table 2. Retrovirus integration datasets in human target cells used in this paper Retrovirus Target cell Reference MLV HeLa [31] MLV HeLa [43] MLV CD4+ T [86] MLV CD34+ hemato. [87] HIVmINmGAG HeLa [43] HIVmIN HeLa [43] HIVmGAG HeLa [43] HIV HeLa [43] HIV CD4+ T [88] PERV HEK293 [89] XMRV DU145 [90] HTLV HeLa [91] ASLV HeLa [92] FV CD34+ hemato. [93] 2.1 STATISTICS TOOLS FOR ASSOCIATION MEASURES Integration datasets are generally compared with control datasets using Fisher s exact test and reported as the p-value [42,43,84,89]. Here two-sided Fisher exact test (or χ 2 approximation when appropriate) was used to evaluate statistical significance. All p-values were Bonferroni corrected for multiple testing and p-values < 0.01 were considered significant. However significance determination is dependent upon dataset size, these measures can be easily conflated, generating extraordinarily low p-values and making it difficult to compare the importance of two factors [82]. Receiver operating characteristic area methods (ROC) have also been used to identify associations [82,84,94], but these methods also have drawbacks when it comes to discriminating between markers for retroviral integration. With the datasets used in these studies, the number of true negatives (control sites not associated with the marker) is considerably higher than the number of false positives (control sites associated with the marker). Given that the false positive rate = false positives / [false positives + true negatives], 17
19 two markers which significantly differ in terms of the number of false positives will fail to be differentiated from one another using ROC [95] F SCORE To address the problems associated with the analysis of these highly skewed data sets, we borrowed the concepts of Precision and Recall from the field of Information Retrieval [95,96,97]. In the context of this discussion, Precision is defined as the number of experimentally-determined integration sites associated with a marker divided by the sum of all associated experimental and all associated control sites. Recall is the number of markerassociated experimental integration sites divided by all experimental integration sites. The F β score, a convenient way to aggregate Precision and Recall, is the weighted harmonic mean of the two measures [98]. Usual values for β are 0.5, 1 or 2 [99]. To limit the influence of true negatives in the analysis of these skewed datasets, we emphasized Precision over Recall by setting β=0.5. The F score tracks better with statistical significance when β=0.5, than 1 or 2 (the comparison of results using different values for β, as well as with other metrics is discussed in 2.3.1). Moreover we normalized the number of false positives with respect to the number of experimental integration sites so as to make the F score independent of control sample size. For the analysis here, markers with F scores between 0.5 and 1 were considered to be associated with integration sites. Formally the F -score is defined as the β-weighted harmonic mean of Precision P t p t p f p and Recall R t p t p f n, that is: 2 PR F 1 (1) 2 P R Where, in this analysis, tp is the number of actual integration sites within 2 kb from a specified factor; tn is the number of control datapoints (generated in silico as described above) >2 kb from a specified factor; fp is the number of control datapoints within 2 kb from a specified 18
20 factor and fn is the number of actual integration sites >2 kb from a specified factor. We set β=0.5 to give more weight to Precision than to Recall. This balances type I and type II errors by adusting for the high rate of False Positives (fp) inherent in the examination of large datasets for genome-wide binding sites according to statistical significance ( 2.3.1). Moreover, to overcome the limitation of standard statistical methods we normalized fp with respect to the number of actual integration sites. The normalized F0. 5 -score is finally 1.25t p F 0.5 V 1.25t p 0.25 f n f p C with V and C being, respectively, the number of effective and control integration sites. The resulting F score is almost constant with respect to the size and ratio of experimental and control datasets (more details in 2.3). It is worth noting that a null-predictor yielding f p C (i.e. a marker composed of all bases in the genome) gives P=0.5 and R=1, resulting in an F score CHROMOSOME PROJECTION MANDALA To visualize genome-wide association of proviruses with potential markers, chromosome proection mandalas were developed (Figure 2). Each dot on the mandala represents a retroviral integration site with polar coordinates (ρ,θ). Angular distance θ corresponds to genomic location on the indicated chromosome and radial distance from the contour of the circle ρ represents the log-scaled distance in nucleotides from the closest marker site. Diagrams have been set to visualize proviruses located between 0 and 1 megabase. Proviruses located more than 1 megabase from the nearest marker accumulate at the center of the mandala. 19
21 Figure 2. Visualization of association between retroviral integration sites and chromosomal markers. (A) Construction of chromosome proection mandalas to visualize the proximity of individual proviruses to the nearest marker on the chromosome. The linear sequence of each human chromosome was linked and circularized. Proviral integration sites were located on the circle according to their position on each chromosome (empty circles) and then a marker (filled circles) was placed towards the center of the circle, at a distance from the perimeter that was equal, in log scale from 0 to 1 megabase, to the distance from the closest marker (empty boxes). Blue filled circles represent proviruses that were within 2kB from the nearest marker; red circles represent proviruses that are >2kB from the nearest marker. Examples of chromosome proection mandala for (B) MLV (Lewinski et al. 2006) versus H3K4me3, the arrow indicates the chromosomal mapping direction (C) Control versus H3K4me3 (D) MLV versus STAT1 and (E) MLV versus CpG+TSS. The number of MLV proviruses analyzed in this dataset (Lewinski et al. 2006) was 588. The F score and the percentage of proviruses within 2 kb are presented under each mandala. 20
22 2.2 ASSOCIATION OF RETROVIRAL INTEGRATION SITES WITH CHIPSEQ DATASETS Before this study, the best known chromosomal marker for retroviral integration site selection is the association of CpG islands and transcription start sites (CpG+TSS) with gammaretroviruses [31,43,86]. By examining published datasets for MLV, 21 to 27% of integration sites fall within 2 kb (wi2kb) of CpG+TSS, with probabilities <3 x to <4 x (Table 3). Despite these extremely low p-values, F scores calculated for these datasets fall between 0.36 to 0.51 (Table 3 and Figure 3), indicating that CpG+TSS is not a powerful predictor of MLV integration sites. Stronger association with CpG+TSS was observed with porcine endogenous retrovirus, PERV (50% wi2kb; p<10-250; F score 0.72), and xenotropic MuLV-related virus, XMRV (33% wi2kb; p<10-46; F score 0.58), two viruses from the same gammaretrovirus family as MLV (Figure 3 and Table 3). As expected, no significant association with CpG/TSS was observed for proviruses generated by non-gammaretroviruses, including HIV-1, for which the F score was 0.11 (Figure 4 and Table 3), or with ASLV, HTLV, or Foamy virus (Figure 5 and Table 3). ChIPSeq datasets for 60 chromatin-associated factors (Table 1) were compared with 14 provirus datasets for MLV, PERV, XMRV, HIV-1, HTLV-1, ASLV, Foamy virus, and HIV/MLV chimeras (Table 2). Acetylation of H3 and H4 at several positions, and methylation of H2AZ, H3K4, and K9, were strongly associated with gammaretroviral integration sites, all with F scores >0.80 (Figure 3; Tables 3, 4 and 5). H3K4me3 in particular was strongly associated with MLV integration sites (68% wi2kb; p< ; F score 0.83) and with the integration sites of PERV (60% wi2kb; p< ; F score 0.82) and XMRV (64% wi2kb; p< ; F score 0.81). 21
23 Table 3. Association of retroviral integration sites with some ChIPSeq profiles a Provirus Dataset CpG+TSS H3K4me3 H3K4me1 STAT1 POL II CTCF MLV HeLa [31] 24%; 0.49; 6E-24 63%; 0.84; <1E %; 0.80; 1E %; 0.83; 1E %; 0.70; 1E-198 5%; 0.26; N.S. MLV HeLa [43] 27%; 0.51; 4E-42 68%; 0.83; 1E %; 0.78; 1E %; 0.83; 4E %; 0.71; 2E-164 7%; 0.19; 4E-5 MLV CD4+T [86] 21%; 0.36; 3E-22 65%; 0.82 b ; 1E %; 0.80 b ; 1E-90 47%; 0.73; 2E-46 34%; 0.64; 2E-43 3%; 0.17; N.S. HIV [43] 6%; 0.11; N.S. 9%; 0.24; N.S. 48%; 0.60; 1E-31 8%; 0.27; N.S. 6%; 0.16; N.S. 2%; 0.06; N.S. HIV min [43] 14%; 0.29; N.S. 27%; 0.50; 1E-14 49%; 0.51; 1E-11 30%; 0.51; 1E-12 13%; 0.36; 2E-6 5%; 0.17; N.S. HIV mgag [43] 4%; 0.04; N.S. 11%; 0.30; N.S. 43%; 0.56; 1E-11 8%; 0.11; N.S. 3%; 0.14; N.S. 1%; 0.04; N.S. HIV minmgag [43] 21%; 0.43; 4E-14 65%; 0.82; 1E %; 0.79; 1E %; 0.81; 1E %; 0.67; 4E-101 4%; 0.16; N.S. PERV [89] 50%; 0.72; <1E %; 0.82; <1E %; 0.78; <1E %; 0.82; <1E %; 0.70; <1E %; 0.3; 3E-40 XMRV [90] 33%; 0.58; 1E-46 64%; 0.81; 8E %; 0.76; 1E %; 0.81; 9E %; 0.75; 1E-135 7%; 0.36; 2E-3 HTLV [91] 8%; 0.21; N.S. 30%; 0.59; 1E-15 62%; 0.70; 6E-26 31%; 0.60; 4E-15 13%; 0.39; 1E-6 6%; 0.22; N.S ASLV [92] 10%; 0.10; N.S. 16%; 0.43; 1E-4 39%; 0.56; 1E-4 13%; 0.37; N.S. 6%; 0.13; N.S. 2%; 0.08; N.S. FV [93] 11%; 0.27; 2E-5 17%; 0.42; 1E-17 39%; 0.56; 1E-22 17%; 0.44; 6E-17 9%; 0.28; 1E-14 4%; 0.17; N.S. a Values indicate percent of integration sites within 2 kb of the indicated factor; the F 0.5 score; and the significance (p-value). N.S. means p value > b ChIPSeq profiles from CD4+ T cells. All other ChIPSeq profiles from HeLa cells.
24 Table 4. Histone Acetylation [69] and MLV Modification Cell Type F 0.5 score a Exp vs cont Random % H3K4ac CD4+ T [71] /3 H3K36ac CD4+ T [71] /2 H2BK120ac CD4+ T [71] /4 H3K18ac CD4+ T [71] /4 H2BK20ac CD4+ T [71] /4 H2BK5ac CD4+ T [71] /4 H2BK12ac CD4+ T [71] /3 H4K8ac CD4+ T [71] /3 H4K91ac CD4+ T [71] /4 H4K16ac CD4+ T [71] /2 H3K27ac CD4+ T [71] /4 H2AK5ac CD4+ T [71] /1 H3K16ac HeLa [43] /6 H3K9ac CD4+ T [71] /6 H3K9ac HeLa [43] /7 a % of experimental proviruses wi2kb versus the % randomized control sites wi2kb
25 Table 5. Histone methylation and MLV Modification Cell Type Virus F 0.5 score a Exp vs cont H3K4me1 [63] HeLa MLV [43] /26 H3K4me3 [63] HeLa MLV [43] /10 H3K4me1 [63] HeLa MLV [31] /25 H3K4me3 [63] HeLa MLV [31] /9 H2AZ [64] CD4+ T MLV [71] /7 H2BK5me1 [64] CD4+ T MLV [71] /12 H3K27me1 [64] CD4+ T MLV [71] /5 H3K36me1 [64] CD4+ T MLV [71] /5 H3K36me3 [64] CD4+ T MLV [71] /10 H3K79me1 [64] CD4+ T MLV [71] /04 H3K79me2 [64] CD4+ T MLV [71] /1 H3K79me3 [64] CD4+ T MLV [71] /5 H3K9me3 [64] CD4+ T MLV [71] /1 H3K9me1 [64] CD4+ T MLV[71] /12 H3R2me1 [64] CD4+ T MLV [71] /8 H3R2me2 [64] CD4+ T MLV [71] /3 H3K27me2 [64] CD4+ T MLV [71] /3 H3K27me3 [64] CD4+ T MLV [71] /2 H3K4me1 [64] CD4+ T MLV [71] /13 H3K4me2 [64] CD4+ T MLV [71] /10 H3K4me3 [64] CD4+ T MLV [71] /8 H3K9me2 [64] CD4+ T MLV [71] /1 H4K20me1 [64] CD4+ T MLV [71] /10 H4K20me3 [64] CD4+ T MLV [71] /2 H4R3me2 [64] CD4+ T MLV [71] /3 a % of experimental proviruses wi2kb versus the % randomized control sites wi2kb 24
26 Table 6. HIV vs. histone methylation and acetylation Modification Cell Line Virus F 0.5 score a Exp vs cont H2BK5me1 Jurkat HIV [79] /13 H2BK5me1 CD4+ T HIV [75] /10 H3K36me3 Jurkat HIV [79] /10 H3K36me3 CD4+ T HIV [75] /10 H4K20me1 Jurkat HIV [79] /10 H3K9me1 Jurkat HIV [79] /15 H3K4me1 Jurkat HIV [79] /13 H3K4me2 Jurkat HIV [79] /11 H3K4me1 CD4+ T HIV [75] /14 H3K4me2 CD4+ T HIV [75] /11 H3K4me3 CD4+ T HIV [75] /10 H4K20me1 CD4+ T HIV [75] /10 H3K9me1 Jurkat HIV [79] /14 H3K9me1 CD4+ T HIV [75] /13 H3K27me1 Jurkat HIV [79] /11 H3K27me1 CD4+ T HIV [75] /10 H3K4me1 HeLa HIV [42] /24 H3K4me1u HeLa HIV [42] /23 H3K4me1u HeLa HIV min [43] /22 H3K4me1 HeLa HIV min [43] /23 H3K4me1u HeLa HIV mgag [43] /24 a % of experimental proviruses wi2kb versus the % randomized control sites wi2kb 25
 and N indicates the number of proviruses considered for each analysis.")
27 Figure 3. Chromosome proection mandala and F score calculated within 2 kb for the indicated markers (columns) versus the indicated proviruses (rows). The source of the provirus datasets is listed (see Table 2 and the text) and N indicates the number of proviruses considered for each analysis. MLV [31] proviruses were cloned from HeLa cells, XMRV proviruses from DU145, and PERV proviruses from HEK 293. H3K4me3 and STAT1 ChIPSeq datasets were from HeLa (see Table 3 and text). The F score and the percentage of proviruses within 2 kb are presented under each mandala. 26
28 Figure 4. Chromosome proection mandala and F score calculated within 2 kb for the indicated markers (columns) versus the indicated proviruses (rows). All proviruses were cloned from HeLa cells (Table 2 and text). H3K4me3 and STAT1 ChIPSeq datasets were from HeLa cells (Table 1). N indicates the number of specific proviral integrations considered for each analysis. The F score and the percentage of proviruses within 2 kb are presented under each mandala. 27
29 Figure 5. Chromosome proection mandala and F0.5 score calculated within 2 kb for the indicated markers (columns) versus the indicated proviruses (rows). ASLV and HTLV1 proviruses were cloned from HeLa cells, the Foamy virus from CD34+ hematopoietic stem cells (Table 2 and text). H3K4me3 and STAT1 ChIPSeq datasets were from HeLa cells (Table 1). N indicates the number of specific proviral integrations considered for each analysis. The F0.5 score and the percentage of proviruses within 2 kb are presented under each mandala. 28
30 2.2.1 SETTING THE WINDOW SIZE The effect of window size on the F score was examined for factors strongly associated with MLV and the other gammaretroviruses. Interestingly, the F score was maximal when it was calculated using a window of +/-2 kb for proviruses flanking the sites of these chromatin features (Figure 6). Figure 6. Influence of window size on the F score. Association (F score) between MLV proviruses [43] and either H3K4me3 (green dashed line with stars) or the supermarker in HeLa cells (solid blue line with solid circles) as a function of window size in kilobases. The true positive fraction versus the false positive fraction is shown for each point. In contrast to the gammaretroviruses, HIV-1 integration sites were not associated with H3K4me3 (9% wi2kb; p>0.05; F score 0.21)(Figure 4 and Table 3). Among the markers for which ChIPSeq datasets were available from HeLa cells, H3K4me1 had the strongest association with HIV-1 proviruses (48% wi2kb; p<10-31 ; F score 0.6), though H3K4me1 was the sole chromatin marker that yielded F score values greater than 0.5 across all queried viruses (Table 3, Table 6). H3K4me3, and other chromatin modifications linked to transcriptionally active promoters [63,100,101,102], were reported to be associated with HIV proviruses when a window of 50 kb 29
31 flanking the proviruses was considered [94,103]. This could be explained by the fact that HIV-1 proviruses localize to active transcription units with equal distribution along the length of the genes [32,42,43], and that the size of the average transcription unit is on the order of tens of kilobases. To examine this further, the F score for HIV-1 versus H3K4me3 in HeLa cells was plotted as a function of window size (Figure 7). For comparison, a similar plot was generated for a hypothetical marker at the TSS of transcribed genes in HeLa cells, taking into account the length of these genes, and considering a uniform distribution of proviruses on each gene. For both H3K4me3 and the hypothetical TSS marker, the F score plateaued at a window size of 20 kb, the median gene length. Thus if the window size is large enough to encompass the TSS and half of the gene length, the F score becomes significant. This could explain the window-size dependence of HIV-1 association with H3K4me3. Figure 7. Association (F score) between HIV-1 proviruses and two markers as a function of window size in kb. The first marker is H3K4me3 sites in HeLa (green solid line). The second is a virtual marker placed in the promoter region of transcribed genes in HeLa cells (blue dashed line), assuming a uniform distribution of integration sites in transcribed regions. The median length of transcribed genes in HeLa is ~20kB. 30
32 2.2.2 HIV/MLV CHIMERA ASSOCIATES WITH GAMMARETROVIRAL MARKERS We also analyzed an integration site map for an HIV-1 vector in which IN-encoding pol sequences and part of gag were replaced by homologous sequences from MLV [45]. It was shown previously that substitution of these two viral components from MLV is sufficient to change the integration site preference of HIV-1, such that it targets TSS with a frequency like MLV [43]. Replacement with these MLV genes was sufficient for HIV-1 proviruses to associate with methylated histones (65% wi2kb, p<10-182, F score 0.82) in a manner that was indistinguishable from MLV (Figure 4) STAT1 ASSOCIATION WITH GAMMARETROVIRUSES A remarkable association was found between MLV integration sites and STAT1 binding sites in IFN- stimulated HeLa cells (68% wi2kb; p< ; F score 0.83) (Figure 3, Table 3). Strong association with STAT1 binding sites was also observed for porcine endogenous retrovirus (60% wi2kb; p< ; F score 0.82) and XMRV (64% wi2kb; p< ; F score 0.81). Interestingly, if MLV was compared with STAT1 binding sites in HeLa cells that had not been treated with IFN- the association was greatly decreased (34% wi2kb; p<10-120, F score: 0.69). HIV-1 proviruses showed no association with STAT1 (8% wi2kb; p>0.4; F score 0.27). Substitution of HIV-1 IN and parts of gag with the corresponding genes from MLV was sufficient for HIV-1 proviruses to associate with STAT1 binding sites (64% wi2kb, p<10-182, F score 0.81) (Figure 4, Table 3). Attempts to detect a protein-protein interaction between STAT1 and MLV IN in our lab were unsuccessful. STAT1-deficient cell lines, either Stat1 -/- mouse embryonic fibroblasts [104], HeLa cells with stable STAT1 knockdown using lentiviral vectors [105], or well-characterized, STAT1 mutant, HT1080 cells [106], were challenged with MLV and, as a control, HIV-1. No clear defect associated with STAT1-deficiency was detected when MLV infectivity was compared with HIV-1 (data not shown). These results suggest that STAT1 itself is not directly responsible for MLV integration site preference but that its chromatin preferences resemble those of MLV. 31
33 2.3 THE F SCORE IS ROBUST AND HIGHLY DISCRIMINATING The stability of the F score for H3K4me3, an excellent marker, and for TSS/CpG, a poor marker, was examined as the size of a dataset containing 588 MLV proviruses [43] was decreased. The ratio of the size of the provirus dataset with respect to the control dataset was fixed at ten. While the p-value varied enormously as the size of the provirus dataset decreased, the F score was constant for both H3K4me3 and TSS/CpG over the full range from 50 to 500 proviruses (Figure 8A). The size of the provirus dataset was then fixed at 588 [43] and the F score was plotted versus the ratio (from 0.1 to 10) of the experimental and control datasets. Under these conditions the F score for either factor was constant except for a small increase when the ratio of the experimental to control datasets decreased below 0.3 (Figure 8B). The p-value for H3K4me3 changed markedly with the change in ratio of the datasets. Thus, while the p-value is strongly biased by the size of the provirus dataset or by the ratio of experimental to control sites, the F score is a remarkably stable measure. Similar stability was observed for the F score of all markers as compared to all proviral integration datasets (data not shown). As demonstrated for the F score, the area under the curve (AUC) ROC method used previously to evaluate markers associated with retroviral integration sites [82,84,94] is a robust measure that is insensitive to dataset size. Like the F score, AUC(ROC) also works well to assess markers that are weakly or moderately associated with integration sites (2.3.1). But, as demonstrated for the highly associated marker H3K4me3, AUC(ROC) does not respond to the increase in false positives that is expected with increasing window size (Fig 9A). Moreover, this insensitivity to false positives leads AUC(ROC) to overestimate the association of markers that are more common in the genome. Consequently, AUC ranks markers differently from statistical significance, as shown in Figure 9 and discussed in more detail in In contrast, the p-value and the F 0.5 score incorporate an adustment for the increase in false positives as window size increases, and both measures achieve a maximal value at a window size of 2 kb (Figure 9A). A standard regression plot shows that the F 0.5 score tracks with the p-value almost perfectly 32
34 (R 2 =0.97), whereas the AUC(ROC) diverges considerably (R 2 =0.37) (Figure 9B). The F 0.5 score and the p-value adust similarly for the increasing number of false positives. Figure 8. Stability of F score as function of dataset size. (A) Plot of the absolute value of the p-value exponent (right Y scale) or the F score (left Y scale) for H3K4me3 or CpG+TSS, as a function of MLV provirus dataset size. The experimental MLV dataset size (x-axis) was reduced by random sampling and the ratio of control dataset points was fixed at 10. (B) Examination of the same parameters as a function of the ratio between experimental and control dataset size (x-axis). The experimental dataset size was reduced by random sampling from 1:1 down to 0.1:1. From 1:1 up to 1:10 the control dataset size was proportionally increased by matched random generation. 33
35 Figure 9. Effect of the window size on F score. (A) Plot of Area Under Curve (AUC) or F score (both on left Y scale) or the absolute value of the p-value exponent (right Y scale) for MLV with respect to H3K4me3 as a function of window size in basepairs. (B) Pearson correlation for AUC or F score (both on X axis) versus the absolute value of the p-value exponent (Y axis) COMPARISON OF PRECISION/RECALL-BASED METHODS WITH OTHER METHODS, APPLIED TO THE ANALYSIS OF PROVIRUS DATASETS One of the principal aims of this PhD proect is to identify markers that are significantly associated with retroviral integration. In the past, several groups have performed this kind of study by means of the standard Fisher exact test [31,43,86,87,88,89,90,91,92,93]. Theoretically 34
36 Fisher p-values are the correct tool to evaluate the association strength of the single marker. Unfortunately p-values are influenced by the experimental and control dataset size and, while reliable in the context of a single dataset, cannot be used as a universal measure ([82] and Figure 8). For the purpose of this kind of analysis, other researchers also utilized ROC and logistic regression techniques [39,84,103,107]. Thus our aim was to find a measure with range [0,1], that is invariant with respect to dataset size, but that maintains a strong link with significance. We showed in Figure 9 that Area Under Curve, the ROC-based measure used by the Bushman Lab [80,81,90], does not satisfy this criteria since, for the reasons reported in references [95,108,109] and in 2.3, it is biased with respect to the number of true negatives. This results in a distortion with respect to significance. Indeed, ROC uses the false positive rate fp/(fp+tn) (fp - false positives, tn - true negatives). If the number of true negatives is much higher than the number of false positives a large change in the number of false positives can lead to a small change in the false positive rate used in ROC analysis. [95]. Precision, or positive predictive value, is defined as tp/(tp+fp) (tp true positives, fp false positives) so the effect of false positives is directly compared to true positives. We compared ROC and PR curves for all of the markers. In these comparisons, the same set of confusion matrices, calculated with the same cutoff points, were utilized for ROC and PR. As one example (Figure 10) we show the ROC and PR curves of two markers, H3K4me1 (blue) and H3K4me3 (dashed red), that are strongly associated with MLV in HeLa cells. Within the ROC space it is difficult to distinguish by eye which marker is better than the other. According to Area Under Curve (AUC) methods from the Bushman lab [84,103] H3K4me1 is considered superior to H3K4me3 (and the difference was significant according to the Wald test in the supplement to reference [103]). In contrast, in the PR space, it is quite clear that H3K4me3 performs better than H3K4me1. Given the discrepancy between these two methods, what criteria should be used to decide which method is correct? 35
37 Figure 10. Plot of curves generated using ROC (left) or PR (right) for H3K4me1 (blue) and H3K4me3 (dashed red) It was our goal to find an index with a strong relationship to significance. The significance - log(p), calculated with the Fisher exact test, of H3K4me3 and H3K4me1 in this specific HeLa proviral dataset is, respectively, 249 and 226. Using this criterion, in this specific comparison, AUPR fits significance better than does AUC. SIMILARITY MEASURE FOR METRIC COMPARISON The comparison of H3K4me3 with H3K4me1 described above is one specific case. In the case of other markers, to see if AUPR fits significance better than AUC, we analyzed one of the MLV integration datasets in HeLa cells [43] (same results are obtained using the other HeLa dataset [31]) and the MLV integration dataset in CD4+ T cells [86] by comparing the strength of association of 9 significant markers (in terms of p-value) from HeLa cells, and 31 significant markers from CD4+ T cell, using different window sizes (2kB, 5kB, 10kB, and 20kB). We calculated ROC and PR curves for all 40 markers, and made all ~1600 comparisons using the calculated AUC and AUPR. Then we ranked the markers by comparing the i-esim marker with the -esim marker and filling in an NXN matrix M for each measure: 36
38 M AUC [ i, ] 1 if AUC [ i] AUC [ ] 0 if AUC [ i] AUC [ ] M AUPR [ i, ] 1 if AUPR [ i] AUPR [ ] 0 if AUPR [ i] AUPR [ ] In general a similar matrix could be built for a general metric X as: M X [ i, ] 1 if X [ i] X [ ] 0 if X [ i] X [ ] As a reference, a similar matrix was built using the p-value (significance) obtained by Fisher s exact test, defined for the i-esim marker as Si log( pi ) : M S [ i, ] 1 if S[ i] S[ ] 0 if S[ i] S[ ]. A simple measure of similarity between the ranking obtained by the metric X and that yielded by reference S was calculated as 1 MS[ i, ] M X[ i, ] D( X, S) (sum spans over all matrix 2 N i, elements). Observe that 0 D 1. PRECISION AND RECALL BASED METHODS ARE MORE RELIABLE THAN ROC BASED METHODS Among a set of measures that included F 0.5, F 1, F 2, Area Under Curve (AUC), Area Under Precision/Recall (AUPR), Odds Ratio (OR), Shannon Mutual Information (SMI), and Difference of Proportions (DOP), the F 0.5 score showed the strongest link with statistical significance. Results have been reported in Table 7 and Table 8 and summarized in Figure 11, where red squares indicate that the ranking calculated by the specified metric differs from the rank obtained by significance. Comparisons were performed by fixing the matched control data set size at 10-times the experimental dataset size and using window sizes of 2, 5, 10, and 20 kilobases. 37
39 It is worth pointing out that the markers on the axes in Figure 11 have been ranked by significance. This means that groups of markers that are most highly associated are in the upper-left of the matrix, while the less tightly associated markers are in the lower right. AUC more commonly diverges from significance when one considers the most highly associated markers (upper left). AUC overestimates association with markers that are more common in the genome due to a higher false positive rate for these markers. Notably, Table 7 shows D(AUC,S) and D(AUPR,S). It is clear that AUPR has a better fit with significance than does AUC, in all the measurements. Though AUPR fits our purposes better than does AUC, AUPR suffers from some important limitations. Most of the publicly available proviral datasets have <1000 proviruses and, when the specified window size for analysis is relatively small (generally we use 2kB), there are far too few datapoints available for the construction of PR curves. The problem of too few datapoints cannot be resolved by interpolation because the AUPR is not reliable under these conditions [95]. For this reason, we adopted the F β score. It considers how many proviruses from a given dataset are within 2 kb of at least one ChIPSeq peak for a particular marker without concern for the number of markers within 2 kb. Given that the F β score is not subect to the same limitations concerning dataset size as AUPR, the two parameters which are used to derive it, Precision and Recall, can be easily calculated for all markers and all datasets. When compared to other measures (AUC, AUPR, OR, SMI, and DOP) the F β score has an advantage which is that it has an additional degree of freedom, beta. Usual values for beta are 0.5, 1, or 2 [97]. A beta value of 0.5 gives more weight to precision; 2 gives more weight to recall. To decide which beta value was best to use, we compared the performance of the F β score with respect to significance using beta=0.5, 1 or 2. Table 7 reports the percentage of correct ranking of factors with respect to significance for each measure in HeLa and CD4+ T cell datasets. F 0.5 and SMI are better than AUPR, AUC and the other indexes but SMI has the drawback that it is not invariant with respect to dataset size. As expected, F 2 and AUC give the poorest performances, reflecting their emphasis of recall (the true positive rate). AUC works better with markers that are not very highly associated with proviruses than for markers that are highly associated (for example, see the lower right corner of the matrices in 38
40 Figure 11). This is also confirmed by repeating the ranking test with HIV-1, HTLV, FV, ASLV. As an example, results for HIV are reported in Table 8. In these conditions, F 0.5 keeps good performances while SMI is the worst metric here. Table 7. Comparison of different methods for ranking markers a of MLV integration Provirus Window Size AUC AUPR F Dataset 0.5 F 1 F 2 OR SMI DOP HeLa [43] 2K K K k CD4+T [86] 2K K K k a similarity of the ranking of integration markers obtained by each metric with that yielded by Fisher s statistical significance. The formula used to calculate the similarity is in the methods. By this formula, 0 D 1, and D = 1 when the ranking perfectly matches that obtained by significance. AUC - Area Under the Curve, AUPR - Area Under Precision and Recall curve, F - F score at β = 0.5, 1, 2, OR - Odd Ratio, SMI - Shannon Mutual Information, DOP - Differences Of Proportions Table 8. Comparison of different methods for ranking markers a of HIV-1 integration in HeLa cells [43] AUC AUPR F 0.5 F 1 F 2 OR SMI DOP 2K K K k a similarity of the ranking of integration markers obtained by each metric with that yielded by Fisher s statistical significance. The formula used to calculate the similarity is in the methods. By this formula, 0 D 1, and D = 1 when the ranking perfectly matches that obtained by significance. 39
41 Several conclusions can be drawn from this analysis. Concerning markers that were highly associated with proviruses, the ranking yielded by the F 0.5 score closely tracked with significance. By increasing the weight of recall over precision by increasing the beta value (F 1 or F 2 ) the F score tracked less well with significance (it was the F 0.5 score that was used throughout this manuscript). The SMI also tracked well, but, unlike the F score, the results with this method vary with dataset size. Therefore AUC, OR, AUPR, and DOP were clearly not as robust as the F 0.5 score. Concerning markers that are moderately or weakly associated with proviruses, the ranking based on the F 0.5 score was similar to that obtained by significance, AUC, AUPR, OR, or DOP (Table 8). SMI scored less well for these markers. All results taken together indicate that, for the kind of datasets evaluated here, the F 0.5 score is a superior measure at discriminating among factors for differences in magnitude of association with genomic sites of integration. 40
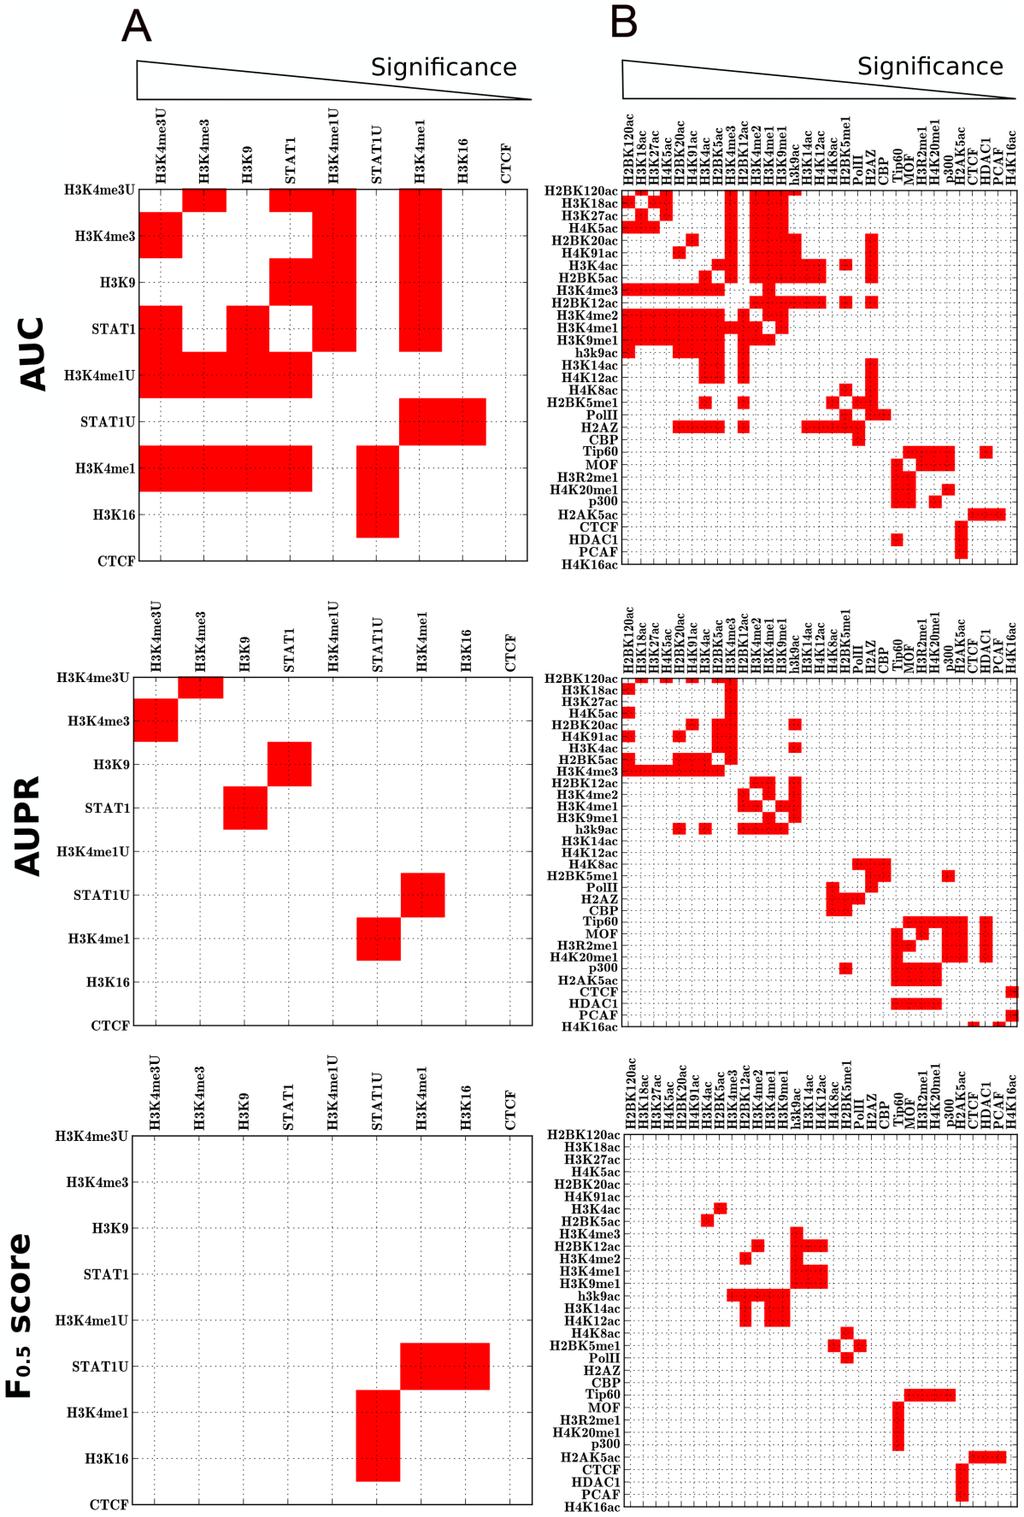
42 41
43 Figure 11. Comparison of different methods for ranking markers associated with integration. Markers for MLV integration in HeLa cells (A) or in CD4+ T cells (B) were ranked by Area Under Curve (AUC), Area Under Precision and Recall Curve (AUPR), or using the F 0.5 score. The rankings obtained by these methods were compared with the ranking obtained by the Fisher s exact test: each crosslink between markers in the grid represents a comparison. Red squares indicate when the ranking calculated by the specified metric disagrees with the ranking calculated by significance. Markers were arranged in order of decreasing significance (from left to right) 2.4 GENERATION OF A SUPERMARKER FOR RETROVIRUS INTEGRATION Given the effectiveness of the F score for identifying and ranking individual factors associated with retrovirus integration site selection, markers with the best F scores were combined in an attempt to generate a supermarker. An estimate of the probability of proviral integration into the host genome ( P (V ) ) was derived based on the genomic distribution of combinations of ChIPSeq peaks for the best scoring markers with respect to particular experimental provirus datasets. The resulting probability mass function (at base- pair resolution) is ( x p) F 2 2 P( V ) K e (1) N p 2 where V is the set of proviral integration sites, F is the F score associated with each marker M, for the set of peaks. x is the physical position on chromosomal DNA and K is a normalization constant. From this composite distribution, the peaks with the largest amplitude were identified, and the subset of peaks yielding the maximal F score in the test dataset was defined as the supermarker peak set DERIVING THE SUPERMARKER The mass probability functions p(v=i) or p(m=i) are defined as the probability of a provirus V or a marker M to be localized at a given genomic location defined as i (chromosome, position). p(v=i) is estimated from the linear combination of mass probability functions for candidate markers, that is 42
44 p ( V i) p( M i). Coefficient measures the goodness of fit of the marker as a function of the related F score. M and it seems reasonable to write Indeed the probability of integration P(V) can be written as P( V ) p( V M i) p( M1 i 1 i P( V ) p( V M i) p( M 2, i 2 i P( V ) p( V M N i) p( M N i), i with respect to a set of markers M 1,M 2,,M N. Adding these equations we get ), ), p(v M i) P(V) p(m N i). (2) i If we introduce C as the control dataset and P( C x) is the probability of finding a random integration site at the x location, we can write: t p N p P( M, V ) t n N C P( M, C) f n N p P( M, V ) f p N C P( M, C) Indeed, using the definition of the F-score (2.1.1): 43
45 44 ), ( ), ( ), ( 1 ), ( M V P N V M P N M V P N M V P N F n p p p In the scaled F-score we have and, if the control is ideal, ), ( ), ( V M P C M P. Then ), ( ), ( ), ( 1 ), ( C M P V M P M V P M V P F Simple manipulation leads to ) ( ) ( ), ( P V M P M V P F and ) ( ) ( 1 1 ) ( M V P M P V R P F The choice of 2 1 ustifies ( M) PV F. A first order approximation of (2) is then the mixture model: p(v M i) N i p(m i) p(v M k) N k p(m i) i K F N i p(m i) where K is a normalization constant. Eventually we set K F N and the resulting new probability mass function is ). ( ) ( * i M p N F K i M p (3)
46 The marker mass density p(m i) was modeled as the sum of Gaussian functions centered on ChIPSeq peaks, with the variance set as the average size of the peak regions, as determined by the F-seq algorithm [110]. In this way we minimized the potential bias that can arise by summing ChIPSeq densities obtained over different experimental conditions. Briefly, each marker probability density function was written as 2 2 p( M i) e p 2 ( i p), where is the peak set of the marker M. Function (3) summarizes the properties of all the markers and can be interpreted as a new ChIPSeq density. Indeed it contains all markers associated and not associated peaks. To reduce the number of false positives we applied a thresholding procedure similar to that used to filter raw ChIPSeq data in a training set of experimental and control integration sites. The peaks of function (3) were ranked with respect to their amplitude and the F score is recalculated on the training set as a function of the number of peaks. We define the supermarker M* as the marker set that yields a maximal F score. The supermarker density function is finally written as p(m * x) K F N p * (x p ) 2 2 e 2, where * is the reduced peak set VALIDATION OF THE SUPERMARKER Two strategies were used to validate the supermarker procedure. First we calculated the supermarker and the relative peak set on each single proviral dataset and then we evaluated the association with the remaining datasets. The second strategy was a standard 10-fold cross- 45
47 validation applied to each single dataset. The two evaluations yielded the same results (Table 9 and Table 10). COMPARISON WITH RANDOM FOREST To validate the effectiveness of the supermarker peak set, we trained RandomForest [111], a machine learning algorithm, with the same set of markers composing the supermarker. Our datasets are extremely imbalanced and this results in a classifier with an high misclassification error for predicting the minority class (i.e. the experimental dataset) as shown in Table S6. In order to correct for that, RandomForest can be tuned by an additional parameter, classwt, that can be used to assign priors to the classes (experimental and control) to minimize the misclassification error and improve the performance. We adopted a 10-fold cross-validation procedure by correcting the priors in the training set. Interestingly, the maximum achievable F score and the number of associated integration sites wi2kb match almost exactly with the F score and wi2kb that we obtained with our supermarker procedure (Table 11). We consider this as further evidence of the effectiveness of the supermarker. Table 9. Association of supermarker with gammaretroviruses Retrovirus F 0.5 score Matched a p-value wi2kb(%) F 0.5 score Unmatched p-value MLV HeLa [43] E E MLV HeLa [31] 0.85 <1E E MLV CD4+T [86] E E HIVmINmGAG [43] E E XMRV [90] E E PERV [89] 0.83 <1E <1E wi2kb(%) a matched means that the supermarker was calculated using proviruses cloned from the same cell type as the ChIPSeq dataset. In the case of XMRV and PERV, proviruses were cloned from a cell type that is similar to the ChIPSeq dataset, according to the transcriptional profile (see text and Figure 14). 46
48 Table 10. Supermarker association with gammaretroviral integration sites measured with 10-fold crossvalidation a Supermarker Provirus Dataset F 0.5 score wi2kb(%) b MLV HeLa [43] MLV HeLa [31] MLV CD4+T [71] HIVmINmGAG[43] XMRV [76] PERV [77] a each provirus dataset was randomly partitioned into 10 subsets. Each subset was examined for association with the supermarker calculated on the remaining 9 subsets. b Global F 0.5 score and % of proviruses wi2kb. Table 11. Supermarker vs. Random Forest a Retrovirus MLV HeLa [43] Supermarker F 0.5 score wi2kb(%)% Random Forest F 0.5 score wi2kb(%) Random Forest (classwt b ) F 0.5 score wi2kb(%) MLV HeLa [31] MLV CD4+T [71] HIVmINmGAG XMRV [76] PERV [77] a Supermarker and the Random Forest algorithm [91] were trained on the same marker set. Shown is the strength of association as measured by the F 0.5 score and % of proviruses wi2kb. b this parameter adusts for imbalanced datasets containing large a excess of true negatives (see methods). A 10-fold crossvalidation strategy was adopted to maximize the F 0.5 score. 47
49 IMPROVING THE PREDICTION POWER With respect to MLV integration in HeLa cells, H3K4me1, H3K4me3, H3K9ac and STAT1 were the markers with the best F scores (>0.80)(Table 3, Table 4 and Table 5). Examination of the ChIPSeq peaks derived from all combinations of these five candidates revealed that the best supermarker was generated by combining H3K4me3, H3K4me1, and H3K9ac (75% wi2kb; p< ; F score 0.87) (Table 9). Figure 12A shows the distribution of supermarker density and MLV integration sites across the human genome, with an expansion of chromosome 1 to help visualize detail in Figure 12B. The Pearson correlation for the supermarker density and MLV integration site density across the whole genome was 0.75 (p=0, with both functions averaged over a non-overlapping 10 kb window). Figure 12C shows the correlation for chromosome 1 in isolation. As with the single marker H3K4me3, the supermarker yields a maximal F score using a window size of 2 kb (Figure 6). Inclusion of STAT1 in the HeLa supermarker increased the number of false positives over the number of true positives and thus decreased the composite F score. This suggests that any information carried by STAT1 is contained within the other markers. Among the ChIPSeq data in CD4 + T cells, the best individual markers associated with MLV were H3K4m1, H3K4m2, H3K4m3, H3K9ac, H2BK120ac, H2BK5ac, H3K18ac, H3K27ac, and H2AZ (all >0.80, Table 4 and 5). The best supermarker for MLV on CD4 + T cells was composed of H3K4m1, H3K4m2, H3K4m3, and H3K9ac (71% wi2kb; p< ; F score 0.84). 48
50 Figure 12. Visualization of association between retroviral integration sites and the chromosomal supermarker. (A) Chromosome proection mandala showing MLV proviruses from HeLa cells plotted as in Figure 1 and 2 with supermarker density (gray shading) from the 2 kb circle to the contour of the circle. (B) Chromosome proection mandala for chromosome 1 in isolation. (C) Plot showing density of supermarker (red dashed line) vs MLV proviruses (solid blue line) in HeLa cells, calculated over a 10 kb sliding window on chromosome 1. Pearson correlation is 0.81 for chromosome 1 and 0.75 for the whole genome. 49
51 2.5 EXPECTATION-MAXIMIZATION BASED ALGORITHM FOR THE EVALUATION OF THE SUPERMARKER Here we propose a computational method to build a supermarker starting from a set of markers without any previous information (i.e. the individual F score). Consider N DNA-binding factors modeled as described in As previously observed, each ChIPSeq profile for the -esim factor X could be interpreted as the probability to find X bound to a specific genomic locus i = (chr, pos): p p( X i). X Similarly, the biological function could be modeled as a random variable B taking values on all chromosomal loci. In other words the function modeled by B has an unknown mass probability to happen at the same region centered on i: p( B i). p B The obective is thus to find a new mass probability functional that can approximate means of the p s with the possible use of a parameter θ: p p p,..., p, X B. X, 1 X 2 M p B by First observe that p B can be written in term of each -esim factor as p B p( B k) i p( B k X p( B k X i) p( X i) k) p( X k) ik p( B k X i) p( X i) (4) where i spans across all possible N loci. The first term in (4) can be interpreted as how well p X fits p B and the second term is the related error expressing the spreading of p X over loci unrelated to B. Summing (4) over : p( B k) ~ p B M p( B k X M k) p( X k) ik p( B k X M i) p( X i) (5) 50
52 where M ~ p B p( X ),,..., ) and is the aggregate of the M approximation ( 1 M errors. can be estimated by a classical Maximum Likelihood approach. Indeed, maximizing the (log)likelihood of ~ p : B M ~ log. L ( B) log( p B ) log p( X ) is equivalent to a mixture-density parameter estimation problem and can be efficiently treated with the Expectation Maximization algorithm (EM) [112]. This algorithm works in a way that, at the t-esim iteration, the expectation ( t1) ( t1) function (, ) Elog L( B, Y) B, Q is maximized (Y is an auxiliary random Y ( t) ( t1) variable), that is arg max Q (, ). It is important to recall that, by introducing the probability that the value k arises from the -esim factor distribution P( k, ) p( X k), (6) M p( X k) l l ( 1) the function Q (, t ) can be written as l ( t1) ( t1) Q(, ) log( ) p( k, ) (7) k The mixture coefficient vector is then evaluated by substituting (6) in (7) and maximizing with the Lagrange multiplier according to the constraint 1. Therefore: ( t) 1 N k P( k, ( t1) ) 1 N k ( t1) p( X k) ~ t p ( ( 1) B k ) 1 N M k l ( t1) ( t1) p( X k). (8) p( X k) l where N is the number of discrete genomic loci where all densities have support. 51
53 From (5) the following identity holds: ( t1) 1 ( t1) p( X k) p( B k, X k ), M and introducing the concept of Recall, defined as written as: R P( B, X ), equation (8) could be simply P( B) ( t) 1 ( t1) 1 ( t1 (, ) ( ) P B X R ). (9) M M Similarly it is worth noting that the spreading error can be interpreted as the affinity of the factor M for a control dataset C, defined as a set of random loci where p( B c) 0, c C. Indeed, considering a control dataset with N C control loci, the spreading error could be estimated as: ik p( B k X M i) p( X i) NC i p( C i X M i) p( X 1 i) M fp fp where fp N P C, X ) is the number of false positives, that is, the number of control loci that C ( falls in the region where the factor X is bound. Therefore, minimizing implies the minimization of the number of false positives. The computational strategy to calculate the supermarker is based on these observations and consists on the iteration of a two step process until no further maximization is possible: 1) ~ p B is evaluated by (9). This corresponds to weight each factor distribution X by the respective Recall. 2) a thresholding procedure is applied to ~ p B to reduce the number of false positives by erasing smaller peaks until the F 0.5 score is maximized. 52
54 2.5.1 MAP-REDUCE BASED PARALLEL VERSION With respect to the analytic calculation of the supermarker (2.4.1), EM-based algorithm can work independently on each chromosome. Thus it can be obviously parallelized. We developed a framework to run embarrassingly parallel version of bioinformatics algorithms (BLAST, GRAMMAR, GSEA) based on Hadoop [113]. Hadoop includes an open source implementation of MapReduce and a distributed file system (HDFS, Hadoop Distributed File System) on which applications can run. MapReduce is a computational paradigm, where the application is divided into many small fragments, each of which may be executed on any node in a cluster of COTS machines. The framework takes care of data partitioning, scheduling, load balancing, machine failure handling and inter-machine communication, while developers need only write their application in terms of a Map function, which produces a set of intermediate key/value pairs for each input line, and a Reduce function, which merges together these values to form the final output [114]. The algorithm presented here works on a large amount of ChIPSeq data which is not modified during a ob run. Then it is well supported by MapReduce model. Instead of the standard Java API, the Hadoop streaming library (included in the Hadoop distribution) was used, which allows the user to create and run obs with any executable as the mapper and/or the reducer. In Hadoop streaming input values (with the default formatter) are lines of text read from one or more files. Our implementation here is pretty straightforward. Experimental and control integrations datasets are divided by chromosomes and assigned to each computational node as well as ChIPSeq data. EM optimization is then performed independently on each chromosome (MAP). Optimized parameters (tp, fp, fn, tn) are returned by each node with the resulting supermarker density and the final F score is calculated (REDUCE). As expected, execution time is ~20X reduced. 53
55 2.6 THE F SCORE DETECTS DIFFERENCES BETWEEN CELL TYPES The F scores reported here (Tables 3 and 4) were calculated using ChIPSeq and provirus datasets that were matched for cell type. In a previous report, when AUC(ROC) was used to evaluate epigenetic marks mapped in T cells, the correlation with proviruses cloned from T cells was no greater than the correlation with proviruses cloned from other target cell types such as the human embryonic kidney cell line HEK 293 or the fibrosarcoma cell line HT1080 [103]. Differences due to experimental error were in fact greater than differences due to cell type [103]. To determine if the F score has the ability to discriminate between cell types, MLV provirus data sets from HeLa and CD4 + T cells were compared with the supermarker for each of these cell types, in all combinations. As mentioned above, when an MLV provirus dataset obtained from infection of HeLa cells [43] was compared with the supermarker from HeLa cell ChIPSeq data, very strong association was observed (75% wi2kb; p< ; F score 0.87) (Table 5 and Figure 13). When the same provirus dataset was compared with the supermarker derived from CD4 + T cell ChIPSeq data the strength of the association was much decreased (32% wi2kb; p<10-57 ; F score 0.61) (Table 9 and Figure 13). The same pattern was seen for the chimera HIVmINmGag, for which association with the supermarker in HeLa cells (70% wi2kb; p< ; F score 0.86) was much greater than association with the supermarker in CD4+ T cells (27% wi2kb; p<10-24 ; F score 0.56) (Table 9 and Figure 13). The opposite pattern was also seen in that MLV proviruses cloned from CD4+ T cells [86] were strongly associated with the supermarker derived in these cells (71% wi2kb; p< ; F score 0.84), and less well associated with the supermarker from HeLa cells (39% wi2kb; p<10-42 ; F score 0.67) (Table 9 and Figure 13). 54
 and the percentage of associated proviruses wi2kb of the supermarkers (lower panel) with respect to MLV proviruses, either from [43](MLV HeLa I) or [31](MLV")
56 Figure 13. Influence of dataset matching on the F score. Histograms of the F score (upper panel) and the percentage of associated proviruses wi2kb of the supermarkers (lower panel) with respect to MLV proviruses, either from [43](MLV HeLa I) or [31](MLV HeLa II), and the HIVmINmGAG chimera, as indicated. Supermarkers were generated with ChIPSeq data from HeLa cells or from CD4+ T cells and compared with MLV proviruses from either HeLa cells or CD4+T cells. Matched means that the provirus and the supermarker are from the same cell type. A similar analysis was attempted with provirus datasets for the gammaretroviruses XMRV and PERV (Table 9). The XMRV provirus data was obtained in the human prostate cancer cell line DU145 [90] and ChIPSeq datasets are not available for these cells. Despite the mismatched cell lines, when the XMRV dataset from DU145 cells was compared with the epigenetic markers mapped in HeLa cells strong correlation was observed with the supermarker (66% wi2kb; p< ; F score 0.83). When the supermarker was derived from CD4 + T cell data, the association with XMRV was much less significant (41% wi2kb; p<10-85 ; F score 0.70). Similarly, the PERV provirus dataset cloned from HEK 293 cells was better associated with the supermarker from HeLa cells (66% wi2kb; p< ; F score 0.83) than from CD4+ T cells (51% wi2kb; p< ; F score 0.75). 55
57 To understand why some mismatched cell comparisons gave higher F scores than others, CD4+ T cells, HeLa, DU145, Jurkat, HEK 293, and CD34+ hematopoietic stem cells were clustered based on global gene expression profiles ( The resulting dendrogram (Figure 14) demonstrated that the cells mainly clustered into two groups, one consisting of HeLa, DU146, and HEK 293 cells, and the other CD4+ T cells, Jurkat cells, and CD34+ cells. Based on expression profiles DU145 cells are more similar to HeLa cells than to CD4+ T cells, offering an explanation for the higher F score when XMRV was compared with HeLa. Figure 14. Hierarchical clustering applied to the expression profiles of the cell types cited in this study as a measure of similarity. Branch length correlates inversely with similarity, according to the scale bar. 2.7 USE OF THE SUPERMARKER TO PREDICT THE LIKELIHOOD OF INTEGRATION AT SPECIFIC LOCI WITHIN SPECIFIC CELL TYPES As a first step towards examining the utility of the supermarker in the context of published clinical or experimental data, supermarker density was examined in proto-oncogenes that have been activated by retroviral insertion. 20 SCID-X1 patients were successfully treated with 56
58 autologous bone marrow CD34+ hematopoietic stem cells transduced ex-vivo with an MLV vector expressing the therapeutic gene IL2RG. 5 of these patients developed T cell leukemia and 4 possessed insertional mutations from the MLV vector at LMO2 [24,25,26,27,28], a T cell oncogene [115]. The fifth patient had a provirus near CCND2, another lymphoid oncogene [116] that encodes cyclin D2. When ChIPSeq datasets from HeLa cells were used to generate the supermarker, no high probability sites were identified near the promoters of LMO2 or CCND2 (Figure 11). For LMO2 the nearest sites in HeLa cells were >150 kbp upstream and >200 kbp downstream of the TSS. For CCND2 the nearest sites in HeLa were >800 kbp upstream and >50 kbp downstream of the TSS. Figure 15. Cell type-dependence of supermarker density near the promoters of protooncogenes. (A) Schematic diagram of the region on human chromosome 11 flanking the promoter of the protooncogene LMO2. In CD4+ T cells, a very prominent supermarker peak is found wi2kb of the TSS. According to supermarker density, the probability of MLV integration in this region is 1 in In HeLa cells, the nearest supermarker is found more >150 kb upstream and the probability of MLV integration is 1 in (B) Schematic diagram of the region on human chromosome 12 flanking the promoter of the protooncogene CCND2. In CD4 + T cells, a dense cluster of supermarker peaks is found wi2kb of the TSS, and the probability of MLV integration is 1 in In HeLa cells, the nearest supermarker is found >50 kb downstream and the probability of MLV integration is 1 in
59 Sufficient ChIPSeq datasets to generate a supermarker were not available for CD34 + hematopoietic stem cells. Given the relative similarity of the transcription profile (Figure 14) we used the supermarker data generated from CD4 + T cells. The F score when crossing from CD34+ cells to CD4+ cells decreases from 0.85 to 0.78 (57% wi2kb, p< ), but is much better than when using HeLa cell data (38% wi2kb; p<10-48 ; F score 0.66). With respect to the LMO2 TSS a very prominent supermarker peak was observed at bp (Figure 15). Based on the probability of the supermarker we estimate that 1 out of 10 5 MLV proviruses would target this gene in CD34+ cells or CD4+ T cells, as compared to a much less frequent 1 out of 10 7 MLV proviruses in HeLa cells. Nearly identical probabilities were calculated based on experiments in which MLV proviruses were cloned from T cell lines and HeLa cells [117]. These authors observed a hotspot for MLV integration located between to of the LMO2 promoter within CD4+ T cells but not within HeLa. Though experimental data for calculating the probability of integration into CCND2 is not available, it is interesting that multiple, high-probability supermarkers are located wi2kb of the promoter (Figure 15). 2.8 HIV INTEGRATION SITE SELECTION The best single marker for HIV-1 in HeLa cells, H3K4me1, predicted 48% of proviruses wi2kb but with only moderate precision (F score 0.60). Using the F score we were able to detect a stronger association of HIV-1 with H3K4me1 in CD4+ T cells (57% wi2kb, p<10-71, F score 0.73) but combining markers in an attempt to generate a supermarker failed to improve the F score. The associations that were observed may be related to HIV-1 s propensity to integrate along the length of transcriptionally active genes [94,103]. Association with histone modifications at active promoters may be detected given short enough gene-length, or a wide-enough window around the provirus (Figure 7). Either way, we were unable to identify a marker capable of predicting HIV-1 integration site selection wi2kb. Perhaps the HIV-1 IN-interacting protein PSIP1/LEDGF/p75 [53,54,55] would be such a factor. Though binding sites have been reported for LEDGF [61], this dataset is limited to 1% of the human genome and cannot be used for a genome-wide association study. LEDGF influences HIV-1 integration site selection in that its 58
60 disruption causes a shift away from transcriptional units and towards CpG-rich sequences [56,58,59]. Nonetheless, these are relatively general effects and LEDGF binding sites may fail to give resolution down to a window of 2 kb. It appears that integration site selection by HIV-1 is mechanistically quite different than for the gammaretroviruses. 59
61 3 DISCOVERING MARKERS FOR ENDOGENOUS RETROVIRAL INTEGRATION SITE SELECTION The observed high levels of association between gammaretrovirus integration sites and some epigenetic markers prompted the quest to study associations between any known endogenous retroviral element embedded in the human and mouse genomes and the localization of histone post-transcriptional modifications. For this purpose, ChIPSeq profiles of H3K4me3 in more than 40 different human and mouse cell lines, including embryonic stem cells, induced pluripotent stem cells, monocytes, HeLa, CD4 T cells, and CD34 hematopoietic stem cells, were considered (Table 12). Other markers are unfortunately not yet available for this analysis. The viral dataset was compiled using all endogenous viral fragments (LTR) annotated via RepeatMasker on the human reference genome hg18 (UCSC) and the mouse reference genome mm9 (UCSC). Association with a given marker was defined as the presence of the endogenous proviral DNA within a fixed distance (usually 2Kilobases [68]) from the nearest marker on the linear sequence of the chromosome. Unlike exogenous retroviruses, the endogenous virus is already integrated. Therefore, to restore the conditions before integration, the distance from the -esim marker s e M with peaks in locim 0,..., m N and the i-esim provirus Vi spanning along the loci { V i, Vi } has been calculated as d( V, M i ) min( V s i M, V e i M ) min( V c i M Vi ) e V 2 s i where V c i V s i V 2 e i is the central locus of the provirus. As a control dataset, we randomly selected genomic locations. Association strength was measured with the statistical method based on the F score, as previously described in and reported previously [68]. Markers with F scores ranging between 0.5 and 1 were considered to be associated with endogenous integration sites. 60

62 Figure 16 reports a schematic view of this analysis. The block Associator is a computational module fed of ChIPSeq profiles and LTR loci in BED format (see Appendix A). Remarkably, among all LTRs, only the endogenous retrovirus HERV-H showed a significant association with H3K4me3 in some human cell types. In contrast, no retroviral element has been found associated to H3K4me3 in mouse cell types. Figure 16. Searching for endogenous elements correlated with the H3K4me3 marker for retroviral integration. More than 40 different cell types have been checked for association with all annotated endogenous retroviral elements (hg18). Only HERV-H expressed a relevant association in several human embryonic stem cell lines. No association has been detected in mouse. 61
63 Table 12. Data used for analysis of endogenous retrovirus Data Type and GEO accession number Factor Cell Type or Tissue Reference Human ChIPSeq, GSE16256 H3K4me3, H3K27me3 H1, H9, I3, ips, IMR90 [118] ChIPSeq, GSE22499 H3K4me3 BG01/03, WIBR1/2/7, hipsa6/c1, Fibroblast [119] ChIPSeq, GSE15353 H3K4me3 HeLa w/o IFN [62] ChIPSeq, GSE19465 H3K4me3 hips-11a/18c/15b/20b, duodenum mucosa, BM-MSC,smooth muscle, adult liver, fetal lung, fetal brain, CD34, CD3, CD15, CD19, Pancreatic Islets [120] ChIPSeq, GSE20650 NANOG,OCT4, KLF4 H1 [121] ChIPSeq, GSE18292 SOX2 H1 [122] RNASeq, GSE23316 H1, HeLa, K562 UCSC ENCODE Proect RNASeq, GSE20301 H1, differentiated H1 [123] Mouse ChIPSeq, GSE22075 Mouse H3K4me3 ES, LSK cells [124] ChIPSeq, GSE12241 Mouse H3K4me3 ES, MEF [125] 62

64 3.1 ASSOCIATION WITH HOMO SAPIENS AND MUS MUSCULUS ENDOGENOUS RETROVIRUSES Association analysis strongly endorsed the hypothesis that HERV-H had inserted into primate chromosomes similarly to a modern gammaretrovirus. Coherently with the fact that this retrovirus infected either host germ cells or embryonic tissues, its integration pattern is highly associated with H3K4me3 profiles in ES cells (Fs>0.8) and, to a lesser extent, in ips cells (Fs>0.7). Figure 17. H3K4me3 association with HERV-H provirus as measured with the F score in 40 different cell types in function of the distance. The F score (Fs) is reported on the z-axis. Cell types are listed on the x-axis, while the distance of association is reported on the y-axis. Yellow to red bands indicate a significant association (Fs > 0.5). 12 out of 15 associated cell types are hesc or ips cells 63
65 To allow a deeper comprehension of these results, data were clustered by means of Hierarchical Clustering. Each association profile calculated in function of the window size (discretized with steps of 0.5kB, y-axis in Figure 17) was labeled with the respective cell type (xaxis in Figure 17) and the euclidean distance between these profiles was used to discriminate among clusters. The algorithm identified three main clusters of high, medium and low association (represented in green, red and cyan in Figure 18). The highest associated cluster (green) is populated by embryonic H1, H9 and I3 stem cells and induced pluripotent ips-15b and ips-11a cells with a mean F score of The red cluster is populated by ES and ips cells and the first sub-cluster (mean F score 0.58) with the cell lines BG03, WIBR , H1 and ips-18c, as well as with low differentiated pre-hematopoietic CD3 cells, Bone Marrow Mesenchimal Stem cells (DMSC) and Breast Cancer cells vhmec. The second subcluster (F score 0.48) includes cells from Fetal tissues (Brain and Lung), embryonic BG01-02 stem cells and Skeletal and Stomach Smooth Muscle cells among others. The cyan cluster (F score 0.36) is populated by differentiated cell types, such as CD34 cells, CD4+ T cells, Fibroblasts, pancreas islets and cancer cell lines, such as HeLa and Hs68. These results strongly suggest that the association between HERV-H and the post-translational histone modification H3K4me3 correlates with the degree of cell differentiation. 64
 is reported on the z-axis.")
66 Figure 18. Hierarchical Cluster Analysis on HERV-H/H3K4me3 F score based association in function of the window size (horizontal axis). F score is represented in color scale as in Figure 17. H3K4me3 association with HERV-H provirus as measured with the F score in 40 different cell types in function of the distance. The F score (Fs) is reported on the z-axis. Cell types are listed on the x-axis, while the distance of association is reported on the y-axis. Yellow to red bands indicate a significant association (Fs > 0.5). 12 out of 15 associated cell types are hesc or ips cells. The highly associated cluster (green tree) is made of embryonic H1, H9, I3 and ips cell types only. In contrast, no embryonic cell types are present in the less associated (cyan) cluster.
. Figure 19. Chromosome Proection Mandalas for I3 cells, ips-15b cells and HeLa cells.")
67 Indeed, the analysis of chromosomes proection mandalas of HERV-H/H3K4me3 association in different cell types visually depicts an inverse correlation with the degree of differentiation:the more the cell is differentiated, the further from the proviruses the marker is positioned (Figure 19). Figure 19. Chromosome Proection Mandalas for I3 cells, ips-15b cells and HeLa cells. The association strength (F score) seems to be inversely correlated with the degree of differentiation HUMAN ENDOGENOUS RETROVIRUSES Human Endogenous RetroViruses (HERVs) are currently named after their Primer Binding Site (PBS) affinity to human trnas. The retroviral element HERV-H presents a trna-histidine PBS in its genome. HERV-H is one of the most abundant proviral groups in the human genome, with more than 1000 copies, and belongs to the family of Gammaretroviridiae which includes also MLV, XMRV and PERV. HERV-H has integrated into the genomes of higher monkeys 30 to 35 million years ago and is variably present in all primates, the human genome being the prevalent carrier [126]. HERV-H proviral structure does not differ from the canonical gammaretroviral construct (5 LTR-GAG-PRO-POL-ENV-LTR 3 ). LTRs are built from unique 3 and 5 (U3 and U5) regions, separated by a repeat sequence (R). The PBS is located in the pre-gag region between the 5 LTR and the group-specific antigen (GAG) which include matrix (MA), capsid (CA) and nucleocapsid (NC) proteins. The protease gene pro encoding the protein PR needed for GAG and POL polyprotein cleavage, is located between gag and pol, which encode for reverse
68 transcriptase RT and integrase IN. The envelope gene env consists of the surface unit SU needed for particle-cell binding and the transmembrane unit (TM). (Figure 20A and [127]) Figure 20. A) Genetic organization of a gammaretrovirus. LTR - Long Terminal Repeat, GAG - Group specific AntiGen, MA - Matrix, CA - Capsid, NC - Nucleocapsid, PR - Protease, RT - Reverse Transcriptase, IN - Integrase, ENV - Envelope [from ViralZone, 2008]. B) Specific HERV-H features. HERV-H is the only known gammaretrovirus with a two zinc fingers nucleocapsid. HERV-H has some peculiarities with respect to its cousins. The CA protein shares a 40% similarity with that of Reticulo-endotheliosis (REV-T) virus, an oncogenic avian gammaretrovirus (aligned with BLAST at blast.ncbi.nlm.nih.gov). ENV is 70% similar to its homolog in REV-T and in 67
69 RD114, a feline endogenous retrovirus present in the genome of the cat. This similarity indicates that the cellular receptor for HERV-H should be SLC1A5, a membrane protein highly expressed in human embryonic stem cells. The striking feature of this virus is the presence of two zing finger motifs into the nucleocapsid protein. The role of NC is linked to the reverse transcription step, since it binds the viral RNA via its zinc finger domains and promotes the polymerase activity of RT. Indeed all known gammaretroviruses, except HERV-H, have only one zinc finger domain, while the privilege of bearing two zinc fingers is, in general, reserved to more complex retroviruses, such as HIV and HTLV. Notably, none of the HERV-H transcripts encode for a functional protein, being intercalated by non-sense stop codons, frame shifts or deletions. However, some studies reported the detection of HERV-H proteins, such as ENV, under certain conditions [128]. No replicationcompetent HERV-H virus construct is currently available, but an attempt to reconstruct a functional viral DNA in silico has been reported [127] ENDOGENOUS RETROVIRUSES IN MOUSE Exogenous gammaretroviruses in mouse have the same integration preferences as we have described in human cells. Indeed, in Mouse Embryonic Fibroblasts (MEF), the analysis of the association of MLV integration sites with the H3K4me3 profile yielded an F score of 0.83 (p<1e- 100), with more than 60% of proviruses integrated wi2kb of the marker. Moreover, 63% of MLV integration events in Hematopoietic Stem Cells are wi2kb of H3K4me3 ChIPSeq peaks in hematopoietic derived LZK cells with an F score of Therefore, we conclude, as observed in humans, that the association strength is cell-type dependent. There are several endogenous gammaretroviruses in mouse, some of them well conserved and functional [3]. Interestingly, as previously mentioned, none of them associate with available H3K4me3 profiles in embryonic stem cells (all F scores <<0.5). This could be explained by the embryonic silencing exerted by TRIM28 in complex with the adaptor protein ZNF805, as recently discovered [129]. ZNF805 is a zinc finger protein with no homolog in humans or in 68
70 other species. Probably this protein arose as a result of strong selection pressure exerted by murine specific gammaretroviruses during evolution. Furthermore, it has been shown that the lysine methyltransferase protein G9a changes the epigenetic features favorable to transcription by inducing the di-methylation of lysine 9 of histone 3, a specific marker for DNA silencing (H3K9me2), on the proviral promoter [130]. The Eset protein is then required to maintain this epigenetic modification and to induce the DNA methylation that eventually silences the proviral transcription [131] DOES HERV-H MAINTAIN THE MEMORY OF ANCESTRAL EPIGENETIC FACTORS? All these data taken together suggest that HERV-H, as other retroviruses belonging to the genus gammaretroviridae, acknowledged the same epigenetic factors associated with integration site selection. Therefore we can imagine that millions year ago, during the waves of HERV-H infection of human and simian progenitors, these retroviruses infected germ and/or embryonic stem cells by integrating in the proximity to H3K4me3-marked nucleosomes. These proviruses could have then retained these cell-type specific markers by transmitting through all cell lineages. Unfortunately, the analysis of the DNA surrounding HERV-H did not support this hypothesis, since it is too degraded to retain some functional sequence, probably due to the absence of positive selection on these genomic regions. We tried also to search for epigenetic markers on syntenic regions in the mouse genome, being epigenetic profiles not available for ancestors closer to humans, such as higher apes (chimpanzee, orangutan) or macaques. In practice, we considered the DNA surrounding the provirus which was aligned to the mouse genome (using the tool LiftOver, after excision of all repetitive elements (performed with RepeatMasker, No clear distinction has been found by measuring the association of mouse H3K4me3 between syntenic provirus and control loci. 69
71 Of course, another straightforward and simple interpretation is possible. Un-methylated HERV- H LTR could be able to recruit chromatin remodeling factors after integration and to induce H3K4me3 modifications of the viral promoter. An argument against this hypothesis relies on the presence, in the 4kB HERV-H surrounding regions, of two factors recently shown to co-localize in embryonic-specific enhancers: P300 and H3K27ac [132,133]. Incidentally, H3K27ac is one of the most powerful markers of gammaretroviral integration site selection (Table 4). These markers have been shown to bind intra-species conserved regions and we found they are present in most of the 30 best expressed HERVH (80% wi4kb, F score 0.95). Therefore, since it is unlikely that a virus is capable to recruit these factors by exploiting the presence of random conserved regions around its integrations site, we propend for a pre-existing layer of epigenetic markers that could have driven, or at least favored, the stable integration of HERV-H into the heritable DNA. 70
72 4 HERV-H EXPRESSION IN HUMAN EMBRYONIC AND DIFFERENTIATED CELLS H3K4me3 is a well known marker for transcription. Promoters tagged with this factor usually ensure a consistent expression of the related gene [63,134]. Taking into account the remarkable association between HERV-H loci and H3K4me3 positions, we suspected that the expression of HERV-H mrna would be considerably higher in embryonic and induced pluripotent stem cells than in other cell lines. Moreover, we observed that HERV-H DNA fragments are not silenced by H3K27me3 (F score 0.2), a repressing marker involved in the bivalent control of developmental genes in embryonic stem cells [135]. In our opinion, HERV-H expression represents a general hesc feature and could be exploited to measure the degree of differentiation of embryonic and induced stem cells. H3K4me3 is located, on average, around 0.5kB from the HERV-H LTRs. It is worth to recall that exogenous gammaretroviruses mainly associate around 2kB (Figure 6). Therefore, proximity of H3K4me3 to the LTR is suggestive of active HERV-H transcription. Supporting this hypothesis, overexpression of two specific HERV- Hs in embryonic stem cells has been already reported [136,137]. To quantify the potential HERV-H expression level in hesc, we re-analyzed some datasets based on RNA quantification experiments obtained by high throughput sequencing techniques (RNASeq) released by the ENCODE Proect [138]. The complete expression profile of H1 hesc cells and 5 other differentiated cell lines is available [UCSC ENCODE Proect]. Basic information about RNASeq technology is reported in Appendix B. 4.1 RNASEQ DATA ANALYSIS Despite HERV-H being present in more than 1000 imperfect copies in the human genome and its transcripts still share a number of short conserved regions (each around 100bp). Therefore, deep sequencing of those transcripts yields reads (25-75bp long sequences) which perfectly 71
73 align to several genomic loci. Indeed, multireads mapping is still a challenging process [139]. The strategy adopted here was to perform the alignment of uniquely mapped single- and paired-end reads and to reassign the multiple-mapped reads in function of the expression level of the surrounding (context) region [123]. HERV-H expression was evaluated by counting the reads mapped in all HERV-H loci normalized with the standard formula N r Er K [140] Lr NT where N is the number of reads mapping onto the r transcript, r Lr is the length of the r-esim transcript and numbers. 9 N is the total number of reads. K, usually10, is a constant to avoid small T Alignments of RNASeq generated reads have been performed with a two-step procedure. First we used Bowtie[141] on raw data, admitting up to two mismatches for each alignment, and then we discriminated between unique mapping reads and multireads, 80% and 20% of the total number of reads respectively. As expected, many multireads matched with repeated elements. Ignoring them would have resulted in a potential underestimation of the expression of endogenous retroviruses and, in general, of all repetitive elements. Therefore, we adopted a probabilistic assignment based on the amount of reads that univocally map onto the surrounding regions (context), as described in more detail in This evaluation is also useful to establish if a repeated element is expressly transcribed or if it is part of another structure (i.e. a gene), as described in PROBABILISTIC ALIGNMENT OF MULTIPLE MAPPING READS The uniquely mapping read was defined as a short sequence generated by high throughput sequencing that can be aligned to a single genomic region s. Accordingly, we defined the multiread as a sequence r that aligns to a set of M regions {s1,..,s M}. For each region s i the context region is ci Ci /( Ci si ) being C i a genomic region of n nucleotides encompassing s i. The assumption that the amount of reads is proportional to the amount of actual mrna implies that the set of multireads is distributed on the reference genome accordingly to the amount of 72
74 uniquely mapping reads aligned to the context regions. Consider (s D ) as the function giving the number of reads of the dataset D that map univocally to the genomic region s described by the tuple (chr, start, end). Therefore, the probability of the read r to be actually part of the mrna generated from the region s i is estimated as: D ( ci ) PD ( r si ) M. D ( c ) Eventually, the set of multireads mapping to the same M regions is then partitioned to {s1,..,s M} accordingly to P D ( s i ) SPECIFICITY The first axiom of high throughput sequencing asserts that the number of reads aligned to a specific genomic region is proportional to how much RNA has been generated by this region within the cell. At this point it is worth observing that repeated element (RE) sequences might be present in the RNA ust because they are part of longer mrnas. Since we expect that elements having a specific biological function are independently transcribed, we attempted to distinguish between RE specifically expressed with their own promoter from those that are part of longer RNAs. The number of reads mapped to a region s can be naively modeled as a linear combination of specific reads T (s), unspecific reads 2 U(s) and additional zero-mean noise that account for all other experimental and nonsystematic fluctuations that can randomly influence the output of the sequencing process. Formally: 2 ( s) U( S) T( s) where (s), as before, is the function giving the number of reads assigned to the region s. Therefore, the mean number of reads in the region s is: 73
75 E[ T( s)] ( s) U( s). In order to estimate U(s), it is possible to count the number of reads mapped to the context region c as previously shown (4.1.1). Therefore we set ( c) U( s) 2, and we eventually adopt the following approximation to correct for the non-specificity of transcription: ( c) E[ T( s)] ( s) HERV-H EXPRESSION Expression levels of HERV-H have been evaluated in 5 cell types: H1 (embryonic stem cell), K562 (myelogenous leukemia), HeLaS3 (cervical cancer), GSM12878 (lymphoblastoid), HepG2 (hepatocellular liver carcinoma), HUVEC (umbilical vein endothelial) and NHEK (epidermal keratinocyte) where RNASeq datasets of paired 75nt long reads are available [ENCODE Caltech]. Among these cell types, we would predict that HERV-H is significantly expressed only in H1 embryonic stem cells because of the stringency of the association with H3K4me3. Accordingly, the highest amount of HERV-H RNA can be observed in these cells compared to HeLa (100-fold lower) and to other available cell types (more than 100-fold lower). As a comparison, in H1 stem cells we observed a~1000-fold lower expression of the younger and better conserved betaretrovirus HERV-K and a 65-fold lower expression of BRD2, a constitutive gene that keep almost the same level of expression in all cell types (Figure 21). The same observations have been made by examining the RNASeq from another embryonic stem cell line (H9) [132]. We found that almost all expressed HERV-H in hesc have the structure LTR+GAG+PRO+LTR with a deletion of the POL+ENV region. Conversely, HERV-H fragments containing POL and ENV are barely detected (Figure 22). 74

76 RPKM Figure 21. HERV-H cumulative expression in hesc, HeLa and K562 cells compared to HERV-K expression and BRD2, a constitutive gene that has the same expression level in all these cell types. HERV-H is 1000 fold more expressed than HERV-K and 25 fold more expressed than BRD2 in hesc. It is barely detected in HeLa and no significative expression has been observed in K562 cells. (RNASeq data from[138]) Figure 22. Transcriptional level of each HERV-H component normalized to 5 LTR expression. Only fragments containing 5 LTR-GAG-PRO-3 LTR are significantly expressed in hesc. 75
77 4.2.1 HERV-H EXPRESSION IS SPECIFIC IN HESC It has been previously reported that hesc are hypomethylated with respect to differentiated cell lines and this fact promotes the dysregulated transcription of all endogenous transposable elements such as SINE, LINE and endogenous HERVs [142]. Moreover, we observed that an endogenous element could be transcribed as part of regular mrna. To support the hypothesis that only HERV-H is specifically expressed, we compared the expression levels of all repetitive elements in hesc from RNASeq data and we introduced a measure of transcriptional specificity defined as the difference between the expression level of the repetitive element and the expression level of the surrounding sequence (4.1.2). Compared to LINE and SINE, HERV-H is by far the most (and probably the sole) expressed repeated element in hesc cells and accounts for almost all transcription of the HERVs family. Moreover, HERV-H shows a transcriptional specificity comparable to that of regular genes in term of specific/unspecific transcription ratio (0.85 vs. 0.86), while LINE and SINE have a transcription ratio of 0.06 and 0.03 respectively (Figure 23). Figure 23. Specific vs. non specific expression of LINE, SINE, all HERVs and HERV-H compared to regular genes. Unspecific levels of all repetitive elements are comparable but only HERV-H remains significatively expressed after adustment. Moreover, HERV-H accounts for almost all HERVs expression. 76
78 4.2.2 HERV-H EXPRESSION IN HUMAN ES DURING DIFFERENTIATION The disparity between the HERV-H high transcriptional level in hesc and the almost absence of transcription in more differentiated cell lines indicates a potential correlation between HERV-H expression and phases of differentiation. A recent study reported the results of a 4-point time course experiment, where RNA of H1 hesc cells in the undifferentiated state (N0), early initiation (N1), neural progenitor (N2) and pre-glial cells (N3) was collected and sequenced [123]. Figure 24. HERV-H expression along H1 differentiation up to early-glial cells is decreasing. Blue bars indicate unspecific expression, yellow bars represent specific expression (adusted as described in 4.1.2). HERV-H is barely detectable at the neuronal progenitor stage (N2) and disappears at the earlyglial stage (N3). BRD2 has the same expression level along differentiation and it has been used to normalize HERV-H levels. By applying our analysis on available row data ( /query/acc.cgi?acc=gse20301), we confirmed high HERV-H transcriptional levels in the undifferentiated stage (N0). As expected, HERV-H levels sensibly decrease accordingly to the differentiation time-point (Figure 24). 77
79 4.2.3 WHAT IS THE HERV-H-SPECIFIC TRANSCRIPTION FACTOR? A relatively small number of transcription factors, such as Oct4, SOX2, KLF4 and cmyc, has been demonstrated to be capable together to reprogram differentiated cells into embryonic-like induced pluripotent stem cells [143,144,145,146]. Another factor, NANOG, has been shown to be essential to retain embryonic stem cells in the undifferentiated state and to be part of the reprogramming cocktail [146]. The analysis of the RNASeq expression dynamics over time (4.2.2) revealed that NANOG, OCT4 and HERV-H RNA levels are well correlated. NANOG and OCT4 are gradually less expressed throughout differentiation. Figure 25. Correlation between the expression of some hes specific transcription factors and HERV-H during differentiation (t0-undifferentiated, t1-early initiation, t2-neural progenitor). OCT4 and NANOG are positively correlated (ρ=0.95, ρ=0.84, respectively) while SOX2 shows no correlation. This is not unexpected since these proteins are considered reliable indicators of cell pluripotency and a decrease in their expression level corresponds to an advance towards 78
80 differentiation [147]. Conversely, SOX2 is more stably expressed during differentiation and it is not correlated with HERV-H. KLF4 is less expressed and has a behavior similar to SOX2 (not shown). This agrees with NANOG and OCT4 being normally not expressed in non-embryonic cells (but they can be present in some cancer cells) while SOX2 and KLF4 are broadly expressed genes. To explore the possibility that these embryonic specific factors are somehow involved in HERV- H transcription, we performed the F score-based association analysis between HERV-H locations and available ChIPSeq binding profiles of OCT4, SOX2, KLF4 and NANOG extracted from embryonic stem cells [121,122]. Over the usual 2kB window, NANOG showed the most significant association (F score 0.75). OCT4 weakly associated to HERV-H (F score 0.55) while SOX4 and KLF4 were not associated (F score 0.46 and 0.24, respectively). Statistical significance largely increased by including into the analysis the expression level of each provirus. Strikingly, 96% of the 50 most expressed HERV-H (which account for 80% of all expressed HERV-H RNA) have their LTR promoter bound by NANOG, as shown by the modified chromosome proection mandala (Figure 26). Green areas represent the LTR region corresponding to the first 0.5kB of HERV-H proviral sequence and dot sizes are proportional to expression levels. Consequently, the resulting F score was almost perfectly associated (0.97) within a window of 0.5kB (Figure 27). OCT4 also increased considerably its association with HERV-H LTRs, yielding an F score of 0.90 wi2kb. Even remaining outside of the LTR region, SOX2 obtained an F score of 0.85 wi4kb, while KLF4 still appeared to be not associated (F score 0.34, Figure 26). These high associations indicate that these transcription factors are distributed along the regions between the HERV-H transcription starting sites and the distance of their maximal association. Indeed the average distance from HERV-H transcription starting sites of NANOG, OCT4 and SOX2 ChIPSeq peaks is 0.250kB, 1kB and 2kB respectively, as if they were uniformly distributed (Figure 27). 79

81 Figure 26. Modified Chromosome Proection Mandalas depicting NANOG, OCT4, SOX2 and KLF4 associations with HERV-H proviruses. The green ring indicates the 5 LTR region. Dot size is proportional to the expression level of each single provirus. NANOG is bound to the 5 LTR of almost all highly expressed retroviruses. OCT4 shows a significant association. SOX2 binds all expressed HERV-H in a region between 1KB and 2KB while KLF4 does not show any significant association pattern. 80
82 Figure 27. A) Association strength (F score) of NANOG, OCT4 and SOX2 to the 50 most transcribed HERV-H (accounting for 80% of total HERV-H expression) in function of the distance from HERV-H Transcription Starting Site (TSS). Maxima in F score indicate the distance of greatest association. B) Average distance of NANOG (red), OCT4 (blue) and SOX2 (green) to HERV-H TSS is schematically reported. As expected from a uniform distribution model, the average distance is half of the distance between maximal association and TSS. These results taken together delineate the structure of a precise pattern obtained by combining the binding profile of NANOG, OCT4 and SOX2 in hesc (Figure 28). Indeed, binding of these three factors maps in the same specific order within the promoter region of most of those HERV-H proviruses (8 out of 10) which express the highest amount of transcripts. This suggests that a fine tuning of the expression of these proviruses could be required by specific cellular functions. 81
")
83 Figure 28. Chromosome Proection Mandala combination of NANOG, OCT4 and SOX2 with respect to 50 HERV-H proviruses. The three embryonic transcription factors bind with the same order (NANOG- OCT4-SOX2) the promoter region of the most expressed HERV-Hs suggesting a regulatory function of their expressions EXPRESSION OF OTHER REPETITIVE ELEMENTS As a matter of comparison, we created a chromosome proection mandala where Long INterspersed Elements (LINE) took the place of HERV-H fragments with respect to NANOG binding sites. No LINE is expressed to an appreciable level except one located on chromosome 13:55,048,158-55,050,476. Interestingly, a deeper inspection of this region revealed a particular genomic structure where LINE transcription is driven by an adacent HERV-H bounded by NANOG at both LTRs. This element does not have an integral ORF and its possible functional role is unclear. 82
 Chromosome Proection Mandala depicting the association between NANOG and expressed LINE elements in human embryonic stem cells. Remarkably, there is only one highly transcribed LINE element.")
.")
84 A LINE / NANOG B chr13:55,043,884-55,066,179; transcription on minus strand Figure 29. A) Chromosome Proection Mandala depicting the association between NANOG and expressed LINE elements in human embryonic stem cells. Remarkably, there is only one highly transcribed LINE element. B) LINE transcription in hesc is mediated by HERV-H. The genomic region of interest has been represented by UCSC Genome Browser where the linear chromosome is mapped on the horizontal axis. Four biological replicates confirm HERV-H and LINE expression in hesc while no expression has been detected in K562 cells (only one out of 4 replicates has been shown). Direction of transcription has been determined by strand-specific sequencing [138]. NANOG is bound to both LTRs (represented with black squares along the LTR row). Notably, the adacent HERV-L is not transcribed. It is also noteworthy that the betaretrovirus HERV-L is not expressed, even if it is adacent to the transcribed region, confirming that HERV-H expression is specifically regulated and not ust the outcome of a spurious transcription due to hypomethylation. 83
85 4.3 POSSIBLE ROLES OF HERV-H IN EMBRYONIC STEM CELLS All these results taken together clearly suggest that HERV-H is transcribed in contexts important for the maintenance of the undifferentiated state of embryonic stem cells (stemness). At this point the intriguing question concerns the possible function of this highly expressed RNA. Although the final answer could only come from well-tailored wet lab experiments, we applied some bioinformatics techniques to analyze different biological meaningful hypothesis HYPOTHESIS 1: HERV-H AS A CODING SEQUENCE As previously mentioned, almost all of the transcribed HERV-H has the LTR-GAG-PRO-LTR structure, but, following non-sense mutations, insertion and deletions, none of them has an integral Open Reading Frame (ORF). It could be possible that some kind of splicing could generate coding-competent mrna. However, this possibility is unlikely because the used RNASeq protocol excluded non-polyadenylated RNAs (see Appendix B). This implies that only spliced RNA was considered for sequencing and the expression pattern we observed is rather compact and does not reveal the presence of HERV-H exons HYPOTHESIS 2: MICRORNA RESERVOIR Generally, the secondary structure of retroviral RNA is rather complicated since it has to accomplish different tasks before and during reverse transcription, as observed by analyzing the structure of an entire HIV-1 genome at single nucleotide resolution [148]. 84
86 A C B Figure 30. A) One example of HERV-H RNA (~3kB) secondary structure. Other HERV-Hs could have a different structure, given their heterogeneity. B) and C) Several HERV-H branches have a secondary structure similar to a 100bp pre-mirna. 85
87 Indeed the HERV-H secondary structure folds efficiently (Figure 30A) and presents several stemloop motifs. The hypothesis is that HERV-H could play the role of mirna reservoir, as recently seen for Epstein-Barr Virus (EBV, not a retrovirus) [149]. mirnas are short ribonucleic acid (RNA) molecules, on average 22 nucleotides long, and are post-transcriptional regulators that bind to full or partial complementary sequences on target mrnas, resulting in translational repression and consequent gene silencing. Many of the eukaryotic mirna are characterized by a 7-8nt region named seed, that perfectly matches the target mrna 5 or 3 UTR [150]. We applied MFold to estimate the secondary structure of several full HERV-H sequences through the Vienna mrna WebSuite [151] and of some HERV-H sub-sequences that are well conserved across all these proviruses. Notably, some 0.1kB sequences show secondary structures similar to standard pre-mirna configurations (Figure 30B and C). To confute the hypothesis that these or other sequences belonging to HERV-H transcripts could express functional mirnas, we made use of another RNASeq dataset, specifically tailored for small RNA fragments (30nt) produced in the H9 embryonic cell line [152]. Since typical analysis pipelines of HTS data filters out reads mapping to repetitive elements, we accessed row data and counted the number of all small reads (i.e. putative mirnas) arising from HERV-H transcripts. With respect to known expressed embryonic mirna clusters (i.e. hsa-mir-302), these putative HERV- H mirnas levels were at least 100-fold lower, suggesting that a functional role in this sense is unlikely HYPOTHESIS 3: MICRORNA DECOY A recent study demonstrated the existence of mirna decoys, i.e. non-coding transcripts (usually pseudogenes) that compete with coding mrna for binding to mirna and therefore regulating mirna-mediated mrna repression [153]. We analyzed the possibility that HERV-Hs could have thisrole. To test this hypothesis, we considered all known human and non-human mirna sequences, as deposited in mirbase ( and aligned them against the 86
88 10 most expressed HERV-H transcripts in embryonic stem cells. Only mirnas with an alignment producing at least 8nt conserved out of six or more HERV-Hs were selected for advanced analysis. Interestingly, only one (hsa-mir-21) out of 9 hits is highly expressed in the H9 embryonic stem cell line [152] (Table 13). Hsa-miR-21 was one of the first mammalian mirnas identified and its mature sequence is strongly conserved throughout evolution. The human microrna-21 gene is located on the positive strand of chr17, at location (hg18) within the 3 UTR of a coding gene. It has its own promoter regions and forms its independent transcript. Hsa-mir-21 has already been reported to be an embryonic specific mirna [154], targeting tumor suppressor genes and being the first mirna to acquire the denomination of oncomir [155]. Most notably, experimentally validated targets are the co-transcription factor BRG1, the tumor suppressors PDCD4, BTG2 and PTEN, the first gene shown to be protected by mirna decoy [153]. Table 13. mirnas potentially targeting HERV-H transcripts mirna Sequence HERV-H match (length in nt) HERV-H conservation Expression in hesc hsa-mir-21 UAGCUUAUCAGACUGAUGUUGA 10 8/10 High hsa-mir-483-5p AAGACGGGAGGAAAGAAGGGAG 11 8/10 Poor hsa-mir-513a-3p UAAAUUUCACCUUUCUGAGAAGG 10 7/10 No hsa-mir-671-3p UCCGGUUCUCAGGGCUCCACC 10 6/10 Poor hsa-mir-1267 CCUGUUGAAGUGUAAUCCCCA 11 6/10 Poor hsa-mir-3141 GAGGGCGGGUGGAGGAGGA 11 8/10 Poor hsa-mir p AGAAAAUUUUUGUGUGUCUGAUC 10 7/10 No hsa-mir-3652 CGGCUGGAGGUGUGAGGA 11 8/10 No hsa-mir-3914 AAGGAACCAGAAAAUGAGAAGU 11 6/10 No 87
89 4.3.4 HYPOTHESIS 4: ANTIVIRAL FACTOR One of the most conserved regions among all transcribed HERV-H extends from the 5 LTR to the GAG initiator. This region contains the Primary Binding Sequence (PBS) and, most notably, the packaging signal Ψ. When viral RNA is transcribed, this particular sequence folds in a secondary structure that is recognized by the NucleoCapsid domain (NC) of the GAG polyprotein precursor. Two copies of viral RNA are then transported near the cytoplasmic membrane and encapsidated (or packaged) into the newly assembled particle. A possible function that the cell could have acquired after HERV-H integration is a defensive mechanism based on co-packaging of exogenous infectious retroviruses with non-functional defective endogenous retroviral RNA. In this case, an exogenous retrovirus infects cells which begin to produce viral RNA and proteins. If these cells also express a large amount of defective endogenous retroviral RNA with a compatible packaging signal, this will compete for packaging with the exogenous retrovirus genome, resulting in retroviral particles that will contain mainly non-functional genomes Such progeny of pseudotyped particles will be able to bind to and fuse with new target cells, but will not transmit infectious RNA. To assess whether this hypothesis is possible, we can describe with a simple mathematical model how the spreading infection process flows. Assume that a retrovirus is able to infect a single cell with efficiency, then the infinitesimal variation of the number of infected cell is dc t dt v(t) (10) where v(t) is the viral concentration in function of time. On average we can assume that a single infected cell is able to produce a certain amount of virus. In this simple model we don t consider diffusive effects, spatial constraints, cell population morphologies or free virus in the supernatant. Therefore the viral concentration is given by v( t) C( t). (11) 88
90 Giving the initial concentration of the virus, V and the condition C( 0) V, the solution of (10) is simply C t ( t) Ve. That is, the number of infected cell increases exponentially. To make the model more realistic, we should consider that cellular population is dynamic. In vivo, the average number of cells is homeostatic in normal biological structures. Introducing the growth rate and the mortality rate, the equation (10) can be rewritten as: dc t dt ( ) C( t) v( t). Infected cells have a lower fitness with respect to normal cells and, more importantly, they can be intercepted and induced to apoptosis by the immune systems [156]. In the model this condition is represented by. Setting and with eq. (11), we get dc t dt ( ) C( t) and the solution is C t t ( t) V e e. Clearly, increments or decrements of the number of infected cells are controlled by the sign of the exponent of the dominant factor. In other words, the virus has to guarantee good efficiency of infection and high viral production to overcome the cell mortality due to inherent low fitness of infected cell and the shutdown induced by the immune system. On the other hand, it is clear that an adequate immune system could eliminate all the infected cells if. (12) Getting back to the hypothesis, co-packaging mechanism acts directly on viral particle production. Indeed, if a non-functional but packaging-compatible viral RNA is expressed, can be written as: 89
91 ˆ ˆ P ( r1, r2 V ), 2 where ˆ is the ideal viral production rate, is the amount of the expressed functional viral RNA and is the amount of compatible, non-functional RNA. The two viral RNAs are independently selected for packaging in this model. From (12), the condition for an effective antiviral co-packaging mechanism is then 1. Reasonable values for the parameters are: efficiency , viral production of virions/day, infected cell rate of [mortality-growth] /day [157]. To achieve a silencing effect, the antiviral non-functional RNA needs then to be expressed around ~10 fold more than the viral RNA. Gammaretroviral promoters are considered to be as efficient as promoters of active genes. BRD2, having a transcript of around 4kB and being constitutively expressed, is a good surrogate. As previously observed, HERV-H is at least 60 fold more expressed than BRD2 in hesc. Therefore these estimations suggest that, in principle, the antiviral co-packaging mechanism is capable to significantly help the immune system to efficiently eliminate a compatible pathogen. 90
92 5 DISCUSSION In this proect, we attempted to identify epigenetic markers related to exogenous and endogenous retroviral integration site selection. To this end, the growing body of ChIPSeq and retroviral integration datasets was exploited. Borrowing from the field of information retrieval, we derived a measure, the F score, which allowed us to identify and rank candidate markers for association with proviruses. Covalent modification of histone H3, most prominently H3K4me1, H3K4me3, and H3K9ac, as well as binding sites for the transcription factor STAT1, were tightly linked to proviruses from MLV, XMRV, and PERV. The F score also permitted us to combine factors to generate a supermarker that predicted 75% of integration sites with precision and with specificity for integration site preference within a given cell type. The ChIPSeq datamining approach used here identified markers for gammaretroviral integration site selection that are superior to any markers previously reported. This result suggested that the genomic localization of endogenous retroviruses can be related to the distribution of epigenetic markers too. Indeed, an ancient primate endogenous gammaretrovirus, HERV-H, results highly associated with H3K4me3 in human embryonic and induced pluripotent stem cells, while this association decreases with cell differentiation. As a consequence of that, we found this provirus to be highly expressed in hesc and its transcription to be regulated by three maor transcription factors: NANOG, OCT4 and SOX2. While the possible functional role has yet to be discovered, this study raises intriguing questions about the role of retroviruses during the evolution of the human species and during the embryonal development. 5.1 ADVANTAGES OF THE F SCORE Prior to this study, the best predictor for retroviral integration site selection was the association of TSS/CpG with gammaretroviruses such as MLV [31,43,86]. Given a window of 2 kb, TSS/CpG predicts 21 to 27% of MLV integration sites. But even this modest prediction comes with the 91
93 cost of a high background rate (low precision) and consequently a borderline F score (0.51 under the best conditions). In contrast, H3K4me3 predicts 63 to 68% of MLV integration sites with high precision (F score 0.84). H3K4me1 predicts 90% of MLV integration sites but, in isolation, this marker has a higher background rate (F score 0.78) due to the larger size of the H3K4me1 ChIPSeq dataset (300,000 binding sites for H3K4me1 versus 70,000 for H3K4me3). Previous studies have reported the same histone modifications as markers associated with integration sites [94,103]. The Precision-Recall methods used here have been shown to be better suited than ROC when negative results far exceed positive ones [95]. Precision-Recall methods have been shown to perform better than ROC in a number of other areas in biology, including the prediction of functional residues within proteins [108] or predicting the function of genes [109]. In our case, the resolution offered by the Precision-Recall-based F score allowed us to rank markers according to statistical significance. Then, by ranking markers with respect to their F score, we were able to combine them to generate a supermarker which predicts 75% of MLV integration sites wi2kb with very high precision (F score 0.87). It will certainly be important to find an explanation for the remaining 25% of integration sites not accounted for by the markers identified here. 5.2 SIGNIFICANCE OF THE SUPERMARKER The supermarker was used here to predict the probability of gammaretroviral integration into a specific locus, in a cell-type specific manner (Figure 15). Our in silico probability estimates for integration near a particular proto-oncogene, LMO2, were nearly identical to the probabilities calculated from experimental data [117], and even concurred with respect to the cell-type specificity of the experimentally determined probability. Additional experimental confirmation of supermarker predictions is called for, but the case of LMO2 suggests that the supermarker is indeed the first powerfully predictive tool for retroviral integration site selection. A supermarker generated from cell-type-specific ChIPSeq data for a handful of markers has the potential to transform how decisions are made concerning clinical gene-therapy trials. The calculations here were based on distinct datasets from multiple sources (Tables 1 and 2). 92
94 Table 14. Association of some genomic features with proviral integration sites, H3K4me3 and H3K4me1 ChIPSeq data Integration Density a % Control Density % Integration F 0.5 score p-value b H3K4me3 F 0.5 score H3K4me1 F 0.5 score MLV motif c [80] > HIV motif [80] > MA0056 d MA > MA > MA > MA > MA > MA > MA > MLV AT content e * MLV GC content f HIV AT content HIV GC content * a Feature densities are calculated wi2kb of MLV or HIV proviral integration sites and H3K4m1 and H3K4me3 ChIPSeq putative sites in HeLa cells. b non corrected P-value related to the association of the feature with the proviral integration dataset. c MLV and HIV-1 consensus integration site according to [80]. d JASPAR accession codes of Position Weight Matrices of 8 transcription factor binding motifs previously reported to be associated with MLV proviruses in HeLa [100]. e % of A and T in genomic DNA sequence wi2kb of proviruses. f % of G and C wi2kb of proviruses. * indicates a negative association It is possible that, by generating matched datasets, i.e. integration datasets and ChIPSeq datasets from identical cells and by the same laboratory, or by combining ChIPSeq data for new 93
95 factors in new combinations, the ability of the supermarker to predict integration sites will be improved even further. On the other hand, STAT1, a powerful marker in isolation, increased the false positive rate and decreased the F score. In addition to the ChIPSeq datasets in Table 1, we checked if the F score was improved by examining other previously reported features, including GC content, AT content, putative consensus sequences for integration or transcription factors [84,158]. When a window of 2kB was considered, these features failed to yield a significant F score (all were 0.5) for all of the retroviral provirus datasets, and these factors considerably lessened the F score when combined with the highly associated markers (Table 14). 5.3 MECHANISTIC IMPLICATIONS The strength of the associations with H3K4me3, H3K4me1, and H3K9ac indicates that gammaretroviral integration is not a quasi-random process, but rather, a deterministic process that tracks with the epigenetic histone code. Though some of these histone modifications are linked to transcriptionally active promoters [63,100,101,102], the link to transcription per se seems not to be relevant, since 60 to 70% of supermarker loci are not associated with TSS/CpG. Consistent with this point, our supermarker is highly associated with the LMO2 promoter in CD4+ T cells, but not in HeLa cells, and these cell-type-specific differences in marker binding do not correlate with differential LMO2 expression in these cells [117]. The 2 kb window maxima for the F score of the supermarker is intriguing and suggests that it is a physical property of chromatin that is favored for integration by gammaretroviruses, perhaps linked to the position of the supermarker relative to nucleosomes or bent DNA [34,36,37,38]. The factors constituting the supermarker, along with the other histone modifications listed in Tables 4 and 5 that are also associated with MLV integration, suggest a mechanistic link between gammaretroviral integration and chromatin-associated complexes with H3K4 methyltransferase and histone acetyltransferase activity. H3K4 methylation is clearly linked with histone acetylation, in that promoters which are methylated are much more likely to become acetylated [64] and knockdown of WDR5, a factor required for H3K4 methylation [159] 94
96 leads to altered histone acetylation [64,160]. Methylation may recruit chromatin remodeling complexes [161,162], the methylated histone may be bound by the acetylases [163], or acetylases may be components of the methylase complex itself [159]. CBP/p300 is associated with H3K4 methyltransferase activity in vivo [164,165]. ChIPSeq data on acetyltransferases shows a weak but significant association between CBP and MLV integrations in CD4+ T cells (F score 0.68, Table S4). Interestingly, combination of CBP and p300 leads to an aggregated F score of Thus, any of these chromatin associated factors, methylated histones, methylases, chromatin remodeling complexes or acetylases are candidates for gammaretroviral IN-binding factors. Interestingly, HIV-1 IN associates with, and is acetylated by, p300 [166] but the p300 ChIPSeq binding profile was not associated with the HIV-1 proviral datasets (F score 0.34). Table 15. Acetyltransferases, deacetyltransferases [65] and MLV [71] Modification Cell Line Virus F 0.5 score a Exp vs cont p300 CD4+ T MLV /1 CBP CD4+ T MLV /2 MOF CD4+ T MLV /3 TIP60 CD4+ T MLV /3 P/CAF CD4+ T MLV /4 HDAC1 CD4+ T MLV /4 HDAC2 CD4+ T MLV /4 HDAC3 CD4+ T MLV /3 HDAC6 CD4+ T MLV /5 a % of experimental proviruses wi2kb versus the % randomized control sites wi2kb GAMMARETROVIRUS ASSOCIATION WITH STAT1 Though very strong association was observed when any of the gammaretroviruses were compared with STAT1 binding sites, adding this transcription factor to the supermarker did not improve the F score. This is perhaps because any retroviral targeting information derived from 95
97 STAT1 binding sites is already present in the modified histone H3. 90 to 95% of the STAT1 binding sites are in fact within 2 kb of the nearest H3K4me1 site. Our attempts to detect STAT1 binding to MLV IN, or to see effects of STAT1 disruption on MLV infectivity were unsuccessful. Taken together it seems likely that STAT1 itself is not mechanistically involved in gammaretrovirus integration. More likely, STAT1 homes to chromosomal regions that are also preferred targets for integration by these viruses. STAT1 has a complex relationship with the histone acetylase CBP/p300. Acetylation of histones is required for STAT1-mediated transcription [102,167] but STAT1 itself binds CBP/p300 [168] and is also acetylated and this contributes to its inactivation [169]. 5.4 EPIGENETIC ASSOCIATION WITH ENDOGENOUS RETROVIRUSES Gammaretroviruses played an important role in species evolution, contributing to genome expansion and differentiation. In humans, phylogenetic analysis of endogenous gammaretroviral sequences identified HERV-H as the latest gammaretrovirus that was able to colonize primate germ lines during two main waves, 40 and 15Myrs ago. They are nowadays impaired in their replication functionality by several deletions and mutations in their proviral sequence. In the mouse genome, there are also several active endogenous MLV-like retroviruses, but they are fully silenced in embryonic stem cells by a TRIM28-mediated mechanism. This mechanism is capable of recruiting silencing markers and deleting H3K4me3 in the proximity of the proviral sequence [129]. In this study a strong association between the genomic position of epigenetic markers and the location of endogenous retroviral sequences has been observed for the first time. This association is exclusively limited to embryonic and induced pluripotent stem cells. Indeed, the human endogenous gammaretrovirus HERV-H seems to be integrated in close proximity of H3K4 three-methylated histones, into germ or embryonic chromosomes of human ancestors and following the same integration pattern that we recently observed for MLV, PERV and XMRV. While we cannot yet formally prove it, several clues indicate that such ancient retrovirus retains the same epigenetic markers that it had exploited across the human evolution. 96
98 H3K4me3 is a known marker for transcription. By analyzing publicly available RNASeq data of H1 and H9 human embryonic stem cell lines, we discovered that some HERV-Hs are highly expressed in these cells, and expression levels are inversely correlated with the stages of differentiation. Moreover, we observed a peculiar binding profile of NANOG, OCT4 and SOX2. These proteins bind almost all the expressed HERV-H LTRs following this order: NANOG and OCT4 bind into the LTR and SOX2 is located upstream of the promoter regions. Strikingly, it has been previously observed that NANOG, OCT4 and SOX2 co-occupy a substantial portion of their target genes and that most of these genes are transcription factors involved in development, such as homeodomain proteins [170]. All these observations strongly support the hypothesis that HERV-H transcripts could have some relevant role in human embryos development and that this role is finely regulated by the interplay of three of the most important transcription factors in hesc. Since HERV-H transcripts cannot encode proteins, we suggest that such expression has two possible functions: 1) a decoy effect aimed at smoothing or retarding the activation of differentiation pathways triggered by mirna ; 2) an antiviral function aimed at counteracting retroviral spreading infection by interfering with viral RNA packaging. At the moment we can conclude that HERV-H is specifically transcribed in hesc and that the association with H3K4me3 in induced pluripotent cells indicates that HERV-H is potentially reexpressed after reprogramming differentiated cells. The presence of NANOG, OCT4 and SOX2 on the promoter region strongly suggests that HERV-H expression is finely regulated by the interaction of these embryonic specific factors. Accordingly, we observed that HERV-H RNA levels decrease with differentiation, in a way proportional to expression of NANOG and OCT4. As an immediate application of these findings, HERV-H could be employed as a reliable marker of embryonic stem cell growth and differentiation, as well as an indicator of the degree of stemness of ips cells in standard protocols. 97
99 5.5 RETROVIRUSES MODELED THE SHAPE AND THE BEHAVIOR OF THE HUMAN GENOME Recently, we demonstrated that a well known antiviral protein, TRIM5, acts as a pattern recognition receptor specific for the retrovirus capsid lattice, and constitutively promotes innate immune signaling [171]. In one experiment, we assessed the effect of TRIM5 knockdown in myeloid THP-1 cells. Pools of cells were generated using a vector used to knock down TRIM5 or a control vector. Global expression profiles were assessed using Illumina microarrays. Raw microarray data were processed and analyzed using the Bioconductor R package, lumi, with default values for background correction, variance stabilization and quantile normalization. For further analysis, all Illumina probe IDs were converted to unique Entrez IDs. Gene ontology terms and pathways that were enriched in the downregulated and upregulated gene sets were measured using DAVID [172], with the total set of genes mapped on the microarray as the background. Significance was evaluated by a modified Fisher s exact test and p-values were Bonferroni corrected for multiple testing. The effect of the TRIM5 knockdown was extraordinarily specific in that, of 25,000 genes probed, only 33 were significantly decreased (differential expression > 2 fold and adusted p- value<0.05, see Figure 31). The maority of these were NF-kB- and AP-1-responsive inflammatory mediators, 70% being inflammatory chemokines and cytokines (Table 16 and 17). This result, confirmed and integrated with other experiments [171], indicates that retroviruses apply a significant selection pressure leading to the development of antiviral factors, of which TRIM5 is one example among other known (i.e. APOBEC3G, Tetherin) and not known factors. Moreover they are part of pathways that nowadays are constitutively activated and significantly contribute to the regulation of maor defenses against external intruders. Altogether, the observations reported in this thesis highlight the remarkable force that retroviruses have applied to species evolution using diverse mechanisms. On one hand, pathogenic retroviruses constantly pose a selective pressure which forces the development of 98

100 novel cellular activities, as seen in the case of Trim5. On the other hand, the presence of nonrandomly integrated retroviral DNA abundantly expressed during the early phases of embryonic development shows that retroviruses can modulate the function of the human genome more directly, after altering its genetic structure. We hope that the work presented here contributes to unveil, at least in part, the complex relationship between retroviruses and evolution of the species. Figure 31. Global expression profile comparing TRIM5 knockdown (KD) to control KD THP-1 macrophages. Each dot represents a single gene. Genes falling between the dashed lines are not disregulated (<2 fold). Triangles indicate inflammatory genes significantly downregulated in TRIM5 KD. 99
101 Table 16. Upregulated genes in TRIM5KD versus Control THP1 cells Gene logfc p-value COL10A e-17 MB e-17 MFGE e-16 PLAC e-15 CRIP e-15 CDC e-14 LILRA e-14 NMB e-13 GJA e-11 NTS e-11 TOP2A e
102 Table 17. Downregulated genes in TRIM5KD versus Control THP1 cells Gene logfc P.Value CCL4L e-12 LEPREL e-18 ADAMDEC e-19 SOD e-19 CCL e-18 CCL3L e-18 CCl3L e-18 IGFBP e-18 TDO e-18 COL22A e-18 CCL e-18 MFGE e-18 CCL4L e-13 HSD17B e-18 APOC e-17 LYPLA e-17 KYNU e-17 TFPI e-16 TNF e-16 EBI e-15 IL e-16 IL1B e-15 GIMAP e-14 MMP e-14 HS3ST3A e-13 LRFN e-12 CCL e-11 STC e-13 SLC39A e-11 GNG e-12 IER e-12 TGFB e-11 GEM e
103 6 APPENDIX A RETROVIRUS INTEGRATION SITE DATASETS AND GENERATION OF CONTROLS The analysis of integration sites was based on the published integration datasets in Table 2. In the analysis performed here, to control for possible bias introduced during the cloning of the integration sites, 10 control sites in the human genome were generated for each integration site, randomly choosing among all sites placed at the same distance from cutting enzyme consensus, as previously described [42,43,82,84]. These controls, in silico-generated sites, were used to calculate the significance and the F score. CPG ISLAND AND TRANSCRIPTION START SITES These genomic features were obtained from Annotated Genome version hg18 for human ( CpG island and transcription start sites were combined into single datasets for determining association with retrovirus integration sites. CHIPSEQ DATASETS ChIPSeq peaks were derived from published ChIPSeq datasets (Table 1) with a robust and fast algorithm, F-Seq [110] running with default parameters and standard Poisson statistics. Comparison with other tools as MACS [173] or SISSRs [174] has been done for consistence checking. We recalculated the peaks even when the peak set was already available to confirm the reproducibility of published procedures. 102
104 RNASEQ ALIGNMENT To align raw RNASeq reads, the program Bowtie ( [175] has been used. Human genome version hg18 has been used as reference. POSITION SPECIFIC SCORING MATRIX (PWM) PWM for retroviruses and human transcription factors was borrowed from [84] and from the JASPAR database ( DATASET FILE FORMAT The formats for all input and output files used or produced during this proect are BED and WIG. BED is a TAB delimited text based format and has been used to describe the position of whatever feature (retroviruses, proteins, nucleosomes) on chromosomal DNA. Mandatory fields are Chromosome, ChrStart (starting position of the feature in the chromosome), ChrEnd (starting position of the feature in the chromosome). Custom additional fields can include Strand, Feature Expression level, Peak Height, Peak Size and others. Example:... chr chr The wiggle (WIG) format is for display of continuous data such as GC/AT content, expression levels at base-pair resolution and ChIPSeq/RNASeq data densities. Wiggle format is lineoriented. For wiggle custom tracks, the first line is a track definition line and adds a number of options for different uses. 103
105 Wiggle format is composed of declaration lines and data lines. There are two options for formatting wiggle data: variablestep and fixedstep. variablestep is suited for data with irregular intervals between new data points. It begins with a declaration line and is followed by two columns containing chromosome positions and data values. The declaration line starts with the word variablestep and is followed by a specification for a chromosome. For example variablestep chrom=chr fixedstep is suited for data with regular intervals between new data values and is the more compact wiggle format. It begins with a declaration line and is followed by a single column of data values. For example: variablestep chrom=chr1 start= step= Further reference in ftp://hgdownload.cse.ucsc.edu/apache/htdocs-rr/goldenpath/help/wiggle.html. COMPUTATIONAL FRAMEWORK All computation and graphics were done with ad-hoc Python scripts with the support of the motility library for PWM calculations (cartwheel.caltech.edu/ motility), Matplotlib library for graphical and scientific computing (matplotlib.sourceforge.net) and the Random Forest implementation on R environment ( Specific conversion tools from BED to WIG and vice versa have been specifically written in Python for this proect. 104
106 7 APPENDIX B CHIPSEQ Figure 32. Main steps of ChIPSeq process. [Immunoprecipitation schema from wiki/chip-on-chip] Chromatin Immunoprecipitation Sequencing (ChIPSeq) is a technique that improves the detection of protein binding site on chromosomal DNA with respect to previous microarray based techniques (ChIP on ChIP) [62]. The first phase of the process is similar to a standard immunoprecipitation. After crosslinking and shearing the unpurified genomic DNA, the protein bound to a DNA fragment sticks to a matrix prepared with the specific antibody. After purification, labeling and amplification, the fragmented DNA is sequenced and mapped back on the reference genome. Statistics is then applied to identify highly probable binding sites with respect to an internal background (Poisson distribution) or to a control dataset. 105
 is generated from the RNA of interest and purified via")
107 RNASEQ Computational Alignment and Mapping Figure 33. Schematic RNASeq procedure After RNA extraction, complementary DNAs (cdnas) is generated from the RNA of interest and purified via RNase digestion (usually selection for polyadenylated RNA is made to get rid of 106
Introduction retroposon
 17.1 - Introduction A retrovirus is an RNA virus able to convert its sequence into DNA by reverse transcription A retroposon (retrotransposon) is a transposon that mobilizes via an RNA form; the DNA element
LESSON 4.6 WORKBOOK. Designing an antiviral drug The challenge of HIV
 LESSON 4.6 WORKBOOK Designing an antiviral drug The challenge of HIV In the last two lessons we discussed the how the viral life cycle causes host cell damage. But is there anything we can do to prevent
Computational Analysis of UHT Sequences Histone modifications, CAGE, RNA-Seq
 Computational Analysis of UHT Sequences Histone modifications, CAGE, RNA-Seq Philipp Bucher Wednesday January 21, 2009 SIB graduate school course EPFL, Lausanne ChIP-seq against histone variants: Biological
Retroviruses. ---The name retrovirus comes from the enzyme, reverse transcriptase.
 Retroviruses ---The name retrovirus comes from the enzyme, reverse transcriptase. ---Reverse transcriptase (RT) converts the RNA genome present in the virus particle into DNA. ---RT discovered in 1970.
Lecture 2: Virology. I. Background
 Lecture 2: Virology I. Background A. Properties 1. Simple biological systems a. Aggregates of nucleic acids and protein 2. Non-living a. Cannot reproduce or carry out metabolic activities outside of a
Reverse transcription and integration
 Reverse transcription and integration Lecture 9 Biology 3310/4310 Virology Spring 2018 One can t believe impossible things, said Alice. I dare say you haven t had much practice, said the Queen. Why, sometimes
VIRUSES. 1. Describe the structure of a virus by completing the following chart.
 AP BIOLOGY MOLECULAR GENETICS ACTIVITY #3 NAME DATE HOUR VIRUSES 1. Describe the structure of a virus by completing the following chart. Viral Part Description of Part 2. Some viruses have an envelope
Julianne Edwards. Retroviruses. Spring 2010
 Retroviruses Spring 2010 A retrovirus can simply be referred to as an infectious particle which replicates backwards even though there are many different types of retroviruses. More specifically, a retrovirus
Section 6. Junaid Malek, M.D.
 Section 6 Junaid Malek, M.D. The Golgi and gp160 gp160 transported from ER to the Golgi in coated vesicles These coated vesicles fuse to the cis portion of the Golgi and deposit their cargo in the cisternae
7.012 Problem Set 6 Solutions
 Name Section 7.012 Problem Set 6 Solutions Question 1 The viral family Orthomyxoviridae contains the influenza A, B and C viruses. These viruses have a (-)ss RNA genome surrounded by a capsid composed
The HIV life cycle. integration. virus production. entry. transcription. reverse transcription. nuclear import
 The HIV life cycle entry reverse transcription transcription integration virus production nuclear import Hazuda 2012 Integration Insertion of the viral DNA into host chromosomal DNA, essential step in
Genetics and Genomics in Medicine Chapter 6 Questions
 Genetics and Genomics in Medicine Chapter 6 Questions Multiple Choice Questions Question 6.1 With respect to the interconversion between open and condensed chromatin shown below: Which of the directions
VIROLOGY. Engineering Viral Genomes: Retrovirus Vectors
 VIROLOGY Engineering Viral Genomes: Retrovirus Vectors Viral vectors Retrovirus replicative cycle Most mammalian retroviruses use trna PRO, trna Lys3, trna Lys1,2 The partially unfolded trna is annealed
Recombinant Protein Expression Retroviral system
 Recombinant Protein Expression Retroviral system Viruses Contains genome DNA or RNA Genome encased in a protein coat or capsid. Some viruses have membrane covering protein coat enveloped virus Ø Essential
Circular RNAs (circrnas) act a stable mirna sponges
 act a stable mirna sponges") Circular RNAs (circrnas) act a stable mirna sponges cernas compete for mirnas Ancestal mrna (+3 UTR) Pseudogene RNA (+3 UTR homolgy region) The model holds true for all RNAs that share a mirna binding
Circular RNAs (circrnas) act a stable mirna sponges cernas compete for mirnas Ancestal mrna (+3 UTR) Pseudogene RNA (+3 UTR homolgy region) The model holds true for all RNAs that share a mirna binding
Name Section Problem Set 6
 Name Section 7.012 Problem Set 6 Question 1 The viral family Orthomyxoviridae contains the influenza A, B and C viruses. These viruses have a (-)ss RNA genome surrounded by a capsid composed of lipids
Eukaryotic Gene Regulation
 Eukaryotic Gene Regulation Chapter 19: Control of Eukaryotic Genome The BIG Questions How are genes turned on & off in eukaryotes? How do cells with the same genes differentiate to perform completely different,
Chapter 18. Viral Genetics. AP Biology
 Chapter 18. Viral Genetics 2003-2004 1 A sense of size Comparing eukaryote bacterium virus 2 What is a virus? Is it alive? DNA or RNA enclosed in a protein coat Viruses are not cells Extremely tiny electron
Last time we talked about the few steps in viral replication cycle and the un-coating stage:
 Zeina Al-Momani Last time we talked about the few steps in viral replication cycle and the un-coating stage: Un-coating: is a general term for the events which occur after penetration, we talked about
Chapter 19: Viruses. 1. Viral Structure & Reproduction. 2. Bacteriophages. 3. Animal Viruses. 4. Viroids & Prions
 Chapter 19: Viruses 1. Viral Structure & Reproduction 2. Bacteriophages 3. Animal Viruses 4. Viroids & Prions 1. Viral Structure & Reproduction Chapter Reading pp. 393-396 What exactly is a Virus? Viruses
Chapter 13B: Animal Viruses
 Chapter 13B: Animal Viruses 1. Overview of Animal Viruses 2. DNA Viruses 3. RNA Viruses 4. Prions 1. Overview of Animal Viruses Life Cycle of Animal Viruses The basic life cycle stages of animal viruses
number Done by Corrected by Doctor Ashraf
 number 4 Done by Nedaa Bani Ata Corrected by Rama Nada Doctor Ashraf Genome replication and gene expression Remember the steps of viral replication from the last lecture: Attachment, Adsorption, Penetration,
Hepadnaviruses: Variations on the Retrovirus Theme
 WBV21 6/27/03 11:34 PM Page 377 Hepadnaviruses: Variations on the Retrovirus Theme 21 CHAPTER The virion and the viral genome The viral replication cycle The pathogenesis of hepatitis B virus A plant hepadnavirus
Chapter 19: Viruses. 1. Viral Structure & Reproduction. What exactly is a Virus? 11/7/ Viral Structure & Reproduction. 2.
 Chapter 19: Viruses 1. Viral Structure & Reproduction 2. Bacteriophages 3. Animal Viruses 4. Viroids & Prions 1. Viral Structure & Reproduction Chapter Reading pp. 393-396 What exactly is a Virus? Viruses
Viruses Tomasz Kordula, Ph.D.
 Viruses Tomasz Kordula, Ph.D. Resources: Alberts et al., Molecular Biology of the Cell, pp. 295, 1330, 1431 1433; Lehninger CD Movie A0002201. Learning Objectives: 1. Understand parasitic life cycle of
Polyomaviridae. Spring
 Polyomaviridae Spring 2002 331 Antibody Prevalence for BK & JC Viruses Spring 2002 332 Polyoma Viruses General characteristics Papovaviridae: PA - papilloma; PO - polyoma; VA - vacuolating agent a. 45nm
AP Biology. Viral diseases Polio. Chapter 18. Smallpox. Influenza: 1918 epidemic. Emerging viruses. A sense of size
 Hepatitis Viral diseases Polio Chapter 18. Measles Viral Genetics Influenza: 1918 epidemic 30-40 million deaths world-wide Chicken pox Smallpox Eradicated in 1976 vaccinations ceased in 1980 at risk population?
Human Genome Complexity, Viruses & Genetic Variability
 Human Genome Complexity, Viruses & Genetic Variability (Learning Objectives) Learn the types of DNA sequences present in the Human Genome other than genes coding for functional proteins. Review what you
Accessing and Using ENCODE Data Dr. Peggy J. Farnham
 1 William M Keck Professor of Biochemistry Keck School of Medicine University of Southern California How many human genes are encoded in our 3x10 9 bp? C. elegans (worm) 959 cells and 1x10 8 bp 20,000
Histones modifications and variants
 Histones modifications and variants Dr. Institute of Molecular Biology, Johannes Gutenberg University, Mainz www.imb.de Lecture Objectives 1. Chromatin structure and function Chromatin and cell state Nucleosome
HIV INFECTION: An Overview
 HIV INFECTION: An Overview UNIVERSITY OF PAPUA NEW GUINEA SCHOOL OF MEDICINE AND HEALTH SCIENCES DIVISION OF BASIC MEDICAL SCIENCES DISCIPLINE OF BIOCHEMISTRY & MOLECULAR BIOLOGY PBL MBBS II SEMINAR VJ
Fayth K. Yoshimura, Ph.D. September 7, of 7 RETROVIRUSES. 2. HTLV-II causes hairy T-cell leukemia
 1 of 7 I. Diseases Caused by Retroviruses RETROVIRUSES A. Human retroviruses that cause cancers 1. HTLV-I causes adult T-cell leukemia and tropical spastic paraparesis 2. HTLV-II causes hairy T-cell leukemia
Fayth K. Yoshimura, Ph.D. September 7, of 7 HIV - BASIC PROPERTIES
 1 of 7 I. Viral Origin. A. Retrovirus - animal lentiviruses. HIV - BASIC PROPERTIES 1. HIV is a member of the Retrovirus family and more specifically it is a member of the Lentivirus genus of this family.
LESSON 4.4 WORKBOOK. How viruses make us sick: Viral Replication
 DEFINITIONS OF TERMS Eukaryotic: Non-bacterial cell type (bacteria are prokaryotes).. LESSON 4.4 WORKBOOK How viruses make us sick: Viral Replication This lesson extends the principles we learned in Unit
Hands-on Activity Viral DNA Integration. Educator Materials
 OVERVIEW This activity is part of a series of activities and demonstrations focusing on various aspects of the human immunodeficiency virus (HIV) life cycle. HIV is a retrovirus. Retroviruses are distinguished
For all of the following, you will have to use this website to determine the answers:
 For all of the following, you will have to use this website to determine the answers: http://blast.ncbi.nlm.nih.gov/blast.cgi We are going to be using the programs under this heading: Answer the following
Ch. 18 Regulation of Gene Expression
 Ch. 18 Regulation of Gene Expression 1 Human genome has around 23,688 genes (Scientific American 2/2006) Essential Questions: How is transcription regulated? How are genes expressed? 2 Bacteria regulate
mirna Dr. S Hosseini-Asl
 mirna Dr. S Hosseini-Asl 1 2 MicroRNAs (mirnas) are small noncoding RNAs which enhance the cleavage or translational repression of specific mrna with recognition site(s) in the 3 - untranslated region
7.014 Problem Set 7 Solutions
 MIT Department of Biology 7.014 Introductory Biology, Spring 2005 7.014 Problem Set 7 Solutions Question 1 Part A Antigen binding site Antigen binding site Variable region Light chain Light chain Variable
Alternative splicing. Biosciences 741: Genomics Fall, 2013 Week 6
 Alternative splicing Biosciences 741: Genomics Fall, 2013 Week 6 Function(s) of RNA splicing Splicing of introns must be completed before nuclear RNAs can be exported to the cytoplasm. This led to early
MIR retrotransposon sequences provide insulators to the human genome
 Supplementary Information: MIR retrotransposon sequences provide insulators to the human genome Jianrong Wang, Cristina Vicente-García, Davide Seruggia, Eduardo Moltó, Ana Fernandez- Miñán, Ana Neto, Elbert
HIV & AIDS: Overview
 HIV & AIDS: Overview UNIVERSITY OF PAPUA NEW GUINEA SCHOOL OF MEDICINE AND HEALTH SCIENCES DIVISION OF BASIC MEDICAL SCIENCES DISCIPLINE OF BIOCHEMISTRY & MOLECULAR BIOLOGY PBL SEMINAR VJ TEMPLE 1 What
7.012 Quiz 3 Answers
 MIT Biology Department 7.012: Introductory Biology - Fall 2004 Instructors: Professor Eric Lander, Professor Robert A. Weinberg, Dr. Claudette Gardel Friday 11/12/04 7.012 Quiz 3 Answers A > 85 B 72-84
7SK ChIRP-seq is specifically RNA dependent and conserved between mice and humans.
 Supplementary Figure 1 7SK ChIRP-seq is specifically RNA dependent and conserved between mice and humans. Regions targeted by the Even and Odd ChIRP probes mapped to a secondary structure model 56 of the
Hands-On Ten The BRCA1 Gene and Protein
 Hands-On Ten The BRCA1 Gene and Protein Objective: To review transcription, translation, reading frames, mutations, and reading files from GenBank, and to review some of the bioinformatics tools, such
Lecture Readings. Vesicular Trafficking, Secretory Pathway, HIV Assembly and Exit from Cell
 October 26, 2006 1 Vesicular Trafficking, Secretory Pathway, HIV Assembly and Exit from Cell 1. Secretory pathway a. Formation of coated vesicles b. SNAREs and vesicle targeting 2. Membrane fusion a. SNAREs
Screening for Complex Phenotypes
 Screening for Complex Phenotypes Michael Hemann hemann@mit.edu Screening for cancer phenotypes in mice How do we typically model cancer in mice? Tumor Suppressor KO Oncogene transgenesis Problems with
Fig. 1: Schematic diagram of basic structure of HIV
 UNIVERSITY OF PAPUA NEW GUINEA SCHOOL OF MEDICINE AND HEALTH SCIENCES DIVISION OF BASIC MEDICAL SCIENCES DISCIPLINE OF BIOCHEMISTRY & MOLECULAR BIOLOGY PBL SEMINAR HIV & AIDS: An Overview What is HIV?
Nature Immunology: doi: /ni Supplementary Figure 1. Characteristics of SEs in T reg and T conv cells.
 Supplementary Figure 1 Characteristics of SEs in T reg and T conv cells. (a) Patterns of indicated transcription factor-binding at SEs and surrounding regions in T reg and T conv cells. Average normalized
MedChem 401~ Retroviridae. Retroviridae
 MedChem 401~ Retroviridae Retroviruses plus-sense RNA genome (!8-10 kb) protein capsid lipid envelop envelope glycoproteins reverse transcriptase enzyme integrase enzyme protease enzyme Retroviridae The
VIRUSES AND CANCER Michael Lea
 VIRUSES AND CANCER 2010 Michael Lea VIRAL ONCOLOGY - LECTURE OUTLINE 1. Historical Review 2. Viruses Associated with Cancer 3. RNA Tumor Viruses 4. DNA Tumor Viruses HISTORICAL REVIEW Historical Review
Dr. Ahmed K. Ali Attachment and entry of viruses into cells
 Lec. 6 Dr. Ahmed K. Ali Attachment and entry of viruses into cells The aim of a virus is to replicate itself, and in order to achieve this aim it needs to enter a host cell, make copies of itself and
The Epigenome Tools 2: ChIP-Seq and Data Analysis
 The Epigenome Tools 2: ChIP-Seq and Data Analysis Chongzhi Zang zang@virginia.edu http://zanglab.com PHS5705: Public Health Genomics March 20, 2017 1 Outline Epigenome: basics review ChIP-seq overview
Nature Structural & Molecular Biology: doi: /nsmb.2419
 Supplementary Figure 1 Mapped sequence reads and nucleosome occupancies. (a) Distribution of sequencing reads on the mouse reference genome for chromosome 14 as an example. The number of reads in a 1 Mb
p53 cooperates with DNA methylation and a suicidal interferon response to maintain epigenetic silencing of repeats and noncoding RNAs
 p53 cooperates with DNA methylation and a suicidal interferon response to maintain epigenetic silencing of repeats and noncoding RNAs 2013, Katerina I. Leonova et al. Kolmogorov Mikhail Noncoding DNA Mammalian
Regulation of Gene Expression in Eukaryotes
 Ch. 19 Regulation of Gene Expression in Eukaryotes BIOL 222 Differential Gene Expression in Eukaryotes Signal Cells in a multicellular eukaryotic organism genetically identical differential gene expression
19 Viruses BIOLOGY. Outline. Structural Features and Characteristics. The Good the Bad and the Ugly. Structural Features and Characteristics
 9 Viruses CAMPBELL BIOLOGY TENTH EDITION Reece Urry Cain Wasserman Minorsky Jackson Outline I. Viruses A. Structure of viruses B. Common Characteristics of Viruses C. Viral replication D. HIV Lecture Presentation
AP Biology Reading Guide. Concept 19.1 A virus consists of a nucleic acid surrounded by a protein coat
 AP Biology Reading Guide Name Chapter 19: Viruses Overview Experimental work with viruses has provided important evidence that genes are made of nucleic acids. Viruses were also important in working out
Nature Structural & Molecular Biology: doi: /nsmb Supplementary Figure 1
 Supplementary Figure 1 Effect of HSP90 inhibition on expression of endogenous retroviruses. (a) Inducible shrna-mediated Hsp90 silencing in mouse ESCs. Immunoblots of total cell extract expressing the
5/6/17. Diseases. Disease. Pathogens. Domain Bacteria Characteristics. Bacteria Viruses (including HIV) Pathogens are disease-causing organisms
 Pathogens are disease-causing organisms") 5/6/17 Disease Diseases I. II. Bacteria Viruses (including HIV) Biol 105 Chapter 13a Pathogens Pathogens are disease-causing organisms Domain Bacteria Characteristics 1. Domain Bacteria are prokaryotic.
5/6/17 Disease Diseases I. II. Bacteria Viruses (including HIV) Biol 105 Chapter 13a Pathogens Pathogens are disease-causing organisms Domain Bacteria Characteristics 1. Domain Bacteria are prokaryotic.
Multiple sequence alignment
 Multiple sequence alignment Bas. Dutilh Systems Biology: Bioinformatic Data Analysis Utrecht University, February 18 th 2016 Protein alignments We have seen how to create a pairwise alignment of two sequences
Nature Genetics: doi: /ng Supplementary Figure 1. Assessment of sample purity and quality.
 Supplementary Figure 1 Assessment of sample purity and quality. (a) Hematoxylin and eosin staining of formaldehyde-fixed, paraffin-embedded sections from a human testis biopsy collected concurrently with
7.013 Spring 2005 Problem Set 7
 MI Department of Biology 7.013: Introductory Biology - Spring 2005 Instructors: Professor Hazel Sive, Professor yler Jacks, Dr. Claudette Gardel 7.013 Spring 2005 Problem Set 7 FRIDAY May 6th, 2005 Question
Chapter 4 Cellular Oncogenes ~ 4.6 -
 Chapter 4 Cellular Oncogenes - 4.2 ~ 4.6 - Many retroviruses carrying oncogenes have been found in chickens and mice However, attempts undertaken during the 1970s to isolate viruses from most types of
October 26, Lecture Readings. Vesicular Trafficking, Secretory Pathway, HIV Assembly and Exit from Cell
 October 26, 2006 Vesicular Trafficking, Secretory Pathway, HIV Assembly and Exit from Cell 1. Secretory pathway a. Formation of coated vesicles b. SNAREs and vesicle targeting 2. Membrane fusion a. SNAREs
OCCUPATIONAL HEALTH CONSIDERATIONS FOR WORK WITH VIRAL VECTORS
 OCCUPATIONAL HEALTH CONSIDERATIONS FOR WORK WITH VIRAL VECTORS GARY R. FUJIMOTO, M.D. PALO ALTO MEDICAL FOUNDATION ADJUNCT ASSOCIATE CLINICAL PROFESSOR OF MEDICINE DIVISION OF INFECTIOUS DISEASES AND GEOGRAPHIC
Biol115 The Thread of Life"
 Biol115 The Thread of Life" Lecture 9" Gene expression and the Central Dogma"... once (sequential) information has passed into protein it cannot get out again. " ~Francis Crick, 1958! Principles of Biology
Viral Genetics. BIT 220 Chapter 16
 Viral Genetics BIT 220 Chapter 16 Details of the Virus Classified According to a. DNA or RNA b. Enveloped or Non-Enveloped c. Single-stranded or double-stranded Viruses contain only a few genes Reverse
STAT1 regulates microrna transcription in interferon γ stimulated HeLa cells
 CAMDA 2009 October 5, 2009 STAT1 regulates microrna transcription in interferon γ stimulated HeLa cells Guohua Wang 1, Yadong Wang 1, Denan Zhang 1, Mingxiang Teng 1,2, Lang Li 2, and Yunlong Liu 2 Harbin
Herpesviruses. Virion. Genome. Genes and proteins. Viruses and hosts. Diseases. Distinctive characteristics
 Herpesviruses Virion Genome Genes and proteins Viruses and hosts Diseases Distinctive characteristics Virion Enveloped icosahedral capsid (T=16), diameter 125 nm Diameter of enveloped virion 200 nm Capsid
Chapter 19: The Genetics of Viruses and Bacteria
 Chapter 19: The Genetics of Viruses and Bacteria What is Microbiology? Microbiology is the science that studies microorganisms = living things that are too small to be seen with the naked eye Microorganisms
Problem Set 5 KEY
 2006 7.012 Problem Set 5 KEY ** Due before 5 PM on THURSDAY, November 9, 2006. ** Turn answers in to the box outside of 68-120. PLEASE WRITE YOUR ANSWERS ON THIS PRINTOUT. 1. You are studying the development
The Insulator Binding Protein CTCF Positions 20 Nucleosomes around Its Binding Sites across the Human Genome
 The Insulator Binding Protein CTCF Positions 20 Nucleosomes around Its Binding Sites across the Human Genome Yutao Fu 1, Manisha Sinha 2,3, Craig L. Peterson 3, Zhiping Weng 1,4,5 * 1 Bioinformatics Program,
Microbiology Chapter 7 Viruses
 Microbiology Chapter 7 Viruses 7:1 Viral Structure and Classification VIRUS: a biological particle composed of genetic material (DNA or RNA) encased in a protein coat CAPSID: protein coat surrounding a
EPIGENOMICS PROFILING SERVICES
 EPIGENOMICS PROFILING SERVICES Chromatin analysis DNA methylation analysis RNA-seq analysis Diagenode helps you uncover the mysteries of epigenetics PAGE 3 Integrative epigenomics analysis DNA methylation
Endogenous Retroviral elements in Disease: "PathoGenes" within the human genome.
 Endogenous Retroviral elements in Disease: "PathoGenes" within the human genome. H. Perron 1. Geneuro, Geneva, Switzerland 2. Geneuro-Innovation, Lyon-France 3. Université Claude Bernard, Lyon, France
Transcriptional control in Eukaryotes: (chapter 13 pp276) Chromatin structure affects gene expression. Chromatin Array of nuc
 Chromatin structure affects gene expression. Chromatin Array of nuc") Transcriptional control in Eukaryotes: (chapter 13 pp276) Chromatin structure affects gene expression Chromatin Array of nuc 1 Transcriptional control in Eukaryotes: Chromatin undergoes structural changes
Transcriptional control in Eukaryotes: (chapter 13 pp276) Chromatin structure affects gene expression Chromatin Array of nuc 1 Transcriptional control in Eukaryotes: Chromatin undergoes structural changes
he micrornas of Caenorhabditis elegans (Lim et al. Genes & Development 2003)
") MicroRNAs: Genomics, Biogenesis, Mechanism, and Function (D. Bartel Cell 2004) he micrornas of Caenorhabditis elegans (Lim et al. Genes & Development 2003) Vertebrate MicroRNA Genes (Lim et al. Science
MicroRNAs: Genomics, Biogenesis, Mechanism, and Function (D. Bartel Cell 2004) he micrornas of Caenorhabditis elegans (Lim et al. Genes & Development 2003) Vertebrate MicroRNA Genes (Lim et al. Science
Running Head: AN UNDERSTANDING OF HIV- 1, SYMPTOMS, AND TREATMENTS. An Understanding of HIV- 1, Symptoms, and Treatments.
 Running Head: AN UNDERSTANDING OF HIV- 1, SYMPTOMS, AND TREATMENTS An Understanding of HIV- 1, Symptoms, and Treatments Benjamin Mills Abstract HIV- 1 is a virus that has had major impacts worldwide. Numerous
8/13/2009. Diseases. Disease. Pathogens. Domain Bacteria Characteristics. Bacteria Shapes. Domain Bacteria Characteristics
 Disease Diseases I. Bacteria II. Viruses including Biol 105 Lecture 17 Chapter 13a are disease-causing organisms Domain Bacteria Characteristics 1. Domain Bacteria are prokaryotic 2. Lack a membrane-bound
Bacteriophage Reproduction
 Bacteriophage Reproduction Lytic and Lysogenic Cycles The following information is taken from: http://student.ccbcmd.edu/courses/bio141/lecguide/unit3/index.html#charvir Bacteriophage Structure More complex
Coronaviruses. Virion. Genome. Genes and proteins. Viruses and hosts. Diseases. Distinctive characteristics
 Coronaviruses Virion Genome Genes and proteins Viruses and hosts Diseases Distinctive characteristics Virion Spherical enveloped particles studded with clubbed spikes Diameter 120-160 nm Coiled helical
SUPPLEMENTAL INFORMATION
 SUPPLEMENTAL INFORMATION GO term analysis of differentially methylated SUMIs. GO term analysis of the 458 SUMIs with the largest differential methylation between human and chimp shows that they are more
2.1 VIRUSES. 2.1 Learning Goals
 2.1 VIRUSES 2.1 Learning Goals To understand the structure, function, and how Viruses replicate To understand the difference between Viruses to Prokaryotes and Eukaryotes; namely that viruses are not classified
19 2 Viruses Slide 1 of 34
 1 of 34 What Is a Virus? What Is a Virus? Viruses are particles of nucleic acid, protein, and in some cases, lipids. Viruses can reproduce only by infecting living cells. 2 of 34 What Is a Virus? Viruses
Supplementary Figure 1: Attenuation of association signals after conditioning for the lead SNP. a) attenuation of association signal at the 9p22.
 attenuation of association signal at the 9p22.") Supplementary Figure 1: Attenuation of association signals after conditioning for the lead SNP. a) attenuation of association signal at the 9p22.32 PCOS locus after conditioning for the lead SNP rs10993397;
Supplementary Figure 1: Attenuation of association signals after conditioning for the lead SNP. a) attenuation of association signal at the 9p22.32 PCOS locus after conditioning for the lead SNP rs10993397;
I. Bacteria II. Viruses including HIV. Domain Bacteria Characteristics. 5. Cell wall present in many species. 6. Reproduction by binary fission
 Disease Diseases I. Bacteria II. Viruses including are disease-causing organisms Biol 105 Lecture 17 Chapter 13a Domain Bacteria Characteristics 1. Domain Bacteria are prokaryotic 2. Lack a membrane-bound
Size nm m m
 1 Viral size and organization Size 20-250nm 0.000000002m-0.000000025m Virion structure Capsid Core Acellular obligate intracellular parasites Lack organelles, metabolic activities, and reproduction Replicated
1. Virus 2. Capsid 3. Envelope
 VIRUSES BIOLOGY II VOCABULARY- VIRUSES (22 Words) 1. Virus 2. Capsid 3. Envelope 4. Provirus 5. Retrovirus 6. Reverse transcriptase 7. Bacteriophage 8. Lytic Cycle 9. Virulent 10. Lysis 11. Lysogenic Cycle
Mayo Clinic HIV ecurriculum Series Essentials of HIV Medicine Module 2 HIV Virology
 Mayo Clinic HIV ecurriculum Series Essentials of HIV Medicine Module 2 HIV Virology Eric M. Poeschla, MD Professor of Medicine College of Medicine Consultant, Division of Infectious Diseases Mayo Clinic
Fragile X Syndrome. Genetics, Epigenetics & the Role of Unprogrammed Events in the expression of a Phenotype
 Fragile X Syndrome Genetics, Epigenetics & the Role of Unprogrammed Events in the expression of a Phenotype A loss of function of the FMR-1 gene results in severe learning problems, intellectual disability
Broad H3K4me3 is associated with increased transcription elongation and enhancer activity at tumor suppressor genes
 Broad H3K4me3 is associated with increased transcription elongation and enhancer activity at tumor suppressor genes Kaifu Chen 1,2,3,4,5,10, Zhong Chen 6,10, Dayong Wu 6, Lili Zhang 7, Xueqiu Lin 1,2,8,
Nature Genetics: doi: /ng Supplementary Figure 1
 Supplementary Figure 1 Expression deviation of the genes mapped to gene-wise recurrent mutations in the TCGA breast cancer cohort (top) and the TCGA lung cancer cohort (bottom). For each gene (each pair
HS-LS4-4 Construct an explanation based on evidence for how natural selection leads to adaptation of populations.
 Unit 2, Lesson 2: Teacher s Edition 1 Unit 2: Lesson 2 Influenza and HIV Lesson Questions: o What steps are involved in viral infection and replication? o Why are some kinds of influenza virus more deadly
Breaking Up is Hard to Do (At Least in Eukaryotes) Mitosis
 Mitosis") Breaking Up is Hard to Do (At Least in Eukaryotes) Mitosis Chromosomes Chromosomes were first observed by the German embryologist Walther Fleming in 1882. Chromosome number varies among organisms most
Breaking Up is Hard to Do (At Least in Eukaryotes) Mitosis Chromosomes Chromosomes were first observed by the German embryologist Walther Fleming in 1882. Chromosome number varies among organisms most
INTEGRATION OF VIRUSES INTO CHROMOSOMAL DNA
 JOURNAL OF PATHOLOGY, VOL. 163: 191-197 (1991) REVIEW ARTICLE-CHROMOSOME PATHOLOGY INTEGRATION OF VIRUSES INTO CHROMOSOMAL DNA DAVID ONIONS Director, Leukaemia Research Fund Human Virus Centre, Department
Comparison of open chromatin regions between dentate granule cells and other tissues and neural cell types.
 Supplementary Figure 1 Comparison of open chromatin regions between dentate granule cells and other tissues and neural cell types. (a) Pearson correlation heatmap among open chromatin profiles of different
Revisiting the Definition of Living Thing
 Biology of Viruses (Ch 0 p77 and 88-9) What do you already know about viruses? Revisiting the Definition of Living Thing How did we define a living thing? H0 DOMAIN ARCHAEA virus So, if the Cell Theory
11/15/2011. Outline. Structural Features and Characteristics. The Good the Bad and the Ugly. Viral Genomes. Structural Features and Characteristics
 Chapter 19 - Viruses Outline I. Viruses A. Structure of viruses B. Common Characteristics of Viruses C. Viral replication D. HIV II. Prions The Good the Bad and the Ugly Viruses fit into the bad category
Overview: Conducting the Genetic Orchestra Prokaryotes and eukaryotes alter gene expression in response to their changing environment
 Overview: Conducting the Genetic Orchestra Prokaryotes and eukaryotes alter gene expression in response to their changing environment In multicellular eukaryotes, gene expression regulates development