Link to publication in the UWA Research Repository
|
|
|
- Trevor Flowers
- 5 years ago
- Views:
Transcription


1 The suitability of active personal dosimeters as the legal dosimeter for PET radioisotope workers Crossley, S. J. (2016). The suitability of active personal dosimeters as the legal dosimeter for PET radioisotope workers Link to publication in the UWA Research Repository Rights statement This work is protected by Copyright. You may print or download ONE copy of this document for the purpose of your own non-commercial research or study. Any other use requires permission from the copyright owner. The Copyright Act requires you to attribute any copyright works you quote or paraphrase. General rights Copyright owners retain the copyright for their material stored in the UWA Research Repository. The University grants no end-user rights beyond those which are provided by the Australian Copyright Act Users may make use of the material in the Repository providing due attribution is given and the use is in accordance with the Copyright Act Take down policy If you believe this document infringes copyright, raise a complaint by contacting repository-lib@uwa.edu.au. The document will be immediately withdrawn from public access while the complaint is being investigated. Download date: 21. Jul. 2018
2 The suitability of active personal dosimeters as the legal dosimeter for PET radioisotope workers Steven J Crossley Supervisors: Dr. Roger Price, Dr. Mike House Masters Thesis submitted as part of the M.Sc. by Thesis and Coursework in the School of Physics, University of Western Australia Date of submission: 28 th of September 2016
3 Abstract Staff working with PET radiopharmaceuticals wear active personal dosimeters and a passive dosimeter which provides the legal dose record for regulatory purposes. Given the capabilities of current active dosimeters with a dose logging capability it may be asked whether the active dosimeters could be used as the legal dosimeter, removing the need for a passive dosimeter. A series of controlled experiments were performed exposing active dosimeters and two types of approved passive dosimeters to a range of doses from vials containing 18 FDG. Reported doses from passive and active monitoring of staff were compared over 24 months. A questionnaire was used to gauge worker preferences and acceptance of different personal dosimeters. It was found that the active dosimeters agree well with the TLD results over the range of doses tested in the controlled experiments. Agreement with the OSL dosimeters was not as good. Active dosimeters gave more repeatable results than either of the passive dosimeters. There was poor agreement between the passive and active dosimeters in the worker results for both radiopharmaceutical production workers and nurses and technologists working with PET patients. Large numbers of the passive dosimeters reported below the detection limit when the active dosimeters reported doses above the supplier stated detection limits. Workers were positive in their response to using active dosimeters, and felt that they were useful in aiding their radiation protection. Controlled experiments have demonstrated that active dosimeters are capable of accurately and reliably reporting doses from 18 FDG. Comparisons of worker doses were far less conclusive and demonstrated the difficulty of obtaining accurate dose data from personal dosimeters of any kind. The main hurdle to the use of active dosimeters to provide the legal record of worker exposure seems to be regulatory rather than technical.
4 Acknowledgements I would like to acknowledge the assistance I have received form my co-workers in the Medical Technology & Physics Department (MTP) at Sir Charles Gairdner Hospital. The RAPID group within MTP, in particular Peter Gibbons and Chris Jones, for their dispensing of doses of radiopharmaceutical and helping with the ordering, setting up and running of the active dosimetry system. The Medical Physics group in MTP for help with ordering and reporting advice for passive dosimeters and assistance with literature searches and for there feedback during thesis writing. I d like to thank Phil Parr and Barry Turk for their mechanical skills in making my experimental rig. Janette Atkinson and Dr Roger Price have my gratitude for allowing me the time and resources to carry out my research in the department. The nurses and technologists in Nuclear Medicine also deserve thanks for their willingness to assist me in trialing the active dosimeters in their department. My project coordinator Dr Mike House has been a great help in pulling this thesis together and in helping me complete the rest of the Masters course. I would like to thank him for his patience. Last, but by no means least, my wife Kelly has helped greatly with patience, advice, assistance and motivation throughout my Masters and indeed our life together.
5 Contents 1 Introduction Background Types of personal dosimeter Passive Dosimeters Film Badges Thermo-luminescent and Optically Stimulated Dosimeters (TLD & OSL) Active Personal Dosimeters The Accuracy of Personal Radiation Dosimeters Active Dosimeters for Legal Assessment of Occupational Dose PET Radiopharmaceutical Production PET Radiopharmaceutical Dispensing and Use PET Centre workers Aims Experimental Methods & Materials Radiation Source Passive Dosimeters TLD OSL Active Dosimetry System DMC 2000 and DMC Logging Station & Database Software Controlled performance comparison of passive and active dosimeters Radiation Safety Physical layout of experiment Conducting an Exposure i
6 CONTENTS ii Exposures Performed Obtaining Results Normalising results from separate exposures Displaying Results Statistical Assessment of Difference of Means Comparison of staff doses recorded by passive and active dosimeters Gathering RAPID Staff doses Gathering PET Centre Staff doses Comparison of doses User Experience Survey Results Results below the detection limit Controlled performance comparison of passive and active dosimeters Comparison of doses around the experimental rig Comparison of results from the same dosimeter type Comparison of dosimeter results with theoretical dose Effects of angling the dosimeters Comparison of passive dosimeters Comparison of active dosimeters with OSL dosimeters Comparison of active dosimeters with Thermoluminescent dosimeters Summary of inter and intra-dosimeter type comparisons in controlled experiments Statistical significance of agreement of means Comparison of staff doses recorded by passive and active dosimeters RAPID Staff doses The effect of reported wear position on correlation PET Centre Staff doses User Survey Results Profession Time using Passive and Active Dosimeters
7 iii Ease of use of Dosimeters Comfort wearing Dosimeters Wear Position of Dosimeters Frequency of checking results Level of trust in dosimeter results Rate of not wearing a dosimeter Usefulness of results and feedback Prefer to wear Active, Passive or Both Additional Comments Discussion Reliability Equivalence Repeatability Limits of Detection User compliance User Acceptance of Active Dosimeters Approval of Personal Radiation Dosimetry Services Standards for Personal Radiation Monitors Calibration of APDs Record Keeping and Data Analysis Incident investigation Economic Comparison Costs of Passive Dosimetry Costs of an Active Dosimetry System Lifetime of MGP Active dosimeters Comparison of costs per year Legislative issues in Western Australia Conclusion and Future Work Conclusions Future Work Bibliography 89 A User Experience Survey 94 B Example Dose Reports 97
8 List of Figures 1.1 Electron trapping in TLD/OSL Electron relaxation during TLD/OSL readout Doped silicon semiconductor structures illustrating free electrons (ntype) and electron holes (p-type) Diode with no applied voltage A reverse bias diode acting as a radiation detector Example diagram of an FDG synthesis system (IBA Synthera) Radiation Detection Company TLD Landauer OSL Active dosimeters DMC2000S, DMC2000X, DMC2000XB and DMC Logging Station with dosimeter in cradle Logging Station showing dose results at log out Passive dosimeters arranged on 1m radius rail Personal dosimeters on holders Dosimeter holders on the rail at 0, 30 and 60 degrees Example plan layout of experimental setup Comparison plots for results from the same dosimeter type Comparison of Active dosimeter results with theoretical dose Comparison of OSL dosimeter results with theoretical dose Comparison of TLD results with theoretical dose Plots showing the effect of angulation on MGP dosimeters Plots showing the effect of angulation on OSL dosimeters Plots showing the effect of angulation on TLDs Plot of Normalised Mean Results against angle Initial comparison of passive dosimeter results Comparison of OSL and TLD results after repeat exposures Comparison of OSL and MGP results iv
9 LIST OF FIGURES v 3.12 Comparison of TLD and MGP results Mean dose per Dosimeter Type vs Mean dose per exposure Comparison of RAPID staff dose results for Comparison of RAPID staff dose results for Comparison of RAPID staff dose results for RAPID staff dose results for 2014 for staff wearing the passive and active dosimeters in the same position on the body Comparison of PET Centre staff dose results for Comparison of PET Centre staff dose results for Lifetime of MGP dosimeters
10 List of Tables 2.1 Active Dosimeter Models Used Alarm Settings on Active Dosimeters Exposures performed in initial controlled experiments Exposures performed in repeated controlled experiments RAPID Staff Numbers Numbers of staff wearing active dosimeters when working in PET only (Nov 2012 to December 2013) Numbers of staff wearing active dosimeters while working with PET and Nuclear Medicine patients (January to December 2014) Reported Minimum Detection Limits for Passive dosimeters as stated by suppliers Number of excluded dosimeter results in the controlled experiments Position dependence of results Summary of changes in dose readings when angling dosimeters Summary of linear fits to comparisons of dosimeter results Mean difference and 1.96σ values for dosimeter comparisons T-test Results (for p=0.05) for agreement of different dosimeter types Bland-Altman Results for 2012 RAPID Doses Bland-Altman Results for 2013 RAPID Doses Bland-Altman Results for 2014 RAPID Doses Bland-Altman Results for 2013 PET Centre Doses Bland-Altman Results for 2014 PET Centre Doses Professions of those surveyed Experience using Active and Passive Dosimeters Ease of Use of Dosimeters How comfortable are dosimeters Wear Position of Dosimeters vi
11 LIST OF TABLES vii 3.18 Frequency of checking dosimeter results Level of trust in dosimeter results The rate at which workers forget to wear dosimeters Usefulness of results and feedback Prefer to wear active, passive or both UK HSE Pass/Fail criteria for dosimetry services for monitoring whole body gamma exposure (Health and Safety Executive, 2010) Economic Comparison of Active and Passive Dosimetry
12 Chapter 1 Introduction 1.1 Background Exposure to ionising radiation is potentially harmful both in terms of large acute doses, causing tissue effects, and small but chronic exposure increasing the risk of stochastic effects, in particular cancer (International Commission on Radiological Protection, 2007). While the statistics of cancer induction make it impossible to prove that doses of a few milli-sieverts increase the risk of cancer in humans, data at higher doses indicate a linear relationship between radiation exposure and the probability of cancer induction. Radiation safety standards and legislation assume that this relationship is linear for low exposures all the way down to zero; this is known as the linear no threshold hypothesis (LNT) (International Commission on Radiological Protection, 2007). In order to assess the risk from an exposure, or a series of exposures, it is essential to know the dose to which the individual was exposed (International Commission on Radiological Protection, 2007), even when the exposure level is low. International recommendations have been made to limit the dose to which radiation workers are exposed (International Commission on Radiological Protection, 2007). Based on these recommendations governments, in Australia and around the world, have put in place laws (Western Australia, 1984; The Health and Safety Executive, 1999; South Australia, 2000) to limit the risks to occupationally exposed workers from radiation. Dose limits are set to keep the risk from ionising radiation, calculated using LNT, similar to workplace risks of other kinds, accepted by workers in other occupations. In order to monitor compliance with dose limits, many jurisdictions have also mandated the use of personal radiation monitors (The Health and Safety Executive, 1999; Western Australia, 1984; Bolognese-Milsztajn et al., 2004). 1
13 1 Introduction 2 Personal radiation monitors are devices worn by individual workers which are used to provide a permanent record of their radiation exposure. The principal is that the monitor is exposed to the same radiation fields as the individual, and is capable of recording the exposure. The dose that the monitor has been exposed to is then read from the dosimeter to provide a record of the exposure of the individual (National Council on Radiation Protection and Measurements, 1995). The materials used to record radiation exposure in personal dosimeters have evolved over time, but the general working practice has remained the same, with personal dosimetry being provided as a service by approved suppliers. It has been argued that developments in active dosimeter technology could change this model. Employers could provide their own dosimetry service while improving radiation safety through feedback on dose rates from active dosimeters (Luszik-Bhadra et al., 2007). 1.2 Types of personal dosimeter Passive Dosimeters Different types of passive dosimeter record dose in different ways, but all are worn for a fixed period of time, usual one or three months, by a specific individual and then returned to the supplier for reading (American Association of Physicists in Medicine [AAPM], 1995). The dosimeters are recording their radiation exposure from the time of their manufacture to the time of their reading. The supplier then provides a report of the cumulative dose for each individual over the period the dosimeter was worn. The effect of background radiation is mitigated by the use of control dosimeters which come from the same batch as the dosimeters which will be worn. The control dosimeters travel to and from the workplace with the dosimeters which will be worn by staff, but are kept away from occupational exposure. The reading of the control dosimeter is subtracted from that of the worn dosimeters to give the occupational dose reading. Passive dosimeters provide a retrospective record of received dose which is reported some time after the exposure occurs. The dosimeter is sent to be read at the end of the wear period, and there is a delay between the end of the wear period and the reporting of the dose. This delay can extend to three or four months (Lummis, 2013). Passive dosimeters have a decades long history of use in radiation protection, and their performance across a wide range of radiation energies and types is well understood and documented (Luszik-Bhadra et al., 2007). There comes a point where a measurement is too small to reliably distinguish it from background radiation. Passive dosimeters start recording background radiation
14 1 Introduction 3 from the moment they are manufactured or are reset through heating or exposure to a strong light source. When a worker is only exposed to small amounts of radiation in their occupation, this small amount of radiation can be swamped by the background signal acquired over the months between manufacture and reading of the dosimeter. Even with background subtraction there is a limit to how small an exposure can be reliably detected. Because of these issues, passive dosimeters have a minimum detectable dose below which no reliable dose information can be obtained, and thus readings below this level are not reported. The value of the minimum detectable dose varies from provider to provider, but is largely governed by the material used to record the dose Film Badges Film badges are the oldest type of passive personal dosimeter still in use today, but are being phased out in some jurisdictions, including France and Germany (Luszik- Bhadra et al., 2007). A film badge contains a small sheet of radiation sensitive film protected from light by an opaque packet. The film is housed in a plastic holder that can be attached to clothing. Radiation incident on the film causes chemical changes which make the film darker when developed, increasing its optical density. The film is read with a densitometer as the optical density of the developed film is proportional to the radiation dose it has been exposed to. Due to its composition and density, film does not absorb radiation in the same way that human tissue does. Exposed to the same radiation, film will absorb a different fraction of the energy from the radiation than tissue would. Film is not tissue equivalent. As the film is not tissue equivalent the optical density of the film is not directly related to tissue dose. The use of a range of filter materials placed in the holder between the radiation source and the film give a range of optical densities on the film. The set of optical densities can be used in the calculation of tissue dose. A filter is a known thickness of a pure material with known radiation absorption qualities. If two areas of a film are exposed to the same radiation source with different, known filters, the difference in the energy deposited in the two regions gives information on the energy of the radiation. This spectral information can be combined with the dose to the film to deduce the dose to tissue. Typically film badges have a minimum detectable dose of 100μSv (Bushberg, 2012). They are lightweight and inexpensive, but easily damaged by exposure to light, heat or moisture. As the film is replaced in the holder each month or quarter it is possible to load the film into the holder the wrong way around. Rotating the film changes the positions of the filters relative to the film, leading to
15 1 Introduction 4 inaccurate results (Bushberg, 2012) Thermo-luminescent and Optically Stimulated Dosimeters (TLD & OSL) TLDs and OSLs are both radiation exposure monitoring devices which make use of a scintillant material to record exposure over a period of time. Scintillants are materials which give off visible light when irradiated by ionising radiation. For most scintillant materials the emission of light is immediate (prompt fluorescence). In TLDs and OSLs small amounts of specific impurities (dopants) are used to create electron traps. When electrons in the material are excited to higher energy levels by ionising radiation they transition to the electron trap rather than returning to the valence energy level as shown in figure 1.1. Light is only emitted when a stimulus enables the trapped electron to return to the valence band, emitting a photon of a particular frequency (see figure 1.2). In the case of TLDs the stimulus is heat, with an OSL the stimulus is laser light of a particular frequency scanning the surface of the dosimeter (Bushberg, 2012). The amount of light given off during reading is proportional to the amount of radiation absorbed. As the materials used in the dosimeters have a similar effective atomic number to tissue the light output is broadly proportional to the dose to tissue (Bushberg, 2012). The use of filters of different materials allows for more accurate determination of equivalent dose, based on the dose to dosimeter material behind each filter. The use of filters is particularly important for measuring dose from low energy photons. In modern TLDs and in OSLs the filters are fixed inside the dosimeters (Obryk et al., 2011). Figure 1.1: Electron trapping in TLD/OSL

16 1 Introduction 5 Figure 1.2: Electron relaxation during TLD/OSL readout From the users perspective the badges are handled in the same way as film badges, they are worn for a given period, and then returned to the supplier. For a TLD the badge is heated to a particular temperature in controlled conditions, and the light emitted is detected by a photo-multiplier (PM) tube. The electrical signal from the PM tube is proportional to the light emitted which in turn is proportional to the radiation dose delivered to the scintillant (Bushberg, 2012). When reading an OSL dosimeter the surface of the scintillant is scanned by a laser of one frequency which causes the de-excitation of electrons, and the emission of light of a different frequency from the illuminated region (Bushberg, 2012). The scanning of OSL dosimeters allows for readout of the distribution of dose across the dosimeter which can give information relating to the nature of the exposure, for example whether it was a single acute exposure or a number of smaller exposures (Akselrod et al., 2000). OSL badges can also be scanned more than once if there is a query (McKeever and Moscovitch, 2003). Film badges themselves form a permanent record, and can be reviewed if required, but once TLD and OSL badges are read the badges are stimulated to return all electrons to the ground state, and the scintillant material is re-used (Bushberg, 2012). The ability to reuse scintillant materials keeps costs down Active Personal Dosimeters Active personal dosimeters (APDs) contain at least one semiconductor based radiation detector, with electronics to calculate and display equivalent dose. When semiconducting material absorbs ionising radiation, electrons are promoted to the conduction band from the valence band, creating electron-hole pairs in a manner similar to that in TLDs.


17 1 Introduction 6 Without cooling, applying a voltage across a pure semiconductor to collect the charge carriers induces a greater number of electron-hole pairs than low doses of radiation. This renders pure semiconductors inefficient radiation detectors at room temperature. To overcome this problem a semiconductor diode is used with a reverse bias. A diode consists of an n-type semiconductor which contains mobile electrons joined to a p-type semiconductor containing electron holes. The effect of dopants on the crystal structure of a semiconductor is shown in figure 1.3. The free electrons and holes are present due to the presence of dopants with fewer or more valence electrons than the semiconductor material itself. If an element containing one more valence electron than the semiconductor is present, the spare valence electron can act as a free electron in the structure of the semiconductor. The presence of an element containing one fewer valance electrons than the semiconductor will create a hole into which electrons can move, the movement of an electron to fill the hole creates another hole. The hole thus acts as a mobile charge carrier in the semiconductor. Figure 1.3: Doped silicon semiconductor structures illustrating free electrons (n-type) and electron holes (p-type). The potassium atom (P) contains an unpaired valence electron, and the boron atom (B) requires an extra electron to form bonds to all the surrounding silicon (Si) atoms.
18 1 Introduction 7 Figure 1.4: Diode with no applied voltage With no voltage applied to the diode the mobile charge carriers are distributed through the diode (figure 1.4). When a reverse bias is applied the mobile charge carriers move to the edge of the diode, leaving a region at the junction of the two semiconductors free of charge carriers; the depleted region (figure 1.5a). When exposed to ionising radiation, electron-hole pairs form in the depleted region (figure 1.5b). Moved by the applied voltage, the charge carriers generate a small current which can be amplified and measured (figure 1.5c).
19 1 Introduction 8 (a) Diode with reverse bias creating the depleted region (b) An incident gamma photon creating a charge pair (c) Movement of the charge pair generating a small current. Figure 1.5: A reverse bias diode acting as a radiation detector A diode detector acts as an ion chamber. The current generated is proportional to the energy deposited by the radiation, which is proportional to the dose to tissue (Bushberg, 2012). As the signal is electrical it can be used by computing circuits as the input to calculations, the results of these calculations of radiation dose can be
20 1 Introduction 9 recorded, and displayed to the user in real time. As active personal dosimeters can give instant feedback on the dose and/or dose rate, they have primarily been used for operational radiation protection monitoring (Ginjaume et al., 2007). In particular they are used where there is the potential for high dose rates, necessitating immediate feedback to minimise exposure. Their use is mandated for some occupations in Western Australia (Radiological Council of WA, 2010), including radiochemists working with large activities of PET isotopes. There have been a number of papers published comparing the performance of many of the available APDs. The IAEA established a methodology for comparing the performance of APDs over a range of x-ray, gamma and beta energies, and compared 13 different dosimeters (International Atomic Energy Association, 2007). Dosimeters from Artomex, Canberra, Graetz Strahlungsmesstechnik, Polimaster, SAIC, Synodys Group (MGP and Rodos), Thermo Electron and Unfors were tested. All but one of the tested monitors reported H p10 (the personal dose equivalent to tissue at a depth of 10mm, usually referred to as deep dose), but 3 (Atomex AT3509B, MGP DMC2000XB and the Thermo Electron EPD Mk2.3) also report H p0.07 (the personal dose equivalent to tissue at a depth of 0.7mm; the surface or skin dose). The Unfors NED is an extremity monitor used for monitoring the dose to fingers or eyes, and only reports H p0.07. The monitors were tested using a range of different radiation sources facing the radiation source, and at 30 and 60 degrees from the source direction to assess that response is acceptably independent of direction. The IAEA report concluded that the performance of the active dosimeters was generally comparable to that of passive dosimeters when measuring gamma radiation, but only a few accurately reported beta and low energy x-ray radiation doses. Many of the dosimeters were incapable of measuring pulsed x-ray doses accurately; this failure has also been reported in other publications (Ambrosi et al., 2010; Ankerhold et al., 2009; Bordy et al., 2008; Clairand et al., 2008). Pulsed x-rays are used extensively in fluoroscopic procedures in hospitals, and so the selection of an appropriate model of dosimeter is critical in this setting. It is clear from the literature that the choice of active dosimeter should be carefully considered to ensure that it is suitable for dosimetry in all the radiation fields to which it may be exposed. There are however some dosimeters that perform well across the board, and could be used in a wide range of occupations, the MPG2000XB being one such dosimeter (International Atomic Energy Association, 2007). All of the active dosimeters used in this thesis are MGP2000 or MGP3000 (the successor to the MGP2000) models.
21 1 Introduction 10 There have been some papers reporting direct comparison of active and passive dosimeters in specific workplaces. In nuclear power production Singh et al. (2013) found good agreement between Saphydose APDs and TLDs when comparing results during both normal reactor operation, and during refuelling outages. In the same paper Singh also outlined controlled experiments which showed good agreement in results from APDs and TLDs when exposed to known doses from a Cs-137 source. Other experiments comparing multiple types of APD to TLDs in controlled conditions (Boziari et al., 2011) have produced less convincing results. The main conclusion of the Boziari paper was to underline the importance of choosing the correct APD for your work practices, and understanding any limitations it may have. No comparisons were found in the literature of passive and active dosimeters for workers exposed to PET isotopes or other positron emitters. Hence, there is a need to assess the suitability of using active dosimeters in this type of radiation exposure environment if we are to consider removing passive dosimeters. 1.3 The Accuracy of Personal Radiation Dosimeters Assumptions are made when using a personal dosimeter to assess the exposure of a worker. The dosimeter only occupies a small volume in space compared to the worker, and radiation fields are often inhomogeneous across the worker due to the effects of geometry, and the presence of shielding materials. It is also assumed that the dosimeter is worn whenever the worker is occupationally exposed, and not exposed when the worker is not. Passive dosimetry services rely on the dosimeter being returned on time, with the appropriate control badge, such that background radiation levels are subtracted appropriately. If this is not the case an estimate of the background dose will be subtracted introducing greater error into the results. The reader will appreciate that where large numbers of people are required to keep track of small objects over long periods of time some of those objects will become misplaced either temporarily or permanently. The loss of, and damage to dosimeters leaves gaps in the data which can generate significant error in the estimation of personal exposure, significant exposure events could be completely missed from the record. The range of results provided by different service providers for dosimeters exposed in controlled conditions has been evaluated (Böhm et al., 1994), and large differences were found between providers, and from the expected values. Due to the large errors
22 1 Introduction 11 inherent in measuring small radiation doses using small dosimeters it should be noted that results for personal dosimetry are more indicative of personal radiation exposure than they are an accurate measure of it. 1.4 Active Dosimeters for Legal Assessment of Occupational Dose Significant improvements in radiation protection have been obtained through the use of active personal dosimeters (Bolognese-Milsztajn et al., 2004). Their ability to give instant feedback allows for radiation workers to adjust their technique while working, and also give dose information for post work assessments and incident investigations immediately. There have been a number of suggestions that active dosimeters will replace passive dosimeters as the legally accepted means of measuring and recording occupational exposure (Ortega et al., 2001; Luszik-Bhadra et al., 2007). The argument in favour of APDs is that occupational doses will be reduced through the effect of instant feedback. With such feedback, workers are more aware of the dose rates they are exposed to and can adjust their work practices to avoid their highest levels of exposure. Lower levels of exposure can be reported when using electronic monitors, as they have a much lower minimum detectable level. An active monitor will display a dose of a single micro-sievert where passive dosimeters can only report doses above 10, 50 or 100μSv depending on the type. In the event of malfunction or damage to the active dosimeter, the loss of dose information is reduced, as the dosimeter can be readily replaced soon after the event. In comparison, a problem with a passive monitor may not be detected until it is sent for reading at the end of the wear period. Despite the advantages given, and significant improvements in performance in the recent past, very few jurisdictions use active dosimeters for legal assessment of occupational dose (Ginjaume, 2011). The main arguments given against replacing passive dosimeters are that passive dosimeter s have a long pedigree of reliable use; have proven reliability in a wide range of radiation fields, are compact in size and light weight, and are low cost (Ortega et al., 2001; Luszik-Bhadra et al., 2007). Before the current working practice can be changed, regulatory bodies must be convinced that active dosimeters are capable of providing a reliable record of worker exposure, and any legal hurdles involving the nature of personal dosimetry services must be overcome.
23 1 Introduction PET Radiopharmaceutical Production At Sir Charles Gairdner Hospital, PET radiopharmaceutical production occurs in the Radiopharmaceutical Production and Development (RAPID) Laboratories. PET radiopharmaceuticals have two parts, the positron emitting radioisotope which can be detected by the PET scanner, and the molecule to which it is attached. The molecule is chosen as it has a particular behaviour in the body of the patient, which enables a biological function to be detected or evaluated (Ametamey et al., 2008). Production of radiopharmaceuticals has two main parts, the production of the required radioisotope, and the incorporation of the isotope into the pharmaceutical molecule by a series of chemical reactions. PET isotopes are produced by proton bombardment of a suitable target material in a cyclotron. A cyclotron accelerates hydrogen ions using a powerful oscillating magnetic field to produce a high energy (10-20 MeV) beam of protons. The beam is incident upon a target containing atoms which absorb the protons and undergo radioactive decay to form the desired positron emitting isotope. The most widely used PET isotope is Fluorine-18 ( 18 F) which is produced by proton bombardment of water enriched with Oxygen-18 ( 18 O) as shown in equation O p 18 9 F n + ν (1.1) A number of other reactions can be used to produce 18 F using different target materials and particle beams. The 18 O p,n reaction has proven the most cost effective despite the expense of the target material, due to the relatively low beam energy required, and the large yields that can be obtained (>100GBq) (Bailey et al., 2015). In addition to the desired radionuclide, other isotopes can be produced. Protons in the beam can be absorbed by atoms other than the target atoms and be transmuted to radioactive species. Also components within the cyclotron can absorb the neutrons produced in the p,n reaction shown in equation 1.1 and become radioactive. All of the produced radioisotopes can potentially pose a radiation risk to staff working with the cyclotron. Once enough of the desired radioisotope has been produced, the target material is transported to hot-cells, where the desired isotope is separated from other target materials. In the case of 18 F production, the water target is pumped through shielded tubing from the cyclotron bunker into the hot-cell. For the production of routine PET radiopharmaceuticals the chemical separation from the target material and incorporation into the final molecule is a semi-automated process.
24 1 Introduction 13 In RAPID, prior to the arrival of the target material in the hot-cell, a kit containing the chemical reagents and any disposable piping, filters, reaction chambers and vessels are attached to a production system and checked by a radiochemist. The production system transfers the target material, and the intermediate and final products, through the various reaction chambers for appropriate amounts of time and may provide heating to speed up chemical reactions where required (see figure 1.6). The final product is a small volume (~10ml) of very high specific activity 18 Fluorodioxyglucose ( 18 FDG) in aqueous solution (IBA Molecular, 2010). The final product is transferred to an automated dispensing unit in a separate hot-cell, which splits and dilutes the product into multiple doses for delivery to customers, and for quality assurance testing. The automated process is monitored by the radiochemist to ensure that all the steps of production are progressing correctly. The radiochemist is responsible for ensuring the final activities dispensed are suitable for the customers needs, and for performing the required quality assurance processes. The radiochemist then removes the shielded product from the hot-cell and packages it for distribution to the PET centres. A separate sample may be dispensed for individual doses which must be drawn up by hand. Drawing up doses by hand from a large activity can expose the radiochemist to a significant radiation dose, particularly to the hands. Figure 1.6: Example diagram of an FDG synthesis system (IBA Synthera)
25 1 Introduction PET Radiopharmaceutical Dispensing and Use Once dispatched to the PET centre, the large bolus of 18 FDG is transferred to and loaded into an automated dose dispenser by a nurse or technologist. The dose dispenser measures the activity of the bolus, which is compared to the expected activity supplied by the RAPID radiochemist. The dose dispenser can then deliver individual patient doses via intra-venous lines inserted by nursing staff. Through use of the automated dose dispenser, staff can be some distance from the line delivering the patient doses and protected by shielding material from the patient while they are at their most radioactive. Other radiopharmaceuticals may be delivered as single doses, in shielded syringes, which are hand injected into the patients. Due to the need for handling of the dose, exposure of the staff is higher for hand doses. 18 FDG follows the same metabolic path as glucose, accumulating in cells with higher metabolic function, such as cancer cells. Concentrations of 18 FDG are detected during the PET scan and can be used to diagnose and track cancer and other diseases. In order to allow time for bio-distribution and to prevent accumulation in muscle cells, patients rest between the injection and scanning, typically between 45 and 60 minutes. Immediately after injection the dose rate from the patient is of the order of 0.092μSv/h/MBq at 1m (Madsen et al., 2006), this means a typical dose rate of around 23μSv/h at 1m. To minimise radiation exposure to staff and other patients, the PET patients rest in shielded bays monitored by CCTV. At the end of the rest period they are escorted to the scanner, positioned and scanned. Scan times vary depending on the volume of the patient being scanned. The scan rooms are shielded to reduce dose to the technologists operating the scanner and people in surrounding rooms, including those above and below the scan room. Due to the penetrating nature of positron annihilation photons there is no monitoring window between the control and scan rooms and patients are monitored on the scanner by use of CCTV. Technologists attempt to minimise contact time with the patients, but it is often unavoidable, particularly with patients with reduced mobility. 1.7 PET Centre workers Hospital workers are one of the largest groups of occupationally exposed workers to ionising radiation (Covens et al., 2007), and medical applications account for the largest collective dose to radiation workers of any industry (Holmberg et al., 2010). Positron Emission Tomography (PET) relies on the production of pairs of photons from positron annihilation. Positrons are emitted in the radioactive decay of an
26 1 Introduction 15 isotope and rapidly annihilate on contact with an electron in the environment. Each of the photons produced has at least the energy of half the rest mass of the positronelectron pair, i.e. 511keV. Positron emitting isotopes may also have alternate decay modes producing high energy gammas, for example 18 F decays 3% of the time by electron capture producing a 1.66 MeV gamma (Delacroix et al., 2002). Due to the high energy, and therefore high penetrating power of annihilation and other photons, the dose minimisation precautions required to protect staff working with PET isotopes present a special challenge (Madsen et al., 2006), greatly increasing the requirements for shielding materials compared with other medical imaging modalities. The RAPID group, consisting of radiochemists and cyclotron engineers are required to use active personal dosimeters in Western Australia (Radiological Council of WA, 2010). The cyclotron engineers are responsible for the maintenance of the cyclotron, the associated radioactive material transport systems and the hot-cells and synthesis equipment used in the production of radiopharmaceuticals. They are often exposed to the radioactive products produced by the cyclotron and synthesis process and are also exposed to neutron activated components of the cyclotron during regular maintenance, and when undertaking repairs and upgrades. The radiochemists are responsible for producing radiopharmaceuticals containing the isotopes produced by the cyclotron. Even with the automation of much of the chemistry, radiochemists are still exposed when handling and transporting the shielded doses. Radiochemists are also exposed when performing quality assurance tests which require handing of samples. Radiochemists are regularly working with tens of GBq of activity and so maintenance of good radiation hygiene is vital. Nursing staff and imaging technicians in Nuclear Medicine are not legally required to wear active dosimeters, but those who work with PET patients receive higher occupational doses than others in the same department (Covens et al., 2007). The dose rates involved are lower than in radiopharmaceutical production, but the staff can be exposed for significant periods of time when they are in close proximity to the patients. Even when not close to patients radiation shielding is not capable of reducing the dose rate to zero, and so staff are exposed to above background levels of radiation for most of the working day, adding to their cumulative exposure. RAPID workers are accustomed to wearing APDs, whereas Nuclear Medicine workers are not. This historical difference in usage offers an opportunity to gather information on attitudes to the use of active dosimeters from the two groups to investigate if familiarity affects their opinions. As both groups are routinely exposed to doses measurable by passive personal dosimeters, they are an ideal population for
27 1 Introduction 16 a comparison study of the two dose measurement methods (passive and active) in real workplace environments. 1.8 Aims It is the intent of this thesis to explore whether the type of logging active personal dosimetry system, currently used by the staff working in PET radiopharmaceutical production at Sir Charles Gairdner Hospital, would be suitable as a legal dosimeter, in place of the currently used passive dosimeters, for workers exposed to PET radiopharmaceuticals and patients. There are several criteria that would need to be met for the active dosimeters to be suitable. They must be shown to have adequate detection capabilities for the radiation emitted by PET radiopharmaceuticals, either as good as, or better than the passive dosimeters currently used. They must be shown to be as reliable, or more reliable than passive dosimeters. These two factors will be examined in controlled exposure experiments. Dosimeters of different types will be exposed to known quantities of 18 FDG, and their results compared. The doses reported by passive and active dosimeters worn by staff in RAPID and the PET centre will also be compared. Active dosimeters must also be accepted by the staff working with PET radiopharmaceuticals, and preferably offer benefit to and be appreciated by the staff. This will be assessed by obtaining feedback from the staff in the form of a questionnaire after a period of using both types of dosimeter. Economic factors must be considered. If active dosimeters are to replace passive dosimeters in areas where the use of active dosimeters is not mandated they must be cost competitive with the use of passive dosimeters. The final consideration is legal. Dosimeters must be approved for use by the regulatory body of the state in which they are used. At present the active dosimetry system under consideration in this thesis is not approved. The legal hurdles facing approval of this types of dosimetry system will be explored.
28 Chapter 2 Experimental Methods & Materials This chapter outlines the materials and methods used to compare the performance of the active and passive dosimeters. A series of controlled experiments were performed to directly compare the results from passive and active dosimeters when exposed to a known quantity of 18 FDG. The methods used to compare the results from the passive and active dosimeters worn by staff working with PET radioisotopes are also discussed. The section ends with a discussion of the method used to obtain feedback from staff regarding the use of passive and active dosimeters. 2.1 Radiation Source All of the radiation sources used in the controlled experiments consisted of a 5ml glass vial containing less than 1ml of 18 FDG in aqueous solution. The activity of the source at a specific point in time, close to the start of each experiment, was obtained using a calibrated well counter. The activity of the sources used are given in tables 2.3 and 2.4. The half-life of 18 F is 1.83 hours and the gamma constant for a glass vial at 1m is 0.158μSvMBq -1 (Delacroix et al., 2002). The gamma constant is a value derived from computer models of a given isotope in a particular geometry. The constant gives the dose rate per MBq at 1m. Other references (Madsen et al., 2006)quote different values for the gamma constant. The value from Delacroix et al. (2002) was chosen as it is based on the same geometry (a small glass vial) used in the controlled experiments. 17
29 2 Experimental Methods & Materials Passive Dosimeters In the controlled experiments two types of passive dosimeter are used, TLD badges (described in section 2.2.1) and OSL badges (described in section 2.2.2). The dosimeters are held vertically in a dosimeter holder clipped to a thin piece of ABS (a common thermoplastic) slotted into holders on a track. The track and the layout of the controlled experiment are described in section Dosimeters used in the experiments were returned directly after exposure along with an unexposed control badge used to remove the contribution from background radiation. All PET and RAPID workers wore TLDs (described in section 2.2.1) during the study. Workers are required to wear the dosimeters on their torso whenever working in an area where they may be exposed to ionising radiation. They are usually worn clipped at waist or chest height. TLDs are supplied in batches for use over a one month wear period (for RAPID and PET Centre staff) and then returned to the supplier for reading. Both of the passive dosimeter types used are approved as legal personal dosimeters in Western Australia, and are in use at Sir Charles Gairdner Hospital. They have been compared to assess the degree of agreement that could be expected between approved dosimeter types. Because of time and financial constraints it was not possible to compare all of the approved passive dosimeters with each other. These two dosimeter types were chosen as they are readily available, in use in the hospital where the experiments were undertaken, and utilise two different scintillant materials and reading methodologies TLD The Pansonic UD-802 TLD dosimeters used in the experiments are supplied by Global Medical Solutions (GMS) in Sydney and analysed by the Radiation Detection Company in the U.S.. The TLD itself is sealed in a plastic case with a small thin window which allows the passage of less penetrating radiation, enabling differentiation between shallow (H p0.07 ) and deep (H p10 ) dose (see figure 2.1a). There are four lithium borate chips in the dosimeter (figure 2.1b) with different amounts of filtration to improve photon energy discrimiation and tissue dose estimation (Radiation Detection Company, 2015).


 External image of OSL show-(bing thin window left of centre and the Al 2 O 3 :C Internals of OSL showing filters, hole and grid in the")
30 2 Experimental Methods & Materials 19 (a) External image of TLD showing thin window in upper right (b) Central component of dosimeter showing 4 TLD chips Figure 2.1: Radiation Detection Company TLD A copy of a typical GMS dose report can be seen in Appendix B. The suppliers claim their TLD badges have a reported minimum detection limit of 50μSv. If the dose recorded by the dosimeter less the control badge dose is less than this limit the result on the dose report shows as ND OSL The OSL dosimeters used in the experiments are manufactured and analysed by Landauer. The crystal itself is sealed in a plastic case with a small thin window which allows the passage of less penetrating radiation, enabling differentiation between shallow (H p0.07 ) and deep (H p10 ) dose (figure 2.2a). The casing holds the integrated filtration and a thin strip of Al 2 O 3 :C (figure 2.2b). A copy of a typical Landauer (a) External image of OSL show-(bing thin window left of centre and the Al 2 O 3 :C Internals of OSL showing filters, hole and grid in the casing, dosimeter Figure 2.2: Landauer OSL dose report can be seen in Appendix B. The suppliers claim their OSL badges have a reported minimum detection limit of 10μSv. If the dose recorded by the dosimeter minus the control badge dose is lower than this limit, the result on the dose report shows as M.

31 2 Experimental Methods & Materials 20 Figure 2.3: Active dosimeters DMC2000S, DMC2000X, DMC2000XB and DMC Active Dosimetry System DMC 2000 and DMC 3000 The active dosimeters used by staff and in the controlled experiments were DMC 2000 and DMC 3000 personal dosimeters, manufactured and supplied by MGP Instruments. Four models of dosimeter were used in the controlled experiments (see table 2.1 for descriptions) as they are used interchangeably by staff in RAPID. Staff in Nuclear Medicine prefer the 2000 models as they are physically smaller. In the controlled experiments the dosimeters were selected at random depending on availability, reflecting the way they are used by staff. All four models were used. This decision was validated by the small variability in results between active dosimeters, shown in figure 3.1 and table 3.6. When in use a small screen displays the dose accumulated since log in and the dosimeter chirps when radiation is detected. The rate of the chirps provides feedback to the user on the dose rate they are currently exposed to.
32 2 Experimental Methods & Materials 21 Model DMC 2000 S DMC 2000 X DMC 2000 XB DMC 3000 Measures dose from Gamma only Gamma & x-rays Gamma, x-rays & betas Gamma only (new model) Table 2.1: Active Dosimeter Models Used The X and XB models of the MGP contain a thin window to allow calculation of shallow (H p0.07 ) as well as deep (H p10 ) dose. In PET the radiation risk comes from penetrating gammas rather than low energy x-rays or betas, so only the deep (H p10 ) dose is of concern. The dose measurements compared in this study are the deep (H p10 ) doses from the active and passive dosimeters, all of the models of APD measure deep dose, so they can all be used. Different dosimeters were used in each controlled experiment as this reflects the way the dosimeters are used by staff. The IDs of dosimeters used in the controlled experiments were recorded so that any differences in results between the active dosimeters could be investigated if any were found Logging Station & Database A dosimeter logging station allows radiation workers to assign a dosimeter to themselves before beginning their shift, and log the dosimeter out at the end. At log out the logging station receives the dose information, displays it to the worker, and transmits the data to a database for storage. The stations consist of networked touch screen PCs running the LDM MGR software with a USB dongle or cradle which enables wireless communication with the MGP dosimeters. At the start of their shift workers place the dosimeter in the cradle, and enter their unique identifier code on the touchscreen. The logging station assigns the dosimeter to that worker, setting the appropriate dose and dose rate alarm levels. The alarm levels are chosen such that they will not alarm during routine procedures, only in the event of an unexpectedly high dose or dose rate. As different dose rates are experienced by different occupations the levels are assigned by occupation.

33 2 Experimental Methods & Materials 22 Figure 2.4: Logging Station with dosimeter in cradle Dose (μsv) Dose Rate (msv/h) Visitor Nurse/Technologist Radiochemist Engineer Table 2.2: Alarm Settings on Active Dosimeters At the end of their shift the worker returns the dosimeter to the cradle, and the dose data is read from the dosimeter and saved to the database. The total dose and maximum dose rate per day for the last few days logged in are displayed on the screen, allowing the worker to quickly review their dose, and check for unusual readings. The logging stations read and write data from a relational database running on a networked PC. This PC also runs the Dosicare software which is used as a front end to the database. The Dosicare software can be used to add new users, create or modify user group profiles (with associated dose and dose rate alarm levels), and generate dose reports.

34 2 Experimental Methods & Materials 23 Figure 2.5: Logging Station showing dose results at log out Software The MGP active dosimetery system requires a number of software components to function. LGM MGR is run on the logging stations, it handles logging dosimeters in and out of the system. Dosicare is used to modify user and dosimeter information in the database and to configure and produce reports. It can also be configured to send alerts if recorded doses exceed threshold values. All of the MGP software communicates with a Microsoft SQL Server Express installation which holds the database of user, dosimeter, and dose information.
35 2 Experimental Methods & Materials Controlled performance comparison of passive and active dosimeters In order to judge the suitability of active dosimeters as a legal dosimeter in PET applications, one of the first considerations is their ability to accurately record radiation dose when exposed to radiation from a PET isotope. There are a number of different providers of passive dosimeters that are approved for use in Western Australia (Radiological Council of WA, 2010). The methods below explain how a comparison was made between the results from active dosimeters and two types of approved passive dosimeters. It is reasoned that if the difference in results between the active and passive dosimeters is less than, or similar to, the difference between the results from the two types of passive dosimeters, then the active dosimeters can be said to be equivalent in terms of accuracy of measurement. The dosimeters used were chosen because the passive dosimeters are both approved for use as legal personal dosimeters in Western Australia; the active dosimetry system has been in use for a number of years in the hospital and is capable of automatically producing a record of each individual s exposure. A controlled experiment was undertaken in order to remove the variations which occur from person to person and day to day and concentrate simply on the ability of the dosimeters to measure radiation doses from a PET radiopharmaceutical across the range of doses typically received by radiation workers in PET radiopharmaceutical production and use. The controlled experiments consisted of a number of planned simultaneous exposures of dosimeters to the radiation from a vial containing 18 FDG the most commonly used PET radiopharmaceutical Radiation Safety The experiments require the use of an unshielded source of penetrating ionising radiation (511keV gammas). It is essential to ensure that the experiment is conducted in a controlled area and that dose rates in any surrounding uncontrolled areas do not pose a risk to anyone. The controlled area has restricted access with signage and a physical barrier at the single access point during the period of the exposure. Dose rate measurements were taken in accessible areas around the controlled area to ensure that dose rates were below 25μSv/h. All areas surrounding the controlled area were low occupancy areas (corridors and stairwells). The limited number of exposures carried out also reduced the risk of cumulative doses to staff from the experiments.
. 2.4.")
36 2 Experimental Methods & Materials 25 Lead shielding was placed such that the source could be approached from the entrance to the controlled area with minimal exposure to the experimenter (Figure 2.6) Physical layout of experiment At least three of all three types of dosimeter were arranged simultaneously at a fixed distance of 1m from the vial of FDG in an arc by means of positioning them on stands on a circular rail (Figure 2.6) for each exposure. The circular nature of the apparatus and the central source ensures that the dose to each dosimeter was equal including the possible effect of scatter from the floor. Figure 2.6: Passive dosimeters arranged on 1m radius rail The different types of dosimeter (figure 2.7) were placed alternately around the arc of the rail. The spread of each dosimeter type around the rig removes any possibility of systematic bias between dosimeter types caused by geometry.
.")

. In each experiment at least three dosimeters of each type were irradiated simultaneously.")
37 2 Experimental Methods & Materials 26 Figure 2.7: Personal dosimeters on holders. From left to right: an OSL passive dosimeter, an active MGP DMC2000X dosimeter and a TLD passive dosimeter. The dosimeter holders contain slots which allowed them to be positioned on the rail, and to hold the dosimeters parallel with the rail or at and angle of 30 or 60 from the rail (figure 2.8). These slots allowed for accurate positioning of the dosimeters when comparing the effect of angling the dosimeters relative to the source of radiation. In a real world application, a source will not always be perpendicular to a detector, so a dosimeter should still give a reasonable measurement when angled away from the source. 30 and 60 were chosen to match the methodology used by the IAEA when comparing multiple types of active dosimeter, including one of the models of MGP dosimeter used here (International Atomic Energy Association, 2007). In each experiment at least three dosimeters of each type were irradiated simultaneously. All of the dosimeters in each experiment were at either 0, 30 or 60 degrees from perpendicular to the radiation source. All dosimeters irradiated simultaneously were at the same angle to the source. Simultaneous irradiation at the same distance from the same source allows for direct comparison of the results from the dosimeters in each experiment. The methodology for comparing between exposures is explained in section

38 2 Experimental Methods & Materials 27 Figure 2.8: Dosimeter holders on the rail at 0, 30 and 60 degrees As the active dosimeters contain metal components it was thought that there may be a small amount of scatter from the active dosimeters. To remove the possibility of scatter affecting adjacent dosimeters the dosimeters were placed alternately by type on the holders with a minimum of 10cm space between each one. A minimum of three of each type of dosimeter were placed on holders around the ring to negate any unknown geometric effect when comparing between dosimeter types. An example layout showing dosimeter placement is shown in figure 2.9.

39 2 Experimental Methods & Materials 28 Figure 2.9: Example plan layout of experimental setup Figure not to scale To ensure that there was no geometric bias between the positions around the rig the mean of the reported dose at positions A, B and C in each exposure for each dosimeter type was calculated. The percentage difference from these means for each dosimeter type was calculated for each usable result. The average of these percentage differences for positions A, B and C were then calculated across all dosimeter types. The results are shown in table Conducting an Exposure With the dosimeters in place, a shielded vial containing a known activity of 18 FDG was placed in the centre of the apparatus and the shielding removed. The activity
40 2 Experimental Methods & Materials 29 and exposure time can be chosen to deliver a given exposure to the dosimeters using D T = T1 /2ΓA 0 ln2 ( 1 e ln2 T T 1 /2 ) (2.1) Where D T is the predicted effective dose to the dosimeter, T1/2 is the half-life of the isotope, Γ is the gamma constant for the isotope, A 0 is the activity of the source at the start of the exposure and T is the length of the exposure. This equation accounts for the decay of the isotope during the exposure which is significant for PET isotopes as they typically have short half-lives. The values for T1/2 and Γ for the sources used were given in section Exposures Performed Personal dosimeters must be shown to work accurately over the range of exposure levels and dose rates experienced by staff, thus a series of exposures were carried out with different activities of 18 FDG. In order to investigate the angular dependence of the dosimeters exposures were repeated with the dosimeters rotated through 30 and 60 degrees following the methodology of the IAEA (International Atomic Energy Association 2007). Initial results showed no change in dose rate related to position around the experimental setup. This meant that there was no need to repeat exposures with varied positions around the rail. Tables 2.3 and 2.4 show the exposures performed on dosimeters giving an estimation of the dose to the dosimeters based on equation 2.1. The low doses were intended to investigate the claimed minimum detectable level for the passive dosimeters, in addition to comparing their results with the active dosimeters. The largest doses were delivered using three separate exposures of the same passive dosimeters in order to keep the dose rate outside the controlled area to a reasonable level. A larger number of active dosimeters were used when they were available to increase the number of points of comparison produced by each exposure. Some of the OSL dosimeters returned lower than expected results requiring a repeat of some of the exposures.
41 2 Experimental Methods & Materials 30 Initial Source Exposure Degrees Calculated Number of Experiment Activity Duration from Dose Dosimeters (MBq) (hours) perpendicular (μsv) OSLs TLDs MGPs a b c Table 2.3: Exposures performed in initial controlled experiments Initial Source Exposure Degrees Calculated Number of Experiment Activity Duration from Dose Dosimeters (MBq) (hours) perpendicular (μsv) OSLs TLDs MGPs 11a b c Table 2.4: Exposures performed in repeated controlled experiments Obtaining Results In the controlled experiments dosimeters were logged in using guest log-in codes and the doses recorded manually at log out for each dosimeter after each experiment. The passive badges were returned to the companies that supplied them within a few days of exposure to be read and reported on. Dose reports were returned within a few months and the results compared to those from the active monitors. The result from each dosimeter was compared to the results from each of an alternate dosimeter type from the same exposure. Each comparison provides a point on the Bland- Altman plots shown in the Results section, starting on page 37. It was expected that the results from the same dosimeter type in each experiment would be similar. Comparisons of results from the same dosimeter type in each experiment were made using the same methodology as the inter-type comparisons. The result from each dosimeter was compared to the results from the others in the same experiment. Each result compared had the dosimeter exposed to the same source, for the same amount
42 2 Experimental Methods & Materials 31 of time, at the same angle to the source; the only difference being their location around the experimental rail. Any significant differences between results from the same dosimeter type would reveal problems either with the dosimeters themselves, or with the experimental set up. The results from the intra-type comparisons can be seen in section There were some failures of passive dosimeters, these failures are discussed in chapter 3. Some results were excluded from comparison as they were obviously in error and would skew the results. Dosimeters which reported the dose as below the detectable limit when the other results for the same exposure were greater than 20% over the reported detection limit were excluded. The number and type of excluded dosimeter results are recorded in table 3.2 on page Normalising results from separate exposures It was not possible to expose multiple dosimeters of each type at all three angular positions simultaneously. As shown in table 2.3, the experiments with the dosimeters 0, 30 and 60 from perpendicular to the source were separate. Each experiment involved different activities of 18 FDG and different lengths of time and thus the measurements from the separate experiments cannot be directly compared. The theoretical dose to the dosimeters (see equation 2.1) takes into account the activity and exposure time for each experiment. The theoretical dose can therefore be used to normalise the results for comparison of results from separate experiments. The scaled result from the 30 experiment (D s30 ) is calculated from the actual result from the 30 experiment (D 30 ) scaled by the ratio of the theoretical dose in the 0 experiment to the theoretical dose in the angled experiment D T 0 D T 30. D s30 = D 30 D T 0 D T 30 (2.2) The results of equation 2.2 can now be compared to the results from the 0 experiment in a Bland-Altman plot. Plots have been generated comparing the results at 0 with 30 and 0 with 60 for each dosimeter type. The results can be seen in section Displaying Results The majority of results in Chapter 3 are displayed as plots. One type of plot shows a direct comparison of results from two dosimeter types, with the dose result from each dosimeter type forming the axes of the plot. The direct comparison plots include a least-squares fit to the data. Bland-Altman plots are also used extensively.
43 2 Experimental Methods & Materials 32 The direct comparison plots have the reported dose from one dosimeter type on the x axis, and the results from the other on the y axis. If the two sets of results agreed perfectly the least squares linear fit to the points on the graph would be the line of x = y with a correlation coefficient (r 2 ) of one. The further the linear fit is from x = y, and the lower the correlation coefficient, the worse the agreement is between the dosimeter types. Bland-Altman plots are used to analyse the agreement between two different measurement methods of the same variable (Bland and Altman, 1999). Each point in a plot is a comparison between two measurement methods of the same variable, in the case of these experiments, radiation dose. The point s position along the x axis is the average of the results of the two measurements, and the position on the y axis is the difference between the results. If the two measurement methods were perfectly correlated, all the points would lie along the line of y=0. A constant systematic bias can be seen as a shifting of the points up or down away from y=0. If the points in a Bland-Altman plot slope away from the x-axis, this indicates a need for a multiplicative correction factor to correlate the results. In the controlled experiments multiple dosimeters of each type were used. As they were all exposed to the same radiation they can all be said to be making the same measurement. This provides multiple points of comparison for each result and therefore multiple points in each Bland-Altman plot. As an example, a single exposure of 3 dosimeters of type A, 3 dosimeters of type B, and 3 dosimeters of type C (as shown in figure 2.9), produce 27 comparison points (A 1 -B 1,A 1 -B 2,A 1 -B 3,A 2 -B 1,A 2 -B 2,A 2 - B 3,A 3 -B 1,A 3 -B 2,A 3 -B 3, A 1 -C 1,A 1 -C 2,A 1 -C 3,A 2 -C 1,A 2 -C 2,A 2 -C 3,A 3 -C 1,A 3 -C 2,A 3 -C 3, B 1 -C 1,B 1 -C 2,B 1 -C 3,B 2 -C 1,B 2 -C 2,B 2 -C 3,B 3 -C 1,B 3 -C 2,B 3 -C 3 ) which would be shown as 9 points in each of three plots, one comparing A to B, one comparing A to C, and one comparing B to C. The equivalence of positions 1 to 3 were evaluated by calculating the difference between the mean result for all three positions with the result from each position for each dosimeter type. The Bland-Altman plots in Chapter 3 include lines showing the mean difference between the results, which demonstrates any systematic bias between the measurement methods. An indication of the spread of results is shown by the ±1.96σ (95% confidence interval) lines. In addition to the detailed comparison plots, tables summarising the results and plots displaying the aggregated data can be found in section
44 2 Experimental Methods & Materials Statistical Assessment of Difference of Means For each pair of dosimeter types (active-tld, active-osl and TLD-OSL) a test of the difference of the means was performed. The results of experiments at similar exposure levels were grouped by normalising the results from the 30 and 60 to the perpendicular results as per section The mean and standard deviation of each set of results was calculated, and from these the standard error of the difference of the means and the degrees of freedom. As the standard deviations for each set of results were not similar, equations 2.3 and 2.4 were used. Standard Error: Degrees of freedom: SE[ X A X s 2 B ] = A + s2 B (2.3) n A n B df = [ [ s2 A na + s2 B nb ] 2 s 4 A + n 2 A (n A 1) s 4 B ] (2.4) n 2 B (n B 1) The test statistic T was calculated using equation 2.5 and compared to the t distribution to judge agreement between the means. T = ( X A X B ) SE[ X A X B ] (2.5) The results of the tests are shown in section
45 2 Experimental Methods & Materials Comparison of staff doses recorded by passive and active dosimeters Gathering RAPID Staff doses Radiochemists and Engineers working in radiopharmaceutical production and development (RAPID) at Sir Charles Gairdner Hospital have been wearing both passive and active dosimeters since the inception of the service in In 2012 a logging system was introduced which allowed automatic recording of the results from the active dosimeters to a central SQL database. It is a requirement of the Radiological Council that all staff and visitors entering the RAPID area must wear an active dosimeter. All staff are also legally required to wear an approved passive dosimeter whenever they are working with radioactive material, or are in an area where they may be occupationally exposed to ionising radiation. As the staff are wearing both dosimeters at all times, a comparison of the total monthly whole body exposure measurements from the two dosimeter types was performed. Staff doses from the active dosimetry system were extracted from the SQL database with a query which summed doses over a month for each worker. The monthly doses were copied into a spreadsheet for comparison with the doses reported by the passive monitors. The number of staff has varied from year to year, and not all staff have worked in RAPID every month in a year (table 2.5). Type of Worker Number of staff (and months of data) in RAPID Radiochemist 5 (53) 5 (59) 5 (59) Engineer 3 (36) 3 (35) 3(36) Research Chemist 3 (29) 5 (48) 3 (34) Total 10 (118) 13 (142) 11 (129) Table 2.5: RAPID Staff Numbers Gathering PET Centre Staff doses The PET Centre staff did not routinely use active dosimeters prior to commencement of this project. The PET Centre is within the Nuclear Medicine department, and the majority of nursing and medical imaging staff who have days working with PET patients also work some days in Nuclear Medicine. These staff will receive some exposure from non-pet patients. Due to a limited budget, there were not enough
46 2 Experimental Methods & Materials 35 dosimeters to track all the staff who work with PET patients while they work in PET and other areas of the Nuclear Medicine department. It was originally thought that the doses from PET patients would constitute the majority of the exposure such that the results from the passive badges, and the active badges should show correlation even if the active dosimeters were only worn by the staff on the days they were working in PET. It was thought that including a larger number of staff (table 2.6) would make for more useful data. Profession Number of staff Nurse 11 Technologist 5 Table 2.6: Numbers of staff wearing active dosimeters when working in PET only (Nov 2012 to December 2013) The correlation of active and passive dosimetry results from 2013 proved to be very poor (see figure 3.18) with the passive dosimeters consistently reporting higher doses. In 2014 specific staff members were asked to wear the active dosimeters in PET and Nuclear Medicine such that they were always wearing passive and active radiation monitors when working. The staff chosen were the ones who had received the highest doses recorded by their passive dosimeters in Seven active dosimeters were reserved for use by these workers (table 2.7). Other staff could use any unused active dosimeters when they were available. Profession Number of staff Nurse 5 Technologist 2 Table 2.7: Numbers of staff wearing active dosimeters while working with PET and Nuclear Medicine patients (January to December 2014) The doses recorded by the active dosimeters were extracted from the database and compared with the results from the passive monitors, in the same manner as the results from the RAPID staff Comparison of doses As with the controlled experiments, the results from the passive and active dosimeters were compared using least-squares fits to a linear relationship, and Bland-Altman plots. Each point on both types of plot show the comparison of the results from the active and passive dosimeters for a particular staff member for a single month.
47 2 Experimental Methods & Materials 36 As with the controlled experiments, if the dosimeters are equivalent the leastsquares fits should be close to y = x, and well correlated with the data. Good correlation would be demonstrated by a correlation coefficient (r 2 ) close to one. In the Bland-Alman plots the x axis position of each point shows the average of the results from the two measurement methods. The y axis position shows the difference between the active and passive measurement results. For two sets of ideal measurements all the data points would lie along the line y=0. The Bland-Altman plots include horizontal lines showing the mean of the difference between the two measurement methods, and the mean plus and minus 1.96 standard deviations (the 95% confidence interval). In addition to the standard Bland-Altman plots the staff data is also compared in Bland-Altman ratio plots. In these plots the y axis value is the result from the active dosimeter divided by the passive dosimeter result. These ratio plots are useful when the data in the standard Bland-Altman plot does not follow a horizontal trend. If there is a systematic bias between two measurement methods, the mean ratio of one result to the other will show this bias, and the spread of results show how consistent this bias is. For two equivalent measurement methods the plot should have points close to y = 1 across the range of values measured. 2.6 User Experience Survey Staff in RAPID and Nuclear Medicine who have been using both types of personal radiation monitor were asked to complete a survey (Appendix A). The intent of the survey was to indicate the level of acceptance of the use of active personal dosimeters, any preferences between the two types of dosimeter, and the extent to which the staff felt that either provided a benefit to their radiation safety. The results of the survey are shown in Section 3.4.
48 Chapter 3 Results 3.1 Results below the detection limit As discussed in section all passive dosimeters have a minimum detection limit. Suppliers of passive dosimeters do not report doses below this limit, giving the result as below the detectable limit. Some of the controlled experiments exposed the dosimeters to doses close to the stated detection limit in order to investigate how the different dosimeter types performed near the limit, and how accurate the stated limits where. Minimum detection limit (μsv) TLD 50 OSL 10 Table 3.1: Reported Minimum Detection Limits for Passive dosimeters as stated by suppliers In the controlled experiments all results which came back as below the detectable limit are excluded from comparison with the other dosimeter results. In some cases the results from passive dosimeters came back as below the detectable limit when the results from the other dosimeters, and calculation of the expected dose indicated the dosimeter was exposed to a dose in excess of the stated minimum detection limit for the dosimeter type (see table 3.1). The number of results which could not be used despite an apparent exposure above the stated minimum detection limit are given in table
49 3 Results 38 Excluded Unreliable Results Unreliable results results* (as % of dosimeters of this type used) above 50μSv TLD 1 1 (3%) 1 (3%) OSL 8 11 (33%) 6 (18%) Table 3.2: Number of excluded dosimeter results in the controlled experiments *Badges reporting results below the detection limit when active dosimeter reported doses greater than the stated detection limit + 20% In the first high dose experiment (3 exposures totalling around 1mSv) the results of the three OSLs were significantly lower than the results of the other dosimeters, and the value expected by calculation. These values were not excluded and so are not included in the first column of table 3.2, but are included in the Unreliable Results columns of the table, taking the total to 11 (6 above 50μSv). The results of this first high dose exposure can be seen in figure 3.9. The high dose experiment (10 in table 2.3) was repeated, and the results of the OSLs from the repeat experiment (11 in table 2.4) were used for all comparisons shown after figure The active dosimeter and TLD results from experiment 10 are still included in comparisons. Table 3.2 does include three OSLs, used in experiment 9, which reported below the detectable limit when the active dosimeters and TLDs gave results of the order of 300μSv. The one TLD in table 3.2 reported below the detectable limit when the other two TLDs from the same batch reported 100μSv and 130μSv from experiment 6. There were nine other TLDs that reported below the detectable limit. The expected dose for these nine dosimeters was below or around 50μSv according to the other dosimeters. These results are not included in the table as the dosimeters were not expected to report doses at that level. There is no way to compare the TLD results with those of the other dosimeters in the plots and tables of section 3.2 where the dose is close to or below the reported detection limit. In the comparison of passive and active dosimeter results for staff there is no way to know whether the active or passive result is more accurate as there is no third measurement. In the comparisons of results from staff dosimeters the results of below the detectable limit (BDL) were included as an estimate in the plots but not in the calculation of the mean difference and the standard deviation. As the stated minimum detection limit of the used TLDs is 50μSv a value of half the detection limit (25μSv) was chosen as the estimate for all results returned as below the detectable limit in the plots. To explore the effect of the BDL results, the mean difference and standard deviations were calculated setting the BDL dose values to
50 3 Results 39 0μSv, 25μSv and 50μSv and these results are tabulated beneath the comparison plots. The only months where data were excluded from the plots were those where the active dosimeters had not been logged in, and the TLD results were below the detectable limit. 3.2 Controlled performance comparison of passive and active dosimeters Comparisons of the performance of the dosimeters have been performed by producing Bland-Altman plots for pairs of dosimeter types as explained in section The sections of this chapter demonstrate the variation in results between dosimeters of the same type to show the repeatability of each dosimeter type. This is followed by a comparison of results from each dosimeter type with the theoretical dose. The effect of angulation of each dosimeter type is then explored. The inter-type comparisons start with the dose results from the two types of passive dosimeter, then the reported doses from each of the passive dosimeters are compared with the results from the active dosimeters Comparison of doses around the experimental rig The means of the differences between the results across all positions and the individual positions were less than 1.5% (table 3.3). This variation is much smaller than variations in results found within and between dosimeter types in the subsequent sections of this chapter. Mean difference from mean result across positions for all dosimeter types Position A Position B Position C -1.4% -0.3% 1.4% Table 3.3: Position dependence of results Comparison of results from the same dosimeter type Any repeated experiments, even with the same equipment will show a spread of results, the smaller the spread the more repeatable a measurement method is said to be. The following plots compare the results from the same dosimeter type in each experiment with each other, comparing the spread of those results with the
51 3 Results 40 spread between dosimeter types. The direct comparison plots are of no use for these comparisons as the slope of the plot would always be close to unity. As stated by Bland and Altman (1999) we would not expect a bias between measurements of the same type but the size of the standard deviation gives an indication of the repeatability of each dosimeter type. (a) Bland-Altman plot of OSL results (b) Bland-Altman plot of TLD results (c) Bland-Altman plot of MGP results Figure 3.1: Comparison plots for results from the same dosimeter type For the OSL dosimeters the mean difference is 3μSv, and the 1.96σ value is 92μSv. For the TLDs the mean difference is 9μSv, and the 1.96σ value is 109μSv, and for the active dosimeters the mean difference is 4μSv, and the 1.96σ value is 41μSv. As expected, the mean difference is very low for all three types of dosimeter. It
52 3 Results 41 is not statistically different from 0 for any of the dosimeters, according to a standard one sample t-test with a 95% confidence interval. The active dosimeters show a much smaller spread of results than the passive dosimeters, demonstrating better repeatability. The OSL results are in close agreement below 500μSv, but the large spread of results at around 1mSv has greatly increased the 1.96σ value, as shown in figure 3.1a. The results from the TLDs gradually get further apart with increasing dose, resulting in the spreading of points away from y=0 in figure 3.1b. The spread of results for the MGPs is noticeably smaller, resulting in the lower 1.96σ value. The agreements between the active dosimeters and each of the passive dosimeters are similar to the level of agreement within the passive dosimeters. These results again suggests that the active dosimeters are at least as capable of providing accurate measurements of radiation dose from 18 FDG as the passive dosimeters Comparison of dosimeter results with theoretical dose As shown in section 2.4.3; with a known activity at a fixed distance for a known period of time it is simple to calculate a theoretical estimate of the dose expected to be received by the dosimeters using the gamma constant for 18 F. This calculation is not expected to be accurate as it assumes a geometry which is only an estimate, and that no radiation scattered from other materials reach the detector. As the source and the dosimeters are close to a concrete floor there is expected to be a scatter contribution. This contribution should be uniform across the dosimeters due to the design of the experimental rig. As with the comparisons between different dosimeter types, direct comparison plots and Bland-Altman plots have been produced. The plots compare the results from the three dosimeter types to the calculated theoretical dose. The active dosimeter results show an excellent fit to a linear model (figure 3.2a) but the dosimeter results exceed the theory by 32%. The sets of points form vertical lines as all the dosimeter results are compared to the same theoretical result for each experiment. There were two experiments performed with the dosimeters perpendicular to the source at the high dose level hence the two lines of data. The Bland-Altman plot (figure 3.2b) shows the mean difference is -60μSv, and the 1.96σ value is 135μSv. The increasing difference in this plot echoes the substantial difference between the slope of the previous plot and the ideal agreement of x = y.
53 3 Results 42 (a) Direct comparison (b) Bland-Altman plot Figure 3.2: Comparison of Active dosimeter results with theoretical dose (a) Direct comparison (b) Bland-Altman plot Figure 3.3: Comparison of OSL dosimeter results with theoretical dose For the OSL dosimeters there is also a good agreement with a linear model (figure 3.3a) but an even higher difference between the reported dose and the theoretical dose (~50%). In this case the fit does not have an intercept very close to zero. The higher slope and the negative intercept suggests that the reported high dose results may be in excess of the actual dose as suggested by earlier comparisons between dosimeter types. In the Bland-Altman plot (figure 3.3b) the mean difference is
54 3 Results 43-50μSv, and the 1.96σ value is 159μSv. (a) Direct comparison (b) Bland-Altman plot Figure 3.4: Comparison of TLD results with theoretical dose For the TLD results the direct comparison plot (figure 3.4a) shows good agreement with a linear model but an underestimation of the dose by theory (or an overreporting by the TLDs) of 29%. The intercept is closer to zero than for the OSL dosimeters but not as close as for the active dosimeters. In the Bland-Altman plot (figure 3.4b) the mean difference is -85μSv, and the 1.96σ value is 172μSv. For all of the theory comparisons the measured dose was significantly higher than the theoretical dose. In all three cases the mean difference was significantly different to 0, according to a standard one sample t-test with a 95% confidence interval. In the direct comparison the slope of the results with increasing dose around 1.3 for the MGPs and TLDs, and 1.5 for the OSLs, suggests either a significant under measurement of dose at 511keV for all the dosimeters or a scatter component of the dose rate of around 30% Effects of angling the dosimeters In real life exposure situations the dosimeter is not always perfectly perpendicular to the source of radiation. It is important that personal dosimeters can accurately record dose from a range of angles. When testing dosimeters the IAEA exposes dosimeters at angles of 30 and 60 degrees from perpendicular to judge their ability to cope with angulation (International Atomic Energy Association, 2007). The
55 3 Results 44 results of a similar comparison are presented in this section for the three dosimeter types assessed. (a) Bland-Altman plot comparing 0 and 30 results (b) Bland-Altman plot comparing 0 and 60 results Figure 3.5: Plots showing the effect of angulation on MGP dosimeters For the active dosimeters at 30 the mean difference is 3μSv, and the 1.96σ value is 36μSv (figure 3.5a). At 60 the mean difference increases to 11μSv, and the 1.96σ value is 44μSv (figure 3.5b). The measured values decrease slightly with angulation. The difference between 0 and 30 degree results is not statistically significant but the difference in the mean results between 0 and 60 degrees is statistically significant according to a standard one sample t-test with a 95% tolerance interval. For the OSL dosimeters at 30 the mean difference is -31μSv, and the 1.96σ value is 56μSv (figure 3.6a). This is a larger drop and wider spread than for the active dosimeters at 30 or even 60. A batch of three OSL dosimeters failed to report a dose when measuring the doses at 60 ; this greatly reduced the data for the plot (figure 3.5b), but the mean, and in fact all the results at 60, are lower than those at 0, as expected. The difference between 0 and 30 degree and 0 and 60 degree is statistically significant according to a standard one sample t-test with a 95% tolerance interval.
56 3 Results 45 (a) Bland-Altman plot comparing 0 and 30 results (b) Bland-Altman plot comparing 0 and 60 results Figure 3.6: Plots showing the effect of angulation on OSL dosimeters (a) Bland-Altman plot comparing 0 and 30 results (b) Bland-Altman plot comparing 0 and 60 results Figure 3.7: Plots showing the effect of angulation on TLDs For the TLDs at 30 the mean difference is 17μSv, and the 1.96σ value is 73μSv (figure 3.7a). A slightly larger drop, and a wider spread than for the active dosimeters at 60. At 60 the mean difference is 55μSv, and the 1.96σ value is 72μSv (figure 3.7b). The difference between 0 and 30 degree results is not statistically significant but the difference in the mean results between 0 and 60 degrees is statistically significant
57 3 Results 46 according to a standard one sample t-test with a 95% tolerance interval. Mean Difference from 0 (μsv) MGP OSL TLD Table 3.4: Summary of changes in dose readings when angling dosimeters Figure 3.8: Plot of Normalised Mean Results against angle Figure 3.8 shows the normalised, mean reported dose for each dosimeter type at zero, thirty and sixty degrees. Lines of best fit for each type at the two exposure levels were calculated and included in the plot. Overall there is a slight reduction in measured dose when angling the dosimeters away from perpendicular to the source of radiation in all the dosimeters. This is shown by the negative value of the mean difference in all the Bland-Altman plots and the values in table 3.4. As one might expect, the effect is stronger overall in all three cases with increasing angle. This can been seen in the downward slope of the lines of best fit in figure 3.8. The active dosimeters appear less effected by the angle of incidence than the passive dosimeters. The results suggest that the active dosimeters would be at least as suitable for personal dose measurement as the approved passive dosimeters in this regard.
58 3 Results Comparison of passive dosimeters The plots in sections 3.2.5, and include results at 0, 30 and 60 degrees from perpendicular to the source. All comparisons are like for like, only dosimeters from the same exposure, and therefore at the same angle, are compared with each other. The points are plotted in separate series for the 0, 30 and 60 degree exposures in all of the plots. (a) Direct comparison of dose results (b) Bland-Altman Plot Figure 3.9: Initial comparison of passive dosimeter results It is obvious in figure 3.9 that there is a problem with the results from the OSL dosimeters in the high dose experiment. The source of this error is unknown. No fit was made to the data in figure 3.9a as it is clearly not a linear relationship. All of the data in subsequent plots for the controlled experiment show good agreement with a linear relationship fitted to the data as would be expected. The points in the plot form groups of rectangles because the points all come from comparing each result from one dosimeter type to all the results from the other dosimeter type in the same experiment. The width of each rectangle shows the spread of results for the dosimeter type on the x axis; the height shows the spread of results for the dosimeter on the y axis in each experiment. A similar effect can be seen in the Bland-Altman plots that follow, the points from each set of comparisons form parallelograms. The y value of point of the parallelogram furthest from y=0 shows the maximum difference between the two dosimeter types being compared in that experiment, the y value of the point closest to the x axis (y=0) shows the smallest difference between the dosimeter types.
59 3 Results 48 There are more points in the plot than can actually be seen, as the results from the passive dosimeters are often the same. They coincide as results from passive dosimetry services are given to the nearest 10μSv. Coincidence of data is much less likely for the active dosimeters, as the results are given to the nearest 1μSv. In the plots with linear fits to the data, all points are used in the least squares fit calculation, independent of whether they can be seen visually in the plot. The reported doses for the OSLs exposed to the highest dose were considerably lower than expected from theory, or recorded by the TLDs or active dosimeters. Due to this discrepancy the exposures were repeated with new TLDs and OSLs in order to see if this was a flaw in the reporting of a single batch or a consistent problem with the OSLs. The repeated experiment gave the results in figure In the repeated experiment, the results of the OSLs where much more in line with the results from the other dosimeter types. It was concluded that there was an error with the batch of OSLs used in the first set of exposures, or the reading of them. From this point all comparisons with OSL results in controlled experiments include the results from this second experiment rather than the first set of exposures. (a) Direct comparison with least squares fit (b) Bland-Altman plot Figure 3.10: Comparison of OSL and TLD results after repeat exposures The results from the repeated experiment where fitted to a linear f(x) = ax + b relationship using the least squares method. The results show a good agreement with a linear relationship with an r 2 value of However the relationship is far from the expected y = x with a slope a = 0.75 and an intercept b = 79. The results from the OSLs at the higher exposure level (~1mSv) are higher than those of the
60 3 Results 49 TLD but agree well in the lower dose experiments. The high values for the OSL doses cause the decrease in the slope of the fit in figure 3.10a and the high points to the right of plot 3.10b. The results of other comparisons later in this chapter support the conclusion that the reported OSL dose in this experiment were higher than the actual value of a little under 1mSv for this exposure. The spread of results between dosimeters increases with increasing dose. This effect can be seen on all the subsequent plots. This could be explained by a systematic bias on each individual dosimeter which becomes more evident with increasing dose. The spread of results is greater for the OSL dosimeters at the highest dose exposure but less than that of the TLDs at the lower dose levels. The spread of results also appears to increase when turning the dosimeters from 0 to 30 and 60 from perpendicular to the source. The Bland-Altman plot including the results of the repeated high dose experiment (figure 3.10b) shows the mean difference of -21μSv, and just two data points (of 51) outside the 1.96σ of 106μSv. At the low and medium dose levels the OSL results are below those of the TLD resulting in a negative mean difference. For the high dose results however 5 of the 6 points are above the mean and 4 of the points are positive. The higher OSL results at the high dose level are obvious in the Bland-Altman plot, as the mean difference is below zero but five of the six points from the high exposure experiment are above the mean.
61 3 Results Comparison of active dosimeters with OSL dosimeters (a) Direct comparison of OSL and MGP results (b) Band-Altman plot Figure 3.11: Comparison of OSL and MGP results The agreement between the active dosimeters and the OSL dosimeters appears to be better than that between the two types of passive dosimeters, with a = 1.18, b = 49 and an r 2 of The OSL dosimeters report a higher dose than the active dosimeters around 1mSv, excluding those data points would give a fit closer to y = x. The mean difference between active and passive dosimeters is just 3μSv with a 1.96σ of 125μSv. Six data points outside 1.96σ in a sample size of 84 is unexpected and all occur at the highest dose level. The active and passive dosimeters show good agreement in the low and medium dose exposures but an obvious difference at 1mSv (over 200μSv difference in one case). The results from the OSLs are mostly lower than the results from the active dosimeters at lower doses. At these lower doses (<0.5mSv) there is some overlap in the reported doses from the two dosimeter types. This can be seen in the points clustered around y=0 in figure 3.11b. The results from the OSLs are all higher than the results from the active dosimeters in the high dose experiment, this is obvious from the points on the right of figure 3.11b, which are all below the line of y=0.
62 3 Results Comparison of active dosimeters with Thermoluminescent dosimeters (a) Direct comparison (b) Bland-Altman plot Figure 3.12: Comparison of TLD and MGP results The agreement between the active dosimeter and TLD results seems excellent, with the slope of the linear fit to the data very close to unity, and an intercept near zero. There are two sets of high dose comparisons because usable data comparing TLDs and the active dosimeters was obtained in both the initial and repeated high dose experiments. The Bland-Altman plot also shows excellent agreement between TLDs and MGPs in the controlled experiments. The mean difference is 0μSv, and the 1.96σ value is 105μSv. There is a spreading of the results as dose increases but only 3 points outside the ±1.96σ values (one at ~350μSv and two at ~900μSv) which is to be expected for a sample of 92 points. The agreement between the TDLs and the active dosimeters is the best agreement between the three dosimeter types.
63 3 Results Summary of inter and intra-dosimeter type comparisons in controlled experiments Slope of Fit Intercept Coefficient of Determination (r 2 ) OSL-TLD MGP-OSL MGP-TLD Table 3.5: Summary of linear fits to comparisons of dosimeter results On average the TLD and active dosimeters show the best agreement in a direct comparison, with a slope of close to one, and an intercept close to zero. All of the data sets show good agreement with a linear fit. Mean difference 1.96 Standard Deviations Points of comparison (μsv) from the mean (μsv) OSL TLD MGP OSL-TLD MGP-OSL MGP-TLD Table 3.6: Mean difference and 1.96σ values for dosimeter comparisons Standard one sample t-tests show that of all these comparisons, the only statistically significant mean difference is the one between the two types of passive dosimeter (OSL-TLD in table 3.6). The differences in mean dose results between active and passive dosimeter results are not statistically significant for either passive dosimeter type with a 95% confidence interval.
64 3 Results 53 (a) All Results (b) Results below 500μSv Figure 3.13: Mean dose per Dosimeter Type vs Mean dose per exposure The plots in figure 3.13 show the variation in each group of dosimeters and the overall agreement of the dosimeters with each other. The figures plot the mean dose reported by each dosimeter type, with bars showing the maximum and minimum dose result reported, against the mean reported dose for all dosimeter types used in an experiment. For the lowest doses reported the means agree exactly as they are the same value, only the active dosimeters report any result at this level. In all other cases there are clusters of vertically overlapping results as the maximum dose for one dosimeter type overlaps the minimum dose for another. The closely grouped vertical lines of results arise from the 0, 30 and 60 degree exposures at approximately the same dose. The greatest differences between the groups of results arise at the highest doses. The active dosimeter and TLD results for one high exposure overlap, but the OSL results for that same exposure are very low, as reported earlier. The low OSL results lower the overall mean, taking the TLD and active dosimeter results above the line of x = y. The results for the repeated high dose experiment (at the right of figure 3.13a) show the opposite result, with the OSL results higher than the TLD and active dosimeter results, in this case though the TLD and active dosimeter results do not agree as well, as the lowest active dosimeter result is higher than the highest TLD result. In order to better display the lower dose results, figure 3.13b shows the results below 500μSv.
65 3 Results Statistical significance of agreement of means T-tests were performed, as outlined in section 2.4.8, to test the significance of agreement between the mean results of the different dosimeter types. Test were performed for the low (~150μSv) and medium (~300μSv) dose experiments (experiments 4-6 and 7-9 in table 2.3). Dose results from the experiments with the dosimeters at 30 and 60 were normalised using the method explained in section and included in the comparison in order to produce a useful number of results for each test. Low Dose Low Dose Low Dose Med Dose Med Dose Med Dose MGP-OSL TLD-OSL MGP-TLD MGP-OSL TLD-OSL MGP-TLD Difference of Means Standard Error Degrees of Freedom Test Statistic Confidence Interval (-0.33,41) (-13,38) (-11,29) (-16,25) (-15,68) (-63,20) Agreement Yes Yes Yes Yes Yes Yes Table 3.7: T-test Results (for p=0.05) for agreement of different dosimeter types Table 3.7 shows no statistically significant difference in the mean results of the two dosimeter types in each comparison, within the 95% confidence interval. The confidence interval spans zero in all cases, but only just in the case of the low dose comparison of active and OSL dosimeters.
66 3 Results Comparison of staff doses recorded by passive and active dosimeters RAPID Staff doses Staff in RAPID have been using the MGP active dosimeters together with the logging stations since The following Bland-Altman plots show the level of agreement between the active and passive dosimeters for 2012, 2013 and For privacy reasons the staff are represented by numbers rather than by name. The use of different symbols gives an indication of agreement between active and passive dosimeters for different staff members. Each point is a comparison of the monthly TLD result with the sum of the active dosimeter results over that month for the same staff member. In 2013 all staff using the MGP dosimeters were asked to wear the passive and active dosimeters in the same location on the torso to minimise the differences between the results. The survey results in table 3.17 show around 70% reported compliance with this request at the time of the survey (August 2014) The first full year using the logging stations and database was One TLD result has been excluded from these plots as it was found that the dosimeter was exposed while it was not being worn, invalidating the result. The r 2 value of 0.49 indicates that the data dose not fit particularly well to the least-squares linear fit. There are a large number of TLD results of below the detectable limit (BDL) which is given by the manufacturer as 50μSv. These results form the horizontal line in the bottom left of figure 3.14a extending out to 177μSv. The lowest reported TLD result is 100μSv. Excluding the comparisons where the TLDs returned a value of below the detectable limit dose not improve the correlation, r 2 drops to 0.38 for the best fit shown with a dashed line. The slope of the fit excluding the BDL results is closer to one but the intercept is much further from zero. In the Bland-Altman plot shown (figure 3.14b) the mean and standard deviation values were calculated excluding the BDL results. As this excludes a large amount of data (35 out of 117 points), calculations of the mean difference and the standard deviation of the differences were calculated assuming three different values for the unreported TLD results. A one sample t-test shows that the difference between the
67 3 Results 56 (a) Direct dose comparison (b) Bland-Altman Plot (c) Bland-Altman Ratio Plot Figure 3.14: Comparison of RAPID staff dose results for 2012 passive and active dosimeter results is statistically significant using a 95% confidence interval. As the stated minimum detection level is 50μSv, values of 0μSv, 25μSv and 50μSv were used to cover the assumed range of potential values. The results of these calculations are displayed in table 3.8. Excluding the BDL results, the mean difference between results from the TLDs and the summed active dosimeter results for each month was -190μSv with a 1.96σ of 500μSv. The mean difference and spread of results is much larger than in the controlled experiments. Picking a value between 0 and 50μSv for the unreported
68 3 Results 57 Excluding BDL BDL values BDL values BDL values comparisons set to 0μSv set to 25μSv set to 50μSv Mean Difference x Std Deviation Table 3.8: Bland-Altman Results for 2012 RAPID Doses TLD results reduces both the mean difference and the spread of differences. The best agreement comes from setting the BDL results to 0μSv. The Bland-Altman ratio plot (figure 3.14c) shows that on average the active dosimeter result is 0.60 of the equivalent TLD result. The spread is wide with a 1.96σ value of In only two of the comparisons is the active dosimeter result greater than the passive dosimeter result. The points form a better horizontal fit than the standard Bland-Altman plot, with what seems to be a consistent spread with increasing average reported dose. This plot does not include any BDL values. A one sample t-test shows that the ratio between the passive and active dosimeter results is significantly different to 1 using a 95% confidence interval The least-squares fit is closer to x = y than for the 2012 comparison but the correlation coefficient suggests that the fit is no better. Again the active dosimeter results report doses far in excess of 50μSv for a number of TLD reports of below the detectable limit and the lowest reported TLD result is 100μSv. In the Bland- Altman plot the mean difference is -136μSv and the 1.96σ is 321, an improvement on the 2012 results. This may be due to the request to wear dosimeters in the same location reducing the variation in exposure to the two dosimeters. A one sample t-test shows that the difference between the passive and active dosimeter results is statistically significant using a 95% confidence interval. Excluding BDL BDL values BDL values BDL values comparisons set to 0μSv set to 25μSv set to 50μSv Mean Difference x Std Deviation Table 3.9: Bland-Altman Results for 2013 RAPID Doses As with the 2012 results, picking a value between 0 and 50μSv for the unreported TLD results reduces both the mean difference and the spread of differences. The effect on the spread of differences is not as great as in 2012 and again, the best agreement comes from setting the BDL results to 0μSv (table 3.9).
69 3 Results 58 (a) Direct dose comparison (b) Bland-Altman Plot (c) Bland-Altman Ratio Plot Figure 3.15: Comparison of RAPID staff dose results for 2013 The Bland-Altman ratio plot (figure 3.15c) shows that on average the active dosimeter result is 0.58 of the equivalent TLD result, this is similar to the 2012 result. The spread is even wider with a 1.96σ value of There are more instances of the active dosimeter results being higher than the passive results, particularly some results for staff members 7 and 4. Both staff members also have many comparisons for the year where the TLD results are higher than the active dosimeter results, illustrated by points below 1 on the y-axis. The spread of results seems to reduce with increasing average reported dose, but the smaller number of points at higher
70 3 Results 59 doses make it difficult to draw conclusions. This plot does not include any BDL values. A one sample t-test shows that the ratio between the passive and active dosimeter results is significantly different to 1 using a 95% confidence interval (a) Direct dose comparison (b) Bland-Altman Plot (c) Bland-Altman Ratio Plot Figure 3.16: Comparison of RAPID staff dose results for 2014 For the 2014 data the least-squares fit has a slope close to one and the correlation coefficient is improved over 2012 and It can be seen in the plot that there are a smaller number of points with very large differences between the TLD and active
71 3 Results 60 dosimetry results in the 2014 data, compared to previous years. The lowest reported TLD dose is 120μSv. Excluding BDL BDL values BDL values BDL values comparisons set to 0μSv set to 25μSv set to 50μSv Mean Difference (μsv) x Std Deviation Table 3.10: Bland-Altman Results for 2014 RAPID Doses The spread of results has decreased year on year. In all three cases the results from the active dosimeters are lower than those from the TLDs but are getting closer each year. One sample t-tests show that the difference between the passive and active dosimeter results is statistically significant using a 95% confidence interval for all three years of results. As with the previous results, picking a value between 0 and 50μSv for the unreported TLD results reduces the mean difference, however for the 2014 results the spread of differences is increased by setting the BDL values to zero or 25μSv. The best agreement for the mean of the results again comes from setting the BDL results to 0μSv (table 3.10). The Bland-Altman ratio plot (figure 3.16c) shows that on average the active dosimeter result is 0.56 of the equivalent TLD result, this is similar to the results from the previous years. The spread is similar to 2012 with a 1.96σ value of The results do not seem distributed along the mean, showing that the ratio between the active and passive results is not consistent. There is one very obvious outlier from staff member 19 which is not easy to see in figures 3.16a and b as it is at a relatively low dose level. This plot does not include any BDL values. A one sample t-test shows that the ratio of the passive and active dosimeter results is again significantly different to 1 using a 95% confidence interval The effect of reported wear position on correlation It was thought that staff wearing the dosimeters in different locations on the torso may be a contributing factor to the differences between the passive and active dosimetry results. To assess this, comparisons (figure 3.17) were made of the results only for the staff who, when surveyed, reported wearing both dosimeters in the same location on their torso. Excluding the staff who wear dosimeters in different locations does nothing to improve the correlation. The linear fit has a similar slope and intercept to the
72 3 Results 61 (a) Direct dose comparison (b) Bland-Altman Plot Figure 3.17: RAPID staff dose results for 2014 for staff wearing the passive and active dosimeters in the same position on the body. inclusive plot (figure 3.16) and the correlation to that line is worse than for the inclusive plot. In the Bland-Altman plot the mean difference is increased from -90μSv to -102μSv and the 1.96σ value is decreased from 169μSv to 159μSv by including only the results from dosimeters worn in the same body position. A one sample t-test on this data shows that the difference between the passive and active dosimeter results is still statistically significant using a 95% confidence interval PET Centre Staff doses Staff in the PET Centre started using the dosimeters in As discussed in the 2013 data was gathered with a large number of staff only wearing the active dosimeters when working in PET. The staff were wearing their TLDs in PET and also in Nuclear Medicine. The TLD results are much higher than those from the active dosimeters. The least-squares fit is meaningless with a correlation coefficient as low as 0.13 (figure 3.18a).
73 3 Results 62 (a) Direct dose comparison (b) Bland-Altman Plot (c) Bland-Altman Ratio Plot Figure 3.18: Comparison of PET Centre staff dose results for 2013 The Bland-Altman plot (figure 3.18b) demonstrates the poor correlation between the TLD and active dosimeter results. There is only one active dosimeter result less than the equivalent TLD result and the difference between the TLD and active dosimeter results is marked and increases with increasing dose. The mean difference between TLD and active dosimeter results is similar to that in the RAPID group despite much lower average dose results. Setting the BDL values to 0, 25 or 50μSv reduces the mean difference but the standard deviation is even larger (table 3.11). The Bland-Altman ratio plot (figure 3.18c) shows that on average the active dosimeter result is 0.36 of the equivalent TLD result, this is much lower than the
74 3 Results 63 Excluding BDL BDL values BDL values BDL values comparisons set to 0μSv set to 25μSv set to 50μSv Mean Difference x Std Deviation Table 3.11: Bland-Altman Results for 2013 PET Centre Doses RAPID results. The spread is similar to RAPID with a 1.96σ value of There is no discernible trend in the data. This plot does not include any BDL values As explained in section 2.5.2, in 2014 a smaller number of staff wore the active dosimeters in both PET and Nuclear Medicine in an attempt to gather more meaningful data. The direct comparison plot (figure 3.19a) does show an improved correlation compared to 2013 but it is still far from convincing. The slope of the fit suggests that the active dosimeter results are still much lower than those from the TLDs. In the Bland-Altman plot (figure 3.19b) the mean difference is -86μSv and the 1.96σ is 93μSv. Given the lower doses recorded by the dosimeters compared to the RAPID staff, one would expect that the difference and spread would be lower for PET centre workers. The results excluding the below detectable limit results, are very similar for the PET centre and RAPID in 2014, the mean difference and standard deviations are both within a few micro-sieverts of the results from the other group.
75 3 Results 64 (a) Direct dose comparison (b) Bland-Altman Plot (c) Bland-Altman Ratio Plot Figure 3.19: Comparison of PET Centre staff dose results for 2014 Excluding BDL BDL values BDL values BDL values comparisons set to 0μSv set to 25μSv set to 50μSv Mean Difference (μsv) x Std Deviation Table 3.12: Bland-Altman Results for 2014 PET Centre Doses For the 2014 results the mean difference is improved by assuming a value for the BDL results and including the comparisons, but including the assumed BDL values increases the standard deviation in all cases (table 3.12).
76 3 Results 65 The Bland-Altman ratio plot (figure 3.19c) shows that on average the active dosimeter result is 0.56 of the equivalent TLD result, this is much more like the RAPID results than the previous year s results. The spread is similar to 2013 with a 1.96σ value of The two points where the active dosimeter reading was higher than the TLD results have increased the mean ratio. Without those two points the mean is reduced to This plot does not include any BDL values. One sample t-tests show that the difference between the passive and active dosimeter results are statistically significant using a 95% confidence interval for both the difference and ratio data for 2013 and 2014.
77 3 Results User Survey Results A copy of the user survey can be found in Appendix A. 22 questionnaires were completed Profession Profession Number Technologist 9 Nurse 5 Radiochemist 7 Other (Engineer) 1 Table 3.13: Professions of those surveyed The technologists and nurses work in the PET center. The radiochemists and engineers work in RAPID. The radiochemists include those that do regular productions of 18 FDG and those who produce research radiopharmaceuticals Time using Passive and Active Dosimeters Timespan Passive Active Less than 3 months months 6-12 months 1 1 Longer than 12 months Table 3.14: Experience using Active and Passive Dosimeters Almost all of the workers have been wearing both types of dosimeter for more than 12 months and so are accustomed to wearing them Ease of use of Dosimeters Ease of Use Passive Active Very Easy Complex/Difficult 0 0 Table 3.15: Ease of Use of Dosimeters
78 3 Results 67 Nobody reported finding the dosimeters difficult to use Comfort wearing Dosimeters Passive Active Very Comfortable Difficult/Uncomfortable 0 0 Table 3.16: How comfortable are dosimeters Almost all the staff reported finding both dosimeters comfortable to wear Wear Position of Dosimeters Passive Active Waist 13 9 Chest 9 13 Same for both 16 Table 3.17: Wear Position of Dosimeters There is a preference for wearing the active dosimeters at chest height and the passive dosimeters at the waist when staff wear them in different positions. 16 of 22 staff members wear the dosimeters in the same location (as requested), evenly split between waist and chest Frequency of checking results How often Passive Every Month 11 Most Months 5 Sometimes 4 Hardly Ever 2 Never 0 How often Active Every Day 18 Most Days 2 Sometimes 1 Hardly Ever 0 Never 1 Table 3.18: Frequency of checking dosimeter results Results from the passive dosimeters are only available once per month and half the staff report checking the results every month. Most staff report checking their
79 3 Results 68 results from the active dosimeter every day, probably because it is displayed on screen during log out Level of trust in dosimeter results Level of trust Passive Active Completely Not at all 0 0 Did not respond 1 1 Table 3.19: Level of trust in dosimeter results The overall level of trust in the results is high with slightly more trust in the results of the active dosimeter Rate of not wearing a dosimeter Passive Active Never 7 6 Hardly Ever 9 11 Sometimes 2 3 Once per month 3 0 Once per week 1 1 N/A 0 1 Table 3.20: The rate at which workers forget to wear dosimeters Workers report a high level of compliance with wearing dosimeters. The N/A result is from a nurse in the PET Centre who said that she had stopped wearing an active dosimeter.
80 3 Results Usefulness of results and feedback Passive Active Very Useful No use at all 2 0 Table 3.21: Usefulness of results and feedback The feedback from the active dosimeters is clearly seen to be more useful than that from the passive dosimeters Prefer to wear Active, Passive or Both Number Just Passive 1 Just Active 14 Both 7 Table 3.22: Prefer to wear active, passive or both Given the choice most of the staff questioned would prefer to use just an active dosimeter, about one third would like to use both and only one member of staff would prefer to use just a passive dosimeter Additional Comments The following comments were added by the staff: Finger badges cannot be replaced by electronic dosimeter TLD result turn-around too slow. Log-in problems made use of MGPs more difficult MGP recommended for high radiation areas National dosimetry register to collect data from all providers using common unique identifier for workers. Audible alarm helpful reminder, good for students, possible to equalize dose among staff by assigning high dose procedures to staff with lowest dose.
81 3 Results 70 Don t wear MGP as end of day alert is annoying TLD is retroactive so too late. MGP better as checking each day makes you more aware. Like the beep as it is a constant reminder. If switch to just electronic would still want monthly summaries. Not had any really helpful info back from the MGPs. Like the beeps as it is a constant reminder. The comments mainly center on the audible feedback from the active dosimeters, the delay in reporting from passive dosimeters and some technical issues with the active dosimeters. The reference to finger badges acknowledges that current active monitoring systems cannot replace passive dosimeters entirely, as there are no systems to record extremity doses. RAPID workers are required to wear ring badges containing TLDs to monitor their extremity doses.
82 Chapter 4 Discussion 4.1 Reliability In the course of the controlled experiments there were occasions where passive monitors produced unexpectedly low results. As shown in table 3.2 a number of results were excluded from comparison because the reported dose was given as below detectable limits when the results from the other two detection methods were above the stated detection limit of the passive monitor. In one case a single TLD badge from a batch reported below detectable limits while the other badges of the same type reported doses around 120μSv, well above the detection limit. One of the experiments had to be repeated as a set of results from the OSL monitors came back as approximately one third the reported doses of the active and TLD monitors. In the repeated high dose experiment the results from the OSLs were higher than the TLDs and active dosimeters, but the difference was not nearly as great as in the original experiment. There were also incidents of staff doses measured by TLDs being unexpectedly reported as below detectable limits when their work patterns were unchanged and active dosimeters reported typical doses. This may reduce worker confidence in the results they are receiving. Despite these problems the result of the staff survey in table 3.19 show a high level of trust in the results though slightly lower for the passive dosimeters than the active ones. Given the relatively small number of passive dosimeters used, the number which seem to have failed to report doses accurately is a cause for concern. The details are summarised in table 3.2. This lack of reliability does not seem to have been reported 71
83 4 Discussion 72 in the literature and is worthy of further investigation. Regular blind testing of dosimetry services using controlled exposures is recommended (Böhm et al., 1994) but there is no evidence in the literature that this has been carried out in Australia in recent history. All of the active dosimeters performed reliably during the controlled experiments. There were a few older active monitors that failed (while in use in the PET centre) during the course of this investigation, but their failure was immediately obvious to users, and so did not significantly reduce the effectiveness of dose monitoring. If there are spare batteries and a few spare monitors for when there are technical problems, the reliability of the active dosimeters seems higher than that of the passive dosimeters in terms of service provision. The database and logging stations can pose a single point of failure, but with backups a problem of this nature should pose no greater disruption to monitoring than a shipment of passive dosimeters being delayed in the mail. 4.2 Equivalence The results of the controlled experiments show excellent agreement between the active and passive dosimeters over a range of exposures typically seen by radiation workers. The data shows no more variation between active and passive dosimeters than there is difference between the two types of approved passive dosimeter either perpendicular to the radiation source or at 30 and 60 degrees to the source. The only statistically significant difference in mean dose comparisons was between the two types of passive dosimeter (section 3.2.8). The high level of agreement between the TLD and active dosimeter results (figures 3.12a and b) suggest that differences between the active and OSL dosimeter results are likely to be because of the OSL dosimeters over-reporting the dose at around 1mSv. Without the high dose results the spread of results in the Bland-Altman plot (figure 3.11b) would be much smaller. When assessing the quality of a dosimetry service the acceptable difference between the expected result and that reported can be ±50% (Böhm et al., 1994) for the kinds of relatively low doses experienced by radiation workers. The difference between the results from active and passive dosimeters in the controlled experiments was always less than 50% and usually much less than that. The spread of results from the passive dosimeters as seen in figures 3.2.2a and b was very similar to the spread between active and passive dosimeters as seen in figures 3.11 and The spread was also similar when comparing the two types of passive dosimeter (figure
84 4 Discussion ). The results are summarised in table 3.6. It is clear from these results that in controlled conditions with 511keV gammas there is no greater difference between the active and passive dosimeters than there is between the two types of approved passive dosimeters or even between different individual passive dosimeters of the same type. The active dosimeters are at least as accurate at reporting dose as the passive dosimeters in these conditions. A premises using radioactive material in WA must have at least one calibrated dosimeter for measuring dose rates (Western Australia, 1984). When calibrating dosimeters, settings on the dosimeter must be adjusted to attempt to bring the measured dose rate within 10% of the actual dose rate. If no adjustments are capable of bringing the measured dose rate within 20% of the actual dose rate the dosimeter fails and cannot be used. Calibration certificates are provided specifying the isotope or x-ray energies used to calibrate the dosimeter and its results compared to the reference dose rates. In the controlled experiments we do not have a reference dose to compare the results to, as no laboratory calibrates dosimeters to 18 FDG. The best comparison for evaluating the suitability of the active dosimeters appears to be the comparison with TLDs, due to the large number of OSLs which failed to provide usable results, and the apparent over-reporting of the ~1mSv results. Even in the best comparison (figure 3.12) some of the results of the TLDs and MGPs differed by more than 20% of the average of their results. Much of the difference between the results are due to the spread of results from the passive dosimeters. The spread of results from each dosimeter type is shown in figure 3.2.2, the active dosimeters show an obvious advantage in terms of precision. The comparison of active and passive dosimeter results from workers is far less conclusive than the controlled experiments. The results from the active dosimeters were almost always lower than those from the passive dosimeters except when the passive dosimeters reported below detectable limit. This bias could be a result of failure to always wear an active dosimeter when exposed. This was definitely the case for the 2013 PET centre results as the active dosimeters were only worn in PET and not in Nuclear Medicine. It is also possible that the large differences in the results are due to large anisotropies in the radiation field caused by uneven shielding and differing positions of the two badges when working. As shown in table 3.17, not all staff wore the two badges in the same position. When working with small, high activity sources even small distances can make large differences to exposure of different areas. This explanation is undermined by comparing the results shown in figures 3.16 and Limiting the comparison to the staff who reported wearing
85 4 Discussion 74 dosimeters in the same location on the body did not improve the correlation between the results of the active and passive dosimeters. It should be noted that there are significant errors in attempting to measure an individual s exposure using a personal radiation monitor of any kind. In laboratory conditions it is usually possible to measure radiation fields to within 10% of the true value (International Commission on Radiological Protection, 1997). In the workplace non-uniformity and uncertain orientation can change the recorded dose by a factor of 1.5 in either direction (International Commission on Radiological Protection, 1997). In light of this, it seems that equivalence should be judged more by the experiments in controlled conditions than the workplace comparisons. 4.3 Repeatability When measuring any quantity it is important that the measuring instrument reports the same result every time it measures the same quantity. The repeatability of each type of dosimeter can be judged by the spread of results when measuring the same radiation dose. The Bland-Altman plots in figure 3.1 show that the average difference between results from the same type of dosimeter are smallest for the active dosimeters. The 2σ value for the MGPs was approximately half that of the 2σ value for the OSL and TLD results. 4.4 Limits of Detection The purpose of personal radiation monitoring is to provide information on the dose individual staff members are occupationally exposed to. Radiation regulations and standards are based around the principle of keeping radiation exposure As Low As Reasonably Achievable (the ALARA principle) (International Commission on Radiological Protection, 1997). Dose reports can be examined to highlight unexpectedly high doses in radiation workers. The data from the staff monitoring in section contained no reported staff doses from TLDs below 100μSv but a large number of reports of below the detectable limit. This would suggest that the true lower limit of detection for the TLDs used in the workplace is around 100μSv. From one monitoring period to the next an individual s exposure could vary from 0 to 100μSv without any indication that changes in their work practice was exposing them to more radiation. This is clearly not the case for an active dosimetry system that displays reading down to 1μSv at the end of each day. The primary justification for
86 4 Discussion 75 a dose monitoring system is in the way in which it helps to achieve and demonstrate an appropriate level of protection (International Commission on Radiological Protection, 1997). This present study would suggest that the use of an active monitoring system could allow better compliance with the ALARA principle. 4.5 User compliance Even a technically perfect dosimeter can only report the dose to the worker if it is worn during any work involving sources of ionising radiation. There is evidence to suggest that large numbers of radiation workers in healthcare regularly fail to wear their dosimeters (Klein et al., 2015; Padovani et al., 2011). Compliance with the requirement to wear a passive dosimeter is difficult to enforce, relying on spot checks and comparison of reported doses with those of similarly employed colleagues. Many hospital radiation workers regularly report doses below the detectable limit of passive dosimeters which means that there is no way to tell if a dosimeter has been worn at all. Where an active dosimeter is coupled to a logging system however, it is a simple matter of querying the database to check whether an employee has logged in a dosimeter regularly, such records can then be compared to shift rosters or other work records to monitor compliance. The user survey (table 3.20) suggests that non-compliance among those working with PET radiopharmaceuticals and patients is low, though self reporting may not be 100% reliable. Since the conclusion of the data gathering phase of this thesis, work has been undertaken to systematically track the logging in and out of staff in RAPID. This system allows us to better calculate staff dose per work day and improve radiation hygiene, it also serves to highlight non-compliance. 4.6 User Acceptance of Active Dosimeters Active dosimeters are larger and heavier than passive dosimeters, they also require more effort to use as they must be logged in and out every shift. Despite these drawbacks they were accepted well by staff and preferred over passive dosimeters by many, as demonstrated by the results of the user survey (section 3.22). One staff member in the PET center stopped wearing the active dosimeter (she was not obliged to wear one) as she found an alarm emitted after eight hours logged in to be annoying (her shifts regularly exceeded eight hours). This problem could have been overcome with changes to the settings of the dosimeter.
87 4 Discussion 76 Many workers responded that they found the audible feedback from the active dosimeters to be useful and felt that it helped them to reduce their radiation exposure. No evidence could be found to demonstrate a reduction in radiation dose after the introduction of the active dosimeters. Any change could easily be lost in the noise due to the variability in worker routine, dose results, patient numbers and dispensed activity from month to month. 4.7 Approval of Personal Radiation Dosimetry Services The standards required of providers of personal dosimetry services vary around the world (Cavallini et al., 1994; Marshal, 1998). The United States has had a program of assessing service providers since the 1960s (Schauer et al., 2004), the current testing requirements of the National Voluntary Laboratory Accreditation Program (NVLAP) are given in HPS N (Soares, 2007). In the United Kingdom the Health and Safety Executive (HSE) also publish a set of requirements which must be met by service providers (Health and Safety Executive, 2010). In jurisdictions which mandate testing of service providers, batches of dosimeters exposed to known doses are sent for analysis by the service providers. The results are examined for compliance with a number of criteria. The US and UK both use pass/fail criteria based on the bias in the average of the results and the standard deviation for batches of dosimeters. The criteria used in the UK for dosimeters designed to monitor whole body gamma exposure are shown in table 4.1. The service provider is required to pass the initial assessment before being approved and are subject to repeat testing every 5-7 years (Health and Safety Executive, 2010). A 2001 update to the NVLAP performance criteria requires that no more than 10% of the dosimeters tested fall outside the acceptance criteria for the mean of all results (Schauer et al., 2004). This change prevents approval of services with a rate of dosimeter failure close to or higher than 10%. The Radiological Council of Western Australia do not mandate regular testing of approved suppliers; service providers must request initial approval from the Council. In the preparation of this thesis Council officers were asked about the methods used to approve providers. The providers are asked to produce details of their measurement methods and processes and demonstrate that measurement methods are traceable to Australian or international standards. One of the most significant factors in gaining approval is the provider having a national or international accreditation from one or
88 4 Discussion 77 Limit on Criteria (must pass all) Bias in average of all results < 20% Standard Deviation in all results <10% Bias in average of < 20% each group of 5 dosimeters (< 30% for any group irradiated to 1.0 msv or less) Standard Deviation of < 10% each group of 5 dosimeters (< 15% for any group irradiated to 1.0 msv or less) Table 4.1: UK HSE Pass/Fail criteria for dosimetry services for monitoring whole body gamma exposure (Health and Safety Executive, 2010) more of the major accreditation providers such as National Association of Testing Authorities (NATA). NATA accreditation for personal dosimetry is in part based on the provider meeting the standards set by the HSE, NVLAP or International Accreditation New Zealand (IANZ). In our controlled experiments we have no true dose values to compare our results to so we cannot say if any of our sets of dosimeters would have passed a review to the standards of the HSE or NVLAP. We can say however that the MGP results showed a much smaller standard deviation that either of the passive dosimeter types. It would be prohibitively expensive for an individual hospital to obtain NATA accreditation as a dosimetry service provider. This may represent a significant hurdle to getting the active dosimetry system approved by the Radiological Council as a means of obtaining the legal dose record. 4.8 Standards for Personal Radiation Monitors National standards relating to radiation protection and detection tend to be based largely on international standards published by bodies such as the International Atomic Energy Authority (IAEA), the International Commission on Radiation Protection (ICRP) and the International Electrotechnical Commission (IEC) (Voytchev et al., 2011). The IEC has a sub-committee (45B) focused on radiation protection instrumentation which has published standards for both active personal dosimeters (IEC also known as ISO 4037) and passive integrating dosimetry systems (IEC ). The two IEC standards contain a list of criteria for the dosimetry systems including the dosimeter reading and reporting equipment. The criteria include the minimum energy range, and minimum and maximum dose and dose rate levels, over which a dosimetry system must function. Type testing is not included in IEC ; it is only concerned with system properties and states that absolute calibration
89 4 Discussion 78 should be performed as part of routine testing (Voytchev et al., 2011). Comparing the requirements between these two standards show that the requirements for the passive dosimeters are more stringent, with a broader energy requirement; 12 kev 7 MeV for passive dosimeters and 80 kev 1.5 MeV for active dosimeters when measuring H p10 for gamma exposure. This is not to say that active dosimeters cannot meet the same standard as the passive dosimeters, but that they do not have to in order to satisfy IEC Edition 3. Boziari and Hourdakis (2007) and others have demonstrated that some active personal dosimeters show good energy independent response down to 50keV, while with others the response drops sharply below 65keV making them unsuitable for some applications. The results of tests of a number of active personal dosimeters against aspects of IEC have been published. Texier et al. (2001) tested the energy response of seven different active dosimeters including the DMC 2000S, one of the dosimeters used in this study. It was found that the majority conform to the standard but many, including the DMC 2000S, have a poor response below 50 kev. Using the x-ray and gamma energies suggested in IEC 61526, angular response was tested for two types of active dosimeter by Suliman et al. (2010) and very little variation was found with rotation which is in agreement with the results in section Calibration of APDs Unlike passive dosimeters, active dosimeters may be in use for more than 10 years (see section ). There is potential for their performance to degrade over time, or be altered by calibration or changes to settings. If the active dosimetry system were to provide the legal record of occupational dose this problem would need to be overcome through regular calibration. This could either be performed in-house, if a suitable source and measurement apparatus is available, or by an approved service provider against a source traceable to a national standard. This requirement for calibration would place an extra workload and/or expense on the center using APDs Record Keeping and Data Analysis Having a single database containing all the dose data for your staff has advantages and disadvantages. Whatever dosimetry system is used as the legal record of worker dose there is a legal requirement for data retention; in Western Australia personal dosimetry records can not be disposed of without the explicit permission of the
90 4 Discussion 79 Radiological Council (Western Australia, 1984). A single database provides a single point of failure if the database is not backed-up, posing a great risk of loss of data. This is counteracted by the ease with which electronic files can be backed-up and stored, in comparison to paper records. The main advantage of a single structured database is the ease with which data can be queried and cross-referenced. The reports provided by external suppliers have moved from paper to electronic files. The files provided are of changing file format and structure which makes compiling data from multiple years difficult, error prone and time consuming. Data analysis is much easier with a single, large structured database than a large collection of separate files Incident investigation One of the significant advantages of active over passive dosimeters is in the area of incident investigations. With passive dosimeters dose reports much be checked for doses above regulatory limits or internal trigger levels and investigations of unusually high reported doses must be carried out. Any results, either monthly or quarterly, which are above the pro-rata annual limit (20mSv/year whole body dose) must be reported to the Radiological Council in Western Australia (Western Australia, 1984). The delays in data collection and reporting with passive dosimeters, and the inability to pinpoint the day a high dose occurred, can cause significant problems in investigating and reporting on high doses. Active dosimetry systems on the other hand can provide immediate notification of unusually high exposure or dose rates. This acts to both to reduce exposure and pin-point where and when the exposure occurred. If a high monthly dose is shown without a record of a high exposure incident there will be a record of chronic, above average exposure. Whether the exposure is acute or chronic, the dose record can be a significant help when investigating and comparing work practices and technique with those of other staff. A day by day record of received dose and maximum dose rate can be a significant help in attempting to reduce radiation dose to workers Economic Comparison Active dosimeters are required by the state regulator in Western Australia for cyclotron production of radiopharmaceuticals. This means that both active and passive dosimeters are required by legislation. There is an obvious economic advantage to
91 4 Discussion 80 removing the requirement for passive dosimeters if active dosimeters can be demonstrated to provide adequate protection alone. In other work areas where there is no requirement for active monitoring, whatever the technical advantages of an active dosimetry system it is unlikely to be adopted if it is prohibitively expensive when compared to passive dosimetry. This section is not intended as a full economic assessment of the available dosimetry systems, but is intended to give an overview and impression of the costs involved. As with any costings projecting years into the future, a number of assumptions about future prices and equipment reliability must be made, based on past information. A comparison of the costs of passive and active dosimetry systems is a comparison of a small but ongoing cost, against a larger upfront cost, with the outlay going forward being a requirement for equipment replacement. Any dose monitoring system will also require staff time to manage, which can be non-trivial Costs of Passive Dosimetry For each wear period, either one or three months, a dosimeter must be supplied and returned for each member of staff. There is a delay between ordering and receiving dosimeters, so usually a large department will have a standing order for a number of spare dosimeters, to be assigned to new members of staff or to cover for lost or damaged dosimeters. There is a fixed cost for each dosimeter supplied (excluding control dosimeters). If any badge is not returned within a designated time, for example within 1 month of the end of the wear period, it is considered lost and an additional lost badge charge is levied. Some suppliers also charge a delivery fee, a flat fee independent of the number of badges delivered. The cost per year of the passive dosimetry system shown in table 4.2c are simply 12 times the unit cost, multiplied by the number of staff and thus represent the minimum cost with no lost badges or delivery fee. The dollar values given in the costings in table 4.2a are indicative values based on 2015 figures quoted to staff in Medical Technology & Physics by three of the main service providers in Australia. There is no significant difference between the cost of TLD and OSL badges. There is a great deal of time spent by staff receiving, checking, distributing, collecting, packaging and returning dosimeters each wear period when there are large numbers of dosimeters. Time is also spent making changes to orders due to staff changes and processing the invoices to pay for each shipment. For a large department with regular staff changes, managing communication with the supplier can become a significant time burden and expense.
92 4 Discussion Costs of an Active Dosimetry System An active dosimetry system requires a number of components as explained in 2.3. While the costs of a passive system scale roughly linearly with the number of workers; due to the requirement for one or more logging stations and a central database, this is not the case for an active system. Due to relatively large capital outlay, any calculation of cost per worker per year is strongly dependant on the number of workers and the lifetime of the various pieces of equipment. The costs per year in table 4.2c are calculated by summing the the unit costs of the required equipment divided by its predicted lifetime. As with the passive dosimetry service there will be a need for monitoring staff doses and following up on results. Far less time is spent in the occasional battery change and replacement of faulty dosimeters than is spent in the routine handling of large numbers of passive dosimeters. There would be the additional staff overhead of report production, but this is a largely automated process Lifetime of MGP Active dosimeters One of the important economic considerations is the lifetime of the dosimeters. The date of purchase and failure of every MGP dosimeter used at Sir Charles Gairdner Hospital was obtained to assess the typical lifetime of an active dosimeter of this type.

93 4 Discussion 82 Figure 4.1: Lifetime of MGP dosimeters It can be seen in figure 4.1 that the typical lifetime of the MGPs which have failed is around 10 years. There are however three dosimeters still in use after 11 years and two more still active after 13 years. For this simple analysis a value of 10 years was chosen. The logging stations and PC used to run the database were replaced in 2016 so a lifetime of 4 years was used Comparison of costs per year With any set of reasonable assumptions it is clear from table 4.2c that for large groups (> 20) an active dosimetry system can cost less per year than a passive system. The difference in costs will however be outweighed easily by any change in staff time allocated to managing the dosimetry system, analysing results and performing investigations. As noted in section 4.11 investigation of high exposure should be simpler and more effective with an active dosimetry system reducing the duration of investigations and improving their effectiveness. Alternative dosimetry systems may prove more cost effective in the future. Instadose dosimeters are a
94 4 Discussion 83 Unit cost (AU$) Passive dosimeter 15 MGP active dosimeter 800 Logging Station 3000 Database PC 2000 Software 500 (a) Indicative unit costs for active and passive dosimetry systems in 2015 AUD Lifetime (Years) MGP active dosimeter 10 Logging Station 4 Database PC 4 (b) Expected Lifetime of active dosimetry system components Total staff requiring monitoring Staff requiring monitoring simultaneously Cost (AU$/year) Passive Dosimetry Active Dosimetry (c) Averaged cost per year of active and passive dosimetry systems for different user group sizes. Costs exclude staff costs in managing the system. Table 4.2: Economic Comparison of Active and Passive Dosimetry
95 4 Discussion 84 small electronic personal dosimeter without a screen which can report doses to a central database via the web when plugged into a PC. They are currently cost competitive with passive dosimeters and their cost could fall with greater uptake of the technology.
96 4 Discussion Legislative issues in Western Australia Every state has its own legislation regarding the use of ionising radiation and the protection of personnel working with it. In Western Australia the relevant legislation is The Radiation Safety Act 1975 and the Radiation Safety (General) Regulations The Act and Regulations are administered by a statutory body called the Radiological Council (Western Australia, 1975). The Act and Regulations were written before the advent of active personal dosimeters and because of this the wording of the Regulations relating to the requirements for personal dosimetry could pose an impediment to the replacement of passive dosimeters with active ones even if active dosimeters are deemed technically suitable or even superior. There is nothing in the Regulations that specifically prohibits the use of active dosimeters, the means by which dose information is obtained is not described at all. Section 25 of the Regulations relate specifically to personal monitoring devices, in particular this section refers to use of an approved personal monitoring device and the use of the services of radiation monitoring organizations that have been approved. A list of approved organizations can be obtained from the Radiological Council website, all of the approved organizations provide passive monitors (Radiological Council of WA, 2010). It is possible to request approval from the Radiological Council for a new service provider but the approval of active monitors would be a significant shift from current practice. At present an approved supplier supplies the badges and is responsible for reading them and reporting the doses. The approved suppliers are either large laboratory organizations who have obtained internationally recognised quality accreditations or their agents. With the active dosimetry system discussed in this thesis the organization producing the reports is the organization employing the workers, this could be seen by the Council as a conflict of interest. If the Council were amenable to approving individual workplaces as approved personal radiation monitoring service providers it would mean that each workplace would have to apply individually. Applying for approval could prove a significant administrative burden which could discourage centres from switching despite the advantages of active dosimeters. Having to assess a large number of applicants for approval would also place additional work on the Council and its Officers. One type of electronic dosimeter, the Instadose ( has been approved by the Radiological Council. This dosimeter differs significantly from the active dosimeters discussed in this thesis in that it offers no direct feedback. Its main
97 4 Discussion 86 advantage is that it can be read at any time by plugging it into a PC with the correct software installed; the dosimeter does not need to be returned to the supplier. The dose data is stored by the supplier on remote servers which receive updates from the software. Account managers can access and assess the doses recorded through the software. The use of such a system may overcome some of the issues with passive systems, but it does not offer the full range of advantages of an active dosimetry system and would still require RAPID workers to wear two dosimeters.
98 Chapter 5 Conclusion and Future Work 5.1 Conclusions There seems to be no technical reasons why the active dosimetry system described in this work could not be used to provide the occupational dose record for staff working with PET radiopharmaceuticals and patients. Controlled experiments demonstrated that the ability of the active dosimeters to measure radiation dose from 18 FDG was at least as good as that of the passive dosimeters currently in use at Sir Charles Gairdner Hospital. The agreement between the active dosimeters in the same experiments was better than that between the same type of passive dosimeters. The controlled experiments demonstrated a problem with the reliability of the passive dosimeters, with many results being significantly lower than expected. In a real life situation this could lead to under reporting of occupational doses. Both the controlled experiments and the staff dose results showed that the actual lower limit on detection for the passive dosimeters is greater than that stated by the suppliers. Over a year the unreported doses from passive dosimeters could total 1mSv and opportunities for dose reduction could be missed. If the project were to be repeated it would be sensible to use a larger number of passive dosimeters to gather better statistics and attempt to gather data for all dosimeter types over the dose range of interest. When designing the experiments such a large failure rate was not anticipated, in particular the failure of multiple dosimeters in the same batch. The nature of gathering workplace data meant that few conclusions could be drawn from comparing active and passive dose results for staff. The correlation between the dose results for active and passive dosimeters was far from clear, though it did seem to improve over the course of the monitoring. A large proportion of the results were below the detection limit of the passive dosimeters and so gave no 87
99 5 Conclusion and Future Work 88 meaningful data. There was an obvious overall lower dose recorded by the active dosimeters. Gathering more informative workplace data would require a change to work practices such that workers wore the active dosimeters whenever they were at work and more supervision to ensure that there were not periods where they were not being used. The problems with doses below 100μSv not being recorded by the passive dosimeters are always going to result in a smaller pool of useful comparisons. With one exception, staff reported that they were comfortable using the active dosimeters and many stated a preference for the active over passive dosimeters. For a medium to large workforce (20 or more radiation workers) there should be no economic disincentive to switching to an active dosimetry system if a long term (multi-year) view is taken. The major hurdle is legal approval. Active dosimetry systems have been approved in some jurisdictions but the only system approved for use in Western Australia uses dosimeters which simply store data and report it back to a central service without relying on local data storage and report production. No currently approved personal dosimetry systems give instant feedback of dose or dose rate, which is one of the major advantages of active personal dosimetry. 5.2 Future Work The number of passive dosimeters which reported doses well below those expected in the controlled experiments suggests that further work be carried out to determine how significant this problem is. A wider survey involving larger numbers of dosimeters, exposed to a range of known doses, should be carried out. Such a survey is probably the remit of state and national regulatory bodies. A program of regular assessment similar to the US model (Böhm et al., 1994) may be required to assure that personal dosimetry services are providing the expected results. The next obvious step for this work is to apply to the Radiological Council for approval of the active personal dosimetry system. If approval can be obtained for use in the RAPID and/or Nuclear Medicine areas then attention could turn to other areas in the hospital who might wish to use an active dosimetry system. Radiation Oncology, Radiology and Cardiovascular Medicine all have large numbers of radiation workers. Each area has the potential for significant exposure either through routine work or accident situations and may benefit from the feedback from active dosimetry.
100 Bibliography Akselrod, M. S., N. A. Larsen, and S. W. S. McKeever (2000, June). A procedure for the distinction between static and dynamic radiation exposures of personal radiation badges using pulsed optically stimulated luminescence. Radiation Measurements 32(3), Ambrosi, P., M. Borowski, and M. Iwatschenko (2010, June). Considerations concerning the use of counting active personal dosemeters in pulsed fields of ionising radiation. Radiation Protection Dosimetry 139(4), American Association of Physicists in Medicine [AAPM] (1995, April). AAPM report 53. Radiation Information for Hospital Personnel. Reports of the [AAPM]. Ametamey, S. M., M. Honer, and P. A. Schubiger (2008, May). Molecular Imaging with PET. Chem. Rev. 108(5), Ankerhold, U., O. Hupe, and P. Ambrosi (2009, July). Deficiencies of active electronic radiation protection dosemeters in pulsed fields. Radiation Protection Dosimetry 135(3), Bailey, D., J. Humm, A. Todd-Pokropek, and A. van Aswegen (2015). Nuclear Medicine Physics: A Handbook for Teachers and Students. IAEA. Bland, J. M. and D. G. Altman (1999, April). Measuring agreement in method comparison studies. Statistical Methods in Medical Research 8(2), Böhm, J., V. N. Lebedev, and J. C. McDonald (1994, July). Performance Testing of Dosimetry Services and Its Regulatory Aspects. Radiation Protection Dosimetry 54(3-4), Bolognese-Milsztajn, T., M. Ginjaume, M. Luszik-Bhadra, F. Vanhavere, W. Wahl, and A. Weeks (2004, November). Active personal dosemeters for individual monitoring and other new developments. Radiation Protection Dosimetry 112(1),
101 BIBLIOGRAPHY 90 Bordy, J.-M., J. Daures, I. Clairand, M. Denoziére, L. Donadille, F. d Errico, J. Gouriou, C. Itié, and L. Struelens (2008). Evaluation of the calibration procedure of active personal dosemeters for interventional radiology. Radiation Protection Dosimetry 131(1), Boziari, A. and C. J. Hourdakis (2007, July). Calibration, performance and type testing of personal dosemeters used in ionising-radiation applications in Greece. Radiation Protection Dosimetry 125(1-4), Boziari, A., C. Koukorava, E. Carinou, C. J. Hourdakis, and V. Kamenopoulou (2011, March). The use of active personal dosemeters as a personal monitoring device: comparison with TL dosimetry. Radiation Protection Dosimetry 144(1-4), Bushberg, J. T. (2012). The essential physics of medical imaging (3rd ed.). Philadelphia: Wolters Kluwer Health/Lippincott Williams & Wilkins. Cavallini, A., V. Klamert, and G. Busuoli (1994, July). Qualification of Personal Dosimetry Services in Italy: Procedures and Results. Radiation Protection Dosimetry 54(3-4), Clairand, I., L. Struelens, J.-M. Bordy, J. Daures, J. Debroas, M. Denozières, L. Donadille, J. Gouriou, C. Itié, P. Vaz, and F. d Errico (2008, March). Intercomparison of active personal dosemeters in interventional radiology. Radiation Protection Dosimetry 129(1-3), Covens, P., D. Berus, N. Buls, P. Clerinx, and F. Vanhavere (2007, April). Personal dose monitoring in hospitals: global assessment, critical applications and future needs. Radiation Protection Dosimetry 124(3), Delacroix, D., J. P. Guerre, P. Leblanc, and C. Hickman (2002). Radionuclide and radiation protection data handbook 2nd edition (2002). Radiation protection dosimetry 98(1), Ginjaume, M. (2011, March). Performance and approval procedures for active personal dosemeters. Radiation Protection Dosimetry 144(1-4), Ginjaume, M., T. Bolognese-Milsztajn, M. Luszik-Bhadra, F. Vanhavere, W. Wahl, and A. Weeks (2007, July). Overview of active personal dosemeters for individual monitoring in the European Union. Radiation Protection Dosimetry 125(1-4),
102 BIBLIOGRAPHY 91 Health and Safety Executive (2010, April). Dosimetry Services. Web. HSE statement on the approval of Holmberg, O., R. Czarwinski, and F. Mettler (2010, October). The importance and unique aspects of radiation protection in medicine. European Journal of Radiology 76(1), IBA Molecular (2010). Synthera fdg system - application guide. International Atomic Energy Association (2007, December). Intercomparison of Personal Dose Equivalent Measurements by Active Personal Dosimeters - Final Report of a Joint IAEA-EURADOS Project. IAEA-TECDOC International Commission on Radiological Protection (1997). General principles for the radiation protection of workers. Annals of the ICRP 27(1), International Commission on Radiological Protection (2007). The 2007 Recommendations of the International Commission on Radiological Protection. ICRP publication 103. Annals of the ICRP 37(2-4), Klein, L. W., Y. Tra, K. N. Garratt, W. Powell, G. Lopez-Cruz, C. Chambers, J. A. Goldstein, and On Behalf of the Society for Cardiovascular Angiography and Interventions (2015, March). Occupational health hazards of interventional cardiologists in the current decade: Results of the 2014 SCAI membership survey. Catheterization and Cardiovascular Interventions, n/a n/a. Lummis, S. (2013, November). Personal Radiation Monitoring System Inneficiencies: A Comparison in Service Provision. In Procedings of the 2013 Conference of the ACPSEM, Pan Pacfic Hotel Perth, pp ACPSEM. Luszik-Bhadra, M., S. Perle, and J. C. McDonald (2007, March). Electronic personal dosemeters will replace passive dosemeters in the near future. Radiation Protection Dosimetry 123(4), Madsen, M. T., J. A. Anderson, J. R. Halama, J. Kleck, D. J. Simpkin, J. R. Votaw, R. E. Wendt, L. E. Williams, and M. V. Yester (2006). AAPM Task Group 108: PET and PET/CT Shielding Requirements. Medical Physics 33(1), 4. Marshal, T. (1998, June). Future Perspectives in Personal Dosimetry. Radiation Protection Dosimetry 77(4),
103 BIBLIOGRAPHY 92 McKeever, S. W. S. and M. Moscovitch (2003, May). Topics under Debate - On the advantages and disadvantages of optically stimulated luminescence dosimetry and thermoluminescence dosimetry. Radiation Protection Dosimetry 104(3), National Council on Radiation Protection and Measurements (1995). Use of personal monitors to estimate effective dose equivalent and effective dose to workers for external exposure to low-let radiation: Recommendations of the National Council on Radiation Protection and Measurements. Obryk, B., C. Hranitzky, H. Stadtmann, M. Budzanowski, and P. Olko (2011, March). Energy response of different types of RADOS personal dosemeters with MTS- N (LiF:Mg,Ti) and MCP-N (LiF:Mg,Cu,P) TL detectors. Radiat Prot Dosimetry 144(1-4), Ortega, X., M. Ginjaume, A. Hernandez, I. Villanueva, and I. Amor (2001, July). The Outlook for the Application of Electronic Dosemeters as Legal Dosimetry. Radiation Protection Dosimetry 96(1-3), Padovani, R., J. L. Heron, R. Cruz-Suarez, A. Duran, C. Lefaure, D. L. Miller, H. K. Sim, E. Vano, M. Rehani, and R. Czarwinski (2011, March). International project on individual monitoring and radiation exposure levels in interventional cardiology. Radiat Prot Dosimetry 144(1-4), Radiation Detection Company (2015, 12). RDC FAQ. Web. Radiological Council of WA (2010, March). PRMS requirements (western australia). Schauer, D. A., N. Stanford, and J. C. McDonald (2004, October). Are HPS N test conditions and performance criteria appropriate for evaluating personal dosimetry systems? Radiation Protection Dosimetry 111(3), Singh, V. P., S. S. Managanvi, R. R. Bihari, and H. R. Bhat (2013, August). Operational experience of electronic active personal dosemeter and comparison with CaSo4:Dy TL dosemeter in Indian PHWR. Radiation Protection Dosimetry 156(1), Soares, C. G. (2007, July). History of personal dosimetry performance testing in the United States. Radiation Protection Dosimetry 125(1-4), South Australia (2000). Regulations Radiation Protection and Control (Ionising Radiation)
104 BIBLIOGRAPHY 93 Suliman, I., E. Yousif, A. Beineen, B. Yousif, and M. Hassan (2010, December). Performance testing of selected types of electronic personal dosimeters used in Sudan. Radiation Measurements 45(10), Texier, C., C. Itié, H. Servière, V. Gressier, and T. Bolognese-Milsztajn (2001, July). Study of the Photon Radiation Performance of Electronic Personal Dosemeters. Radiation Protection Dosimetry 96(1-3), The Health and Safety Executive (1999). The Ionising Radiations Regulations Voytchev, M., P. Ambrosi, R. Behrens, and P. Chiaro (2011, March). IEC standards for individual monitoring of ionising radiation. Radiation Protection Dosimetry 144(1-4), Western Australia (1975). Radiation Safety Act [Perth, W.A.] : Govt. Printer. A collection of acts pertaining to the Radiation safety act Western Australia (1984). Radiation Safety (General) Regulations [Perth] : Government Printer. "Extract from Government Gazette (No.12) of 21 February, 1983".
105 Appendix A User Experience Survey 94
106 Personal Radiation Monitoring Questionnaire This questionnaire is intended to gather data as part of a project to determine whether electronic personal dosimeters can replace passive dosimeters (TLDs) for staff working with PET radiopharmaceuticals. The data you provide will help determine whether SCGH will pursue the replacement of TLDs with electronic dosimeters. The introduction of electronic dosimetry will only happen if it is technically appropriate, satisfies legal requirements and is desirable to the staff of SCGH. Your Name.. Your name will not be included in any publications; it is collected for data analysis only. Are you a Technologist [ ] Nurse[ ] Physician[ ] Radiochemist[ ] Other[ ] How long have you been using passive dosimeters (TLDs, OSLs, film badges)? Less than 3 months [ ] 3-6 months [ ] 6-12 months [ ] longer than 12 months [ ] How long have you been using the electronic dosimeters? Less than 3 months [ ] 3-6 months [ ] 6-12 months [ ] longer than 12 months [ ] How would you rate the ease of use of TLD badges and MGP Electronic dosimeters? Very Easy Complex/Difficult TLD Electronic How comfortable is it to wear the dosimeters? Very Comfortable Difficult/Uncomfortable TLD Electronic Where do you normally wear the dosimeters? (mark with an X) TLD Electronic Please continue overleaf If you have any questions please contact Steve on x1450 or steven.crossley@health.wa.gov.au
107 How often do you check your results? TLD Every month [ ] Most months [ ] Sometimes [ ] Hardly ever [ ] Never [ ] Electronic Every day [ ] Most days [ ] Sometimes [ ] Hardly ever [ ] Never [ ] How much do you trust the results? Completely Not at all TLD Electronic Roughly how often do you forget to use a dosimeter? TLD Never [ ] Hardly ever [ ] Sometimes [ ] Once per month [ ] Once per week [ ] Electronic Never [ ] Hardly ever [ ] Sometimes [ ] Once per month [ ] Once per week [ ] How useful are the results or feedback from the dosimeters in monitoring and reducing your exposure? Very Useful No use at all TLD Electronic Given the choice would you rather use just the TLD [ ] use just the Electronic Dosimeter [ ] use both [ ] Please add any other comments If you have any questions please contact Steve on x1450 or steven.crossley@health.wa.gov.au
108 Appendix B Example Dose Reports 97


109
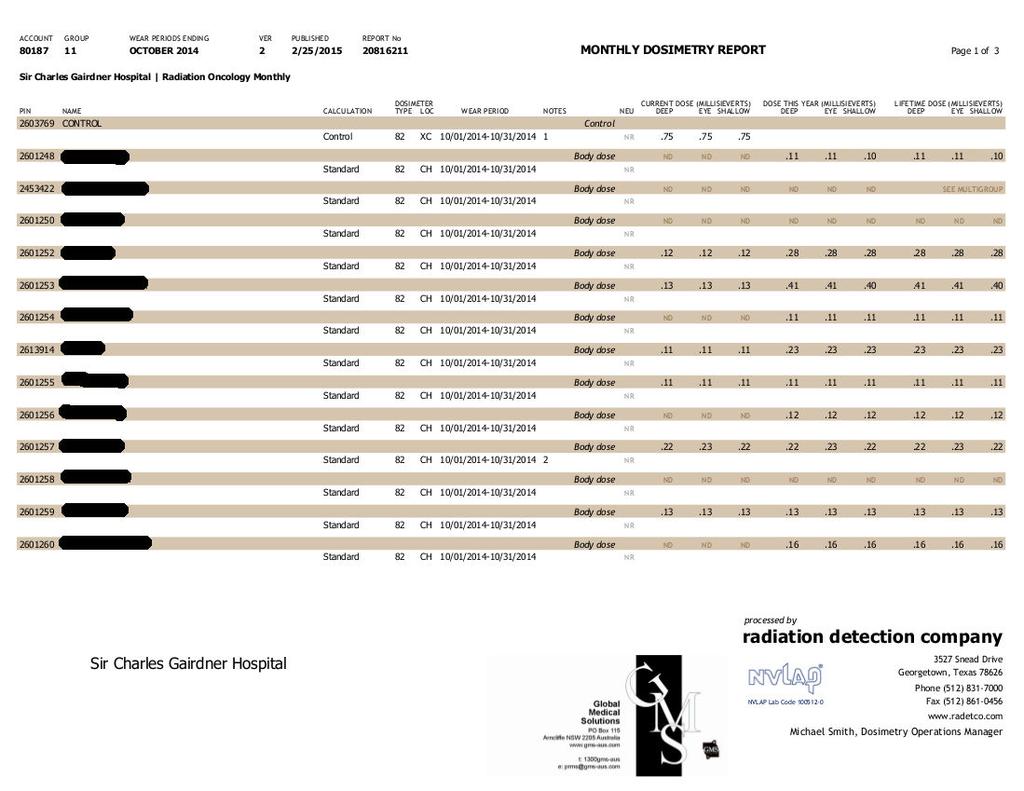
110
RADIATION MONITORING DEVICES R A D I A T I O N P R O T E C T I O N & B I O L O G Y - R H O D E S
 RADIATION MONITORING DEVICES 10-526- 1 9 7 R A D I A T I O N P R O T E C T I O N & B I O L O G Y - R H O D E S DETECTION AND MEASUREMENT OF IONIZING RADIATION Dosimeter Dose-measuring device Two classifications:
Radiation Monitoring Instruments
 Radiation Monitoring Instruments This set of slides is based on Chapter 4 authored byg. Rajan, J. Izewska of the IAEA publication (ISBN 92-0-107304-6): Radiation Oncology Physics: A Handbook for Teachers
PHYSICS 2: HSC COURSE 2 nd edition (Andriessen et al) CHAPTER 20 Radioactivity as a diagnostic tool (pages 394-5)
 CHAPTER 20 Radioactivity as a diagnostic tool (pages 394-5)") PHYSICS 2: HSC COURSE 2 nd edition (Andriessen et al) CHAPTER 20 Radioactivity as a diagnostic tool (pages 394-5) 1. (a) A radioisotope is an isotope that is unstable and will emit particles from the nucleus
PHYSICS 2: HSC COURSE 2 nd edition (Andriessen et al) CHAPTER 20 Radioactivity as a diagnostic tool (pages 394-5) 1. (a) A radioisotope is an isotope that is unstable and will emit particles from the nucleus
Radiation physics and radiation protection. University of Szeged Department of Nuclear Medicine
 Radiation physics and radiation protection University of Szeged Department of Nuclear Medicine Radiation doses to the population 1 Radiation doses to the population 2 Sources of radiation 1 Radiation we
Medical Use of Radioisotopes
 Medical Use of Radioisotopes Therapy Radioisotopes prove to be useful in the application of brachytherapy, the procedure for using temporary irradiation close to the area of disease (i.e. cancer) 10% Medical
RADIATION MONITORING EXPERIMENT USING THERMOLUMINESCENT DOSIMETER FOR THE TR 19 CYCLOTRON AREA IN NUCLEAR RESEARCH INSTITUTE
 RADIATION MONITORING EXPERIMENT USING THERMOLUMINESCENT DOSIMETER FOR THE TR 19 CYCLOTRON AREA IN NUCLEAR RESEARCH INSTITUTE A. STOCHIOIU, L. CRACIUN, F. MIHAI, I. TUDOR Horia Hulubei National Institute
Radiologic Units: What You Need to Know
 Radiologic Units: What You Need to Know TODD VAN AUKEN M.ED. RT (R)(MR) Agenda Greys, Sieverts, Coulombs per kg, & Becquerel's Conventional Units Other Concepts (LET, Q-Factor, Effective Dose, NCRP Report
45 Hr PET Registry Review Course
 45 HR PET/CT REGISTRY REVIEW COURSE Course Control Document Timothy K. Marshel, MBA, R.T. (R), (N)(CT)(MR)(NCT)(PET)(CNMT) The PET/CT Training Institute, Inc. SNMMI-TS 028600-028632 45hr CEH s Voice Credits
Radiation Exposure to Staff Using PET/CT Facility
 Egyptian J. Nucl. Med., Vol. 8, No. 2, December 2013 1 Editorial Radiation Exposure to Staff Using PET/CT Facility Taalab, Kh; and Mohsen, Z Department of Nuclear Medicine, International Medical Center;
Chapter 4: Radiation Monitoring Instruments
 Chapter 4: Radiation Monitoring Instruments Set of 107 slides based on the chapter authored by G. Rajan, J. Izewska of the IAEA publication (ISBN 92-0-107304-6): Review of Radiation Oncology Physics: A
PERSONNEL MONITORING AND DOSIMETRY POLICIES
 PERSONNEL MONITORING AND DOSIMETRY POLICIES All individuals who are required to have their exposure to ionizing radiation monitored must be trained prior to using the source(s) of radiation. The radioactive
UQ X-ray Safety Training Module
 UQ X-ray Safety Training Module 23 January 2018, v2 1 UQ X-ray Safety Training Module Course Overview: This training module has been developed for workers at the University of Queensland, and forms part
KEYWORDS: positron emission tomography, occupational dose, real time dose monitoring
 A Real-Time Monitoring Study of the Personal Dose Received By Nuclear Medicine Technologists Administering 18 F-FDG in a High Patient Throughput PET Centre Anthony Wallace a1, Paul U a, Kevin Hickson a,
OCCUPATIONAL EXPOSURE IN CANDU NUCLEAR POWER PLANT: INDIVIDUAL DOSIMETRY PROGRAM AT CERNAVODA NPP
 OCCUPATIONAL EXPOSURE IN CANDU NUCLEAR POWER PLANT: INDIVIDUAL DOSIMETRY PROGRAM AT CERNAVODA NPP Catalina Chitu, cchitu@cne.ro, Vasile Simionov, vsimionov@cne.ro CNE Cernavoda NPP, No. 2, Medgidiei Str.
Hand Dose in Nuclear Medicine Staff Members
 Hand Dose in Nuclear Medicine Staff Members T.M.Taha, Amany.Y.Shahein and R.Hassan* Radiation Protection Department, Nuclear Research Center, Atomic Energy Authority * National Cancer Institute, Cairo
MONITORING OF OCCUPATIONAL EXPOSURE AT NUCLEAR FACILITIES
 GUIDE YVL 7.10 / 29 JANUARY 2002 MONITORING OF OCCUPATIONAL EXPOSURE AT NUCLEAR FACILITIES 1 GENERAL 3 2 PROVISIONS OF THE RADIATION ACT AND DECREE 3 3 MONITORING OF RADIATION EXPOSURE 4 3.1 General requirements
SUMMARY OF PERSONAL DOSIMETRY PRACTICIES IN RCA MEMBER COUNTRIES
 A Personal Dosimetry Intercomparison Study in Asian and Pacific Region Hiroyuki MURAKAMI and Fumiaki TAKAHASHI Department of Health Physics, Japan Atomic Energy Research Institute and Richard V. Griffith
3/26/2017. Personal Dosimetry Monitoring and Dose Measurements. Agenda. Dosimetric Terms and Definitions Dose Limits External Dosimetry
 Speaker David Pellicciarini, CHP, MBA Vice President, Pharmacy Safety, Practice and Technical Operations Cardinal Health Nuclear Pharmacy Services david.pellicciarini@cardinalhealth.com Personal Dosimetry
Topic 6 Benefits and drawbacks of using radioactive materials
 Topic 6 Benefits and drawbacks of using radioactive materials CHANGING IDEAS When radioactivity was first discovered in the late 1800s, scientists did not know it was dangerous: o Becquerel handled radioactive
Basic radiation protection & radiobiology
 Basic radiation protection & radiobiology By Dr. Mohsen Dashti Patient care & management 202 Wednesday, October 13, 2010 Ionizing radiation. Discussion issues Protecting the patient. Protecting the radiographer.
Performance of several active personal dosemeters in interventional radiology and cardiology
 Performance of several active personal dosemeters in interventional radiology and cardiology S. Chiriotti 1,*, M. Ginjaume 1, E. Vano 2,3, R. Sanchez 3, J.M. Fernandez 2,3, M.A. Duch 1, J. Sempau 1 1.
Chem 481 Lecture Material 3/11/09
 Chem 481 Lecture Material 3/11/09 Health Physics NRC Dose Limits The NRC has established the following annual dose limits. Organ NRC Limit (mrem/year) Comments Whole Body 5000 (50 msv/yr) Lens of the Eye
PAGE 1 OF 5 HEALTH, SAFETY & ENVIROMENTAL MANUAL PROCEDURE: S560 Radiation Safety REV /14/2012
 PAGE 1 OF 5 RADIATION SAFETY PURPOSE: A wide usage of x-ray machines and isotopes for examination of steel plate fabricated and erected structures require a knowledge of the radiation hazard and the precautionary
Introduction. Chapter 15 Radiation Protection. Advisory bodies. Regulatory bodies. Main Principles of Radiation Protection
 Introduction Chapter 15 Radiation Protection Radiation Dosimetry I Text: H.E Johns and J.R. Cunningham, The physics of radiology, 4 th ed. F.M. Khan, The Physics of Radiation Therapy, 4th ed., Chapter
Option D: Medicinal Chemistry
 Option D: Medicinal Chemistry Basics - unstable radioactive nuclei emit radiation in the form of smaller particles alpha, beta, positron, proton, neutron, & gamma are all used in nuclear medicine unstable
Chapter 4 RADIATION MONITORING INSTRUMENTS
 Chapter 4 RADIATION MONITORING INSTRUMENTS G. RAJAN Medical Physics and Safety Section, Bhabha Atomic Research Centre, Mumbai, Maharashtra, India J. I Z E W S K A Division of Human Health, International
Personal Dosimetry. Radiation Protection Section Department of Medical Physics Colchester Hospital University NHS Foundation Trust
 Personal Dosimetry Radiation Protection Section Department of Medical Physics Colchester Hospital University NHS Foundation Trust Why do we monitor members of staff? The staff dosimetry service of the
An investigation of the effect of ionising radiation on nurses and their patients during dialysis
 International Scholars Journals African Journal of Nursing and Midwifery ISSN 2198-4638 Vol. 2 (7), pp. 548-552, September, 2015. Available online at www.internationalscholarsjournals.org International
a. If dosimeters should be issued; b. What type(s) will be used and; c. The frequency that dosimeters will be exchanged
 will be used and; c. The frequency that dosimeters will be exchanged") Monitoring Criteria for External Radiation RMSO Standard Operating Procedure Risk Management & Safety Main Office, Merica Hall Room 323 Phone: (307) 766-3277 Fax: (307)766-6116 Regulated Materials Management
Monitoring Criteria for External Radiation RMSO Standard Operating Procedure Risk Management & Safety Main Office, Merica Hall Room 323 Phone: (307) 766-3277 Fax: (307)766-6116 Regulated Materials Management
ADVANCES IN RADIATION TECHNOLOGIES IN THE TREATMENT OF CANCER
 ADVANCES IN RADIATION TECHNOLOGIES IN THE TREATMENT OF CANCER Bro. Dr. Collie Miller IARC/WHO Based on trends in the incidence of cancer, the International Agency for Research on Cancer (IARC) and WHO
Radiation Safety Manual
 King Abdulaziz University Faculty of Dentistry Radiation Safety Manual FOR X-RAY EQUIPMENT OPERATORS October 2009 Radioactivity and Radiation All matter in our environment is made of atoms. Most atoms
Site Planning and Design of PET/CT Facilities. Melissa C. Martin, M.S., FACR, FAAPM AAPM Annual Meeting, Orlando, FL August 2, 2006
 Site Planning and Design of PET/CT Facilities Melissa C. Martin, M.S., FACR, FAAPM AAPM Annual Meeting, Orlando, FL August 2, 2006 Acknowledgements: AAPM Task Group #108 on PET and PET/CT Shielding Requirements
Code of Practice for Radiation Protection in Dentistry. Code of Practice For Radiation Protection in Dentistry
 Code of Practice for Radiation Protection in Dentistry Code of Practice For Radiation Protection in Dentistry 10 OCTOBER 2017 CONTENTS 1. INTRODUCTION... 3 1.0 CITATION... 3 1.1 BACKGROUND... 3 1.2 PURPOSE
nuclear science and technology
 EUROPEAN COMMISSION nuclear science and technology Evaluation of Individual Dosimetry in Mixed Neutron and Photon Radiation Fields (EVIDOS) Editor: Helmut Schuhmacher, Physikalisch-Technische Bundesanstalt
Ionizing Radiation. Michael J. Vala, CHP. Bristol-Myers Squibb
 Ionizing Radiation Michael J. Vala, CHP Bristol-Myers Squibb michael.vala@bms.com 732-227-5096 2013 American Industrial Hygiene Association, New Jersey Section, Inc. Course Objectives At the end of this
Neutron Interactions Part 2. Neutron shielding. Neutron shielding. George Starkschall, Ph.D. Department of Radiation Physics
 Neutron Interactions Part 2 George Starkschall, Ph.D. Department of Radiation Physics Neutron shielding Fast neutrons Slow down rapidly by scatter in hydrogenous materials, e.g., polyethylene, paraffin,
Radiation Protection Program Update: The Details. July 2010
 Radiation Protection Program Update: The Details July 2010 Update Topics 2 Changes mandated by Title 10, Code of Federal Regulations, Part 835, Occupational Radiation Protection (10 CFR 835) How changes
Radiotherapy. Marta Anguiano Millán. Departamento de Física Atómica, Molecular y Nuclear Facultad de Ciencias. Universidad de Granada
 Departamento de Física Atómica, Molecular y Nuclear Facultad de Ciencias. Universidad de Granada Overview Introduction Overview Introduction Brachytherapy Radioisotopes in contact with the tumor Overview
RADIATION SAFETY REFRESHER TRAINING FOR AUGUSTA UNIVERSITY USERS OF RADIOACTIVE MATERIAL
 RADIATION SAFETY REFRESHER TRAINING FOR AUGUSTA UNIVERSITY USERS OF RADIOACTIVE MATERIAL Environmental Health and Safety Division Course Content Radiation Safety Radiation Dose Limits and Dosimetry Postings
Digital film dosimetry in radiotherapy and the development of analytical applications software
 University of Wollongong Research Online University of Wollongong Thesis Collection 1954-2016 University of Wollongong Thesis Collections 2005 Digital film dosimetry in radiotherapy and the development
A Novel Concept and Technique for Individual Monitoring for Photon, Beta and Neutron Radiation
 A Novel Concept and Technique for Individual Monitoring for Photon, Beta and Neutron Radiation Christian Wernli, Markus Boschung Paul Scherrer Institute, 5232 Villigen, Switzerland E-mail: Christian.Wernli@psi.ch
Radiation Protection Services in R.Macedonia
 Radiation Protection Services in R.Macedonia Lidija Nikolovska Institute of Public Health Ionizing Radiation Laboratory Skopje, Republic of Macedonia Background - no NPP or research reactors, - limited
The Status and Challenges of External Personal Dosimetry
 The Status and Challenges of External Personal Dosimetry Filip Vanhavere SCK-CEN Introduction 20 years ago Pencil dosemeters Film dosemeters Thermoluminescent dosemeters Personal dosimetry: measuring operational
OPTION I TEST REVIEW
 IB PHYSICS 3 Name: Period: Date: DEVIL PHYSICS BADDEST CLASS ON CAMPUS OPTION I TEST REVIEW s2. This question is about defects of hearing. The graph below shows an audiogram for a person who has not been
Radioactivity. Alpha particles (α) :
 :") Radioactivity It is the property of an element that causes it to emit radiation Discovered by Becquerel (1896) Radiation comes from the nucleus of the atom There are three types of radiation : alpha particles
Radioactivity It is the property of an element that causes it to emit radiation Discovered by Becquerel (1896) Radiation comes from the nucleus of the atom There are three types of radiation : alpha particles
Practice and Risk at Medical Facilities in Agency Operations
 Practice and Risk at Medical Facilities in Agency Operations Igor Gusev Radiation Protection Unit IAEA International Atomic Energy Agency Outline What is medical radiation exposure? Radiation sources and
Y Physics Radiation Measurements and Monitoring
 90 Y Physics Radiation Measurements and Monitoring Mack L. Richard, MS, CHP Indiana University Medical Center Phone: (317) 274-0330 Email: mrichar@iupui.edu What type of measurements are required? Dosage
RADIATION PROTECTION IN DIAGNOSTIC AND INTERVENTIONAL RADIOLOGY. L19: Optimization of Protection in Mammography
 IAEA Training Material on Radiation Protection in Diagnostic and Interventional Radiology RADIATION PROTECTION IN DIAGNOSTIC AND INTERVENTIONAL RADIOLOGY L19: Optimization of Protection in Mammography
Radiation Dosimeters for Foods. Ashish Anand Department of Biological and Agricultural Engineering Texas A&M University
 Radiation Dosimeters for Foods Ashish Anand Department of Biological and Agricultural Engineering Texas A&M University Introduction Interest in food irradiation technology is increasing world-wide. Some
NPTEL NPTEL ONLINE COURSE. NPTEL Online Certification Course (NOC) NPTEL. Theory and Practice of Non Destructive Testing
 NPTEL. Theory and Practice of Non Destructive Testing") NPTEL NPTEL ONLINE COURSE NPTEL Online Certification Course (NOC) NPTEL Theory and Practice of Non Destructive Testing Dr. Ranjit Bauri Dept. of Metallurgical & Materials Engineering IIT Madras, Chennai
NPTEL NPTEL ONLINE COURSE NPTEL Online Certification Course (NOC) NPTEL Theory and Practice of Non Destructive Testing Dr. Ranjit Bauri Dept. of Metallurgical & Materials Engineering IIT Madras, Chennai
Ionizing Radiation. Alpha Particles CHAPTER 1
 CHAPTER 1 Ionizing Radiation Ionizing radiation is radiation that has sufficient energy to remove electrons from atoms. In this document, it will be referred to simply as radiation. One source of radiation
Measurement of Dose to Implanted Cardiac Devices in Radiotherapy Patients
 Measurement of Dose to Implanted Cardiac Devices in Radiotherapy Patients Moyed Miften, PhD Professor and Chief Physicist University of Colorado Chester Reft, PhD Associate Professor University of Chicago
Dollars and Sense: Are We Overshielding Imaging Facilities? Part 2
 Disclosure Dollars and Sense: Are We Overshielding Imaging Facilities? Part 2 Bryon M. Murray, M.S., DABR Paid consultant to NELCO Worldwide Owner, CEO ZapIT! Medical Objectives Understand methods for
Safety Services Guidance. Occupational Noise
 Occupational Noise Key word(s): Occupational noise, sound, hearing, decibel, noise induced hearing loss (NIHL), Noise at Work Regulations 2005 Target audience: Managers and staff with responsibility to
Radiation Safety for New Medical Physics Graduate Students
 Radiation Safety for New Medical Physics Graduate Students John Vetter, PhD Medical Physics Department UW School of Medicine & Public Health Background and Purpose of This Training This is intended as
Nuclear Radiation Today
 CHAPTER 10 13 SECTION Nuclear Changes Nuclear Radiation Today KEY IDEAS As you read this section, keep these questions in mind: Where are some common sources of radiation? What are some beneficial uses
Twelfth Annual Warren K. Sinclair Keynote Address
 THE INFLUENCE OF NCRP ON RADIATION PROTECTION IN THE U.S.: REGULATION AND GUIDANCE Twelfth Annual Warren K. Sinclair Keynote Address Kenneth R. Kase Annual Meeting of NCRP 16 March 2015 1 OUTLINE Introduction
Radiation Safety Bone Densitometer
 Radiation Safety Bone Densitometer Outline I. State Regulations II. Fundamentals of Radiation Safety III. IV. i. Characteristics of x-ray radiation ii. Units of radiation dose iii. Biological effects iv.
Radiation Health Protection Manual
 Bureau of Medicine and Surgery 7700 Arlington Blvd. CH-1 of 12 Apr 2018 Falls Church, VA 22042 NAVMED P-5055 (FEB 2011) Radiation Health Protection Manual This edition includes CH-1 of 12 Apr 2018. DISTRIBUTION
Dental Radiography Core Subject. Digital Radiography
 Dental Radiography Core Subject Digital Radiography Aims: To develop an understanding of the history of digital radiography, the different types of digital x-rays and the advantages and disadvantages of
Trends in Occupational Exposure in Malaysia
 Trends in Occupational Exposure in Malaysia Noriah Mod Ali Secondary Standard Dosimetry Laboratory (SSDL) Malaysian Institute for Nuclear Technology Research (MINT) Bangi, 43000 KAJANG, Selangor Darul
RELIANT HOLDINGS LTD AND ITS AFFILIATES Safety Management System. Preparation: Safety Mgr Authority: CEO Issuing Dept: Safety Page: Page 1 of 5
 Preparation: Safety Mgr Authority: CEO Issuing Dept: Safety Page: Page 1 of 5 Purpose The purpose of this program is to protect employees who may encounter ionizing radiation and its hazards while performing
Multilayer Gafchromic film detectors for breast skin dose determination in vivo
 INSTITUTE OF PHYSICSPUBLISHING Phys. Med. Biol. 47 (2002) N31 N37 PHYSICS INMEDICINE AND BIOLOGY PII: S0031-9155(02)27324-8 NOTE Multilayer Gafchromic film detectors for breast skin dose determination
A Novel Dosimetry System for Military Use in Response of Nuclear Emergencies
 A Novel Dosimetry System for Military Use in Response of Nuclear Emergencies Mirela Kirr 1, Craig Yoder, PhD 1, Chris Passmore, CHP 1 1 Landauer Inc. 2 Science Road, Glenwood IL 60425-1586 USA Abstract.
NASA Crew Personal Active Dosimeters (CPADs) Leveraging Novel Terrestrial Personal Radiation Monitoring Capabilities for Space Exploration
 Leveraging Novel Terrestrial Personal Radiation Monitoring Capabilities for Space Exploration") NASA Crew Personal Active Dosimeters (CPADs) Leveraging Novel Terrestrial Personal Radiation Monitoring Capabilities for Space Exploration TCC Radiation Technologies Event 9/21/16 Martin Leitgab 1) Novel
NASA Crew Personal Active Dosimeters (CPADs) Leveraging Novel Terrestrial Personal Radiation Monitoring Capabilities for Space Exploration TCC Radiation Technologies Event 9/21/16 Martin Leitgab 1) Novel
IMAGES THAT SPEAK ABOUT ERRORS IN PERSONAL DOSIMETER HANDLING AND PARTICULAR SOLUTIONS
 Romanian Reports in Physics, Vol. 68, No. 4, P. 1554 1565, 2016 IMAGES THAT SPEAK ABOUT ERRORS IN PERSONAL DOSIMETER HANDLING AND PARTICULAR SOLUTIONS F. MIHAI, A. STOCHIOIU Horia Hulubei National Institute
X-ray Safety Discussion and Tour for Health Physicists
 X-ray Safety Discussion and Tour for Health Physicists April 1, 2016 Health Physics Society Spring Meeting Jerry Bai Environmental Administrator, Field Operations Bureau of Radiation Control Florida Department
International Conference on Clinical PET and Molecular Nuclear Medicine (IPET 2011)
") IAEA-CN-185 International Conference on Clinical PET and Molecular Nuclear Medicine (IPET 2011) Trends in Clinical PET and Radiopharmaceutical Development 8 11 November 2011 Vienna, Austria Announcement
IAEA-CN-185 International Conference on Clinical PET and Molecular Nuclear Medicine (IPET 2011) Trends in Clinical PET and Radiopharmaceutical Development 8 11 November 2011 Vienna, Austria Announcement
BIOLOGICAL EFFECTS OF
 BIOLOGICAL EFFECTS OF RADIATION Natural Sources of Radiation Natural background radiation comes from three sources: Cosmic Radiation Terrestrial Radiation Internal Radiation 2 Natural Sources of Radiation
radiation monitoring programs Tailored to your needs
 radiation monitoring programs Tailored to your needs Dosimetry Services Division OVERVIEW Mirion Technologies is comprised of five divisions delivering products, services, and solutions in the world of
Development of the Nation-Wide Dosimetric Monitoring Network in Ukraine
 Development of the Nation-Wide Dosimetric Monitoring Network in Ukraine V.Chumak 1, A.Boguslavskaya 2, A.Musijachenko 1 1 Scientific Center for Radiation Medicine AMS Ukraine, 04050 Melnikova, 53, Kiev,
in developing institutional policies, procedures, and /or protocols. The Canadian Society of
 1 TITLE: GUIDELINES FOR RADIATION SAFETY APPROVED; October 2015 REVISION DATE: February 2016 Disclaimer The Canadian Society of Gastroenterology Nurses and Associates present this guideline for use in
Basics of nuclear medicine
 Basics of nuclear medicine Prof. dr. Davor Eterović Prof. dr. Vinko Marković Radioisotopes are used both in diagnostics and in therapy Diagnostics gamma emitters are used since gamma rays can penetrate
INSTRUMENTS. Personal alarm dosimeter 120 Survey meters 122 Beta secondary standard 123
 INSTRUMENTS This section shows a range of state-of-the-art surface contamination monitors, survey dosimeters and personal alarm dosimeters from approved manufacturers. Personal alarm dosimeter 120 Survey
GAFCHROMIC MD-55 RADIOCHROMIC DOSIMETRY FILM FOR HIGH-ENERGY PHOTONS CONFIGURATION, SPECIFICATIONS AND PERFORMANCE DATA
 GAFCHROMIC MD-55 RADIOCHROMIC DOSIMETRY FILM FOR HIGH-ENERGY PHOTONS CONFIGURATION, SPECIFICATIONS AND PERFORMANCE DATA DESCRIPTION GAFCHROMIC MD-55 radiochromic dosimetry film is designed for the measurement
Use of Bubble Detectors to Characterize Neutron Dose Distribution in a Radiotherapy Treatment Room used for IMRT treatments
 Use of Bubble Detectors to Characterize Neutron Dose Distribution in a Radiotherapy Treatment Room used for IMRT treatments Alana Hudson *1 1 Tom Baker Cancer Centre, Department of Medical Physics, 1331
U.S. DEPARTMENT OF ENERGY LABORATORY ACCREDITATION PROGRAM (DOELAP) FOR PERSONNEL DOSIMETRY SYSTEMS
 FOR PERSONNEL DOSIMETRY SYSTEMS") U.S. DEPARTMENT OF ENERGY LABORATORY ACCREDITATION PROGRAM (DOELAP) FOR PERSONNEL DOSIMETRY SYSTEMS F. M. Cummings ^ R. D. Carlson^ R. M. Loesch INTRODUCTION Accreditation of personnel dosimetry systems
U.S. DEPARTMENT OF ENERGY LABORATORY ACCREDITATION PROGRAM (DOELAP) FOR PERSONNEL DOSIMETRY SYSTEMS F. M. Cummings ^ R. D. Carlson^ R. M. Loesch INTRODUCTION Accreditation of personnel dosimetry systems
Neutrons. ρ σ. where. Neutrons act like photons in the sense that they are attenuated as. Unlike photons, neutrons interact via the strong interaction
 Neutrons Neutrons act like photons in the sense that they are attenuated as I = I 0 e μx where Unlike photons, neutrons interact via the strong interaction μ = The cross sections are much smaller than
The activity. Suggested Answers
 Teacher notes Introduction This activity encourages students to consider the principles of radiation protection and how they might apply in the nuclear industry and in medicine. They discuss and answer
The x-rays produced penetrate the body which absorbs, refracts, or reflects the x-ray beam energy depending on the tissue. Bone
 Authors Sari Cohen, Poh Yan Lim, Merng Koon Wong, Siew Hong Lau, Donna Russell-Larson 1.6.2 Image intensifier Poh Yan Lim, Merng Koon Wong The discovery of x-rays had a profound impact on the diagnosis
Hong Kong Association of Medical Physics. Guide to Candidates
 Hong Kong Association of Medical Physics Certification of Medical Physicists Professional Assessment Guide to Candidates PA App Form (r2017.1) Contents Chapter 1 p. 3 Professional Assessment System and
Mobile PET Center Project
 Journal of Physics: Conference Series PAPER OPEN ACCESS Mobile PET Center Project To cite this article: O Ryzhikova et al 2017 J. Phys.: Conf. Ser. 784 012051 View the article online for updates and enhancements.
Recent Achievements in External Radiation Dosimetry A. Delgado CIEMAT Radiation Dosimetry Unit Avda Complutense 22, Madrid, Spain
 Topical Session TS 1.1.1 External Exposure to Ionizing Radiation Keynote Lecture: Recent Achievements in External Radiation Dosimetry A. Delgado CIEMAT Radiation Dosimetry Unit Avda Complutense 22, 28040
TLD as a tool for remote verification of output for radiotherapy beams: 25 years of experience
 IAEA-CN-96-82 TLD as a tool for remote verification of output for radiotherapy beams: 25 years of experience J. Francisco Aguirre, Ramesh C. Tailor, Geoffrey S. Ibbott, Marilyn Stovall and William F. Hanson
RADIATION MANAGEMENT PLAN EXPLANATORY NOTE
 AS/NZS 4801 OHSAS 18001 OHS20309 SAI Global RADIATION MANAGEMENT PLAN EXPLANATORY NOTE This template is a guide to development of a local Radiation Management Plan for organisational units that use ionising
Validation of the MEDRAD Intego PET Infusion System in the Clinical Nuclear Medicine Setting
 Validation of the MEDRAD Intego PET Infusion System in the Clinical Nuclear Medicine Setting Mark Weir BSc, MRT(N), CTIC(N) C. Vollrath BSc, CRPA(R) A. Bonnell OT Reg. (On.) CRPA Saskatoon - 2017 1 Disclaimer
Before taking field measurements, it is important to determine the type of information required. The person making the measurement must understand:
 Why measure noise in the workplace? Measuring noise levels and workers' noise exposures is the most important part of a workplace hearing conservation and noise control program. It helps identify work
Medical Physics 4 I3 Radiation in Medicine
 Name: Date: 1. This question is about radiation dosimetry. Medical Physics 4 I3 Radiation in Medicine Define exposure. A patient is injected with a gamma ray emitter. The radiation from the source creates
PHYS 383: Applications of physics in medicine (offered at the University of Waterloo from Jan 2015)
") PHYS 383: Applications of physics in medicine (offered at the University of Waterloo from Jan 2015) Course Description: This course is an introduction to physics in medicine and is intended to introduce
PHYS 383: Applications of physics in medicine (offered at the University of Waterloo from Jan 2015) Course Description: This course is an introduction to physics in medicine and is intended to introduce
Radon Gas & What You Need to Know. Bob Caskanette, B.A.Sc., CEC, CAQS, CRS, CIEC, C.E.T., EP (C-NRPP Certified) Caskanette Udall Consulting Engineers
 Caskanette Udall Consulting Engineers") Radon Gas & What You Need to Know Bob Caskanette, B.A.Sc., CEC, CAQS, CRS, CIEC, C.E.T., EP (C-NRPP Certified) Caskanette Udall Consulting Engineers What is Radon? Naturally occurring radioactive soil
Radon Gas & What You Need to Know Bob Caskanette, B.A.Sc., CEC, CAQS, CRS, CIEC, C.E.T., EP (C-NRPP Certified) Caskanette Udall Consulting Engineers What is Radon? Naturally occurring radioactive soil
Table of Contents. Introduction 3. Background 4
 Training manual Table of Contents Introduction 3 Background 4 What are X-rays? 4 How are X-rays Generated? 5 Primary and Scatter Radiation 6 Interactions with Matter 6 Biological Effects of Radiation 7
COMENIUS-Project: SM&CLIL Radiation & Medicine
 Medical imaging refers to the techniques and processes used to create images of the human body (or parts thereof) for clinical purposes. Thanks to modern mathematics and computer technology, medical imaging
SafeTview Syringe Shields Models to Latchkey Syringe Shields Models to Nuclear Medicine. Specifications.
 SafeTview Syringe Shields Models 56-342 to 56-345! Best shielding syringe shield with a window. Window is reset into offset solid tungsten barrel to prevent shine-through as occurs with other designs!
Section 7 ALARA Program
 Page 7-1 Section 7 ALARA Program Contents A. ALARA Principle... 7-2 1. Biological Basis... 7-2 2. Applied Practices... 7-3 3. Operational Dose Limits... 7-3 4. Collective Dose... 7-3 B. Radiation Safety
Radiation Safety Guide. Analytical X-Ray Equipment
 Radiation Safety Guide Analytical X-Ray Equipment Table of Content Page 1. Radiation 2 A. Radiation Quantities 2 B. Background Radiation 2 C. Biological Effect of Radiation 3 D. Radiation Injury To The
Staff Exposure Monitoring in Interventional Radiology
 Conference on Physics in Medicine: From Diagnosis to Treatment "Enhancing safety and quality in radiation medicine". KFMC, Riyadh 7-9 November 2017 Staff Exposure Monitoring in Interventional Radiology
Bureau of Laboratory Quality Standards
 1. Condom -Lubricant ISO 4074:2002/Cor.1:2003 Annex C -Thickness ISO 4074:2002/Cor.1:2003 Annex F - Length ISO 4074:2002 / Cor1 : 2003 - Width ISO 4074 : 2002/Cor 1 : 2003 - Bursting pressure and Volume
Medical dosimetry using Optically Stimulated Luminescence dots and microstar readers
 Medical dosimetry using Optically Stimulated Luminescence dots and microstar readers Christopher A Perks *a, Cliff Yahnke b, Marc Million c a LANDAUER EUROPE, Unit 28, Bankside, Station Approach, Kidlington,
Results of dose control and measurement plans applied for SPEAR3 commissioning year (FY04)
") SLAC-PUB-12309 February 2007 Results of dose control and measurement plans applied for SPEAR3 commissioning year (FY04) Hesham Khater, James Liu, Alyssa Prinz, Jim Allan and Sayed Rokni Radiation Protection
SLAC-PUB-12309 February 2007 Results of dose control and measurement plans applied for SPEAR3 commissioning year (FY04) Hesham Khater, James Liu, Alyssa Prinz, Jim Allan and Sayed Rokni Radiation Protection
ROPES eye plaque dosimetry: commissioning and verification of an ophthalmic brachytherapy treatment planning system
 University of Wollongong Research Online Faculty of Engineering and Information Sciences - Papers: Part A Faculty of Engineering and Information Sciences 2013 ROPES eye plaque dosimetry: commissioning