Comparison of ESI-MS Spectra in MassBank Database
|
|
|
- Amberlynn McCormick
- 6 years ago
- Views:
Transcription
1 BMEI 2008 Comparison of ESI-MS Spectra in MassBank Database Hisayuki Horai 1,2, Masanori Arita 1,2,3,4, Takaaki Nishioka 1,2 1 IAB, Keio Univ., 2 JST-BIRD, 3 Univ. of Tokyo, 4 RIKEN PSC 1
2 Table of Contents Metabolomics, Mass Spectrometry & Spectral Database Spectral Search by Similarity Vector Space Model Evaluation of Relevance MS/MS Spectra Search of Metabolites 2
3 Metabolomics & Mass Spectrometry Measurement of Metabolites Identification & Quantification + Intensity + Fragment Ion + + Precursor Ion 0 m/z Identification by Similarity of Peak Pattern mass-to-charge(number)-ratio 3
4 MassBank Mass Spectral Database for Identification of Metabolites Comprehensive Collection Metabolites, Drugs, Agrichemicals,... EI-MS, ESI-MS, MS/MS, XC/MS,... Various Experimental Conditions Distributed Database on Internet Cloud Computing Environment for Users Quality Control of Data at Contributor's Site Open to Public Variation of Resolution Sensitivity Fragmentation... Distributed Search Public Free Access via Internet Provide Software as Freeware (Server, DB System, Search Engine,...) 4

5 Collaboration in MassBank 2008/05/09 Copyright 2008, Hisayuki Horai, All Rights Reserved. 5
6 Spectral Search Most Important Function of Spectral Database 6
7 Spectral Search by Similalrity Based on Vector Space Model Search Based on Vector Space Model: Already Established Search Method Information Retrieval (e.g. Google, PubMed,...) Low Resolution (Integer) m/z Spectral Search for EI-MS Translate Spectrum to Vector Axis for m/z of Peak Element of Vector: Intensity of Peak Similarity of 2 Spectra = Cosine of Vectors Query q Target d 0 θ (1) - (6): m/z q1 - q5, d1 - d6: Intensity d1 q1 d2 Spectrum s2 (1) (2) (3) (4) (5) (6) q3 Spectrum s1 d4 q4 q = q + Score( s1, s2) d q = q1 d1 + q4 d q3 + q4 q 5 = cosθ = d = d1 + d2 + d4 + d5 2 2 q5 Score( q, d) = cosθ = s1 s2 s1 d6 s2 (q1, 0, q3, q4, q5, 0) Inner Product Length q d q d (d1, d2, 0, d4, 0, d5) Dimension = 6 7
8 Weighting & Normalization Spectral Vector: (..., V i,... ) Relative Intensity "Intensity must be normalized by Largest Peak." Vi = Intensity / max(intensity) Improvement for Better Search Importance of Large Ion "Large m/z may be specific for a compound." Vi = Relative Intensity (m/z) n [ n > 1 ] Importance of Intensity "Small peaks should not be ignored." Vi = (Relative Intensity) m (m/z) n [ n > 1, 0 < m < 1 ] 8
9 Spectral Search of Real Number m/z Introduce Tolerance of m/z to Match Peaks in Different Spectra Peaks within Tolerance are Compiled into an Axis "Different Peak Hit Problem" and "Same Peak Hit Problem" q1 q3 q4 q5 (q1, 0, q3, q4, q5, 0) Query q d1 d2 d4 d6 (d1, d2, 0, d4, 0, d5) Target d 0 (1) - (6): m/z q1 - q5, d1 - d6: Intensity (1) (2) (3) (4) (5) (6) Dimension = 6 9
10 Different Peak Hit Problem q1 (..., q1,...) Query q d1 d2 What is Element d of Vector d? (...,???,...) Target d 0 q1, d1, d2: Intensity Choice of Solution: Largest, Smallest Average, Total Nearest m/z... Select Largest Peak in MassBank 10
11 Same Peak Hit Problem q1 q2 Query q d1 q1 and q2: 1 Axis or 2 Axes? If 1Axis, What is Element of Vector q? If 2 Axes, What are 2 Elements of Vector d? Target d 0 q1, q2, d1:intensity 2 Axes & Duplicated Use of Hit Peak in Target in MassBank: q = (..., q1, q2,... ) d = (..., d1, d1,... ) 11
12 Variety of Spectral Search Variety of Weighting & Normalization Variety of Real Number m/z Search Tolerance Solution for Different Peak Hit Problem Solution for Same Peak Hit Problem Variety of Practical Parameters 12
13 Spectral Search in MassBank - Default Setting - Weighting & Normalization: sqrt(relative Intensity) m/z / 10 where Relative Intensity = 1000 * Intensity / max(intensity) Tolerance:0.3 Choose Effective Peaks (Ignore Noise Peaks): Upper Bound of m/z: Ignore Peak when m/z 1000 Lower Bound of Intensity: Ignore Peak when Relative Intensity < 5 Lower Bound of Number of Hit Peaks: # Effective Peaks of Query 3: Ignore Target when # of Hit Peaks 3 # Effective Peaks of Query < 3: Ignore Target unless all Effective Peaks are Hit 13

14 Spectral Search in MassBank Red: Exact Hit Pink: Hit within Tolerance 3D View Select & Search Queries Selected Results Selected Query Ranked List of Search Results for Selected Query 14
15 Variety of Spectral Search Variety of Weighting & Normalization Variety of Real Number m/z Search Tolerance Solution for Different Peak Hit Problem Solution for Same Peak Hit Problem Variety of Practical Parameters Optimization of Search Method Depends on Target Set Based on Systematic Evaluation for Real Data 15
16 Evaluation of Relevance Identification of Metabolites 16
17 MS/MS Spectra MS/MS: Fragmentation Depend on Machine & Collision Energy Difficulty of MS/MS Spectral Search Needs for Comprehensive Collection Different Machine Different Collision Energy 2008/05/09 Copyright 2008, Hisayuki Horai, All Rights Reserved. 17
18 MS/MS Spectra in MassBank Contributor: Keio Univ. QqQ MS/MS Spectra Low Resolution 861 Metabolites 4,205 Spectra (1-to-5 Spectra for 1 Metabolites) QqTOF MS/MS Spectra High Resolution 898 Metabolites 4,431 Spectra (2-to-5 Spectra for 1 Metabolites) 18
19 Evaluation Method For each Machine, Leave-one-out Test Test-1: QqQ Spectra Test-2: QqTOF Spectra For both Machines, Test-3: Query = QqQ, Target = QqTOF Test-4: Query = QqTOF, Target = QqQ Evaluation Index Precision & Recall Best Ranking of True Positive "Cross" Search 19
20 Precision & Recall Correct Answer = Spectrum of Same Metabolite as Query Results Targets Correct Answers P (Positive): Results N (Negative):not Results T (True): Success F (False): Mistake FP TP FN Targets are Divided into 4 Groups (FN, FP, TN, TP) for a Query. TN Precision = TP / (TP + FP) Recall = TP / (TP + FN) 20
21 Evaluation of Score Based Search Method Introduce Threshold of Score : Th Select Results where score Th Set of Results Depends on Th Tradeoff between Recall and Precision: Th Positive Recall & Precision Th Positive Recall & Precision precision Plot Precision-Recall Curve when Th is Shifted between 0 and 1. recall 21
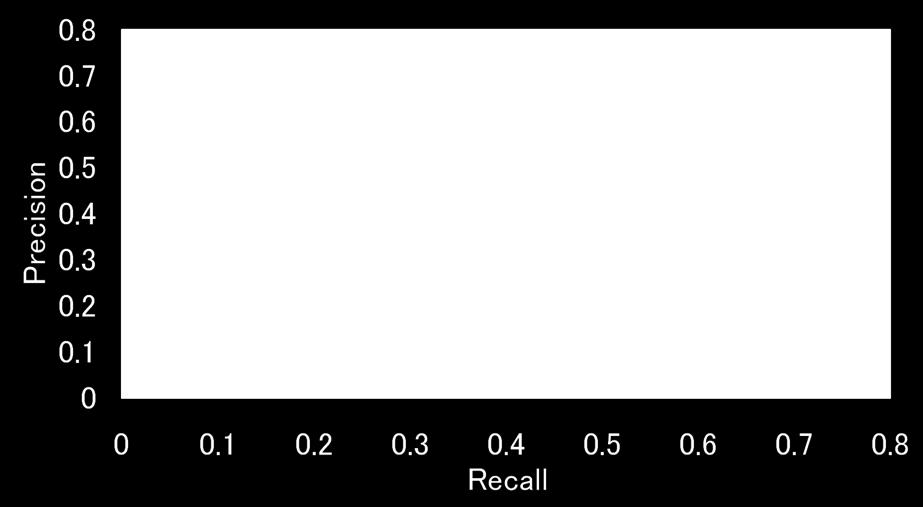
22 Precision-Recall Graph 22

23 Best Rank of True Positive 23
24 Relevance of MS/MS Spectral Search Top 1 has High Relevance Top 1 is True Positive for 30% of all Queries Average of Best Rank of True Positive [BRTP] is Less than 2! Top 2 has High Relevance but BRTP 2 is Rare Case If Top 2 is True Positive, then Top1 might be True Positive! If Top 1 & Top2 are same Metabolites, then Relevance is Very High! Relativity between Rank & Score Top 1 is True / False Score is High / Low Ignoring Precision, QqTOF hits More than QqQ Tolerance of m/z Affects Relevance Tolerance Recal Tolerance Precision (Especially, for QqTOF) 2008/05/09 Copyright 2008, Hisayuki Horai, All Rights Reserved. Importance of Rank 24
25 Relevane of "Cross" Search Q QTof:Query = QqQ, Target = QqTOF (test-3) QTof Q: Query = QqTof, Target = QqQ (test-4) Q Tof is Better than Tof Q High Resolution Spectral Database is Useful for Low Resolution MS Users, too! Better than test-1 and test-2 Difference of Machine is Less Important than Difference of Collision Energy! Effectiveness of MS/MS Database of Various Machines 2008/05/09 Copyright 2008, Hisayuki Horai, All Rights Reserved. 25
26 Conclusions Search Method based on Vector Space Model High Resolution (Real Number) m/z Spectra Weighting & Normalizing using m/z & Intensity Evaluation of MS Database of Metabolites Importance of High Resolution Spectra Effectiveness for Collecting Various Spectra by Different Machine under Different Experimental Condition 26


27 Future Plan Metabolome Integrated Database MassBank is an Important Part of Metabolome Integrated Database FlavonoidViewer Metabolome Passway DB MassBank LipidBank KNApSAcK Species-Metabolite Relationship DB 2008/05/09 Copyright 2008, Hisayuki Horai, All Rights Reserved. Comprehensive Lipid DB 27
28 Acknowledgements Special Thanks to Following Collaborators... IAB, Keio Univ. Y.Nihei, T.Ikeda, Y.Ojima, R.Matsuzawa, T.Soga, Y.Kakazu Grad.Sch.Frontier Sc., Univ. of Tokyo K.Suwa, M.Yoshimoto Bioinfo.&Genomics, NAIST S.Kanaya, Y.Shimbo RIKEN PSC K.Saito, F.Matsuda, A.Oikawa, M.Kusano, A.Fukushima, T.Sakurai, K.Akiyama Grad.Sch.Med., Univ. of Tokyo R.Taguchi Dept.Sci., Nara Women T.Takeuchi Nishiwaki Lab., JCL Bioassay Inc. Z.Tozuka Kazusa DNA Lab. T.Ara Leibniz Inst. Plant BIochem. S.Neumann This work is supported by BIRD-JST and Grant-in-Aid for Scientific Research on Priority Areas "Systems Genomics" from MEXT of Japan. 2008/05/09 Copyright 2008, Hisayuki Horai, All Rights Reserved. 28
29 We would appreciate it very much if you could contribute spectra of metabolites and natural products to MassBank. URL: iab.keio.ac.jp
30 (Supplemental) 30
31 Evaluation for Single Correct Set Divide Correct Set into Target and Query k-fold Cross Validation Divide Correct set into k Subsets(S 1,... S k ) For all i, Query = S i, Target = Union of Other Subsets Calculate Average & Variance of Evaluation Index e.g. 2CV(k = 2),10CV(k = 10) Leave-one-out For all Element x of Correct Set, Query = { x }, Target = Rest of Correct Set Equivalent to k-fold Cross Validation where k is Number of Elements Useful when Correct Set is Small Random Sampling Query = Select k Elements Randomly, Target = Rest of Correct Set Repeat Enough Times of Evaluation 31
32 Index of Relevance Recall (Sensitivility) = TP / (TP + FN) Precision = TP / (TP + NP) Accuracy = (TP + FN) / (TP + TN + FP + FN) Fallout (Specificity) = TN / (TN + FP) Generality = TP / (TP + TN + FP + FN) Targets Results FP TP Correct Answers FN TN 32
33 Free from Tradeoff between Recall & Precision Area Measurement Break Even Point Value where Precision = Recall Average Precision of Eleven Point Average of Precisions where Recall are 0.0, 0.1, 0.2,..., 0.9, 1.0 Maximum F-measure = max(2 R P / (R + P)) precision recall F-measure = Harmonic Average of Recall and Precision 33
34 Evaluation Index by Ranking Average Precision Average of Precision for each True Positive Ex.:(1/1 + 2/4) / 2 = 0.75 Mean Reciprocal Rank (MRR) Average of Inverse of Rank for each True Positive 例 :(1/1 + 1/4) / 2 = Discounted Cumulative Gain (DCG) Cumulate 1 / log 2 (r + 1) for each True Positive (r:rank) 例 :1/log /log 2 5 = Ex. 1:T 2:F 3:F 4:T 5:F 6:F 34
35 Evaluation Index for Best True Positive Precision of Top Ranker Analogy of Average Precision Inverse of Best Ranking of True Positive Analogy of Mean Reciprocal Rank e.g.:top1~4:false, Top5:True 1/5 =
36 Why Cross Search is Better in High Threshold Area? Nearest Spectrum of Different Energy in Same Machine is Far from Nearest Spectrum in Different Machine QqTOF QqQ Limitation of Leave-one-out Test 36
37 37
MassBank User s Manual
 MassBank User s Manual Version 2.4, 7 February 2012 Copyright 2006 MassBank Project CONTENTS 1. Introduction... 3 1.1 Overview of the Database Services... 3 1.2 System Requirements... 3 2. Searching for
Feature selection methods for early predictive biomarker discovery using untargeted metabolomic data
 Feature selection methods for early predictive biomarker discovery using untargeted metabolomic data Dhouha Grissa, Mélanie Pétéra, Marion Brandolini, Amedeo Napoli, Blandine Comte and Estelle Pujos-Guillot
LC/MS/MS SOLUTIONS FOR LIPIDOMICS. Biomarker and Omics Solutions FOR DISCOVERY AND TARGETED LIPIDOMICS
 LC/MS/MS SOLUTIONS FOR LIPIDOMICS Biomarker and Omics Solutions FOR DISCOVERY AND TARGETED LIPIDOMICS Lipids play a key role in many biological processes, such as the formation of cell membranes and signaling
Metabolite identification in metabolomics: Database and interpretation of MSMS spectra
 Metabolite identification in metabolomics: Database and interpretation of MSMS spectra Jeevan K. Prasain, PhD Department of Pharmacology and Toxicology, UAB jprasain@uab.edu utline Introduction Putative
METABOSCAPE A METABOLITE PROFILING PIPELINE DRIVEN BY AUTOMATIC COMPOUND IDENTIFICATION
 METABOSCAPE A METABOLITE PROFILING PIPELINE DRIVEN BY AUTOMATIC COMPOUND IDENTIFICATION OR W TO LINK HRAM QTOF PLANT METABOLOMICS DATA TO BIOLOGY Aiko Barsch, Bruker Daltonics, Bremen, Germany 1 Outline
MASS SPECTROMETRY BASED METABOLOMICS. Pavel Aronov. ABRF2010 Metabolomics Research Group March 21, 2010
 MASS SPECTROMETRY BASED METABOLOMICS Pavel Aronov ABRF2010 Metabolomics Research Group March 21, 2010 Types of Experiments in Metabolomics targeted non targeted Number of analyzed metabolites is limited
Welcome! Mass Spectrometry meets Cheminformatics WCMC Metabolomics Course 2014 Tobias Kind. Course: Search of MS/MS files with the NIST MS Search GUI
 Biology Informatics Chemistry Welcome! Mass Spectrometry meets Cheminformatics WCMC Metabolomics Course 2014 Tobias Kind Course: Search of MS/MS files with the NIST MS Search GUI http://fiehnlab.ucdavis.edu/staff/kind
Library identifications for Lemnaceae
 Library identifications for Lemnaceae NP-001984 ESI+ NP-001984 present in, enriched in (15.47min) NP-001984 -MS^E CH 3 Moupinamide H NH NP-005512 + NP-016675 ESI- s NP-005512 NP-016675 NP-005512 present
Probability-Based Protein Identification for Post-Translational Modifications and Amino Acid Variants Using Peptide Mass Fingerprint Data
 Probability-Based Protein Identification for Post-Translational Modifications and Amino Acid Variants Using Peptide Mass Fingerprint Data Tong WW, McComb ME, Perlman DH, Huang H, O Connor PB, Costello
Metabolite identification in metabolomics: Metlin Database and interpretation of MSMS spectra
 Metabolite identification in metabolomics: Metlin Database and interpretation of MSMS spectra Jeevan K. Prasain, PhD Department of Pharmacology and Toxicology, UAB jprasain@uab.edu Outline Introduction
Introducing.. PIKA (Ochotona princeps)
") Introducing.. PIKA (Ochotona princeps) Pikas are hearty little mammals who live in rock piles high in the mountains of western North America. PIKA, or Peak Integration by Key Analysis is a software tool
Introducing.. PIKA (Ochotona princeps) Pikas are hearty little mammals who live in rock piles high in the mountains of western North America. PIKA, or Peak Integration by Key Analysis is a software tool
Quadrupole and Ion Trap Mass Analysers and an introduction to Resolution
 Quadrupole and Ion Trap Mass Analysers and an introduction to Resolution A simple definition of a Mass Spectrometer A Mass Spectrometer is an analytical instrument that can separate charged molecules according
Comparing Multifunctionality and Association Information when Classifying Oncogenes and Tumor Suppressor Genes
 000 001 002 003 004 005 006 007 008 009 010 011 012 013 014 015 016 017 018 019 020 021 022 023 024 025 026 027 028 029 030 031 032 033 034 035 036 037 038 039 040 041 042 043 044 045 046 047 048 049 050
Top 10 Tips for Successful Searching ASMS 2003
 Top 10 Tips for Successful Searching I'd like to present our top 10 tips for successful searching with Mascot. Like any hit parade, we will, of course, count them off in reverse order 1 10. Don t specify
SWATH Acquisition Enables the Ultra-Fast and Accurate Determination of Novel Synthetic Opioids
 SWATH Acquisition Enables the Ultra-Fast and Accurate Determination of Novel Synthetic Opioids Data Independent Acquisition on TripleTOF and X-Series QTOF Systems for Seized Drug Analysis Oscar G. Cabrices
Metabolomic and Proteomics Solutions for Integrated Biology. Christine Miller Omics Market Manager ASMS 2015
 Metabolomic and Proteomics Solutions for Integrated Biology Christine Miller Omics Market Manager ASMS 2015 Integrating Biological Analysis Using Pathways Protein A R HO R Protein B Protein X Identifies
Review. Imagine the following table being obtained as a random. Decision Test Diseased Not Diseased Positive TP FP Negative FN TN
 Outline 1. Review sensitivity and specificity 2. Define an ROC curve 3. Define AUC 4. Non-parametric tests for whether or not the test is informative 5. Introduce the binormal ROC model 6. Discuss non-parametric
AB Sciex QStar XL. AIMS Instrumentation & Sample Report Documentation. chemistry
 Mass Spectrometry Laboratory AIMS Instrumentation & Sample Report Documentation AB Sciex QStar XL chemistry UNIVERSITY OF TORONTO AIMS Mass Spectrometry Laboratory Department of Chemistry, University of
Improved Intelligent Classification Technique Based On Support Vector Machines
 Improved Intelligent Classification Technique Based On Support Vector Machines V.Vani Asst.Professor,Department of Computer Science,JJ College of Arts and Science,Pudukkottai. Abstract:An abnormal growth
MS/MS Library Creation of Q-TOF LC/MS Data for MassHunter PCDL Manager
 MS/MS Library Creation of Q-TOF LC/MS Data for MassHunter PCDL Manager Quick Start Guide Step 1. Calibrate the Q-TOF LC/MS for low m/z ratios 2 Step 2. Set up a Flow Injection Analysis (FIA) method for
MASS SPECTROMETRY IN METABOLOMICS
 For personal use only. Please do not reuse or reproduce without the author s permission MASS SPECTRMETRY IN METABLMICS Pavel Aronov Stanford Mass Spectrometry Users Meeting August 21, 2008 rigin of Metabolomics
Efficient AUC Optimization for Information Ranking Applications
 Efficient AUC Optimization for Information Ranking Applications Sean J. Welleck IBM, USA swelleck@us.ibm.com Abstract. Adequate evaluation of an information retrieval system to estimate future performance
SYNAPT G2-S High Definition MS (HDMS) System
 System") SYNAPT G2-S High Definition MS (HDMS) System High performance, versatility, and workflow efficiency of your MS system all play a crucial role in your ability to successfully reach your scientific and business
SYNAPT G2-S High Definition MS (HDMS) System High performance, versatility, and workflow efficiency of your MS system all play a crucial role in your ability to successfully reach your scientific and business
Simple Cancer Screening Based on Urinary Metabolite Analysis
 FEATURED ARTICLES Taking on Future Social Issues through Open Innovation Life Science for a Healthy Society with High Quality of Life Simple Cancer Screening Based on Urinary Metabolite Analysis Hitachi
Characterization of an Unknown Compound Using the LTQ Orbitrap
 Characterization of an Unknown Compound Using the LTQ rbitrap Donald Daley, Russell Scammell, Argenta Discovery Limited, 8/9 Spire Green Centre, Flex Meadow, Harlow, Essex, CM19 5TR, UK bjectives unknown
METHODS FOR DETECTING CERVICAL CANCER
 Chapter III METHODS FOR DETECTING CERVICAL CANCER 3.1 INTRODUCTION The successful detection of cervical cancer in a variety of tissues has been reported by many researchers and baseline figures for the
Mass Spectrometry Infrastructure
 Mass Spectrometry Infrastructure Todd Williams, Ph.D. Director KU Mass Spectrometry and Analytical Proteomics Laboratory Mass Spectrometry Lab B025 Malott Hall Mission The Mass Spectrometry and analytical
COMP90049 Knowledge Technologies
 COMP90049 Knowledge Technologies Introduction Classification (Lecture Set4) 2017 Rao Kotagiri School of Computing and Information Systems The Melbourne School of Engineering Some of slides are derived
Proteomics of body liquids as a source for potential methods for medical diagnostics Prof. Dr. Evgeny Nikolaev
 Proteomics of body liquids as a source for potential methods for medical diagnostics Prof. Dr. Evgeny Nikolaev Institute for Biochemical Physics, Rus. Acad. Sci., Moscow, Russia. Institute for Energy Problems
Quantitation by High Resolution Mass Spectrometry: Case Study of TOF MS for the Quantitation of Allopurinol from Human Plasma
 Quantitation by High Resolution Mass Spectrometry: Case Study of TOF MS for the Quantitation of Allopurinol from Human Plasma Shaokun Pang 1, Weixing Sun 2, Adrien Musuku 2, Xavier J. Misonne 1 1 SCIEX,
INTRODUCTION TO MACHINE LEARNING. Decision tree learning
 INTRODUCTION TO MACHINE LEARNING Decision tree learning Task of classification Automatically assign class to observations with features Observation: vector of features, with a class Automatically assign
Knowledge Discovery and Data Mining. Testing. Performance Measures. Notes. Lecture 15 - ROC, AUC & Lift. Tom Kelsey. Notes
 Knowledge Discovery and Data Mining Lecture 15 - ROC, AUC & Lift Tom Kelsey School of Computer Science University of St Andrews http://tom.home.cs.st-andrews.ac.uk twk@st-andrews.ac.uk Tom Kelsey ID5059-17-AUC
LC/QTOF Discovery of Previously Unreported Microcystins in Alberta Lake Waters
 LC/QTOF Discovery of Previously Unreported Microcystins in Alberta Lake Waters Ralph Hindle Vogon Laboratory Services Ltd. Cochrane, Alberta, Canada Xu Zhang David W. Kinniburgh Alberta Centre for Toxicology
New Developments in LC-IMS-MS Proteomic Measurements and Informatic Analyses
 New Developments in LC-IMS-MS Proteomic Measurements and Informatic Analyses Erin Shammel Baker Kristin E. Burnum-Johnson, Xing Zhang, Cameron P. Casey, Yehia M. Ibrahim, Matthew E. Monroe, Tao Liu, Brendan
MALDI Activity 4 MALDI-TOF Mass Spectrometry: Data Analysis
 MALDI Activity 4 MALDI-TOF Mass Spectrometry: Data Analysis Model 1: Introduction to Triacylglycerides (TAGs) In MALDI Activity 3 you learned how to open your raw mass spectrum data and use the MMass program
Terminology. Metabo*omics
 Terminology Metabolite: substance produced or used during metabolism such as lipids, sugars and amino acids Metabolome: the quantitative complement of all the low molecular weight molecules present in
Metabolomics: quantifying the phenotype
 Metabolomics: quantifying the phenotype Metabolomics Promises Quantitative Phenotyping What can happen GENOME What appears to be happening Bioinformatics TRANSCRIPTOME What makes it happen PROTEOME Systems
Data Mining in Bioinformatics Day 4: Text Mining
 Data Mining in Bioinformatics Day 4: Text Mining Karsten Borgwardt February 25 to March 10 Bioinformatics Group MPIs Tübingen Karsten Borgwardt: Data Mining in Bioinformatics, Page 1 What is text mining?
Choosing the metabolomics platform
 Choosing the metabolomics platform Stephen Barnes, PhD Department of Pharmacology & Toxicology University of Alabama at Birmingham sbarnes@uab.edu Challenges Unlike DNA, RNA and proteins, the metabolome
Sensitivity, Specificity, and Relatives
 Sensitivity, Specificity, and Relatives Brani Vidakovic ISyE 6421/ BMED 6700 Vidakovic, B. Se Sp and Relatives January 17, 2017 1 / 26 Overview Today: Vidakovic, B. Se Sp and Relatives January 17, 2017
Derivative-Free Optimization for Hyper-Parameter Tuning in Machine Learning Problems
 Derivative-Free Optimization for Hyper-Parameter Tuning in Machine Learning Problems Hiva Ghanbari Jointed work with Prof. Katya Scheinberg Industrial and Systems Engineering Department Lehigh University
Discovery Metabolomics - Quantitative Profiling of the Metabolome using TripleTOF Technology
 ANSWERS FOR SCIENCE. KNOWLEDGE FOR LIFE. Discovery Metabolomics - Quantitative Profiling of the Metabolome using TripleTOF Technology Baljit Ubhi Ph.D ASMS Baltimore, June 2014 What is Metabolomics? Also
OMCL Network of the Council of Europe QUALITY MANAGEMENT DOCUMENT
 OMCL Network of the Council of Europe QUALITY MANAGEMENT DOCUMENT PA/PH/OMCL (10) 86 2R QUALIFICATION OF EQUIPMENT ANNEX 7: QUALIFICATION OF MASS SPECTROMETERS Full document title and reference Document
MSSimulator. Simulation of Mass Spectrometry Data. Chris Bielow, Stephan Aiche, Sandro Andreotti, Knut Reinert FU Berlin, Germany
 Chris Bielow Algorithmic Bioinformatics, Institute for Computer Science MSSimulator Chris Bielow, Stephan Aiche, Sandro Andreotti, Knut Reinert FU Berlin, Germany Simulation of Mass Spectrometry Data Motivation
Prediction of micrornas and their targets
 Prediction of micrornas and their targets Introduction Brief history mirna Biogenesis Computational Methods Mature and precursor mirna prediction mirna target gene prediction Summary micrornas? RNA can
Benefits and Characteristic Applications of High Resolution GC/MS and LC/MS. Frank David RIC and Ghent University
 Benefits and Characteristic Applications of High Resolution GC/MS and LC/MS. Frank David RIC and Ghent University Mass Spectrometry Structure Elucidation Selective and Sensitive Detection Identification
How to Use TOF and Q-TOF Mass Spectrometers
 How to Use TOF and Q-TOF Mass Spectrometers October 2011 What do TOF and Q-TOF offer? TOF Fast scanning of full spectrum High resolution full scan spectra Accurate mass measurements Q-TOF Fast scanning
Copyright 2008 Society of Photo Optical Instrumentation Engineers. This paper was published in Proceedings of SPIE, vol. 6915, Medical Imaging 2008:
 Copyright 2008 Society of Photo Optical Instrumentation Engineers. This paper was published in Proceedings of SPIE, vol. 6915, Medical Imaging 2008: Computer Aided Diagnosis and is made available as an
Chemical Analysis Business Operations Waters Corporation Milford MA
 The Detection and Identification of Unknown Contaminants During ToF Screening and Structural Elucidation for Pesticides in River Water Using an Integrated Software Approach Chemical Analysis Business Operations
Ultra High Definition Optimizing all Analytical Dimensions
 Ultra High Definition Optimizing all Analytical Dimensions Sensitivity Dynamic Range Signal Response Linearity Separation Speed Peak Capacity Chromatogram Mass Spectrum Mass Accuracy Resolving Power Acquisition
ION MOBILITY COUPLED TO HIGH RESOLUTION MASS SPECTROMETRY: THE POSSIBILITIES, THE LIMITATIONS
 ION MOBILITY COUPLED TO HIGH RESOLUTION MASS SPECTROMETRY: THE POSSIBILITIES, THE LIMITATIONS Anton Kaufmann Official Food Control Authority of the Canton of Zurich (Kantonales Labor Zürich) Switzerland
Various performance measures in Binary classification An Overview of ROC study
 Various performance measures in Binary classification An Overview of ROC study Suresh Babu. Nellore Department of Statistics, S.V. University, Tirupati, India E-mail: sureshbabu.nellore@gmail.com Abstract
3. Model evaluation & selection
 Foundations of Machine Learning CentraleSupélec Fall 2016 3. Model evaluation & selection Chloé-Agathe Azencot Centre for Computational Biology, Mines ParisTech chloe-agathe.azencott@mines-paristech.fr
[application note] DIRECT TISSUE IMAGING AND CHARACTERIZATION OF PHOSPHOLIPIDS USING A MALDI SYNAPT HDMS SYSTEM
![[application note] DIRECT TISSUE IMAGING AND CHARACTERIZATION OF PHOSPHOLIPIDS USING A MALDI SYNAPT HDMS SYSTEM](/thumbs/93/111965378.jpg "[application note] DIRECT TISSUE IMAGING AND CHARACTERIZATION OF PHOSPHOLIPIDS USING A MALDI SYNAPT HDMS SYSTEM") DIRECT TISSUE IMAGING AND CHARACTERIZATION OF PHOSPHOLIPIDS USING A MALDI SYNAPT HDMS SYSTEM Emmanuelle Claude, Marten Snel, Thérèse McKenna, and James Langridge INTRODUCTION The last decade has seen a
DIRECT TISSUE IMAGING AND CHARACTERIZATION OF PHOSPHOLIPIDS USING A MALDI SYNAPT HDMS SYSTEM Emmanuelle Claude, Marten Snel, Thérèse McKenna, and James Langridge INTRODUCTION The last decade has seen a
4-Fluoroethamphetamine
 NMS Labs 2300 Stratford Ave Willow Grove, PA 19090 4-Fluoroethamphetamine Sample Type: Seized Material Latest Revision: January 3, 2019 Date Received: July 31, 2018 Date of Report: January 3, 2019 1. GENERAL
chapter 1 - fig. 2 Mechanism of transcriptional control by ppar agonists.
 chapter 1 - fig. 1 The -omics subdisciplines. chapter 1 - fig. 2 Mechanism of transcriptional control by ppar agonists. 201 figures chapter 1 chapter 2 - fig. 1 Schematic overview of the different steps
Latest Innovations in LC/MS/MS from Waters for Metabolism and Bioanalytical Applications
 Latest Innovations in LC/MS/MS from Waters for Metabolism and Bioanalytical Applications Ignatius J. Kass Senior Field Marketing Manager Pharmaceutical MS Challenges in Pharmaceutical Sample Analysis Quantitative
Databehandling. 3. Mark e.g. the first fraction (1: 0-45 min, 2: min, 3; min, 4: min, 5: min, 6: min).
.") Databehandling Data analysis 1. Choose Open in the Data analysis window. 2. Press the Open folder and choose the desired analysis. Click the + button, so that the Chromatograms line appears. Click the
Databehandling Data analysis 1. Choose Open in the Data analysis window. 2. Press the Open folder and choose the desired analysis. Click the + button, so that the Chromatograms line appears. Click the
CEU MASS MEDIATOR USER'S MANUAL Version 2.0, 31 st July 2017
 CEU MASS MEDIATOR USER'S MANUAL Version 2.0, 31 st July 2017 1. Introduction... 2 1.1. System Requirements... 2 2. Peak search... 3 2.1. Simple Search... 3 2.2. Advanced Search... 5 2.3. Batch Search...
Week 2 Video 3. Diagnostic Metrics
 Week 2 Video 3 Diagnostic Metrics Different Methods, Different Measures Today we ll continue our focus on classifiers Later this week we ll discuss regressors And other methods will get worked in later
Designer Cannabinoids
 Liquid Chromatography Mass Spectrometry SSI-LCMS-010 Designer Cannabinoids LCMS-8030 Summary A rapid LC-MS-MS method for determination of designer cannabinoids in smokeable herbs was developed. Background
New Mass Spectrometry Tools to Transform Metabolomics and Lipidomics
 New Mass Spectrometry Tools to Transform Metabolomics and Lipidomics July.3.13 Ken Miller Vice President of Marketing, Life Sciences Mass Spectrometry 1 The world leader in serving science Omics & the
Impurity Identification using a Quadrupole - Time of Flight Mass Spectrometer QTOF
 Impurity Identification using a Quadrupole - Time of Flight Mass Spectrometer QTOF PUSHER TOF DETECTOR ZSPRAY TM Ion Source SAMPLING CONE SKIMMER RF HEXAPOLE RF HEXAPOLE QUADRUPOLE IN NARROW BANDPASS MODE
MS1 and MS2 crosstalk in label free quantitation of mass spectrometry data independent acquisitions
 MS1 and MS2 crosstalk in label free quantitation of mass spectrometry data independent acquisitions MS1 528.18 +++ m/z 568.98 ++ m/z 678.34 ++ m/z MS2/SWATH June 9th, 2013 Matthew J. Rardin SIRT3 regulated
Sue D Antonio Application Chemist Cedar Creek, TX
 Sue D Antonio Application Chemist Cedar Creek, TX What is Hemp Oil? CBD hemp oil is a natural botanical extract of the common hemp plant. CBD hemp oil is derived from the seeds and stem of the Cannabis
Challenges in Separation Technologies
 Challenges in Separation Technologies Erin Shammel Baker Xing Zhang, Yehia Ibrahim, Matthew Monroe, Dennis Mehinagic, Justin Teeguarden, Thomas Metz and Richard D. Smith Pacific Northwest National Laboratory
Introduction to diagnostic accuracy meta-analysis. Yemisi Takwoingi October 2015
 Introduction to diagnostic accuracy meta-analysis Yemisi Takwoingi October 2015 Learning objectives To appreciate the concept underlying DTA meta-analytic approaches To know the Moses-Littenberg SROC method
High-sensitivity Orbitrap mass analysis of intact macromolecular assemblies. R. J. Rose, E. Damoc, E. Denisov, A. Makarov, A. J. R.
 High-sensitivity Orbitrap mass analysis of intact macromolecular assemblies R. J. Rose, E. Damoc, E. Denisov, A. Makarov, A. J. R. Heck SUPPLEMENTARY INFORMATION HCD multipole C -trap Transport octapole
Increased Identification Coverage and Throughput for Complex Lipidomes
 Increased Identification Coverage and Throughput for Complex Lipidomes Reiko Kiyonami, David Peake, Yingying Huang, Thermo Fisher Scientific, San Jose, CA USA Application Note 607 Key Words Q Exactive
Behavioral Data Mining. Lecture 4 Measurement
 Behavioral Data Mining Lecture 4 Measurement Outline Hypothesis testing Parametric statistical tests Non-parametric tests Precision-Recall plots ROC plots Hardware update Icluster machines are ready for
[ APPLICATION NOTE ] High Sensitivity Intact Monoclonal Antibody (mab) HRMS Quantification APPLICATION BENEFITS INTRODUCTION WATERS SOLUTIONS KEYWORDS
![[ APPLICATION NOTE ] High Sensitivity Intact Monoclonal Antibody (mab) HRMS Quantification APPLICATION BENEFITS INTRODUCTION WATERS SOLUTIONS KEYWORDS](/thumbs/79/80328542.jpg "[ APPLICATION NOTE ] High Sensitivity Intact Monoclonal Antibody (mab) HRMS Quantification APPLICATION BENEFITS INTRODUCTION WATERS SOLUTIONS KEYWORDS") Yun Wang Alelyunas, Henry Shion, Mark Wrona Waters Corporation, Milford, MA, USA APPLICATION BENEFITS mab LC-MS method which enables users to achieve highly sensitive bioanalysis of intact trastuzumab
Yun Wang Alelyunas, Henry Shion, Mark Wrona Waters Corporation, Milford, MA, USA APPLICATION BENEFITS mab LC-MS method which enables users to achieve highly sensitive bioanalysis of intact trastuzumab
Introduction to Proteomics 1.0
 Introduction to Proteomics 1.0 CMSP Workshop Pratik Jagtap Managing Director, CMSP Objectives Why are we here? For participants: Learn basics of MS-based proteomics Learn what s necessary for success using
Analysis of Diabetic Dataset and Developing Prediction Model by using Hive and R
 Indian Journal of Science and Technology, Vol 9(47), DOI: 10.17485/ijst/2016/v9i47/106496, December 2016 ISSN (Print) : 0974-6846 ISSN (Online) : 0974-5645 Analysis of Diabetic Dataset and Developing Prediction
Application Note # LCMS-89 High quantification efficiency in plasma targeted proteomics with a full-capability discovery Q-TOF platform
 Application Note # LCMS-89 High quantification efficiency in plasma targeted proteomics with a full-capability discovery Q-TOF platform Abstract Targeted proteomics for biomarker verification/validation
For personal use only. Please do not reuse or reproduce
 DATA ANALYSIS IN MASS SPECTROMETRY BASED METABOLOMICS Pavel Aronov Stanford Mass Spectrometry Users Meeting September 26, 2011 Presented at the 2011 Stanford Mass Spectrometry t Users Meeting For personal
Amadeo R. Fernández-Alba
 % of compounds % of compounds % of compounds % of compounds Amadeo R. Fernández-Alba LC-Orbitrap QExactive Focus Instrumental LOQ 1% 9% 8% 7% 6% 5% 4% 3% 2% 1% %.1 mg/g.2 mg/g Tomato.5 mg/g ddms2 Target
Moving from targeted towards non-targeted approaches
 Gesundheitsdirektion Moving from targeted towards non-targeted approaches Anton Kaufmann Official Food Control Authority of the Canton of Zurich () Switzerland 2 Overview I From single residue to multi
Statistics, Probability and Diagnostic Medicine
 Statistics, Probability and Diagnostic Medicine Jennifer Le-Rademacher, PhD Sponsored by the Clinical and Translational Science Institute (CTSI) and the Department of Population Health / Division of Biostatistics
MALDI Imaging Drug Imaging Detlev Suckau Head of R&D MALDI Bruker Daltonik GmbH. December 19,
 MALDI Imaging Drug Imaging Detlev Suckau Head of R&D MALDI Bruker Daltonik GmbH December 19, 2014 1 The principle of MALDI imaging Spatially resolved mass spectra are recorded Each mass signal represents
Data Independent MALDI Imaging HDMS E for Visualization and Identification of Lipids Directly from a Single Tissue Section
 Data Independent MALDI Imaging HDMS E for Visualization and Identification of Lipids Directly from a Single Tissue Section Emmanuelle Claude, Mark Towers, and Kieran Neeson Waters Corporation, Manchester,
An Improved Algorithm To Predict Recurrence Of Breast Cancer
 An Improved Algorithm To Predict Recurrence Of Breast Cancer Umang Agrawal 1, Ass. Prof. Ishan K Rajani 2 1 M.E Computer Engineer, Silver Oak College of Engineering & Technology, Gujarat, India. 2 Assistant
Don t miss a thing on your peptide mapping journey How to get full coverage peptide maps using high resolution accurate mass spectrometry
 Don t miss a thing on your peptide mapping journey How to get full coverage peptide maps using high resolution accurate mass spectrometry Kai Scheffler, PhD BioPharma Support Expert,LSMS Europe The world
Sunil Kulkarni Product Specialist Agilent Technologies
 Drug Residue Analysis by LC/MS methods Sunil Kulkarni Product Specialist Agilent Technologies Outline General Drug Residue information Veterinary drug residue Analysis by LC/MS QQQ and Q-TOF method Analytical
NON TARGETED SEARCHING FOR FOOD
 NON TARGETED SEARCHING FOR FOOD CONTAMINANTS USING ORBITRAP HIGH RESOLUTION MASS SPECTROMETRY Michal Godula 1, Adrian Charlton 2 and Klaus Mittendorf 1 1 Thermo Fisher Scientific, Dreieich, Germany 2 Food
Inhibitory Effect of Methotrexate on Rheumatoid Arthritis Inflammation and Comprehensive Metabolomics Analysis Using UPLC-Q/TOF-MS
 SUPPLEMENTARY MATERIALS Inhibitory Effect of Methotrexate on Rheumatoid Arthritis Inflammation and Comprehensive Metabolomics Analysis Using UPLC-Q/TOF-MS Zhiqiang Pang 1, Guoqiang Wang 1, Nan Ran 1, Hongqiang
MS/MS to Targeted Proteomics (MRM)
") MS/MS to Targeted Proteomics (MRM) How it worked on the Human Lens Proteome Jayson Falkner PhD jay@singleorganism.com Genes Show Limited Value in Predicting Diseases With only a few exceptions, what the
MS/MS to Targeted Proteomics (MRM) How it worked on the Human Lens Proteome Jayson Falkner PhD jay@singleorganism.com Genes Show Limited Value in Predicting Diseases With only a few exceptions, what the
The Agilent MassHunter Software. One Software for all Agilent Mass Spec Systems
 The Agilent MassHunter Software One Software for all Agilent Mass Spec Systems MassHunter The most innovative MS SW! MassHunter Workstation One software for all Agilent MS Systems Minimize learning (and
Automating Mass Spectrometry-Based Quantitative Glycomics using Tandem Mass Tag (TMT) Reagents with SimGlycan
 Reagents with SimGlycan") PREMIER Biosoft Automating Mass Spectrometry-Based Quantitative Glycomics using Tandem Mass Tag (TMT) Reagents with SimGlycan Ne uaca2-3galb1-4glc NAcb1 6 Gal NAca -Thr 3 Ne uaca2-3galb1 Ningombam Sanjib
PREMIER Biosoft Automating Mass Spectrometry-Based Quantitative Glycomics using Tandem Mass Tag (TMT) Reagents with SimGlycan Ne uaca2-3galb1-4glc NAcb1 6 Gal NAca -Thr 3 Ne uaca2-3galb1 Ningombam Sanjib
Supplementary materials
 Supplementary materials Metabolic phenotyping for monitoring ovarian cancer patients Chaofu Ke a, Ang Li a, Yan Hou a, Meng Sun b, Kai Yang a, Jinlong Cheng c, Jingtao Wang a, Tingting Ge c, Fan Zhang
2. Ionization Sources 3. Mass Analyzers 4. Tandem Mass Spectrometry
 Dr. Sanjeeva Srivastava 1. Fundamental of Mass Spectrometry Role of MS and basic concepts 2. Ionization Sources 3. Mass Analyzers 4. Tandem Mass Spectrometry 2 1 MS basic concepts Mass spectrometry - technique
PosterREPRINT AN AUTOMATED METHOD TO SELF-CALIBRATE AND REJECT NOISE FROM MALDI PEPTIDE MASS FINGERPRINT SPECTRA
 Overview AN AUTOMATED METHOD TO SELF-CALIBRATE AND REJECT NOISE FROM MALDI PEPTIDE MASS FINGERPRINT SPECTRA Jeffery M Brown, Neil Swainston, Dominic O. Gostick, Keith Richardson, Richard Denny, Steven
Improved method for the quantification of lysophospholipids including enol ether
 Supplemental Material Improved method for the quantification of lysophospholipids including enol ether species by liquid chromatography-tandem mass spectrometry James G. Bollinger *, Hiromi Ii*, Martin
A NOVEL METHOD OF M/Z DRIFT CORRECTION FOR OA-TOF MASS SPECTROMETERS BASED ON CONSTRUCTION OF LIBRARIES OF MATRIX COMPONENTS.
 A NOVEL METHOD OF M/Z DRIFT CORRECTION FOR OA-TOF MASS SPECTROMETERS BASED ON CONSTRUCTION OF LIBRARIES OF MATRIX COMPONENTS. Martin R Green*, Keith Richardson, John Chipperfield, Nick Tomczyk, Martin
Predictive Models for Healthcare Analytics
 Predictive Models for Healthcare Analytics A Case on Retrospective Clinical Study Mengling Mornin Feng mfeng@mit.edu mornin@gmail.com 1 Learning Objectives After the lecture, students should be able to:
QSTAR Operation. May 3, Bob Seward
 QSTAR Operation May 3, 2005 Bob Seward Presentation CD Contents QSTAR Hardware QSTAR Schematic 10-7 torr QSTAR Schematic Chernushevich et al, JMS 2001, 36: 849-865 Curtain Plate ESI Source ESI Source Curtain
Advantages of Ion Mobility Q-TOF for Characterization of Diverse Biological Molecules
 Advantages of Ion Mobility Q-TOF for Characterization of Diverse Biological Molecules Add a New Dimension to your Research Capability with Agilent s New Drift Ion Mobility Q-TOF System Overview: 6560 IM
The Comparison of High Resolution MS with Triple Quadrupole MS for the Analysis of Oligonucleotides
 The Comparison of High Resolution MS with Triple Quadrupole MS for the Analysis of Oligonucleotides Mohammed Abrar Unilabs York Bioanalytical Solutions Outline Introduction Why LC-MS/MS? Limitations of
HW 1 - Bus Stat. Student:
 HW 1 - Bus Stat Student: 1. An identification of police officers by rank would represent a(n) level of measurement. A. Nominative C. Interval D. Ratio 2. A(n) variable is a qualitative variable such that
Comparison of Full Scan MS2 and MS3 Linear Ion Trap Approaches for Quantitation of Vitamin D
 Comparison of Full Scan MS2 and MS3 Linear Ion Trap Approaches for Quantitation of Vitamin D Julie A. Horner 1, Marta Kozak 1, Subodh Nimkar 1, and August A. Specht 1 1 Thermo Fisher Scientific, San Jose,
Lecture 3. Tandem MS & Protein Sequencing
 Lecture 3 Tandem MS & Protein Sequencing Nancy Allbritton, M.D., Ph.D. Department of Physiology & Biophysics 824-9137 (office) nlallbri@uci.edu Office- Rm D349 Medical Science D Bldg. Tandem MS Steps: