SUPPLEMENTAL MATERIAL
|
|
|
- Martha Hampton
- 5 years ago
- Views:
Transcription
1 SUPPLEMENTAL MATERIAL Supplemental Methods Lipid extraction. Tissue was pulverized with a mortar and pestle or a ball-grinding method (Mikro Dismembrator, Sartorius). All subsequent steps were performed in glass vials that were thoroughly rinsed with water, methanol, and chloroform before use. 300 µl water (HPLC grade, Fisher Scientific), 2 ml methanol (HPLC grade, Fisher Scientific) and 4 ml chloroform (GLC-pesticide residue grade, Fisher Scientific) were added to each sample. Then, the mixture was vortexed for 10 min and centrifuged for 10 min at 3000 rpm. The supernatant was transferred, mixed with 1.2 ml water and vortexed for 10 min. After centrifugation at 1000 rpm for 5 min the lower organic phase was transferred into a new glass vial and 2 ml of chloroform/methanol/water (3:48:47) was added. To extract any remaining lipids, the upper phase was washed with 2 ml chloroform and centrifuged for 5 min at 1000 rpm. The two organic phases were combined and split into aliquots corresponding to 50 mg of tissue. The organic solvent was evaporated and samples stored at -80 C. Plasma extraction. 10 µl of plasma were added to an aliquot (110 µl) of an internal standard mixture in a glass vial. 10 µl 0.15 M sodium chloride were added and each sample was homogenized by vortexing for 5 sec. After 30 min incubation at room temperature the samples were centrifuged for 3 min at rpm and an exact aliquot of the lower phase (50 µl) was transferred in a new glass vial. The internal standard mixture included 2600 pmol CE(17:0), 750 pmol lpc(19:0), 5000 pmol PC(17:0/17:0) and 750 pmol SM(d18:1/12:0) (all Avanti polar lipids, Alabaster, AL) in chlorform/methanol 2:1 containing butylated hydroxytoluene (BHT, 20 mg/l). Network analysis. The PCC threshold was set to >0.70 on the basis of the following evidence: (i) -omic correlation profiles with PCC over 0.60 were demonstrated to be more 1
2 biologically relevant 1 and (ii) below this cut-off all networks were excessively large (>700 coexpressions), suggesting a presence of false-positive edges. A more stringent PCC threshold was avoided due to rapid elimination of most lipid co-expressions. For the unbiased network clustering algorithm we used the Louvain Method for fast community detection in graphs. The algorithm is parameter-free and identifies community structures by maximizing network modularity. 2 Supplemental References 1. Elo LL, Jarenpaa H, Oresic M, Lahesmaa R, Aittokallio T. Systematic construction of gene coexpression networks with apllications to human T helper cell differentiation process. Bioinformatics 2007;23, Newman MEJ. Modularity and community structure in networks. Proc Natl Acad Sci. 2006;103, Manicke NE, Nefliu M, Wu C, Woods JW, Reiser V, Hendrickson RC, Cooks RG. Imaging of lipids in atheroma by desorption electrospray ionization mass spectrometry. Anal Chem. 2009;81:
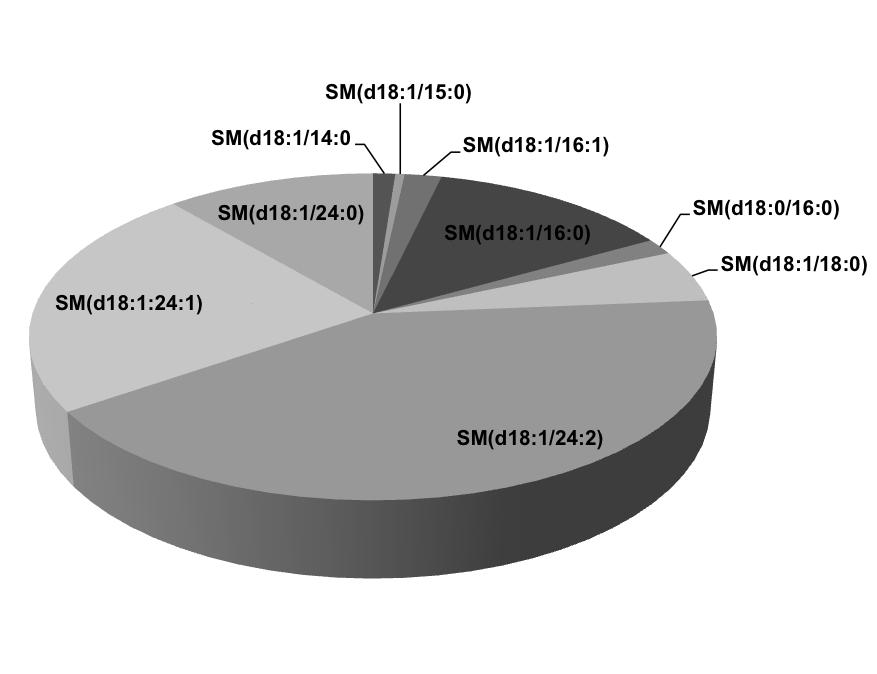
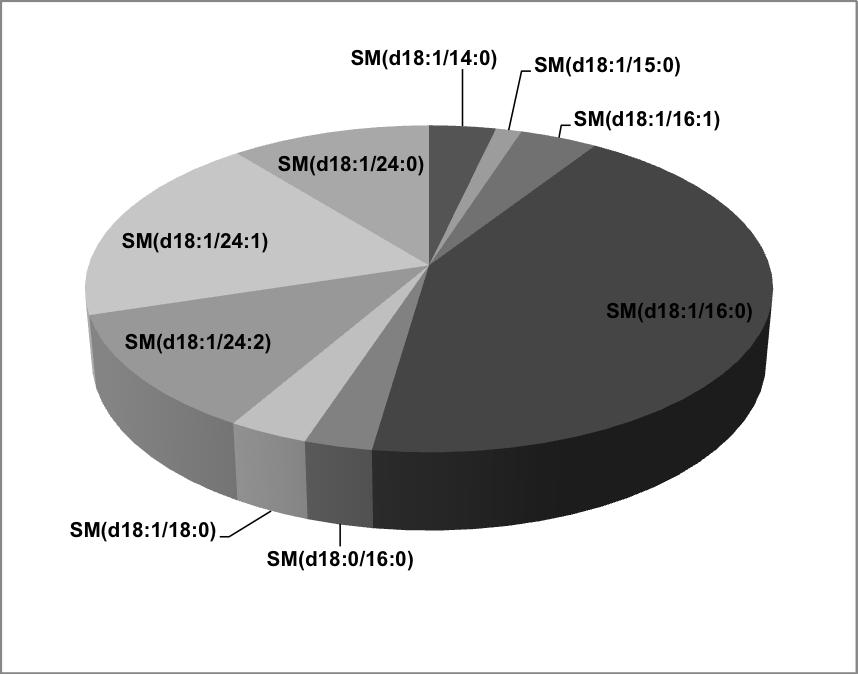
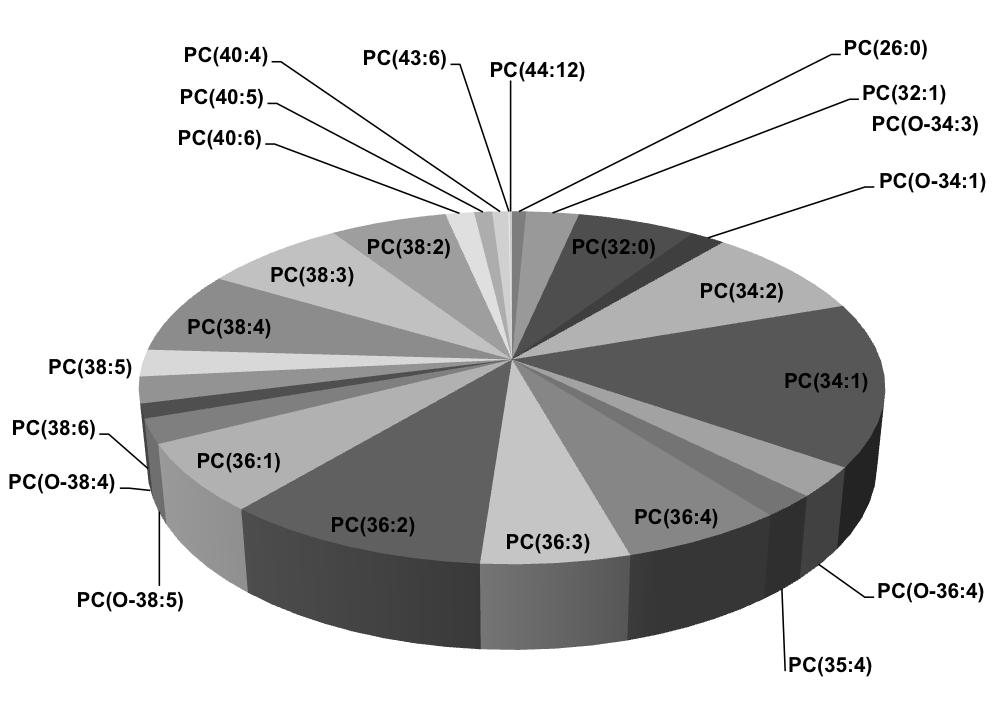
3 Supplemental Figures Supplemental Figure I: A full MS scan (A) and a PI scan at m/z for SM species (B) in negative ion mode. Supplemental Figure II: PCAs for lipid profiles of symptomatic and asymptomatic patients. The red circles denote symptomatic patients; the blue squares denote asymptomatic patients. The numbers correspond to the patients in Supplemental Table VI. The plot on the right show the magnitude of the first 2 principal components based on all measurements. The black and green lines represent the mean value of the weights in symptomatic and asymptomatic plaques. CE and, to lesser, extent SM, contributed to most of the composition of the first two principal components. Supplemental Figure III: Comparison of relative distribution of CE species in plasma (n = 35) and plaques (n = 28). Supplemental Figure IV: Comparison of relative distribution of SM species in plasma (n = 35) and plaques (n = 28). Supplemental Figure V: Comparison of relative distribution of lpc species in plasma (n = 35) and plaques (n = 28). Supplemental Figure VI: Comparison of relative distribution of PC species in plasma (n = 35) and plaques (n = 28). 3
4 Supplemental Table I: Neutral loss (NL) and precursor ion (PI) scans plus their collision energy (CE) used for shotgun lipidomics on a QqQ-MS (TSQ Vantage, ThermoFisher). Lipid class Precursor ion MS mode MS/MS mode CE (ev) PC, lysopc, SM [M+H] + pos PI acylcarnitine [M+H] + pos PI CE [M+NH 4 ] + pos PI PE [M+H] + pos NL PS [M+H] + pos NL scans for different FAs from TAG+CE species [M+NH 4 ] + pos NL + NH 4 35 PC, lysopc, SM [M-Cl] - neg NL PS [M-H] - neg NL Glycerophospholipids [M-H] - neg PI PI [M-H] - neg PI PIP [M-H] - neg PI PIP 2 [M-H] - neg PI Sulfatides [M-H] - neg PI acylcoa [M-2H] 2- neg PI Ceramide (non-hydroxy) [M-H] - neg NL Ceramide (2-hydroxy) [M-H] - neg PI Ceramide (general) [M-H] - neg NL Cerebroside [M-Cl] - neg NL SM [M-H] - neg PI scans for different FAs from PC species [M-Ac] - neg PI 28 4
5 Supplemental Table II: Clinical characteristics from patients undergoing endarterectomy and control subjects. Age Gender BMI DM COPD HTN Renal failure b- blockers ASA ACEI Statins Patient 1 66 Male 21 No No Yes No No Yes No Yes Patient 2 82 Male 23 No No Yes No No No No No Patient 3 70 Male 26 No No Yes No Yes Yes Yes No Control 1 60 Male 27 No No Yes No No Yes No Yes Control 2 61 Male 26 No No No No Yes Yes Yes Yes Control 3 55 Male 24 No No Yes No Yes Yes Yes Yes Patient 1 and 3 were undergoing carotid endartectomy, Patient 2 was undergoing femoral endarterectomy, and macroscopically normal radial arteries from individuals undergoing coronary bypass grafting were used as controls BMI indicates body mass index; DM, diabetes mellitus; COPD, Chronic obstructive pulmonary disease; HTN, hypertension; ASA, acetyl salicylic acid; ACEI, angiotensin-converting enzyme inhibitors. 5
6 Supplement Table III: Lipids identified in endarterectomies (P1-P3) and radial control arteries (C1-C3) in positive MS mode. m/z Lipid P1 P2 P3 C1 C2 C3 lpe PE lps PS lpe(16:0) lpe(18:1) lpe(18:0) L lpe(22:6) lpe(22:5) L lpe(22:4) L lpe(24:6) L lpe(24:5) L lpe(24:4) L lpe(24:0) PE(28:0) PE(34:2) L PE(34:1) L PE(O-36:5) L PE(36:4) L PE(36:3) L PE(36:2) L PE(36:1) L PE(O-38:0) PE(38:6) L PE(38:5) L PE(38:4) L PE(38:3) L PE(O-40:0) L PE(40:6) L PE(40:5) L PE(40:4) L lps(18:0) lps(20:0) L PS(34:1) PS(34:0) PS(36:2) L PS(36:1) L PS(36:0) L
7 810.8 PS(38:5) L PS(38:4) L PS(38:3) L PS(38:2) L PS(40:6) L PS(40:5) L PS(40:4) L SM SM(d18:1/14:0) L * SM(d18:1/15:0) L * SM(d18:1/16:1) L * SM(d18:1/16:0) L * SM(d18:0/16:0) L SM(d18:1/18:0) L * SM(d18:1/24:2) L * SM(d18:1/24:1) L * SM(d18:1/24:0) L lpc lpc(14:0) L lpc(o-16:1) L lpc(o-16:0) L lpc(16:1) L lpc(16:0) L * lpc(o-18:0) lpc(18:2) L * lpc(18:1) L * lpc(18:0) L * lpc(20:4) L lpc(20:3) L lpc(20:2) L lpc(22:6) lpc(22:5) L lpc(22:4) L lpc(22:0) L lpc(24:6) lpc(24:0) PC PC(22:0) L PC(24:0) L PC(26:0) L PC(16:0/16:1) L 7
8 734.5 PC(16:0/16:0) L * PC(O-34:1) L * PC(18:2/16:0) L * PC(16:0/18:1) L * PC(O-16:1/20:4) L PC(O-16:0/20:4) L PC(16:0/20:4) L * PC(18:1/18:2) L * PC(18:0/18:2) L * PC(18:1/18:1) L * PC(18:0/18:1) L PC(O-16:0/22:5) L PC(O-38:4) L PC(16:0/22:6) L PC(18:1/20:4) L PC(18:0/20:4) L PC(18:0/20:3) L PC(38:2) L PC(40:6) L PC(18:0/22:5) L PC(40:4) L PC(43:6) PC(44:12) L CE CE(10:0) L CE(14:0) L CE(16:1) L * CE(16:0) L * CE(18:3) L CE(18:2) L * CE(18:1) L * CE(18:0) CE(20:5) L CE(20:4) L * CE(20:3) L * CE(20:2) L CE(20:1) CE(20:0) L CE(22:6) L
9 716.7 CE(22:5) L CE(22:4) L CE(22:3) L TAG TAG(46:2) L TAG(46:1) L TAG(46:0) L TAG(48:3) TAG(48:2) L TAG(48:1) L TAG(48:0) L TAG(50:4) TAG(50:3) L TAG(50:2) L TAG(50:1) L TAG(O-52:2) TAG(52:5) TAG(52:4) L TAG(52:3) L TAG(52:2) L TAG(52:1) L TAG(54:6) L TAG(54:5) L TAG(54:4) L TAG(54:3) L TAG(54:2) L TAG(54:1) L TAG(56:8) L TAG(56:7) L TAG(56:6) L TAG(56:5) L TAG(56:4) L TAG(56:3) L TAG(58:9) TAG(58:8) TAG(58:7) L TAG(58:6) For TAG species, different neutral loss scans for identification of fatty acids were used and in most cases >3 fatty acids were identified. Thus, a single peak in the full MS scan is an overlay of different isobaric TAG species. There are no class specific scans for TAG species, so they were identified from the full MS scan. In the m/z area of 790 to 9
10 890 an overlay of PC and TAG species can occur. PC species are unambiguously identified by a NL scan for the PC headgroup. In addition a MS/MS spectrum of all signals above m/z of 790 was recorded. Compared to PC species, MS/MS spectra of TAG species show very intensive signals due to loss of fatty acids. Thus, MS/MS spectra were used to identify TAG species and resolve the possibility of an overlay with PC species, which show a characteristic signal at m/z Lipids marked with an ( L ) were detected with Liquid Extraction Surface Analysis (LESA) in positive ion mode with NL or PI scans (phospholipids and CEs) or in the full MS mode (TAG). Lipids marked with an asterisk (*) were previously identified with DESI-MS. 3 10
11 Supplement Table IV: Lipids identified in endarterectomies (P1-3) and radial control arteries (C1-3) in negative MS mode. m/z [Ion] Lipid P1 P2 P3 C1 C2 C3 SM [M-Cl] - SM(d18:1/14:0)* [M-Cl] - SM(d18:1/15:0)* [M-Ac] - SM(d18:1/14:0)* [M-Cl] - SM(d18:1/16:1)* [M-Cl] - SM(d18:1/16:0)* [M-Cl] - SM(d18:0/16:0) [M-Ac] - SM(d18:1/15:0)* [M-Ac] - SM(d18:0/15:0)* [M-Ac] - SM(d18:1/16:1)* [M-Ac] - SM(d18:1/16:0)* [M-Ac] - SM(d18:0/16:0) [M-Ac] - SM(d18:1/18:0)* [M-Cl] - SM(d18:0/20:0) [M-Cl] - SM(d18:1/24:3) [M-Cl] - SM(d18:1/24:2)* [M-Cl] - SM(d18:1/24:1) [M-Ac] - SM(d18:1/24:2)* [M-Ac] - SM(d18:1/24:1)* [M-Cl] - SM(d18:1/24:0) lpc lpc(16:0)* lpc(18:2)* PC PC(34:2) PC(36:4) PC(36:3) PC(36:2) PC(36:1) PC(38:2) PC(38:1) PS PS(36:1) PS(38:4)
12 812.8 PS(38:3) PS(38:1) PS(40:6) PS(40:5) PS(40:4) Lipids marked with an asterisk (*) were previously identified with DESI-MS. 3 12
13 Supplement Table V: Quantitation of CE, SM, lpc and PC species in endarterectomies and radial arteries. Lipid species Endarterectomies (n = 3) Radial Arteries (n = 3) CE CE(10:0) 0.03 (±0.031) 0.00 (±0.000) CE(14:0) 0.08 (±0.024) 0.00 (±0.001) CE(16:0) 1.34 (±0.380) 0.01 (±0.004) CE(16:1) 1.09 (±0.199) 0.00 (±0.003) CE(18:0) 1.00 (±0.998) 0.01 (±0.005) CE(18:1) 8.75 (±1.017) 0.00 (±0.003) CE(18:2) (±1.203) 0.01 (±0.004) CE(18:3) 0.65 (±0.159) 0.00 (±0.001) CE (20:0) 1.91 (±1.118) 0.07 (±0.046) CE(20:1) 0.86 (±0.305) 0.03 (±0.013) CE(20:2) 0.29 (±0.224) 0.03 (±0.015) CE(20:3) 1.31 (±0.447) 0.02 (±0.012) CE(20:4) 3.00 (±0.475) 0.07 (±0.036) CE(20:5) 0.79 (±0.273) 0.05 (±0.024) CE(22:3 ) 0.14 (±0.082) 0.00 (±0.000) CE(22:4) 0.20 (±0.131) 0.00 (±0.001) CE(22:5) 0.33 (±0.115) 0.00 (±0.000) CE(22:6) 0.58 (±0.202) 0.00 (±0.002) SM SM(d18:1/14:0) (±84.198) 6.61 (±1.123) SM(d18:1/15:0) (±42.053) 2.81 (±0.428) SM(d18:1/16:1) (± ) 13.7 (±2.211) SM(d18:1/16:0) (± ) (±18.218) SM(d18:0/16:0) 0.0 (±0.000) 16.2 (±4.525) SM(d18:1/18:0) (±50.536) 22.0 (±1.215) SM(d18:1/24:2) (±232.9) 48.3 (±7.032) SM(d18:1/24:1) (± ) 75.4 (±18.375) SM(d18:1/24:0) (± ) 46.2 (±6.921) lpc lpc(14:0) 0.3 (±0.186) 0.08 (±0.084) lpc(o-16:1) 0.4 (±0.180) 0.03 (±0.028) 13
14 lpc(o-16:0) 3.2 (±2.224) 0.0 (±0.000) lpc(16:1) 6.4 (±3.787) 0.2 (±0.173) lpc(16:0) (±82.92) 3.4 (±1.114) lpc(o-18:0) 10.7 (±4.468) 3.1 (±0.586) lpc(18:2) 79.7 (±52.028) 1.4 (±0.190) lpc(18:1) (±67.418) 1.5 (±0.283) lpc(18:0) (±45.472) 4.3 (±0.944) lpc(20:4) 39.6 (±18.225) 8.7 (±6.140) lpc(20:3) 23.1 (±11.614) 2.8 (±1.498) lpc(20:2) 6.8 (±2.875) 3.3 (±0.603) lpc(22:6) 0.0 (±0.000) 0.3 (±0.260) lpc(22:5) 0.2 (±0.214) 0.5 (±0.347) lpc(22:4) 2.2 (±2.230) 0.4 (±0.400) lpc(22:0) 0.0 (±0.000) 0.6 (±0.629) lpc(24:6) 0.0 (±0.000) 0.3 (±0.327) lpc(24:0) 0.0 (±0.000) 1.2 (±1.196) PC PC(24:0) 0.0 (±0.000) 0.6 (±0.612) PC(26:0) 7.5 (±7.537) 30.0 (±15.883) PC(32:1) (±35.995) (±6.251) PC(32:0) (± ) 67.3 (±8.742) PC(O-34:1) 86.7 (±29.938) 11.0 (±2.505) PC(34:2) (±84.022) 71.5 (±22.006) PC(34:1) (± ) (±31.683) PC(O-36:5) (±23.325) 49.2 (±24.949) PC(O-36:4) 99.0 (±29.058) 23.3 (±1.205) PC(36:4) (±48.470) 71.4 (±18.798) PC(36:3) (±66.385) 40.0 (±11.058) PC(36:2) (± ) 70.0 (±16.422) PC(36:1) (± ) 67.1 (±11.761) PC(O-38:5) 95.7 (±31.416) 18.8 (±8.375) PC(O-38:4) 70.9 (±21.676) 13.5 (±6.486) PC(38:6) 64.9 (±15.026) 15.6 (±7.430) PC(38:5) 83.7 (±25.984) 26.0 (±8.381) PC(38:4) (±90.744) 65.4 (±18.571) PC(38:3) (± ) 46.0 (±9.378) 14
15 PC(38:2) (± ) 26.7 (±14.090) PC(40:6) 33.6 (±10.728) 7.4 (±2.613) PC(40:5) 26.4 (±12.732) 5.4 (±1.980) PC(40:4) 30.8 (±10.157) 4.3 (±1.627) PC(43:6) 1.8 (±1.089) 0.7 (±0.128) PC(44:12) 4.8 (±0.952) 0.7 (±0.198) PC(44:10) 0.3 (±0.283) 0.0 (±0.000) Data are given in pmol/µl (mean ± SE) for CE or fmol/µl (mean ± SE) for lpc, PC and SM. 15
16 Supplement Table VI: Clinical characteristics of symptomatic and asymptomatic patients. Symptomatology Age Gender DM COPD HTN Renal failure b- blockers ASA ACEI Statins Patient 4 Symptomatic 71 Male No No Yes No No Yes Yes No Patient 5 Symptomatic 76 Male Yes No Yes No No Yes Yes Yes Patient 6 Symptomatic 71 Male No No Yes Yes No Yes Yes Yes Patient 7 Asymptomatic 62 Male Yes No Yes No No Yes Yes Yes Patient 8 Asymptomatic 70 Male No No Yes No No Yes Yes Yes Patient 9 Asymptomatic 71 Male No No Yes No No Yes Yes Yes Patient 10 Symptomatic 84 Female No No Yes No No Yes Yes Yes Patient 11 Symptomatic 78 Female No No Yes No No Yes Yes No Patient 12 Symptomatic 71 Female No No Yes No No Yes Yes Yes Patient 13 Asymptomatic 80 Female No No Yes No No Yes Yes Yes Patient 14 Asymptomatic 65 Female No Yes Yes No No Yes No Yes Patient 15 Asymptomatic 69 Female Yes No Yes No No Yes Yes Yes For abbreviations, see footnote to Supplemental Table II. 16
17 Supplemental Table VII: Clinical characteristics of plaques divided in ruptured (unstable) and non-ruptured (stable) areas. Symptomatology Age Gender DM COPD HTN Renal failure b- blockers Patient 16 Symptomatic 81 Male No No Yes No No No Yes Patient 17 Asymptomatic 70 Male Yes Yes Yes No Yes Yes Yes Patient 18 Symptomatic 54 Male Yes No Yes No No Yes Yes Patient 19 Symptomatic 76 Male No Yes Yes No No No Yes Patient 20 Symptomatic 79 Female Yes No Yes No Yes No Yes ACEI Statins Patient 21 Symptomatic 73 Male No No No No No No Yes (4 days) Patient 22 Symptomatic 81 Male No No Yes No Yes Yes Yes Patient 23 Symptomatic 80 Female Yes No Yes Yes No No Yes For abbreviations, see footnote to Supplemental Table II. 17
18 Supplemental Table VIII: Quantitation of CE, SM, lpc and PC species in stable and unstable areas of the same plaques. Stable (n = 8) Unstable (n = 8) P value* (paired t-test) CE species CE(10:0) 0.1 (±0.025) 0.2 (±0.083) CE(14:0) 0.3 (±0.031) 0.5 (±0.174) CE(16:0) 6.2 (±0.190) 6.3 (±0.284) CE(16:1) 2.4 (±0.187) 2.8 (±0.393) CE(18:0) 0.0 (±0.000) 2.1 (±0.799) CE(18:1) 29.2 (±1.247) 26.3 (±1.885) CE(18:2) 27.8 (±1.745) 31.2 (±1.655) CE(18:3) 1.4 (±0.095) 1.7 (±0.242) CE(20:0) 2.2 (±0.458) 3.7 (±0.589) CE(20:1) 2.1 (±0.508) 2.2 (±0.117) CE(20:2) 1.9 (±0.311) 1.9 (±0.345) CE(20:3) 6.7 (±0.777) 3.6 (±0.345) CE(20:4) 9.4 (±0.850) 8.5 (±0.960) CE(20:5) 3.3 (±0.302) 3.5 (±0.343) CE(22:3) 0.8 (±0.171) 0.8 (±0.359) CE(22:4) 1.5 (±0.311) 0.8 (±0.175) CE(22:5) 1.9 (±0.325) 1.8 (±0.236) CE(22:6) 2.7 (±0.404) 2.2 (±0.425) SM species SM(d18:0/16:0) 3.6 (±1.399) 3.2 (±1.839) SM(d18:1/24:0) 11.6 (±2.180) 13.1 (±2.110) SM(d18:1/24:1) 18.9 (±1.199) 20.9 (±1.451) SM(d18:1/24:2) 14.0 (±1.602) 12.6 (±0.632) SM(d18:1/14:0) 3.2 (±0.277) 3.5 (±0.316) SM(d18:1/15:0) 1.2 (±0.111) 1.6 (±0.174) SM(d18:1/16:0) 39.9 (±2.273) 38.0 (±2.407) SM(d18:1/16:1) 4.0 (±0.414) 3.8 (±0.203) SM(d18:1/18:0) 3.4 (±0.209) 3.3 (±0.216) lpc species 18
19 lpc(o-16:0) 0.1 (±0.064) 0.2 (±0.140) lpc(16:0) 36.1 (±1.870) 35.2 (±1.994) lpc(16:1) 0.2 (±0.099) 0.1 (±0.046) lpc(o-18:0) 0.8 (±0.250) 1.3 (±0.284) lpc(18:0) 22.3 (±1.674) 27.0 (±1.001) lpc(18:1) 17.3 (±1.661) 12.1 (±1.852) lpc(18:2) 10.1 (±0.967) 10.5 (±1.071) lpc(20:2) 1.0 (±0.417) 2.5 (±0.713) lpc(20:3) 2.8 (±0.478) 3.1 (±0.579) lpc(20:4) 4.3 (±0.556) 4.7 (±0.848) lpc(22:0) 0.1 (±0.056) 0.1 (±0.047) lpc(22:4) 3.9 (±2.002) 1.9 (±1.041) lpc(22:5) 0.3 (±0.193) 0.5 (±0.182) lpc(22:6) 0.6 (±0.304) 0.8 (±0.318) lpc(24:6) 0.1 (±0.110) 0.1(±0.093) PC species PC(26:0) 0.2 (±0.062) 0.6 (±0.244) PC(32:0) 5.3 (±0.365) 4.5 (±0.252) PC(32:1) 2.2 (±0.216) 2.8 (±0.171) PC(O-34:1) 1.8 (±0.214) 1.8 (±0.173) PC(34:1) 15.2 (±0.824) 12.1 (±1.122) PC(34:2) 8.3 (±0.829) 8.7 (±0.792) PC(O-36:4) 2.0 (±0.286) 2.4 (±0.208) PC(36:1) 5.7 (±1.169) 7.1 (±0.750) PC(36:2) 9.4 (±0.485) 10.3 (±0.382) PC(36:3) 5.8 (±0.241) 5.9 (±0.344) PC(36:4) 7.5 (±0.518) 5.6 (±0.385) PC(O-36:4) 2.9 (±0.598) 2.5 (±0.289) PC(O-38:4) 1.5 (±0.276) 1.5 (±0.301) PC(O-38:5) 2.6 (±0.333) 2.6 (±0.226) PC(38:2) 5.2 (±1.222) 7.4 (±2.104) PC(38:3) 6.6 (±0.990) 7.5 (±1.317) PC(38:4) 8.8 (±0.405) 7.3 (±0.224) PC(38:5) 3.0 (±0.162) 2.7 (±0.187) PC(38:6) 2.1 (±0.346) 3.1 (±0.350) PC(40:4) 1.0 (±0.084) 0.7 (±0.147)
20 PC(40:5) 1.0 (±0.197) 1.1 (±0.159) PC(40:6) 1.7 (±0.099) 1.5 (±0.213) PC(43:6) 0.1 (±0.023) 0.1 (±0.032) PC(44:12) 0.1 (±0.022) 0.1 (±0.035) Data presented are given in % (mean ± SE) for each single lipid class. * P-values were derived from paired Student s t-tests since stable and unstable areas were from the same plaque, bold numbers highlight p-values <
21 Supplemental Table IX: Clinical characteristics of patients with endarterectomies. The plasma of the patients were extracted with chloroform/methanol and analyzed with shotgun lipidomics. Plasma (n = 35) Demographic Age, years (mean±sd) 69.0 (± 8.8) Male, % 71.4 BMI, kg/m Medical history, % DM 20.0 COPD 8.6 HTN 71.4 Renal failure 5.7 Medication b-blockers 22.9 ASA 71.4 ACEI 40.0 Statins 97.1 For abbreviations, see footnote to Supplemental Table II. 21
22 Supplemental Table X: Relative amount of CE, SM, lpc and PC species in human plasma and human atherosclerotic plaques. Plasma (n = 35) Plaques (n = 28) P value* (unpaired t-test) CE species CE(10:0) 0.0 (±0.000) 0.1 (±0.026) <0.001 CE(14:0) 0.3 (±0.016) 0.4 (±0.051) CE(16:0) 6.9 (±0.167) 6.6 (±0.176) CE(16:1) 2.6 (±0.199) 2.6 (±0.163) CE(18:0) 0.0 (±0.000) 1.0 (±0.329) CE(18:1) 30.0 (±0.446) 26.9 (±0.847) CE(18:2) 41.4 (±0.766) 29.7 (±1.032) <0.001 CE(18:3) 1.9 (±0.174) 1.4 (±0.100) CE(20:0) 0.5 (±0.054) 4.5 (±0.556) <0.001 CE(20:1) 0.0 (±0.000) 2.9 (±0.294) <0.001 CE(20:2) 0.0 (±0.000) 1.8 (±0.210) <0.001 CE(20:3) 0.0 (±0.000) 4.6 (±0.390) <0.001 CE(20:4) 12.6 (±0.738) 8.5 (±0.482) <0.001 CE(20:5) 2.5 (±0.235) 3.6 (±0.250) CE(22:3) 0.0 (±0.000) 0.7 (±0.115) <0.001 CE(22:4) 0.0 (±0.000) 0.9 (±0.131) <0.001 CE(22:5) 0.0 (±0.000) 1.6 (±0.163) <0.001 CE(22:6) 1.3 (±0.081) 2.2 (±0.185) <0.001 SM species SM(d18:0/16:0) 1.6 (±0.182) 2.8 (±0.773) SM(d18:1/14:0) 1.2 (±0.057) 3.6 (±0.184) <0.001 SM(d18:1/15:0) 0.5 (±0.037) 1.4 (±0.091) <0.001 SM(d18:1/16:1) 2.0 (±0.079) 4.2 (±0.174) <0.001 SM(d18:1/16:0) 13.2 (±0.381) 43.1 (±1.675) <0.001 SM(d18:1/18:0) 5.2 (±0.167) 3.3 (±0.182) <0.001 SM(d18:1/24:2) 41.8 (±0.704) 11.8 (±0.683) <0.001 SM(d18:1/24:1) 23.3 (±0.410) 19.0 (±0.753) <0.001 SM(d18:1/24:0) 11.3 (±0.480) 10.8 (±1.146) lpc species 22
23 lpc(o-16:0) 0.0 (±0.000) 0.1 (±0.045) lpc(16:0) 40.7 (±0.803) 36.5 (±1318) lpc(16:1) 0.5 (±0.087) 0.1 (±0.033) <0.001 lpc(o-18:0) 0.0 (±0.000) 1.1 (±0.162) <0.001 lpc(18:0) 13.3 (±0.317) 24.6 (±1.094) <0.001 lpc(18:1) 14.9 (±0.411) 14.5 (±1.179) lpc(18:2) 17.2 (±0.611) 9.4 (±0.629) <0.001 lpc(20:2) 0.0 (±0.000) 2.2 (±0.551) <0.001 lpc(20:3) 2.4 (±0.180) 3.2 (±0.489) lpc(20:4) 8.1 (±0.363) 5.7 (±0.962) lpc(22:0) 0.0 (±0.000) 0.1 (±0.028) lpc(22:4) 0.0 (±0.000) 1.7 (±0.688) lpc(22:5) 0.0 (±0.000) 0.3 (±0.083) lpc(22:6) 0.8 (±0.121) 0.5 (±0.139) lpc(24:6) 0.0 (±0.000) 0.1 (±0.041) PC species PC(26:0) 0.0 (±0.000) 0.7 (±0.264) PC(O-32:0) 0.1 (±0.005) 0.0 (±0.000) <0.001 PC(O-32:1) 0.1 (±0.005) 0.0 (±0.000) <0.001 PC(32:0) 0.7 (±0.017) 6.0 (±0.476) <0.001 PC(32:1) 0.9 (±0.048) 2.7 (±0.210) <0.001 PC(32:2) 0.3 (±0.007) 0.0 (±0.000) <0.001 PC(O-34:1) 0.4 (±0.013) 1.8 (±0.111) <0.001 PC(O-34:2) 0.3 (±0.012) 0.0 (±0.000) <0.001 PC(O-34:3) 0.2 (±0.009) 0.0 (±0.000) <0.001 PC(34:1) 11.8 (±0.329) 15.0 (±0.711) <0.001 PC(34:2) 15.4 (±0.407) 8.6 (±0.408) <0.001 PC(34:3) 0.6 (±0.031) 0.0 (±0.000) <0.001 PC(35:4) 0.0 (±0.000) 2.1 (±0.157) <0.001 PC(36:1) 5.2 (±0.258) 6.3 (±0.523) PC(36:2) 10.0 (±0.209) 10.0 (±0.250) PC(36:3) 7.4 (±0.170) 5.5 (±0.153) <0.001 PC(36:4) 11.9 (±0.367) 6.1 (±0.385) <0.001 PC(36:5) 2.2 (±0.151) 0.0 (±0.000) <0.001 PC(O-36:4) 0.0 (±0.000) 2.8 (±0.288) <0.001 PC(O-38:4) 1.4 (±0.032) 1.3 (±0.142)
24 PC(O-38:5) 1.7 (±0.030) 2.2 (±0.168) <0.001 PC(38:2) 2.0 (±0.090) 5.9 (±0.947) <0.001 PC(38:3) 3.7 (±0.098) 7.2 (±0.652) <0.001 PC(38:4) 7.9 (±0.287) 7.6 (±0.309) PC(38:5) 4.5 (±0.106) 2.5 (±0.133) <0.001 PC(38:6) 5.8 (±0.262) 2.4 (±0.172) <0.001 PC(O-40:5) 0.5 (±0.018) 0.0 (±0.000) <0.001 PC(O-40:6) 0.8 (±0.029) 0.0 (±0.000) <0.001 PC(40:4) 0.4 (±0.017) 0.8 (±0.067) <0.001 PC(40:5) 1.0 (±0.046) 0.9 (±0.100) PC(40:6) 2.1 (±0.096) 1.4 (±0.115) <0.001 PC(41:5) 0.1 (±0.004) 0.0 (±0.000) <0.001 PC(41:6) 0.1 (±0.005) 0.0 (±0.000) <0.001 PC(43:6) 0.0 (±0.004) 0.1 (±0.023) PC(44:12) 0.1 (±0.005) 0.1 (±0.025) Data presented are given in % (mean ± SE) for each single lipid class. * P-values were derived from unpaired Student s t-tests, bold numbers highlight p-values <
25 A Supplemental Figure I Relative Abundance B m/z Relative Abundance m/z
 P6 P7 P12 P4 P13 P14 P9 P11 P10 P5 P8 P15 CE SM lpc")
26 Supplemental Figure II Symptomatic versus asymptomatic plaques Magnitude of 2 first PCs (all measurements) P6 P7 P12 P4 P13 P14 P9 P11 P10 P5 P8 P15 CE SM lpc PC
 B")
27 A Supplemental Figure III Relative Distribution (%) B Plasma Plaque
28 A Supplemental Figure IV B Plasma Plaque

29 A Supplemental Figure V B Plasma Plaque

30 A Supplemental Figure VI B Plasma Plaque
Mass Spectrometry based metabolomics
 Mass Spectrometry based metabolomics Metabolomics- A realm of small molecules (
The use of mass spectrometry in lipidomics. Outlines
 The use of mass spectrometry in lipidomics Jeevan Prasain jprasain@uab.edu 6-2612 utlines Brief introduction to lipidomics Analytical methodology: MS/MS structure elucidation of phospholipids Phospholipid
LC/MS Method for Comprehensive Analysis of Plasma Lipids
 Application Note omics LC/MS Method for Comprehensive Analysis of Plasma s Authors Tomas Cajka and Oliver Fiehn West Coast Metabolomics Center, University of California Davis, 451 Health Sciences Drive,
Principles of Shotgun Lipidomics
 Principles of Shotgun Lipidomics Xianlin Han Diabetes and Obesity Research Center Sanford-Burnham Medical Research Institute Lake Nona Orlando, FL 32827 What is shotgun lipidomics? Original definition
Supporting Information (SI)
") Electronic Supplementary Material (ESI) for Analyst. This journal is The Royal Society of Chemistry 2015 Supporting Information (SI) Title: Optimization of Metabolite Extraction of Human Vein Tissue for
Electronic Supplementary Material (ESI) for Analyst. This journal is The Royal Society of Chemistry 2015 Supporting Information (SI) Title: Optimization of Metabolite Extraction of Human Vein Tissue for
Impact of Chromatography on Lipid Profiling of Liver Tissue Extracts
 Impact of Chromatography on Lipid Profiling of Liver Tissue Extracts Application Note Clinical Research Authors Mark Sartain and Theodore Sana Agilent Technologies, Inc. Santa Clara, California, USA Introduction
Mass-Spectrometric Analysis of Lipids (Lipidomics)
") Mass-Spectrometric Analysis of Lipids (Lipidomics) 1. Identification 2. Quantification 3. Metabolism Why to do lipidomics? Biology: Functions of different lipids? Medicine: Diagnostics and Therapy Industry:
Mass-Spectrometric Analysis of Lipids (Lipidomics) 1. Identification 2. Quantification 3. Metabolism Why to do lipidomics? Biology: Functions of different lipids? Medicine: Diagnostics and Therapy Industry:
Lipids Analysis. Lipids
 Lipids Analysis Stephen Barnes 3 5 15 Lipids Lipids are mostly very hydrophobic Most are conjugates of fatty acids of a variety of chain lengths, which have different degrees of unsaturation, cis trans
SUPPLEMENTARY DATA. Materials and Methods
 SUPPLEMENTARY DATA Materials and Methods HPLC-UV of phospholipid classes and HETE isomer determination. Fractionation of platelet lipid classes was undertaken on a Spherisorb S5W 150 x 4.6 mm column (Waters
Essential Lipidomics Experiments using the LTQ Orbitrap Hybrid Mass Spectrometer
 Application Note: 367 Essential Lipidomics Experiments using the LTQ rbitrap Hybrid Mass Spectrometer Thomas Moehring 1, Michaela Scigelova 2, Christer S. Ejsing 3, Dominik Schwudke 3, Andrej Shevchenko
LC-Based Lipidomics Analysis on QTRAP Instruments
 LC-Based Lipidomics Analysis on QTRAP Instruments Junhua Wang and Paul RS Baker SCIEX LC-Based Lipidomics Analysis Topics Covered Lipid extraction techniques Hydrophilic Interaction Chromatography (HILIC)
Glycerolipid Analysis. LC/MS/MS Analytical Services
 Glycerolipid Analysis LC/MS/MS Analytical Services Molecular Characterization and Quantitation of Glycerophospholipids in Commercial Lecithins by High Performance Liquid Chromatography with Mass Spectrometric
Suppl. Table 1: CV of pooled lipoprotein fractions analysed by ESI-MS/MS
 Supplement VLDL LDL HDL PC 3.3 1.77 1.3 LPC 4.82 2.5.35 SM 3.1 4.6 1.92 CER 2.17 6.3 4.15 PE 3.18 1.93 2.79 PE-pl 13.18 1.9 2.32 CE 2.9.65.4 FC.36 3.5 2.54 Suppl. Table 1: CV of pooled lipoprotein fractions
LC/MS/MS SOLUTIONS FOR LIPIDOMICS. Biomarker and Omics Solutions FOR DISCOVERY AND TARGETED LIPIDOMICS
 LC/MS/MS SOLUTIONS FOR LIPIDOMICS Biomarker and Omics Solutions FOR DISCOVERY AND TARGETED LIPIDOMICS Lipids play a key role in many biological processes, such as the formation of cell membranes and signaling
Agilent Solutions for Lipidomics. Greater Insight into
 Agilent Solutions for Lipidomics Greater Insight into Lipid Metabolism Understanding Lipidomics What is Lipidomics? The term "lipidome" refers to all the lipids that exist in an organism and their effects
A Monophasic Extraction Strategy for the Simultaneous Lipidome Analysis of. Polar and Nonpolar Retina Lipids
 A Monophasic Extraction Strategy for the Simultaneous Lipidome Analysis of Polar and Nonpolar Retina Lipids Todd A. Lydic 1, Julia V. Busik 2, and Gavin E. Reid 1,3* Departments of 1 Biochemistry and Molecular
Achieve Broad Lipid Quantitation using a High-Throughput Targeted Lipidomics Method
 Achieve Broad Lipid Quantitation using a High-Throughput Targeted Lipidomics Method LC-Based Approach for Lipid Class Separation and Quantitation on QTRAP 6500+ System Mackenzie Pearson, Santosh Kumar
Core E Analysis of Neutral Lipids from Human Plasma June 4, 2010 Thomas J. Leiker and Robert M. Barkley
 Core E Analysis of Neutral Lipids from Human Plasma June 4, 2010 Thomas J. Leiker and Robert M. Barkley This protocol describes the extraction and direct measurement of cholesterol esters (CEs) and triacylglycerols
SelexION Technology for Lipid Analysis: Pushing the Boundaries of Lipidomics
 ANSWERS FOR SCIENCE. KNOWLEDGE FOR LIFE. SelexION Technology for Lipid Analysis: Pushing the Boundaries of Lipidomics Baljit Ubhi, Ph.D ASMS Baltimore, June 2014 Lipidomics Profiling Needs and Deliverables
Determination of Chlorophenoxyacetic Acid and Other Acidic Herbicides Using a QuEChERS Sample Preparation Approach and LC-MS/MS Analysis
 Determination of Chlorophenoxyacetic Acid and Other Acidic Herbicides Using a QuEChERS Sample Preparation Approach and LC-MS/MS Analysis UCT Product Number: ECQUEU75CT-MP - Mylar pouch containing extraction
Increased Identification Coverage and Throughput for Complex Lipidomes
 Increased Identification Coverage and Throughput for Complex Lipidomes Reiko Kiyonami, David Peake, Yingying Huang, Thermo Fisher Scientific, San Jose, CA USA Application Note 607 Key Words Q Exactive
Obtaining Answers to Biological Questions Sample Prep to Data Analysis. Jeremiah D. Tipton, Ph.D. SCIEX Advanced Workflow Specialist in OMICS
 Obtaining Answers to Biological Questions Sample Prep to Data Analysis Jeremiah D. Tipton, Ph.D. SCIEX Advanced Workflow Specialist in OMICS OMICS Research Why Quantitative OMICS? 2 2015 AB Sciex SCIEX
Poly-unsaturated phospholipids WE (FA18:1) A B C D OAHFA 18:1/24:0 OAHFA 18:1/30:2 PS 38:4 C18:1C23:0 OAHFA 18:1/25:0 OAHFA 18:1/30:1
 A B C D OAHFA 18:1/24:0 OAHFA 18:1/30:2 PS 38:4 C18:1C23:0 OAHFA 18:1/25:0 OAHFA 18:1/30:1") Figure S1, related to Figure 1. Correlation scatter plots illustrating individual lipid species from various classes that exhibited statistically significant correlations to age. (A-B) Various species
Figure S1, related to Figure 1. Correlation scatter plots illustrating individual lipid species from various classes that exhibited statistically significant correlations to age. (A-B) Various species
DECLARATION OF CONFLICT OF INTEREST. None
 DECLARATION OF CONFLICT OF INTEREST None Plasma Lipidomic Analysis of Stable and Unstable Coronary Artery Disease Peter J Meikle 1, Gerard Wong 1, Despina Tsorotes 1, Christopher K Barlow 1, Jacquelyn
Relative Quantitation of Human Polymorphonuclear Leukocyte Cell Membrane GPEtn Lipids
 Relative Quantitation of Human Polymorphonuclear Leukocyte Cell Membrane GPEtn Lipids Using the QTRAP System with mtraq Reagents Karin A. Zemski-Berry 1, John M. Hevko 2, and Robert C. Murphy 1 1 Department
Phospholipid characterization by a TQ-MS data based identification scheme
 P-CN1716E Phospholipid characterization by a TQ-MS data based identification scheme ASMS 2017 MP-406 Tsuyoshi Nakanishi 1, Masaki Yamada 1, Ningombam Sanjib Meitei 2, 3 1 Shimadzu Corporation, Kyoto, Japan,
Supporting Information
 Supporting Information Mass Spectrometry Imaging Shows Cocaine and Methylphenidate have Opposite Effects on Major Lipids in Drosophila Brain Mai H. Philipsen *, Nhu T. N. Phan *, John S. Fletcher *, Per
Improving Coverage of the Plasma Lipidome Using Iterative MS/MS Data Acquisition Combined with Lipid Annotator Software and 6546 LC/Q-TOF
 Application Note Lipidomics Improving Coverage of the Plasma Lipidome Using Iterative MS/MS Data Acquisition Combined with Lipid Annotator Software and 6546 LC/Q-TOF Authors Jeremy Koelmel Department of
Supporting Information
 Supporting Information Development of a High Coverage Pseudotargeted Lipidomics Method Based on Ultra-High Performance Liquid Chromatography-Mass Spectrometry Qiuhui Xuan 1,2#, Chunxiu Hu 1#, Di Yu 1,2,
Overview on the identification of different classes of. lipids by HPTLC (High Performance Thin Layer. Chromatography) and ITLC (Immuno Thin Layer
 and ITLC (Immuno Thin Layer") Overview on the identification of different classes of lipids by HPTLC (High Performance Thin Layer Chromatography) and ITLC (Immuno Thin Layer Chromatography) Iuliana Popa 1, Marie-Jeanne David 2, Daniel
Overview on the identification of different classes of lipids by HPTLC (High Performance Thin Layer Chromatography) and ITLC (Immuno Thin Layer Chromatography) Iuliana Popa 1, Marie-Jeanne David 2, Daniel
Supplemental Information. LipiDex: An Integrated Software Package. for High-Confidence Lipid Identification
 Cell Systems, Volume 6 Supplemental Information LipiDex: An Integrated Software Package for High-Confidence Lipid Identification Paul D. Hutchins, Jason D. Russell, and Joshua J. Coon Figure S1. Omics
ASSAY OF SPHINGOMYELINASE ACTIVITY
 ASSAY OF SPHINGOMYELINASE ACTIVITY Protocol for Protein Extraction Stock Solution 1. Leupeptin/hydrochloride (FW 463.0,
Detection of Low Level of Chloramphenicol in Milk and Honey with MIP SPE and LC-MS-MS
 Detection of Low Level of Chloramphenicol in Milk and Honey with MIP SPE and LC-MS-MS Olga Shimelis, An Trinh, and Michael Ye Supelco, Div. of Sigma-Aldrich, Bellefonte, PA T407125 Introduction Molecularly
Shotgun lipidomics of cardiolipin molecular species in lipid extracts of biological samples
 methods Shotgun lipidomics of cardiolipin molecular species in lipid extracts of biological samples Xianlin Han, 1, *, Kui Yang,* Jingyue Yang,* Hua Cheng,* and Richard W. Gross*,,, ** Division of Bioorganic
Thermo Scientific LipidSearch Software for Lipidomics Workflows. Automated Identification and Relative. Quantitation of Lipids by LC/MS
 Thermo Scientific LipidSearch Software for Lipidomics Workflows Automated Identification and Relative of Lipids by LC/MS The promise of lipidomics Lipidomics is a new field of study crucial for understanding
New Frontiers for MS in Metabolipidomics
 New Frontiers for MS in Metabolipidomics Giuseppe Astarita, PhD Principal Scientist Discovery & Life Sciences Milford, MA USA 2011 Waters Corporation 1 Why Metabolipidomics? Biomedical Sciences o Biomarker
Enrichment of Phospholipids from Biological Matrices with Zirconium Oxide-Modified Silica Sorbents
 Enrichment of Phospholipids from Biological Matrices with Zirconium Oxide-Modified Silica Sorbents Xiaoning Lu, Jennifer E. Claus, and David S. Bell Supelco, Div. of Sigma-Aldrich Bellefonte, PA 16823
Supporting Information
 Composition and lipid spatial distribution of High Density Lipoprotein particles in subjects with Laxman Yetukuri, 1 Sanni Söderlund, 2 Artturi Koivuniemi, 3 Tuulikki Seppänen-Laakso, 1 Perttu S. Niemelä,
Characterization and direct quantitation of cerebroside
 methods Characterization and direct quantitation of cerebroside molecular species from lipid extracts by shotgun lipidomics Xianlin Han 1 and Hua Cheng Division of Bioorganic Chemistry and Molecular Pharmacology,
Lipid Class Separation Using UPC 2 /MS
 Michael D. Jones, 1,3 Giorgis Isaac, 1 Giuseppe Astarita, 1 Andrew Aubin, 1 John Shockcor, 1 Vladimir Shulaev, 2 Cristina Legido-Quigley, 3 and Norman Smith 3 1 Waters Corporation, Milford, MA, USA 2 Department
Discrimination of Human Astrocytoma Subtypes by Lipid Analysis Using Desorption Electrospray Ionization Imaging Mass Spectrometry
 Discrimination of Human Astrocytoma Subtypes by Lipid Analysis Using Desorption Electrospray Ionization Imaging Mass Spectrometry L. S. Eberlin, A. L. Dill, A. J. Golby, K. L. Ligon, J. M. Wiseman, R.
Desorption Electrospray Ionization Coupled with Ultraviolet Photodissociation for Characterization of Phospholipid Isomers in Tissue Sections
 Desorption Electrospray Ionization Coupled with Ultraviolet Photodissociation for Characterization of Phospholipid Isomers in Tissue Sections Dustin R. Klein, Clara L. Feider, Kyana Y. Garza, John Q. Lin,
Quantitative Analysis of Vit D Metabolites in Human Plasma using Exactive System
 Quantitative Analysis of Vit D Metabolites in Human Plasma using Exactive System Marta Kozak Clinical Research Applications Group Thermo Fisher Scientific San Jose CA Clinical Research use only, Not for
Ammonia chemical ionization mass spectrometry of intact diacyl phosphatidylcholine
 Ammonia chemical ionization mass spectrometry of intact diacyl phosphatidylcholine C. G. Crawford and R. D. Plattner Northern Regional Research Center, Agricultural Research Service, United States Department
Rapid Lipid Profiling of Serum by Reverse Phase UPLC-Tandem Quadrupole MS
 Rapid Lipid Profiling of Serum by Reverse Phase UPLC-Tandem Quadrupole MS Mark Ritchie and Evelyn Goh Waters Pacific Pte Ltd., Singapore A P P L I C AT ION B E N E F I T S Delivers a rapid 10-min MRM method
Supplementary Information
 Supplementary Information Molecular imaging of brain localization of liposomes in mice using MALDI mass spectrometry Annabelle Fülöp 1,2, Denis A. Sammour 1,2, Katrin Erich 1,2, Johanna von Gerichten 4,
Shotgun Proteomics MS/MS. Protein Mixture. proteolysis. Peptide Mixture. Time. Abundance. Abundance. m/z. Abundance. m/z 2. Abundance.
 Abundance Abundance Abundance Abundance Abundance Shotgun Proteomics Protein Mixture 1 2 3 MS/MS proteolysis m/z 2 3 Time µlc m/z MS 1 m/z Peptide Mixture m/z Block Diagram of a Mass Spectrometer Sample
Determination of 6-Chloropicolinic Acid (6-CPA) in Crops by Liquid Chromatography with Tandem Mass Spectrometry Detection. EPL-BAS Method No.
 in Crops by Liquid Chromatography with Tandem Mass Spectrometry Detection. EPL-BAS Method No.") Page 1 of 10 Determination of 6-Chloropicolinic Acid (6-CPA) in Crops by Liquid Chromatography with Tandem Mass Spectrometry Detection EPL-BAS Method No. 205G881B Method Summary: Residues of 6-CPA are
Page 1 of 10 Determination of 6-Chloropicolinic Acid (6-CPA) in Crops by Liquid Chromatography with Tandem Mass Spectrometry Detection EPL-BAS Method No. 205G881B Method Summary: Residues of 6-CPA are
Determination of Patulin in Apple Juice Using SPE and UHPLC-MS/MS Analysis
 Determination of Patulin in Apple Juice Using SPE and UHPLC-MS/MS Analysis UCT Part Numbers ECHLD126-P ENVIRO-CLEAN HLDVB mg/6ml SPE cartridge PE Frit SLDAID21-18UM Selectra DA UHPLC column ( 2.1 mm, 1.8
SPE-LC-MS/MS Method for the Determination of Nicotine, Cotinine, and Trans-3-hydroxycotinine in Urine
 SPE-LC-MS/MS Method for the Determination of Nicotine, Cotinine, and Trans-3-hydroxycotinine in Urine J. Jones, Thermo Fisher Scientific, Runcorn, Cheshire, UK Application Note 709 Key Words SPE, SOLA
Supporting information
 Supporting information A novel lipidomics workflow for improved human plasma identification and quantification using RPLC-MSn methods and isotope dilution strategies Evelyn Rampler 1,2,3, Angela Criscuolo
Comprehensive Lipidome Analysis by Shotgun Lipidomics on a Hybrid Quadrupole-Orbitrap-Linear Ion Trap Mass Spectrometer
 B American Society for Mass Spectrometry, 2014 J. Am. Soc. Mass Spectrom. (2015) 26:133Y148 DOI: 10.1007/s13361-014-1013-x RESEARCH ARTICLE Comprehensive Lipidome Analysis by Shotgun Lipidomics on a Hybrid
Greazy: Open-Source Software for Automated Phospholipid MS/MS Identification. Michael Kochen
 Greazy: Open-Source Software for Automated Phospholipid MS/MS Identification By Michael Kochen Thesis Submitted to the Faculty of the Graduate School of Vanderbilt University in partial fulfillment of
Large-Scale Metabolite Analysis by Laser Desorption Ionization Mass Spectrometry from Silicon Nanopost Arrays
 Supporting Information Large-Scale Metabolite Analysis by Laser Desorption Ionization Mass Spectrometry from Silicon Nanopost Arrays Andrew R. Korte, Sylwia A. Stopka, Nicholas Morris, Trust Razunguzwa,
The study of phospholipids in single cells using an integrated microfluidic device
 Supporting Information: The study of phospholipids in single cells using an integrated microfluidic device combined with matrix-assisted laser desorption/ionization mass spectrometry Weiyi Xie,, Dan Gao,
Quadrupole and Ion Trap Mass Analysers and an introduction to Resolution
 Quadrupole and Ion Trap Mass Analysers and an introduction to Resolution A simple definition of a Mass Spectrometer A Mass Spectrometer is an analytical instrument that can separate charged molecules according
Comprehensive Two-Dimensional HPLC and Informative Data Processing for Pharmaceuticals and Lipids
 PO-CON1576E Comprehensive Two-Dimensional HPLC and Informative Data Processing for Pharmaceuticals and Lipids HPLC 2015 PSB-MULTI-06 Yoshiyuki WATABE, Tetsuo IIDA, Daisuke NAKAYAMA, Kanya TSUJII, Saki
SWATH Acquisition Enables the Ultra-Fast and Accurate Determination of Novel Synthetic Opioids
 SWATH Acquisition Enables the Ultra-Fast and Accurate Determination of Novel Synthetic Opioids Data Independent Acquisition on TripleTOF and X-Series QTOF Systems for Seized Drug Analysis Oscar G. Cabrices
Comprehensive Lipid Profiling of Human Liver Tissue Extracts of Non-Alcoholic Fatty Liver Disease
 Comprehensive Lipid Profiling of Human Liver Tissue Extracts of Non-Alcoholic Fatty Liver Disease Multiplexed Precursor Ion Scanning and LipidView Software Brigitte Simons 1 and Bianca Arendt 2 1 AB SCIEX,
Analysis of Limonin in Citrus Juice Using QuEChERS and LC-MS/MS
 Analysis of Limonin in Citrus Juice Using QuEChERS and LC-MS/MS UCT Part Numbers ECQUEU7-MP Mylar pouch containing 4g MgSO4, 1g NaCl, 1g Na3Cit 2H2O and 0.5g Na2Cit 1.5H2O CUMPSC1875CB2CT 2mL dspe tube
Mass spectrometry Technologies in Lipid chemistry
 Mass spectrometry Technologies in Lipid chemistry Rabah Soliymani University Of Helsinki Protein Chemistry Unit Biomedicum Helsinki Rabah.soliymani@helsinki.fi Complex_&_dynamic_mixtures (few copies to
NON TARGETED SEARCHING FOR FOOD
 NON TARGETED SEARCHING FOR FOOD CONTAMINANTS USING ORBITRAP HIGH RESOLUTION MASS SPECTROMETRY Michal Godula 1, Adrian Charlton 2 and Klaus Mittendorf 1 1 Thermo Fisher Scientific, Dreieich, Germany 2 Food
Metabolomic fingerprinting of serum samples by direct infusion mass spectrometry
 Metabolomic fingerprinting of serum samples by direct infusion mass spectrometry Raúl González-Domínguez * Department of Chemistry, Faculty of Experimental Sciences. University of Huelva, Spain. * Corresponding
O O H. Robert S. Plumb and Paul D. Rainville Waters Corporation, Milford, MA, U.S. INTRODUCTION EXPERIMENTAL. LC /MS conditions
 Simplifying Qual/Quan Analysis in Discovery DMPK using UPLC and Xevo TQ MS Robert S. Plumb and Paul D. Rainville Waters Corporation, Milford, MA, U.S. INTRODUCTION The determination of the drug metabolism
Detection, Confirmation, and Quantification of Chloramphenicol in Honey, Shrimp and Chicken Using the Agilent 6410 LC/MS Triple Quadrupole
 Detection, Confirmation, and Quantification of Chloramphenicol in Honey, Shrimp and Chicken Using the Agilent LC/MS Triple Quadrupole Application Food Safety Authors Yanyan Fang Agilent Technologies (Shanghai),
Hiroya Hidaka *1), Masaki Takiwaki 2), Mine Yamashita 2), Shinya Otsuki 1), Kenji Kawasaki 3), Mitsutoshi Sugano 3) and Takayuki Honda 4)
, Masaki Takiwaki 2), Mine Yamashita 2), Shinya Otsuki 1), Kenji Kawasaki 3), Mitsutoshi Sugano 3) and Takayuki Honda 4)") Mild acid hydrolysis of sphingolipids yields lysosphingolipids: a matrix-assisted laser desorption and ionization time-of-flight mass spectrometry study Hiroya Hidaka *1), Masaki Takiwaki 2), Mine Yamashita
Mild acid hydrolysis of sphingolipids yields lysosphingolipids: a matrix-assisted laser desorption and ionization time-of-flight mass spectrometry study Hiroya Hidaka *1), Masaki Takiwaki 2), Mine Yamashita
Determination of Bath Salts (Pyrovalerone Analogs) in Biological Samples
 in Biological Samples") Determination of Bath Salts (Pyrovalerone Analogs) in Biological Samples Application Note Forensic Toxicology Authors Joe Crifasi Saint Louis University Forensic Toxicology Laboratory Saint Louis, Mo.
Determination of Bath Salts (Pyrovalerone Analogs) in Biological Samples Application Note Forensic Toxicology Authors Joe Crifasi Saint Louis University Forensic Toxicology Laboratory Saint Louis, Mo.
John Haselden 1, Gordon Dear 1, Jennifer H. Granger 2, and Robert S. Plumb 2. 1GlaxoSmithKline, Ware, UK; 2 Waters Corporation, Milford, MA, USA
 Challenges of Polar Compound Analysis Routine LC/MS-based analyses usually rely on using reversed-phase column chemistries (e.g. C 18, C 8, C 4 ) in their LC methodology. However, one of the shortcomings
SYNAPT G2-S High Definition MS (HDMS) System
 System") SYNAPT G2-S High Definition MS (HDMS) System High performance, versatility, and workflow efficiency of your MS system all play a crucial role in your ability to successfully reach your scientific and business
SYNAPT G2-S High Definition MS (HDMS) System High performance, versatility, and workflow efficiency of your MS system all play a crucial role in your ability to successfully reach your scientific and business
CONTENT. i iv ix. SVKM s NMIMS, School of Pharmacy and Technology Management
 CONTENT Chapter No. Title Page No. Abbreviations List of Figures List of Tables 1 Introduction 1 1.1 Practical aspects 4 1.2 Stability-indicating assay method (SIAM) 5 1.3 Regulatory aspects 6 1.4 Techniques
Supporting Information
 Supporting Information Wiley-VCH 2006 69451 Weinheim, Germany Tissue Imaging at Atmospheric Pressure using Desorption Electrospray Ionization (DESI) Mass Spectrometry Justin M. Wiseman, Demian R. Ifa,
Technical Report. Abstract: 2. Experiment. 1. Introduction. Hiroshi Tsugawa 1,*, Eiichiro Fukusaki 1
 C146-E217 Technical Report Effectiveness of Metabolomics Research Using Gas Chromatograph / Quadrupole Mass Spectrometer with High-Sensitivity and High-Speed Scanning Hiroshi Tsugawa 1,*, Eiichiro Fukusaki
Sample Preparation is Key
 PLOS ONE DOI: 10.1371/journal.pone.0117232 February 6, 2015 Presented by Katie Gibbs Sample Preparation is Key Sample extraction and instrumental analysis methods are well documented in metabolomics. Understanding
Alterations in Myocardial Cardiolipin Content and Composition Occur at the Very Earliest Stages of Diabetes: A Shotgun Lipidomics Study
 Biochemistry 2007, 46, 6417-6428 6417 Alterations in Myocardial Cardiolipin Content and Composition Occur at the Very Earliest Stages of Diabetes: A Shotgun Lipidomics Study Xianlin Han,*,, Jingyue Yang,
Applying a Novel Glycan Tagging Reagent, RapiFluor-MS, and an Integrated UPLC-FLR/QTof MS System for Low Abundant N-Glycan Analysis
 Applying a Novel Glycan Tagging Reagent, RapiFluor-MS, and an Integrated UPLC-FLR/QTof MS System for Low Abundant N-Glycan Analysis Ying Qing Yu Waters Corporation, Milford, MA, USA APPLICATION BENEFITS
Welcome! Mass Spectrometry meets Cheminformatics WCMC Metabolomics Course 2014 Tobias Kind. Course: Search of MS/MS files with the NIST MS Search GUI
 Biology Informatics Chemistry Welcome! Mass Spectrometry meets Cheminformatics WCMC Metabolomics Course 2014 Tobias Kind Course: Search of MS/MS files with the NIST MS Search GUI http://fiehnlab.ucdavis.edu/staff/kind
Determination of β2-agonists in Pork Using Agilent SampliQ SCX Solid-Phase Extraction Cartridges and Liquid Chromatography-Tandem Mass Spectrometry
 Determination of β2-agonists in Pork Using Agilent SampliQ SCX Solid-Phase Extraction Cartridges and Liquid Chromatography-Tandem Mass Spectrometry Application Note Food Safety Authors Chenhao Zhai Agilent
Accurate Quantification of Lipid Species by Electrospray Ionization Mass Spectrometry Meets a Key Challenge in Lipidomics
 Metabolites 2011, 1, 21-40; doi:10.3390/metabo1010021 Review OPEN ACCESS metabolites ISSN 2218-1989 www.mdpi.com/journal/metabolites/ Accurate Quantification of Lipid Species by Electrospray Ionization
LC-MS-based Metabolomics: Workflows, Strategies and Challenges
 LC-MS-based Metabolomics: Workflows, Strategies and Challenges Presented by: Sponsored by: Dr. Clary Clish Director of the Metabolite Profiling Platform at the Broad Institute of MIT and Harvard LC-MS-based
By Daniel C. Perrinez Morse Hall 103. Faculty Contact: Ihab H. Farag, Sc.D., P.E.
 By Daniel C. Perrinez Morse Hall 103 Faculty Contact: Ihab H. Farag, Sc.D., P.E. Overview Background Project Process Description Approach Chemicals, Equipment, and Wastes Status & Future Steps http://www.rbgsyd.nsw.gov.au/
The Investigation of Factors Contributing to Immunosuppressant Drugs Response Variability in LC-MS/MS Analysis
 The Investigation of Factors Contributing to Immunosuppressant Drugs Variability in LC-MS/MS Analysis Joseph Herman, Dayana Argoti, and Sarah Fair Thermo Fisher Scientific, Franklin, MA, USA Overview Purpose:
Relative Measurement of Zeaxanthin Stereoisomers by Chiral HPLC
 Relative Measurement of Zeaxanthin Stereoisomers by Chiral HPLC Principle To measure the relative percentages of the (3R,3 R), (3R,3 S) and (3S,3 S) stereoisomers of zeaxanthin in dietary ingredient and
Non targeted Lipidomic Analysis by Direct Infusion Mass Spectrometry. Jianzhong Chen, PhD Assistant Professor School of Optometry UAB
 Non targeted Lipidomic Analysis by Direct Infusion Mass Spectrometry Jianzhong Chen, PhD Assistant Professor School of Optometry UAB 1 Lipidome: A subset of Metabolome https://en.wikipedia.org/wiki/lipidomics
LOCALISATION, IDENTIFICATION AND SEPARATION OF MOLECULES. Gilles Frache Materials Characterization Day October 14 th 2016
 LOCALISATION, IDENTIFICATION AND SEPARATION OF MOLECULES Gilles Frache Materials Characterization Day October 14 th 2016 1 MOLECULAR ANALYSES Which focus? LOCALIZATION of molecules by Mass Spectrometry
Metabolomic and Proteomics Solutions for Integrated Biology. Christine Miller Omics Market Manager ASMS 2015
 Metabolomic and Proteomics Solutions for Integrated Biology Christine Miller Omics Market Manager ASMS 2015 Integrating Biological Analysis Using Pathways Protein A R HO R Protein B Protein X Identifies
EXPERIMENT 13: Isolation and Characterization of Erythrocyte
 EXPERIMENT 13: Isolation and Characterization of Erythrocyte Day 1: Isolation of Erythrocyte Steps 1 through 6 of the Switzer & Garrity protocol (pages 220-221) have been performed by the TA. We will be
Lecture 3. Tandem MS & Protein Sequencing
 Lecture 3 Tandem MS & Protein Sequencing Nancy Allbritton, M.D., Ph.D. Department of Physiology & Biophysics 824-9137 (office) nlallbri@uci.edu Office- Rm D349 Medical Science D Bldg. Tandem MS Steps:
Characterization of an Unknown Compound Using the LTQ Orbitrap
 Characterization of an Unknown Compound Using the LTQ rbitrap Donald Daley, Russell Scammell, Argenta Discovery Limited, 8/9 Spire Green Centre, Flex Meadow, Harlow, Essex, CM19 5TR, UK bjectives unknown
Improved method for the quantification of lysophospholipids including enol ether
 Supplemental Material Improved method for the quantification of lysophospholipids including enol ether species by liquid chromatography-tandem mass spectrometry James G. Bollinger *, Hiromi Ii*, Martin
Determination of 44 Pesticides in Foodstuffs by LC/MS/MS Application
 Determination of Pesticides in Foodstuffs by LC/MS/MS Application Food Safety Authors Masahiko Takino Agilent Technologies, Inc. Hachioji, Tokyo Japan Toshitsugu Tanaka Kobe Institute of Health Department
DIRECT EXTRACTION OF BENZODIAZEPINE METABOLITE WITH SUPERCRITICAL FLUID FROM WHOLE BLOOD
 DIRECT EXTRACTION OF BENZODIAZEPINE METABOLITE WITH SUPERCRITICAL FLUID FROM WHOLE BLOOD Kenichi TAKAICHI, Shuji SAITOH, Yoshio KUMOOKA, Noriko TSUNODA National Research Institute of Police Science, Chiba,
Acetyl-CoA Assay Kit. Catalog Number KA assays Version: 03. Intended for research use only.
 Acetyl-CoA Assay Kit Catalog Number KA0803 96 assays Version: 03 Intended for research use only www.abnova.com Table of Contents Introduction... 3 Background... 3 General Information... 4 Materials Supplied...
Metabolite identification in metabolomics: Metlin Database and interpretation of MSMS spectra
 Metabolite identification in metabolomics: Metlin Database and interpretation of MSMS spectra Jeevan K. Prasain, PhD Department of Pharmacology and Toxicology, UAB jprasain@uab.edu Outline Introduction
Future Directions: Tissue and Cell Imaging Robert C. Murphy
 LIPID MAPS Lipidomics Workshop April 19, 2009 www.lipidmaps.org m/z 806 (16:0a/22:6-PC) [M+H] + Future Directions: Tissue and Cell Imaging Robert C. Murphy 16:0/22:6 PC m/z 806.4 Department of Pharmacology
SUPPORTING INFORMATION. High Throughput Reaction Screening using Desorption Electrospray Ionization Mass Spectrometry
 Electronic Supplementary Material (ESI) for Chemical Science. This journal is The Royal Society of Chemistry 2018 SUPPORTING INFORMATION High Throughput Reaction Screening using Desorption Electrospray
Application Note # FTMS-46 solarix XR: Analysis of Complex Mixtures
 Application Note # FTMS-46 solarix XR: Analysis of Complex Mixtures Introduction Natural organic matter (NOM) as well as crude oil and crude oil fractions are very complex mixtures of organic compounds
Protein Precipitation for Biological Fluid Samples Using Agilent Captiva EMR Lipid 96-Well Plates
 Application Note Clinical Research Protein Precipitation for Biological Fluid Samples Using Agilent Captiva EMR Lipid 96-Well Plates Authors Limian Zhao and Megan Juck Agilent Technologies, Inc. Abstract
MALDI Imaging Drug Imaging Detlev Suckau Head of R&D MALDI Bruker Daltonik GmbH. December 19,
 MALDI Imaging Drug Imaging Detlev Suckau Head of R&D MALDI Bruker Daltonik GmbH December 19, 2014 1 The principle of MALDI imaging Spatially resolved mass spectra are recorded Each mass signal represents
Discovery Metabolomics - Quantitative Profiling of the Metabolome using TripleTOF Technology
 ANSWERS FOR SCIENCE. KNOWLEDGE FOR LIFE. Discovery Metabolomics - Quantitative Profiling of the Metabolome using TripleTOF Technology Baljit Ubhi Ph.D ASMS Baltimore, June 2014 What is Metabolomics? Also
A Definitive Lipidomics Workflow for Human Plasma Utilizing Off-line Enrichment and Class Specific Separation of Phospholipids
 A Definitive Lipidomics Workflow for Human Plasma Utilizing Off-line Enrichment and Class Specific Separation of Phospholipids Jeremy Netto, 1 Stephen Wong, 1 Federico Torta, 2 Pradeep Narayanaswamy, 2