University of Chester. Digital Repository. Physical demands of elite rugby league match-play and the subsequent impact on recovery
|
|
|
- Randell Ball
- 5 years ago
- Views:
Transcription
1 University of Chester Digital Repository Physical demands of elite rugby league match-play and the subsequent impact on recovery Item type Authors Publisher Thesis or dissertation Oxendale, Chelsea University of Chester Downloaded 7-Jul :09:17 Item License Link to item
2 This work has been submitted to ChesterRep the University of Chester s online research repository Author(s): Chelsea Oxendale Title: Physical demands of elite rugby league match-play and the subsequent impact on recovery Date: 2014 Originally published as: University of Chester MRes dissertation Example citation: Oxendale, C. (2014). Physical demands of elite rugby league match-play and the subsequent impact on recovery. (Unpublished master s thesis). University of Chester, United Kingdom. Version of item: Submitted version Available at:
3 Physical demands of elite rugby league match-play and the subsequent impact on recovery Chelsea Oxendale Number of words: 14,105
4 i Acknowledgments I would like to thank my supervisors, Dr Jamie Highton and Dr Craig Twist, for providing guidance and support throughout this study. I would also like to thank the staff and players of St. Helens Rugby League Club for their participation and support.
5 ii Abstract Whilst fatigue in the days after elite rugby league match-play has been well documented, the specific match actions which contribute to fatigue are not well understood. Thus, the purpose of this study was to examine the relationship between the physical demands of elite rugby league match-play and fatigue in the days after. Twenty-eight individual performances from an English Super League team were captured using a 10 Hz global positioning system (GPS). Upper and lower body neuromuscular fatigue, plasma creatine kinase (CK) and perceptual well-being were assessed 24 h before, immediately after, and at 12, 36 and 60 h after a competitive match. Backs covered more distance during sprinting (214.5 ± m) and highintensity sprinting (129.6 ± m) than forwards (142.9 ± 86.2 and 57.1 ± 67.6 m, respectively), whereas forwards experienced significantly more collisions than backs (75.1 ± 64.1 cf ± 18.8). CK concentration peaked at 12 h and remained significantly elevated up to 60 h post-match (p < 0.05). Large decrements in countermovement jump (CMJ) and small to moderate decrements in repeated plyometric push-up (RPP) performance were evident at 12 and 36 h post-match. Well-being questionnaire (WQ) score was significantly decreased up to 36 h post-match (p < 0.05), specifically large increases in perceived muscle soreness were found at 12 and 36 h. Duration (r = 0.8), total distance covered (r = 0.79) and efforts performed over 18 km h -1 (r = 0.78) were strongly associated with CK concentration. High intensity accelerations (r = 0.47) and decelerations (r = 0.45) were significantly associated with CK concentration. Total collisions and repeated high-intensity effort (RHIE) bouts were associated with decrements in RPP (r = and r = -0.51, respectively), CK concentration (r = 0.56 and r = 0.63, respectively) and perceived muscle soreness (r = and r = -0.48, respectively). The findings suggest
6 iii duration of match-play, high intensity running and collisions experienced were the strongest predictors of fatigue following elite rugby league match-play.
7 iv Declaration This work is original and has not been previously submitted in support of a Degree, qualification or other course. Signed... Date...
8 v Contents Acknowledgements... Error! Bookmark not defined. Abstract... Error! Bookmark not defined. Deceleration... iv Table of Contents... Error! Bookmark not defined. List of Figures... Error! Bookmark not defined.ii List of Tables... Error! Bookmark not defined.iii Chapter 1 - Introduction... 1 Chapter 2 - Review of Literature...7 Error! Bookmark not defined..1 Match demands Video analysis Global positioning systems Summary of match demands Recovery Changes in neuromuscular function following rugby league Changes in biochemical markers following rugby league Changes in perceptual well-being following rugby league Relationship between match demands and recovery Mechanisms of muscle damage Summary of recovery Chapter 3 - Method Participants Design Procedures Statistical analysis...47 Chapter 4 - Results...49 Chapter 5 - Discussion Conclusion...68 References...69 Appendix 1 Certificate of ethical approval...75 Appendix 2 Participant information sheet...77 Appendix 3 Informed consent form...80
9 vi Appendix 4 Well-being questionnaire...81 Appendix 5 Statistical Outputs...82
10 vii List of Figures Figure 1. Schematic representation of data collection...43 Figure 2. Changes in CK concentration after elite rugby league match-play Figure 3. Changes in CMJ flight time following elite rugby league matchplay Figure 4. Changes in total flight time and contact time during a RPP following elite rugby league match-play...54
11 viii List of Tables Table 1. Comparison of high-intensity runs performed during elite rugby league match-play...12 Table 2. Comparison of repeated high-intensity effort bouts performed during elite rugby league match-play...15 Table 3. Comparison of collisions/tackles performed during elite rugby league match-play...18 Table 4. Physical movement demands of all nine individual playing positions in professional rugby league...22 Table 5. Creatine kinase activity following elite and amateur rugby league matchplay...31 Table 6. Significant correlations between hit-up number, impact zone entries and CK immediately after rugby league match play Table 7. An example of typical training and recovery strategies performed before and after match day, in elite rugby league players...44 Table 8. Positional comparison of distance covered, duration and accelerations/decelerations during rugby league match-play...50 Table 9. Positional comparison of collisions, repeated high-intensity effort bouts and during rugby league match-play...51 Table 10. Magnitude based inferences for neuromuscular and biochemical fatigue markers at 12 h and 36 h post-match in comparison to baseline....52
12 ix Table 11. Perceptual responses to each item on the questionnaire at baseline and post-match Table 12. Magnitude based inferences for perceptual markers at 12 h and 36 h post-match in comparison to baseline Table 13. Correlations between duration and distance covered match demands and repeated plyometric push-up and creatine kinase markers at 12 h postmatch Table 14. Correlations between HI accelerations/decelerations, collision match demands and fatigue markers at 12 h post-match....57
13 1 Introduction Team sports, such as rugby league, involve frequent bouts of high intensity, intermittent activity separated by more prolonged bouts of low intensity activity (Gabbett, King & Jenkins, 2008). The physical demands of the sport are complex, involving various movement patterns (sprinting, tackling, passing) and work-to-rest ratios (King, Jenkins & Gabbett, 2009; Sykes, Twist, Hall & Nicholas, 2009), whilst players are required to have well developed qualities of speed, agility, aerobic and anaerobic power and muscular strength to excel (Meir, 1994). Unlike many other team sports, rugby league includes physical contact, in which players are required to repeatedly undergo physical collisions. During a tackle, forwards have been reported to be involved in an average of 55 collisions and backs, an average of 29 collisions (Gissance, White, Kerr & Jennings, 2001) per match. As result of these collisions, players experience blunt force trauma to skeletal muscle tissue causing neuromuscular fatigue (McLellan, Lovell & Gass, 2011a), evident by decrements in muscular power and repeated sprint performance (Singh, Guelfi, Landers, Dawson & Bishop, 2011). Indeed, symptoms of exercise-induced muscle damage, such as skeletal muscle stiffness, swelling, reduced range of movement, fatigue and loss of strength (Cheung, Huma & Maxwell, 2003), are evident for at least 48 hours following match play (McLean, Coutts, Kelly, McGuigan & Cormack, 2010) and 80 minutes of simulated rugby league exercise (Twist & Sykes, 2011). Previous studies have employed video-based time-motion analysis to quantify the movement patterns of team sports (King et al., 2009; Sirotic, Coutts, Knowles & Catterick, 2009; Sirotic, Knowles, Catterick & Coutts, 2011). Yet, video systems may
14 2 be subject to errors due to changes in gait during sport-specific actions (Edgecomb & Norton, 2006). In addition, retrospective video recording analysis prolongs the assessment of physical match demands, and the failure to operate in real time could increase measurement error (Dobson & Keogh, 2007). More recently, it has become common for sport scientists to use Global Positioning System (GPS) technology to quantify playing movements during field-based team sports. Current authorization within the rugby codes now allows for the use of GPS in Super League competition (Waldron, Twist, Highton, Worsfold & Daniels, 2011, 2011), offering a practical, nontime-consuming method of assessing the physical demands of both training and competition. An acceptable level of reliability for total distance (CV %) and peak speeds (CV %) during high intensity, intermittent exercise has been reported for previous GPS units (Coutts & Duffield, 2008; Jennings, Cormack, Coutts, Boyd & Aughey, 2010). However, the co-efficient of variation for high intensity running ( %) and very high intensity running ( %) was poor (Coutts & Duffield, 2008), due to a low sampling rate (1 Hz). Newer GPS units which sample at higher rates (10 Hz), have been found to be two to three times more valid than 5 Hz devices at detecting instantaneous velocity (CV: % cf %) and up to six-fold more reliable (CV: % cf %) (Varley, Fairweather & Aughey, 2012). In addition, 10 Hz devices were able to accurately detect the occurrence of an acceleration or deceleration (Varley, Fairweather & Aughey, 2012), and have demonstrated good reliability (CV <10%) for distance covered at low and high speed running (Johnston, Watsford, Kelly, Pine & Spurrs, 2014). The commercial
15 3 availability of current 10 Hz devices, with a more sensitive GPS receiver and improved algorithms, justifies their utilisation within current research examining the physical demands of intermittent, field based sports such as rugby league. Collisions and tackles are recognized as one of the most physiologically demanding factors within a rugby league match (Brewer, 1995), and are performed frequently throughout a game, with a typical range of 16 to 45 (Gabbett, Jenkins & Abernethy, 2012; Gabbett, 2013a, Gabbett 2013b). Generally, these physical collisions or tackles occur between intermittent sprints, without rest, and this can be termed a repeated high intensity effort (RHIE) bout. Compared with repeated sprints, the addition of a physical collision results in a greater physiological cost (Johnston & Gabbett, 2011). On average, players will perform 9 RHIE bouts during the course of a game (Gabbett, 2012), whilst Austin, Gabbett & Jenkins (2011a) reported that 70% of RHIE bouts occurred within 5 minutes of a try being scored. Thus, the monitoring RHIE bouts during matches appears warranted, as they may influence a team and individual s performance. Recent advances in GPS technology allow for the immediate measurement of RHIE bouts, however, the impact of performing RHIE bouts on recovery post-match has yet to be investigated. During the competition phase of the rugby league season, players typically have 5 to 9 days between matches (McLean, Coutts, McGuigan & Cormack, 2010). Thus monitoring fatigue after a match is important to avoid injury, performance decrements and overtraining for subsequent matches (Twist & Highton, 2013). Altogether, exercise-induced muscle damage manifests itself as a temporary
16 4 decrease in muscle function, increased muscle soreness, increased swelling of the muscles involved and an increase in intramuscular proteins in blood (Howatson & Van Sommeren, 2008). Accordingly previous authors have implemented measurements of neuromuscular function (McLellan & Lovell, 2012; Twist et al., 2012; Duffield, Murphy, Snape, Minett & Skein, 2012; Johnston, Gibson, Twist, Gabbett, MacNay & MacFarlane, 2013) and biochemical markers (McLean et al., 2010; Twist et al., 2012; McLellan, Lovell & Gass, 2010; McLellan, Lovell & Gass, 2011b; Johnston et al., 2013) to assess fatigue after rugby league match play. Traditionally, neuromuscular fatigue has been measured by means of isolated maximal isometric, concentric or eccentric muscular contractions. However, movements involving the stretch-shortening cycle (SSC) present a complex model of fatigue that may not be utilized in isolated forms of movements (Wadden, Duane, Button, Kibele & Behm, 2012). Thus movements involving the stretch-shortening cycle (SSC), such as jumping, provide a more specific assessment of neuromuscular fatigue (Nicol, Avela & Komi, 2006). Furthermore, these can be easily used within the field, and generally do not increase players existing symptoms of fatigue (Twist & Highton, 2013). Previous studies have focused on lower body decrements in neuromuscular function, however as upper body strength and power are important due to the large amount of tackling and grapping during a game (Baker & Newton, 2006), the inclusion of an upper body measure is also warranted. McLellan & Lovell (2012) found peak rate of force development (PRFD) and peak power (PP), during a counter-movement jump was decreased for up to 48 hours
17 5 post-match and peak force (PF) was decreased 30 minutes post-match. Furthermore very heavy and severe impacts during the game were significantly correlated to PRFD and PP 24 hours post-match. To date few studies have investigated the change in neuromuscular contractile properties following rugby league match-play and the relationship with match demands (Duffield, Murphy, Snape, Minett & Skein, 2012). They found decrements in isometric maximal voluntary contraction postmatch, which was associated with match playing time and mean speeds. However Duffield et al. (2012) only used amateur players within this study. Differences in match demands between playing standards has previously been reported (Gabbett, 2013), which warrants further investigation match demands have on fatigue in an elite population. In addition, Kempton, Sirotic & Coutts (2013) found a large degree of variability in high-speed activities (CV %) between matches, which further suggests fatigue following rugby league match-play could differ dependant on the demands of the matches analysed. Plasma Creatine Kinase concentration (CK) is often used as an indirect marker of muscle damage (Takarada, 2003) and has been advocated as a useful marker for monitoring inadequate recovery and muscle damage throughout a season (Hunkin, Fahrner & Gastin (2014). Twist et al. (2012) examined neuromuscular, biochemical and perceptual post-match fatigue in professional rugby league players. Large increases in CK were found in the 2 days after the match and this was associated with the number of collisions experienced during the game. However the examination of CK responses for up to 48 hours may not be extensive enough as McLellan, Lovell & Gass (2010) found CK to remain elevated for at least 120 hours after competitive rugby league match-play.
18 6 Accordingly, the purpose of the study was three-fold 1) to perform an analysis of the physical demands of elite rugby league match-play using GPS; 2) to assess immediate and prolonged fatigue post-match using biochemical markers, decrements in muscle function and perceptual measures; 3) to determine the potential relationship between match demands and fatigue post-match.
19 7 Literature Review Many studies have observed the movement demands of rugby league match play using various techniques. Previous research which has utilised video analysis and GPS was discussed. The second part of the review focused on fatigue following rugby league, quantified using measurements of neuromuscular fatigue, perceptual fatigue and changes in biochemical markers. Finally, the relationship between match demands and fatigue was discussed, along with the proposed mechanisms of fatigue. Match demands Video Analysis Video based time-motion analysis involves the quantification of movement patterns, where the observer codes movements, retrospectively, from video footage (Dobson & Keogh, 2007). A number of previous studies have utilised this method to quantify the physical demands of rugby league. King, Jenkins & Gabbett (2009) analysed the movement patterns of professional rugby league players using video analysis. One player from each of the three positional groups; outside backs (full-back, wing and centre positions), adjustables (half-back, hooker, five-eighth/standoff and loose forward) and hit-up forwards (props and second row), were studied over three matches. Video footage from three cameras were analysed using hand-motion game analysis to log frequency, distance covered and duration of the activities. Categories of intensity from 0 (no effort) to 5
20 8 (greatest effort) were assigned to different movement activities. Time spent standing (category 0), walking (category 1) and jogging (category 2) was regarded as low intensity activity. Striding and lateral movement (category 3), sprinting (category 4) and tackling (category 5) were considered as high intensity activity. Distance covered by outside backs (6265 ± 318 m) and adjustables (5908 ± 158 m) was significantly greater than that covered by hit-up forwards (4310 ± 251 m). This difference was attributed, in part, to a greater number of interchanges in the hit-up forwards as they spent approximately 21 minutes off the field of play. The absolute time spent in high intensity exercise during the whole match was significantly greater for outside backs (862 ± 99 s) and adjustables (809 ± 56 s) in comparison to hit-up forwards (568 ± 40 s). The relative percentage of time in high intensity exercise was significantly higher in outside backs (19.3 ± 1.6%) when compared with adjustables (15.0 ± 0.7%) and hit-up forwards (15.2 ± 0.1%) during the first half. No differences were found between outside backs, adjustables and hit-up forwards for the relative percentage of time spent in high intensity exercise during the second half (14.6 ± 2.5, 16.8 ± 0.8 and 18.1 ± 7.3%). The exercise-to-rest (high-intensity to low-intensity) ratio for the adjustables was ~1:5 and for both the outside backs and hit-up forwards it was ~1:6. Typically the hit-up forwards strode or sprinted over short distances (approximately 5-6 m) before becoming involved in a tackle. Adjustables covered a greater distance in the lead up to a tackle (approximately 8-12 m) and spent more time jogging and striding/moving laterally than hit-up forwards. The outside backs generally covered a greater distance before being involved in a tackle, as they often chased down a player who had broken through the defence. However, the use of only one player within each position could have misrepresented the actual match
21 9 demands for the nine positions, particularly given the findings observed in a more recent study (Austin & Kelly, 2014). Sirotic et al. (2011) examined the positional match demands of professional rugby league competition using video and notional analysis. Seventeen professional rugby league players participated in the study and were split into five positional groups; backs, forwards, fullback, hooker and service players (half-back, stand-off and lock). Physical performance measures included exercise intensity, distance travelled, time, frequency, and speed. Game specific skill measures, such as supports and tackling indices, were also recorded. Analysis of physical match activities were determined using the following movement categories; standing (0-1.0 km h -1 ), walking ( km h -1 ), jogging ( km h -1 ), low intensity running (<13.1 km h -1 ), highintensity running (>13.1 km h -1 ), very high intensity running (>18.6 km h -1 ), sprinting (>24.0 km h -1 ) and backward movement. High-intensity to low-intensity ratio for the match was similar between backs, forwards, fullback, hooker, and service players (1:9.5, 1:7.2, 1:7.3, 1:7.6 and 1:7.9, respectively). These values are slightly higher than those reported by King, Jenkins & Gabbett (2009), and could be due to a difference in methods used to assess movement activities. No differences in mean match playing speed between backs, forwards, fullback, hooker, and service players were found (6.1 ± 0.4, 6.4 ± 0.6, 6.7 ± 0.6, 6.7 ± 0.6 and 6.4 ± 0.5 km h -1 ). The full back performed more very high intensity running (>18.6 km h -1 ), due to more support runs when compared to all other positions (Sirotic et al. 2011) (Table 1), which was in agreement with previous
22 10 research (Sirotic et al., 2009). The forwards, hooker, and service players completed more tackles per minute during the match (0.41 ± 0.07, 0.34 ± 0.11, 0.31 ± 0.12 n min -1, respectively) than the backs and full back (0.12 ± 0.09, 0.05 ± 0.02 n min -1, respectively). Generally the backs had the lowest involvement in game-specific skills, however, when they did get the ball they tended to carry it further due to the space created by players in the middle of the field (Sirotic et al., 2011). The frequency of very high intensity running per minute of match play reported were higher than those more recently reported by Gabbett (2013a) (Table 1). This discrepancy could be caused by methodological differences, such as the use of video analysis rather than GPS, and slight discrepancies in high speed classification (>18.6 km h -1 compared to >18 km h -1 ). Austin, Gabbett & Jenkins (2011a) identified the frequency and duration of RHIE bouts in Australian professional rugby league. Using video analysis, movement patterns of fifteen players were recorded during five national rugby league games. A RHIE was defined as 3 or more sprints, tackles or combination of both with <21 seconds recovery between high-intensity efforts (modified from Spencer, Lawerence, Rechichi, Bichop, Dawson & Goodman (2004) to include tackling). Players were separated into three position groups; hit-up forwards, adjustables and outside backs. Hit-up forwards were involved in a significantly greater number of RHIE (12 ± 3) when compared to the adjustable and outside backs (6 ± 3 and 5 ± 1, respectively). This is in contrast to the findings of Gabbett (2013a), who observed outside backs and adjustables performed more RHIE bouts (Table 2). The inclusion of maximal accelerations ( 2.79 m s -2 ) and contact efforts as opposed to tackles within Gabbett s (2013a) study could explain these discrepancies. The total time spent in
23 11 RHIE per game for the hit-up forwards, adjustable and outside backs was 374 ± 96, 145 ± 94 and 120 ± 39 s, respectively. Of these times, hit-up forwards tended to have a higher percentage of their RHIE spent tackling (57%) than sprinting (43%). The percentage of tackling for the hit-up forwards was significantly greater than for the adjustables (49.4%) and outside backs (40.5%). From these results, Austin et al. (2011a) found the majority of RHIE bouts performed by hit-up forwards and adjustables included 1 sprint and 2 tackles whereas RHIE bouts performed by outside backs included 2 sprints and 1 tackle. Furthermore, hitup forwards completed a significantly greater number of RHIE bouts per game, despite spending an average of 26.6% less time on the field. This, along with a reduced recovery time, reflects the high intensity nature of the work demand for hitup forwards. With regards to sprints performed, 80% of all sprints completed by the hit-up forwards and adjustables were <20 m in distance whereas the outside backs completed 80% of their sprints over <30 m. The greater sprint distances performed by backs and a higher frequency of tackles performed by forwards are in agreement with previous research (Sirotic et al., 2009; Sirotic et al., 2011). Austin, Gabbett & Jenkins (2011b) examined tackling, and activities preceding tackling in professional rugby league. Using video analysis, the movement patterns of fifteen NRL players were recorded during five games. Movement was coded as 1 of 8 speeds of locomotion; standing, forward walking, backward walking, forward jogging, backward jogging, forward striding, forward sprinting and lateral movement
24 12 Table 1. Comparison of high intensity runs performed during elite rugby league match-play Study McLellan et al. (2011a) Sirotic et al. (2011) Gabbett et al. (2012) Average/total distance of high intensity runs (~ > 18 km h -1 ) (m) Hit-up Forwards Adjustables Outside Backs Additional position Forwards: Backs: 232 (total) 440 (total) 11.5 ± ± ± 0.8 Fullback: 10.7 ± 0.5 Hooker: 10.9 ± (total) 436 (total) 583 (total) Wide running forwards: 418 (total) Austin & Kelly (2013) Forwards: 17 ± 2 Backs: 18 ± 2 Gabbett (2013a) 11.9 ± ± ± Austin & Kelly (2014) Forwards: 16 ± 2.5 Backs: 17.2 ± 2.8 (King, Jenkins & Gabbett, 2009). Tackles were assessed by recording the sequence of involvement (whether a player was first, second or third to engage in the tackle). Players were separated into 3 positional groups; hit-up forwards, adjustables and outside backs, for analysis. The average number of tackles completed for hit-up forwards, adjustables and outside backs was 33.2, 17.8 and 8.2, respectively. Hit-up forwards performed the majority of tackles as the second player in the tackle contest (39%) as opposed to being the first (37%) or third (24%) player in the tackle. For the adjustables and outside backs, the tackle order involvement descending from first player contact to
25 13 second and third accordingly was 54 and 33%, 13 and 63% and 29 and 7%, respectively. The most common activity performed immediately before the tackles was sprinting for the adjustables and outside backs (28 and 44% respectively), whereas striding was the most common for hit-up forwards. These findings suggest forwards made a greater portion of 3 man tackles from low intensity activities such as standing, walking etc. whereas backs made more one-onone tackles from sprinting. Consistent with previous research (Gabbett, Jenkins & Abernethy, 2012; Twist et al., 2012, McLellan & Lovell, 2012), hit-up forwards were involved in nearly twice as many tackles as the adjustables and 4 times as many as the outside backs. Collectively, these data indicate differences in positional demands during elite rugby league match play, which highlight the need to differentiate between positions in future research. Global Positioning Systems Global positioning systems (GPS) are a recent development in time-motion analysis and offer greater practicality in comparison to traditional video analysis (Johnston, Watsford, Pine, Spurrs, Murphy & Pruyn, 2012). They track changes in position of an athlete in real-time by calculating the displacement between the signal (satellite) and the receiver (GPS unit) (Dobson & Keogh, 2007). Accordingly, their use within team sports has increased over the last decade.
26 14 Mclellan, Lovell & Gass (2011a) employed GPS to examine the physical demands of professional rugby league match play. Data from fifteen players (Forwards n = 8; Backs n = 7) during five matches was obtained, using commercially available GPSport units measuring at 5 Hz. Distance, position and running speed was categorised into 6 different speed bands. These consisted of walking (0 6.0 km h - 1 ), jogging ( km h -1 ), cruising ( km h -1 ), striding ( km h -1 ), high intensity running ( km h -1 ) and sprinting (>20.1 km h -1 ). There were no significant differences in total distance covered between forwards (4982 ± 1,185 m) and backs (5573 ± 1,128 m), backs covered more of this distance at high intensity running (147 ± 46 m) and sprinting speeds (293 ± 55 m) during the match when compared with forwards (80 ± 32 m and 152 ± 28 m, respectively). These distances were similar to those reported in a previous study employing the same speed bands (McLellan, Lovell & Gass, 2010). In this study the average distance travelled for forwards and backs was 4774 ± 1186 and 5747 ± 1095 m, respectively. Backs travelled greater distance at high intensity running (135 ± 49 m) and sprinting (290 ± 69 m) when compared with the forwards (82 ± 21 and 149 ± 32 m, respectively). McLellan et al. (2011a) reported the average duration of a sprint for forwards and backs was 2.88 ± 0.91 and 3.05 ± 0.87 s, respectively. These findings indicate backs cover greater distances at high intensity and sprinting speeds, most likely due to positional requirements and location on the outer edges and sidelines of the field (McLellan et al., 2011a). Backs had a significantly shorter recovery time between sprints than forwards (3.2 ± 1.1 min and 5.2 ± 2.2 min, respectively), however, forwards spent a significantly greater percentage of their time with heart rate (HR)
27 15 greater than 170 b min -1 compared to backs during the whole game, who spent a significantly greater percentage of their time with HR less than 90 b min -1. Forwards generally experience a higher frequency of tackles and collisions during match-play (Table 3) which have been found to produce a high physiological strain (Toner, Glickman & McArdle, 1990), and therefore could provide some justification for the differences in HR. Table 2: Comparison of repeated high intensity effort bouts performed during elite rugby league match-play. Study Austin, Gabbett & Jenkins (2011a) Gabbett (2012) Gabbett, Jenkins & Abernethy (2012) Gabbett (2013a) Hit-up forward Wide running forward Adjustables Outside backs Average 12 ±3 NR 6 ± 3 5 ± 1 8 ± 2 8 ± 1 10 ± 1 9 ± 1 9 ± 1 9 ± ± 6.2 NR 14.3 ± ± ± 5.7 Waldron et al. (2011) examined the position-specific demands of an English Super League club using portable GPS devices. Players were sub-categorized into three positional groups (hit-up forwards, outside backs and adjustables/pivots) based on similarities in playing role (King, Jenkins & Gabbett, 2009). Data on total distance covered and distance covered within four distinct speed categories, consisting of low intensity running ( km h -1 ), moderate intensity running ( km h -1 ),
28 16 high intensity running ( km h -1 ) and very high intensity sprinting (>21 km h -1 ) was recorded. In agreement with McLellan et al. (2011a), outside backs covered a greater distance during low intensity running (3262 ± 505 m) when compared with both adjustables (2365 ± 667 m) and forwards (1723 ± 743 m). In addition, outside backs covered a greater total sprint distance (316 ± 117 m) and total distance (6917 ± 1130 m) than adjustables (196 ± 56 m and 6093 ± 1232, respectively) and forwards (119 ± 86 m and 4181 ± 1829, respectively). However, when expressed as distance covered per minute of match play, forwards (95 ± 7 m min -1 ) and adjustables (94 ± 8 m min -1 ) achieved a greater relative intensity of work than outside backs (89 ± 4 m min -1. This was explained by differences in duration of match-play, in relative medium intensity running (forwards = 41 ± 5 m min -1 ; adjustables = 41 ± 6 m min -1 ) in comparison with outside backs (31 ± 5 m min -1 ). This indicates that forwards and adjustables work at a higher relative intensity but cover less absolute distance (Waldron et al., 2011). A recent study by Austin & Kelly (2013) examined the positional differences in professional rugby league match play using GPS. Movement patterns were recorded during 28 games played throughout an entire Australian professional rugby league season in 2010, using 5 Hz GPSport units. Data were clustered into two positional groups, consisting of forwards and backs, however hookers were removed from data analysis due to the variability of this position. Distances covered were calculated according to 6 movement categories; standing, walking or jogging (0-12 km h -1 ),
29 17 cruising (12-14 km h -1 ), striding (14-18 km h -1 ), high intensity running (18 20 km h -1 ), sprinting (20 24 km h -1 ) and high intensity sprinting (>24 km h -1 ). The addition of a high intensity speed zone (>18 km h -1 ) was also analysed. The mean total time of match play was 70 ± 8 minutes for forwards and 89 ± 8 minutes for backs. Total distances covered in the game for forwards and backs were 5964 ± 696 and 7628 ± 744 m, respectively. Backs covered a significantly greater distance, when compared with forwards, during high intensity running (377 ± 78 vs. 224 ± 38 m), sprinting (229 ± 60 vs. 148 ± 47 m) and high intensity sprinting (143 ± 67 vs. 60 ± 32 m). In agreement with Gabbett (2013a), the average number of entries of high intensity running was 23 ± 4 for forwards and significantly higher for backs with 35 ± 8. Forwards covered on average 432 m and backs covered 749 m per match during high intensity running. These distances covered during high intensity running are almost double those reported by McLellan et al. (2011a). The greater number of players and games analysed within this study could account for these discrepancies and highlight the need to include a greater quantity of matches for analysis (Austin & Kelly, 2013). In a similar study, Gabbett (2012) investigated the sprint demands of NRL competition and characterized the sprint patterns into playing position. Movement was recorded by a minimaxx GPS unit, over the course of 16 NRL matches. Players were grouped into hit-up forwards (prop), wide running forwards (second row, lock),
30 18 adjustables (hooker, halfback, stand-off and full back) and outside backs (center, wing). Data was Table 3: Comparison of collisions/tackles performed during elite rugby league match-play. Study Gabbett, et al. (2012) Hit-up Forwards Adjustables Outside backs Additional positional group Collisions/contacts (n) Wide-running forwards: 45 Twist et al. (2012) Forwards: 38.2 ± 18.7 Backs: 25.2 ± 8.0 Gabbett (2013a) Austin et al. (2011b) 23.3 ± ± ± 6.1 Tackles (n) McLellan & Lovell (2012) Forwards: 26.1 ± 15.3 Backs: 10.7 ± 8.9 categorized into (a) accelerations bands corresponding to mild ( m s -2 ), moderate ( m s -2 ) and maximal ( 2.79 m s -2 ) accelerations; and (b) RHIE bout defined as 3 high acceleration, high-velocity sprints (>5 m s -2 ), or contact efforts with 21 seconds of recovery between efforts. Players performed an average of 35 ± 2 sprints each game, ranging from an average of 31 ± 4 to 39 ± 5 for adjustables and hit-up forwards, respectively. The majority
31 19 (67.5%) of sprints were performed across distances of <20m, whilst approximately 85% of all sprints were performed over distances <30m. In agreement with previous research (Austin et al., 2011a), the most common sprint distance for hit-up forwards was 6-10 m (46.3%) whereas outside backs had a greater proportion (33.7%) of sprints efforts over distances of 21m. Players performed an average of 9 ± 1 RHIE bouts during a match (Table 2). When compared with repeated-sprint bouts only, 0 4 were performed during a game, highlighting the importance of repeated-effort ability for rugby league players. The majority of sprints were followed by a long recovery ( 5 minutes).these findings suggest hit-up forwards perform a greater number of short duration, maximal acceleration efforts and outside backs perform a greater number of longer duration, higher velocity sprint efforts (Gabbett, 2012). Gabbett, Jenkins & Abernethy (2012) examined the physical demands of professional rugby league match-play during competition. Thirty elite male rugby league players from a NRL squad were used in the study and data from sixteen matches was recorded using minimaxx GPS units. Players were selected from one of four positional groups representing hit-up forwards, wide-running forwards, adjustables and outside backs. Data was categorized into low and high speed bands, mild, moderate and heavy collisions, RHIE bouts, as previously described (Gabbett, 2013a) and recovery between efforts corresponding to short (<30 s), moderate (30 s 2 min) and long (>2 min). Absolute distances covered during match-play were higher for outside backs (6819 m) when compared with the hit-up forwards (3569 m), wide-running forwards (5561
32 20 m) and adjustables (6411 m), however no differences were observed for relative distances covered per minute of match-play. Outside backs covered a significantly greater distance during high speed running than adjustables and wide-running forwards (583, 436 and 418 m respectively), which were all greater than hit-up forwards (235 m) (Table 1). Hit-up forwards completed a greater number of collisions per minute of match-play (1.09 n min -1 ) than wide-running forwards, adjustables, and outside backs (0.76, 0.58 and 0.38 n min -1, respectively). All playing positions performed a similar number of RHIE bouts during a match (Table 2). In line with the research discussed above (Austin & Kelly, 2013; Austin et al., 2011a; Gabbett, 2012) these findings emphasize the importance of high speed running for outside backs. The most significant difference among playing positions were collisions and RHIE demands of match-play (Gabbett et al., 2012). In agreement with Austin et al. (2011a), hit-up forwards and wide-running forwards were involved in a collision approximately each minute, whereas adjustables and outside backs were involved approximately every 2 minutes (Table 3). McLellan & Lovell (2013) examined the positional differences in physical performance measures of professional rugby league players using 5-Hz GPS receivers (GPSport). Twelve NRL players (6 forwards and 6 backs), were monitored during 5 regular-season competition matches. Information regarding distance, position and running speed, categorised into 6 different speed bands (McLellan et al., 2011) was recorded. The total distance covered by forwards and backs was similar throughout the whole match (8442 ± 812 and 8158 ± 673 m, respectively).
33 21 These distances are considerably greater than those reported by Austin & Kelly (2013), and could indicate a high degree of variability with-in rugby league match play. In relative terms, backs covered 101 ± 8 m min -1, while forwards covered 98 ± 12 m min -1, which is in agreement with previous research (Gabbett et al., 2012; Austin & Kelly, 2013). Backs performed a greater number of sprints than forwards (25 ± 7 vs. 16 ± 5, respectively), however, total sprint distances for backs and forwards were similar (468 ± 77 and 429 ± 62 m, respectively). This is in disagreement with the findings of Gabbett et al. (2012), who found lower distances covered by forwards (Table 1). Methodological differences between speed classifications, and further separation of forwards and backs, could account for these discrepancies. Furthermore, the lack of data on movement other than sprinting within the current study makes it difficult to make comparisons with other research. Austin & Kelly (2014) quantified the movement demands of all nine individual playing positions (fullback, wing, centre, five-eight, halfback, hooker, lock, back row and prop) in professional rugby league, over 28 NRL games. Using 5 Hz GPSport units, data on distance covered, quantified into six different speed categories (Austin & Kelly, 2013) with the addition of a high-intensity speed zone (> 18 km h -1 ) was recorded. Due to the shear amount of positions analysed within the current study, the findings have been presented in Table 4. The findings of Austin & Kelly (2014) demonstrate that halfbacks, five-eights, fullbacks and back row forwards cover greater distances in general and at higher intensity during match-play. The occurrence of high intensity runs within the study
34 22 are higher than previously reported (Austin & Kelly, 2013; Gabbett 2013a). These differences resulted from the much higher frequency of high intensity efforts by the five-eight and halfback (86 and 120, respectively). Furthermore, Gabbett (2013a) quantified high intensity running as > 5 m s -1, which is slightly higher than the speed band used within the current study (18 km h -1 ). When quantified as average distance covered during high intensity running, the findings are in agreement with previous research (Austin & Kelly, 2013). Table 4: Physiological movement demands of all nine individual playing positions in professional rugby league (Austin & Kelly, 2014). Position Average playing time (min) Total distance covered (m) Average occurrences of high-intensity running (n) Average distance during high intensity running (m) Fullback 85 ± ± ± ± 2 Wing 88 ± ± ± ± 2 Centre 87 ± ± ± 9 18 ± 3 Five-eight 85 ± ± ± ± 3 Half-back 84 ± ± ± ± 4 Hooker 75 ± ± ± ± 3 Lock 63 ± ± ± ± 2 Back row 79 ± ± ± 9 18 ± 3 Prop 58 ± ± ± 6 16 ± 2 The distance covered during high intensity running for the backs ranged from 477m for the five-eight position to 925 m for fullbacks. This indicates the mean value for
35 23 backs, when grouped together could underestimate the distance covered by fullbacks and overestimate the distance covered by the five-eight (Austin & Kelly, 2014). In addition, Gabbett (2012) reported 39 high intensity running efforts per match which is over twice as much as the prop forwards. When combined with back row and lock (wide running forwards), the number of high intensity running efforts (37) was similar to Gabbett (2012). However, this demonstrates the need to separate playing positions, or only combine positions which contain similar physical characteristics, or it could produce misleading results, which over/under quantify the physical demands of specific positions. Summary of match demands Collectively, these studies suggest rugby league players have high physical demands placed on them during a match. In terms of positions, backs, particularly outside backs, perform more high-intensity running and sprints during a game than forwards (in particular hit-up forwards). These sprint efforts are generally over longer distances (>21m), whereas forwards cover shorter distances (6-10m). The forwards are involved in a greater number of collisions than backs, (~1 every minute). Backs generally have a longer recovery time between high intensity efforts than forwards, but will be in play for a longer period of time. Both positions perform RHIE bouts frequently during game, which appear to be an important indicator of performance. Typically backs will perform two sprints and one tackle, whereas forwards will perform two tackles and one sprint. These studies provide a good understanding of the physical demands of elite rugby league match-play, however, direct comparison
36 24 of results becomes problematic due to differences in methods between research studies. Recovery Changes in neuromuscular function following rugby league Twist & Sykes (2011) investigated symptoms of exercise-induced muscle damage following a simulated rugby league match. Ten males with rugby playing experience volunteered to participate in the study. The rugby league match simulation protocol (RLMSP) involved various forms of locomotion and activates (walking, jogging, maximal sprints, decelerations, simulated contacts and passive recoveries), typically seen in rugby league (Austin, Gabbett & Jenkins, 2011a; McLellan et al., 2011a; Sirotic et al., 2009). Measurements of isokinetic muscle strength and vertical jump performance were taken at baseline, immediately after (0 h) and at 24 and 48 hours following the RLMSP. Significant decreases in isokinetic torque of the knee extensors were found, in which slower velocities were impaired at all-time points (mean change at 60 deg s -1, 0 h: -26.6, 24 h: -19.9, 48 h: N m -1 ) while faster velocities were unchanged. In addition, peak isokinetic torque of the knee flexors was significantly reduced at 0 and 24 hours during slower velocities (60 deg s -1 ), and
37 25 24 hours during faster velocities (240 deg s -1 ). Peak jump height during CMJ was significantly reduced at 0 (-10%) and 24 (5%) hours following the RLMSP. The peak decrements in peak isokinetic muscle force provide strong evidence that muscle damage was present in both the knee flexors and extensors. The results suggest that strength loss following eccentric exercise (i.e. decelerations) is greater at lower angular velocities of movement, and thus maximal strength training should be avoided in the 48 hours after a game. In addition, decrements in CMJ peak height, suggest faster movement velocities with minimal loading on the muscle might be impaired to a lesser degree than those with higher loads. It must be noted the ability to control physical contact was not deemed possible in this study and as it is only a simulation, recovery following a rugby league match may differ. McLean et al. (2010) examined the changes in neuromuscular responses following professional rugby league matches during different length between-match microcycles. Twelve rugby league players from a NRL team were assessed during a 5 day, 7 day and 9 day between-match period. Changes in CMJ performance (flight time and relative power) were measured on match days and at frequent intervals between match days. Training load for each microcycle was calculated by multiplying session RPE (Foster, Florhaug, Frankin, Gottschall, Hrovatin, Parker, Doleshal & Dodge, 2001) by session duration. Daily mean training load was significantly higher in the 7 day (234) and 9 day (252) microcycle when compared with the 5 day microcycle (189). Similar to the findings of Twist & Sykes (2011), decrements in CMJ were evident. Baseline CMJ flight time values were significantly higher than day 1
38 26 and the day before the match at the end of the microcycle. In addition, baseline CMJ flight time tended to be higher than day 4 measures with values approaching significance. Duffield et al. (2012) monitored the post-match changes in neuromuscular function following amateur rugby league matches. Eleven participants took part in the study, and data was collected from 2 to 3 respective competitive matches for each participant. Decrements in neuromuscular function were assessed using a repeated counter-movement jump (CMJ), followed by isometric tests on the right knee extensors for maximal voluntary contraction (MVC), voluntary activation (VA) and twitch contractile properties of peak twitch force (Pt), rate of torque development (RTD), contraction duration (CD) and relaxation rate (RR), immediately after and 2 hours post-match. CMJ displacement was significantly reduced immediately after (4.8%), but not 2 hours post-match. MVC was significantly reduced immediately (8.4%) and 2 hours post-match (11.9%), however, VA and CD did not differ from prematch at any time post-match. Pt was significantly reduced immediately (10.6%) and 2 hours post-match (7.3%), whereas both RR and RTD were significantly slower and lower immediately post-match (9.8% and 9.6%, respectively) but not 2 hours postmatch. The findings of Duffield et al. (2012) indicate reductions in lower-body peak power and voluntary isometric torque following an amateur rugby league match. The reduction in twitch contractile properties, suggests the physical match demands result in an interruption and damage to the skeletal muscle contractile mechanisms.
39 27 In addition, the reduction in MVC and CMJ and the variability in VA suggest that post-match fatigue may be related to the peripheral skeletal muscle structure, causing a suppression of force generating capabilities. Possible mechanisms for this could be linked with the contractile unit, rather than a reduction in muscle recruitment and the regulation of calcium within the sarcomere reticulum (Gandevia, 2001). McLellan et al. (2011b) identified neuromuscular fatigue following rugby league match-play. Data on seventeen elite rugby league players, representing a NRL team was collected, during a single match. Peak rate of force development (PRFD), peak power (PP), and peak force (PF) were measured during a CMJ performed on a force platform. Reductions found in PRFD and PP at 24 hours may reflect the influence of impaired excitation-contraction coupling reported with low-frequency fatigue (MacLaren, Gibson, Parry-Billings & Edwards, 1989), whereas decreases at 30 minutes may be due to more high-frequency fatigue consisting of reductions in central drive and impairment of the action potential to initiate muscle contraction (Abbiss & Laursen, 2005). The decrease in PP, remaining until 48 hours and the reduction in PF only lasting 30 minutes post-match suggests the velocity component of PP was more sensitive to fatigue than the force component, thus maximal strength recovers more quickly than PP and PRFD after rugby league match-play (McLellan, Lovell & Gass, 2011a). Johnston, Gibson, Twist, Gabbett, MacNav & MacFarlane (2013) examined the physiological responses to an intensified period of rugby league competition. Seven rugby league players, competing in an international student tournament, involving
40 28 three 80-minute games over a 5-day period (48 hours recovery between each game), were used in the study. Measurements for upper and lower body neuromuscular fatigue, assessed by a CMJ and plyometric push-up (PP), were taken 36 hours prior to the first match. These measures where then repeated every morning for the following 6 days after the first match, between 08:00 and 10:00 am. Neuromuscular fatigue was also assessed within 2 hours after each match. Moderate reductions in peak power during CMJ were observed at 12 (Effect size [ES] = -0.7) and 36 hours after game 1 (ES=-0.73). Neuromuscular fatigue during a CMJ had not recovered by game 2 as peak power remained lower than baseline at 2 hours (ES=-0.6), 12 hours (ES=-1.07), and 36 hours (ES=-1.09) after game 2. Moderate reduction in upper body peak power at 2 (ES=-0.017), 12 (ES=-0.54) and 36 hours (ES=-0.55) were observed after game 1. After game 2, moderate to large reductions in peak power were observed at 2 (ES=-0.74), 12 (ES=-1.11) and 36 hours (ES=-0.95). These data indicate neuromuscular fatigue can accumulate over a 3-game intensified rugby league competition. In addition these appear to compromise high intensity running, maximal accelerations and defensive performance in the final game of competition (Johnston et al., 2013). In agreement with McLellan, Lovell & Gass (2011b), reductions in peak power during CMJ were observed, however no meaningful reductions were observed for peak force. Collectively, these data suggest that decrements in neuromuscular function are evident for at least 36 hours post-match, and can return to baseline within 4 days. Whilst reductions in both the velocity and force component of neuromuscular
41 29 function have been found, it is unclear whether force (Twist & Sykes, 2011; Duffield et al., 2012) remains suppressed to a greater extent than velocity or vice versa (McLellan, Lovell & Gass, 2011a; Johnston et al., 2013). Changes in biochemical markers following rugby league Twist & Sykes (2011) also assessed changes in CK activity, within the study detailed above. CK activity increased at 0 hour, significantly increased and peaked at 24 hour and remained elevated at 48 hour (mean changes: 49.8, and U L -1, respectively). Similar to previous studies assessing muscle damage following team sport simulation (Sing et al., 2011), Twist & Sykes (2011) found exercise-induced muscle damage was evident after RLMSP for up to 48 hours. Elevations in CK were similar to those previous reported by Cunniffe et al. (2010), however they observed a peak at 14 hours, rather than 24 hours. The lack of a 24 hour measurement within Cunniffe et al. s (2010) study could have caused this discrepancy, in which a true peak may have been missed. McLellan, Lovell & Gass (2010) examined CK and endocrine responses of elite rugby league players pre, during and post, match play. Saliva and blood samples were collected 24 hours pre-match, 30 minutes pre-match, within 30 minutes postmatch and at 24, 48, 72, 96 and 120 hours post-match. Plasma CK was significantly elevated immediately post-match, and at 24, 48, 72, 96 and 120 hours post-match, when compared with 24 hours pre-match (Table 5). Substantial increases in CK were identified immediately post-match (+56%) and 24 hours post-match (+91 %),
42 30 with progressive decreases in CK from 48 hours. Salivary cortisol levels significantly increased pre-match, immediately post-match and at 24 hours post-match, when compared with 24 hours pre-match. Salivary testosterone levels significantly decreased pre-match, immediately post-match and at 96 and 120 hours post match, when compared with 24 hours pre-match. These findings suggest competitive rugby league match-play results in significant amount of muscle damage post-match. Elevated CK activity peaked within 24 hours and remained elevated for at least 120 hours, consistent with previous findings (McLellan et al., 2011c; Cunniffe et al., 2010) but not all (Takarada, 2003). The use of amateur rugby union players could account for the shorter time-course of CK responses observed in Takarada s (2003) study. The combination of increases in cortisol and reduced testosterone at 30 minutes pre-match and immediately postmatch result in a low T:C ratio and predominantly a catabolic hormonal environment. These returned to baseline within 48 hours, suggesting a successful recovery of testosterone and cortisol levels. This study provides insight into CK and endocrine responses to elite rugby league match-play, however, as fatigue is multifaceted, a range of appropriate measurements, such as the inclusion of neuromuscular function, should be employed (Twist & Highton, 2013). In particular, jump procedures reflect the stretch-shortening capabilities of the lower-limb musculature, and the ability to evaluate muscle fatigue (Komi, 2000), whereas blood markers do not. McLellan et al. (2011b) identified biochemical markers of fatigue following rugby league match-play. Data on seventeen elite rugby league players, representing a
43 31 NRL team was collected, during a single match. Blood samples were collected 24 hours and 30 minutes pre-match, within 30 minutes post-match and at 24,48,72,96 and 120 hours post-match. Plasma CK was significantly elevated at all post-match time intervals (30 min: 454 ± 167, 24 h: 941 ± 392, 48 h: 592 ± 201, 72 h: 553 ± 191, 96 h: 442 ± 154 and 120 h: 365 ± 139 U L -1 ) when compared with 30 minutes prematch (Table 5). These findings indicates the presence of muscle damage up to 5 days post rugby league match play suggesting that any training performed within this time period could be compromised. Table 5. Creatine kinase activity following elite and amateur rugby league match-play Study Pre CK activity post-match (U L -1 ) 30 mins 24 hours 48 hours 72 hours 96 hours McLellan, Lovell & Gass (2011b) McLellan, Lovell & Gass (2010) 302 ± ± ± ± ± ± ± ± ± 538 ~604 ~586 ~480 Twist et al. (2012) Forwards: Backs: Forwards: Backs: Johnston, Gibson, Twist, Gabbett, MacNav & MacFarlane (2013) also examined blood CK responses to an intensified period of rugby league competition (study detailed above). Significant elevations in CK were observed at 12 and 36 hours post
44 32 game 1, and 12 and 36 hours post game 2. In addition, CK activity 12 hours after game 2 was significantly greater than CK activity 12 hours before game 2. These increases in circulating CK were similar to previous reports (Cunniffe et al., 2010) suggesting exercise-induced muscle damage following rugby league match-play was present and markers of muscle damage can accumulate over a 3-game intensified rugby league competition. Collectively, the studies outlined suggest the presence of muscle damage, lasting up to 5 days after rugby league match play and peaking around 24 hours. Changes in perceptual well-being following rugby league McLean et al. (2010) examined changes in perceptual responses (fatigue, well-being and muscle soreness) following professional rugby league and found fatigue levels were significantly higher on day 1 following the match for each training cycle, and tended to be higher at day 2 post-match, in the 7 and 9 day microcycle. Fatigue levels returned to near pre-match values on day 4 in all three microcycles. Overall well-being was significantly reduced at day 1 post-match for all microcycles and remained significantly reduced at day 2 in the 7 day and 9 day microcycle. Generally, players endured less muscle soreness in the 5 day microcycle when compared with the 7 and 9 day microcycles. The reduction in training load (determined by session RPE; Foster et al., 2001) seen in the 5 day microcycle is most likely due to the coaching staff focus on optimizing
45 33 recovery by reducing physical training. Players perception of overall well-being returned to near baseline values within 4 days following the match in each training cycle. Despite the same training being completed on day 1 for all microcycles, an accelerated return to baseline measures for general muscle soreness during the 5 day microcycle, when compared with the 7 and 9 day microcycles, suggests general muscle soreness is affected by many variables such as the extent of damage during match play. Twist & Sykes (2011) observed significant increases in perceived muscle soreness at all-time points following RLMSP with values of 0.8 ± 0.6, 3.2 ± 1.3, 5.0 ± 1.9 and 4.6 ± 3.4 at baseline, 0, 24 and 48 hours, respectively. Simialarly, Johnston et al. (2013) found perceived well-being scores were significantly reduced 12 hours post game 1, and 12 and 36 hours post game 2. This was mainly attributed to increases in perceptions of fatigue and increases in general muscle soreness. Collectively, these data suggest a prolonged increase in muscle soreness was evident for up to 48 hours post rugby league match play. Such changes may have implications for the quality of training sessions performed by athletes in the 48 hours following a rugby league match, and thus should be taken into consideration during post-match training sessions. Relationship between match demands and recovery
46 34 In an extension to the above study (McLellan et al., 2011b), McLellan et al. (2011c) linked the biochemical and endocrine responses during elite rugby league matchplay to the distribution of impacts associated with collisions. Impacts were classified into 6 different zones (zone 1: < , zone 2: , zone 3: , zone 4: , zone 5: and zone 6 >10.1 G) and the number of tackles and hit ups were recorded. The total number of impacts for forwards and backs was 858 ± 125 and 795 ± 145, respectively. The total number of tackles (20.1 ± 11.3) and hit-ups (10.9 ± 4.2) for forwards was significantly higher than backs (10.7 ± 8.0 and 9.7 ± 3.5, respectively). Significant correlations between number of hit-ups, impacts in zones 4, 5 and 6 and CK after match-play are detailed in Table 5. Strong correlations were observed for impact entries in zone 4,5,6 and CK concentrations (Table 6). Furthermore, a significant correlation was found between the number of zone 5 and 6 entries and CK 48 and 72 hours post-match. These results indicate that regardless of the nature of contact, exposure to high impact collisions during match play (>7.1 G) caused significant skeletal muscle damage that peaked 24 hours post-match. Collisions that involved heavy impacts (>8.1 G), resulted in a more prolonged increase in CK, which remained elevated for at least 72 hours (McLellan et al., 2011c). Table 6. Significant correlations between hit-up number, impact zone entries and CK immediately after rugby league match play. Impact zones I Hit up number I 4 5 6
47 35 Plasma CK U L min post h post hr post hr post McLellan & Lovell (2012) examined the neuromuscular responses to impact and collision during elite rugby league match play. Twenty-two elite male rugby league players were monitored during eight regular season competition matches using portable GPS units (GPSport). Data on the average number of tackles, number of ball carries (hit-ups) and impacts classified into 6 different impact zones (McLellan et al., 2011c) was recorded. Peak rate of force development (PRFD), peak power (PP) and peak force (PF) during a CMJ on a force plate was used to assess decrements in neuromuscular function 24 hours and 30 minutes pre-match, 30 minutes postmatch and then at 24 hour intervals for a period of 5 days. The number of hit ups performed by forwards and backs was 13.8 ± 5.2 and 11.7 ± 4.6, with forwards performing significantly more tackles than backs (Table 3). The total number of impacts within zone 4, 5 and 6 were 154 ± 44, 55 ± 17 and 41 ± 22 for forwards and 120 ± 57, 48 ± 36 and 32 ± 5 for backs, respectively. Peak rate of force development (PRFD) and peak power (PP), during a CMJ, was decreased for up to 48 hours postmatch and peak force (PF) was decreased 30 minutes post-match. Impacts within zone 4, 5 and 6 were significantly correlated to PRFD and PP 30 minutes post-match and impacts within zones 5 and 6 were significantly correlated to PRFD and PP 24 hours post-match. In agreement with previous research (McLellan
48 36 et al., 2011c), these findings indicate elite rugby league causes significant neuromuscular fatigue, which was highly dependent on the number of heavy and serve collisions performed during a game (McLellan & Lovell, 2012). However, as only collisions experienced during the match have been accounted for, the extent to which other match demands (e.g sprints, decelerations) contribute to fatigue is unknown. In a more extensive study, Twist et al. (2012) examined neuromuscular, biochemical and perceptual markers of post-match fatigue. Twenty-three professional rugby league players, separated into forwards and backs, took part in the study. Data on CK concentration, perceptual ratings of fatigue, attitude to training, muscle soreness and flight time during a CMJ was measured, one day prior to the match and in the two days afterwards. Total playing time and number of contacts performed by each player during a match, was also recorded. In line with previous research (Table 3), forwards experienced significantly more contacts during a match than backs (38.2 ± 18.7 and 25.2 ± 8.0, respectively). Large increases in the mean change for CK concentration were found for forwards (301.4 and 153.4) and backs (299.0 and 140.7) when compared to pre-match levels for day 1 and 2, respectively (Table 6). Increases in the mean changes for muscle soreness were observed for backs (1.2 and 0.9) and forwards (1.2 and 1.3), for day 1 and 2, respectively. In addition, decreases in CMJ flight time were found for backs (-2.9 and 2.3%) and forwards (-3.9 and -1.2%) for day 1 and 2, respectively.
49 37 Together, the findings of Twist et al. (2012) suggest tissue damage occurred and remained for 2 days, post-match. Correlations between total contacts and CK level in forwards (r = 0.74) suggests high intensity collisions result in acute tissue damage, which is in agreement with previous research (McLellan & Lovell, 2012). However, no relationship was found between CK and total contacts in backs, which suggests tissue damage for backs could be attributed to a combination of longer match duration and more high intensity running, accelerations and decelerations (Waldron et al., 2011) and a greater metabolic stress (Tee, Bosch & Lambert, 2007). The larger increase in muscle soreness in forwards compared with backs suggests tissue damage caused partly by the blunt trauma of physical contact, probably has a longer lasting effect on muscle soreness and fatigue induced by repeated eccentric muscle actions (Twist et al., 2012). Recovery for jump flight time was evident by day 2; however, backs still had moderate reductions in flight time at day 2, compared with forwards who only had small reductions. Moreover, an inverse relationship between contacts and flight time was observed, indicating players who are involved in more contacts showed the greatest reductions in flight time. In addition to quantifying fatigue following amateur rugby league match-play (detailed above) Duffield et al. (2012) examined the relationship between changes in neuromuscular function and the match demands. MVC was moderately related to the time on the field (r = -0.5) and the mean playing speed (r = -0.4). Furthermore, mean speed (r = 0.35) and distance covered during low speed running (r = 0.37) was moderately correlated with the % change in VA post (1.2%) and 2 hours post (1%),
50 38 although these were not significant. From these findings Duffield et al. (2012) suggests mean speed, distance covered during low intensity running and time in play could account for some variability in post-match decrements in neuromuscular function. However, the use of amateur players, who have reduced match-demands in comparison to elite rugby league players (King et al., 2009) and the lack of strong correlations, warrant further investigation into the relationship between matchdemands and the effect on neuromuscular function. Mechanisms of muscle damage Although the exact mechanisms of muscle damage are not fully understood, previous research has divided this phenomenon into two general areas; primary damage (metabolic and mechanical), and secondary damage associated with the inflammatory response (Howatson & Van Someren, 2008). Mechanical disruption relates to damage that occurs from mechanical loading on the myofibres (Howatson & Van Someren, 2008). The weakest sacromeres are located at different regions of each myofibril, and it is believed the non-uniform lengthening of these sacromeres results in some myofibres being over-stretched and thus no longer able to overlap (Talbot & Morgan, 1996). Consequently, the longest sarcomeres become weaker, thus passive structures assume more tension (Howatson & Van Someren, 2008) and undergo what is termed popping (Morgan, 1990). This encompasses a shearing of myofibrils, exposing membranes, especially t-tubules, to large deformations (Morgan & Proske, 2004), leading to a loss of
51 39 calcium ion homeostasis, mechanical disruption of the actin-myosin bonds, and a decrease in force production (Zhou, Li & Wang, 2011). In an alternative view, damage is associated with excitation-contraction (E-C) coupling. This process involves a sequence of events that starts with the passage of the action potential along the plasmalemma and ends with the release of calcium (Ingalls, Warren, Williams, Ward & Armstrong, 1998). Following eccentric exercise, a reduced efficiency of the E-C coupling process has been demonstrated (Byrne, Twist & Eston, 2004). However, it could be argued an increase in calcium is secondary to mechanical stress. The metabolic stress model proposes that the initial events of muscle damage are caused by metabolic deficiencies within the working muscle. During physical activity metabolic flux through the glycolytic and oxidative metabolic pathways is increased to match the increased rate of adenosine triphosphate (ATP) synthesis, for muscular contraction (Krisanda, Moreland & Kushmerick, 1988). However, as there is always a reduction in the concentration of phosphates, the level of ATP could decrease to concentrations sufficiently low to induce muscle damage, particularly in the presence of glycogen depletion (Tee et al., 2007). The proposed mechanism for metabolic muscle injury would be a decreased action of the calcium adenosine triphosphatase (ATPase), compromising the removal of calcium (Tee et al., 2007). In addition an increase in hydrogen ions, effecting the ability of the sarcomere reticulum to take up calcium (Kendall & Eston, 2002), insufficient mitochondrial respiration and oxygen free radial production (Armstrong, 1990) have also been associated with the initial stimulus for damage. Of these possible causes associated with exercise induced muscle damage, the loss of calcium homeostasis may activate free fatty acids which
52 40 can leave the cell membranes vulnerable to free radial attack, resulting in cell dysfunction (Kendall & Eston, 2002). However, metabolic factors seem to be unlikely causes of muscle damage following eccentrically biased exercise, due to a lower metabolic cost when compared with concentric actions (Howatson & Van Someren, 2008). The secondary phase of muscle damage is initiated by this disruption of the intracellular calcium homeostasis (Howatson & Someren, 2008). This can trigger proteolysis (the breakdown of proteins) and facilitate breakdown of the damaged fibres (Proske & Allen, 2005), Accompanying this is the inflammatory response, in which damaged areas are invaded by leucocytes, in particular neutrophils and macrophages (Tidball, 2004). These leucocytes primarily perform three functions; attack and breakdown of debris, removal of cellular debris and regeneration of cells (Kendall & Eston, 2002). In doing so, neutrophil activation can release high concentrations of cytolytic and cytotoxic molecules that can damage muscle and healthy tissues (Tiddus, 1998). This inflammation is accompanied by edema, which is thought to be responsible for the muscle swelling and the associated soreness (Proske & Allen, 2005). Altogether, exercise-induced muscle damage manifests itself as a temporary decrease in muscle function, increased muscle soreness, increased swelling of the muscles involved and an increase in intramuscular proteins in blood (Howatson & Van Sommeren, 2008). Summary of recovery Collectively, the above research suggests muscle damage is evident following contact sports such as rugby league, which generally manifests itself as a temporary
53 41 decrease in muscle function, increased muscle swelling and soreness and increased intramuscular proteins in the blood. CK activity tends to increase post-match, peak at around 24 hours and gradually decline to baseline values after 72 hours. However significant increases in CK have been observed up to 120 hours post-match. Measurements of neuromuscular and perceptual fatigue are generally reduced immediately after, at 24 and 48 hours post-match, but can return to baseline within 4 days. Typically, a positive correlation exists between the number of heavy/severe tackles performed during a match and markers of fatigue, in particular blood markers and neuromuscular measurements. It has been suggested the number of accelerations and decelerations performed during a match could also impact on a players recovery, however this has yet to be examined. When players are required to play multiple matches without adequate rest, recovery manifests over the consecutive matches and can compromise high intensity running, maximal accelerations and defensive performance. Therefore, assessing the relationship between match demands and recovery post-match can provide information on what sport specific activities contribute towards fatigue.
54 42 Method Participants After gaining ethical approval from the Ethics Committee of the Facility of Applied Sciences, 17 elite level rugby league players (age: 24.5 ± 4.4 yrs, stature: 1.84 ± 0.06 m, body mass 98.5 ± 10.3 kg) from an English Super League team, participated in the study. Data were collected over four competitive matches culminating in data from a total of 28 individual performances (1.6 ± 0.8). This sample size was based on the estimated G* power (Faul, Erdfelder, Buchner & Lang, 2009) using previously reported effect sizes (Twist et al., 2012). Players were sub-categorised into two positional groups: forwards and backs, for the analyses of match demands and grouped together for the analysis of recovery. Only players who were deemed free of injury and fit to play in a match during the time of testing were used within the study. Players were briefed on all the procedures and completed a habituation process to familiarise themselves with the requirements of the study. All players provided written informed consent for their data to be used. Design A repeated measures design was used within the study (Figure 1). During preseason players underwent a familiarization period, in which they wore GPS during training sessions and participated in neuromuscular (counter movement jump [CMJ] and repeated plyometric push up [RPP]), perceptual (well-being questionnaire [WQ]) and biochemical (creatine kinase [CK]) measurements post training.
55 Baseline Match 30 min 12 h 36 h 60 h 43 CK RPP CMJ WQ GPS CK RPP CMJ WQ CK RPP CMJ WQ CK RPP CMJ WQ CK RPP CMJ WQ Figure 1. Schematic representation of data collection. After a rest day, players reported to the training ground, at approximately 9 am, on the day before the match. During this time, baseline measurements for CK, RPP, CMJ and WQ were taken in that order. The next day, players competed in a rugby league match, during which the physical demands of selected players were recorded using GPS units. Measurements for biochemical (CK) responses, followed by neuromuscular and perceptual measures (RPP, CMJ, WQ) were repeated at regular intervals after the match (Figure 1). An example of the training schedule and recovery strategies used around a match are outlined in Table 7. Procedures GPS Match demands were recorded using MinimaxX GPS units (Team 2.5, Catapult Innovations, Melbourne, Australia) sampling at 10 Hz. All players wore custom designed vest, housing the portable GPS tracking unit, positioned on the trapezius
56 44 Table 7. An example of typical training and recovery strategies performed before and after a match day. Day 1 pre- Match day Day 1 post- Day 2 post- Day 3 post- match match match match Morning Testing Rest Testing Testing Testing Captains run 50 point Rest Resistance session recovery session training min 30 min Afternoon Rest Pre-match warm up min Rest Rest Team training (skills) min Match 80 min Testing: comprised blood samples for assessing CK, neuromuscular measurements (CMJ, RPP) and perceptual measures. Captains run session: attack and defence patterns and game structure. 50 point recovery session: Incorporating low intensity exercise, stretching, foam rolling, compression garments, ice baths and massage. Resistance training: typical exercises include squat variations, bench press, shoulder press, horizontal pull, power clean and push/pull variations. Team training (skills): attack and defensive patterns and general skills. Rest: No structured training, players encouraged to rest. muscle. Prior to the warm up, all units were simultaneously activated at pitch side. Distance covered was calculated according to six movement categories; walking or jogging (0-12 km h -1 ), cruising (12-14 km h -1 ), striding (14-18 km h -1 ), high intensity running (18-20 km h -1 ), sprinting (20-24 km h -1 ) and high intensity sprinting (> 24 km h -1, as used in previous research (Austin & Kelly, 2014). Total high intensity running (> 18 km h -1 ) was also calculated.
57 45 Collisions experienced by the players were determined via accelerometer and gyroscope data provided in G force. For a collision to be registered, the athlete maintained a non-vertical position either; leaning forward by more than 60 degrees, leaning backwards by more than 30 degrees or leaning left or right by more than 45 degrees for one second. Combined G-force was calculated as the average acceleration on each directional axis. Each collisions was coded into one of six classification zones according to their severity; very light (0-2 G), light (2-3 G), moderate (3-4.5 G), heavy (4.5-6 G), very heavy (6-8 G) and severe (>8 G). These bands were based on pilot studies with the units, as no previous research has quantified the severity of collisions using MinimaxX devices. Maximal accelerations and decelerations, classified as greater than 2.79 m s -2 and RHIE bouts, defined as three or more maximal accelerations, high velocity sprints (>5 m s -2 ), or contact efforts with less than 21 seconds recovery between efforts (Gabbett & Mulvey, 2008; Gabbett, Jenkins & Abernethy, 2012), were recorded. Creatine Kinase (CK) activity In a seated position, CK concentration was determined from 30 µl of capillarized, whole blood. Samples were obtained from a single fingertip using a spring-loaded disposable lancet. Blood was then analysed using a colorimetric assay procedure (Reflotron, Type 4, Boehringer, Mannheim, Germany). All samples were taken at the same time (09:00 11:00) (with the exception of the 30 minute post-match measurement) to reduce the effects of diurnal variation.
58 46 Repeated plyometric push-up (RPP) Participants commenced in a press up position, with their hands placed on the floor 70cm apart from the participants index finger. Participants then rapidly flexed their elbows to approximately 90 degrees before maximally exploding off the floor, clapping their hands together, and landing with their arms fully extended. This was repeated three times within quick succession using an Optojump timing mat system (Optojump, Microgate, Microgate S.r.l., Bolzano, Italy). Flight time and contact time for each push up was recorded, and the total flight time and contact time was reported and used for comparison. After completing one sub-maximal plyometric push up as a warm up, participants performed two maximal RPP efforts, with one minute recovery after the warm up and in-between each effort. Reliability data for this measurement with the same group of players showed a co-efficient of variation of 5.5% for total flight time and 3.2% for total contact time. Counter-movement jump (CMJ) Participants began standing upright in a shoulder width stance, with their hands placed onto their hips. They rapidly flexed their knees to approximately 90 degrees, before jumping to maximal height. Flight time was recorded based on recommendations from current research (Cormack, Newton, McGuigan & Doyle, 2008), as it provided the most reliable performance measure. Similar to the RPP protocol, participants completed one sub-maximal practice jump as a warm up, then after one minute, performed two maximal CMJ, with one minute of rest between each jump. The greatest flight time was used for analysis. This procedure has been adapted from previous research (McLellan et al., 2011b). All CMJs were recorded
59 47 using a timing mat system (Just Jump System, Probotics, Inc., Huntsville, AL). Reliability data, determined from CMJ flight time taken after a rest day and then repeated the following week, showed a co-efficient of variation of 2.7%. Well-being Questionnaire Based on the well-being questionnaire devised by McLean et al. (2010) players provided a rating of six perceived measures of fatigue. The questionnaire assessed their stress, fatigue, sleep quality, well-being, soreness and injury on a seven point Likert scale ranging from 0 (poor) to 6 (excellent) (Appendix 4). Although subjective, this questionnaire allows for complex psycho-physiological stresses to be monitored, all of which are associated with poor recovery (Twist & Highton, 2013). The coefficient of variation for stress, fatigue, soreness, well-being, sleep quality and injury was 11.0, 9.9, 15.2, 9.7, 18.1 and 16.7%, respectively. Statistical Analysis The statistical software package SPSS (v, 20; SPSS Inc., Chicago, IL) and Microsoft Excel were used for data analysis. Descriptive statistics (mean ± SD) were calculated for all dependant variables. Individual data were grouped into forwards and backs for match demands and was combined for recovery analysis. Differences in distance covered in each speed zone, RHIE bouts, accelerations, decelerations and collisions, were determined using multiple one-way analyses of variance (ANOVAs). Sphericity was assessed via Mauchly s test, with any violations accounted for via the Greenhouse-Geisser statistic. Independent t-tests were used to
60 48 follow up any significant effects. Differences in fatigue markers were analysed using repeated measures ANOVAs, and any statistical differences were followed up with paired samples t-tests. Effect sizes and magnitude based inferences, as previously suggested by Twist and Highton (2013), were also calculated for GPS variables and fatigue markers at 12 and 36 hours post-match. Threshold probabilities for a considerable effect based on the 90% confidence intervals were: >0.5% most unlikely, 0.5-5% very unlikely, 5-25% unlikely, 25-75% possibly, 75-95% likely, % very likely, > 99.5% most likely. The magnitude of the observed change were determined as the within-participant standard deviation x 0.2, 0.5 and 0.8 for a small, moderate and large effect (Cohen, 1988). Effects with confidence limits across a likely small positive or negative change were classified as unclear (Hopkins, Marshall, Batterham & Hannin, 2006). All calculations were completed using a predesigned spreadsheet (Hopkins, 2006). Pearson s correlation was used to assess the relationship between match demands and recovery post-match. Where appropriate the alpha level was set at p < 0.05.
61 49 Results Match-demands ANOVA revealed significant differences in the distance covered between each speed zone per minute of match-play (F = 1849, p < 0.05), however there was no interaction between position and distance covered (F = 0.57, p > 0.05). Significantly fewer meters per minute were covered as the speed increased, excluding cruising and striding zones which were not significantly different (t = 0.86, p > 0.05) from one another (Table 8). Significant differences between the number of collisions at different severities were observed (F = 18.5, p < 0.05), with the differences associated with position approaching significance (F = 2.82, p = 0.083). Players experienced significantly less collisions as the severity increased (Table 9), although no difference was observed between very light and light (t = , p > 0.05), very light and moderate (t = , p > 0.05) and light and moderate collisions (t = 0.616, p > 0.05). Positional comparisons for all other match-demands revealed forwards experienced significantly more total collisions than backs (t = 2.188, p < 0.05). Whilst no other significant differences were observed between positions, magnitude-based inferences indicated likely to very likely positional effects for cruising, sprinting and high intensity sprinting relative to duration of match-play, high intensity accelerations, very light to moderate collisions experienced, total RHIE bouts and efforts performed over 18 km h -1 (Table 8 and Table 9).
62 50 Table 8. Positional comparison of distance covered, duration and accelerations/decelerations during rugby league match-play. Forwards (n = 17) Backs (n = 11) Mean diff ± 90% confidence interval Qualitative interpretation Duration (min) 55:14 ± 21:26 67:10 ± 25:18 11:56 ± 16:42 Unclear Total distance (m) 4675 ± ± ± Unclear Distance: Walking/jogging (m) ± ± ± 1089 Unclear m min ± ± ± 4.7 Unclear Cruising distance (m) ± ± ± Unclear m min ± ± ± 1.4 Likely, moderate Striding distance (m) ± ± ± Unclear m min ± ± ± 1.3 Unclear HI running (m) ± ± ± 46.5 Unclear m min ± ± ± 0.5 Unclear Sprinting (m) ± ± ± 75.1 Likely, moderate m min ± ± ± 0.8 Likely, moderate HI sprinting (m) 57.1 ± ± ± 68.6 Likely, moderate m min ± ± ± 0.7 Likely, large Total efforts over ± ± ± 10.7 Likely, moderate km h -1 HI accelerations 4.7 ± ± ± 3.8 Likely, large HI decelerations 8.4 ± ± ± 3.7 Unclear
63 51 Table 9. Positional comparison of collisions and repeated high-intensity effort bouts during rugby league match-play. Collisions (n): Forwards (n = 17) Backs (n = 11) Mean diff ± 90% confidence interval Qualitative interpretation Very light (0-2 G) 21.0 ± ± ± 13.3 Likely, moderate Light (2-3 G) 24.2 ± ± ± 7.9 Very likely, large Moderate (3-4.5 G) 21.3 ± ± ± 6.2 Likely, moderate Heavy (4.5-6 G) 6.1 ± ± ± 3.0 Unclear Very heavy (6-8 G) 1.8 ± ± ± 1.4 Unclear Severe (8-15 G) 0.7 ± ± ± 0.9 Unclear Total 75.1 ± ± ± 29.5 Likely, moderate RHIE bouts (n) 14.4 ± ± ± 5.1 Likely, small Recovery Changes in CK concentration over time are presented in Figure 2. ANOVA revealed significant differences in CK concentration over each time point (F = 13.2, p < 0.05). CK concentration was significantly elevated at 30 minutes (t = -5.7, p < 0.05), 12 hours (t = , p < 0.05), and 36 hours (t = , p < 0.05), returning to baseline at 60 hours post-match. These differences were most likely large increases at 12 and 36 hours post-match (Table 10).
64 52 Table 10. Magnitude based inferences for neuromuscular and biochemical fatigue markers at 12 h and 36 h post-match in comparison to baseline. Baseline to 12 h Baseline to 36 h Mean diff ± 90% confidence interval Qualitative interpretation Mean diff ± 90% confidence interval Qualitative interpretation RPP flight time (s) ± 0.1 Possibly, small ± 0.1 Likely, moderate RPP contact time 0.0 ± 0.1 Unclear, trivial 0.01 ± 0.1 Unclear, trivial (s) CMJ (s) ± 0.0 Very likely, large ± 0.0 Very likely, large CK (U.L¹) ± Most likely, large ± Most likely, large CK concentration (U.L ¹) * * * Baseline 30 mins 12 h 36 h 60 h Time Figure 2. Changes in CK concentration after elite rugby league match-play. * Significantly different from baseline values. Significantly different from 30 minutes post values.
65 53 Average CMJ flight time decreased (F = 5.781, p < 0.05) at 12 hours (t = 4.108, p < 0.05) and 36 hours post-match (t = 2.872, p < 0.05) in comparison to baseline (Figure 3). The magnitude of change at these time points was very likely large (Table 10) CMJ flight time (seconds) * * Baseline 30 mins 12 h 36 h 60 h Time Figure 3. Changes in CMJ flight time following elite rugby league match-play. * Significantly different from baseline values. Total flight time and contact time during a RPP are displayed in Figure 4. ANOVA failed to show significant differences in flight time and contact time at 12 hours and 36 hours post-match compared to baseline (F = 2.684, p > 0.05). However, as shown in Table 10, observed effect sizes demonstrated possibly small and likely moderate decrements in flight time at 12 and 36 hours, respectively.
66 RPP flight time (seconds) RPP contact time (seconds) Baseline 30 mins 12 h 36 h 60 h Time flight time contact time Figure 4. Changes in total flight time and contact time during a RPP following elite rugby league match-play. Table 11. Perceptual responses to each item on the questionnaire following elite rugby league match play. Stress Fatigue Soreness Wellbeing Sleep quality Injury Baseline 4.7 ± ± ± ± ± ± min 4.2 ± ± ± ± ± ± h 4.4 ± ± 1.2* 3.6 ± 1.3* 4.2 ± 1.0* 3.3 ± 1.6* 3.6 ± 1.5* 36 h 4.8 ± ± 0.8* 3.9 ± 1.0* 4.2 ± 0.7* 4.2 ± ± 1.3* 60 h 4.7 ± ± ± ± ± ± 1.2 * Significantly different from baseline values (p<0.05).
67 55 Table 12. Magnitude based inferences for perceptual markers at 12 h and 36 h post-match in comparison to baseline. Baseline to 12 h Baseline to 36 h Mean diff ± 90% confidence interval Qualitative interpretation Mean diff ± 90% confidence interval Qualitative interpretation Questionnaire: Stress ± 0.4 Possibly, 0.05 ± 0.5 Unclear, trivial small Fatigue -1.4 ± 0.5 Most likely, large -1.0 ± 0.4 Most likely, large Soreness -1.1 ± 0.5 Most likely, large -0.8 ± 0.5 Very likely, large Well-being -0.7 ± 0.4 Very likely, moderate -0.7 ± 0.3 Most likely, large Sleep quality -1.1 ± 0.6 Very likely, -0.1 ± 0.5 Unclear, trivial moderate Injury -1.2 ± 0.6 Very likely, large -0.7 ± 0.6 Likely, moderate Table 11 displays perceptual responses to each question at baseline and postmatch. Baseline WQ score was 28.2 ± 3.6, which decreased to 24.5 ± 6.0 at 30 minutes, 22.4 ± 5.8 at 12 hours, 24.9 ± 4.6 at 36 hours and 27.6 ± 4.4 at 60 hours post-match. Significant decrements (F = 5.018, p < 0.05) in perceptual score at 30
68 56 minutes (t = 3.584, p < 0.05), 12 hours (t = 5.789, p < 0.05) and 36 hours post-match (t = 3.771, p < 0.05) were observed in comparison to baseline. Fatigue score significantly decreased at 12 (t=4.676, p < 0.05) and 36 hours (t = 3.990, p < 0.05) in comparison to baseline. Similarly, perceived soreness, well-being and injury score decreased at 12 (t = 4.974, p < 0.05; t = 4.149, p < 0.05 and t = 4.626, p < 0.05, respectively) and 36 hours (t = 3.286, p < 0.05; t = 3.873, p < 0.05 and t = 3.302, p < 0.05, respectively). Sleep quality displayed decrements at 12 hours (t = 4.626, p < 0.05), returning to baseline at 36 hours post-match. Calculated probabilistic inferences based on effect size, demonstrated agreement with significant effects (Table 12). Relationship between match demands and recovery Correlations for selected match demands, based on previous research (Nedelec, McCall, Carling, Legall, Berthoin & Dupont, 2014) are presented in Table 13 and 14. Correlations for CMJ flight time were all r < 0.3. Additional correlations can be found in Appendix 5. Contact time during the RPP and other perceptual markers (stress, well-being and injury) were not included within correlational analysis.
69 57 Table 13. Correlations between duration and distance covered match demands and repeated plyometric push-up and creatine kinase markers at 12 h post-match. Match demands Fatigue markers RPP flight time CK r R² r R² Duration * 0.64 Total distance (m) * 0.62 Distance: HI running (m) m min -1 Sprinting (m) m min -1 HI Sprinting (m) m min * * 0.53* 0.54* 0.52* Efforts over 18 km h -1 (n) * 0.61 * Significant correlation (p<0.05). Table 14. Correlations between HI accelerations/decelerations, collision match demands and fatigue markers at 12 h post-match. Match Fatigue markers demands RPP flight time CK Questionnaire Fatigue Soreness r R² r R² r R² r R² HI accels (n) * HI decels (n) * * Total -0.49* * * 0.27 collisions (n) Total RHIE bouts (n) -0.51* * * 0.23 * Significant correlation (p<0.05).
70 58 Discussion To the author s knowledge this is the first study to examine the relationship between the physical demands of elite rugby league match-play, and changes in neuromuscular function, biochemical responses and perceptual fatigue in the days after a match. The key findings of the study were reductions in upper body neuromuscular function and elevations in CK concentration and perceived muscle soreness were associated with duration of match-play, distance covered during highintensity running (>18 km h -1 ) and total collisions and RHIE bouts performed during the matches analysed. Movement demands reported within the current study show some discrepancies with previous literature. Total distance covered was typically lower than previously reported by McLellan & Lovell (2013) who found both forwards and backs covered around 8000 m, competing in the Australian National Rugby League (NRL). Waldron et al. (2011) reported total distances of 6917 ± 1130 m, 6093 ± 1232 m and 4181 ± 1829 m for outside backs, adjustables and hit-up forwards, respectively. These distances demonstrate agreement with distances covered by forwards in the current study (4596 ± 1863 m), but are somewhat higher than the total distance covered by backs (5640 ± 2191). However, when expressed relative to match time, the distance covered by backs was similar to that reported by Waldron et al. (2011) (83 cf. ~89 m), and thus this discrepancy might, in part, be explained by a shorter playing time in the current study.
71 59 There were likely moderate increases in the distance covered during sprinting (215 ± 118 m), high intensity sprinting (130 ± 111 m) and total efforts over 18 km h -1 (32 ± 17) in backs compared to forwards (140 ± 86 m, 56 ± 68 m and 21 ± 13, respectively). This is in line with previous research (McLellan et al., 2011a; Waldron et al., 2011) who reported similar distances covered at sprinting speeds for forwards m and backs m. However, the values are lower than those reported for elite Australian rugby league ( m) (Gabbett et al., 2012). This could be attributed to differences in the standard of league competition as Twist, Highton, Waldron, Edwards, Austin & Gabbett (2014) found relative high-speed running distance was greater in NRL matches in comparison to Super League. Comparisons between forwards and backs, for measured relative distances covered at sprinting and high intensity sprinting (Table 8) show backs perform more high intensity work per minute of match-play, in line with previous research (Sirotic et al., 2011) Overall, the data indicates that backs participate in a greater amount of high intensity running when compared with forwards.. Backs performed a likely large number of maximal accelerations in comparison to forwards (4.7 cf. 9.1), whereas the number of maximal decelerations performed between both positions was similar (8.4 cf. 9.6). Shorter sprint distances (6 10 m) typical in hit-up forwards and a lower peak velocity during a match (7.8 m s -1 ) in comparison to outside backs (8.18 m s -1 ) (Gabbett, 2013b) could explain why less maximal accelerations were registered for forwards. The longer sprint distances for outside backs (>21 m) (Gabbett, 2013b) would allow them to achieve higher speeds and thus more maximal accelerations. Maximal decelerations occur regularly throughout the match, regardless of positions, and could be due to rapid changes of
72 60 direction to return to the defensive-line particularly when the opposing team gains possession of the ball. Forwards experienced a likely, moderate to large amount of very light to moderate collisions, and thus total collisions, in comparison to backs. Total collisions were higher than those previously reported; ranging from 16 to 45 (Gabbett et al., 2012; Gabbett, 2013; Twist et al., 2012). In contrast McLellan et al., (2011c) found forwards and backs experienced 858 ± 125 and 795 ± 145 impacts during rugby league match-play. These vast disparities could partly be due to differences in collision bands analysed and the GPS units used. The GPSport units utilised by McLellan et al. (2011c) calculated combined G force as a sum of the G force on each direction plane, whereas Catapult MinimaxX units averages the combined G force. RHIE bouts occurred regularly throughout the game, and was consistent with previous reports (Gabbett, 2012; Gabbett, 2013a). Forwards performed more repeated efforts than in comparison to backs, in agreement with Gabbett et al. (2012). These data, coupled with the fact higher standard rugby league teams perform more repeated efforts during a match (Gabbett, 2013), indicates repeated sprints incorporating physical collisions are essential to fully prepare players for the demands of competition. Collectively these GPS data indicate that backs have more space to run and therefore are able to attain higher speeds, due to less collisions experienced and specific roles such as retrieving and chasing kicks. The most likely, large increase in CK concentration indicates that tissue damage occurred after the match, and persisted for at least 36 hours. The values are similar
73 61 to those reported in elite rugby union (Takarada, 2003; Cunniffe, Hore, Whitecombe, Jones, Baker & Davies, 2010) and elite Australian rugby league (McLellan et al., 2011b; McLellan et al., 2010), where elevations persisted for up to 96 hours postmatch. These findings are different to those of Twist et al. (2012), who reported lower values (~100 to 900 U L -1 ) for CK concentration in a Super League team in the 24 hour period after a match. The lower number and magnitude of contacts reported in both forwards and backs could account for the differences between this study and that of Twist and colleagues, particularly given the strong relationship between the number of impacts experienced by a player and peak CK concentration at 24 and 48 hours post-match (McLellan et al., 2011c). In agreement with previous work (McLean et al., 2010; Twist et al., 2012; McLellan & Lovell, 2012) very likely, large decrements in CMJ flight time at 12 and 36 hours post-match, were evident. Reductions in muscular strength and velocity, caused by mechanical disruption of sarcomeres and/or sarcolemma membrane (Friden & Lieber, 1992) and associated loss of calcium ion homeostasis (Zhou, Li & Wang, 2011), could have accounted for the reduction in CMJ flight time in the present study. These data suggest a player s muscular strength may be reduced for at least 36 hours after a match, which coaching staff should take into consideration during training and recovery sessions after a match. Although none significant, possibly small and likely moderate decrements in RPP flight time were also evident at 12 and 36 hours post-match, respectively (Table 10). To the author s knowledge only one other study has observed changes in upper
74 62 body neuromuscular function following rugby league match-play (Johnston et al., 2013). Consistent with the current findings, they reported small to moderate reductions in upper body peak power. Given the fact considerable time during a match is spent tackling and wrestling, assessing upper body neuromuscular fatigue is important. Collectively, these data suggest coaches should incorporate an assessment of upper body neuromuscular function post-match and were necessary include recovery strategies which target the upper body, as previous methods used only integrate the lower limbs (Gill, Beaven & Cook, 2006; Webb, Harris, Cronin & Walker, 2013). In the present study, perceived fatigue, muscular soreness and injury increased at 12 and 36 hours post-match (as indicated by a lower score). In particular, fatigue and soreness demonstrated a most likely, large change at 12 hours (Table 12). This was consistent with previous research adopting a similar procedure (McLean et al., 2010; Twist et al., 2012). Muscle soreness has previously been closely correlated with myoglobin, a marker of muscle damage (r = 0.73) (Kanda, Sugama, Hayashida, Sakuma, Kawakami, Miura, Yoshioka & Suzuki, 2013). Combined with the observed changes in CK concentration, these data strongly suggest the presence of muscle damage following elite rugby league match-play. Perceived well-being remained below pre-match values at 12 and 36 hours post-match. These changes in psychological state could alter an athlete s sense of effort, causing them to downregulate their exercise capacity in the days where perceived fatigue is increased (Marcora, Staiano & Manning, 2009). Players also reported a very likely, moderate reduction in sleep quality at 12 hours post-match, which returned to baseline at 36 hours. Sleep deprivation has been reported to cause reductions in endurance
75 63 running performance (Oliver, Costa, Laing, Bilzon & Walsh, 2009) and sprint time (Skein, Duffield, Edge, Short & Mündel, 2011), thus athletic performance may be compromised the day after a match. Consequently, coaches should acknowledge changes to players psychological state and sleep quality after a match, and the possible impact these variables have on training quality and exercise tolerance. The final part of the study assessed the relationship between match demands and recovery following elite rugby league match-play. Significant correlations were observed between total distance and duration of match-play and CK concentration, suggesting an increased total volume of distance covered during match-play can result in tissue damage. In particular, strong associations were found between distance covered over 18 km h -1, relative distance covered over 20 km h -1 and elevations in CK activity. Previous research has suggested that high-force, highvelocity eccentric contractions, such as those engaged during sprinting, can increase the extent of muscle damage (Byrne & Eston, 2002), which is further supported by the current findings. Duffield et al. (2012) found the change in maximal voluntary contraction during a CMJ was moderately related to time on field, however no correlation was found between high speed running distance and changes in neuromuscular function. Match demands are lower in amateurs players, with decreased distances covered at higher intensity speed zones and reduced mean speed (Sirotic, et al., 2009). Consequently, decrements in neuromuscular function may be less dependent on high-intensity activities in amateur players, whereas the findings of the current study suggest high intensity running can contribute towards fatigue after a match in elite rugby league players.
76 64 The total number of high intensity accelerations and decelerations were moderately correlated with tissue damage. Such observation reaffirm those of Nedelec et al. (2014) who reported a significant relationship between decrements in CMJ and the number of hard changes in direction performed during a soccer match. The mechanical loading, causing by rapid accelerations and decelerations could have caused a lengthening and popping of the sacromeres (Talbot & Morgan, 1996). Consequently, this results in a shearing of myofibrils, exposing membranes, especially t-tubules, to large deformations (Morgan & Proske, 2004), leading to a loss of calcium ion homeostasis, mechanical disruption of the actin-myosin bonds, and a decrease in force production (Zhou, Li & Wang, 2011). Total collisions experienced were significantly correlated with decrements in RPP flight time, elevated CK concentration and perceived muscle soreness. These results are consistence with others who have observed changes in CK concentration and collisions experienced in both rugby union (Smart, Gill, Beaven, Cook & Blazevich, 2008) and rugby league (McLellan et al., 2011c; Twist et al., 2012). Twist et al. (2012) found correlations between tissue damage and total contacts only in forwards, suggesting recovery post-match could be position specific. Regardless, the data reported herein suggests the more collisions a player experiences the more damaged they are likely to be, and typically, heavier impacts were associated with greater elevations (very light: r = 0.42, light: r = 0.56, moderate: r = 0.69). A novel finding of the study was that decrements in upper body neuromuscular function were associated with total collisions experienced. McLellan & Lovell (2012) found heavy
77 65 impacts were significantly correlated to peak rate of force development and peak power during a CMJ, at 24 hours post-match. This highlights the need to incorporate an assessment of upper body muscular function in the days after a match. Where possible, future research could look at the possible impact decrements in upper body neuromuscular function has on training quality, recovery and injury rates. The total amount of RHIE bouts players performed was also significantly correlated with decrements in RPP flight time, elevated CK concentration and perceived muscle soreness. Johnston & Gabbett (2011) reported tackling performed in conjunction with repeated sprints resulted in a greater physiological cost, as indicated by an average HR of 167 b min -1, in comparison to a repeated sprint performed without the addition of a tackle (154 b min -1 ). The high physiological cost could place significant metabolic stress on the muscle fibres, decreasing the action of the calcium adenosine triphosphatase (ATPase), compromising the removal of calcium (Tee, Bosch & Lambert, 2007). Furthermore, an increase in hydrogen ions, effecting the ability of the sarcomere reticulum to take up calcium (Kendall & Eston, 2002), insufficient mitochondrial respiration and oxygen free radial production (Armstrong, 1990) have also been associated with the initial stimulus for damage. These data indicate tissue damage caused by blunt force trauma from physical collisions may affect muscle soreness and fatigue to a greater extent than that caused by repeated eccentric muscle actions. The weak correlations between match demands and CMJ data suggest lower limb neuromuscular fatigue post-match is multifaceted. This is contrary to previous
78 66 research which has reported a significant relationship (r = -0.55) between CMJ performance decrement at 24 hours and the number of hard changes in direction (Nedelec et al., 2014). The sensitivity of the jump procedure used within the current study to assess neuromuscular fatigue might explain these findings. Indeed, while jump procedures have been recommended to evaluate muscle fatigue (Twist & Highton, 2013), their sensitivity has previously been questioned (Krustrup, Zebis, Jensen & Mohr, 2010). A portable force platform, which has been utilised within previous research (McLellan & Lovell, 2012; Nedelec et al., 2014), can provide a more comprehensive understanding of neuromuscular fatigue (Twist & Highton, 2013). Therefore future research should aim to adopt jump procedures utilising equipment which is sensitive enough to detect small changes in jump performance. These data provide several practical implications. Simple measures of individual player duration can provide coaches with a starting point to individualize player recovery strategies. The use of GPS technology can provide a more comprehensive prediction of player recovery, from distance covered over 18 km h -1, maximal accelerations and decelerations performed, the total number of collisions experienced and RHIE bouts performed. Accordingly, coaches can use this information to alter training sessions after a match to ensure training quality is not compromised. Not only this, but the utilisation of GPS within training sessions can allow coaches to monitor and predict player recovery on a daily basis. It may be advantageous to allow players extra recovery time, after they have performed physiologically demanding sessions involving a high frequency of collisions, high intensity running, and rapid accelerations and decelerations. Previous published work in rugby league observing the physical demands of both matches and training
79 67 session have implemented a variety of speed zones, which makes it difficult to make comparisons amongst the research. The data presented provides a strong argument for the use of speed zones incorporating km h -1 and > 20 km h -1 due to the associated relationship with fatigue markers.
80 68 Conclusion The present study demonstrates post-match reductions in upper body neuromuscular function and elevations in CK concentration and perceived muscle soreness were associated with certain match demands. Specifically, duration of match-play, high intensity running and collisions were the strongest predictors of recovery. Although decrements in lower limb neuromuscular function were evident, the lack of sensitivity of the jump procedure used may account for the absence of correlations between decrements in CMJ performance and match demands. Prolonged reductions in perceived well-being, in particular elevations in muscle soreness and a reduced sleep quality could reduce the quality of training for up to 2 days after a match. The application of collisions as a predictor of player recovery, coupled with the strong association between collisions experienced and perceived muscle soreness, provides strong evidence for the use of psychometric tools to monitor fatigue in rugby league players. These data are in support of previous recommendations (McLean et al., 2010; Twist et al., 2012), particularly for their ease of use within the field. The utilisation of GPS and be incorporated into training sessions and competitive matches to provide a more comprehensive prediction of player recovery.
81 69 References Abbiss, C.R. & Laursen, P.B. (2005). Models to explain fatigue during prolonged endurance cycling. Sports Medicine, 35(10), Armstrong (1990). Initial events in exercise-induced muscular injury. Medicine and Science in Sport and Exercise, 22, Austin, D., Gabbett, T.J., Jenkins, D. (2011a). Repeated-high intensity exercise in professional rugby league. Journal of Strength and Conditioning Research, 25(7), Austin, D., Gabbett, T.J., Jenkins, D. (2011b). Tackling in professional rugby league. Journal of Strength and Conditioning Research, 25(6), Austin, D.J. & Kelly, S.J. (2013). Positional differences in professional rugby league match play through the use of global positioning systems. Journal of Strength and Conditioning Research, 27(1), Austin, D.J. & Kelly, S. (2014). Professional rugby league positional match-play analysis through the use of global positioning system. Journal of Strength and Conditioning Research, 28(1), Baker, D.G. & Newton, R.U. (2006). Discriminative analysis of various upper body tests in professional rugby-league players. International Journal of Sports Physiology, 1, Brewer, J., Davis, J. (1995). Applied physiology of rugby league. Sports Medicine, 20, Byrne, C. & Eston, R.G. (2002). The effect of exercise induced muscle damage on isometric and dynamic knee extensor strength and vertical jump performance. Journal of Sport Science, 20, Cheung, K. Huma, P. & Maxwell, L. (2003). Delayed onset muscle soreness: treatment strategies and performance factors. Sport Medicine, 32(2), Cohen, J. (1988). Statistical power analysis for the behavioural sciences. Hillsdale, NJ: Lawrence Erlbaum associates. Cormack, S.J., Newton, R.U., McGuigan, M.R. & Doyle, T.L. (2008). Reliability of measures obtained during single and repeated countermovement jumps. International Journal of Sports Physiology and Performance, 3, Coutts, A.J. & Duffield, R. (2010). Validity and reliability of GPS devices for measuring movement demands of team sports. Journal of Science and Medicine in Sport, 13(1),
82 70 Cormack, S.J., Newton, R.U., McGuigan, M.R. & Doyle, T.L. (2008). Reliability of measures obtained during single and repeated countermovement jumps. International Journal of Sports Physiology and Performance, 3, Cunniffe, B., Hore, A.J., Whitecombe, D.M., Jones, K.P., Baker, J.S. & Davies, B. (2010). Time course of changes in immuneoendocrine markers following an international rugby game. European Journal of Applied Physiology, 108, Deutsch, M.U., Kearney, G.A. & Rehrer, N.J. (2007). Time-motion analysis of professional rugby union players during match-play. Journal of Sport Science, 25(4), Dobson, B.P. & Keogh, J.W.L. (2007). Methodological issues for the application of time-motion analysis research. Strength and Conditioning Journal, 29(2), Duffield, R., Murphy, A., Snape, A., Minett, G. & Skein, M. (2012). Post-match changes in neuromuscular function and the relationship to match demands in amateur rugby league matches. Journal of Science and medicine in Sport, 15, Edgecomb, S.J. & Norton, K.I. (2006). Comparison of global positioning and computer-based tracking systems for measuring player movement distance during Australian Football. Journal of Science and medicine in Sport, 9, Foster, C., Florhaug, A., Frankin, J., Gottschall, L., Hrovatin, L.A., Parker, S., Doleshal, P., Dodge, C. (2001). A new approach to monitoring exercise training. Journal of Strength and Conditioning Research, 15, Friden, J. & Lieber, R.L. (1994). Structural and mechanical basis of exercise induced muscle injury. Medicine and Science in Sport and Exercise. 24(5), Gabbett, T.J. (2012). Sprinting patterns of national rugby league competition. Journal of Strength and Conditioning Research, 26(1), Gabbett, T.J. (2013a). Influence of the opposing team on the physical demands of elite rugby league match play. Journal of Strength and Conditioning Research, 27(6), Gabbett, T.J. (2013b). Influence of playing standard on the physical demands of professional rugby league. Journal of Sports Sciences, 31(10), Gabbett, T.J., Jenkins, D.G. & Abernethy, B. (2012). Physical demands of professional rugby league training and competition using microtechnology. Journal of Science and Medicine in Sport, 15, Gabbett, T.J., King, T. & Jenkins, D.G. (2008). Applied physiology of rugby league. Sports Medicine, 38,
83 71 Gabbett, T.J., Mulvey, M.J. (2008). Time-motion analysis of small-sided training games and competition in elite women soccer players. Journal of Strength and Conditioning Research, 22, Gill, N.D., Beaven, C.M. & Cook, C. (2006). Effectiveness of post-match recovery strategies in rugby players. British Journal of Sports Medicine, 40, Gissane, C., White, J., Kerr, K. & Jennings, D. (2001). Physical collisions in professional rugby league: The demands on different player positions. Cleveland Medical Journal, 4, Hopkins, W.G. (2006). Spreadsheets for analysis of controlled trials, with adjustment for a subject characteristic. Sportscience, 10, Hopkins, W.G., Marshall, S.W., Batterham, A.M. & Hanin, J. (2009). Progressive statistics for studies in sport medicine and exercise science. Medicine and Science in Sports and Exercise, 41, Howatson, G. & Van Someren, K.A. (2008). The prevention and treatment of exercise-induced muscle damage. Sports Medicine, 38(6), Hunkin, S.L., Fahrner, B. & Gastin, P. (2014). Creatine kinase and its relationship with match performance in elite Australian Rules football. Journal of Science and Medicine in Sport, 17, Ingalls, C.P., Warren, G.L., Williams, J.H., Ward, C.W. & Armstrong, R.B. (1998). E- C coupling failure in mouse EDL muscle after in vivo eccentric contractions, Journal of Applied Physiology, 85(1), Jennings, D., Cormack, S., Coutts, A.J., Boyd, L. & Aughey, R. (2010). The validity of reliability of GPS units for measuring distance in team sport specific running patterns. International Journal of Sport Physiology and Performance, 5, Johnston, R.D. & Gabbett, T.J. (2011). Repeated-sprint and effort ability in rugby league players. Journal of Strength and Conditioning Research, 25(10), Johnston, R.D., Gibson, N.V., Twist, C., Gabbett, T.J., MacNav, S.A. & MacFarlane, N.G. (2013). Physiological responses to an intensified period of rugby league competition. Journal of Strength and Conditioning Research, 27(3), Johnston, R.J., Watsford, M.L., Kelly, S.J., Pine, M.J. & Spurrs, R.W. (2014). Validity and interunit reliability of 10 Hz and 15 Hz GPS units for assessing athlete movement demands. Journal of Strength and Conditioning Research. 28(6), Johnston, R.J., Watsford, M.L., Pine, M.J., Spurrs, R.W., Murphy, A.J. & Pruyn, E.C. (2012). The validity and reliability of 5-Hz global positioning system units to measure team sport movement demands. Journal of Strength and Conditioning Research, 26,
84 72 Kanda, K., Sugama, K., Hayashida, H., Sakuma, J., Kawakami, Y., Miura, S., Yoshioka, H., & Suzuki, M. (2013). Eccentric exercise-induced delayed-onset muscle soreness and changes in markers of muscle damage and inflammation. Kempton, T., Sirotic, A.C. & Coutts, A.J. (2013). Between match variation in professional rugby league competition. Journal of Science and Medicine in Sport, 17(4), Kendall, B. & Eston, R. (2002). Exercise-induced muscle damage and the potential protective role of estrogen. Sports Medicine, 32(2), King, T., Jenkins, D. & Gabbett, T. (2009). A time-motion analysis of professional rugby league match-play. Journal of Sport Science, 27, Krisanda, J.M., Moreland, T.S. & Kushmerick, M.J. (1988). ATP supply and demand during exercise. Horton, E.S. & Terjung, R.L. (eds). Exercise, nutrition, energy and metabolism New York: McMillan. Krustrup, P., Zebis, M., Jensen, J.M. & Mohr, M. (2010). Game induced fatigue patterns in elite female soccer. Journal of Strength and Conditioning Research. 24, Maclaren, D., Gibson, H., Parry-Billings, M. & Edwards, R.A. (1989). A review of metabolic and physiological factors in fatigue. Exercise and Sport Science Reviews, 17, Marcora, S.M., Staiano, W. & Manning, V. (2009). Mental fatigue impairs physical performance in humans. Journal of Applied Physiology, 106, Mclean, B.D., Coutts, A.J., Kelly, V., McGuigan, M.R. & Cormack, S.J. (2010). Neuromuscular, endocrine and perceptual fatigue responses during different length between-match microcycles in professional rugby league players. International Journal of Sports Physiology and Performance, 5, McLellan, C.P. & Lovell, D.I. (2012). Neuromuscular responses to impact and collision during elite rugby league match play. Journal of Strength and Conditioning Research, 26(5), McLellan, C.P. & Lovell, D.I. (2013). Performance analysis of professional, semiprofessional and junior rugby league match-play using global positioning systems. Journal of Strength and Conditioning Research, 27(12), McLellan, C.P., Lovell, D.I. & Gass, G.C. (2010). Creatine kinase and endocrine responses of elite players pre, during and post rugby league match play, Journal of Strength and Conditioning Research, 24(11), McLellan, C.P., Lovell, D.I. & Gass, G.C. (2011a). Performance analysis of elite rugby league match play using global positioning system. Journal of Strength and Conditioning Research, 25(6), McLellan, C.P., Lovell, D.I. & Gass, G.C. (2011b). Markers of postmatch fatigue in professional rugby league players. Journal of Strength and Conditioning Research, 25(4),
85 73 McLellan, C.P., Lovell, D.I. & Gass, G.C. (2011c). Biochemical and endocrine responses to impact and collision during elite rugby league match play. Journal of Strength and Conditioning Research, 25(6), Morgan, D.L. (1990). New insights into the behaviour of muscle during active lengthening. Biophysical Journal, 57, Morgan, D.L. & Proske, U. (2004). Popping sarcomere hypothesis explains stretch induced muscle damage. Proceeding of the Australian Physiological and pharmacological Society, 34, Nedelec, M., McCall, A., Carling, C., Legall, F., Berthoin, S. & Dupont, G. (2014). The influence of soccer playing actions on the recovery kinetics after a soccer match. Journal of Strength and Conditioning Research, 28(6), Nicol, C., Avela, J. & Komi, P.V. (2006). The stretch-shortening cycle: a model to study naturally occurring neuromuscular fatigue. Sports Medicine, 36, O Donoghue, P. & King, S. (2004). Activity profile of men s Gaelic football. Journal of Sports Sciences, 22, Oliver, S.J., Costa, R.J., Laing, S.J., Bilzon, J.L. & Walsh, N.P. (2009). One night of sleep deprivation decreases treadmill endurance performance. European Journal of Applied Physiology, 107(2), Proske, U. & Allen, T.J. (2005). Damage to skeletal muscle from eccentric exercise. Exercise and Sport Science Reviews, 33(2), Smart, D.J., Gill, N.D., Beaven, C.M., Cook, C.J. & Blazevich, A.J. (2008). The relationship between changes in interstitial creatine kinase and game-related impacts in rugby union. British Journal of Sports Medicine, 42, Singh, T.K.R., Guelfi, K.J., Landers, G., Dawson, B. & Bishop, D. (2011). A comparison of muscle damage, soreness and performance following a simulated contact and non-contact sport activity circuit. Journal of Science and Medicine in Sport, 14, Sirotic, A.C., Coutts, A.J., Knowles, H. & Catterick, C. (2009). A comparison of match demands between elite and semi-elite rugby league competition. Journal of Sports Sciences, 27(3), Sirotic, A.C., Knowles, H., Catterick, C. & Coutts, A.J. (2011). Positional match demands of professional rugby league competition. Journal of Strength and Conditioning Research, 25(11), Skein, M., Duffield, R., Edge, J., Short, M. & Mündel, T. (2011). Intermittent-sprint performance and muscle glycogen after 30 h of sleep deprivation. Medicine and Science in Sport and Exercise, 43(7), Spencer, M., Lawerence, S., Rechichi, C., Bishop, D., Dawson, B. & Goodman, C. (2004). Time-motion analysis of elite field hockey, with special reference to repeated-sprint activity. Journal of Sports Science, 22,
86 74 Sykes, D., Twist, C., Hall, S. & Nicholas, C. (2009). Semi-automated time-motion analysis of senior elite rugby league. International Journal of Performance Analysis in Sport, 9, Takarada, Y. (2003). Evaluation of muscle damage after a rugby match with special reference to tackle plays. British Journal of Sports Medicine, 37, Talbot, J.A. & Morgan, D.L. (1996). Quantitative analysis of 74arcomere nonuniformities in active muscle following a stretch, Journal of Muscle Research and Cell Motility, 17(2), Tee, J.C., Bosch, A.N. & Lambert, M.I. (2007). Metabolic consequences of exerciseinduced muscle damage. Sport Medicine, 37, Tiddus, P.M. (1998). Radical species in inflammation and overtraining. Candian Journal of Physiology and Pharmacology, 76, Twist, C. & Highton, J. (2013). Monitoring fatigue and recovery in rugby league players. International Journal of Sports Physiology and Performance, 8, Twist, C. & Sykes, D. (2011). Evidence of exercise-induced muscle damage following a simulated rugby league match. European Journal of Sport Science, 11(6), Twist, C., Highton, J., Waldron, M., Edwards, E., Austin, D. & Gabbett, T.J. (2014). Movement demands of elite rugby league players during Australian National Rugby League and European Super League Matches. International Journal of Sports Physiology and Performance. [article in press]. Twist, C., Waldron, M., Highton, J., Burt, D., Daniels, M. (2012). Neuromuscular, biochemical and perceptual post-match fatigue in professional rugby league forwards and backs. Journal of Sport Science, 30, Varley, M.C., Fairweather, I.H. & Aughey, R.J. (2012). Validity and reliability of GPS for measuring instantaneous velocity during acceleration, deceleration and constant motion. Journal of Sport Sciences, 30(2), Wadden, K.P., Button, D.C., Kibele, A. & Behm, D.G. (2012). Neuromuscular fatigue following rapid and slow stretch-shortening cycle movements. Applied Physiology, Nutrition & Metabolism, 37(3), Waldron, M., Twist, C., Highton, J., Worsfold, P. & Daniels, M. (2011). Movement and physiological match demands of elite rugby league using portable global positioning systems, Journal of Sport Sciences, 29, Webb, N.P., Harris, N.K., Cronin, J.B. & Walker, C. (2013). The relative efficacy of three recovery modalities after professional rugby league matches. Journal of Strength and Conditioning Research, 27(9), Zhou, Y. Li, Y. & Wang, R. (2011). Evaluation of exercise-induced muscle damage by surface electromyography. Journal of Electromyography and Kinesiology, 21,
87 75 Appendix 1 Faculty of Life Sciences Research Ethics Committee frec@chester.ac.uk Chelsea Oxendale 4 th March 2014 Dear Chelsea, Study title: FREC reference: Physiological demands of elite rugby league match play and the subsequent impact on recovery. 870/14/CO/SES Version number: 1 Thank you for sending your application to the Faculty of Life Sciences Research Ethics Committee for review. I am pleased to confirm ethical approval for the above research, provided that you comply with the conditions set out in the attached document, and adhere to the processes described in your application form and supporting documentation. The final list of documents reviewed and approved by the Committee is as follows: Document Version Date Application Form 1 January 2014 Appendix 1 References 1 January 2014 Appendix 2 C.V. for Lead Researcher 1 January 2014 Appendix 3 Participant Information Sheet 1 January 2014
88 76 Appendix 4 Participant Consent Form 1 January 2014 Appendix 5 Risk Assessment Form 1 January 2014 Appendix 6 Procedures 1 January 2014 Appendix 7 Schematic Representation of Data Collection 1 January 2014 Appendix 8 Letter of Consent, St. Helens Training Facility, Cowley College, Merseyside. 1 January 2014 Appendix 9 RESTQ Sport 1 January 2014 Response to FREC request for further information and clarification February 2014 Application Form 2 February 2014 Appendix 1 List of References 2 February 2014 Appendix 6 Procedures 2 February 2014 Appendix 9 RESTQ Sport 2 February 2014 Please note that this approval is given in accordance with the requirements of English law only. For research taking place wholly or partly within other jurisdictions (including Wales, Scotland and Northern Ireland), you should seek further advice from the Committee Chair / Secretary or the Research and Knowledge Transfer Office and may need additional approval from the appropriate agencies in the country (or countries) in which the research will take place. With the Committee s best wishes for the success of this project. Yours sincerely, Dr. Stephen Fallows Chair, Faculty Research Ethics Committee
89 77 Appendix 2 Participant information sheet Physical demands of elite rugby league match play and the subsequent impact on recovery You are being invited to take part in a research study. Before you decide, it is important for you to understand why the research is being done and what it will involve. Please take time to read the following information carefully and discuss it with others if you wish. Ask us if there is anything that is not clear or if you would like more information. Take time to decide whether or not you wish to take part. Thank you for reading this. What is the purpose of the study? The purpose of the study is to examine the individual physiological demands of elite rugby league match play. This will be assessed using Global Positioning System (GPS) technology and monitoring heart rate (HR) during a competitive game. This will be compared with individual recovery after a match to assess whether there is a relationship between specific match demands and recovery. Recovery will be assessed by decrements in jump and plyometric push-up flight time, inflammatory blood markers and perceptual measures, immediately after and in the subsequent days post-match. Why have I been chosen? You have been chosen to take part in the study because you fit the criteria required to be a participant in the study and you have volunteered to take part. All participants must be an elite athlete, playing for a Rugby League first team. Furthermore you are fit to play in at least one competitive game which will be used for analysis. Do I have to take part? It is up to you to decide whether or not to take part. If you decide to take part you will be given this information sheet to keep and be asked to sign a consent form. If you decide to take part you are still free to withdraw at any time and without giving a reason. A decision to withdraw at any time, or a decision not to take part, will not affect you in any way.
90 78 What will happen to me if I take part? You will be required to attend 5 consecutive sessions in which physiological measurements will be taken. 24 hours prior to a match you will have to perform baseline measurements of a counter movement jump (CMJ), repeated plyometric push-up and a questionnaire. On the day of a match you will have blood samples taken to assess Creatine Kinase (CK) levels 30 minutes prior to commencing the match. During the match you will be required to wear a small GPS tracking device, on your back, and a HR monitor. Blood samples, a session rating of perceived exertion (RPE), CMJ and repeated plyometric push-up measurements and a questionnaire will be taken 30 minutes post match. At 24, 48 and 72 hours post-match (providing these times co-inside with your training schedule) blood samples, CMJ and repeated plyometric push-up measurements will be taken as well as completing a questionnaire. This data will be collated in a report, with the possibility of publication. All participants will remain anonymous, and data will be kept confidential. What are the possible disadvantages and risks of taking part? Participants will be required to perform tests assessing power, which will involve maximal excertion for a split second. This could cause some discomfort and further symptoms of exercise induced muscle damage, however as the test only lasts a split second, this will be minimised. Participants could experience some discomfort when blood is being taken, however blood sampled will only require a finger prick. All participants will be familiarised with all tests prior to commencing the study. All the physiological measurements will take a significant amount of time to perform, however these will coincide with the players regular training sessions. What are the possible benefits of taking part? Participants will gain individualised data on the physiological demands placed on their own bodies during an elite rugby league game. This will include data on number and distance of sprints covered during a game, accelerations and decelerations, repeated efforts, number of collisions, HR and metabolic damands of the game. This data will then be implemented into the players training programme and nutrition to help improve sporting performance.
91 79 Furthermore, each individual participant will receive data on their own recovery after a game. From this, specific recovery stategies can be devised for each player. In subsequent games, GPS data will be able to predict each participants decrements in muscle function, inflammatory response and recovery duration. This data will be published to add to our understanding of how the physiological demands of elite rugby league match play effect each players subsequent recovery. What if something goes wrong? If you wish to complain or have any concerns about any aspect of the way you have been approached or treated during the course of this study, please contact Professor Sarah Andrew, Dean of the Faculty of Applied Sciences, University of Chester, Parkgate Road, Chester, CH1 4BJ, Will my taking part in the study be kept confidential? All information which is collected about you during the course of the research will be kept strictly confidential so that only the researcher carrying out the research will have access to such information. What will happen to the results of the research study? The results will be written up into a thesis for my MRes. Individuals who participate will not be identified in any subsequent report or publication. Who is organising the research? The research is conducted as part of my MRes in Sport Science (rugby league) within the Department of Sport and Exercise Sciences at the University of Chester. The study is organised with supervision from the department, by Dr Jamie Highton. Who may I contact for further information? If you would like more information about the research before you decide whether or not you would be willing to take part, please Thank you for your interest in this research.
92 80 Appendix 3 Participant consent form Title of Project: Physical demands of elite rugby league match play and the subsequent impact on recovery Name of Researcher: Chelsea Oxendale Please initial box 1. I confirm that I have read and understand the information sheet for the above study and have had the opportunity to ask questions. 2. I understand that my participation is voluntary and that I am free to withdraw at any time, without giving any reason and without my legal rights being affected. 3. I agree to take part in the above study. Name of Participant Date Signature Researcher Date Signature
93 81 Appendix 4 Well-being Questionnaire (WQ) Name: Date: General Stress 0 Extremely stressed Fatigue 0 Extremely fatigued 0 poor Soreness 0 Extreme soreness General Wellbeing Sleep Quality 0 poor Injury 0 injury No stress No fatigue No soreness excellent excellent No injury
94 82 Appendix 5 ANOVA for match-demands ANOVA Sum of Squares df Mean Square F Sig. Between Groups Duration in secs Within Groups Total Between Groups odometer Within Groups Total Between Groups meterage/min Within Groups Total Between Groups player load Within Groups Total Between Groups dist standing walking jogging Within Groups Total Between Groups dist cruising Within Groups Total Between Groups dist striding Within Groups Total dist HI running Between Groups
95 83 dist sprinting dist HI sprinting HI accelerations HI decelerations % HI running >18km/h 0-2G collisions 2-3G collisions 3-4.5G collisions 4.5-6G collisions 6-8G collisions Within Groups Total Between Groups Within Groups Total Between Groups Within Groups Total Between Groups Within Groups Total Between Groups Within Groups Total Between Groups Within Groups Total Between Groups Within Groups Total Between Groups Within Groups Total Between Groups Within Groups Total Between Groups Within Groups Total Between Groups Within Groups
96 G collisions Total collisions Total RHIE bouts Efforts18-20km/h Efforts 20-24km/h Efforts over 24km/h Total efforts over 18 Total Between Groups Within Groups Total Between Groups Within Groups Total Between Groups Within Groups Total Between Groups Within Groups Total Between Groups Within Groups Total Between Groups Within Groups Total Between Groups Within Groups Total Distances covered Tests of Within-Subjects Effects
97 85 Measure: MEASURE_1 Source Type III Sum of Squares df Mean Square F Sig. Sphericity Assumed distance distance * Position Error(distance) Greenhouse-Geisser Huynh-Feldt Lower-bound Sphericity Assumed Greenhouse-Geisser Huynh-Feldt Lower-bound Sphericity Assumed Greenhouse-Geisser Huynh-Feldt Lower-bound Paired Samples Test Paired Differences t df Sig. (2-tailed) Mean Std. Deviation Std. Error Mean 95% Confidence Interval of the Difference Lower Upper Pair 1 m/min at m/min Pair 2 m/min at m/min Pair 3 m/min at m/min Pair 4 m/min at m/min
98 86 Pair 5 m/min at m/min HI sprinting Pair 6 m/min m/min Pair 7 m/min m/min Pair 8 m/min m/min Pair 9 m/min m/min HI sprinting Pair 10 m/min m/min Pair 11 m/min m/min Pair 12 m/min m/min HI sprinting Pair 13 m/min m/min Pair 14 m/min m/min HI sprinting Pair 15 m/min m/min HI sprinting Collisions Measure: MEASURE_1 Tests of Within-Subjects Effects Source Type III Sum of Squares df Mean Square F Sig. Sphericity Assumed collisions collisions * Position Error(collisions) Greenhouse-Geisser Huynh-Feldt Lower-bound Sphericity Assumed Greenhouse-Geisser Huynh-Feldt Lower-bound Sphericity Assumed Greenhouse-Geisser Huynh-Feldt
99 87 Lower-bound Paired Samples Test Paired Differences t df Sig. (2-tailed) Mean Std. Deviation Std. Error Mean 95% Confidence Interval of the Difference Lower Upper Pair 1 0-2G collisions - 2-3G collisions Pair 2 0-2G collisions G collisions Pair 3 0-2G collisions G collisions Pair 4 0-2G collisions - 6-8G collisions Pair 5 0-2G collisions G collisions Pair 6 2-3G collisions G collisions Pair 7 2-3G collisions G collisions Pair 8 2-3G collisions - 6-8G collisions Pair 9 2-3G collisions G collisions Pair G collisions G collisions Pair G collisions - 6-8G collisions Pair G collisions G collisions Pair G collisions - 6-8G collisions Pair G collisions G collisions Pair G collisions G collisions CK concentration Measure: MEASURE_1 Tests of Within-Subjects Effects
100 88 Source Type III Sum of Squares df Mean Square F Sig. Sphericity Assumed time Greenhouse-Geisser Huynh-Feldt Lower-bound Sphericity Assumed Error(time) Greenhouse-Geisser Huynh-Feldt Lower-bound Paired Samples Test Paired Differences t df Sig. (2-tailed) Mean Std. Deviation Std. Error Mean 95% Confidence Interval of the Difference Lower Upper Pair 1 Baseline CK - 30min CK Pair 2 Baseline CK - 12hr CK Pair 3 Baseline CK - 36hr CK Pair 4 Baseline CK - 60hr CK Pair 5 30min CK - 12hr CK Pair 6 30min CK - 36hr CK Pair 7 30min CK - 60hr CK Pair 8 12hr CK - 36hr CK Pair 9 12hr CK - 60hr CK Pair 10 36hr CK - 60hr CK CMJ
101 89 Measure: MEASURE_1 Tests of Within-Subjects Effects Source Type III Sum of Squares df Mean Square F Sig. Sphericity Assumed time Greenhouse-Geisser Huynh-Feldt Lower-bound Sphericity Assumed Error(time) Greenhouse-Geisser Huynh-Feldt Lower-bound Paired Samples Test Paired Differences t df Sig. (2-tailed) Mean Std. Deviation Std. Error Mean 95% Confidence Interval of the Difference Lower Upper Pair 1 baseline CMJ - 12hr CMJ Pair 2 baseline CMJ - 36hr CMJ Pair 3 12hr CMJ - 36hr CMJ RPP
102 90 Measure: MEASURE_1 Tests of Within-Subjects Effects Source Type III Sum of Squares df Mean Square F Sig. Sphericity Assumed time Greenhouse-Geisser Huynh-Feldt Lower-bound Sphericity Assumed Error(time) Greenhouse-Geisser Huynh-Feldt Lower-bound WQ Measure: MEASURE_1 Tests of Within-Subjects Effects Source Type III Sum of Squares df Mean Square F Sig. Sphericity Assumed time Error(time) Greenhouse-Geisser Huynh-Feldt Lower-bound Sphericity Assumed Greenhouse-Geisser
103 91 Huynh-Feldt Lower-bound Paired Samples Test Paired Differences t df Sig. (2-tailed) Mean Std. Deviation Std. Error Mean 95% Confidence Interval of the Difference Lower Upper Pair 1 fatigue pre - fatigue at 12 hr Pair 2 fatigue pre - fatigue at 36 hr Paired Samples Test Paired Differences t df Sig. (2-tailed) Mean Std. Deviation Std. Error Mean 95% Confidence Interval of the Difference Lower Upper Pair 1 soreness pre - soreness at 12 hr Pair 2 soreness pre - soreness at 36 hr Pair 3 well being pre - well-being at 12 hr Pair 4 well being pre - wellbeing at 36 hr Pair 5 sleep pre - sleep at 12 hr Pair 6 sleep pre - sleep at 36 hr Pair 7 injury pre - injury at 12 hr Pair 8 injury pre - injury at 36 hr
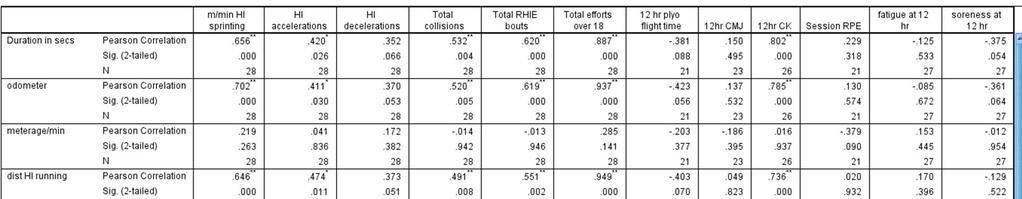
104 Correlations 92
Fatigue and pacing in rugby league players
 Australian Catholic University ACU Research Bank Theses Document Types 12-2015 Fatigue and pacing in rugby league players Richard Johnston Australian Catholic University Follow this and additional works
R REV 1. Running head: Physical demands of netball. Physical demands of training and competition in collegiate netball players
 1 2 3 Running head: Physical demands of netball 4 5 Physical demands of training and competition in collegiate netball players 6 7 8 9 10 11 1 12 13 14 15 16 17 18 19 20 21 22 23 24 25 26 27 28 29 30 ABSTRACT
Variability of GPS Units for Measuring Distance in Team Sport Movements
 Technical Report International Journal of Sports Physiology and Performance, 2010, 5, 565-569 2010 Human Kinetics, Inc. Variability of GPS Units for Measuring Distance in Team Sport Movements Denise Jennings,
Physical, Physiological and Perceptual Match Demands of Amateur Mixed Gender Touch Players
 Journal of Sports Science and Medicine (2017) 16, 589-594 http://www.jssm.org ` Research article Physical, Physiological and Perceptual Match Demands of Amateur Mixed Gender Touch Players Will Vickery
Anthropometric and Physical Qualities of Elite Male Youth Rugby League Players
 Sports Med (2017) 47:2171 2186 DOI 10.1007/s40279-017-0745-8 REVIEW ARTICLE Anthropometric and Physical Qualities of Elite Male Youth Rugby League Players Kevin Till 1,2 Sean Scantlebury 1 Ben Jones 1,2,3
Changes in strength and power characteristics over a season in elite English rugby union players
 Changes in strength and power characteristics over a season in elite English rugby union players Patrick Hogben This is a digitised version of a dissertation submitted to the University of Bedfordshire.
Application of GPS devices to longitudinal analysis on game and training data
 Application of GPS devices to longitudinal analysis on game and training data Author Neville, Jono, Rowlands, David, Wixted, Andrew, James, Daniel Published 2012 Journal Title Procedia Engineering Version
Reviewed by to be arranged, VIS Sport Science, Victorian Institute of Sport, Melbourne, Australia 3205.
 THE CHANGES IN STRENGTH, POWER AND ASSOCIATED FUNCTIONAL VARIABLES IN THE AUSTRALIAN WOMEN S SOCCER TEAM DURING THE 12 MONTH PREPARATION FOR THE SYDNEY 2000 OLYMPIC GAMES Stuart Cormack Fitness Coach West
STRENGTH & CONDITIONING
 Introduction to player profiling Introduction We have previously described the demands of the sevens game for both men and women. We noted that conditioning for the game should take into account the increased
POST-ACTIVATION POTENTIATION AND VERTICAL JUMP PERFORMANCE. Cody Hardwick
 POST-ACTIVATION POTENTIATION AND VERTICAL JUMP PERFORMANCE Cody Hardwick Submitted in partial fulfillment of the requirements For the degree Master of Science in Kinesiology In the School of Public Health
Performance Enhancement. Strength Training
 Performance Enhancement Strength Training Muscle Fiber type & Performance Slow twitch More efficient using oxygen to generate fuel for continuous extended muscle contractions Contract slowly, but continue
Journal of Human Sport and Exercise E-ISSN: Universidad de Alicante España
 Journal of Human Sport and Exercise E-ISSN: 1988-5202 jhse@ua.es Universidad de Alicante España MUÑOZ-LOPEZ, ALEJANDRO; GRANERO-GIL, PAULINO; PINO-ORTEGA, JOSE; DE HOYO, MOISES The validity and reliability
Speed-endurance allows for the. Speed is the result of applying explosive. What is our recipe? Speed, Agility, and Speed- 11/5/2007
 C H A P T E R Speed, Agility, and Speed- Endurance Development 20 What is our recipe? Increase Fast twitch fibers Train Fast Run Properly (Force Applications) + Stride Frequency/length Speed is the result
The purpose of this study was to assess the validity of a GPS tracking system to estimate
 1 1 2 3 4 5 6 7 8 9 10 11 12 13 14 15 16 17 18 19 20 21 22 TITLE Metabolic power method underestimates energy expenditure in field sport movements using a GPS tracking system Abstract The purpose of this
Title: Importance, reliability and usefulness of acceleration measures in team sports. ACCEPTED
 Acceleration in team sports - 1 Journal of Strength and Conditioning Research Publish Ahead of Print DOI: 10.1519/JSC.0000000000001849 Title: Importance, reliability and usefulness of acceleration measures
A Cross-Sectional Comparison of Different Resistance Training Techniques in the Squat Exercise
 A Cross-Sectional Comparison of Different Resistance Training Techniques in the Squat Exercise Alison Egan Faculty Sponsor: Mike McGuigan, Department of Exercise and Sport Science ABSTRACT The purpose
REVIEW OF LITERATURE
 REVIEW OF LITERATURE The researcher of this has done extensive review to find out the related literature in various libraries as well as he has gone through various websites. The relevant studies found
EXAMINATION OF VOLUME AND INTENSITIES OF WEEKDAY PRACTICES AND COMPETITIVE GAMES IN COLLEGIATE FOOTBALL PLAYERS
 University of Kentucky UKnowledge Theses and Dissertations--Kinesiology and Health Promotion Kinesiology and Health Promotion 2017 EXAMINATION OF VOLUME AND INTENSITIES OF WEEKDAY PRACTICES AND COMPETITIVE
Soccer metabolic training: A 12-week training program Peak Performance Radio By Marcelo Aller
 Soccer metabolic training: A 12-week training program Peak Performance Radio By Marcelo Aller 1 This program is designed for a soccer team metabolic conditioning for 12 weeks consisting of 4 phases of
ELITEVIDEN 4, 2006 Anvendt styrketræning, Styrketræning for sprint og spring 1 Symposie ved Institut for Idræt og Biomekanik, Syddansk Universitet
 Symposie ved STRENGTH TRAINING IN EXPLOSIVE-TYPE SPORTS: SPRINTING Steven J. Fleck, Ph.D. Sport Science Department, Colorado College. Colorado Springs, Colorado U.S.A. Introduction Various forms of strength
How does training affect performance?
 Name: How does training affect performance? CQ1 DP2 types of training and training methods aerobic, eg continuous, Fartlek, aerobic interval, circuit anaerobic, eg anaerobic interval flexibility, eg static,
The development and evaluation of a testing protocol to assess upper body pressing strength qualities in high performance athletes
 Edith Cowan University Research Online Theses: Doctorates and Masters Theses 2013 The development and evaluation of a testing protocol to assess upper body pressing strength qualities in high performance
PDH&PE Option 4 //Improving Performance
 2018+ PDH&PE Option 4 //Improving Performance SUMMARY NOTES HSC 1: ANAEROBIC TRAINING & STRENGTH TRAINING Table of Contents How do athletes train for improved performance?... 2 Anaerobic Training:... 2
Factors affecting small-sided game demands among high-level junior rugby league players
 Factors affecting small-sided game demands among high-level junior rugby league players Submitted for the degree of MPhil in Sport and Exercise Science The University of Chester 2012 Christine Foster 1
Conflict of Interest Statement. I have no actual or potential conflict of interest in relation to this presentation.
 Conflict of Interest Statement I have no actual or potential conflict of interest in relation to this presentation. Tapering and peaking for optimal performance in team sports What is a taper? Contents
Chapter 14 Training Muscles to Become Stronger
 Chapter 14 Training Muscles to Become Stronger Slide Show developed by: Richard C. Krejci, Ph.D. Professor of Public Health Columbia College 11.22.11 Objectives 1. Describe the following four methods to
RESULTS AND DISCUSSIONS
 74 CHAPTER IV RESULTS AND DISCUSSIONS 4.1 OVERVIEW This chapter deals with the analysis of data collected from the samples under study. The purpose of this study was to find out the effect of step aerobic
Match play performance characteristics that predict post-match creatine kinase responses in professional rugby union players
 Jones et al. BMC Sports Science, Medicine, and Rehabilitation 2014, 6:38 RESEARCH ARTICLE Open Access Match play performance characteristics that predict post-match creatine kinase responses in professional
S trength and conditioning professionals ABSTRACT
 Strength and Power Profiling of Athletes: Selecting Tests and How to Use the Information for Program Design Michael R. McGuigan, PhD, CSCS*D, 1 Stuart J. Cormack, PhD, 2 and Nicholas D. Gill, PhD 1,3 1
Fitness components & assessment
 Fitness components & assessment Key terms & definitions: Capacity: The total amount of energy produced by the energy system (e.g. aerobic capacity or anaerobic capacity). Power: The rate of energy production
CHAPTER 2: Muscular skeletal system - Biomechanics. Exam style questions - pages QUESTIONS AND ANSWERS. Answers
 CHAPTER 2: Muscular skeletal system - Biomechanics Exam style questions - pages 32-35 1) A Level. Warm up is considered to be an essential element of a training programme. Explain how the muscular and
NATURAL DEVELOPMENT AND TRAINABILITY OF PLYOMETRIC ABILITY DURING CHILDHOOD BY KIRSTY QUERL SPORT SCIENTIST STRENGTH AND CONDITIONING COACH
 NATURAL DEVELOPMENT AND TRAINABILITY OF PLYOMETRIC ABILITY DURING CHILDHOOD BY KIRSTY QUERL SPORT SCIENTIST STRENGTH AND CONDITIONING COACH The truth... Youth are not as active as they used to be, Decline
Neuromuscular fatigue and endocrine responses in elite Australian Rules football players
 Edith Cowan University Research Online Theses: Doctorates and Masters Theses 2008 Neuromuscular fatigue and endocrine responses in elite Australian Rules football players Stuart J. Cormack Edith Cowan
Time Motion Analysis. Sports Analysis LG B518. Aims and Objectives. Investigating why time motion analysis is important when analysing performance
 Time Motion Analysis Sports Analysis LG B518 Image by paddynapper Aims and Objectives Defining Time Motion Analysis Investigating why time motion analysis is important when analysing performance This lecture
International Netball
 International Netball Overview Commonwealth Games Programme (our reality) Activity Profile of Netball Framework Critical Physical Qualities Evolution of the Game 2017 2018 International Programme to COG
Strength and Conditioning Journal Applications of the session RPE system in professional rugby union
 Strength and Conditioning Journal Applications of the session RPE system in professional rugby union --Manuscript Draft-- Manuscript Number: Full Title: Short Title: Article Type: Keywords: Corresponding
CHAPTER 24. Working as a physiologist in professional soccer. Barry Drust The Football Exchange, Liverpool John Moores University, Liverpool, UK
 Working as a physiologist in professional soccer CHAPTER 24 Barry Drust The Football Exchange, Liverpool John Moores University, Liverpool, UK Discussion Soccer is characterised by high-intensity efforts
Published by Verkhoshansky SSTM 2011 Rome, Italy
 YURI VERKHOSHANSKY NATALIA VERKHOSHANSKY SPECIAL STRENGTH TRAINING MANUAL FOR COACHES Published by Verkhoshansky SSTM 2011 Rome, Italy TABLE OF CONTENT PREFACE OF YURI VERKHOSHANSKY... III PREFACE OF NATALIA
Unit 1: Fitness for Sport and Exercise
 Unit 1: Fitness for Sport and Exercise Level: 1 and 2 Unit type: Core Guided learning hours: 30 Assessment type: External Unit introduction All sports performers want to be the best they can be. To reach
In press. Ground travel-induced impairment in wellness is associated with fitness and travel distance in young soccer players
 In press Ground travel-induced impairment in wellness is associated with fitness and travel distance in young soccer players Rabbani, Alireza 1 and Buchheit Martin 2 1 Performance Department, Fooladmobarakeh
TYPES OF TRAINING AND TRAINING ME THODS
 TYPES OF TRAINING AND TRAINING ME THODS FIRST, LET S LOOK AT AEROBIC TRAINING Aerobic training usually complies with the principle. Frequency In order to be effective with aerobic training, individual
International Journal of Sports Physiology and Performance
 International Journal of Sports Physiology and Performance A combination of internal and external training load measures explains the greatest proportion of variance in certain training modes in professional
Authors Taylor, J. M.; Macpherson, T. W. (Tom); Spears, I. R. (Iain); Weston, M. (Matthew)
; Spears, I. R. (Iain); Weston, M. (Matthew)") TeesRep - Teesside's Research Repository Repeated sprints: an independent not dependent variable Item type Article Authors Taylor, J. M.; Macpherson, T. W. (Tom); Spears, I. R. (Iain); Weston, M. (Matthew)
TeesRep - Teesside's Research Repository Repeated sprints: an independent not dependent variable Item type Article Authors Taylor, J. M.; Macpherson, T. W. (Tom); Spears, I. R. (Iain); Weston, M. (Matthew)
Strength and conditioning? Chapter 4 Training Techniques. Weight gain (24yr, 73kg, 177cm, takes 18% protein) Guidelines.
 Guidelines.") Strength and conditioning? Chapter 4 Training Techniques Minimise the probability of injury Maximise performance Athletic Training Spring 2014 Jihong Park Guidelines Safety: environment, technique, nutrition
Strength and conditioning? Chapter 4 Training Techniques Minimise the probability of injury Maximise performance Athletic Training Spring 2014 Jihong Park Guidelines Safety: environment, technique, nutrition
TRAINING FOR EXPLOSIVE POWER
 TRAINING FOR EXPLOSIVE POWER How fast an athlete can generate power from a stand still. Short sprinters, offensive lineman in football and shot putters are examples of explosive athletes. An athlete s
Long-term Training Adaptations in Elite Male Volleyball Players
 Edith Cowan University Research Online ECU Publications 2011 2011 Long-term Training Adaptations in Elite Male Volleyball Players Jeremy Sheppard Edith Cowan University Robert Newton Edith Cowan University
MELDING EXPLOSIVE POWER WITH TECHNIQUES IN THE LONG JUMP. Explosive Strength IS THE RATE OF FORCE DEVELOPMENT AT THE START OF A MUSCLE CONTRACTION.
 MELDING EXPLOSIVE POWER WITH TECHNIQUES IN THE LONG JUMP Jake Jacoby Jumps Coach University of Louisville jake.jacoby@louisville.edu Explosive Strength IS THE RATE OF FORCE DEVELOPMENT AT THE START OF
chapter Plyometric Training
 chapter 18 Plyometric Training Chapter Objectives Explain the physiology of plyometric exercise. Identify the phases of the stretch-shortening cycle. Identify components of a plyometric training program.
TeachPE.com progress charts
 Exercise Physiology topic 2: Preparation and training methods in relation to maintaining physical activity and performance Topic 2A: Physiological effects and benefits of a warm up and cool down Term Identify
LH12 INSTRUCTIONS TO CANDIDATES: There are TWO sections on this paper: Section A (25 Questions) and Section B (5 Questions)
 and Section B (5 Questions)") LH12 UNIVERSITY OF BOLTON SCHOOL OF SPORT AND BIOMEDICAL SCIENCES BSC (HONS) SPORT REHABILITATION SEMESTER TWO EXAMINATION 2015/2016 INJURY PREVENTION & FUNCTIONAL REHABILITATION MODULE NO. SRB 5006 Date:
LH12 UNIVERSITY OF BOLTON SCHOOL OF SPORT AND BIOMEDICAL SCIENCES BSC (HONS) SPORT REHABILITATION SEMESTER TWO EXAMINATION 2015/2016 INJURY PREVENTION & FUNCTIONAL REHABILITATION MODULE NO. SRB 5006 Date:
Repetition Maximum Continuum
 Parts of a Lifting Program Before putting weight on the bar, the athlete needs to know some of the basic terms used in weight training. Repetition or rep refers to the number of times you perform a movement
C2 Qu1 DP2 How does training affect performance?
 C2 Qu1 DP2 How does training affect performance? Hi Guys In this video, we will be explore Core two question 1 - dot point 2 If you look at the syllabus you can see this dot point is about types of training
BTEC. Name: Student Guide. BTEC Level 2 Unit 1- Fitness for Sport and Exercise
 BTEC BTEC Level 2 Unit 1- Fitness for Sport and Exercise Student Guide Name: 1 Before we start Overview This unit covers four keys areas (learning aims): A: Know about the components of fitness and the
Exercise-Induced Muscle Damage Responses: Implications for Performance.
 Exercise-Induced Muscle Damage Responses: Implications for Performance. Ever had that stiff, dull aching feeling that lasts for a few days follows high intensity activity? What causes the pain? Is there
Bishop, D. C. and Wright, C. University of Lincoln. Abstract
 A time-motion analysis of professional basketball to determine the relationship between three activity profiles: high, medium and low intensity and the length of the time spent on court. Bishop, D. C.
Guidance. Name and describe the 4 types of guidance Describe a motor skill
 Skill Guidance What components make up skill? Name and describe the 4 types of guidance Describe a motor skill Implications Explain how you would coach a closed skill and how you would coach an open skill
Muscle damage after a tennis match in young players
 Edith Cowan University Research Online ECU Publications Post 2013 2014 Muscle damage after a tennis match in young players Rodrigo Vitasovic Gomes Ricardo Santos Ken Nosaka Edith Cowan University, k.nosaka@ecu.edu.au
Protocols for the. Physiological Assessment of. Gaelic Football Development. Squads
 Protocols for the Physiological Assessment of Gaelic Football Development Squads by Eugene Young, Declan Gamble & Paul Boyle 1 Introduction Physical fitness in Gaelic football has been defined by the OTú
CAP Soccer: Improvements in Linear Power (Acceleration) and Multidirectional Power (Agility) during a 3 week Power Interval Phase
 and Multidirectional Power (Agility) during a 3 week Power Interval Phase") CAP Soccer: Improvements in Linear Power (Acceleration) and Multidirectional Power (Agility) during a 3 week Power Interval Phase **Scott Moody, Aaron Kleinwolterink Introduction As we approach the beginning
CAP Soccer: Improvements in Linear Power (Acceleration) and Multidirectional Power (Agility) during a 3 week Power Interval Phase **Scott Moody, Aaron Kleinwolterink Introduction As we approach the beginning
Strength and power
 Strength and power Strength Science and practice of strength expression 4 methods of strength development Volume and intensity guidelines 4 Phase progression for strength development Power Science and
Applied physiology of female soccer: an update
 TeesRep - Teesside's Research Repository Applied physiology of female soccer: an update Item type Article Authors Datson, N. (Naomi); Hulton, A. (Andrew); Andersson, H. (Helena); Lewis, T. (Tracy); Weston,
TRAINING IN SPORTS. Key Points :
 TRAINING IN SPORTS Key Points : Strength Definition, Types and Methods of Improving Strength Isometric, Isotonic and Isokinetic. Endurance Definition, Types and Methods of Develop Endurance Continuous
The Purpose of Training
 The Purpose of Training Training improves the physiological capacity of athletes to bring out the best performance possible. The demands of the sport can be identified by undertaking an activity analysis.
Monitoring Fatigue Status
 Monitoring Fatigue Status in Elite Soccer Players Robin T Thorpe A thesis submitted in partial fulfilment of the requirements of Liverpool John Moores University for the degree of Doctor of Philosophy
Geoff Regan ATC, CSCS, PES Select Physical Therapy Avon Old Farms School
 Geoff Regan ATC, CSCS, PES Select Physical Therapy Avon Old Farms School Activity is characterized by high-intensity intermittent skating with rapid changes in velocity and duration. Aerobic and anaerobic
Module Synopsis. Module 1. Biomechanical Concepts
 Module Synopsis The 12 modules composing the Foundation Course are comprised of a total of 109 sections, designed to be taken in series. Each section either has specific learning checks, or suggested tasks
Establishing a duration standard for the calculation of session rating of perceived exertion in NCAA division I men s soccer
 Short Communication Establishing a duration standard for the calculation of session rating of perceived exertion in NCAA division I men s soccer Andrew A. Pustina, Kimitake Sato, Chiang Liu, Ashley A.
BASIC AND SPECIAL PHYSICAL PREPARATION OF TOP TABLE TENNIS PLAYERS
 BASIC AND SPECIAL PHYSICAL PREPARATION OF TOP TABLE TENNIS PLAYERS Prof. Zoran Djokic coach of Yugoslav National Team. Faculty of Physical Education and Sport University - Novi Sad - Yugoslavia 1 Introduction
Speed & Power Development for HS Track & Field
 Speed & Power Development for HS Track & Field Tim O Neill Head Coach Davenport Assumption HS USATF Level 2 Sprints/Hurdles/Relays, Throws, Jumps and Endurance @Assumptiontrack toneill@power-lift.com 641-757-7934
Effectiveness of Muscular Power Performance on Long-Term Training
 Effectiveness of Muscular Power Performance on Long-Term Training M. H. Tavakkoli PhD Scholar, Kerala University, Keraa, India Abstract: Muscular power are commonly used for increasing power in muscles
WORKLOAD MANAGEMENT BASICS
 WORKLOAD MANAGEMENT BASICS A Practical Guide to Workload Management & Injury Prevention in Elite Sport By Francois Gazzano, B.Sc. CONTENTS Introduction... 3 Better workload management a key to better performances,
GCE PHYSICAL EDUCATION PE2 UNIT GUIDE
 GCE PHYSICAL EDUCATION PE2 UNIT GUIDE Content Title: Application of Principles of Training Key points Application of the principles of training Specific examples of how to apply the principles of specificity,
2014 Athletes Performance inc. Athletic Profiling Discuss the need for athletic profiling and the factors that underpin sports performance
 Athletic Profiling: Testing Models That Transfer to Sport Nick Winkelman, MSc, XPS, CSCS*D Director of Movement and Education nwinkelman@teamexos.com Objectives Athletic Profiling Discuss the need for
Readiness for Soccer
 Youth Fitness? Readiness for Soccer Readiness for sports is the match between a child s level of growth, maturity and development, and the task demands presented in competitive sports. Robert M. Malina,
Monitoring Training Load to Understand Fatigue in Youth Athletes
 Monitoring Training Load to Understand Fatigue in Youth Athletes Shona Halson, PhD Associate Professor School of Behavioural and Health Sciences Australian Catholic University Defining Fatigue A practical
catapultsports.com THE MOST USED SECRET IN SPORT
 catapultsports.com THE MOST USED SECRET IN SPORT OUR TECHNOLOGY Catapult has the most widely-used technology for measuring athlete movement. clearsky t6 ClearSky is everything Catapult has evolved in athlete
Induced Muscle Damage. Lee Anthony Bridgeman. PhD
 The Effects of Accentuated Eccentric Loading during Drop Jumps on Strength, Power, Speed and Exercise- Induced Muscle Damage Lee Anthony Bridgeman PhD 2016 The Effects of Accentuated Eccentric Loading
Performance Training in Football Refereeing Training Advice
 General guidelines 1. Training Sessions 1.1 Warm up - Both from a physiological and training perspective it is crucial to warm up prior to training and matches as sports science research has demonstrated
FOOTBALL TRAINING AND PRACTICES
 FOOTBALL TRAINING AND PRACTICES 1. Periodization in Elite Football 2. The Difference Between 1 or 2 Games per Week 3. Fitness Training in Modern Football y Pre-Season y In-Season y Mid-Season y Off-Season
The Effects of Game and Training Loads on Perceptual Responses of Muscle Soreness in Australian Football
 International Journal of Sports Physiology and Performance, 2013, 8, 312-318 2013 Human Kinetics, Inc. www.ijspp-journal.com ORIGINAL INVESTIGATION The Effects of Game and Training Loads on Perceptual
VO2MAX TEST.
 AEROBIC CAPACITY Aerobic capacity refers to the maximum amount of oxygen that the body can utilize in an exercise session It is possible to improve aerobic capacity over time, and it is also possible to
TIME MOTION ANALYSIS IN SPORTS-A REVIEW
 Academic Sports Scholar ISSN : 2277-366 Vol. 3 Issue. 10 Oct 2014 Impact Factor : 1.320 (UIF) 1 2 3 Ravi Prakash Singh, Syed Tariq Murtaza, Shamshad Ahmad, 4 Arshad Hussain Bhat and Mohd Sharique 1 2 Assistant
A Comparison of Plyometric Training Techniques for Improving Vertical Jump Ability and Energy Production
 Journal of Strength and Conditioning Research, 1998, 12(2), 85-89 1998 National Strength & Conditioning Association A Comparison of Plyometric Training Techniques for Improving Vertical Jump Ability and
Does the Time Frame Between Exercise Influence the Effectiveness of Hydrotherapy for Recovery?
 Brief Review International Journal of Sports Physiology and Performance, 2011, 6, 147-159 2011 Human Kinetics, Inc. Does the Time Frame Between Exercise Influence the Effectiveness of Hydrotherapy for
2011 USTFCCCA Annual Meeting
 Caryl Smith Gilbert Caryl Smith Gilbert 2011 USTFCCCA Annual Meeting What t is Power? Why y do we need Power? Where do we use Power? When do we use Power? How do we develop Power? As horizontal velocity
Sports injuries are a widespread problem at college and
 A PRACTICAL GUIDE TO WORKLOAD MANAGEMENT AND INJURY PREVENTION IN COLLEGE AND HIGH SCHOOL SPORTS FRANCOIS GAZZANO, AND TIM GABBETT, PHD INTRODUCTION Sports injuries are a widespread problem at college
MENTOR METHOD OF TRAINING
 MENTOR METHOD OF TRAINING When trying to improve performance on the field of play or on the court, whatever your sport, it is important that you understand where it all begins. For an athlete there are
Training Methods. Remember : FRCIFCP. Fartlek. Resistance Circuit Interval Flexibility Continuous Plyometrics Pilates / Fitball
 Remember : FRCIFCP Fartlek Resistance Circuit Interval Flexibility Continuous Plyometrics Pilates / Fitball Fartlek: A variation of continuous training with bursts of speed so the anaerobic system is also
Needs Analysis. Machar Reid and Miguel Crespo International Tennis Federation LEVEL III COACHES COURSE
 Needs Analysis Machar Reid and Miguel Crespo International Tennis Federation Introduction Principles of physiology Physiological needs analysis Other performance-determining variables Mechanical demands
Worksheet Questions, Chapter 1, The Warm-Up
 Worksheet Questions, Chapter 1, The Warm-Up Exercise 1. True or False. Indicate whether each of the following statements is true or false by clicking on (or if you are using a printed hard copy circling)
Chapter 25. The meaning of fitness. Ranking the components of fitness in different sports. Queensland Senior Physical Education 2nd edition
 Chapter 25 The meaning of fitness Ranking the components of fitness in different sports Learning experience 25.2 Page 231 Activity or Sport Tennis Weights Jogging Cricket Football Squash Cycling Netball
22 Week BEGINNER MARATHON TRAINING PLAN. RG Active 22 Week Beginner Marathon Training Plan Page 1
 22 Week BEGINNER MARATHON TRAINING PLAN RG Active 22 Week Beginner Marathon Training Plan Page 1 Key Notes The NSPCC has teamed up with RG Active to be the charity s official training partner for running
The effect of acute fatigue on countermovement jump performance in rugby union players during preseason
 The effect of acute fatigue on countermovement jump performance in rugby union players during preseason Rodney A. Kennedy, 1* David Drake, 2 1 School of Sport, Ulster University, Jordanstown, N. Ireland;
Monitoring AFL Footballers and Training Load
 Monitoring AFL Footballers and Training Load David Buttifant Collingwood Football Club Australian Rules Football imposes a significant physiological load on the player. The physiological demands on AFL
ELECTRICAL MUSCLE STIMULATION (EMS) IMPLEMENTATION IN EXPLOSIVE STRENGTH DEVELOPMENT
 IMPLEMENTATION IN EXPLOSIVE STRENGTH DEVELOPMENT") Zoran Đokić, Bojan Međedović Fakultet za sport i turizam, Novi Sad UDK:796.012.11:615.84 ELECTRICAL MUSCLE STIMULATION (EMS) IMPLEMENTATION IN EXPLOSIVE STRENGTH DEVELOPMENT 1. INTRODUCTION Research on
Zoran Đokić, Bojan Međedović Fakultet za sport i turizam, Novi Sad UDK:796.012.11:615.84 ELECTRICAL MUSCLE STIMULATION (EMS) IMPLEMENTATION IN EXPLOSIVE STRENGTH DEVELOPMENT 1. INTRODUCTION Research on
Before athletic competition, athletes commonly
 THE ACUTE EFFECTS OF STATIC STRETCHING ON THE SPRINT PERFORMANCE OF COLLEGIATE MEN IN THE 60- AND 100-M DASH AFTER A DYNAMIC WARM-UP BRANDON M. KISTLER, MARK S. WALSH, THELMA S. HORN, AND RONALD H. COX
Strength and Conditioning for Basketball. Jan Legg. Coaches Conference /13/2016
 Strength and Conditioning for Basketball Jan Legg 5/13/2016 Coaches Conference 2016 1 Strength and Conditioning (S&C) with the Opals and Centre of Excellence (COE). Working within a service team. Practical
Inside The Park Baseball NYO Speed-Strength / Performance Training
 Inside The Park Baseball NYO Speed-Strength / Performance Training September 23, 2016 Presented to: Inside the Park Baseball NYO / Chastain Park 140 West Wieuca Rd. Atlanta, GA 30342 Sports Performance
Chapter 4. Muscular Strength and Endurance KIN 217 3/28/18 1
 Chapter 4 Muscular Strength and Endurance KIN 217 1 Functions of Muscle Tissues Functions: provide stability and postural tone, allow purposeful movement, heat production. Muscle mass constitutes: 40 to