Cover Page. The handle holds various files of this Leiden University dissertation.
|
|
|
- Virginia Tucker
- 5 years ago
- Views:
Transcription

1 Cover Page The handle holds various files of this Leiden University dissertation. Author: Scherptong, Roderick Wiebe Conrad Title: Characterization of the right ventricle : embryonic development, noninvasive imaging and electrocardiography Issue Date:
2 Characterization of the Right Ventricle: Embryonic Development, Noninvasive Imaging and Electrocardiography

3 ISBN: Copyright 2013 Roderick Scherptong, Leiden, the Netherlands Layout and printing: Optima Grafische Communicatie, Rotterdam
4 Characterization of the Right Ventricle: Embryonic Development, Noninvasive Imaging and Electrocardiography Proefschrift ter verkrijging van de graad van Doctor aan de Universiteit Leiden, op gezag van Rector Magnificus prof.mr. C.J.J.M. Stolker volgens besluit van het College voor Promoties te verdedigen op dinsdag 26 februari 2013 klokke 15:00 uur door Roderick Wiebe Conrad Scherptong geboren te s Gravenhage in 1980
5 Promotiecommissie Promotores Copromotor Prof. dr. M.J. Schalij Prof. dr. E.E. van der Wall Dr. H.W. Vliegen Overige leden Prof. dr. B.J.M. Mulder (Academisch Medisch Centrum, Amsterdam) Prof. dr. R.N.W. Hauer (Universitair Medisch Centrum, Utrecht) Prof. dr. A.C. Gittenberger-de Groot Prof. dr. A. van der Laarse Prof. dr. J.J. Bax Dr. C.A. Swenne FINANCIAL SUPPORT Financial support by the Dutch Heart Foundation and the Rijnland Zorggroep for the publication of this thesis is gratefully acknowledged. Furthermore, publication of this thesis would not have been possible without the financial support of Pfizer, MSD, Astellas, Servier, Biotronik, Bayer, Boehringer Ingelheim, Pfizer and Actelion.
6 Contents Chapter 1 General Introduction and Outline of Thesis 9 PART I Embryonic Development Chapter 2 Chapter 3 Differentiation of the Left and Right Ventricle Governed by Interaction with Epicardium-Derived Cells as Studied in the TGFbeta2 Mutant Mouse Morphogenesis of Outflow Tract Rotation during Cardiac Development: The Pulmonary Push Concept PART II Noninvasive Right Ventricular Imaging Chapter 4 Chapter 5 Chapter 6 Chapter 7 Chapter 8 Tricuspid Valve Surgery in Adults with a Dysfunctional Systemic Right Ventricle: Repair or Replace? Ventricular Response to Stress Predicts Outcome in Adult Patients with a Systemic Right Ventricle. Right Ventricular Peak Systolic Longitudinal Strain is a Sensitive Marker for Right Ventricular Deterioration in Adult Patients with Tetralogy of Fallot Biventricular Performance in Patients with Marfan Syndrome without Significant Valvular Disease: Comparison to Normal subjects and Longitudinal Follow-Up Prognostic Value of Right Ventricular Function in Patients after Acute Myocardial Infarction Treated with Primary Percutaneous Coronary Intervention PART III Right Ventricular Electrocardiography Chapter 9 Pulmonary Hypertension: The Role of the Electrocardiogram 155 Chapter 10 Chapter 11 Chapter 12 Follow-Up after Pulmonary Valve Replacement in Adults with Tetralogy of Fallot: Association between QRS Duration and Outcome Normal Limits of the Spatial QRS-T angle and Ventricular Gradient in 12-lead ECGs of Young Adults: Dependence on Sex and Heart Rate Diagnosis and Mortality Prediction in Pulmonary Hypertension: The value of the ECG-derived Ventricular Gradient Chapter 13 Summary, Conclusions and Future Perspectives 211 Samenvatting, Conclusies en Vooruitzicht 223 Chapter 14 Appendix; List of Publications, Curriculum Vitae, Dankwoord
7
8 I always like to compose music more than the music itself. Igor Stravinsky
9
10 Chapter 1 General Introduction and Outline of Thesis
11
12 INTRODUCTION In recent years, the amount of research into right ventricular (patho)physiology increased dramatically. Whereas, not too long ago, the right ventricle was regarded a dispensable part of human circulation, 1, 2 investigations demonstrated that a normal right heart is essential for a functional and regulated cardiovascular system. 3 One of the first areas of research in which the importance of right ventricular function was noted, was congenital heart disease. 4 7 Patients with defects in cardiac development, frequently present with right ventricular dysfunction, either as a result of the defect itself or as a consequence of surgical procedures, necessary to correct the birth defect. 8, 9 Pulmonary hypertension is another disease in which dysfunction of the right ventricle is frequently observed 10 and prognosis mainly depends on preservation of right ventricular function. 11 Furthermore, it became apparent that not only dysfunction of the left ventricle, but also the right ventricle is of importance in patients with ischemic heart disease, 12 indicating the relevance of normal right heart function for the full scope of cardiovascular disease. Not long after recognition of the right heart as a critical part of normal heart function, fundamental investigations demonstrated that the right and left ventricle have a different developmental origin Moreover, developmental research showed that the right and left ventricle not only have a different morphology, but also have distinct molecular characteristics Such observations underscored that although both ventricles form part of the same heart, left and right ventricular disease may require a different approach in terms of functional assessment as well as treatment. 19, 20 More importantly, this established research in the field of right ventricular disease, from fundamental developmental investigations to randomized clinical trials, as an independent entity within cardiovascular science. Right ventricular development Before six weeks of gestation, the primitive embryonic human heart exists of an inlet portion which directs return of venous blood, a primary heart tube that propels blood in a peristaltic motion and an outflow tract that directs blood into the direction of the primitive aorta (Figure 1). 21, 22 In this primitive stage the right ventricle still has to develop. One of the first steps in right ventricular development is the addition of an extra-cardiac population of cells designated second heart field (yellow area in Figure 1). These cells migrate into the heart to form, amongst others, the right ventricle. 23 Concurrent with primary right ventricular development, the interventricular septum expands and divides the heart into two separate ventricles. As soon as the heart is septated, clear differences can be observed on a morphological level between the left and right ventricle. 24 Whereas the left ventricle seems to start compaction in a relatively early phase, the right ventricle remains thin-walled. So far, it is unclear which mechanisms play a key role in the difference between left and right ventricular compaction. Although it is known that interstitial fibroblasts induce ventricular compaction and remodel- 11
.")
13 Chapter 1 Figure 1. Early cardiac development. Panel A: The primary heart tube with an inlet portion, blue vessel and an outlet portion, red vessel. The yellow area demarcates the second heart field. Panel B: Migration of second heart field-derived cells into the heart to form the right ventricle (yellow shading in the upper part of the heart tube). The pro epicardial organ (red arrow), which is also derived from the second heart field, protrudes into the celomic cavity. These cells migrate onto the heart and form the epicardial sheet. Adapted from Gittenberger-de Groot et al. 22 ing during embryonic development, 25 it remains to be elucidated whether the interaction of interstitial fibroblasts with surrounding myocardium is different in the right as compared to the left ventricle. Such developmental keys could help to understand why specific medical therapies have beneficial effects in the left and not in the right ventricle. Simultaneous with right ventricular development, remodeling of the cardiac outflow tract occurs. Whereas first the primitive aorta and pulmonary trunk are connected to the right ventricle with a common outflow tract, a tightly regulated process leads to, amongst others: 1. Septation of the aorta and pulmonary artery, 2: Normal positioning of the pulmonary trunk in the ventral-superior position, 3: Connection of the aorta to the left ventricle. 26 Dysregulation of this delicately orchestrated process results in common congenital cardiac defects such as transposition of the great arteries and tetralogy of Fallot. 21 Although outflow tract development is understood roughly, 21 the genetic pathways that guide right ventricular outflow tract remodeling and normal development of aorta and pulmonary artery, are largely unknown. 27 Recognition of these pathways would aid the identification of gene mutations responsible for the aforementioned congenital outflow tract defects. 12

14 INTRODUCTION The right ventricle in adults The right ventricle is located behind the sternum and has a complicated morphology. The tricuspid valve has a partly right-posterior orientation, whereas the pulmonary artery has a largely left-cranial orientation. With the apex positioned between the tricuspid valve (inlet) and the pulmonary artery (outlet), the right ventricle has a triangular shape (figure 2). 28 A general definition of right heart function is currently lacking. Nevertheless, it is generally accepted that that the right ventricle has to pump a certain volume of blood into the pulmonary circulation with a certain pressure in order to provide adequate pulmonary perfusion and to sustain optimal cardiac output. 29 Furthermore, the right ventricle plays a key role in volume regulation. Increases in right ventricular preload result in temporary (and subtle in physiological conditions) ventricular dilatation. Consequently, sarcomere length increases which leads to improvement of myocardial contraction. 30 Ultimately, right ventricular (and therefore cardiac) output increases to adjust to the altered loading conditions. 31 Being a thinwalled and compliant chamber, the right ventricle is equipped for responding to changes in 28, 32 volume loading, which forms an integral part of its function. Figure 2. Adult right ventricular anatomy. Panels A-D show the right ventricle in a progressively superior view as indicated on the torsos. The free walls of the right and left ventricle have been removed. Anatomical landmarks are indicated by colored asterikses. Red asteriks: pulmonary artery; Blue asteriks: right ventricular apex; Orange asteriks: tricuspid valve. Connection of the three asterikses in panel A demonstrates why the shape of the right ventricle is frequently referred to as triangular. 13
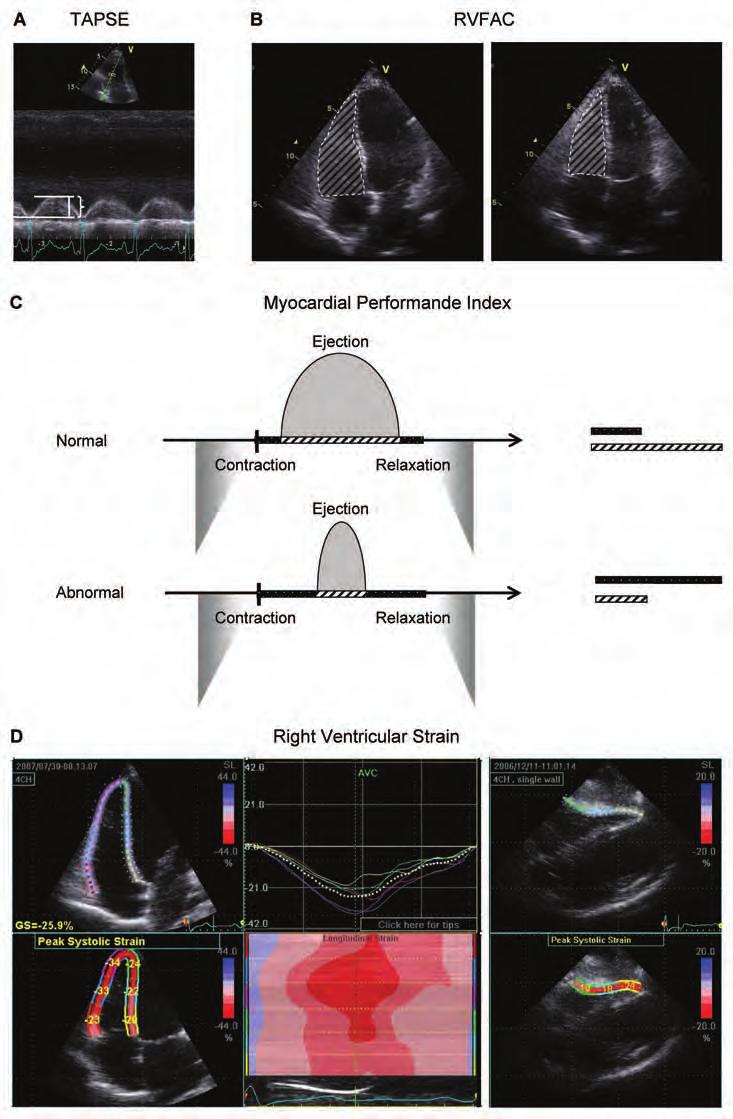
15 Chapter 1 The three-dimensional architecture and the important effect of loading conditions on the right heart make it challenging for physicians to assess right ventricular performance. Currently, no techniques are available that assess all aspects of right ventricular function. Therefore, we rely on functional measurements that are able to assess only a few characteristics of right heart function at the same time. 28 Right ventricular imaging techniques The introduction of echocardiography and, more importantly, cardiovascular magnetic resonance imaging, was the motor behind the fast increasing knowledge about right ventricular function. Although early echocardiographic techniques made it possible to study some of the characteristics of the right ventricle, 33 the anatomy and morphology made study of the right ventricle difficult. In recent years, the quality of echocardiography increased considerably. 34 This made it possible to study right heart function using a two-dimensional technique. Studies demonstrated that simple echocardiographic measurements of right ventricular function (Figure 3 A, B) were associated with patient outcome Drawback of these measurements was the fact that they ignored the complex right heart anatomy. 38 Novel methods such as right ventricular strain measurement (Figure 3 D) provided detailed information about abnormal segmental contraction patterns. 39, 40 It, however, remains to be studied what the additional value of these, more complex, measurements is. Furthermore, three-dimensional echocardiography offers the opportunity to assess right ventricular volumes more precisely, 41, 42 however it is only possible in a limited number of patients due to the position of the right ventricle in the thorax. 38 Another important step-forward in functional assessment was the description of myocardial performance index 43, 44 by Tei et al. (Figure 3 C), which measures the effectiveness of right ventricular contraction. The introduction of cardiovascular magnetic resonance imaging provided, for the first time, the opportunity to investigate right ventricular volumes within its anatomical, three- Figure 3. Echocardiographic assessment of right ventricular function. Panel A: Tricuspid Annular Plane Systolic Excursion, or TAPSE, which measures total movement of the base of the right ventricle into the direction of the apex in a single plane (bracket). Panel B: Right Ventricular Fractional Area Change, or RVFAC, is demonstrated. This measure provides right ventricular luminal area at the end of systole as a percentage of the end-diastolic area. As such, RVFAC is a surrogate of right ventricular contractility. Panel C: Myocardial performance index was first described by Tei et al.. 43 They defined the performance of a ventricle (either left or right) as the time-fraction during which contraction (black box + hatched box) actually leads to ejection of blood (hatched box) into the circulation. In situations of right ventricular overload, lower part of panel C, the effective ejection time reduces signified by shortening of the hatched box. Panel D: Assessment of right ventricular strain. In this technique, the right ventricle is divided into equal segments. In each segment the end-systolic length is expressed as a percentage of the end-diastolic length. Dedicated echocardiographic software is required for these measurements. 14
16 INTRODUCTION 15
17 Chapter 1 dimensional context. 45 Since magnetic resonance imaging is not hampered by abnormal anatomy, 46 it is an excellent tool for assessment of patients with congenital heart disease and right ventricular dysfunction. 47, 48 Besides volume measurement, magnetic resonance imaging is also suitable for assessment of valvular function, specifically regurgitation, which is also relevant for patients with reduced right ventricular performance. 49 Furthermore, whereas this technique was first established as a tool for application in resting conditions, it soon became possible to perform magnetic resonance imaging during exercise. 50 It became apparent that an abnormal ventricular response to exercise was frequently observed in patients with congenital heart disease as compared to healthy controls. 51, 52 However, it remained to be elucidated how abnormal right ventricular response to stress was related to outcome in patients with congenital heart disease. The right ventricle and electrocardiography Another technique for right heart assessment is electrocardiography, which was first described in 1887 by Augustus Désiré Waller 53 and made clinically applicable in 1908 by Willem Einthoven. 54 The right ventricle is thin-walled and part of a low-pressure system in normal situations. Therefore electrical forces are far lower in the right as compared to the left ventricle. Consequently, most electrical activity, as observed on the nowadays used 12-lead surface electrocardiogram, is derived from the left. 55 Only in situations of demarcated right ventricular pressure overload, distinct patterns will occur on the surface electrocardiogram. 56 Therefore most electrocardiography-derived right ventricular disease criteria lack sensitivity. 57 Nonetheless, simple electrocardiographic measurements are helpful in specific situations. E.g., lengthening of QRS duration can be used in patients with tetralogy of Fallot to detect right ventricular volume overload due to pulmonary regurgitation. 58 Moreover, QRS duration is known to reduce after pulmonary valve replacement in patients with a dilated right ventricle. 59 Possibly, the ECG may be helpful in the assessment of patient outcome after pulmonary valve replacement in these patients. Furthermore, electrocardiogram-derived vectorcardiography (Figure 4) greatly improved the sensitivity of criteria for right ventricular pressure overload. 57 It was demonstrated in pulmonary hypertensive rats, that specific vectorcardiographic characteristics changed in response to right ventricular pressure overload, even before hypertrophy occurs. 60 Thereafter clinical investigations in a selected population of patients with pulmonary arterial hypertension showed partial reversibility of these vectorcardiographic characteristics in response to treatment. 61 However, after the first promising results of ECG-derived vectorcardiography in selected groups, it was questioned if the electrocardiogram was of use in heterogeneous patient populations representative of clinical practice. 16

18 INTRODUCTION Figure 4. Electrocardiographic assessment of right ventricular overload. Panel A: A standard 10 seconds, 12-lead surface electrocardiogram with typical characteristics of right ventricular pressure overload: sinus tachycardia, large P-waves, rightward shift of the depolarization axis, frequent extra systoles. These typical changes can only be observed in a minority of patients with advanced disease. 57 Panel B: An electrocardiogram-derived vectorcardiogram. Magnitude and orientation of the cardiac vector is depicted throughout the (electric) cardiac cycle. As opposed to the standard electrocardiogram, the cardiac vector changes quickly in response to hemodynamic alterations. 17
19 Chapter 1 Characterizing the right ventricle The importance of a properly functioning right heart is becoming clearer in an expanding number of cardiovascular and non-cardiovascular diseases Nonetheless, there are still many unanswered questions about assessment of right ventricular pathophysiololgy. 67 Progress in fundamental research provides insight in right ventricular molecular and cellular characteristics, which may be relevant for functional analysis and evaluation of new treatment modalities. 68 Furthermore, the improvements in imaging techniques provided a vast number of novel functional measurements of which the exact clinical application has to be elaborated. 69 Therefore, both clinical and fundamental investigations are necessary for better understanding and more effective treatment of right heart disease. Aim and outline of thesis The aim of this thesis was to further characterize the right ventricle within three different fields of cardiovascular research: 1. Embryonic development, 2: Noninvasive right ventricular imaging, 3: Right ventricular electrocardiography. In part I, several aspects of embryonic development, relevant for normal right ventricular morphology and function are investigated. In chapter 2, a novel concept for normal development of the right ventricular outflow tract is introduced. In chapter 3, the potential relevance of epicardium-derived cells for the difference between left and right ventricular morphology is discussed. Noninvasive imaging techniques are evaluated in part II. In chapter 4, the use of conventional semi-quantitative measurement of right ventricular function in patients with transposition of the great arteries is analyzed. The relevance of abnormal response to stress, measured with cardiovascular magnetic resonance imaging, is investigated in chapter 5. Chapters 6 8 demonstrate how strain measurement can be used in various types of (suspected) right ventricular disease. In part III, both conventional electrocardiography as well as computerized vectorcardiography is described in patients with right ventricular disease. A case-study of conventional electrocardiographic assessment of right ventricular pressure overload is provided in chapter 9. The prognostic value of QRS duration in patients with tetralogy of Fallot who undergo pulmonary valve replacement, is demonstrated in chapter 10. Chapter 11 and 12 discuss the application of ECG-derived vectorcardiography in normal subjects and suspected pulmonary arterial hypertension patients. 18
20 INTRODUCTION References 1. Sade RM, Castaneda AR. The dispensable right ventricle. Surgery 1975; 77: Lee FA. Hemodynamics of the right ventricle in normal and disease states. Cardiol Clin 1992; 10: Oldershaw P. Assessment of right ventricular function and its role in clinical practice. Br Heart J 1992; 68: Cooley RN, Sloan RD, et al. Angiocardiography in congenital heart disease of cyanotic type. II. Observations on tricuspid stenosis or atresia with hypoplasia of the right ventricle. Radiology 1950; 54: Steinberg I. Calcification of the pulmonary artery and enlargement of the right ventricle: a sign of congenital heart disease. Eisenmenger syndrome--pulmonary hypertension, increased pulmonary resistance, and reversal of blood flow. Am J Roentgenol Radium Ther Nucl Med 1966; 98: Bjorkhem G, Lundstrom NR. Echocardiographic studies of children operated on for congenital heart disease; evaluation during the first postoperative year. Eur J Cardiol 1980; 11: Fuster V, McGoon DC, et al. Long-term evaluation (12 to 22 years) of open heart surgery for tetralogy of Fallot. Am J Cardiol 1980; 46: Lopez L, Cohen MS, et al. Unnatural history of the right ventricle in patients with congenitally malformed hearts. Cardiol Young 2010; 20 Suppl 3: Redington AN, Rigby ML, et al. Right ventricular function 10 years after the Mustard operation for transposition of the great arteries: analysis of size, shape, and wall motion. Br Heart J 1989; 62: Grose R, Strain J, et al. Right ventricular function in valvular heart disease: relation to pulmonary artery pressure. J Am Coll Cardiol 1983; 2: Ghio S, Klersy C, et al. Prognostic relevance of the echocardiographic assessment of right ventricular function in patients with idiopathic pulmonary arterial hypertension. Int J Cardiol 2010; 140: Brown KA, Okada RD, et al. Right ventricular ejection fraction response to exercise in patients with coronary artery disease: influence of both right coronary artery disease and exercise-induced changes in right ventricular afterload. J Am Coll Cardiol 1984; 3: Zaffran S, Kelly RG, et al. Right ventricular myocardium derives from the anterior heart field. Circ Res 2004; 95: Mjaatvedt CH, Nakaoka T, et al. The outflow tract of the heart is recruited from a novel heartforming field. Dev Biol 2001; 238: Waldo KL, Kumiski DH, et al. Conotruncal myocardium arises from a secondary heart field. Development 2001; 128: Zammit PS, Kelly RG, et al. Suppression of atrial myosin gene expression occurs independently in the left and right ventricles of the developing mouse heart. Dev Dyn 2000; 217: Kelly RG, Lemonnier M, et al. Cell history determines the maintenance of transcriptional differences between left and right ventricular cardiomyocytes in the developing mouse heart. J Cell Sci 2003; 116: Lowes BD, Minobe W, et al. Changes in gene expression in the intact human heart. Downregulation of alpha-myosin heavy chain in hypertrophied, failing ventricular myocardium. J Clin Invest 1997; 100:
21 Chapter Dore A, Houde C, et al. Angiotensin receptor blockade and exercise capacity in adults with systemic right ventricles: a multicenter, randomized, placebo-controlled clinical trial. Circulation 2005; 112: Provencher S, Herve P, et al. Deleterious effects of beta-blockers on exercise capacity and hemodynamics in patients with portopulmonary hypertension. Gastroenterology 2006; 130: Gittenberger-de Groot AC, Bartelings MM, et al. Basics of cardiac development for the understanding of congenital heart malformations. Pediatr Res 2005; 57: Gittenberger-de Groot AC, Poelmann RE. Cardiac Morphogenesis. In: Yagel S, Silverman NH, Gembruch U, editors. Fetal Cardiology. 2009: Vincent SD, Buckingham ME. How to make a heart: the origin and regulation of cardiac progenitor cells. Curr Top Dev Biol 2010; 90: Risebro CA, Riley PR. Formation of the ventricles. ScientificWorldJournal 2006; 6: Ieda M, Tsuchihashi T, et al. Cardiac fibroblasts regulate myocardial proliferation through beta1 integrin signaling. Dev Cell 2009; 16: Rothenberg F, Fisher SA, et al. Sculpting the cardiac outflow tract. Birth Defects Res C Embryo Today 2003; 69: Rentschler S, Jain R, et al. Tissue-tissue interactions during morphogenesis of the outflow tract. Pediatr Cardiol 2010; 31: Haddad F, Hunt SA, et al. Right ventricular function in cardiovascular disease, part I: Anatomy, physiology, aging, and functional assessment of the right ventricle. Circulation 2008; 117: Furey SA, III, Zieske HA, et al. The essential function of the right ventricle. Am Heart J 1984; 107: de Tombe PP, Mateja RD, et al. Myofilament length dependent activation. J Mol Cell Cardiol 2010; 48: Hanft LM, Korte FS, et al. Cardiac function and modulation of sarcomeric function by length. Cardiovasc Res 2008; 77: Dell Italia LJ. The right ventricle: anatomy, physiology, and clinical importance. Curr Probl Cardiol 1991; 16: Popp RL, Wolfe SB, et al. Estimation of right and left ventricular size by ultrasound. A study of the echoes from the interventricular septum. Am J Cardiol 1969; 24: Lang RM, Bierig M, et al. Recommendations for chamber quantification. Eur J Echocardiogr 2006; 7: Forfia PR, Fisher MR, et al. Tricuspid annular displacement predicts survival in pulmonary hypertension. Am J Respir Crit Care Med 2006; 174: Anavekar NS, Skali H, et al. Usefulness of right ventricular fractional area change to predict death, heart failure, and stroke following myocardial infarction (from the VALIANT ECHO Study). Am J Cardiol 2008; 101: Roos-Hesselink JW, Meijboom FJ, et al. Decline in ventricular function and clinical condition after Mustard repair for transposition of the great arteries (a prospective study of years). Eur Heart J 2004; 25: Lindqvist P, Calcutteea A, et al. Echocardiography in the assessment of right heart function. Eur J Echocardiogr 2008; 9: Pirat B, McCulloch ML, et al. Evaluation of global and regional right ventricular systolic function in patients with pulmonary hypertension using a novel speckle tracking method. Am J Cardiol 2006; 98:
22 INTRODUCTION 40. Borges AC, Knebel F, et al. Right ventricular function assessed by two-dimensional strain and tissue Doppler echocardiography in patients with pulmonary arterial hypertension and effect of vasodilator therapy. Am J Cardiol 2006; 98: Jiang L, Siu SC, et al. Three-dimensional echocardiography. In vivo validation for right ventricular volume and function. Circulation 1994; 89: Papavassiliou DP, Parks WJ, et al. Three-dimensional echocardiographic measurement of right ventricular volume in children with congenital heart disease validated by magnetic resonance imaging. J Am Soc Echocardiogr 1998; 11: Tei C, Ling LH, et al. New index of combined systolic and diastolic myocardial performance: a simple and reproducible measure of cardiac function--a study in normals and dilated cardiomyopathy. J Cardiol 1995; 26: Eidem BW, Tei C, et al. Nongeometric quantitative assessment of right and left ventricular function: myocardial performance index in normal children and patients with Ebstein anomaly. J Am Soc Echocardiogr 1998; 11: de RA, Doornbos J, et al. Cardiovascular applications of magnetic resonance imaging and phosphorus-31 spectroscopy. Eur J Radiol 1992; 14: Pattynama PM, de RA, et al. Evaluation of cardiac function with magnetic resonance imaging. Am Heart J 1994; 128: Weber OM, Higgins CB. MR evaluation of cardiovascular physiology in congenital heart disease: flow and function. J Cardiovasc Magn Reson 2006; 8: Vliegen HW, van SA, et al. Magnetic resonance imaging to assess the hemodynamic effects of pulmonary valve replacement in adults late after repair of tetralogy of fallot. Circulation 2002; 106: Oosterhof T, Mulder BJ, et al. Cardiovascular magnetic resonance in the follow-up of patients with corrected tetralogy of Fallot: a review. Am Heart J 2006; 151: Roest AA, Kunz P, et al. Biventricular response to supine physical exercise in young adults assessed with ultrafast magnetic resonance imaging. Am J Cardiol 2001; 87: Roest AA, Lamb HJ, et al. Cardiovascular response to physical exercise in adult patients after atrial correction for transposition of the great arteries assessed with magnetic resonance imaging. Heart 2004; 90: Roest AA, Helbing WA, et al. Exercise MR imaging in the assessment of pulmonary regurgitation and biventricular function in patients after tetralogy of fallot repair. Radiology 2002; 223: Waller AD. A Demonstration on Man of Electromotive Changes accompanying the Heart s Beat. J Physiol 1887; 8: Einthoven W. Weiteres über das Elektrokardiogram. Pflüger Arch ges Physiol 1908; 122: Zipes DP, Libby P, Bonow RO, Braunwald E. Electrocardiography. In: Braunwalds Heart Disease. Philadelphia: 2004: Harrigan RA, Jones K. ABC of clinical electrocardiography. Conditions affecting the right side of the heart. BMJ 2002; 324: Henkens IR, Mouchaers KT, et al. Improved ECG detection of presence and severity of right ventricular pressure load validated with cardiac magnetic resonance imaging. Am J Physiol Heart Circ Physiol 2008; 294: H2150-H Gatzoulis MA, Balaji S, et al. Risk factors for arrhythmia and sudden cardiac death late after repair of tetralogy of Fallot: a multicentre study. Lancet 2000; 356: Hooft van HB, Henkens IR, et al. Pulmonary valve replacement in tetralogy of Fallot improves the repolarization. Int J Cardiol 2008; 124:
23 Chapter Henkens IR, Mouchaers KT, et al. Early changes in rat hearts with developing pulmonary arterial hypertension can be detected with three-dimensional electrocardiography. Am J Physiol Heart Circ Physiol 2007; 293: H1300-H Henkens IR, Gan CT, et al. ECG monitoring of treatment response in pulmonary arterial hypertension patients. Chest 2008; 134: Di Salvo TG, Mathier M, et al. Preserved right ventricular ejection fraction predicts exercise capacity and survival in advanced heart failure. J Am Coll Cardiol 1995; 25: Mehta SR, Eikelboom JW, et al. Impact of right ventricular involvement on mortality and morbidity in patients with inferior myocardial infarction. J Am Coll Cardiol 2001; 37: Davlouros PA, Niwa K, et al. The right ventricle in congenital heart disease. Heart 2006; 92 Suppl 1: i27-i Vieillard-Baron A, Jardin F. Why protect the right ventricle in patients with acute respiratory distress syndrome? Curr Opin Crit Care 2003; 9: Naeije R. Pulmonary hypertension and right heart failure in chronic obstructive pulmonary disease. Proc Am Thorac Soc 2005; 2: Haddad F, Doyle R, et al. Right ventricular function in cardiovascular disease, part II: pathophysiology, clinical importance, and management of right ventricular failure. Circulation 2008; 117: Kelly RG. Building the right ventricle. Circ Res 2007; 100: Voelkel NF, Quaife RA, et al. Right ventricular function and failure: report of a National Heart, Lung, and Blood Institute working group on cellular and molecular mechanisms of right heart failure. Circulation 2006; 114:
24
25 PART I Embryonic DEVELOPMENT
26
27
28 Chapter 2 Differentiation of the Left and Right Ventricle Governed by Interaction with Epicardium-Derived Cells as Studied in the TGFbeta2 Mutant Mouse Roderick WC Scherptong Monique RM Jongbloed Rebecca Vicente-Steijn Lambertus J Wisse Bin Zhou William Pu Mohamad Azhar Robert E Poelmann Martin J Schalij Adriana C Gittenberger-de Groot Submitted
29 Chapter 2 Abstract Background In the adult heart, morphological and functional differences of right ventricle (RV) and left ventricle (LV) are apparent. We hypothesized that variability in contribution of epicardiumderived cells (EPDCs) to the developing RV and LV might explain these differences. The aim of this study was to assess normal and disrupted formation of the compact myocardial layer of the RV and LV in mice. Methods and Results Epicardial sheet formation and contribution of EPDCs were studied in wildtype and TGFβ2- null embryonic mice (E ) using expression patterns of WT1 and a Cre-activated WT-1 reporter model. After epicardial covering of the heart tube, EPDCs were observed first in the inner curvature and RV wall. WT-1 expressing cells were abundantly observed in the wall of both ventricles at E13.5, more pronounced within the LV correlating with more pronounced thickening of the LV compact myocardial layer. In TGFβ2-null mice, formation and migration of EPDCs was severely diminished, although an epicardial sheet was formed. Differences in RV and LV myocardial thickness as observed in wildtype, were absent in TGFβ2-null mice. Conclusions Spatio-temporal differences in contribution of EPDCs to RV versus LV myocardium were observed during development. Compact myocardial layer formation starts upon migration of EPDCs into the ventricles and is more pronounced in the LV. Disruption of EPDC migration results in absence of normal myocardial thickening, only significant in the LV. This suggests that EPDC-myocardial interaction in the LV differs from that in the RV, which may explain occurrence of lateralized cardiomyopathies as isolated LV non-compaction and may prove relevant for development of cell-based and drug-based therapies. 28
30 DIFFERENTIATION OF THE LEFT AND RIGHT VENTRICLE Introduction Right ventricular (RV) function is an important determinant of survival in a large number of cardiovascular diseases. 1 3 Therapies aimed at long-term improvement of RV function are scarce. 4 In addition, medical therapies which proved to be beneficial in left ventricular (LV) disease are generally not useful in the dysfunctional RV. 5, 6 Therefore, dedicated cell-based therapy might be of interest for the treatment of RV disease. 7, 8 Proper understanding of the differences between the LV and RV on a morphological and molecular level is important for development of these therapies. In the past decade the identification of the second heart field (SHF) showed that the ventricles have a different developmental origin Early in cardiovascular development, the heart exists of a primary heart tube with a venous and an arterial pole. 12 Through migratory processes from the SHF, cells are added to the arterial (and venous) pole of the heart. 9 Whereas the primary heart tube provides the majority of cells of the LV, the SHF provides most cellular components of the RV. 10, 13 This different origin (primary versus SHF) may provide a developmental explanation for the observed differences between the adult LV and RV. 14 The epicardium has concerted interactions with both ventricles during specific stages of development, which is bound to have implications for functioning of the adult heart. 15, 16 The epicardium is derived from the pro-epicardial organ (PEO) which is an element of the caudal part of the SHF and expresses, amongst others, WT-1, TGFβ2, Id2 receptor and PDGFα receptor Epicardial cells migrate from the PEO, cover the ventricles in an orchestrated pattern and form an epithelial sheet. The epicardial cells that cover the distal vascular part of the outflow tract of the heart probably originate from the arterial pole of the heart. 19, 20 After spreading over the heart, epicardial cells go into epithelial-to-mesenchymal transition (EMT) forming a subepicardial layer, in interaction with the underlying myocardium, 21 and migrate into the ventricular wall as epicardium-derived cells (EPDCs). 22, 23 Inside the myocardium EPDCs contribute, amongst others, to vessel formation, differentiation of the Purkinje network and partly differentiate into interstitial fibroblasts. 15, 24, 25 It was demonstrated that the latter cellpopulation induces normal LV growth. 25, 26 Experimental knock-out of epicardium-associated genes in mice showed abnormal epicardium and abnormal development of the ventricular myocardium. 18, Knock-out of TGFβ2, which is expressed in epicardium and is required for EMT, is associated with thin uncompacted myocardium, 27 probably due to a lack of EPDCs. In vitro studies demonstrated the essential role of EPDCs in myocardial proliferation, maturation and alignment. 30 The crucial role of the epicardium for normal ventricular development and compaction is evident, as is the propensity for clinical cases of specific cardiomyopathies, like non-compaction cardiomyopathy and arrhythmogenic right ventricular dysplasia, to occur in a lateralized fashion ( i.e. left vs. right sided, respectively. 31, 32 We hypothesized that EPDCs interact differently with the LV as compared to the RV. As a consequence, EPDCs may contribute to the difference in function and morphology of the postnatal LV and RV. This 29
31 Chapter 2 is particularly relevant since recent studies identified the potential of EPDCs to reactivate embryonic differentiation programs in the adult ischemic heart We are the first to analyse the differences in development of the RV and LV related to the formation of epicardium, the timing of EMT and the migration of EPDCs. The aim of the current study was 1: To assess whether the timing of epicardial sheet formation and EPDC migration is different in the RV as compared to the LV, and 2: To investigate the effect of disrupted epicardial development on formation of the compact layer in the RV versus the LV using the TGFβ2-null mouse model. Methods Mice For the study of normal development, wild type mouse embryos were obtained from the CLB-Swiss strain. To study the fate of EPDCs, WT1 CreERT2/+ and the Cre-activated reporter Rosa26 fslz mice were used. 37 Wt1CreERT2/+ mice were generated by gene targeting followed by Flp-mediated removal of a Neo resistance casette, as described previously (Zhou et al, 2008, also see Figure 2F). CreERT2 is a fusion protein composed of Cre recombinase and a modified variant of the estrogen receptor hormone binding domain. CreERT2 recombines floxed targets in the presence, but not the absence of tamoxifen (Feil et al., 1997). 2 mg tamoxifen (Sigma) was injected peritoneally into pregnant mice at E10.5 to induce Cre activity. Rosa26fsLz (Soriano, 1999) and Rosa26mTmG (Muzumdar et al., 2007) mice were used as Credependent reporters. These mice express LacZ and membrane localized GFP, respectively, after Cre-mediated recombination. Upon maternal injection with tamoxifen, this reporter expresses B-galactosidase upon Cre-mediated recombination and thus provides a means to follow EPDCs after differentiation even when WT-1 is downregulated. To investigate the effect of abnormal EPDC formation and function, the TGFβ2-null mouse was studied. 27 TGFβ2 is abundantly expressed in epicardium 38 and plays an important role in epicardial cell differentiation and invasion. 39 This model provides an effective means to study the effect of abnormal EPDC formation and function, simultaneously for LV as well as RV development. The handling of all animals and embryos was according to the Guide for Care and Use of Laboratory Animals, as published by the NIH. The day the vaginal plug was detected, was designated embryonic day (E) 0.5. Pregnant female mice were sacrificed on consecutive days from E 9.5-E 14.5 and, per day, three embryos were harvested for the study. 30
32 DIFFERENTIATION OF THE LEFT AND RIGHT VENTRICLE Immunohistochemical procedures After fixation in 4% paraformaldehyde in phosphate buffered saline (0.1 M, ph 7.2) and subsequent dehydration embryos were embedded in paraffin, sectioned transversely (5μm) and serially mounted on glass slides. Immunohistochemical staining was performed with antibodies against MLC-2a (1/6000, kindly provided by S.W. Kubalak, Charleston, SC); Nkx2.5 (1/4000, Santa Cruz Biotechnology Inc., CA, United States, SC-8697) and WT-1 (1/1000, Santa Cruz Biotechnology Inc., CA, United States, SC-192). The slides were first incubated for 45 min using ABC-reagent (Vector Laboratories, Burlingame, United States, PK 6100), and then with 400 μg/ml 3 3 di-aminobenzidin tetrahydrochloride (DAB, Sigma-Aldrich, St Louis, United States, D5637) dissolved in trismaleate buffer ph 7.6 to which 20 μl H2O2 was added. The latter incubation was done 5 min for MLC-2a and 10 min for Nkx 2.5 and WT1. Counterstaining was done using 0.1% hematoxylin (Merck, Darmstadt, Germany) for 5 sec, and the slides were subsequently rinsed with tap water for 10 min. Finally, slides were dehydrated and mounted with Entellan (Merck, Darmstadt, Germany). Three-dimensional reconstruction and quantification To address the timing of epicardial covering of the ventricles, the expression of WT-1 from E9.5 to E11.5 was 3D visualized. On each embryonic day, micrographs were made (magnification 10X) of serial sections to cover the whole embryonic heart from the proximal part of the great vessels on the cranial side, down to the inferior cardinal veins on the caudal side. The micrographs were processed using the AMIRA software package (Template Graphics Software, San Diego, CA, United States) as described previously. 40 First, the myocardium, the arterial and the venous pole were reconstructed in MLC-2a stained sections. Then, the expression of WT-1 was superimposed. To this purpose, the nucleus of each WT-1 positive cell, staining brown after incubation with WT-1 antibody, was separately indicated. Thus, the location of WT-1 positive cells in the epicardial sheet and in the extra-epicardial structures in relation to the underlying and surrounding tissue is provided. Wall thickness was assessed in the apical and mid-lateral free wall of the LV and RV. Per stage (E ), micrographs were made of at least three different wild type and TGFβ 2 -null mouse embryonic hearts. In each heart, a section was selected at approximately the same level that included the LV and RV, the interventricular septum and the atrioventricular transition. Wall thickness (apical and mid-lateral, LV and RV) was measured in each section by 2 measurements at the mid lateral wall, and at the apical wall, respectively. Measurements were performed by two observers in consensus (MRMJ, RVS), blinded from the phenotype of the hearts at the time of measurement, using the analysis software ImageJ (Rasband, W.S., ImageJ, U. S. National Institutes of Health, Bethesda, Maryland, USA, ). Results were depicted and significance of differences between RV and LV in wildtype hearts, and in knockout 31
33 Chapter 2 hearts, and between wild type and knockout embryos, was calculated with GraphPad Prism 4.00 for Windows (GraphPad Software, La Jolla, CA, United States). Results Epicardial sheet formation At E9.5, the PEO expressed WT-1 and protruded into the coelomic cavity at the caudal part of the heart at the sinus venosus (Figure1A). Differentiation of the sinus venosus myocardium had only just been initiated and the cardinal veins were still devoid of myocardium. The expression of WT-1 was not confined to the PEO but was also observed in the mesenchyme surrounding the left and right cardinal veins (Figure 1A, arrows). As became apparent from the three- dimensional reconstruction at this stage (Figure 1E), these WT-1 positive cells enclosed the left and right cardinal veins and the proximal part of the sinus venosus in a semicircular fashion. This area of WT-1 positive cells was also observed along the dorsal coelomic cavity wall and was continuous with the PEO (Figure 1). Small clusters of WT-1 positive cells were already detached from the PEO (Figure 1C, D) and were found at the inner curvature of the looping heart tube. The LV was larger in size as compared to the RV and in both ventricles, trabeculations were observed. The trabeculations of the LV were coarser and more pronounced compared to the RV. The outer layer of myocardium was thin, as no compact myocardium had developed, yet. At E10.5, cardiac looping had progressed, however the heart was still in an unseptated state consisting of a common atrium, primitive LV and the outflow tract. Only remnants of the PEO were visible at the original caudal site of the heart and most WT-1 positive cells now attached to the heart tube to form the epicardial sheet (Figure 2D). The early epicardial sheet covered the primitive (common) atrium, the primitive LV and the part of the RV adjacent to the primary fold. Distal parts of the RV were sparsely covered with WT1-positive cells and the outflow tract was for the greater part uncovered (Figure 2). Pronounced expression of WT1 in the coelomic cavity lining was observed. Furthermore, an epicardial sheet extended from the coelomic cavity wall covering the distal end of the outflow tract (Figure 2A-C). Expression of WT1 was more prominent on the right side (putative aorta) of the outflow tract, whereas on the left side (putative pulmonary trunk) the expression of WT1 was almost absent (Figure 2A). At E11.5, the PEO-derived epicardial sheet extended towards the outflow tract, leaving the left side uncovered, whereas on the right (aortic) side the PEO-derived and arterial polederived epicardium were connected and formed a continuous sheet (Figure 2E-G). From E12.5 the heart was fully covered, however, a lower density of WT-1 expressing cells was observed on the RV compared to the LV surface (Figure 2H, I), as observed from WT1Cre- ERT2/+ at ED
. Cells of the pro-epicardial organ (PEO) express WT-1 (A) and not Nkx2.5 (B).")
34 DIFFERENTIATION OF THE LEFT AND RIGHT VENTRICLE Figure 1. E9.5. WT-1 expression in the pro-epicardial organ and putative sinus venosus. A,B: Caudal sections approximately at the level of entrance of the cardinal veins in the sinus venosus (SV). Cells of the pro-epicardial organ (PEO) express WT-1 (A) and not Nkx2.5 (B). WT-1 positive cells are also observed surrounding the right cardinal vein (RCV) and left cardinal vein (LCV, arrows in A) C,D: Epicardial cells traverse the coelomic cavity and attach to the myocardial surface of the ventricle (boxed area in C, which is enlarged in D) Arrowheads in D indicated WT-1 positive epicardial cells. The first epicardial cells are observed at the inner curvature and on the left ventricular surface. E. 3D-reconstruction (left-antero-caudal view) indicating WT-1 expression (indicated by the brown cones) at the inflow part of the heart. Besides the PEO, WT-1 expression is seen in the tissue surrounding the LCV and RCV, that are indicated in blue. Myocardium of the atria and ventricles is indicated in grey. The area of WT-1 expression around the cardinal veins is continuous with the PEO. Abbreviations: A: primitive atrium, DAo: dorsal aorta, LV: primitive left ventricle, RV: primitive right ventricle. Bars: 100 µm 33

35 Chapter 2 Figure 2. Epicardial covering of the heart at E10.5, E11.5 and E13.5. A-C. E10.5. The outflow tract (OFT) is covered with WT-1-expressing epicardial cells on the right side (putative aorta), whereas on the left side (putative pulmonary trunk), no epicardial cells are observed. Cells of the arterial pole epicardium have a cuboidal shape (arrowhead in upper boxed area in A, which is enlarged in B). Epicardial cells covering the more proximal right part of the OFT (that are pro-epicardial organ derived) have a flat, epithelial morphology (arrowhead in lower boxed panel in A, shown enlarged in C). D. Towards the apex both the right ventricle (RV) and left ventricle (LV) have an epicardial covering. The left ventricle (LV) is fully covered by epicardium at E10.5. E. At E11.5 the left side of the OFT is still uncovered by epicardium. F,G: 3D-reconstructions of myocardium (light grey for RV and OFT myocardium, dark grey for LV myocardium) and epicardium (dark brown) demonstrating that the left side of the OFT (the putative pulmonary trunk (purple), is the latest to be covered by epicardium. The atria are depicted in pink. H,I: At E13.5 the PEO-derived ventricular epicardium is fully developed, however the density of epicardial cells is lower at the RV surface as compared to the LV surface as can be observed in WT1 CreERT2/+. AoS: aortic sac. Bars: panels B,C: 50μm, panels A,D,E: 100 µm 34
36 DIFFERENTIATION OF THE LEFT AND RIGHT VENTRICLE EPDC formation and migration From E12.5 onwards, generalized EMT throughout the epicardium of the ventricles resulted in a subepicardial layer covering the LV and the RV and formation of EPDCs was extensive (Figure 3). Migration of EPDCs was observed into RV myocardium but not into the LV (Figure 3A-C). The expression pattern of WT1CreERT2/+ confirmed the presence of EPDCs in the thin myocardial layer of the RV, whereas epicardium-derived cells could not be seen in the LV (Figure 3G-L). Myocardial compaction Figure 4 summarizes the process of myocardial compaction. At E11.5, both ventricles had a thin and uncompacted myocardial wall with loosely organized cells, while the RV was slightly smaller in size. The LV was the first in which reorganization of the compact myocardial layer could be observed at E12.5 (Figure 4A-D). This compact layer was characterized by a lower intensity of MLC-2a expression compared to the trabecular myocardium. At E13.5, MLC2a expression was of lower intensity within the compact outer layer of LV myocardium, whereas reduction of MLC2a expression occurred only at E14.5 in the RV (Figure 4E-H). Simultaneous with reduced expression of MLC2a, cellular organization changed within the LV wall. Structured layers of myocardium started to form in the LV, opposed to the loose organization in RV myocardium. The difference in compaction between the LV and RV was also reflected in myocardial thickening. Since both ventricles were thin-walled and consisted of a single or double layer of cells, no significant difference was observed in myocardial thickness between the LV and RV at E11.5 (Figure 4I). Thereafter, the LV was already significantly thicker at E12.5 in the apical wall and from E14.5 also at mid-lateral level, increasing considerably during development (Figure 4I). Simultaneous with myocardial compaction, expression of WT-1 within the ventricles increased, specifically in the LV where EPDCs were abundantly present in the compact myocardial layer (Figure 4J-M). In the RV, some EPDCs were present in the compact myocardium, but also in the trabeculae, which was not seen in the LV. Differences in density of EPDcs were as also observed in the expression pattern of WT1CreERT2/+ at E14.5 when compaction had commenced in both ventricles (Figure 4N-P). Disruption of epicardial cell migration TGFβ2 plays an important role in EMT and migration of EPDCs, 38 and expression is associated with regular formation of an epicardial sheet (Figure 5). Morphology of the myocardium 35
 (B) and left ventricle (LV) (C). A subepicardial layer has started to form in both the RV and LV.")
37 Chapter 2 Figure 3. E12.5 EPDC formation and migration starts in the right ventricle. A: Overview section of the right ventricle (RV) and left ventricle (LV) at stage E12.5. The ventricles are completely covered by a WT-1 positive epicardial layer. B-C: Enlargements of the boxed areas in A, showing the right ventricle (RV) (B) and left ventricle (LV) (C). A subepicardial layer has started to form in both the RV and LV. EPDCs are found in solely in the myocardium of the RV (B, arrowheads) and not the LV (C). D,E: To confirm this observation, epicardial cells were followed using WT1 CreERT2/+. D: overview section, E: enlargement of the boxed area in E, at the level of the LV. No EPDC s are found in the myocardium. F. Schematic depiction of the Wt1 CreERT2/+ mouse model. For description see the Methods section. G-L: Results in WT1 CreERT2/+, stage E12.5. A subepicardial layer is present in both ventricles and migration of EPDCs into myocardium is observed in the RV (arrows in G and J), but not the LV (I and L). Some EPDCs were also present in the RV part adjacent to the interventricular septum (IVS) (J), and in the IVS itself (arrowheads in H). Bars: B,C: 50μm, other bars: 100 µm 36

38 DIFFERENTIATION OF THE LEFT AND RIGHT VENTRICLE Figure 4. EPDCs and myocardial compaction at stages E11.5- E14.5. A-D. Myocardial compaction and thickening in the left ventricle (LV) at stages E11.5-E14.5. Development of a compact myocardial layer can observed starting from E12.5 and increasing in subsequent stages. E-H: Myocardial compaction and thickening in the right ventricle (RV) at stages E11.5-E14.5. A compact myocardial layer can be observed starting only at E14.5 in the RV. I. Quantification of myocardial thickening. Measurements at the level of mid-lateral wall are indicated in the left panel, and measurements at level of the apical wall are indicated in the right panel. There is a significant increase in wall thickness of the left ventricle during these developmental stages, whereas this increase in wall thickness is not significant for the RV. At the level of the mid-lateral wall, the LV wall is significantly thicker than the RV wall at E14.5, whereas at the apical wall, the LV is already significantly thicker at E12.5. J-M: E14.5: Structural differences are observed comparing the RV and LV. In the RV (J,K), the compact myocardium is still relatively loosely organized as compared to the LV (L,M). Abundant WT1 expressing EPDC s are observed specifically within the compact myocardial layer of the LV (M). In the RV some EPDC s are also observed in the compact myocardial layer, as well as at the base of the trabeculae (K, arrow heads). N-P: WT1 CreERT2/+. O is an overview section at the level of the RV and LV. N and O are enlargements of the boxed areas in O, at the level of the RV (N) and LV (P). Results in WT1 CreERT2/+ confirmed the abundant presence of EPDCs in the LV compact myocardial layer (P) and the presence of some EPDCs within the compact RV myocardium (N). *p<0.05; **p< Bars: 100 µm 37
 and right ventricle (RV). The myocardium of the interventricular septum (IVS) has a spongeous appearance.")
39 Chapter 2 Figure 5. E13.5. TGFβ2 is required for normal EPDC migration and ventricular compaction. A,B: Overview sections of the heart at stage E13.5 in WT (A) and TGFβ2 knockout (B) embryos. In TGFβ2 knockout embryos thin myocardium is observed in both the left ventricle (LV) and right ventricle (RV). The myocardium of the interventricular septum (IVS) has a spongeous appearance. C-F: Overview of myocardial compaction from E11.5 to E14.5 in wildtype (C,E) and TGFβ 2 -null (D,F) mouse embryos. In TGFβ 2 -null mouse embryos (D,F), both the LV and RV myocardium is thin. Migration of EPDCs into the ventricles is severely reduced, and only a few EPDCs can be observed in the RV and LV (D, F, arrow heads). G: Quantification of myocardial thinning. Measurements at the level of mid-lateral wall are indicated in the left panel, and measurements at the level of the apical wall are indicated in the right panel. In contrast to wildtype, no significant difference in wall thickness between the RV and LV was measured in the TGFβ2 knockout embryos. The increase in LV wall thickness throughout development observed in wildtype, is lacking in TGFβ2 knockout embryos. In the midlateral wall, a significant difference in wall thickness of the LV was observed between wildtype and TGFβ2 knockout embryos at stages E13.5 and E14.5. In the measurements of the apical wall, a significant difference in wall thickness in the apical wall of the LV was observed between wildtype and TGFβ2 knockout from E12.5 onwards. *p<0.05; **p< RA: right atrium, LA: left atrium. Bars: 100 µm. 38
40 DIFFERENTIATION OF THE LEFT AND RIGHT VENTRICLE was severely abnormal in TGFβ2-null embryos. Both ventricular vascular walls were thin and uncompacted, while the LV was most prominently affected (Figure 5A,B). In TGFβ2-null mice, expression of WT1 was confined to the epicardium and could only sparsely be found within myocardium. (Figure 5C-F). In knockout embryos no significant differences between RV and LV ventricular wall (apical or mid lateral) were observed throughout development. The increase in LV apical wall thickness observed in wildtype, was lacking in the knockout animals (Figure 5G). Comparing wildtype and knockout embryos, significant differences in wall thickness between wildtype and TGFβ2- null embryos were observed in the apical wall of the LV and from E13.5 onward this difference was also significant for thickness measurements in the LV mid-lateral wall (Figure 5G). Discussion We evaluated the difference in timing of epicardial sheet formation, EMT and migration of EPDCs between the LV and RV in wildtype and TGFβ2-null mouse embryos. WT1 CreERT2/+ and the Cre-activated reporter Rosa26 fslz were used in addition to the protein expression patterns of WT-1. WT-1 was expressed within the mesenchyme surrounding the sinus venosus, the PEO and epicardium. Epicardial covering in the RV is completed later and is less dense compared to the LV. In the RV free wall, migration of EPDCs occurs earlier compared to the LV free wall. EPDCs, having an essential role in normal myocardial compaction development, are more abundant within LV compared to RV myocardium. Finally, due to lack of normal EMT in TGFβ2-null mouse embryos the number of EPDCs is severely reduced in both ventricles, but more pronounced in the LV, resulting in myocardial thinning which is more prominent in the LV. A number of studies indicate the relevance of preserved RV function for survival in patients with cardiac disease Although a wide range of therapeutic options is available for LV failure, treatment possibilities are still limited in case of RV dysfunction. 4 Many differences between the LV and RV on morphological as well as molecular level are founded in embryonic development. 45 The recognition of developmental processes, such as addition of cellpopulations to the embryonic heart e.g. SHF, EPDCs and neural crest cells, have contributed to understanding differences between the LV and RV. 9, 10, 15, 22, 46 However, little attention has been paid to right/left differences in interaction of these cell populations. This is of particular 31, 32 interest since specific cardiomyopathies have a propensity to occur lateralised. EPDCs and ventricular compaction The nuclear transcription factor WT-1 is expressed in the PEO and epicardium and expression is down-regulated upon differentiation of EPDCs. 47 Therefore, the use of reporter constructs 39
41 Chapter 2 is essential to trace the fate of EPDCs after EMT. 37 The current study demonstrates that WT-1 is expressed in epicardium, but also abundantly in the venous pole of the heart at early developmental stages, in the area that surrounds the lumen of the left and right cardinal veins, where the sinus venosus myocardium will form. As a consequence WT-1 is not entirely epicardium-specific, but it is generally accepted that with care WT-1 can be used to study 48, 49 EPDCs. EPDCs contribute to smooth muscle cell formation, development of the cardiac conduction system, composition of the annulus fibrosus and cardiac valves and formation of interstitial fibroblasts. 22, 25, During ventricular development, epicardium and EPDCs interact with underlying and surrounding myocardium on different levels depending on the stage of development. 16 EPDCs that differentiate into interstitial fibroblasts contribute to myocardial proliferation and compaction. 25 Since the LV and RV have a distinct developmental origin (first heart field vs. SHF) and a different timing in terms of growth, it is postulated that the interaction between epicardium and EPDCs on the one hand and myocardium on the other hand varies between both ventricles. The current study shows that epicardial covering is completed later and is less dense in the RV compared to the LV. At E9.5, epicardial covering of the ventricles commences, and the RV expands quickly as a result of proliferation and addition of SHF-derived myocardium. 54 At this stage, the RV is thin-walled and the RV myocardium is loosely organized. The epicardial sheet expands gradually and maintains a contiguous network of epithelial cells. 16 As a consequence, RV expansion, which is most prominent on the left side of the OFT, surpasses extension of the epicardial sheet. This may explain why specifically the left side of the OFT is the latest to be covered by epicardium. Invasion of EPDCs into the myocardium occurred earlier as compared to the LV, although epicardial covering was completed later in the RV. Furthermore, EPDCs were observed near the trabecular surface of the RV and not the LV. In a previous chick-quail chimera study, it was demonstrated that permissiveness for EPDCs is variable within the embryonic heart. 55 The exact mechanism that regulates this variation in myocardial permissiveness is still unclear. We postulate that the loose organization of RV myocardium facilitates early invasion of EPDCs into the RV. From E13.5 the number of myocardially located EPDCs increased dramatically, specifically within the LV. Previous studies demonstrated that this invasion process is essential for normal development of the compact myocardial layer. 25, 26 EPDCs induce myocardial alignment and proliferation through cell-cell interaction. 30 EPDCs are the primary source of cardiac interstitial fibroblasts 22 regulating myocardial proliferation and compaction through fibronectin and collagen synthesis in a process that requires β1 Integrin signalling.26 Therefore, EPDCs are important for the difference in proliferation between the LV and RV. The current study shows that proliferation and myocardial thickening starts at E12.5 in the LV, simultaneous with the invasion of EPDCs. Although EPDCs were observed in the free wall of the RV, their density was 40
42 DIFFERENTIATION OF THE LEFT AND RIGHT VENTRICLE far more prominent in the LV. The spatio-temporal difference in EPDC invasion in the RV may explain why RV myocardium remains thinner as compared to LV myocardium. Alternatively, the lack of an epicardial contribution, more specifically EPDCs, during ventricular development would exert strongest effects in the LV. TGFβ2 and myocardial proliferation Normal EMT, required for the formation of EPDCs, is a tightly regulated process that involves expression of several genes during specific time-intervals. 16 Most of these genes serve multiple functions during cardiovascular development and experimental knock-out of epicardial genes resulted in severe malformations and embryonic lethality as observed in WT-1 knock-out. 56 TGFβ2, expressed by epicardium, is required for normal EMT and migration of EPDCs. 57 TGFβ2-null embryos have multiple cardiac defects, but embryonic lethality was not observed. 27 In TGFβ2 null embryos the compact myocardial layer of the ventricles was abnormally thin and spongy. Hence this model is well-suited for the study of abnormal EPDC contribution to ventricular development. Our evaluation shows that knock-out of TGFβ2 results in a severely reduced densities of EPDCs within the myocardium of the ventricles. The morphological changes were most prominent in the LV, which was expected since the contribution of EPDCs was more important for the LV in wildtype embryos. In the knockout animals, the normal difference in myocardial thickness between RV and LV disappeared, as quantification of myocardial thickening in the RV demonstrated similar thickness in wildtype and TGFβ 2 -null embryos, underscoring that the number of invading EPDCs is instrumental in myocardial architecture. EPDCs and the difference between LV and RV myocardium Whereas the LV largely originates from the first heart field-derived primary heart tube, the RV develops as a result of the addition of cellular components from the SHF This requires regulated proliferation and differentiation which is partly mediated by Wnt, Hedgehog, bone morphogenetic protein and fibroblast growth factor (FGF) signaling pathways. 58 FGF specifically is important for proliferation within the SHF, lengthening of the OFT and normal RV development. 59 To date, a role for FGF in early development of the LV has not been identified. However, FGF signaling is required for normal invasion of EPDCs and for myocardial growth in both ventricles. 25, 60 It is postulated that the multiple functions of FGF during RV development result in responses to EPDC-mediated FGF signaling that differ between the RV and LV. The LV and RV express different sarcomeric genes during cardiac development. 61 The distinctive origins of the LV and RV (first heart field vs. SHF) may account for these differences in 41
43 Chapter 2 expression patterns, and could also be relevant for the growth potential of the ventricles. 62 Although EPDCs induce myocardial organization and proliferation, the characteristics of the underlying and surrounding myocardium are bound to be important. Functional relevance of EPDCs for the treatment of cardiac disease RV dysfunction is a recognized problem in adult patients with congenital or acquired heart disease. 4 Most medical therapies have no or limited effect on RV function in situations of RV overload. In patients with transposition of the great arteries and a systemic RV, treatment with angiotensin receptor blockers does not improve ventricular function, whereas this effect is beyond dispute in patients with LV disease. 5 Similarly, beta-blockade has adverse effects in patients with pulmonary hypertension and an overloaded RV. 6 In recent investigations, it was suggested that the multipotent EPDCs may have potential for cell-based therapies. 33, 34, 63, 64 More importantly, the paracrine function of EPDCs during cardiac development may be preserved in adult life, which can be relevant for the development of novel treatment strategies in cardiovascular disease. 36, 65 Our evaluation indicates that the interaction between myocardium and epicardium follows different patterns in the RV and LV. Therefore, future studies need to explore the mechanisms that guide EPDC-myocardium interaction in the RV and LV separately. Conclusion WT-1 can be used to investigate the fate of EPDCs. However, data interpretation should be performed with diligence since WT1 is also expressed in non-epicardial cell populations. The RV is covered later and less densely by epicardium compared to the LV. Invasion of EPDCs occurs slightly earlier and with a different patterning in the RV. Myocardial thickening occurs from E12.5, upon migration of EPDCs into myocardium, being more prominent in the LV and requires TGFβ2. In TGFβ2-null mouse embryos, migration of EPDCs into myocardium is severely reduced resulting in thin, uncompacted ventricles, most obvious in the LV. 42
44 DIFFERENTIATION OF THE LEFT AND RIGHT VENTRICLE References 1. Steinberg I. Calcification of the pulmonary artery and enlargement of the right ventricle: a sign of congenital heart disease. Eisenmenger syndrome--pulmonary hypertension, increased pulmonary resistance, and reversal of blood flow. Am J Roentgenol Radium Ther Nucl Med 1966; 98: Grose R, Strain J, et al. Right ventricular function in valvular heart disease: relation to pulmonary artery pressure. J Am Coll Cardiol 1983; 2: Brown KA, Okada RD, et al. Right ventricular ejection fraction response to exercise in patients with coronary artery disease: influence of both right coronary artery disease and exercise-induced changes in right ventricular afterload. J Am Coll Cardiol 1984; 3: Haddad F, Doyle R, et al. Right ventricular function in cardiovascular disease, part II: pathophysiology, clinical importance, and management of right ventricular failure. Circulation 2008; 117: Dore A, Houde C, et al. Angiotensin receptor blockade and exercise capacity in adults with systemic right ventricles: a multicenter, randomized, placebo-controlled clinical trial. Circulation 2005; 112: Provencher S, Herve P, et al. Deleterious effects of beta-blockers on exercise capacity and hemodynamics in patients with portopulmonary hypertension. Gastroenterology 2006; 130: Umar S, de Visser YP, et al. Allogenic stem cell therapy improves right ventricular function by improving lung pathology in rats with pulmonary hypertension. Am J Physiol Heart Circ Physiol 2009; 297: H1606-H Castellani C, Padalino M, et al. Bone-marrow-derived CXCR4-positive tissue-committed stem cell recruitment in human right ventricular remodeling. Hum Pathol 2010; 41: Mjaatvedt CH, Nakaoka T, et al. The outflow tract of the heart is recruited from a novel heartforming field. Dev Biol 2001; 238: Cai CL, Liang X, et al. Isl1 identifies a cardiac progenitor population that proliferates prior to differentiation and contributes a majority of cells to the heart. Dev Cell 2003; 5: Waldo KL, Hutson MR, et al. Secondary heart field contributes myocardium and smooth muscle to the arterial pole of the developing heart. Dev Biol 2005; 281: Gittenberger-de Groot AC, Bartelings MM, et al. Basics of cardiac development for the understanding of congenital heart malformations. Pediatr Res 2005; 57: Zaffran S, Kelly RG, et al. Right ventricular myocardium derives from the anterior heart field. Circ Res 2004; 95: Franco D, Campione M, et al. Multiple transcriptional domains, with distinct left and right components, in the atrial chambers of the developing heart. Circ Res 2000; 87: Poelmann RE, Lie-Venema H, et al. The role of the epicardium and neural crest as extracardiac contributors to coronary vascular development. Tex Heart Inst J 2002; 29: Lie-Venema H, van den Akker NMS, et al. Origin, fate, and function of epicardium-derived cells (EPCDs) in normal and abnormal cardiac development. ScientificWorldJournal 2007; 7: Bax NA, Lie-Venema H, et al. Platelet-derived growth factor is involved in the differentiation of second heart field-derived cardiac structures in chicken embryos. Dev Dyn 2009; 238: Jongbloed MR, Vicente-Steijn R, et al. Expression of Id2 in the second heart field and cardiac defects in Id2 knock-out mice. Dev Dyn 2011; 240:
45 Chapter Perez-Pomares JM, Phelps A, et al. Epicardial-like cells on the distal arterial end of the cardiac outflow tract do not derive from the proepicardium but are derivatives of the cephalic pericardium. Dev Dyn 2003; 227: Gittenberger-de Groot AC, Winter EM, et al. The arterial and cardiac epicardium in development, disease and repair. Differentiation 2012; 84: Vrancken Peeters M-PFM, Gittenberger-de Groot AC, et al. Smooth muscle cells and fibroblasts of the coronary arteries derive from epithelial-mesenchymal transformation of the epicardium. Anat Embryol 1999; 199: Gittenberger-de Groot AC, Vrancken Peeters M-PFM, et al. Epicardium-derived cells contribute a novel population to the myocardial wall and the atrioventricular cushions. Circ Res 1998; 82: Munoz-Chapuli R, Macias D, et al. The epicardium and epicardial-derived cells: Multiple functions in cardiac development. Revista Espanola de Cardiologia 2002; 55: Eralp I, Lie-Venema H, et al. Epicardium-derived cells are important for correct development of the Purkinje fibers in the avian heart. Anat Rec 2006; 288A: Vega-Hernandez M, Kovacs A, et al. FGF10/FGFR2b signaling is essential for cardiac fibroblast development and growth of the myocardium. Development 2011; 138: Ieda M, Tsuchihashi T, et al. Cardiac fibroblasts regulate myocardial proliferation through beta1 integrin signaling. Dev Cell 2009; 16: Bartram U, Molin DGM, et al. Double-outlet right ventricle and overriding tricuspid valve reflect disturbances of looping, myocardialization, endocardial cushion differentiation, and apoptosis in TGFß2-knockout mice. Circulation 2001; 103: Mahtab EAF, Wijffels MCEF, et al. Cardiac malformations and myocardial abnormalities in podoplanin knockout mouse embryos: correlation with abnormal epicardial development. Dev Dyn 2008; 237: Bax NA, Bleyl SB, et al. Cardiac malformations in Pdgfralpha mutant embryos are associated with increased expression of WT1 and Nkx2.5 in the second heart field. Dev Dyn 2010; 239: Weeke-Klimp A, Bax NA, et al. Epicardium-derived cells enhance proliferation, cellular maturation and alignment of cardiomyocytes. J Mol Cell Cardiol 2010; 49: Pantazis AA, Elliott PM. Left ventricular noncompaction. Curr Opin Cardiol 2009; 24: Ellinor PT, MacRae CA, et al. Arrhythmogenic right ventricular cardiomyopathy. Heart Fail Clin 2010; 6: Winter EM, Grauss RW, et al. Preservation of left ventricular function and attenuation of remodeling after transplantation of human epicardium-derived cells into the infarcted mouse heart. Circulation 2007; 116: Zhou B, Pu WT. Epicardial epithelial-to-mesenchymal transition in injured heart. J Cell Mol Med 2011; 15: Smart N, Bollini S, et al. De novo cardiomyocytes from within the activated adult heart after injury. Nature 2011; 474: Gittenberger-de-Groot AC, Winter EM, et al. Epicardium-derived cells (EPDCs) in development, cardiac disease and repair of ischemia. J Cell Mol Med 2010; 14: Zhou B, Ma Q, et al. Epicardial progenitors contribute to the cardiomyocyte lineage in the developing heart. Nature 2008; 454: Molin DGM, Bartram U, et al. Expression patterns of Tgfb1-3 associate with myocardialisation of the outflow tract and the development of the epicardium and the fibrous heart skeleton. Dev Dyn 2003; 227:
46 DIFFERENTIATION OF THE LEFT AND RIGHT VENTRICLE 39. Compton LA, Potash DA, et al. Transforming growth factor-beta induces loss of epithelial character and smooth muscle cell differentiation in epicardial cells. Dev Dyn 2006; 235: Jongbloed MRM, Schalij MJ, et al. Embryonic conduction tissue: a spatial correlation with adult arrhythmogenic areas? Transgenic CCS/lacZ expression in the cardiac conduction system of murine embryos. J Cardiovasc Electrophysiol 2004; 15: Antoni ML, Scherptong RW, et al. Prognostic value of right ventricular function in patients after acute myocardial infarction treated with primary percutaneous coronary intervention. Circ Cardiovasc Imaging 2010; 3: Anavekar NS, Skali H, et al. Usefulness of right ventricular fractional area change to predict death, heart failure, and stroke following myocardial infarction (from the VALIANT ECHO Study). Am J Cardiol 2008; 101: Winter MM, Scherptong RW, et al. Ventricular response to stress predicts outcome in adult patients with a systemic right ventricle. Am Heart J 2010; 160: Scherptong RW, Mollema SA, et al. Right ventricular peak systolic longitudinal strain is a sensitive marker for right ventricular deterioration in adult patients with tetralogy of Fallot. Int J Cardiovasc Imaging 2009; 25: Srivastava D. Making or breaking the heart: from lineage determination to morphogenesis. Cell 2006; 126: Boot MJ, Gittenberger-de Groot AC, et al. Spatiotemporally separated cardiac neural crest subpopulations that target the outflow tract septum and pharyngeal arch arteries. Anat Rec 2003; 275A: Perez-Pomares JM, Phelps A, et al. Experimental studies on the spatiotemporal expression of WT1 and RALDH2 in the embryonic avian heart: A model for the regulation of myocardial and valvuloseptal development by epicardially derived cells (EPDCs). Dev Biol 2002; 247: Scholz H, Kirschner KM. A role for the Wilms tumor protein WT1 in organ development. Physiology (Bethesda ) 2005; 20: Bax NA, Van Oorschot AA, et al. In vitro epithelial-to-mesenchymal transformation in human adult epicardial cells is regulated by TGFbeta-signaling and WT1. Basic Res Cardiol 2011; 106: Gittenberger-de Groot AC, Vrancken Peeters M-PFM, et al. Epicardial outgrowth inhibition leads to compensatory mesothelial outflow tract collar and abnormal cardiac septation and coronary formation. Circ Res 2000; 87: Lie-Venema H, Eralp I, et al. Periostin expression by epicardium-derived cells (EPDCs) is involved in the development of the atrioventricular valves and fibrous heart skeleton. Differentiation 2008; 76: Kolditz DP, Wijffels MC, et al. Epicardium-derived cells in development of annulus fibrosis and persistence of accessory pathways. Circulation 2008; 117: Zhou B, von Gise A, et al. Genetic fate mapping demonstrates contribution of epicardium-derived cells to the annulus fibrosis of the mammalian heart. Dev Biol 2010; 338: Rana MS, Horsten NC, et al. Trabeculated right ventricular free wall in the chicken heart forms by ventricularization of the myocardium initially forming the outflow tract. Circ Res 2007; 100: Lie-Venema H, Eralp I, et al. Myocardial heterogeneity in permissiveness for epicardium-derived cells and endothelial precursor cells along the developing heart tube at the onset of coronary vascularization. Anat Rec 2005; 282A: von Gise A, Zhou B, et al. WT1 regulates epicardial epithelial to mesenchymal transition through beta-catenin and retinoic acid signaling pathways. Dev Biol 2011; 356:
47 Chapter Mercado-Pimentel ME, Runyan RB. Multiple transforming growth factor b isoforms and receptors function during epithelial-mesenchymal cell transformation in the embryonic heart. Cells Tissues Organs 2007; 185: Rochais F, Mesbah K, et al. Signaling pathways controlling second heart field development. Circ Res 2009; 104: Marguerie A, Bajolle F, et al. Congenital heart defects in Fgfr2-IIIb and Fgf10 mutant mice. Cardiovasc Res 2006; 71: Pennisi DJ, Mikawa T. FGFR-1 is required by epicardium-derived cells for myocardial invasion and correct coronary vascular lineage differentiation. Dev Biol 2009; 328: Zammit PS, Kelly RG, et al. Suppression of atrial myosin gene expression occurs independently in the left and right ventricles of the developing mouse heart. Dev Dyn 2000; 217: Jonker SS, Zhang L, et al. Myocyte enlargement, differentiation, and proliferation kinetics in the fetal sheep heart. J Appl Physiol 2007; 102: Winter EM, Van Oorschot AA, et al. A new direction for cardiac regeneration therapy: application of synergistically acting epicardium-derived cells and cardiomyocyte progenitor cells. Circ Heart Fail 2009; 2: Limana F, Capogrossi MC, et al. The epicardium in cardiac repair: from the stem cell view. Pharmacol Ther 2011; 129: Smart N, Riley PR. The epicardium as a candidate for heart regeneration. Future Cardiol 2012; 8:
48 Chapter 3 Morphogenesis of Outflow Tract Rotation During Cardiac Development: The Pulmonary Push Concept Roderick WC Scherptong Monique RM Jongbloed Lambertus J Wisse Rebecca Vicente-Steijn Margot M Bartelings Robert E. Poelmann Martin J Schalij Adriana C Gittenberger-de Groot Dev Dyn Sep;241(9):
49 Chapter 3 Abstract Understanding of cardiac outflow tract (OFT) remodeling is essential to explain repositioning of the aorta and pulmonary orifice. In wild type embryos (E ) second heart field contribution (SHF) to the OFT was studied using expression patterns of Islet 1, Nkx2.5, MLC-2a, WT-1 and 3D-reconstructions. Abnormal remodeling was studied in VEGF120/120 embryos. In wild type, Islet 1 and Nkx2.5 positive myocardial precursors formed an asymmetric elongated column almost exclusively at the pulmonary side of the OFT up to the pulmonary orifice. In VEGF120/120 embryos the Nkx2.5 positive mesenchymal population was disorganized with a short extension along the pulmonary OFT. We postulate that normally the pulmonary trunk and orifice are pushed in a higher and more frontal position relative to the aortic orifice by asymmetric addition of SHF-myocardium. Deficient or disorganized right ventricular OFT expansion might explain cardiac malformations with abnormal position of the great arteries, such as double outlet right ventricle. 48
50 MORPHOGENESIS OF OUTFLOW TRACT ROTATION Introduction Morphogenesis of the outflow tract (OFT) is a complex and delicately orchestrated process. 1 3 During proper development of the OFT the great arteries achieve their definitive morphologic relationship, with the aorta situated in a central position right posterior of the pulmonary trunk. Maldevelopment of the OFT results in an abnormal position of the aorta and pulmonary trunk, observed in some forms of congenital heart disease, such as tetralogy of Fallot, transposition of the great arteries and double outlet right ventricle, often characterized by a side-to-side arrangement of the great vessels. The malpositioning of the great arteries and their respective orifices in these instances has major consequences, with early mortality without timely intervention. Knowledge of normal OFT development is mandatory as a first step in comprehension of the background of these malformations, as well as to aid in early (prenatal) diagnosis. During embryonic development the myocardium of the OFT is derived from the second heart field, also referred to as anterior or secondary heart field. 3 5 In this paper we refer to this population as the anterior heart field, which includes the coelomic wall covering the pericardial cavity in the OFT region of the heart. 3 This population of cells expresses amongst others Isl1, Tbx1 and Tbx3, GATA4, Nkx2.5 and WT-1. 3, 6 10 Expression of some of these genes, including Tbx3 and Isl1, is also observed in neural crest derived cells, and a recent study 9, 11 indicates a dual origin (myocardial and neural crest cells) of Isl1 derivatives in the heart. Anterior heart field cells contribute to the vascular wall of the great arteries and differentiate into a myocardial phenotype upon migration to the myocardial OFT. While at the beginning of development the myocardial OFT is short, orchestrated interaction between products of the aforementioned genes results in continuing addition of cells from the anterior heart field to the OFT, which lengthens in response. Although the exact time span of cellular addition from the anterior heart field to the myocardial OFT is unclear, addition until embryonic day (E) 11.5 in mouse was previously described. 12 Using immunofluorescent stainings and deposits of Indian ink in chick an increase of the myocardial part of the OFT up to stage HH24 has been demonstrated, 13 corresponding to E12.5 in mouse. The future aorta and pulmonary trunk and their respective orifices have a side-by-side position early in cardiac development. It is suggested that, besides lengthening, a rotational motion of the OFT is required for normal positioning of the aorta and pulmonary trunk and their respective orifices Multiple developmental signaling factors such as Pitx2c and FGF8/10, expressed in the anterior heart field in an asymmetrical fashion, have been reported as potential regulators of this rotational motion. 17 Several mutant mouse models with a phenotype that includes OFT malformations are currently available, including models with alterations in expression in vascular endothelial growth factor (VEGF) signaling. We have previously studied VEGF 120/120 mutant mouse embryos, that solely express the VEGF120 isoform, and found a high susceptibility of these 18, 19 embryos for OFT malformations, including tetralogy of Fallot and double outlet right ventricle. It was postulated that the anterior heart field-derived subpulmonary myocardium is highly sensi- 49
51 Chapter 3 tive for signaling for VEGF and Notch, which may underlie the observed malpositioning of the OFT vessels in the VEGF 120/120 mutants. However, a direct link with a contribution of the anterior heart field mesenchyme to the OFT has not been studied thus far. In general, studies in which the dynamics of OFT rotation are related to the expression of markers more typical for myocardial precursors in the anterior heart field during consecutive developmental stages, are currently lacking. Hence, it is unknown how and if the anterior heart field contribution to the myocardial OFT could be involved in OFT rotation and whether we are dealing with an already described shortening of the subaortic OFT 20, 21 or with a marked, relative lengthening of the subpulmonary OFT. The aim of the current study was to assess how the specific architecture of the anterior heart field could result in an asymmetric addition of OFT myocardium during cardiac development. We demonstrate asymmetry in contribution of myocardial precursors within the anterior heart field and postulate a basis for OFT rotation and for subsequent normal positioning of the aortic and pulmonary trunk orifice. Additionally we studied this phenomenon in VEGF120/120 embryos which have been described with double outlet right ventricle. Results Early myocardial outflow tract development At embryonic day (E) 9.5 and E10.5, the OFT was not septated yet and was positioned entirely above the primitive right ventricle. At E9.5, the OFT consisted of a myocardial part lined on the inside by cardiac jelly (in subsequent stages developing to endocardial cushion tissue), and of an aortic sac, connecting to the pharyngeal arch arteries (Figure 1). At this stage, the pro-epicardial organ at the venous pole of the heart could be distinguished and expressed WT-1. No epicardial covering of the primitive heart tube was present yet at this stage, with the exception of a few cells (Figure 1a), while the coelomic wall covering the OFT was also still negative for WT-1. Nkx2.5 expression was observed in the ventral endoderm of the foregut, in mesenchymal cells at the level of the OFT as well as in the coelomic wall being more pronounced at the left side of the OFT (Figure 1b). At stage E10.5, faint expression of MLC-2a was observed in the mesenchyme surrounding the aortic sac at the left side, where lining of the coelomic cavity joins the OFT myocardium (arrow in Figure 1c). Here MLC-2a expression intensified along the myocardial OFT towards the body of the right ventricle, indicating myocardial differentiation (Figure 1c). Expression of Isl1 was marked within the cardiac mesoderm and faded towards the differentiating myocardium of the OFT (Figure 1d). Nkx2.5 was strongly expressed in the anterior heart field, including the coelomic wall, and in the OFT myocardium at E10.5 (Figure 1f). The expression of both Isl1 and Nkx2.5 within the anterior heart field mesenchyme was observed as a central cluster of cells ventral to the foregut, extending preferentially on the left side of the aortic sac and surrounding the left 6th pharyngeal arch artery (Figure 1d, f), forming the region surrounding the pulmonary trunk and the future ductus 50
 9.5 (a,b) and E10.5 (c-f). a. Expression pattern of WT-1.")
52 MORPHOGENESIS OF OUTFLOW TRACT ROTATION Figure 1. Expression patterns of MLC-2a, Nkx2.5 Isl-1 and WT-1 in myocardial and mesenchymal regions of the developing outflow tract. Sections through the outflow tract of a wildtype mouse heart embryonic day (E) 9.5 (a,b) and E10.5 (c-f). a. Expression pattern of WT-1. Besides a few WT-1 expressing epicardial cells (arrowhead), epicardial covering of the heart is largely absent at this stage. Expression of WT-1 in the coelomic wall in the region of the outflow tract (OFT) is also still largely absent. b. Nkx2.5 expression can be observed in the endoderm (End), as well as in the coelomic wall bordering the OFT (arrowhead), more pronounced on the left side as compared to the right. c. The myocardial marker MLC-2a stains the myocardium of the OFT. The myocardium is lined on the inside by endocardial cushion tissue (EC). A more faint MLC- 2a staining is seen in the region of the second heart field mesoderm (arrow) being more prominent on the left side of the aortic sac (AoS). d. Expression of Isl 1 is prominent in the endoderm (End) and the anterior second heart field mesoderm (asterisk). It extends along the left lateral side of the AoS up to the myocardial OFT. Isl1 expression is also found in some of the myocardial cells (M) and the coelomic wall lining (Coe, arrowhead in d), being also more prominent on the left side as compared to the right side. The faint staining in the rightsided mesenchyme most likely represents vascular smooth muscle cells of the developing arterial wall. e. Expression pattern of WT-1. Note the expression in the region of the coelomic wall at the right side (arrowhead), as compared to the lack of expression in the coelomic epithelium at the left side (open arrow head). f. Nkx2.5 expression is markedly asymmetric (asterisk) and found more prominently of the left side of the OFT (future pulmonary trunk) and only sparsely on the right side (future aorta). Note the pronounced Nkx2.5 expression in the cells of the coelomic wall on the left side (arrowhead), as compared to the largely absent expression in the coelomic wall on the right side (open arrowhead). CJ: cardiac jelly, DAo: dorsal aorta, G: foregut, LA: left atrium, LV: left ventricle; RV: right ventricle; Bar: 100μm. 51

53 Chapter 3 52
54 MORPHOGENESIS OF OUTFLOW TRACT ROTATION arteriosus. On the right side in the cardiac mesoderm, in the region bordering the aortic wall, expression of Isl1 and Nkx2.5 was absent at this stage. Moreover, the faint MLC-2a staining was missing. A WT-1 positive coelomic wall now covered the Nkx2.5 negative mesoderm on the right (putative aortic) side. Lacking at this stage was a WT-1 positive coelomic wall covering the Nkx2.5 positive population on the left (putative pulmonary) side (Figure 1e). WT-1 positive epicardial cells, derived from the pro-epicardial organ, were found on the atrial and ventricular myocardium. Expression of myocardial progenitor markers during septation and before outflow tract rotation At E11.5, septation of the aorta and pulmonary trunk and orifice level had initiated by condensed mesenchyme (Figure 2a). A comparable expression pattern of Isl1, Nkx2.5, MLC-2a and WT-1 expression with stage E10.5 was observed. A mesenchymal column of Nkx2.5 positive Figure 2. Asymmetric distribution of myocardial progenitors at the level of the outflow tract. Sections and 3D-reconstructions of an E11.5 heart. a. MLC-2a is expressed in the myocardium. The aortic sac is now septated indicated by the presence of condensed mesenchyme (CM) in between the ascending aorta (AAo) and pulmonary trunk (Pu), which are still positioned side by side with the aorta somewhat more to the right as compared to the pulmonary trunk. b. Histological section demonstrating colour coding of 3D-reconstructions in d, e and h, i. Yellow: Nkx2.5 positive myocardial and vascular wall precursors. Light blue: endocardial cushion tissue merging with the CM of the aortopulmonary septum. Dark blue: Lumen of 6 th pharyngeal arch artery (future ductus arteriosus) and Pu. Light red: Lumen of AAo, dorsal aorta (DAo) and outflow tract. Dark red: vascular wall on the aortic side. Light brown: myocardium. (Also see the colour coding bar in the inferior part of the figure); c. Nkx2.5 expression is marked in the mesenchyme lining the pulmonary wall (arrow) and merging with the subpulmonary myocardium. This phenomenon is lacking on the aortic side. The faint staining in the right-sided mesenchyme most likely represents vascular smooth muscle cells of the developing arterial wall. d, e and h, i. show 3D-reconstructions. Black lines in d indicate the sections of levels depicted in a,c and f-g. d. left lateral view, showing the asymmetric expression of Nkx2.5 in the cardiac mesoderm (yellow) around the left branch of the 6 th pharyngeal arch artery (6 th l, blue) and extending in the pulmonary depression of the saddle shaped orifice level (indicated by the dotted lines in d, e, h and i). This is lacking on the aortic side of the orifice (e, right lateral view) f. Nkx2.5 stained section at the level of the outflow tract. Note that a column of Nkx2.5 positive myocardial precursor cells is present exclusively on the left side, where the Pu and right ventricular outflow tract are developing. g. Histological section demonstrating colour coding of 3D reconstructions in d, e, h and i, as related to the histological section shown in f. Yellow: Nkx2.5 positive myocardial and vascular wall precursors. Light blue: endocardial cushion tissue. Blue: left 6 th pharyngeal arch artery (6 th l, future ductus arteriosus), Red: vascular wall on the aortic side. (Also see the colour coding bar in the inferior part of the figure), h. 3D-reconstruction, anterior view i. 3D-reconstruction, posterior view. For explanations and colour coding: see above. j. WT-1 staining. Note the WT-1 expressing cells in the coelomic wall at the right (putative aortic) side (arrowhead), as compared to the low WT-1 expression on the left (putative pulmonary) side (open arrowhead). k. 3D reconstruction, left lateral view, and l. right later view, demonstrating the epicardial covering of the heart, indicated in brown. The remainder of the colour coding is as described above. Note the bare area at the left part of the outflow tract, that is uncovered by epicardium at this stage (open arrowhead). In contrast, the right side of the OFT is covered by epicardium (arrowhead). AVC: atrioventricular canal, LA: left atrium, LV: left ventricle, OFT: outflow tract, RA: right atrium, RV: right ventricle, 6 th r: right 6 th pharyngeal arch artery. Bar: 200μm. 53
55 Chapter 3 cells extended from the cardiac mesoderm in the anterior heart field to the left side of the OFT beneath the left 6th pharyngeal arch artery, where it connected to the subpulmonary myocardium (Figure 2a-c and f,g). 3D-reconstruction of the OFT myocardium, based on the expression pattern of MLC-2a, demonstrated an anterior and posterior cranial extension of myocardium resulting in a saddle-shaped distal myocardial OFT border (Figure 2d,e and h,i, dotted lines). The condensed mesenchyme of neural crest origin connects to the endocardial cushions at the top of the myocardial extensions. 1 Mesenchymal expression of Nkx2.5 (indicated in yellow in the 3D-reconstructions) and Isl1 could be observed as a central cluster of cells located in the pre-pharyngeal mesoderm dorsal to the level of the OFT (Figure 2i), extending in the indentation between the myocardial extensions on the left side where the pulmonary trunk connects to the subpulmonary myocardium (Figure 2d). This area of the coelomic wall lacked WT-1 (Figure 2j; 3D-reconstructions of epicardial covering are shown in Figure 2 k,l). Nkx2.5 expression was absent in the indentation between the myocardial extensions on the right side in the aortic orifice region (Figure 2e) where the coelomic wall is positive for WT-1 (Figure 2j; Figure 2k,l). Similar to E10.5, Isl1 expression in the cardiac precursor cells showed an asymmetric distribution favouring the pulmonary side (not shown). In the OFT myocardium the expression was lost whereas Nkx2.5 as well as MLC-2a was present in both the subaortic and subpulmonary myocardium. An interactive pdf file of a 3D-reconstruction of stage E11.5 is provided in online Supplemental File 2a). Positioning of the pulmonary trunk and aorta: The pulmonary push concept At E12.5, a distinct column of Nkx2.5 expressing mesenchymal cells was found exclusively within the indentation at the orifice level at the pulmonary side but not in the aortic region (Figure 3a-c, Supplemental file 1). From stage E12.5 onwards, the entire heart was covered by WT-1 expressing epicardial cells. In contrast to previous stages, the coelomic epithelium at the left side of the outflow tract now also expressed WT-1 and, similar to previous stages, WT-1 was expressed in the coelomic epithelium at the right side. From E12.5 to E14.5, the orifice of the future pulmonary trunk became progressively positioned in an anterior and rightward direction (Figure 3a, d, black dot and arrow). An interactive pdf file of a 3D-reconstruction of stage E12.5 is provided in online Supplemental File 2b). At E14.5, the pulmonary trunk and orifice reached their definitive position, which is anterior to the aortic orifice (Figure 3 d-f ). The mesenchymal column of Nkx2.5 expressing cells was no longer present at E13.5 and E14.5, indicating that myocardial precursors are not incorporated anymore from the anterior heart field into the OFT. Concurrent with the repositioning of the pulmonary orifice, the atrioventricular canal became positioned below the aortic orifice as it expanded rightward during development (Compare green dot and arrow in Figure 3b and e 54
 and short pulmonary trunk (Pu). Red: ascending aorta (AAo).")
56 MORPHOGENESIS OF OUTFLOW TRACT ROTATION Figure 3. Positional changes of the aorta and pulmonary artery during outflow tract development: The pulmonary push concept. a-c. 3D-reconstructions of stage E12.5. Colour coding: Dark blue: ductus arteriosus, (DA) and short pulmonary trunk (Pu). Red: ascending aorta (AAo). (Also see colour coding bar in the inferior part of the figure), a. Left lateral view. b. Cranial view. c. Right lateral view. The Nkx2.5 expressing mesenchymal cells (yellow) can be seen inserted in the pulmonary side of the indentation of the saddle shaped orifice (a, b) whereas this is lacking on the aortic side (b, c) where the endocardial cushions and condensed mesenchyme are visible (indicated in light blue). d-f. 3D-reconstructions of stage E14.5. Colourcoding: Dark blue: pulmonary trunk (Pu) and ductus arteriosus (DA), connecting distally to the descending aorta (DAo). d. left lateral view. e. cranial view. f. right lateral view. Black dot and arrow (a, d) denote the cranio-anterior positional change of the pulmonary artery orifice from E12.5 to E14.5. The green dot (b, c and e, f) denotes the pronounced expansion of the atrio-ventricular canal in a rightward direction parallel to the OFT towards the aortic orifice. LV: left ventricle, RV: right ventricle. Bar: 100μm. (superior views) and c and f (right lateral views)). An interactive pdf file of a 3D-reconstruction of stage E14.5 is provided in online Supplemental File 2c). Abnormal development: Expression of myocardial progenitor markers in the VEGF120/120 model To test the hypothesis of the pulmonary push concept, development of the OFT was studied in VEGF120/120 mouse embryos of stage E10.5. For the current study, focus was directed specifically at the Nkx2.5 and Isl-1 positive myocardial precursors at the OFT of the heart, 55
, and an elongated column of Nkx2.")
57 Chapter 3 as compared to results obtained in wild type embryos. In wild type embryos at stage E10.5, a well-organized Nkx2.5 positive, Isl-1 positive cluster of cells was observed in the cardiac mesenchyme (Figure 4a-c, asterisk in Figure 4b), and an elongated column of Nkx2.5 positive cells was observed extending along the left side of the OFT (dotted area in Figure 4b). In the stage E10.5 VEGF120/120 embryos a large cluster of cells was also observed in the cardiac mesenchyme (asterisk in Figure 4e), however, in contrast to wild type, we observed an abnormal Figure 4. Expression of myocardial progenitor markers in the VEGF120/120 model. Results in E10.5 in wildtype (a-c) and VEGF 120/120 (e-g) embryos. a-c: Three subsequent sections, stained for MLC-2a (a), Nkx2.5 (b) and Isl1 (c) are shown. In wild type embryos, a group of Isl1/Nkx2.5 positive cells are located behind in the heart in the pre-pharyngeal mesoderm (asterisk in b). An elongated column of Nkx2.5 (b) Isl1 (c) positive cells can be observed extending along the left side of the outflow tract (OFT) (indicated by the dotted line in b). Upon differentiation, cells increasingly express the myocardial marker Mlc2a (a). d-f: Three subsequent sections in VEGF120/120 embryos, stained for MLC-2a (d), Nkx2.5 (e) and Isl1 (f) are shown. In VEGF 120/120 embryos, the cluster of Isl1 (g) and Nkx2.5 (f) positive precursors (asterisk in f) shows an abnormal organisation. The column of cells extending on the left side of the OFT is only very short (compared length of the dotted lines in b and f). Abbreviations: AoS; aortic sac, End: endoderm, LA: left atrium, G: foregut, 6 th : sixth pharyngeal arch artery. Bar: 100μm. 56
58 MORPHOGENESIS OF OUTFLOW TRACT ROTATION organisation of this Nkx2.5 positive anterior heart field mesoderm in front of the pharynx. The extension of this population along the pulmonary side of the OFT up to the pulmonary myocardium was very short with only a small area facing the coelomic cavity (Figure 4d-f, compare the length of the dotted lines in Figure 4b and 4e). Discussion OFT remodeling is an essential part of heart development. Normal separation and positioning of the great arteries of the OFT is necessary for the heart to sustain its function as a central pump coordinating the blood flow through the systemic and pulmonary circulations. 22 Congenital OFT malformations may severely compromise normal physiology, resulting in hemodynamic overload, cyanosis and early death. 23 Knowledge of the developmental processes resulting in proper OFT formation and remodeling, as well as the pivotal cells or cell groups involved, is essential to comprehend when and why malformations, resulting in congenital heart disease, occur. In recent years, the relevance of the contribution of cells derived from the second heart field has been attested, 7, 24, 25 although the exact mechanism of OFT remodeling, including the final positioning of the aorta and the pulmonary trunk and their orifices, is unclear. It has been shown that the anterior part of the second heart field plays a crucial role in normal OFT development together with neural crest and epicardium During cardiovascular development, cells from the three above-described populations are recruited to the linear heart tube via both the arterial and the venous pole from E9.5 onwards It has been demonstrated previously that the myocardial part of the OFT comprising both the subaortic and subpulmonary myocardium, is derived from the second heart field. 7 This myocardium has been shown to have a common lineage relationship to the right-and left sided head muscles, respectively. 32 We have, based on results in the VEGF120/120 model, previously postulated that the second heart field-derived subpulmonary myocardium may be highly sensitive for signaling of factors like VEGF and Notch, which may underlie the observed malpositioning of the OFT vessels in the VEGF120/120 mutants, but did not show a direct link with a contribution of the second heart field mesenchyme to the OFT in this study. 19 The pulmonary trunk originates from the posterior left side of the aortic sac, whereas the putative aorta is originally positioned on the right side. 1, 28 After OFT development is completed, however, the pulmonary trunk has obtained a right anterior position. A dynamic process is required during cardiac development resulting in a rotational movement of the pulmonary trunk and orifice around the aorta. A mechanism of cell death, predominantly present in the subaortic myocardium resulting in a shortening of the subaortic OFT, has been proposed as the mechanism for proper 57
59 Chapter 3 formation of the ventriculo-arterial connections. 20, 21, 33 Cell death is a well known mechanism in heart development and has been described to occur at the level of the OFT. 34, 35 However, a mechanism of asymmetric active shortening of the OFT by cell death alone is unlikely to explain the complex positioning of the OFT and does not take into account an concomitant asymmetrical gaining of length of the subpulmonary myocardium, while the subaortic myocardium remains relatively short from the onset. 36 It was previously reported that asymmetrical expression of Fgf 8/10, Pitx2c and possibly Tbx1 6, 37 within the anterior heart field are involved in the induction of asymmetrical OFT growth. Experimental knock-out of these genes resulted in the association with a large variety of fundamental defects in OFT development. 38 Especially relevant seems to be the co-expression Tbx1 with Pitx2, an important gene in right-left signaling, in the pharyngeal mesoderm of the OFT. Crossing of heterozygous Tbx1 and Pitx2 mice results in cardiac anomalies including double outlet right ventricle. 37 Experiments using right-and left sided second heart field labeling experiments in the chick OFT indicate contributions of second heart field precursors to distinct lateralized regions of the OFT. 39 It was unclear whether other known markers of myocardial precursors within the anterior heart field demonstrate a similar asymmetric expression pattern that could explain the above-described dynamics of OFT remodeling. We have now shown that it is also applicable to Nkx2.5 and Isl1 expression. It is remarkable that the Nkx2.5 and Isl1 positive area of the anterior heart field was the last part of the heart to be covered by a WT-1 expressing coelomic epithelium i.e. the epicardium. On the aortic side, that is supposed to originate from the right sided pre-pharyngeal mesoderm (current study, and 39, 40 ), the disappearance of the Nkx2.5 positive population at day 9.5 was followed by the start of expression of WT-1 in the coelomic wall. A possible interaction between Nkx2.5 and WT1 needs further study. Our studies suggest that lengthening of the subpulmonary myocardium of the OFT is active until day 12.5 which is at least one day longer than proposed in literature 12, 41 but in line with studies in chick that have indicated contributions to the OFT up to HH24 (correlating with mouse day12.5), respectively. 13 The aim of the current study was to assess whether anterior heart field architecture could provide clues relevant for normal positioning of the aorta orifice and pulmonary trunk during mammalian heart development. The main finding of the present study, based on 3Dreconstructions of consecutive developmental stages, was that myocardial precursor cells were asymmetrically positioned in the OFT during development, as they were distinctively observed at the pulmonary side, whereas they were almost absent at the aortic side. The current study shows for the first time that continued addition from the Nkx2.5 expressing mesenchymal myocardial precursors below the left 6 th pharyngeal arch artery may push the future pulmonary artery orifice in an anterior and rightward direction. In addition, we have shown that this addition was disorganized and the extension towards the left side of the OFT shorter than in wildtype in the VEGF120/120 model, that has a phe- 58
60 MORPHOGENESIS OF OUTFLOW TRACT ROTATION notype in which OFT malformations are predominant. 19 It was recently indicated that the myocardium at the base of the pulmonary trunk and the myocardium at the base of the aorta originate from distinct developmental portions of second heart field derived cells. 40 Clonal studies showed a larger number of cell clones in the subpulmonary region, indicative for a higher proliferative rate, whereas in the subaortic region clones were very small. 40 The subpulmonary myocardium remained in a posterior position in the Pitx2c knock-out mouse that presents with OFT malformations such as transposition of the great arteries and double outlet right ventricle. 14 We postulate that the dominant left-sided expression of Pitx2c induces the expression of Nkx2.5 within the anterior heart field, which might be disturbed in Pitx2c knock-out mouse embryos. In our study of the VEGF120/120 embryo we could discern the malpositioning of the Nkx2.5 positive mesenchymal cells at the pulmonary side of the OFT in line with Bajolle et al. The disorganization of the Nkx2.5 positive SHF mesenchyme in front of the pharynx is indicative of an abnormal differentiation of the SHF. The small area of Nkx2.5 positive myocardial precursors covering the pulmonary side of the OFT could underlie the observed tetralogy of Fallot and double outlet right ventricle in the VEGF120/120 hearts 19 in which subpulmonary myocardium is insufficiently added. In transposition of the great arteries, the arterial orifices are positioned in almost one plane 36, supporting the fact that addition of myocardium to the right ventricular OFT has either not taken place or was deficient. Similar observations have been made for mouse hearts with double outlet right ventricle with a marked shortening of the right ventricular OFT. 42, 43 To date specific patterns in the second heart field for Nkx2.5 and Isl1 have not been reported. Results in the VEGF120/120 model in the current study support the postulated mechanism of a deficient and disorganized addition of myocardial precursors to the pulmonary side of the OFT. An asymmetric contribution of anterior heart-field derived myocardium around and specifically below the left 6 th pharyngeal arch artery during crucial stages of OFT development, provides an explanation for the dynamic process that results in positioning of the pulmonary artery orifice in its normal left anterior location. It must be questioned whether a true rotational motion, based on spiraling outflow tract ridges, occurs. The latter explanation has dominated the positional remodeling for several decades, and an abnormal torsion was considered the underlying mechanism for OFT tract abnormalities as observed in transposition of the great arteries. 15, 16, 44, 45 This explanation for rotation of the outlet however has also been the subject of controversy over the past decades, and several authors have indicated that no such rotation occurs during normal development. 1, Given the second heart field contributions to OFT remodeling, new concepts for related abnormalities occur. Obviously, proper positioning of the great arteries needs to occur in order to achieve the normal morphological relation of the aorta and pulmonary trunk. Results of our study support the occurrence of rotation. We propose that, rather than a mechanism based on spiraling of the endocardial OFT cushions, an asymmetrical lengthening of the right ventricular OFT 59
61 Chapter 3 causes the pulmonary trunk to be pushed towards its definitive position in front of the aorta, which is observed as a rotation. Conclusion We conclude that the addition of Nkx2.5 positive myocardial precursors from the anterior heart field occurs during normal development predominantly below the left branch of the 6th pharyngeal arch artery. We postulate that this results in a movement without spiralization of the OFT in which, due to the continued addition of right-sided myocardium, the pulmonary trunk orifice is pushed in a rightward and anterior direction, which presents a new explanation for the rotation of the pulmonary orifice and trunk. This mechanism is referred to as pulmonary push, which results in a rotation of the pulmonary orifice to an anterior position. As the term rotation has been intrinsically used in many ways and for many OFT structures, we prefer the use of pulmonary push to describe the mechanism of OFT positioning. Deficient or disorganized positioning of the Nkx2.5 positive precursors, as was observed in the VEGF120/120 mutant, might explain cardiac malformations with side-by-side position of the great arteries. Experimental procedures Embryonic material and immunohistochemical procedures The handling of all animals and embryos was according to the Guide for Care and Use of Laboratory Animals, as published by the NIH. Wildtype mouse embryos were obtained from the CLB-Swiss strain. In addition to studies of wildtype embryos and to test the hypothesis of the pulmonary push concept, VEGF120/+ mice were crossed to obtain VEGF120/120 embryos and VEGF+/+ wild type littermates. The day the vaginal plug was detected, was designated embryonic day (E) 0.5. Pregnant female mice were sacrificed on consecutive days from E9.5 onward up until E14.5 for wildtype mice and, per day, three embryos were harvested for the study. For VEGF120/120 mice, stage E10.5 was studied. For further immunohistochemical staining, all embryos were embedded in paraffin after fixation in 4% paraformaldehyde in phosphate buffered saline (0.1 M, ph 7.2) and subsequent dehydration. Embryos were sectioned transversely to the body axis (5μm). Due to the position of the heart in the thorax, the level of the outflow tract was therefore positioned in a more frontal plane. Sections were serially mounted on glass slides. Immunohistochemical staining was performed with antibodies against the myocardial marker MLC-2a (1/6000, kindly provided by S.W. Kubalak, Charleston, SC, United States); Nkx 2.5 (1/4000, Santa Cruz Biotechnology Inc., CA, United 60
62 MORPHOGENESIS OF OUTFLOW TRACT ROTATION States, SC-8697), expressed in atrial and ventricular and outflow tract myocardium, as well as in the mesenchyme of the second heart field; the second heart field marker Islet 1 (Isl1) (1/400, mouse monoclonal antibody, clone 39.4D5, Developmental Studies Hybridoma Bank) and Wilms Tumor 1 (WT-1) (1/1000, Santa Cruz Biotechnology Inc., CA, United States, SC-192), to show the coelomic wall covering and the pro-epicardial organ derived epicardium. The slides were first incubated for 45 min using ABC-reagent (Vector Laboratories, Burlingame, United States PK 6100), and then with 400 μg/ml 3-3 di-aminobenzidin tetrahydrochloride (DAB, Sigma-Aldrich, St Louis, United States, D5637) dissolved in trismaleate buffer ph 7.6 to which 20 μl H 2 O 2 was added. The latter incubation was done 5 min for MLC-2a and 10 min for Nkx 2.5, Isl1 and WT-1. Furthermore, counterstaining was done using 0.1% hematoxylin (Merck, Darmstadt, Germany) for 5 sec, and the slides were subsequently rinsed with tap water for 10 min. Finally, slides were dehydrated and mounted with Entellan (Merck, Darmstadt, Germany). Three-dimensional reconstruction To describe the dynamics of OFT development within a spatial context, three-dimensional reconstructions were made from E9.5 to ED14.5 embryos. Micrographs of serial sections were processed using the AMIRA software package (Template Graphics Software, San Diego, CA) as described previously. 49 First, the myocardium was reconstructed using the expression pattern of MLC-2a, after which the expression of Isl1, WT-1 and Nkx2.5, was superimposed to depict myocardial progenitors within the anterior heart field. Isl-1 expression was used to demarcate the anterior heart field, Nkx2.5 was used to identify precursors of OFT myocardium, 3, 12 and WT-1 to show which parts of the outflow tract were covered with epicardium. Acknowledgements We thank Ron Slagter for designing the animation of outflow tract remodelling. 61
63 Chapter 3 References 1. Gittenberger-de Groot AC, Bartelings MM, et al. Basics of cardiac development for the understanding of congenital heart malformations. Pediatr Res 2005; 57: Yutzey KE, Kirby ML. Wherefore heart thou? Embryonic origins of cardiogenic mesoderm. Dev Dyn 2002; 223: Waldo K, Kumiski DH, et al. Conotruncal myocardium arises from a secondary heart field. Development 2001; 128: Kelly RG, Brown NA, et al. The arterial pole of the mouse heart forms from Fgf10-expressing cells in pharyngeal mesoderm. Dev Cell 2001; 1: Mjaatvedt CH, Nakaoka T, et al. The outflow tract of the heart is recruited from a novel heartforming field. Dev Biol 2001; 238: Brown CB, Wenning JM, et al. Cre-mediated excision of Fgf8 in the Tbx1 expression domain reveals a critical role for Fgf8 in cardiovascular development in the mouse. Dev Biol 2004; 267: Cai CL, Liang X, et al. Isl1 identifies a cardiac progenitor population that proliferates prior to differentiation and contributes a majority of cells to the heart. Dev Cell 2003; 5: Kelly RG, Papaioannou VE. Visualization of outflow tract development in the absence of Tbx1 using an FgF10 enhancer trap transgene. Dev Dyn 2007; 236: Mesbah K, Harrelson Z, et al. Tbx3 is required for outflow tract development. Circ Res 2008; 103: Mesbah K, Rana MS, et al. Identification of a Tbx1/Tbx2/Tbx3 genetic pathway governing pharyngeal and arterial pole morphogenesis. Hum Mol Genet 2012; 21: Engleka KA, Manderfield LJ, et al. Islet1 derivatives in the heart are of both neural crest and second heart field origin. Circ Res 2012; 110: Xu H, Morishima M, et al. Tbx1 has a dual role in the morphogenesis of the cardiac outflow tract. Development 2004; 131: Rana MS, Horsten NC, et al. Trabeculated right ventricular free wall in the chicken heart forms by ventricularization of the myocardium initially forming the outflow tract. Circ Res 2007; 100: Bajolle F, Zaffran S, et al. Rotation of the myocardial wall of the outflow tract is implicated in the normal positioning of the great arteries. Circ Res 2006; 98: Thompson RP, Fitzharris TP. Morphogenesis of the truncus arteriosus of the chick embryo heart: tissue reorganization during septation. Am J Anat 1979; 156: Thompson RP, Abercrombie VANT, et al. Morphogenesis of the truncus arteriosus in the chick embryo heart: Movements of autoradiographic tattoos during septation. Anat Rec 1987; 218: Ai D, Liu W, et al. Pitx2 regulates cardiac left-right asymmetry by patterning second cardiac lineage-derived myocardium. Dev Biol 2006; 296: Stalmans I, Lambrechts D, et al. VEGF: a modifier of the del22q11 (DiGeorge) syndrome? Nat Med 2003; 9: Van Den Akker NM, Molin DG, et al. Tetralogy of fallot and alterations in vascular endothelial growth factor-a signaling and notch signaling in mouse embryos solely expressing the VEGF120 isoform. Circ Res 2007; 100: Watanabe M, Choudhry A, et al. Developmental remodeling and shortening of the cardiac outflow tract involves myocyte programmed cell death. Development 1998; 125: Watanabe M, Jafri A, et al. Apoptosis is required for the proper formation of the ventriculo-arterial connections. Dev Biol 2001; 240:
64 MORPHOGENESIS OF OUTFLOW TRACT ROTATION 22. Bartman T, Hove J. Mechanics and function in heart morphogenesis. Dev Dyn 2005; 233: Bashore TM. Adult congenital heart disease: right ventricular outflow tract lesions. Circulation 2007; 115: Snarr BS, Kern CB, et al. Origin and fate of cardiac mesenchyme. Dev Dyn 2008; 237: Vincent SD, Buckingham ME. How to make a heart: the origin and regulation of cardiac progenitor cells. Curr Top Dev Biol 2010; 90: Kirby ML, Turnage KL, et al. Characterization of conotruncal malformations following ablation of cardiac neural crest. Anat Rec 1985; 213: Gittenberger-de Groot AC, Vrancken Peeters MP, et al. Epicardial outgrowth inhibition leads to compensatory mesothelial outflow tract collar and abnormal cardiac septation and coronary formation. Circ Res 2000; 87: Waldo KL, Hutson MR, et al. Secondary heart field contributes myocardium and smooth muscle to the arterial pole of the developing heart. Dev Biol 2005; 281: Kelly RG, Buckingham ME. The anterior heart-forming field: voyage to the arterial pole of the heart. Trends Genet 2002; 18: Perez-Pomares JM, Phelps A, et al. Epicardial-like cells on the distal arterial end of the cardiac outflow tract do not derive from the proepicardium but are derivatives of the cephalic pericardium. Dev Dyn 2003; 227: Poelmann RE, Gittenberger-de Groot AC. A subpopulation of apoptosis-prone cardiac neural crest cells targets to the venous pole: multiple functions in heart development? Dev Biol 1999; 207: Lescroart F, Kelly RG, et al. Clonal analysis reveals common lineage relationships between head muscles and second heart field derivatives in the mouse embryo. Development 2010; 137: Schaefer KS, Doughman YQ, et al. Dynamic patterns of apoptosis in the developing chicken heart. Dev Dyn 2004; 229: Poelmann RE, Gittenberger-de Groot AC. Apoptosis as an instrument in cardiovascular development. Birth Defects Res C Embryo Today 2005; 75: Vuillemin M, Pexieder T. Normal stages of cardiac organogenesis in the mouse; II. Development of the internal relief of the heart. Am J Anat 1989; 184: Bartelings MM, Gittenberger-de Groot AC. Morphogenetic considerations on congenital malformations of the outflow tract. Part 2: complete transposition of the great arteries and double outlet right ventricle. Int J Cardiol 1991; 33: Nowotschin S, Liao J, et al. Tbx1 affects asymmetric cardiac morphogenesis by regulating Pitx2 in the secondary heart field. Development 2006; 133: Liu C, Liu W, et al. Pitx2c patterns anterior myocardium and aortic arch vessels and is required for local cell movement into atrioventricular cushions. Development 2002; 129: Takahashi M, Terasako Y, et al. Myocardial progenitors in the pharyngeal regions migrate to distinct conotruncal regions. Dev Dyn 2012; 241: Bajolle F, Zaffran S, et al. Myocardium at the base of the aorta and pulmonary trunk is prefigured in the outflow tract of the heart and in subdomains of the second heart field. Dev Biol 2008; 313: Viragh S, Challice CE. Origin and differentiation of cardiac muscle cells in the mouse. J Ultrastruct Res 1973; 42: Bartram U, Molin DGM, et al. Double-outlet right ventricle and overriding tricuspid valve reflect disturbances of looping, myocardialization, endocardial cushion differentiation, and apoptosis in TGFß2-knockout mice. Circulation 2001; 103:
65 Chapter Molin DGM, Roest PA, et al. Disturbed morphogenesis of cardiac outflow tract and increased rate of aortic arch anomalies in the offspring of diabetic rats. Birth Defects Res A Clin Mol Teratol 2004; 70: Chuaqui B, Bersch W. The formal genesis of the transposition of the great arteries. Virchows Arch 1973; 358: Lomonico MP, Bostrom MPG, et al. Arrested rotation of the outflow tract may explain tetralogy of Fallot and transposition of the great arteries. Pediatr Pathol 1988; 8: Steding G, Seidl W. Contribution to the development of the heart. Part 1: Normal development. Thorac Cardiovasc Surg 1980; 28: Steding G, Seidl W. Contribution to the development of the heart. Part II: Morphogenesis of congenital heart disease. Thorac Cardiovasc Surg 1981; 29: De la Cruz MV, Da Rocha JP. An ontogenetic theory for the explanation of congenital malformations involving the truncus and conus. Am Heart J 1956; 51: Jongbloed MRM, Schalij MJ, et al. Embryonic conduction tissue: a spatial correlation with adult arrhythmogenic areas? Transgenic CCS/lacZ expression in the cardiac conduction system of murine embryos. J Cardiovasc Electrophysiol 2004; 15:
 within the heart and anterior heart field at ED 12.5. This column is rendered transparent during part of the animation to demonstrate its relation to the aorta (red) and pulmonary trunk (dark blue).")
66 MORPHOGENESIS OF OUTFLOW TRACT ROTATION SUPPLEMENTAL Files Supplemental file 1 Animated 3D-reconstruction demonstrating the column of Nkx2.5 expressing cells (bright yellow) within the heart and anterior heart field at ED This column is rendered transparent during part of the animation to demonstrate its relation to the aorta (red) and pulmonary trunk (dark blue). The outflow tract and right ventricle are depicted in light-yellow, whereas the left ventricle is depicted in grey. Other colour coding: Light blue: endocardial cushion tissue 65
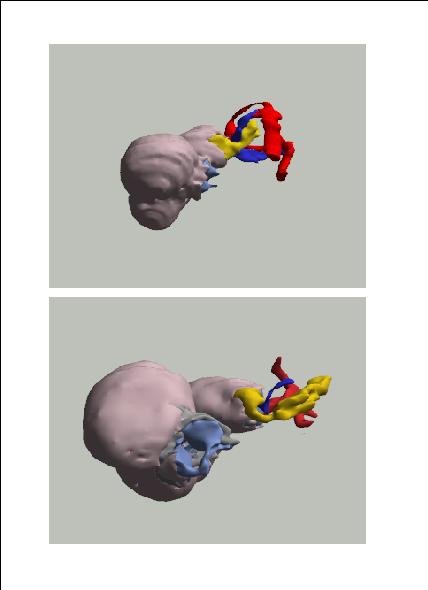
67
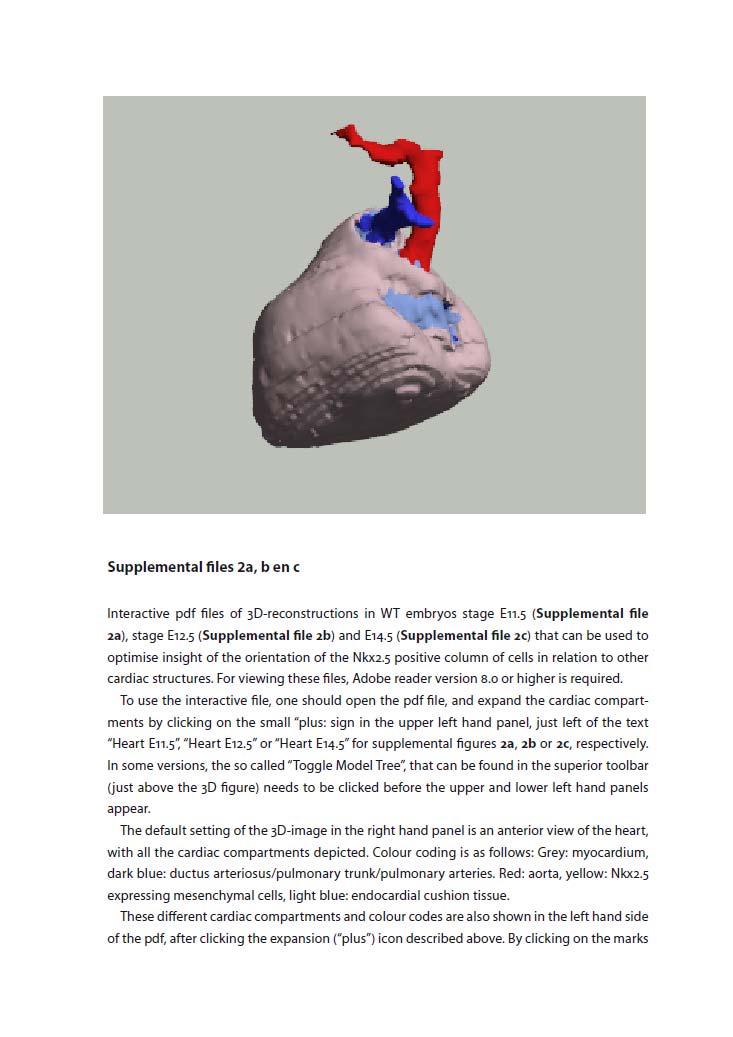
68
69 (v s) one can choose to eliminate different compartment from the figure. Also, by right clicking on the text describing the different compartments, one can chose for the option transparent in order to make the compartment of choice transparent to visualize the Nkx2.5 positive column of cells more clearly. In the lower left hand panel, other views are depicted, that will appear when clicking on them. These other views include a left lateral view, right lateral view, dorsal view and a superior view. One can also manually choose the preferred view by moving the mouse over the 3D-animation.
70
71 PART II Noninvasive RIGHT VENTRICULAR IMAGING
72
73
74 Chapter 4 Tricuspid Valve Surgery in Adults with a Dysfunctional Systemic Right Ventricle: Repair or Replace? Roderick WC Scherptong Hubert W Vliegen Michiel M Winter Eduard R Holman Barbara JM Mulder Ernst E van der Wall Mark G Hazekamp Circulation Mar 24;119(11):
75 Chapter 4 Abstract Background In patients with a right ventricle (RV) in systemic position, tricuspid valve surgery for regurgitation beyond adolescence is subject of debate. The aim of this study was to evaluate complications, survival and benefit of tricuspid surgery in adult patients with an atrial-level correction for transposition of the great arteries or congenitally corrected transposition of the great arteries. Methods & Results All adult patients (n=16; 7 male, 9 female; age: 35 ± 11 yrs) who underwent tricuspid valvuloplasty (TVP, n=8) or replacement (TVR, n=8) in the period were included. Complications and survival were analyzed and post-operative changes in RV function and functional class were evaluated. Tricuspid regurgitation was graded 1 to 4 according to the severity, right ventricular dysfunction was graded 1 to 4 (1; no dysfunction 4; severe dysfunction) and functional status was determined according to NYHA class. Although complications occurred in eleven patients, all could be managed adequately. Three patients died 109, 180 and 659 days after surgery respectively, the first patient after TVR and the latter two after TVP. Overall, tricuspid valve function improved (form grade 3.1 ± 0.8 to 0.9 ± 1.0; P = 0.001), functional class improved (from 2.7 ± 0.6 to 2.1 ± 0.8; P = 0.007), whereas RV function remained unchanged. After TVP, however, recurrent moderate TV regurgitation was frequently observed in three patients (37%). Conclusions Mortality is low after tricuspid surgery in adult patients with mild to moderate RV dysfunction. In general, tricuspid valve function and functional class improve significantly after operation, whereas systemic RV function is preserved. TVP however, is associated with a high recurrence rate of regurgitation. 74
76 TRICUSPID VALVE SURGERY: REPAIR OR REPLACE? Introduction Patients with congenitally corrected transposition of the great arteries (cctga) and patients with atrially corrected transposition of the great arteries (actga), have a morphologically right ventricle (RV) that sustains the systemic circulation. 1 3 In these patients, regurgitation of the systemic atrioventricular valve, the tricuspid valve (TV), is a common finding. When TV regurgitation becomes severe, it is associated with RV failure and decreased survival. 4 In adolescent or younger patients, it can be opted to treat this surgically by retraining the left ventricle by means of pulmonary artery banding and subsequent relocation of the left ventricle into systemic position. In adults beyond the second decade of life however, results of these operations are still mainly negative. 5 7 Another surgical option, which is replacement or repair of the TV, is controversial, as data demonstrating favorable survival after these operations is currently insufficient. The only large study so far, in which beneficial effects of TV replacement are demonstrated, is the study by van Son et al. published in 1995, which reports the follow-up of 40 patients with cctga who were operated for TV regurgitation. 8 In other reports, attempts to repair the TV in patients with cctga are described as largely unsuccessful and in these reports consideration for the above described double switch procedure is advocated. 9, 10 Study results of TV operations in patients with actga are even scarcer than in cctga. The general opinion in literature is that the role of TV surgery, as a treatment option for patients with actga and impending RV failure, should be limited. 11 However, studies that focus on systematic evaluation of TV surgery in adult patients with actga and RV dysfunction are lacking Therefore, the aim of this study was to evaluate complications, survival and benefit of tricuspid valvuloplasty (TVP) or replacement (TVR) as the first option in patients with important tricuspid regurgitation and a dysfunctional right ventricle in systemic position. Methods Patient population All patients, either referred form other medical centers or from the outpatient clinic of our center with cctga or actga, who underwent TVP or TVR for tricuspid regurgitation between 1998 and 2008, were included in this study. Patients were considered for surgery when the combination of important tricuspid regurgitation (grade 3 or 4) and mild to moderate systemic RV dysfunction was present on echocardiographic evaluation. RV function had to be sufficiently preserved, as tricuspid surgery in later stages of RV dysfunction had poor outcome in previous studies. 8, 16 Furthermore, only those patients with functional impairment who were in New York Heart Association (NYHA) class 2 or 3 were regarded suitable for elective 75
77 Chapter 4 tricuspid surgery. Cardiac function and anatomy was evaluated pre-operatively with cardiac magnetic resonance imaging or multi slice computed tomography if a recent evaluation was not available. These evaluations were also used to assess whether concomitant procedures, including baffle and/or conduit revisions, were necessary. Study protocol Complications related to the procedure, survival and operation benefit in terms of TV competence, RV function and NYHA class were evaluated. First, primary diagnosis (cctga or actga), previous operations and pre-operative TV competence, RV function and NYHA class were noted. Secondly, the type of procedure (TVP or TVR) and concomitant procedures were documented. Thirdly, we observed post-operative complications and finally, to assess operation benefit, we analyzed post-operative changes in RV function, tricuspid valve competence and functional class during follow-up. Complications and survival Post-operative complications were categorized into: arrhythmia, low cardiac output (defined as persistently low arterial pressures in the post-operative period, not responding to plasma volume expansion), renal insufficiency, infection and rethoracotomy. Maximum survival was defined as the period between the first day post-operative until the last available follow-up date or until the occurrence of the composite endpoint death or recurrent severe tricuspid regurgitation. Differences in survival were compared between the TVP and TVR procedure. Operation benefit Echocardiography was used for the assessment of RV and TV function. For the purpose of this study, the echocardiograms, made pre-operatively and during periodical follow-up after surgery, were reviewed for RV and TV function. The echocardiographic evaluations were done three weeks, three months and ten months after operation. Tricuspid regurgitation was graded 1 to 4 according to the severity. RV function was analyzed semi-quantitatively 17, 18 and classified as either normal 1, mildly depressed 2, depressed 3 or severely depressed 4. Furthermore, patient functional status was assessed pre- and post-operatively according to NYHA class. 76
78 TRICUSPID VALVE SURGERY: REPAIR OR REPLACE? Operative technique All patients were operated by the same surgeon, through median (re)sternotomy using total cardiopulmonary bypass and mild-to-moderate hypothermia that was combined with antegrade perfusion of a crystalloid cardioplegic solution. The TV was approached via either the right atrium (actga) or via the atrial septum and left atrium (cctga). Initially, TVP was intended in all patients. For this type of surgery, a classical Carpentier-Edwards or the newer Edwards MC3 annuloplasty ring (Edwards LifeSciences Inc, Irvine, CA, USA) was used. However, when pre- or intraoperatively, either the quality of the TV leaflets was regarded insufficient (eg. dysplastic tricuspid leaflets), or when significant leaflet tethering was present, it was decided to replace rather than repair the TV. Moreover, when during the operation the initial TVP did not result in reduction of regurgitation, the TV was also replaced within the same operation. For this procedure, a CarboMedics bileaflet mechanical prosthesis (Sulzer CarboMedics Inc, Austin, Tx, USA), a St. Jude Medical mechanical prosthesis (St. Jude Medical Inc, St. Paul, MN, USA) or a Medtronic Mosaic porcine bioprosthesis (Medtronic Inc, Minneapolis, Minn, USA) was used. Statistical analysis SPSS (12.0.1, SPSS Inc, Chicago, IL, USA) was used for statistical analysis. Data are presented as mean ± standard deviation (SD), unless mentioned otherwise. Due to the small number of patients, the Friedman test and the Mann-Whitney U-test were used to compare pre- and postoperative TV function, RV function and functional class. Kaplan-Meier curves were drawn and the logrank test was used to compare the difference between the TVP and TVR procedure. P-values <0.05 were considered statistically significant. The authors had full access to and take full responsibility for the integrity of the data. All authors have read and agree to the manuscript as written. Results Sixteen patients were operated, nine with cctga and seven with actga. Characteristics of these patients are summarized in Table 1. Pre-operatively, grade 3.1 ± 0.8 TV regurgitation was observed. Most patients exhibited mildly depressed RV function (n=12) and pre-operative functional class according to NYHA was 2.7 ± 0.6. An overview of how patients were operated is depicted in figure 1. In 14 patients the mechanism of tricuspid regurgitation was regarded malcoaptation of the tricuspid leaflets. This was either due to annular dilatation with intact leaflets (n=9) or due to structural abnormalities of the TV other than Ebstein(-like) malforma- 77
79 Chapter 4 tions (n=5). In eleven patients, TVP was initially attempted. In three cases, this procedure did not result in improved TV competence, and it was decided to do TVR in the same operation. In four patients the TV leaflets were Ebstein-like or had important other malformations and in one patient the tricuspid annulus was too severely dilated to perform TVP, therefore TVR was done directly in these cases. In nine patients, concomitant procedures, mainly conduit or baffle revisions (n=6), were performed. Complications and survival In Table 2, all major, post-operative complications are summarized. One patient, operated acutely after explantation of an infected ICD, died 109 days after surgery. This patient suffered from a multitude of complications and eventually died from therapy-refractory sepsis. Arrhythmia was the most frequently encountered short-term complication, occurring in eight patients. In one patient, recurrent ventricular fibrillation was observed post-operatively which required ICD implantation, five patients suffered from supraventricular tachycardia which was treated with cardioversion in three and with medication in two. One patient suffered from sinus arrest and one patient had AV block, both treated with pacemaker insertion. Another complication that occurred frequently was low cardiac output caused by ventricular Table 1. Patient characteristics. cctga (n = 9) actga (n = 7) Age (yrs) 34.2 ± ± 5.9 Previous operations (n) VSD closure 4 ASD closure 1 TVP 2 PVR 2 PA banding 1 Mustard 5 Senning 2 Current operation (n) TVP 3 5 TVR 6 2 Concomitant procedures (n) Conduit/baffle revision 2 4 Mini MAZE procedure 3 VSD closure 1 PA banding 1 actga: atrial correction for transposition of the great arteries; ASD: atrial septal defect; cctga: congenitally corrected transposition of the great arteries; PA: pulmonary artery; PVR: pulmonary valve replacement; TVP: tricuspid valvuloplasty; TVR: tricuspid valve replacement; VSD: ventricular septal defect. 78
80 TRICUSPID VALVE SURGERY: REPAIR OR REPLACE? Patients TR and right systemic ventricle n=16 cctga n=9 actga n=7 Mechanism of TV regurgitation Annular dilatation n=4 Epstein-like TV abnormalities n=2 Other TV abnormalities n=3 Annular dilatation n=5 Structural TV abnormalities n=2 Initial attempt TVP n=3 TVR n=1 TVR n=2 TVR n=2 TVP n=1 TVP n=5 TVP n=2 Secondary TV replacement within same procedure TVR n=1 TVR n=2 Figure 1. Operative approach to patients. In total, 16 patients were operated, 9 cctga and 7 actga patients. Annular dilatation was the main mechanism of tricuspid regurgitation, but valvular abnormalities were also present. In three patients, the initial attempt to repair the tricuspid valve was unsuccessful and a secondary tricuspid valve replacement was done. actga, atrially corrected transposition of the great arteries; cctga, congenitally corrected transposition of the great arteries; TR, tricuspid regurgitation; TV, Tricuspid valve; TVP, tricuspid valvuloplasty; TVR, tricuspid valve replacement. failure (n=5), requiring placement of an intra-aortic balloon pump in three patients and inotropic support in two patients. One patient was operated for gastric perforation and in another patient a rethoracotomy for persistent bleeding was performed. Five patients had renal insufficiency that required temporary dialysis with continuous veno-venous hemofiltration. Fifteen patients were discharged in good condition after a mean duration of in hospital stay of 27 ± 28 days. Two patients died after discharge. One patient was successfully resuscitated after an episode of ventricular fibrillation 180 days after operation, but died subsequently from ventricular failure, without signs of recurrent TR. The other patient died from recurrent TR and cardiac failure 659 days after surgery, before adequate treatment could be initiated. Follow-up of patients ranged from 92 days to 3101 days after operation with a 1-year survival rate of 86.7%. Kaplan-Meier curves (Figure 2) for the composite end-point death or recurrent severe tricuspid regurgitation revealed that TVR exhibited better survival as compared to patients who underwent TVP; the difference in survival, however was not statistically significant (P = 0.09). Table 2. Post-operative complications. Complications TVP TVR Total None, n (%) 4 (25) 1 (6) 5 (31) Arrhythmia, n (%) 3 (19) 5 (31) 8 (50) Low Cardiac Output, n (%) 2 (13) 3 (19) 5 (31) Renal insufficiency, n (%) 2 (13) 3 (19) 5 (31) Infection, n (%) 1 (6) 1 (6) 2 (13) Rethoracotomy, n (%) 1 (6) 1 (6) 2 (13) Death, n (%) 0 1 (6) 1 (6) TVP: tricuspid valvuloplasty; TVR: tricuspid valve replacement. 79
81 Chapter 4 Operation benefit Overall, tricuspid function and functional class improved significantly after operation, whereas RV function remained stable. In figure 3 shows that tricuspid competence improved significantly after TVP and, as can be expected, after TVR. After TVP however, tricuspid function was not substantially improved in three patients (2 cctga, 1 actga) on post-operative echocardiographic evaluation. Therefore, the overall improvement of tricuspid function was less prominent as compared to TVR. Furthermore, three patients developed recurrent TV regurgitation resulting in regurgitation grade 2.6 ± 0.5 at 10.7 ± 1.9 months of follow-up after TVP. After TVR, on the other hand, the improvement of tricuspid competence was maintained at 10.7 ± 1.9 months of follow-up, as can be expected. RV function, which was classified normal (grade 1) to severely depressed (grade 4), remained unchanged post-operatively and at 10.7 ± 1.9 months follow-up (Figure 3). Pre-operatively, RV function was classified 2.2 ± 0.7 and at maximum follow-up (3.2 ± 1.9 years) RV function was 2.0 ± 0.9. Moreover, no differences in RV function were noted pre-operatively and during follow-up between patients who underwent TVP and patients who underwent TVR. Overall, NYHA class improved from 2.7 ± 0.6 to 2.1 ± 0.8 (P= 0.007) at 3.2 ± 1.7 months after surgery. At 3.2 ± 1.9 years follow-up, functional class was 2.0 ± 0.9. Again, there was no difference in NYHA class between TVP and TVR pre-operatively or during follow-up. 100 TVP TVR P = Survival (days) TVP Percent survival TVR Figure 2. Survival curves for the composite end-point death or recurrent tricuspid regurgitation. A trend towards less favourable survival characteristics for patients who underwent tricuspid valvuloplasty was observed, which was, however, not statistically significant. TVP, tricuspid valvuloplasty; TVR, tricuspid valve replacement. Discussion In the current study we systematically evaluated complications, survival and benefit of TV surgery for substantial regurgitation in patients with a dysfunctional right ventricle in systemic position. Key findings were firstly that a high incidence of post-operative complications was observed. Furthermore, overall TV competence and functional class improved after operation. Finally, the survival characteristics of TVP appeared less favorable than those of TVR. 80
82 TRICUSPID VALVE SURGERY: REPAIR OR REPLACE? 4 TV regurgitation * * * TVR, P< TVP, P< RV function TVR, P=0.07 TVP, P= NYHA Class TVR, P= Pre post 1.7 months ± 1.9 months TVP, P=0.01 Figure 3. Follow-up of tricuspid function, right ventricular function and functional class. Significant improvement of tricuspid function was observed both after tricuspid valve replacement (TVR) as well as tricuspid valve plasty (TVP). After TVP however, the improvement was less prominent and recurrent tricuspid regurgitation was frequently observed. Right ventricular function remained stable during follow-up and there was no difference between patients who underwent TVP and patients who underwent TVR. NYHA class improved significantly both after TVP as well as TVR. The P-values denote the significance of the improvement after TV surgery separately for TVP and TVR. * P<0.01 for the difference in TV competence between TVP and TVR. NYHA, New York Heart Association; RV, right ventricular; TV, tricuspid valve The incidence of complications, related to the procedure, was high in our population. However, all complications were treated successfully in those patients who were operated electively and the presence of complications was not related to worse outcome. In the largest study on TV operations, so far, by van Son et al. comprising of 40 patients with cctga, similar types of post operative complications were described (arrhythmia, bleeding, infection) and a relation between post-operative complications and adverse outcome was also not reported. 8 In a report by Beauchesne et al. on patients with cctga, post-operative complications were again not related to post-operative outcome. 19 Therefore, provided that surgical treatment of TV regurgitation in patients with a right ventricle in systemic position is exclusively performed in specialized centers, complication rate should generally not be a reason to refrain from these operations. 81
83 Chapter 4 Three patients, all with previous Mustard corrections, died in our population, making up a 1-year survival rate of 86.7 %. In one of these patients, the cause of death was TV incompetence and associated systemic ventricular failure after tricuspid valvuloplasty. In the other patients, TV incompetence and systemic ventricular dysfunction was present but not indubitably related to the cause of death (sepsis, ventricular arrhythmia). In the previously mentioned study by van Son et al., survival rates of 78.0% at 5 years and 60.7% at 10 years were reported. 8 In other, smaller studies on patients with cctga, in which survival characteristics of TV surgery were reported as part of a larger study, 1-year survival rates range from 63% to 100%. 10, To our knowledge, no studies are available that report data solely on TV operations in patients with actga. Incidentally, survival characteristics are reported as unfavourable in small groups of patients (n=3), with 1-year survival rates of 25% to 33%, which is much lower than the 1-year 13, 15, 24 survival rate in our group of actga patients (71.4%). In general, TVP was intended in all patients. However, in patients with structural leaflet malformations or severe leaflet tethering, which was noted either pre-operatively or during surgery, it was decided to perform TVR. In these patients, the risk for recurrent TR after TVP was regarded higher as compared to patients with intact tricuspid leaflets, without signs of tethering. 25, 26 In our population, tricuspid competence demonstrated a significant improvement after operation. However, the results of TVP were less promising than the results of TVR. After TVP, the improvement was less prominent than after TVR and the rate of recurrence of regurgitation was relatively high after TVP (37%). Therefore, when comparing the survival curves of the TVP procedure to the TVR procedure there seems to be a disadvantage for TVP which was, however, not statistically significant. In our population, RV function remained stable during follow-up and no differences in RV function were noted between patients who underwent TVP and patients who underwent TVR. It should be noted that in most patients, the pre-operative degree of RV dysfunction was generally mild (n=12), and it could be questioned whether an important improvement in RV function is expected after TV surgery. The sparse results of earlier studies suggest that TV surgery in early stages of RV dysfunction is superior to TV surgery in more advanced stages of RV dysfunction. 19 Therefore, the strategy in most patients was to consider TV surgery on the basis of functional impairment, also when mild RV dysfunction was present. Although no improvement in RV function was observed on echocardiographic evaluation, functional class did improve in our population. A mechanism that may underlie this observation is that improved competence of the TV leads to more effective output of the systemic ventricle, whereas the ejection fraction might even decline. Before surgery, stroke volume is partially regurgitated back into the systemic atrium, whereas after surgery stroke volume completely attributes to cardiac output, leading to overall better function. Secondly, visual assessment of right ventricular function, although generally accepted, may not reveal subtle but important changes in RV function. Other imaging modalities, like cardiac magnetic resonance imaging, may demonstrate improved rather than stable RV function on the long term. 82
84 TRICUSPID VALVE SURGERY: REPAIR OR REPLACE? The combination of TR and progressive RV dysfunction is a frequent finding in patients with cctga or actga. It is associated with a rapid decline in functional class and decreased survival frequently necessitating surgical treatment. 27 Selection of the optimal surgical strategy, specifically in the older patients (3 rd to 4 th decade of life), is a complicated issue. It could be postulated that either relocation of the (morphologically) left ventricle in systemic position or cardiac transplantation, is the surgical treatment of choice in these cases. However, results after relocation of the left ventricle into systemic position, in terms of survival and benefit, are discouraging in the adult TGA population. 28, 29 The option of cardiac transplantation is probably the superior option from a functional point of view. Unfortunately, donor organs are scarcely available and cardiac transplantation can only be applied in a limited number of patients. Hence, cardiac transplantation as a treatment option in the approach to TGA patients with TR and a dysfunctional right ventricle is an exceptional solution. The results from our population, which is relatively old (34.2 ± 14.5 years in the cctga group and 35.0 ± 5.9 years in the actga group), demonstrate that TVR and TVP are associated with low mortality and improvement of functional class. Therefore, it could be regarded as a first option in patients with a systemic right ventricle and TR. It should however be noted that survival characteristics tend to be worse after TVP, mainly caused by a high recurrence rate of TR. Tricuspid leaflet tethering may be the mechanism behind the recurrence of TR after TVP. Limitations In the current study, semi-quantitative analysis of tricuspid and right ventricular function with echocardiography was used. Cardiac magnetic resonance imaging provides a more accurate modality for estimation of right ventricular function. However, an important number of patients have pacemakers and could not undergo magnetic resonance imaging. For consistency, we therefore chose echocardiography for comparison of data during follow-up. As another limitation, which is present in most studies on patients with congenital heart disease, the study population was small. Therefore, the results of this study remain to be confirmed prospectively in a larger patient population. Conclusion Mortality is low after tricuspid surgery in patients with a right systemic ventricle. Although the incidence of post-operative complications is high, this should not be a reason to refrain from these operations. Short-term results demonstrate that tricuspid valve replacement in patients with a dysfunctional right ventricle is associated with an improvement of tricuspid valve function, stable right ventricular function and improvement of functional class. Valvulo- 83
85 Chapter 4 plasty, which is associated with a high recurrence rate of regurgitation, is not advisable in this group of patients and tricuspid valve replacement should therefore be performed preferably. 84
86 TRICUSPID VALVE SURGERY: REPAIR OR REPLACE? References 1. Mustard WT. Surgical diagnosis and treatment of common paediatric cardiac anomalies. R I Med J 1964; 47: Senning A. Surgical correction of transposition of the great vessels. Surgery 1959; 45: Webb GD, McLaughlin PR, et al. Transposition complexes. Cardiol Clin 1993; 11: Warnes CA. Transposition of the great arteries. Circulation 2006; 114: Duncan BW, Mee RB. Management of the failing systemic right ventricle. Semin Thorac Cardiovasc Surg 2005; 17: Bove EL, Ohye RG, et al. Anatomic correction of congenitally corrected transposition and its close cousins. Cardiol Young 2006; 16 Suppl 3: Mee RB. Severe right ventricular failure after Mustard or Senning operation. Two-stage repair: pulmonary artery banding and switch. J Thorac Cardiovasc Surg 1986; 92: van Son JA, Danielson GK, et al. Late results of systemic atrioventricular valve replacement in corrected transposition. J Thorac Cardiovasc Surg 1995; 109: Rutledge JM, Nihill MR, et al. Outcome of 121 patients with congenitally corrected transposition of the great arteries. Pediatr Cardiol 2002; 23: Hraska V, Duncan BW, et al. Long-term outcome of surgically treated patients with corrected transposition of the great arteries. J Thorac Cardiovasc Surg 2005; 129: Dodge-Khatami A, Kadner A, et al. In the footsteps of senning: lessons learned from atrial repair of transposition of the great arteries. Ann Thorac Surg 2005; 79: Chang AC, Wernovsky G, et al. Surgical management of late right ventricular failure after Mustard or Senning repair. Circulation 1992; 86: II140-II Myridakis DJ, Ehlers KH, et al. Late follow-up after venous switch operation (Mustard procedure) for simple and complex transposition of the great arteries. Am J Cardiol 1994; 74: Horer J, Herrmann F, et al. How well are patients doing up to 30 years after a mustard operation? Thorac Cardiovasc Surg 2007; 55: Horer J, Karl E, et al. Incidence and results of reoperations following the Senning operation: 27 years of follow-up in 314 patients at a single center. Eur J Cardiothorac Surg 2008; 33: Prieto LR, Hordof AJ, et al. Progressive tricuspid valve disease in patients with congenitally corrected transposition of the great arteries. Circulation 1998; 98: Roos-Hesselink JW, Meijboom FJ, et al. Decline in ventricular function and clinical condition after Mustard repair for transposition of the great arteries (a prospective study of years). Eur Heart J 2004; 25: Sano T, Riesenfeld T, et al. Intermediate-term outcome after intracardiac repair of associated cardiac defects in patients with atrioventricular and ventriculoarterial discordance. Circulation 1995; 92: II272-II Beauchesne LM, Warnes CA, et al. Outcome of the unoperated adult who presents with congenitally corrected transposition of the great arteries. J Am Coll Cardiol 2002; 40: Westerman GR, Lang P, et al. Corrected transposition and repair of associated intracardiac defects. Circulation 1982; 66: I197-I Lundstrom U, Bull C, et al. The natural and unnatural history of congenitally corrected transposition. Am J Cardiol 1990; 65: Horvath P, Szufladowicz M, et al. Tricuspid valve abnormalities in patients with atrioventricular discordance: surgical implications. Ann Thorac Surg 1994; 57:
87 Chapter Acar P, Sidi D, et al. Maintaining tricuspid valve competence in double discordance: a challenge for the paediatric cardiologist. Heart 1998; 80: Cochrane AD, Karl TR, et al. Staged conversion to arterial switch for late failure of the systemic right ventricle. Ann Thorac Surg 1993; 56: Fukuda S, Song JM, et al. Tricuspid valve tethering predicts residual tricuspid regurgitation after tricuspid annuloplasty. Circulation 2005; 111: Fukuda S, Gillinov AM, et al. Determinants of recurrent or residual functional tricuspid regurgitation after tricuspid annuloplasty. Circulation 2006; 114: I582-I Voskuil M, Hazekamp MG, et al. Postsurgical course of patients with congenitally corrected transposition of the great arteries. Am J Cardiol 1999; 83: Poirier NC, Yu JH, et al. Long-term results of left ventricular reconditioning and anatomic correction for systemic right ventricular dysfunction after atrial switch procedures. J Thorac Cardiovasc Surg 2004; 127: Quinn DW, McGuirk SP, et al. The morphologic left ventricle that requires training by means of pulmonary artery banding before the double-switch procedure for congenitally corrected transposition of the great arteries is at risk of late dysfunction. J Thorac Cardiovasc Surg 2008; 135:
88 Chapter 5 Ventricular Response to Stress Predicts Outcome in Adult Patients with a Systemic Right Ventricle Roderick WC Scherptong Michiel M Winter Sabina Kumar Berto J Bouma Igor I Tulevski Laurens F Tops Arno AW Roest Hubert W Vliegen Albert de Roos Maarten Groenink Barbara JM Mulder Am Heart J Nov;160(5):870-6.
89 Chapter 5 Abstract Background Previous studies demonstrated that ventricular response to stress Cardiovascular Magnetic Resonance (CMR) is frequently abnormal in patients with a systemic right ventricle (RV). However, the clinical implications of these findings remained unknown. We sought to evaluate whether abnormal response to stress CMR predicts adverse outcome in patients with a systemic RV. Methods Thirty-nine adult patients (54% male; mean age 26, range years) with a systemic RV underwent stress CMR to determine the response of RV volumes and ejection fraction (EF). During follow-up, cardiac events, defined as hospitalization for heart failure, cardiac surgery, aborted cardiac arrest, or death, were recorded. The prognostic value of an abnormal response to stress, defined as lack of a decrease in RV end systolic volume (ESV) or lack of an increase in RV EF, was assessed. Results We frequently observed an abnormal response to stress, as RV ESV did not decrease in 17 patients (44%), and RV EF did not increase in 15 patients (38%). After a mean follow-up period of 8.1 years, 8 (21%) patients had reached the composite endpoint. The inability to decrease RV ESV during stress was predictive for cardiac events with a hazard ratio of 2.3 (95%CI ; p=0.034), as was the inability to increase RV EF with a hazard ratio of 2.3 (95%CI ; p=0.027). Conclusions Stress CMR potentially has important prognostic value in patients with a systemic RV. Patients with a systemic RV who show abnormal cardiac response to stress have a substantially higher risk of adverse outcome. 88
90 RESPONSE TO STRESS IN A SYSTEMIC RIGHT VENTRICLE Introduction The number of adult patients with congenital heart disease has grown rapidly over the past few decades. 1 A substantial portion of patients have a morphological right ventricle (RV) that sustains the systemic circulation, i.e. patients with a transposition of the great arteries (TGA) after a Mustard or Senning operation, and patients with a congenitally corrected transposition of the great arteries (cctga). Although mid-term survival is acceptable in these patients, complications are common, and frequently relate to dysfunction of the systemic RV. 2 Therefore, careful follow-up of RV function is the cornerstone in the clinical care for patients with either TGA or cctga. Cardiovascular magnetic resonance imaging (CMR) is a widely applied imaging modality that provides a reliable diagnostic tool for the detection of depressed RV function. As such, CMR is frequently used to guide medical therapy and to select patients for surgical interventions. 3;4 The use of stress CMR, either with supine bicycle ergometry or dobutamine infusion, could facilitate early detection of systemic RV dysfunction. Previous studies in which the value of stress CMR was evaluated, demonstrated that ventricular response to stress was frequently abnormal in patients with a systemic RV. 5 8 It was observed that these patients often lack the ability to increase contractility during stress, even when they are asymptomatic. 8;9 These findings suggest that stress CMR provides the possibility to detect subclinical RV dysfunction at an early stage, and could help identify those patients that require medical or surgical intervention. However, the main limitation of these studies was that the relation between the abnormal response to stress CMR and clinical outcome remained unclear, which questioned the clinical applicability of stress CMR. 10 Therefore, the current study aimed to evaluate the relation between cardiac response to stress CMR and cardiac events in patients with a systemic RV. Methods Patient population and study protocol The study was a two-center investigation, and was set-up to evaluate the ventricular response to stress in patients with TGA or cctga and a systemic RV. Patients with a systemic RV (n=39; 54% male; age 26 ± 8 years) were included in 1999 and Patients were excluded from participation if they were younger than 18 years, had (previous) cardiac arrhythmias, had an intra-cardiac device, or had concomitant cardiac lesions. All patients underwent either dobutamine stress CMR (n=18) in the Academic Medical Centre, Amsterdam, or supine bicycle ergometry CMR (n=21) in the Leiden University Medical Centre. 9;10 After baseline stress CMR evaluation, patients were regularly followed-up at the out-patient clinic for adult congenital 89
91 Chapter 5 heart disease. During follow-up, the occurrence of all cardiac events were recorded. Cardiac events were defined as: hospitalization for heart failure, cardiac surgery, aborted out-ofhospital cardiac arrest or cardiac death. We performed a Cox s regression analysis in which the relation between the cardiac response to stress CMR and the occurrence of cardiac events during follow-up was assessed. The ethics committees of the participating tertiary referral centers approved the study protocol, and the study protocol complies with the Declaration of Helsinki. All participating patients provided written informed consent. The current study was funded by an unrestricted educational grant from Novartis Pharma, the Netherlands. The authors are solely responsible for the design and conduct of this study, all study analyses, the drafting and editing of the paper and its final contents. Stress CMR acquisition The supine bicycle ergometry CMR acquisition protocol has previously been published by Roest et al. 11 In short, image acquisition was performed using a Philips Gyroscan ACS/NT 1.5 Tesla MR scanner (Philips Medical Systems, Best, the Netherlands) in the Leiden University Medical Center. Exercise was performed on a MR-compatible bicycle ergometer. Volumetric indexes of the systemic RV were obtained from a short axis stack of 10 images with a slice thickness of 10 mm and a 1 mm slice gap. We used an ultra-fast, turbo field echo planar imaging MR technique with the following parameters: repetition time = 14 ms, echo time = 4.8 ms, flip angle 30 degrees, imaging matrix 128 X 140, field of view 420 X 120 mm. The protocol was repeated at submaximal exercise, which was defined as 60% of peak oxygen consumption, as determined by stationary bike cardiopulmonary exercise testing one day prior to CMR. After reaching a steady heart rate, the individual performed a breath hold of 8 cardiac cycles to obtain 2 short-axis images. This procedure was repeated 5 times to obtain 10 short-axis images. The dobutamine stress CMR acquisition protocol has previously been published by Tulevski et al. 9 In short, image acquisition was performed using a Siemens 1.5 Tesla MR scanner (Vision, Siemens, Erlangen, Germany) in the Academic Medical Center, Amsterdam. Volumetric indexes of the systemic RV were obtained from a short axis stack of images with a slice thickness of 10 mm and a 0 mm slice gap. We used an ultra-fast, turbo field echo planar imaging MR technique with the following parameters: repetition time = R-R interval, echo time = 4.8 ms, flip angle 20 degrees, imaging matrix 256 X 256, field of view 350 mm. Dobutamine was administered through a venous line with an initial dose of 5 ųg/kg/min, which was increased after 3 minutes by 5 ųg/kg/min every 3 minutes up to a maximal dose of 15 ųg/kg/min. The CMR protocol was repeated 3 minutes after reaching the maximal dose. 90
92 RESPONSE TO STRESS IN A SYSTEMIC RIGHT VENTRICLE Previous studies on cardiac response to stress demonstrated that healthy individuals increase cardiac output during exercise through a reduction in end systolic volume and a subsequent increase in ejection fraction. 12 Therefore, we defined an abnormal response to stress as the inability to decrease systemic right ventricular end systolic volume during stress (end systolic volume at rest end systolic volume at stress 0 ml), and/or the inability to increase systemic right ventricular ejection fraction during stress (ejection fraction at rest ejection fraction stress 0%). CMR image analysis For image analysis, the MASS Analytical Software System (Medis, Leiden, the Netherlands) was used. Image analysis was performed by a single observer in 2009, who was blinded for patient characteristics and outcome. Cine loops were used to choose end diastole and end systole. End diastole was defined as the phase with the largest RV area and end systole as the phase with the smallest RV area. The slices at the base of the heart were considered to be in the ventricle if the blood was at least half surrounded by ventricular myocardium. Trabeculations and papillary muscles were considered part of the ventricular cavity. 13 Fourchamber view cine loop movies in phase and slice with the short axes views were used in case the distinction between the ventricles, atria and great vessels was unclear. Tracing was performed manually on each end diastolic and end systolic short-axis view. The sums of the traced contours in end diastole and end systole were used to calculate end diastolic volume and end systolic volume using a disc summation technique. End diastolic volume and end systolic volume were used to calculate stroke volume and ejection fraction. Stroke volume was defined as end diastolic volume end systolic volume, and ejection fraction as [(end diastolic volume end systolic volume) / end diastolic volume] X 100%. Data on reproducibility of CMR image analysis has been published previously by our group. 14 Statistical methods For statistical analyses SPSS 16.0 (SPSS Inc., Chicago, Illinois) for Windows was used. A 2-tailed probability value of < 0.05 was used as a criterion for statistical significance. The descriptive data are presented as number (percentage), or as mean with standard deviation, or median with range, as appropriate. Chi-square and unpaired t-tests were performed to assess differences between subgroups in categorical and continuous variables, respectively. A survival analysis was performed to assess the relation between an abnormal response to stress at baseline and the occurrence of adverse events during follow-up. For this purpose, the patient population was divided into two groups. The first group consisted of patients who had a nor- 91
93 Chapter 5 mal ventricular response to stress; the second group of patients had an abnormal response to stress, as defined above. Kaplan-Meier survival charts were generated to depict the difference in incidence of adverse events between the two groups and Log-rank tests were used to assess whether the survival curves differed significantly. In addition, the prognostic value of an abnormal response to stress was assessed using Cox s proportional hazard regression analysis. For each stress CMR-derived variable, which was categorized as either normal or abnormal, a univariate hazard ratio (HR) with corresponding 95% confidence intervals (CI) was calculated. Furthermore, the univariate HRs were adjusted for age, and sex to obtain the multivariate HRs. Results Thirty-nine adult patients (54% male; mean age 26.4, range years) underwent stress CMR at baseline. The characteristics of these patients are summarized in table 1. At baseline, 26 patients (67%) were in NYHA functional class I, 13 (33%) patients were in NYHA functional class II and none were in NYHA class III or IV. Six patients were diagnosed with cctga, and 33 patients were diagnosed with complete TGA (19 had undergone a Mustard, and 14 had undergone a Senning operation). Patients with cctga were older at the time of baseline stress CMR investigation, as compared to patients with an atrially switched TGA (34.3 ± 16.3 years vs ± 4.6 years, p<0.01). Patients who had undergone a Mustard operation were significantly older compared to patients who had undergone a Senning operation (26.6 ± 4.3 years vs ± 4.2 years; p<0.05). There were no differences in gender distribution or in NYHA class between the TGA and cctga patients, nor between patients with a previous Mustard and Senning operation. Table 1. Baseline Characteristics. Characteristics All patients* (n=39) Cardiac event* (n=8) Death* (n=3) TGA / cctga 33 / 6 6 / 2 2 / 1 Age (years) 26.4 ± ± ± 19.6 Male 21 (54%) 4 (50%) 2 (67%) NYHA class I 26 (67%) 6 (75%) 1 (33%) II 13 (33%) 2 (25%) 2 (67%) * Data are number of patients (percentage), or mean ± standard deviation. cctga: congenitally corrected transposition of the great arteries; NYHA: New York Heart Association; TGA: transposition of the great arteries. 92
94 RESPONSE TO STRESS IN A SYSTEMIC RIGHT VENTRICLE Ventricular Response to Stress Cardiovascular Magnetic Imaging CMR parameters are summarized in table 2. Stress CMR was well tolerated by most patients, as only 1 dobutamine-stress examination was discontinued due to a supraventricular tachycardia with a heart rate around 260 beats/min that was managed by carotid sinus massage. 6 At baseline we found no differences in resting end diastolic volume, end systolic volume, stroke volume and ejection fraction between patients with an atrially switched TGA and patients with a cctga. Resting end diastolic volume was significantly larger at baseline in patients with a Mustard operation, compared to those with a Senning operation (158.1 ± 48.7 ml vs ± 22.2 ml; p<0.05), however, no differences in end systolic volume, stroke volume and ejection fraction were observed between these two groups. Table 2. Systemic RV volumes and function at rest and response to stress. Characteristics All patients (n=39) Cardiac event (n=8) Rest Death (n=3) end diastolic volume (ml) 148 ± ± ± 112 end systolic volume (ml) 68 ± ± ± 83 stroke volume (ml) 79 ± ± ± 35 ejection fraction (%) 55 ± ± 9 52 ± 14 Δ Stress - Rest end diastolic volume (ml) -12 ± 28-2 ± 18-9 ± 29 end systolic volume (ml) -8 ± 18 3 ± 15* -2 ± 22 stroke volume (ml) -4 ± 16-4 ± 5-7 ± 7 ejection fraction (%) 3 ± 8-1 ± 7 4 ± 10 Data are mean ± standard deviation. * p<0.05 in comparison with all patients. Overall, systemic RV end diastolic volume decreased during stress (147.6 ± 44 ml vs ± 51.9 ml; p=0.01), as did end systolic volume (68.0 ± 29.9 ml vs ± 33.9 ml; p=0.01). Subsequently, systemic RV stroke volume remained unchanged (79.4 ± 22.8 ml vs ± 23.3 ml; p=n.s.). Systemic RV ejection fraction increased significantly during stress (54.7 ± 9.5% at rest vs ± 8.1% during stress; p<0.05). Furthermore, heart rate increased from 68.5 ± 12.1 beats per minute to ± 33.6 beats per minute (p<0.001). There were no statistically significant differences in cardiac response to stress between patients with an atrially switched TGA, and patients with a cctga, nor between patients with a Mustard operation, and patients with a Senning operation. An abnormal systemic RV response to stress was frequently observed. In 17 patients (44%), end systolic volume remained equal or even increased during exercise. In addition, 15 patients (38%), showed no increase, or a decrease in RV ejection fraction during stress, 2 of whom showed normal response in end systolic volume. 93
95 Chapter 5 Abnormal Response to Stress and Future Cardiac Events After a mean follow-up period of 8.1 years; range 0.5 to 9.8 years, 8 (21%) patients had reached the composite endpoint of hospitalization for heart failure (n=2), intra-cardiac surgery (n=2, both tricuspid valve replacement), aborted out-of-hospital cardiac arrest (n=1), or cardiac death (n=3), with an annual event rate of 2.5%. Figure 1. Overall Event Free Survival (%) Follow-up (years) Figure 1. Kaplan-Meier survival curve for freedom from cardiac events plotted for follow-up duration after stress CMR in all patients (n=39). Univariate analysis showed that older age at baseline was significantly associated with worse outcome (HR 1.1; 95% CI ; p=0.02). The other baseline patient characteristics; sex, NYHA class at baseline, type of condition (cctga vs. TGA), type of operation (Mustard vs. Senning), and higher age ( 2 years) at Mustard/Senning operation, were not associated with the risk of cardiac events during follow-up. In addition, end diastolic volume, end systolic volume, stroke volume, and ejection fraction measured at rest were not predictive for future cardiac events, nor for cardiac death. An abnormal cardiac response to stress, on the other hand, was related to the occurrence of cardiac events during follow-up. As can be readily seen in figure 2, both the absence of a decrease in systemic RV end systolic volume during stress, as well as the absence of an increase in systemic RV ejection fraction during stress were predictive of future cardiac events. The absence of a reduction in end systolic volume was a risk factor for cardiac events in the univariate analysis (HR=1.58; 95% CI ; p=0.054), and remained a risk factor for cardiac events after adjusting for age and sex (HR=2.33; 95% CI ; p=0.034). The inability to increase ejection fraction was a risk factor for cardiac events in the univariate analysis (HR=1.81; 95% CI ; p=0.027), and remained a risk factor in the multivariate analysis (HR=2.34; 95% CI ; p=0.027). An abnormal response 94
96 RESPONSE TO STRESS IN A SYSTEMIC RIGHT VENTRICLE 100 a. 100 b. Event Free Survival (%) Decrease ESV No decrease ESV Event Free Survival (%) Increase EF No increase EF p = 0.05 p = Follow-up (years) Follow-up (years) Figure 2. Kaplan-Meier survival curve for freedom from cardiac events plotted for follow-up duration after stress CMR. A. patients with (n=22) versus patients without (n=17) the ability to decrease systemic right ventricular end systolic volume (ESV) during stress. B. patients with (n=24) versus patients without (n=15) the ability to increase systemic right ventricular ejection fraction (EF) during stress. to stress was not predictive for cardiac death. The stress related changes in end diastolic volume, increase stroke volume, and heart rate during stress, were not predictive for future cardiac events, nor for cardiac death. Discussion The present study, for the first time, demonstrates that stress CMR is a valuable prognostic tool in patients with a systemic RV. Patients with a systemic right ventricle, who show no decrease in RV end systolic volume or no increase in RV ejection fraction during stress, have a significantly higher risk of future cardiac events. The diagnostic and prognostic value of stress CMR in patients with acquired heart disease has already been established. Dobutamine stress CMR has been proven useful to detect myocardial ischemia in patients with chest pain, and to predict future myocardial infarction and cardiac death in patients with coronary artery disease. 19;20 Moreover, in patients with mildly to moderately reduced LV ejection fraction stress CMR is prognostic for future myocardial infarction and cardiac death. 21 On the other hand, patients without inducible ischemia during stress CMR, and with a resting ejection fraction > 40% are known to have excellent cardiac prognosis. 20 Notwithstanding the knowledge on the prognostic role of stress CMR in patients with acquired heart disease, the predictive value of stress CMR in patients with congenital heart disease was unknown. 22 Previous studies on stress CMR in patients with a systemic RV have demonstrated that these patients often show an abnormal cardiac response to stress. 6;7;9 In healthy individuals, end systolic volume decreases, whereas end diastolic volume remains unchanged during 95
97 Chapter 5 stress, causing an increase in both stroke volume and ejection fraction. 12;23 Frequently, the systemic RV of patients with an atrially switched TGA lack the ability to increase myocardial contractibility during stress, as they often show no decrease in end systolic volume, and no subsequent increase in stroke volume and ejection fraction during stress. 5;8;24 Moreover, it is known that patients with a systemic RV have a reduced ability to increase heart rate during exercise, due to chronotropic incompetence, which further diminishes the increase in cardiac output during stress. 8;25 Overall, we found an adequate chronotropic response to stress, with a substantial increase in heart rate during stress in all patients. However, our study demonstrates that almost half of the patients could not decrease end systolic volume and almost one third of patients could not increase ejection fraction during stress. This is the first study in which an abnormal cardiac response to stress is demonstrated to be prognostic for future cardiac events in patients with a systemic RV. These findings suggest that impaired myocardial contractility during stress identifies a more deteriorated state of the systemic RV, and thus relates to worse patient outcome as observed in the current study. At the time of stress CMR most patients were in NYHA functional class I, and none were NYHA class III or IV. Moreover, RV ejection fraction was not impaired in most patients, as compared to RV ejection fraction of subjects with normal cardiac anatomy. 26 Survival analysis revealed that neither functional status nor resting RV function was predictive for the occurrence of adverse events. Stress CMR, however, facilitates the detection of cardiac dysfunction that is not apparent at rest. 9 Subsequently, stress related cardiac dysfunction demonstrated to be predictive of adverse events during long-term follow-up, in the current study. Hence, stress CMR provides timely detection of systemic RV dysfunction and could thus guide early therapeutic intervention to prevent or decelerate further ventricular deterioration and the occurrence of cardiac events. 27 However, sufficiently powered, prospective trials are needed to establish the role of early therapeutic intervention in asymptomatic or minimally symptomatic patients with a systemic RV and an abnormal response to stress. Although CMR is considered an accurate and noninvasive tool to assess systemic RV volumes and function, there are some limitations for the use of stress CMR. 13;28;29 For example, 20% of patients with a systemic RV is pacemaker dependent, and an increasing number of patients with a failing systemic RV benefits from cardiac resynchronization therapy. 30 As most intra-cardiac devices are considered to be CMR incompatible, these patients are unsuitable to undergo CMR. Moreover, studies in patients with coronary artery disease have proven dobutamine infusion to be safe, although ventricular ectopy and atrial arrhythmias were seen when administrating high doses of dobutamine (40 ųg/kg/min). 21 As no trials had been performed addressing safety issues when performing stress CMR in patients with a systemic RV, we chose to administer dobutamine at a maximum dosage of 15 ųg/kg/min dobutamine, which is known to be sufficient to assess contractile reserve In the present study, one examination was discontinued due to supra-ventricular tachycardia (260 beats per minute), 96
98 RESPONSE TO STRESS IN A SYSTEMIC RIGHT VENTRICLE which was managed with carotid sinus massage. Although our study was not set-up to evaluate safety issues, this was the only complication that we experienced. Limitations As with most studies on CMR in patients with congenital heart disease, the number of patients included in the study was relatively small. Larger-scaled studies should be pursued to definitely establish the value of our findings. However, despite the relatively small sample size and possible bias in favor of healthier patients, we were still able to show that patients with a systemic RV, who show no decrease in RV end systolic volume or increase in RV ejection fraction during stress, have a significantly higher risk of future cardiac events. Our study was importantly limited by the inability to perform adequate flow measurements at the time of baseline data acquisition. Therefore, our data could not be corrected for potential tricuspid valve regurgitation, or baffle stenosis/leakage. As it is known that tricuspid valve regurgitation predicts for reverse outcome in patients with a systemic RV, some of the complications reported in our study could have been due to tricuspid valve regurgitation, rather than to abnormal stress response. Another limitation is the fact that we used two different CMR image acquisition protocols (in the Leiden University Medical Center, and in the Academic Medical Center in Amsterdam), as well as two different stress protocols (dobutamine stress and physical exercise CMR). 34 Nonetheless, the current study was set-up to evaluate the prognostic value of an abnormal cardiac response to stress for each individual patient, irrespective of the diagnostic modality used, and not to compare patients from different medical centers, or to compare two different diagnostic modalities. We excluded patients with irregular rhythms to avoid the risk of life-threatening arrhythmias during stress, and patients with intra-cardiac devices because of CMR incompatibility. This could have lead to a biased sample, favoring healthier patients with lower risk of cardiac events. Conclusion Stress CMR potentially has important prognostic value in patients with a systemic RV. Patients with a systemic RV who are unable to decrease end systolic volume, or to increase ejection fraction during stress have a substantially higher risk of future cardiac events. 97
99 Chapter 5 Acknowledgements This work was supported by an unrestricted educational grant from Novartis Pharma, the Netherlands. 98
100 RESPONSE TO STRESS IN A SYSTEMIC RIGHT VENTRICLE References 1. Engelfriet P, Boersma E, Oechslin E et al. The spectrum of adult congenital heart disease in Europe: morbidity and mortality in a 5 year follow-up period. The Euro Heart Survey on adult congenital heart disease. Eur Heart J 2005; 26: Warnes CA. Transposition of the great arteries. Circulation 2006; 114: Deanfield J, Thaulow E, Warnes C et al. Management of grown up congenital heart disease. Eur Heart J 2003; 24: van Son JA, Danielson GK, Huhta JC et al. Late results of systemic atrioventricular valve replacement in corrected transposition. J Thorac Cardiovasc Surg 1995; 109: Roest AA, Lamb HJ, van der Wall EE et al. Cardiovascular response to physical exercise in adult patients after atrial correction for transposition of the great arteries assessed with magnetic resonance imaging. Heart 2004; 90: Tulevski II, Lee PL, Groenink M et al. Dobutamine-induced increase of right ventricular contractility without increased stroke volume in adolescent patients with transposition of the great arteries: evaluation with magnetic resonance imaging. Int J Card Imaging 2000; 16: van der Zedde J, Oosterhof T, Tulevski II et al. Comparison of segmental and global systemic ventricular function at rest and during dobutamine stress between patients with transposition and congenitally corrected transposition. Cardiol Young 2005; 15: Winter MM, van der Plas MN, Bouma BJ et al. Mechanisms for cardiac output augmentation in patients with a systemic right ventricle. Int J Cardiol Tulevski II, van der Wall EE, Groenink M et al. Usefulness of magnetic resonance imaging dobutamine stress in asymptomatic and minimally symptomatic patients with decreased cardiac reserve from congenital heart disease (complete and corrected transposition of the great arteries and subpulmonic obstruction). Am J Cardiol 2002; 89: Tops LF, Roest AA, Lamb HJ et al. Intraatrial repair of transposition of the great arteries: use of MR imaging after exercise to evaluate regional systemic right ventricular function. Radiology 2005; 237: Roest AA, Kunz P, Lamb HJ et al. Biventricular response to supine physical exercise in young adults assessed with ultrafast magnetic resonance imaging. Am J Cardiol 2001; 87: Schoen HR, Ried C, Arnhold-Schneider M et al. Radionuclide assessment of a normal left ventricular response to exercise in patients without evidence of heart disease. Eur Heart J 1986; 7: Winter MM, Bernink FJ, Groenink M et al. Evaluating the systemic right ventricle by CMR: the importance of consistent and reproducible delineation of the cavity. J Cardiovasc Magn Reson 2008; 10: Winter MM, Bernink FJ, Groenink M et al. Evaluating the systemic right ventricle by CMR: the importance of consistent and reproducible delineation of the cavity. J Cardiovasc Magn Reson 2008; 10: Futamatsu H, Wilke N, Klassen C et al. Evaluation of cardiac magnetic resonance imaging parameters to detect anatomically and hemodynamically significant coronary artery disease. Am Heart J 2007; 154: Kuijpers D, Ho KY, van Dijkman PR et al. Dobutamine cardiovascular magnetic resonance for the detection of myocardial ischemia with the use of myocardial tagging. Circulation 2003; 107:
101 Chapter Nagel E, Lehmkuhl HB, Bocksch W et al. Noninvasive diagnosis of ischemia-induced wall motion abnormalities with the use of high-dose dobutamine stress MRI: comparison with dobutamine stress echocardiography. Circulation 1999; 99: Tsutsui JM, Dourado PM, Elhendy A et al. Prognostic value of left atrial volume in patients who underwent dobutamine stress echocardiography for known or suspected coronary artery disease. Am Heart J 2008; 156: Dendale PA, Franken PR, Waldman GJ et al. Low-dosage dobutamine magnetic resonance imaging as an alternative to echocardiography in the detection of viable myocardium after acute infarction. Am Heart J 1995; 130: Hundley WG, Morgan TM, Neagle CM et al. Magnetic resonance imaging determination of cardiac prognosis. Circulation 2002; 106: Dall Armellina E, Morgan TM, Mandapaka S et al. Prediction of cardiac events in patients with reduced left ventricular ejection fraction with dobutamine cardiovascular magnetic resonance assessment of wall motion score index. J Am Coll Cardiol 2008; 52: Tulevski II, Dodge-Khatami A, Groenink M et al. Right ventricular function in congenital cardiac disease: noninvasive quantitative parameters for clinical follow-up. Cardiol Young 2003; 13: Brandao MU, Wajngarten M, Rondon E et al. Left ventricular function during dynamic exercise in untrained and moderately trained subjects. J Appl Physiol 1993; 75: Fratz S, Hager A, Busch R et al. Patients after atrial switch operation for transposition of the great arteries can not increase stroke volume under dobutamine stress as opposed to patients with congenitally corrected transposition. Circ J 2008; 72: Paul MH, Wessel HU. Exercise studies in patients with transposition of the great arteries after atrial repair operations (Mustard/Senning): a review. Pediatr Cardiol 1999; 20: Lorenz CH, Walker ES, Morgan VL et al. Normal human right and left ventricular mass, systolic function, and gender differences by cine magnetic resonance imaging. J Cardiovasc Magn Reson 1999; 1: Winter MM, Bouma BJ, Groenink M et al. Latest insights in therapeutic options for systemic right ventricular failure: a comparison with left ventricular failure. Heart Chung KJ, Simpson IA, Glass RF et al. Cine magnetic resonance imaging after surgical repair in patients with transposition of the great arteries. Circulation 1988; 77: Lorenz CH, Walker ES, Graham TP, Jr. et al. Right ventricular performance and mass by use of cine MRI late after atrial repair of transposition of the great arteries. Circulation 1995; 92: II233-II Janousek J, Tomek V, Chaloupecky VA et al. Cardiac resynchronization therapy: a novel adjunct to the treatment and prevention of systemic right ventricular failure. J Am Coll Cardiol 2004; 44: Kuijpers D, Janssen CH, van Dijkman PR et al. Dobutamine stress MRI. Part I. Safety and feasibility of dobutamine cardiovascular magnetic resonance in patients suspected of myocardial ischemia. Eur Radiol 2004; 14: Robbers-Visser D, Luijnenburg SE, van den BJ et al. Stress imaging in congenital cardiac disease. Cardiol Young 2009; 19: Wahl A, Paetsch I, Gollesch A et al. Safety and feasibility of high-dose dobutamine-atropine stress cardiovascular magnetic resonance for diagnosis of myocardial ischaemia: experience in 1000 consecutive cases. Eur Heart J 2004; 25:
102 RESPONSE TO STRESS IN A SYSTEMIC RIGHT VENTRICLE 34. Oosterhof T, Tulevski II, Roest AA et al. Disparity between dobutamine stress and physical exercise magnetic resonance imaging in patients with an intra-atrial correction for transposition of the great arteries. J Cardiovasc Magn Reson 2005; 7:
103

104 Chapter 6 Right Ventricular Peak Systolic Longitudinal Strain is a Sensitive Marker for Right Ventricular Deterioration in Adult Patients with Tetralogy of Fallot Roderick WC Scherptong Sjoerd A Mollema Nico A Blom Lucia JM Kroft Albert de Roos Hubert W Vliegen Ernst E van der Wall Jeroen J Bax Eduard R Holman Int J Cardiovasc Imaging Oct;25(7):
105 Chapter 6 Abstract Purpose The aim of this study was to evaluate the feasibility of right ventricular (RV) longitudinal peak systolic strain (LPSS) assessment for the follow-up of adult patients with corrected tetralogy of Fallot (TOF). Methods Adult patients (n=18) with corrected TOF underwent echocardiography and CMR twice with a time interval of 4.2 ±1.7 years. RV performance was derived from CMR, and included RV volumes and ejection fraction (EF). LPSS was calculated globally (GLPSS) and in the RV free wall (LPSS FW), with echocardiographic speckle-tracking strain-analysis. Baseline (G)LPSS values were compared between patients and healthy controls; the relation between (G)LPSS and CMR parameters was evaluated and the changes in (G)LPSS and CMR parameters during follow-up were compared. Results GLPSS and LPSS FW were significantly reduced in patients as compared to controls (-14.9 ±0.7% vs ±0.9% and ±0.9% vs ±1.5%, p<0.01). Moderate agreement between LPSS and CMR parameters was observed. RV EF remained unchanged during follow-up, whereas GLPSS and LPSS FW demonstrated a significant reduction. RVEF showed a 1% increase, whereas GLPSS decreased by 14%, and LPSS FW by 27%. Conclusions RV LPSS is reduced in TOF patients as compared to controls; during follow-up RV EF remained unchanged whereas LPSS decreased suggesting that RV LPSS may be a sensitive marker to detect early deterioration in RV performance. 104
106 PEAK SYSTOLIC STRAIN IN TETRALOGY OF FALLOT Introduction Reliable quantification of right ventricular (RV) performance is essential during follow-up of patients who underwent total repair for tetralogy of Fallot (TOF). 1 Currently, RV performance is mostly quantified with cardiovascular magnetic resonance (CMR) by assessing ventricular volumes and ejection fraction. 2 Although CMR provides a good estimation of RV performance, recent studies demonstrated that the relation with patient outcome is suboptimal. 3 This observation underscores the need for more sensitive parameters to adequately identify patients at risk for a decrease in RV performance. With the introduction of tissue Doppler imaging, the possibility emerged to evaluate RV myocardial function in patients with TOF using RV strain analysis. 4 However, tissue Doppler imaging has limitations that hamper the application of RV strain analysis in clinical practice. 5 Recently, novel echocardiographic strain analysis packages, based on speckle-tracking, have become available. This technology provides direct information on contractile performance of the right ventricle, 6 which may potentially provide a more a sensitive measurement to detect decreases in RV function at an early stage in patients with TOF. The aim of the current study was twofold. First, we evaluated whether RV peak systolic longitudinal strain, quantified with 2D speckle-tracking imaging, is reduced in adult patients with TOF as compared to normal individuals. Second, we hypothesized that reduction of RV peak systolic strain during follow-up can be used for early detection of a decrease in RV performance. Methods Study population and protocol The patient population consisted of 18 adult patients who underwent total correction for TOF during childhood. In adulthood, these patients were regularly followed up at the outpatient clinic for adult congenital heart disease during a period of 4.2 ± 1.7 years. In this study period, medical therapy was unchanged, no surgical interventions were performed and NYHA class remained stable in all patients. Characteristics are summarized in Table 1. At the age of 33.9 ± 11.2 years, these patients underwent routine evaluation with echocardiography (echo) and CMR within a three-month timeframe (baseline measurement), followed by a recent echo and CMR at the age of 38.1 ± 11.2 years (follow-up measurement). The echo evaluation included a standard 2D echo and 2D speckle-tracking strain analysis to calculate RV global longitudinal peak systolic strain (GLPSS) and longitudinal peak systolic strain separately in the RV free wall (LPSS FW). From the CMR images, RV performance was 105
107 Chapter 6 obtained, expressed as RV end systolic volume (RV ESV), RV end diastolic volume (RV EDV) and RV ejection fraction (RV EF). First, we compared the LPSS values from the baseline echocardiograms of the TOF patients to that of 18 healthy controls matched for age and gender. Second, the relations between RV performance (derived from CMR) on the one hand, and GLPSS and LPSS FW (derived from echocardiography) on the other hand, were calculated. Third, we evaluated the changes in GLPSS, LPSS FW (echocardiography-derived; baseline vs. 4.2 ± 1.7 years follow-up) and RV performance (CMR-derived; baseline vs. 4.2 ± 1.7 years follow-up). Finally, we compared the echocardiographic changes during follow-up to the changes measured with CMR. Table 1. Patient Population. Tetralogy of Fallot (n=18) Male/female (n) 8/10 Age (yrs) 33.9 ± 11.2 BSA (m 2 ) 1.8 ± 0.06 NYHA I/II/III/IV (n) 13/5/-/- Type of repair (n) Transannular patch 12 Right ventricular patch 5 No patch 1 Previous pulmonary valve replacement (n) 7 Echocardiography Echocardiographic imaging took place in the left lateral decubitus position on a commercially available system (Vivid Seven, General Electric-Vingmed, Milwaukee, Wisconsin). Besides the standard parasternal (long- and short-axis) and apical (2- and 4-chamber) images, additional apical (4-chamber) images were obtained that included the interventricular septum, the apex and the RV free wall up to tricuspid annulus. Images were digitally stored in the cineloop format for off-line analysis. Longitudinal strain was assessed off-line, on the 4-chamber cine-loop that included the RV free wall, using speckle-tracking analysis. The speckle-tracking software (EchoPac GE Medical systems, Horten, Norway) uses natural acoustic markers, or speckles, to determine frame-to-frame movement of myocardium. Images are subdivided into blocks of approximately 20 to 40 pixels that contain stable patterns of speckles which are followed through the cardiac cycle. 7 In these blocks, the location of speckles is tracked with a dedicated algorithm that uses the sum of absolute differences and specific correlation criteria. After local tissue velocity vectors are derived from the spatial and temporal data of each speckle, strain can be assessed from temporal differences in the mutual distance of neighbouring speckles. For longitudinal strain assessment, the software calculates the length of a predefined segment as 106

108 PEAK SYSTOLIC STRAIN IN TETRALOGY OF FALLOT a percentage of the original length, shortening of a segment is represented as negative strain and lengthening of a segment is represented as positive strain. RV longitudinal peak systolic strain was calculated in a user interface by delineating the endocardial border from the basal septum to the apex, along the RV free wall to the tricuspid valve annulus. After a region of interest was then set covering the complete width of the myocardium, the software automatically distinguished three predefined septal segments and three RV free wall segments in which longitudinal peak systolic strain was calculated. From these segments, GLPSS was obtained, which is a factory specified weighted average of all six segments. 8 Furthermore, RV LPSS FW was calculated as the average of the three free wall segments (see Figure 1). The minimum frame rate used to calculate longitudinal strain was 40 frames per second. Two patients, in whom the image quality was considered inadequate, were excluded from further analysis. Figure 1. 2D Speckle-tracking Strain Analysis of the Right Ventricle. Right ventricular longitudinal strain analysis in the designated user interface. Panel A demonstrates how first the endocardial border is delineated in the apical 4-chamber view. Based on this contour, the interventricular septum and the right ventricular free wall are tracked automatically. The user optimizes the tracking quality, by adjusting the aforementioned contour and by altering the region of interest (ROI), which corresponds to the width of the tracking (Panel B). Thereafter, the program calculates global strain (GS) based on a weighted average of three septal and three right ventricular free wall segments (Panel C and D). FOR COLOR EXAMPLE, SEE CHAPTER 1, FIGURE
109 Chapter 6 Cardiovascular magnetic resonance Cardiovascular magnetic resonance examinations were performed on a 1.5 T ACS-NT15 magnetic resonance scanner (Philips Medical Systems, Best, the Netherlands.) The scanning protocol has been described previously. 9, 10 All images were obtained during breath holds, with an ECG triggered gradient echoplanar technique. For calculation of ventricular volumes, 10 to 12 consecutive slices were obtained in the transverse plane, to cover both ventricles from apex to base. The MASS software package (Medis, Leiden, the Netherlands), was used for calculation RV EDV, RV ESV and RV EF. 11 Statistical analysis SPSS (SPSS for Windows, SPSS Inc., Chicago, USA) was used for statistical analysis. Data are presented as mean ± SD, unless mentioned otherwise. To evaluate the reproducibility of RV LPSS, the echocardiograms of 20 subjects (10 Fallot patients and 10 controls) were analyzed twice by the same observer in a random order. In addition, these echocardiograms were also analyzed by a second observer. Subsequently, intra- and interobserver agreement of GLPSS and LPSS FW was evaluated using Bland-Altman analysis. An unpaired t-test was used to calculate the difference between patients and healthy controls. Pearson correlation coefficients were computed to describe the correlation between echocardiography derived RV peak systolic strain and CMR derived RV function. Furthermore, the changes from baseline to follow-up were calculated using paired t-test analysis. P values <0.05 were considered statistically significant. Results RV longitudinal peak systolic strain: Patients vs. healthy controls Table 2 demonstrates the differences in LPSS of the RV between patients with TOF and healthy controls per segment. LPSS values in patients with TOF ranged from ± 7.6% in the apical septum to ± 7.1% in the RV basal free wall. In healthy controls, peak systolic strain was also lowest in the apical septum (-18.2 ± 8.3%), but highest in the RV mid free wall (-24.2 ± 10.0%). The observed difference in RV LPSS between patients with TOF and healthy controls was significant in all RV segments except the apical free wall (Table 2). Furthermore, the combined strain values GLPSS and LPSS FW were significantly lower in patients with TOF as compared to healthy controls. 108
110 PEAK SYSTOLIC STRAIN IN TETRALOGY OF FALLOT The intra- and interobserver agreement for both GLPSS and LPSS FW were good. The intraobserver variability was 0.4 ± 1.4 and 0.1 ± 1.2 (mean ± 2SD), respectively, whereas the interobserver variability was 0.5 ± 2.7 and 0.3 ± 1.8 (mean ± 2SD). Table 2. Peak Systolic Strain Values in Tetralogy of Fallot Patients vs. Healthy Controls. TOF (n=18) Controls (n=18) p-value RV LPSS (segmental) Basal septum (%) ± ± 0.7 <0.001 Mid septum (%) ± ± 0.7 <0.001 Apical septum (%) ± ± Apical free wall (%) ± ± Mid free wall (%) ± ± 1.6 <0.001 Basal free wall (%) ± ± RV LPSS (combined) GLPSS (%) ± ± 0.9 <0.001 LPSS FW (%) ± ± 1.5 <0.001 FW: free wall; GLPSS: global peak systolic strain; LPSS: peak systolic strain; RV: right ventricle. Data are presented as mean ± SE. Relation between RV performance and RV longitudinal peak systolic strain in TOF patients In Table 3, the relation between RV performance (as derived from CMR) and RV LPSS (as derived from echo) in the TOF patients is summarized. At baseline, moderate-good relations between RV volumes (as derived from CMR) and RV LPSS were observed. RV EDV correlated significantly with both GLPSS and LPSS FW, indicating reduced strain in patients with a dilated RV. RV ESV was not correlated with RV peak systolic strain values. RV EF was correlated with GLPSS and LPSS FW. At follow-up, similar correlations were observed for RV volumes and RV EF on the one hand, and strain values on the other hand (Table 3). Table 3. Correlation between RV performance (expressed as RV Volumes and RV EF derived from CMR) and RV longitudinal peak systolic strain (derived from echocardiography). GLPSS (r) p-value LPSS FW(r) p-value Baseline RV ESV (ml/m2) 0.01 NS 0.22 NS RV EDV (ml/m2) RV EF (ml/m2) < Follow-up RV ESV (ml/m2) NS NS RV EDV (ml/m2) RV EF (ml/m2) < EDV: end diastolic volume; EF: ejection fraction; ESV: end systolic volume; FW: free wall; GLPSS: global peak systolic strain; LPSS: peak systolic strain, RV; right ventricle. 109

111 Chapter 6 Changes in RV performance and RV longitudinal peak systolic strain during follow-up In Table 4, the changes in RV performance and RV LPSS are shown (baseline vs. 4.2 ± 1.7 years follow-up). First, whereas RV EF remained unchanged, RV EDV and RV ESV demonstrated a small, statistically significant increase, indicating that the RV in TOF patients exhibited gradual dilatation. Second, we observed a significant reduction in RV LPSS on both a global level (GLPSS) as well as in the RV free wall (LPSS FW). An example of a patient with significant reduction in GLPSS and LPSS FW is shown in Figure 2. To compare the changes in RV performance and changes in RV LPSS, the overall percentual changes from baseline to follow-up were calculated and depicted in Figure 3. RV EDV and RV ESV respectively demonstrated a 16 % and 17% increase, whereas RV EF increased with 1%. GLPSS decreased 14%, the largest changes during follow-up, however, were noted in LPSS FW (-27%). Table 4. Changes in RV performance and longitudinal peak systolic strain over 4.2 ± 1.7 years follow-up. Baseline Follow-up p-value RV Performance RV ESV (ml/m2) 49.6 ± ± RV EDV (ml/m2) ± ± RV EF (%) 56.8 ± ± RV LPSS LPSS FW (%) ± ± GLPSS (%) ± ± EDV: end diastolic volume; EF: ejection fraction; ESV: end systolic volume; FW: free wall; GLPSS: global peak systolic strain; LPSS: peak systolic strain; RV: right ventricle. Figure 2. Patient Example of Changes in RV Longitudinal Peak Systolic Strain in Relation to RV Performance on Cardiovascular Magnetic Resonance Imaging. In this patient example, RV end diastolic volume increased gradually from 112 ml/m2 to 120 ml/m2 over a follow-up period of three years, but RV ejection fraction remained unchanged (55% at baseline vs. 54% at follow-up). Global RV longitudinal peak systolic strain however, decreased from -15.5% to -13.6% (red circles), mainly caused by a sharp decrease in longitudinal peak systolic strain of the RV free wall (-17.3% at baseline vs. -12% at three years follow-up). These findings indicate that RV performance measured with CMR may exhibit only minimal changes (without change in RV EF), whereas RV LPSS already decreases. FOR COLOR EXAMPLE, SEE CHAPTER 1, FIGURE
112 PEAK SYSTOLIC STRAIN IN TETRALOGY OF FALLOT Figure 3. Changes in Right Ventricular Performance and Right Ventricular Longitudinal Peak Systolic Strain. The white bars represent the overall changes in RV longitudinal peak systolic strain whereas the black bars represent the overall changes in cardiovascular magnetic resonance derived RV volumes and ejection fraction. To compare the relative magnitudes in changes between strain and volumes/ejection fraction, the percentual changes from baseline to follow-up (rather than the absolute changes) are shown. A significant change was noted for RV volumes, global longitudinal peak systolic strain (GLPSS) and longitudinal peak systolic strain in the RV free wall (LPSS FW). The largest changes were observed in LPSS FW. Discussion The main findings in the present study were that RV LPSS is reduced in patients with TOF as compared to healthy controls. Furthermore, RV LPSS was correlated with RV performance. Finally, over the follow-up period, a significant reduction in RV LPSS was observed, both on a global level (GLPSS) and in the RV free wall (LPSS FW), accompanied by a slight RV dilatation, but in the absence of changes in RV EF. After total repair for TOF, a gradual deterioration of RV performance is observed in most patients, 1 which is associated with a gradual reduction of functional class and the need for (surgical) interventions. 3 Accordingly, early detection of a decrease in RV performance is important in the routine follow-up of patients with TOF. Generally, CMR is the preferred technique for quantification of RV performance, and the most traditional parameters include RV volumes and RV EF. 12 Various CMR studies have been performed to evaluate the relation between RV performance and outcome in patients with TOF. 9, 9, 10, 13 Although these studies demonstrated that a severely dilated RV with depressed RV EF (<35%) was associated with poor functional performance (NYHA class III) and outcome, accurate prediction of adverse outcome based on CMR derived RV performance measurements is limited. 3, 3, 14 Moreover, exercise capacity appeared a strong predictor of adverse outcome in patients with TOF, 15 but CMR derived RV performance measurements were demonstrated to be poorly related with exercise capacity. 13 Thus, there appears a need for more sensitive parameters of RV performance to allow for earlier detection of a decline in RV performance. In the current study, we demonstrated that echocardiography derived RV strain measurements may provide this information. It was shown that RV LPSS was reduced in patients with TOF as compared to healthy individuals; in TOF patients, GLPSS was ± 0.7%, as compared 111
113 Chapter 6 to ± 0.9% in healthy controls. Although literature data on RV LPSS in adult patients with TOF are lacking, previous studies in children after total repair for TOF also reported reduced RV strain values. 4, 16 In a study by Weideman et al, RV LPSS was calculated with tissue Doppler imaging in pediatric TOF patients and compared to healthy controls. 4 The authors reported RV LPSS of -20% in both the interventricular septum as well as in the RV free wall. In a similar study by Solarz et al, 16 in which strain also was calculated with tissue Doppler imaging, LPSS values of -17% in the RV free wall and of -21% in the interventricular septum were described. RV LPSS was more reduced in the current study (-14.9 ± 0.7% in TOF patients vs ± 0.9% in normal controls), which may have been related to differences in patients age between study populations in the present vs. former studies. The mean age of patients in the current study was 34 ± 3 years, whereas the mean age in the previous studies was 11 ± 3 years and 7 ± 4 years, respectively. 4, 16 Furthermore, both the timing as well as the type of total correction is most likely different in the current study population as compared to previously described pediatric populations. As a consequence of the evolution of the surgical approach to TOF, the earlier timing of total correction over the years and the use of smaller transannular patches, younger patients are less prone to the development of RV dysfunction. 17 In addition, difference in strain calculation technique, tissue Doppler imaging vs. speckle-tracking may provide an alternative explanation for the differences between the current study and former studies. Next, the relation between RV LPSS and GLPSS derived from 2D speckle-tracking on the one hand, and RV performance derived from CMR parameters on the other hand was evaluated in the current study. We observed moderate-good correlations between RV LPSS with echocardiography and RV performance assessed by CMR, both at baseline and at follow-up. Patients with severe RV dilatation demonstrated reduced GLPSS and LPSS FW as compared to patients with preserved RV dimensions (Table 3). Furthermore, patients with depressed RV EF had lower GLPSS and LPSS FW as compared to patients with preserved RV EF (Table 3). The relation between the CMR derived RV performance measurements, and the echocardiography derived strain measurements was not excellent, suggesting that the two parameters provide different information. This suggestion is further strengthened by the observation that despite unchanged RV EF on CMR over the follow-up period (RV EF 56.8 ± 9.3% at baseline vs ± 10.0% at follow-up, p = NS), the RV strain parameters exhibited already some deterioration over time (Table 4, Figure 3), suggesting that strain parameters may provide more sensitive information on RV performance as compared to the traditional RV EF and RV volumes derived from CMR. To the best of our knowledge, this is the first study to demonstrate the course of RV strain deterioration in patients with TOF. One of the pathophysiological substrates, besides the presence of RV dilatation, underlying this subtle deterioration of RV performance is likely to be related to gradual formation of myocardial fibrosis. 18 Babu-Narayan et al recently reported that patients with corrected TOF develop fibrosis in the RV as visualized on contrastenhanced CMR. 19 In the patient population of 92 adult TOF patients aged 32 ± 11 years, the 112
114 PEAK SYSTOLIC STRAIN IN TETRALOGY OF FALLOT authors demonstrated that RV fibrosis was present in 99% of the patients after 4 to 41 years follow-up. In this study, the presence of fibrosis was not only related to RV dilatation, but also to the increased incidence of arrhythmias and reduced exercise capacity, indicating that RV fibrosis formation is an important mechanism in patients with TOF. 19 Possibly, the presence of RV fibrosis, also explains the reduced RV LPSS values in our current population. Limitations As a shortcoming of most studies in patients with congenital heart disease, the sample size of the current study was small. Therefore, the relation of RV GLPSS and LPSS FW to pulmonary regurgitation, which is an important determinant of RV function in TOF, could not be investigated. Furthermore, the current observations need to be related to outcome, in order to demonstrate whether the changes in RV LPSS without changes in RV EF are of clinical relevance. Conclusion The current findings showed that RV longitudinal peak systolic strain is reduced in TOF patients as compared to normal controls. Moreover, RV longitudinal peak systolic strain correlates moderately with measures of RV performance on CMR. Although RV ejection fraction on CMR remained unchanged and only modest RV dilatation was present during follow-up, echo-derived longitudinal peak systolic strain measures already decreased, suggesting that longitudinal peak systolic strain may be more sensitive to detect changes in RV performance. Further studies are needed to evaluate the role of RV longitudinal peak systolic strain to detect abnormalities in RV performance at an early stage. 113
115 Chapter 6 References 1. Atik FA, Atik E, et al. Long-term results of correction of tetralogy of Fallot in adulthood. Eur J Cardiothorac Surg 2004; 25: van Straten A, Vliegen HW, et al. Right ventricular function late after total repair of tetralogy of Fallot. Eur Radiol 2005; 15: Geva T, Sandweiss BM, et al. Factors associated with impaired clinical status in long-term survivors of tetralogy of Fallot repair evaluated by magnetic resonance imaging. J Am Coll Cardiol 2004; 43: Weidemann F, Eyskens B, et al. Quantification of regional right and left ventricular function by ultrasonic strain rate and strain indexes after surgical repair of tetralogy of Fallot. Am J Cardiol 2002; 90: Gondi S, Dokainish H. Right ventricular tissue Doppler and strain imaging: ready for clinical use? Echocardiography 2007; 24: Perk G, Tunick PA, et al. Non-Doppler two-dimensional strain imaging by echocardiography--from technical considerations to clinical applications. J Am Soc Echocardiogr 2007; 20: Leitman M, Lysyansky P, et al. Two-dimensional strain-a novel software for real-time quantitative echocardiographic assessment of myocardial function. J Am Soc Echocardiogr 2004; 17: Reisner SA, Lysyansky P, et al. Global longitudinal strain: a novel index of left ventricular systolic function. J Am Soc Echocardiogr 2004; 17: Vliegen HW, van Straten A, et al. Magnetic resonance imaging to assess the hemodynamic effects of pulmonary valve replacement in adults late after repair of tetralogy of fallot. Circulation 2002; 106: Oosterhof T, van SA, et al. Preoperative thresholds for pulmonary valve replacement in patients with corrected tetralogy of Fallot using cardiovascular magnetic resonance. Circulation 2007; 116: Niezen RA, Helbing WA, et al. Biventricular systolic function and mass studied with MR imaging in children with pulmonary regurgitation after repair for tetralogy of Fallot. Radiology 1996; 201: Rebergen SA, Chin JG, et al. Pulmonary regurgitation in the late postoperative follow-up of tetralogy of Fallot. Volumetric quantitation by nuclear magnetic resonance velocity mapping. Circulation 1993; 88: Meadows J, Powell AJ, et al. Cardiac magnetic resonance imaging correlates of exercise capacity in patients with surgically repaired tetralogy of Fallot. Am J Cardiol 2007; 100: Knauth AL, Gauvreau K, et al. Ventricular size and function assessed by cardiac MRI predict major adverse clinical outcomes late after tetralogy of Fallot repair. Heart 2008; 94: Giardini A, Specchia S, et al. Usefulness of cardiopulmonary exercise to predict long-term prognosis in adults with repaired tetralogy of Fallot. Am J Cardiol 2007; 99: Solarz DE, Witt SA, et al. Right ventricular strain rate and strain analysis in patients with repaired tetralogy of Fallot: possible interventricular septal compensation. J Am Soc Echocardiogr 2004; 17: Giannopoulos NM, Chatzis AC, et al. Tetralogy of Fallot: influence of right ventricular outflow tract reconstruction on late outcome. Int J Cardiol 2004; 97 Suppl 1: Oosterhof T, Mulder BJ, et al. Corrected tetralogy of Fallot: delayed enhancement in right ventricular outflow tract. Radiology 2005; 237:
116 PEAK SYSTOLIC STRAIN IN TETRALOGY OF FALLOT 19. Babu-Narayan SV, Kilner PJ, et al. Ventricular fibrosis suggested by cardiovascular magnetic resonance in adults with repaired tetralogy of fallot and its relationship to adverse markers of clinical outcome. Circulation 2006; 113:
117
118 Chapter 7 Biventricular Performance in Patients with Marfan Syndrome without Significant Valvular Disease: Comparison to Normal Subjects and Longitudinal Follow-Up Roderick WC Scherptong Hubert W Vliegen Ernst E van der Wall Yvonne Hilhorst-Hofstee Jeroen J Bax Arthur J Scholte Victoria Delgado J Am Soc Echocardiogr Dec;24(12):
119 Chapter 7 Abstract Background The presence and progressive nature of primary myocardial involvement in Marfan is debated. The current study aimed to evaluate the clinical relevance of left ventricular (LV) and right ventricular (RV) strain, in adult patients with Marfan syndrome without significant valvular disease. Methods and Results Adult Marfan patients (n=50; age 35.2 ±12.9 years) were followed prospectively. Echocardiography was performed annually and existed of comprehensive assessment of ventricular and valvular function. Using speckle tracking imaging, the baseline strain values of the Marfan population were calculated and compared to the values of normal controls. The follow-up evaluations were used to assess changes in ventricular strain. The association between the incidence of adverse events (heart failure, (supra)ventricular arrhythmias and proximal aorta surgery) and baseline strain values was investigated. As compared to controls, Marfan patients had significantly lower peak longitudinal LV strain (-18.9 ±2.3% vs ±1.9%, P<0.01) and RV strain (-26.9 ±5.2% vs ±4.25%, P<0.01). The absolute changes in LV longitudinal, radial and circumferential strain and RV longitudinal strain during a median 4 years of follow-up were 0.1 ±2.8%, 1.12 ±7.6%, 0.3 ±3.7% and 0.9 ±5.5%, respectively, which was not statistically significant. Cox regression demonstrated that reduced LV or RV strain was not associated with adverse outcome (supraventicular arrhythmias, n=3; proximal aorta surgery, n=4). Conclusions This study suggests that Marfan patients show lower ventricular strain and strain rate values as compared to healthy controls. However no relevant changes in left and right ventricular function occur during mid-term follow-up in Marfan patients without valvular disease at baseline. Although ventricular strain and strain rate are mildly reduced in Marfan syndrome, this did not affect outcome negatively in the current study. 118
120 BIVENTRICULAR PERFORMANCE IN MARFAN SYNDROME Introduction Marfan syndrome is a systemic connective tissue disorder, caused by mutations in the fibrillin-1 gene. 1 Besides abnormalities in the musculoskeletal and ocular systems, the cardiovascular phenotype exists of widening of the aorta and pulmonary artery and of abnormalities in the mitral valve. 2 In addition, studies into primary myocardial involvement revealed that ventricular function may also be impaired in Marfan patients. Several investigations in which conventional echocardiography was used, indicated that left ventricular (LV) diameters can be increased, and that LV diastolic function can be impaired. 3;4 More recent analyses, in which myocardial deformation was assessed with novel echocardiographic techniques, demonstrated that LV and right ventricular (RV) systolic ventricular function may also be reduced in patients with Marfan syndrome as compared to controls. 5;6 In light of these study data, it is advocated to regularly perform follow-up echocardiographic evaluations, to timely detect decreased ventricular function. 7 Nonetheless, the largest longitudinal follow-up study so far, conducted in 234 Marfan patients, did not demonstrate any significant changes in LV diameters and function during a median follow-up duration of 6 years. 8 This questioned whether the ventricular abnormalities which were observed in the Marfan patient population had a progressive nature. It should, however, be noted that the previously mentioned study relied on conventional echocardiography, whereas recent investigations indicated that small changes in ventricular function may remain undetected using these methods. In recent years, echocardiographic speckle tracking-derived strain imaging was introduced as a novel modality that can be used to detect clinically relevant but modest changes in ventricular performance. 9 The aim of the current study was threefold: First, to assess the difference in LV and RV performance, quantified with speckle trackingderived strain and strain rate imaging, between patients with Marfan syndrome and healthy controls; Second, to investigate the association between bi-ventricular strain and strain rate on the one hand and clinical outcome of Marfan patients on the other hand; Third, to analyze whether any relevant changes in LV and RV performance occur in patients with Marfan syndrome, using both conventional echocardiographic measures of ventricular function as well as speckle tracking-derived strain and strain rate imaging. Methods Study population The study population consisted of all patients with Marfan syndrome who where prospectively followed at the outpatient clinic from until Marfan syndrome was diagnosed according to the Ghent criteria, and genetic testing for Marfan associated 119
121 Chapter 7 mutations was performed in all patients. 2;10 In order to investigate whether potential changes in ventricular function related specifically to Marfan syndrome, only patients without significant valvular regurgitation or stenosis were selected. Patients with significant valvular heart disease, including moderate and severe regurgitation and any grade of valvular stenosis were excluded. Valvular heart disease was evaluated with colour, continuous and pulsed wave echocardiographic Doppler techniques applying the reference measures indicated by current recommendations. 13 The other criteria for exclusion from the analysis were: a follow-up duration of less than two years, documented coronary artery disease or a history of coronary artery disease related events, diabetes; defined as a fasting glucose 6.1 mmol/l or receiving ant-diabetic medication, or hypertension; defined as resting systolic blood pressure 140mmHg or diastolic blood pressure 90mmHg at multiple measurements. A comprehensive echocardiographic evaluation was performed annually and included assessment of valvular function and measurement of aorta and pulmonary artery diameters. In addition, function of the left and right ventricle was evaluated using conventional echocardiographic measures and novel speckle tracking derived strain and strain rate imaging. First, the baseline strain and strain rate values of the Marfan patients (derived from the first echocardiogram) were compared to the strain and strain rate values of a normal control population. This population comprised of consecutive patients with no history of medical illness and was matched for age, sex and body surface area. All patients were referred for echocardiography with atypical chest pain, palpitations, or syncope without murmur and did not show structural heart disease. Those individuals who showed LV dilatation, had known hypertension, or were referred for echocardiographic evaluation of known valvular disease, murmur, or heart failure were excluded. In addition, to assess whether strain-derived ventricular performance was related to the occurrence of adverse events in Marfan patients, all cardiovascular events were noted during follow-up between the echocardiograms. For that purpose, cardiovascular events were defined as: symptomatic heart failure, (supra)ventricular arrhythmia and elective or emergency proximal aorta surgery. An event was noted as symptomatic heart failure when patients had heart failure related symptoms (E.g. dyspnea, orthopnea) which could not be attributed to any other disease or evidence of heartfailure during clinical investigation (E.g. edema, cyanosis, etc). Arrhythmias were documented when patients were symptomatic, or when noted on electrocardiographic evaluation during regular follow-up. Patients were referred for proximal aorta surgery when the diameter at the sinus of Valsalva exceeded 5cm, when the aorta growth exceeded 0.5 cm/y or when a family history of aortic dissection at a diameter < 5 cm was present. Finally, to analyze changes in ventricular performance over time, the baseline echocardiogram was compared to the last follow-up echocardiogram, which was obtained at least two years after the baseline evaluation. 120
122 BIVENTRICULAR PERFORMANCE IN MARFAN SYNDROME Echocardiography Echocardiographic imaging was performed in the left lateral decubitus position on a commercially available system (Vivid Seven, General Electric-Vingmed, Horten, Norway). Images were acquired at a depth of 16 cm in the parasternal, apical, suprasternal and subcostal views using a 3.5 MHz transducer. In all patients, standard M-mode and two-dimensional images were obtained during breath holds and three consecutive beats were saved in regular cineloop format. In addition, color Doppler data were acquired in all views after optimizing gain and Nyquist limit. Subsequently, standard continuous and pulsed wave Doppler examinations were performed. The images were analyzed offline by two independent observers, using dedicated software for echocardiographic analysis (EchoPac version , General Electric Vingmed, Horten, Norway). Vascular diameters and valvular function The diameters of the aorta were measured in the parasternal long-axis view to visualize both the aortic root as well as the proximal part of the ascending aorta. Diameters were measured leading edge to leading edge at the level of the aortic annulus, the sinus of Valsalva, the sinotubular junction and the ascending aorta. 11 The pulmonary artery diameter was assessed on the parasternal short-axis view at the level of the aortic valve and the diameter was measured in the proximal pulmonary artery, distal from the pulmonary valve. Using color, continuous and pulsed-wave Doppler data, valvular heart disease (regurgitation and stenosis) was scored semi-quantitatively according to the guidelines of the American Society of Echocardiography, and was graded as absent, mild, moderate and severe. 12;13 Evaluation of valvular stenosis included a qualitative assessment of morphology and motion of the valvular leaflets and quantification of transvalvular gradients and effective orifice area based on continuous and pulsed wave Doppler recordings. Valvular regurgitation was evaluated using an integrative approach which includes measurement of vena contracta of the regurgitant jet, quantification of the regurgitant volume and effective regurgitant orifice area with the proximal isovelocity surface area method whenever possible, and evaluation of atrial and ventricular dimensions. When tricuspid regurgitation was present, pulmonary artery pressure was estimated using the modified Bernoulli equation. Significant (clinically relevant) valvular heart disease was defined as moderate or severe valvular stenosis or regurgitation. 121
123 Chapter 7 Conventional measurement of ventricular function First, conventional quantification of LV and RV systolic function was performed. For this purpose, LV end-diastolic volume (EDV), end-systolic volume (ESV) and ejection fraction (EF) were derived using the biplane Simpson s method. 11 LV volumes were indexed for body surface area according to Mosteller s formula. 14 In addition, diastolic function of the left ventricle was assessed using pulsed-wave Doppler of the mitral valve inflow. 15 The Doppler sample volume was placed between the tips of the mitral leaflets and subsequently the peak early (E) and late (A) diastolic velocities and E-wave deceleration time (DT) were measured. Furthermore, the averaged E of the LV septal and lateral wall was measured with color-coded tissue Doppler imaging and the E/E ratio was calculated. Thereafter, RV function was evaluated. First, RV diameters were measured in the apical 4-chamber view at the level of the tricuspid annulus (RVD1), mid RV (RVD2) and from base-to-apex (RVD3). 11 Secondly, RV fractional area change (RVFAC) was determined using the standard formula. 11 Third, the tricuspid annular plane systolic excursion (TAPSE) was measured in the RV free wall by placing the M-mode cursor in the lateral part of the tricuspid annulus parallel to the RV free wall, and the maximum systolic displacement of the RV base was measured. 16 Measurement of ventricular strain and strain rate In addition to the conventional measures of ventricular performance, peak strain and strain rate of both the left and right ventricle were assessed off-line, using speckle-tracking analysis software (version , GE Medical systems, General Electric Vingmed, Horten, Norway) For the current study, the peak longitudinal strain and strain rate values were calculated for the left and right ventricle separately. Maximum LV longitudinal strain and strain rate were calculated globally as the average of 18 segments which were obtained in the apical 2-, 3- and 4-chamber view. In addition, strain and strain rate were measured circumferentially and radially on short-axis images of the left ventricle on the level of the papillary muscles. Furthermore, peak RV longitudinal strain and strain rate were determined as the average of three free wall segments obtained in the apical 4-chamber view. 18 Statistical analysis SPSS (SPSS 16.0 for Windows, SPSS Inc., Chicago, USA) was used for statistical analysis. Data are presented as mean ± SD, unless mentioned otherwise. Intraobserver reproducibility was determined by repeating the strain and strain rate measurements by a single observer in 25 randomly selected patients. The patients were again analysed by the second observer to 122
124 BIVENTRICULAR PERFORMANCE IN MARFAN SYNDROME provide interobserver variability. Variability was determined using Bland-Altman analysis. An unpaired Student s t-test was used to test statistical significance of the differences between Marfan patients and healthy controls. Cox s proportional hazard regression analysis was applied to analyze the association between strain and strain rate, on the one hand, and the incidence of adverse events during follow-up, on the other hand. In these analyses, strain and strain rate were entered as continuous variables into the regression equation. To test whether changes in vascular dimensions or ventricular function were statistically significant, a paired Student s t-test was performed. To analyze further whether the extent of potential changes in ventricular function was related to age, the study group was divided according to the mean age at baseline, corresponding to 35 years. Thereafter, changes in ventricular function were analyzed separately in the group of patients who were younger than 35 years and the group of patients who were 35 years or older at baseline. The difference in changes in ventricular function between the groups was assessed with an unpaired Student s t-test. P values <0.05 were considered statistically significant. Results After exclusion of 6 patients with significant valvular disease, 5 patients with other medical conditions besides Marfan syndrome and 10 patients with inadequate follow-up duration (<2 years), 50 patients were included in the analysis. Characteristics of those patients are summarized in Table 1. Exactly 50% of the patient population was male and all patients were adult at time of inclusion. A Marfan-related genetic mutation was found in 37 patients (74%). Table 1. Patient population. Male/female (n) 25/25 Genetic mutation(n,%) 37 (74%) Fibrillin-1 (n,%) 35 (70) Transforming growth factor 2 receptor (n,%) 2 (4%) Cardioprotective medication (n=46) 96% Beta blocker (n, %) 25 (50%) ARB (n, %) 8 (16%) ACE inhibitors (n, %) 2 (4%) Combination (n, %) 11 (22%) Baseline echocardiogram Age (years) 35.5 ± 13.1 BSA (m2) 2.0 ± 0.3 Age at follow-up echocardiogram Age (years) 39.0 ± 13.1 BSA (m2) 2.0 ± 0.2 Follow-up time (yrs) 3.9 ± 1.2 ACE: angiotensin converting enzyme; ARB: angiotensin receptor blocker; BSA: body surface area. 123
125 Chapter 7 A pathologic mutation in the fibrillin-1 gene was identified in 35 patients (70 %), whereas in 2 patients (4 %) a pathologic mutation in the transforming growth factor 2 receptor was found. Most patients used a beta-blocker, an angiotensin-converting enzyme inhibitor or an angiotensin-receptor blocker, though a combination was also frequently applied (22%; see Table 1). Mean age during baseline echocardiographic evaluation was 35.2 ± 12.9 years and the median follow-up duration was 4 years. The age of the control group was 34.8 ± 8.1 years, which was comparable with the Marfan population (P=0.75). Body surface area, which was 1.94 ± 0.18 in the control population did not differ significantly from the Marfan patient population, (P=0.23). In addition, the number of male subjects was not statistically different in the control population (n=29, 58%) as compared to the Marfan population (P=0.55). The intra- and interobserver agreement for biventricular strain and strainrate assessment was good. The intraobserver variability of LV longitudinal strain and strainrate was 0.19 ± 2.11% and 0.01 ± 0.26%/s, respectively. The intraobserver variability of RV longitudinal strain and strainrate was 0.41 ± 1.45% and 0.03 ± 0.37%/s. The interobserver variability of LV longitudinal strain and strainrate was 0.40 ± 2.95% and 0.02 ± 0.21%/s, whereas the interobserver variability of RV longitudinal strain and strainrate was 0.30 ± 1.82% and 0.01 ± 0.38 %/s, respecrively. Ventricular Strain and Strain Rate: Comparison between Marfan Patients and Healthy Controls Strain and strain rate values, in addition to standard echocardiographic measures (see Supplemental Table 2), of 50 healthy control subjects were compared to the strain and strain rate values of the 50 Marfan patients (Figure 1). A consistent difference in longitudinal strain and strain rate values of the left and right ventricle was observed between patients with Marfan syndrome and healthy controls. Mean peak LV longitudinal strain was ± 1.9% and strain rate was ± 0.18%/s in normal controls, whereas this was ± 2.3 % (p<0.01) and ± 0.19%/s (p=0.03), respectively, in the Marfan population (Figure 1). A similar difference in mean peak RV longitudinal strain (-29.3 ± 4.25% vs ± 5.2%, p=0.01) and strain rate (-1.65 ± 0.30%/s vs ± 0.31%/s, p<0.01) was observed between normal controls and Marfan patients, see Figure 1. Mean peak LV circumferential strain rate was significantly lower in Marfan patients (-1.13 ± 0.24%/s) as compared to the control population (-1.29 ± 0.27%/s), p<0.01, whereas mean peak LV circumferential strain did not demonstrate to be significantly different. Finally, mean peak LV radial strain and strain rate were not significantly different between the groups. 124
126 BIVENTRICULAR PERFORMANCE IN MARFAN SYNDROME Table 2. Association between cardiovascular events and biventricular strain. Variable HR 95% CI p-value Strain LV longitudinal LV radial LV circumferential RV longitudinal Strain rate LV longitudinal LV radial LV circumferential RV longitudinal CI: confidence interval; HR: hazard ratio; LV: left ventricle; RV: right ventricle P<0.01 P= P= P= P= P= P< P<0.01 Figure 1. Ventricular strain and strain rate: Comparison between Marfan patients and healthy controls. The bars denote the means with corresponding standard deviations of the strain and strain rate values in normal controls and Marfan patients. The white bars represent normal controls and the black bars indicate Marfan patients. Strain and strain rate values were significantly higher in normal control subjects as compared to Marfan patients. The difference, however, was small. Sr: strain rate. Adverse Cardiovascular Events and Association with Baseline Strain and Strain Rate During a mean follow-up duration of 3.9 ± 1.2 years of the Marfan population, 7 cardiovascular events occurred. No episodes of symptomatic heart failure were observed. Arrhythmias occurred in 3 patients (6%) and existed of atrio-ventricular nodal reentrant tachycardia (n=2) and atrial fibrillation (n=1). Proximal aorta surgery was performed in 4 patients (8%), either due to aneurysmatic widening of the proximal aorta (n=2) or a type A aortic dissection (n=2). Univariate Cox s regression analysis revealed that none of the baseline strain or strain rate values was related to the incidence of adverse events (See Table 2). 125
127 Chapter 7 Changes in Vascular Diameters and Conventional Measures of Ventricular Function Overall, a significant increase in vascular diameters was consistently observed during followup, as summarized in Table 3. A small increase in diameter was observed in the aortic valve annulus, sinus of Valsalva (including Z-score) and sino-tubular junction. In addition, moderate widening was also noted in the ascending aorta and the trunk of the pulmonary artery. In contrast with vascular diameters, LV volumes and function remained unchanged during follow-up of the study population, as summarized in Table 2. At baseline, mean LV EDV was mildly enlarged, however, after correction for body surface area, mean LV EDV was within normal limits. LV EDV was 64 ± 19 ml/m2 at baseline and 64 ± 12 ml/m2 at follow-up, indicating Table 3. Vascular diameters and conventional measures of ventricular function. Baseline Follow-up Mean Δ p-value Vascular diameters Annulus (cm) 2.5 ± ± ± Sinus Valsalva (cm) 3.8 ± ± ± 0.3 <0.01 Z-score (mean, range) 2.5 ( ) 3.2 ( ) 0.76 ( ) <0.01 ST junction (cm) 3.1 ± ± ± 0.3 <0.01 Asc Aorta (cm) 3.1 ± ± ± 0.4 <0.01 Pulmonary artery (cm) 2.4 ± ± ± 0.3 <0.01 LV systolic function LV EDV (ml) 128 ± ± 29 5 ± LV EDV index (ml/m2) 64 ± ± 12 0 ± LV ESV (ml) 48 ± ± 17 1 ± LV ESV index (ml/m2) 24 ± 9 24 ± 7 0 ± LV EF (%) 63 ± 6 63 ± 8 0 ± LV Diastolic function E (m/s) 0.73 ± ± ± A (m/s) 0.54 ± ± ± E/A 1.41 ± ± ± E (m/s) 0.09 ± ± ± E/E 8.56 ± ± ± LA dimensions LA diameter (cm) 3.6 ± ± ± LA index (cm/m2) 1.6 ± ± ± RV systolic function RVD 1 (cm) 3.4 ± ± ± RVD 2 (cm) 3.5 ± ± ± RVD 3 (cm) 7.4 ± ± ± RVFAC (%) 39 ± 7 39 ± 7 1 ± TAPSE (cm) 2.1 ± ± ± Asc: ascending; EDV: end diastolic volume; EF: ejection fraction; ESV: end systolic volume; LV: left ventricular; RVD 1: tricuspid annulus diameter; RVD 2: mid right ventricular diameter; RVD 3: base-to-apex diameter; RVFAC: right ventricular fractional area change; ST: sino-tubular; TAPSE: tricuspid annular plane systolic excursion. 126
128 BIVENTRICULAR PERFORMANCE IN MARFAN SYNDROME that LV EDV was not subject to changes. Analogously, no relevant changes in LV ESV and LV EF were observed. Mean LV ESV was 24 ml/m2 and mean LV EF was 63% both at baseline and at follow-up. In addition to systolic LV function parameters, no changes in the measures of LV diastolic function or left atrial diameter were noted during follow-up (Table 3). In concordance with LV systolic and diastolic function, no changes in RV function as measured with conventional echo measures were noted. During follow-up, a non-significant increase of 0.1 ± 0.6 cm of the tricuspid annulus, of 0.2 ± 0.6 cm in the mid RV and of 0.1 ± 1.0 cm of the base-to-apex diameter, was found. In addition, RV function, as estimated with TAPSE and RVFAC, demonstrated to be unchanged at follow-up (Table 3). Changes in Biventricular Strain and Strain Rate Full assessment of LV and RV strain was performed at baseline and at follow-up in the patient population. A summary of strain characteristics is provided in Table 4. Mean peak LV longitudinal strain was ± 2.3 %, at baseline, with a maximum longitudinal strain rate value of ± 0.19 %/s. At follow-up, peak LV longitudinal strain was ± 2.5 and strain rate was ± 0.16, showing that a similar strain pattern was observed at follow-up. In addition, LV radial and circumferential strain and strain rate also remained unchanged during follow-up, as noted in Table 4. For the right ventricle, the mean peak longitudinal strain value was ± 5.2 % at baseline and ± 4.9% at follow-up and the mean strain rate value was ± 0.31 %/s at the baseline evaluation and ± 0.40 %/s, at follow-up, indicating that RV performance did not deteriorate. To further investigate whether any relevant changes in myocardial performance occurred in the study population, patients were stratified according to the mean age at the baseline echocardiographic evaluation, which was 35 years. Patients who were younger than 35 years Table 4. Changes in strain and strain rate of the left and right ventricle. LV: left ventricular; RV: right ventricular. Baseline Follow-up Mean Δ p-value LV longitudinal Strain (%) ± ± ± Strain rate (%/s) ± ± ± LV radial Strain (%) 38.3 ± ± ± Strain rate (%/s) 1.64 ± ± ± LV circumferential Strain (%) ± ± ± Strain rate (%/s) ± ± ± RV longitudinal Strain (%) ± ± ± Strain rate (%/s) ± ± ±
129 Chapter 7 of age (n=27), were compared to patients who were 35 years or older (n=23). The changes in strain during follow-up were then compared between both age groups, as depicted in Figure 2. In the patients who were younger than 35 years of age at the baseline evaluation, similar strain and strain rate values were observed at baseline and at follow-up. Analogously, no changes in strain and strain rate values were observed in the patients who were 35 years or older during the baseline evaluation. Strain LV longitudinal strain (%) Baseline Baseline Follow-up Follow-up LV radial strain (%) Baseline Baseline Follow-up Follow-up LV circumferential strain (%) Baseline Baseline Follow-up Follow-up RV longitudinal strain (%) Baseline Baseline Follow-up Follow-up Strain rate LV longitudinal Sr (%/s) LV radial Sr (%/s) LV circumferential Sr (%/s) RV longitudinal Sr (%/s) Baseline Baseline Follow-up Follow-up 0.0 Baseline Baseline Follow-up Follow-up -1.6 Baseline Baseline Follow-up Follow-up -2.4 Baseline Baseline Follow-up Follow-up < 35 years 35 years Figure 2. Left and right ventricular strain and strain rate stratified by age at baseline. Means and standard deviations of the strain and strain rate values in the Marfan patients at baseline and at follow-up. Patients <35 years at baseline are represented by the grey boxes with dashed connecting lines, whereas the patients 35 years during the baseline evaluation are represented by the black triangles with uninterrupted connecting lines. There was no difference in strain and strain rate values between patients who were <35 years and patients 35 years during the baseline evaluation. In addition, no significant changes were observed during follow-up. LV: left ventricular; RV: right ventricular; Sr: strain rate. Discussion In the current study, LV and RV performance was followed in a population of Marfan patients without significant valvular disease, using novel and conventional echocardiographic tools. The key findings were that patients with Marfan syndrome have impaired biventricular longitudinal strain and strain rate values although RV and LV ejection fraction were preserved; in addition, none of the occurring cardiovascular events was related to ventricular performance in this selected cohort of patients with Marfan syndrome; Finally, the increase in vascular diameters during follow-up did not impact negatively on LV and RV performance that remained unchanged. 128
130 BIVENTRICULAR PERFORMANCE IN MARFAN SYNDROME Assessment of LV and RV performance in Marfan syndrome The Marfan associated mutations in the fibrillin-1 gene 7 and alterations in transforming growth factor β-signaling pathways 19 ensue in a deterioration of the cardiac connective tissue integrity. These abnormalities have been previously associated with impairment of LV and RV performance in Marfan syndrome 6;20 and it is advocated in the guidelines to screen for ventricular dysfunction periodically in patients with Marfan syndrome. 21 To date, the two studies that prospectively followed LV performance in Marfan patients without significant valvular regurgitation demonstrated no significant changes in LV function over time. In the first study, by Chatrath et al., it was demonstrated in a small population of 36 children and adults with Marfan syndrome, that the left ventricle did not change in size during follow-up. 22 In a far larger study, by Meijboom et al., which included 234 adult Marfan patients, it was shown that LV diameters and fractional shortening did not change. 8 The present study confirmed that LV volumes and ejection fraction did not change during a median follow-up duration of 4 years. In addition, LV diastolic function, assessed with LV inflow characteristics and tissue velocities, did not demonstrate any changes during followup. Furthermore, the present study demonstrated that RV diameters and function remained unchanged during follow-up. This indicates that conventional assessment of both LV and RV function does not reveal any relevant changes during a median follow-up of 4 years. Nonetheless, until now, it remained unknown whether the assessment of myocardial tissue properties with novel echocardiographic techniques demonstrates significant changes in LV and RV performance in Marfan patients during follow-up. Therefore, longitudinal follow-up of novel echocardiographic indices of ventricular performance, based on speckle trackingderived strain and strain rate, were analyzed for the first time in the current Marfan population. These analyses demonstrated that LV and RV performance did not change in the study population and further stratification of the population into older and younger patients, could also not reveal any relevant changes in ventricular performance during follow-up. Ventricular performance and clinical outcome in Marfan syndrome A significant difference in LV and RV performance was observed between Marfan patients and a population of healthy controls in the current study. Peak LV and RV strain and strain rate values were significantly lower in Marfan patients, which confirms the findings from previous studies. 5;6 However, as heart failure symptoms are uncommon in Marfan patients, the clinical relevance of this difference depends on potential progressiveness of ventricular dysfunction and on the incidence of ventricular dysfunction-related events. Previous studies that aimed to evaluate the natural history of ventricular function in Marfan syndrome did not provide information on the incidence of ventricular dysfunction-related events. In the cur- 129
131 Chapter 7 rent population, adverse cardiovascular events occurred in 7 patients. None of these events (AV nodal reentrant tachycardia, atrial fibrillation and proximal aorta complications) is known to be related to the presence of ventricular dysfunction in Marfan patients. 23 In addition, no episodes of symptomatic heart failure were observed in the current analysis. Therefore, it could be postulated that the observed difference in ventricular strain values between normal controls and Marfan patients did not demonstrate to be clinically relevant in terms of progressive ventricular deterioration or patient outcome. The results of the Cox s regression analysis in the present evaluation confirmed that there is no relation between ventricular performance and clinical outcome. Numerous studies have shown that dilatation of the aorta and pulmonary artery is one of the key aspects of the cardiovascular phenotype of patients with Marfan syndrome. 24;25 Progressive widening of, specifically, the proximal aorta is a regular phenomenon, which causes most of the cardiovascular complications of the disease. 26 In the current study, widening of the aorta and pulmonary artery was also observed. In addition, most of the events that occurred during follow-up were related to the proximal aorta. This underscores that the progressive nature of the disease was present in the currently evaluated patient population. Progressive impairment of ventricular performance, on the other hand, could not be demonstrated in the study population, which was free of significant valvular disease. This may indicate that, in contrast with the vascular phenotype of Marfan syndrome, ventricular dysfunction does not have a strongly progressive nature. Possibly, another cardiac stressor besides the presence of Marfan syndrome is required to evoke deterioration of ventricular function in Marfan patients. E.g., the presence of significant valvular regurgitation may be crucial to induce overt ventricular dysfunction. This concept is underscored by animal studies in which the function of fibrillin-1 was investigated. In this study on rats, fibrillin-1 expression was specifically enhanced when myocardial stress was induced, indicating that a lack of fibrillin-1 function may not become apparent under normal, physiological conditions. 27 Although the present study does not demonstrate progressive ventricular dysfunction, measured with biventricular strain and strainrate, careful follow-up is warranted in Marfan patients. Since strain and strainrate measurement provide a sensitive technique to detect subtle changes in ventricular performance, regular assessment of these measurements over a longer follow-up period could be useful. This, however, needs to be confirmed in future studies. Limitations In the current study, patients with other conditions besides Marfan syndrome were excluded from the analysis, since the study was aimed at investigating Marfan-related deterioration of ventricular performance only. Potentially, this may have led to a selection-bias towards inclusion of patients with a mild cardiovascular phenotype. It could be postulated that moderate 130
132 BIVENTRICULAR PERFORMANCE IN MARFAN SYNDROME valvular disease in patients with Marfan syndrome may lead to more rapid deterioration of ventricular function as compared to controls. Such observations cannot be made from the current study population. To address this point, future studies should also include Marfan patients with variable forms of valvular and non-valvular cardiac disease. In addition, most of the patients used cardioprotective medication such as beta-blockers, angiotensin converting enzyme inhibitors or angiotensin receptor blockers. Long-term use of these medications may prevent ventricular deterioration in patients with Marfan syndrome. However, since the number of patients without medication was low, the effect on ventricular function could not be assessed separately. Furthermore, it would be interesting to assess whether any association exists between the type of fibrillin-1 or transforming growth factor β 2 receptor mutation and bi-ventricular strain patterns. Since a large variety of Marfan associated mutations exists, the current patient population was regarded too small to evaluate such a relationship. In the current evaluation, 2D speckle tracking was used to assess biventricular strain and strain rate. For reliable analysis, sufficient image quality and frame rate is required. In the current population, speckle tracking analysis could be performed in all patients. It should however be noted that this may not be possible in patients with extensive thoracic deformities. Conclusion In our study, patients with Marfan syndrome had significantly lower mean peak left and right ventricular strain and strain rate values as compared to healthy control subjects. However, most events that occur during follow-up do not appear to be related to ventricular dysfunction and there is no association between the incidence of adverse outcome and reduced ventricular strain and strain rate. In addition, despite progressive dilatation of the aorta and pulmonary artery, no relevant changes in left and right ventricular performance occur during mid-term follow-up of patients with Marfan syndrome in whom significant valvular disease is absent at baseline. Disclosures Roderick WC Scherptong is supported by an unrestricted educational grant of Actelion Pharmaceuticals Nederland BV. Jeroen J Bax receives research grants from Medtronic, Biotronik, Boston Scientific, BMS medical imaging, St. Jude Medical, Edwards Life Sciences and GE Healthcare 131
133 Chapter 7 References 1. Dietz HC, Cutting GR, Pyeritz RE, Maslen CL, Sakai LY, Corson GM, et al. Marfan syndrome caused by a recurrent de novo missense mutation in the fibrillin gene. Nature 1991; 352: De Paepe A, Devereux RB, Dietz HC, Hennekam RC, Pyeritz RE. Revised diagnostic criteria for the Marfan syndrome. Am J Med Genet 1996; 62: De Backer JF, Devos D, Segers P, Matthys D, Francois K, Gillebert TC, et al. Primary impairment of left ventricular function in Marfan syndrome. Int J Cardiol 2006; 112: Das BB, Taylor AL, Yetman AT. Left ventricular diastolic dysfunction in children and young adults with Marfan syndrome. Pediatr Cardiol 2006; 27: Kiotsekoglou A, Bajpai A, Bijnens BH, Kapetanakis V, Athanassopoulos G, Moggridge JC, et al. Early impairment of left ventricular long-axis systolic function demonstrated by reduced atrioventricular plane displacement in patients with Marfan syndrome. Eur J Echocardiogr 2008; 9: Kiotsekoglou A, Sutherland GR, Moggridge JC, Kapetanakis V, Bajpai A, Bunce N, et al. Impaired right ventricular systolic function demonstrated by reduced atrioventricular plane displacement in adults with Marfan syndrome. Eur J Echocardiogr 2009; 10: Kiotsekoglou A, Sutherland GR, Moggridge JC, Nassiri DK, Camm AJ, Child AH. The unravelling of primary myocardial impairment in Marfan syndrome by modern echocardiography. Heart 2009; 95: Meijboom LJ, Timmermans J, van Tintelen JP, Nollen GJ, De Backer JF, van den Berg MP, et al. Evaluation of left ventricular dimensions and function in Marfan s syndrome without significant valvular regurgitation. Am J Cardiol 2005; 95: Leitman M, Lysyansky P, Sidenko S, Shir V, Peleg E, Binenbaum M, et al. Two-dimensional strain-a novel software for real-time quantitative echocardiographic assessment of myocardial function. J Am Soc Echocardiogr 2004; 17: Dietz HC, Pyeritz RE. Mutations in the human gene for fibrillin-1 (FBN1) in the Marfan syndrome and related disorders. Hum Mol Genet 1995; 4 Spec No: Lang RM, Bierig M, Devereux RB, Flachskampf FA, Foster E, Pellikka PA, et al. Recommendations for chamber quantification. Eur J Echocardiogr 2006; 7: Baumgartner H, Hung J, Bermejo J, Chambers JB, Evangelista A, Griffin BP, et al. Echocardiographic assessment of valve stenosis: EAE/ASE recommendations for clinical practice. J Am Soc Echocardiogr 2009; 22: Zoghbi WA, Enriquez-Sarano M, Foster E, Grayburn PA, Kraft CD, Levine RA, et al. Recommendations for evaluation of the severity of native valvular regurgitation with two-dimensional and Doppler echocardiography. J Am Soc Echocardiogr 2003; 16: Mosteller RD. Simplified calculation of body-surface area. N Engl J Med 1987; 317: Nagueh SF, Appleton CP, Gillebert TC, Marino PN, Oh JK, Smiseth OA, et al. Recommendations for the evaluation of left ventricular diastolic function by echocardiography. J Am Soc Echocardiogr 2009; 22: Kaul S, Tei C, Hopkins JM, Shah PM. Assessment of right ventricular function using two-dimensional echocardiography. Am Heart J 1984; 107: Marwick TH, Leano RL, Brown J, Sun JP, Hoffmann R, Lysyansky P, et al. Myocardial strain measurement with 2-dimensional speckle-tracking echocardiography: definition of normal range. JACC Cardiovasc Imaging 2009; 2:
134 BIVENTRICULAR PERFORMANCE IN MARFAN SYNDROME 18. Scherptong RW, Mollema SA, Blom NA, Kroft LJ, de RA, Vliegen HW, et al. Right ventricular peak systolic longitudinal strain is a sensitive marker for right ventricular deterioration in adult patients with tetralogy of Fallot. Int J Cardiovasc Imaging 2009; 25: Habashi JP, Judge DP, Holm TM, Cohn RD, Loeys BL, Cooper TK, et al. Losartan, an AT1 antagonist, prevents aortic aneurysm in a mouse model of Marfan syndrome. Science 2006; 312: Rybczynski M, Koschyk DH, Aydin MA, Robinson PN, Brinken T, Franzen O, et al. Tissue Doppler imaging identifies myocardial dysfunction in adults with Marfan syndrome. Clin Cardiol 2007; 30: Ades L. Guidelines for the diagnosis and management of Marfan syndrome. Heart Lung Circ 2007; 16: Chatrath R, Beauchesne LM, Connolly HM, Michels VV, Driscoll DJ. Left ventricular function in the Marfan syndrome without significant valvular regurgitation. Am J Cardiol 2003; 91: Yetman AT, Bornemeier RA, McCrindle BW. Long-term outcome in patients with Marfan syndrome: is aortic dissection the only cause of sudden death? J Am Coll Cardiol 2003; 41: Ates M. When should we replace the ascending aorta in Marfan syndrome? Eur J Cardiothorac Surg 2007; 31: Meijboom LJ, Timmermans J, Zwinderman AH, Engelfriet PM, Mulder BJ. Aortic root growth in men and women with the Marfan s syndrome. Am J Cardiol 2005; 96: Westaby S. Aortic dissection in Marfan s syndrome. Ann Thorac Surg 1999; 67: Bouzeghrane F, Reinhardt DP, Reudelhuber TL, Thibault G. Enhanced expression of fibrillin-1, a constituent of the myocardial extracellular matrix in fibrosis. Am J Physiol Heart Circ Physiol 2005; 289: H982-H
135 Chapter 7 Supplemental Table 1. Vascular diameters and conventional measures of ventricular function in Marfan patients as compared to controls. Vascular diameters Marfan Controls p-value Annulus (cm) 2.5 ± ± 0.2 <0.01 Sinus Valsalva (cm) 3.8 ± ± 0.4 <0.01 ST junction (cm) 3.1 ± ± 0.2 <0.01 Pulmonary artery (cm) 2.4 ± ± 0.2 <0.01 LV systolic function LV EDV (ml) 128 ± ± LV EDV index (ml/m2) 64 ± ± LV ESV (ml) 48 ± ± LV ESV index (ml/m2) 24 ± 9 22 ± LV EF (%) 63 ± 6 64 ± LV Diastolic function E (m/s) 0.73 ± ± A (m/s) 0.54 ± ± E/A 1.41 ± ± E (m/s) 0.09 ± ± 0.03 <0.01 E/E 8.56 ± ± 1.6 <0.01 RV systolic function RVD 1 (cm) 2.7 ± 0.3 <0.01 RVD 2 (cm) 3.1 ± 0.2 <0.01 RVD 3 (cm) 7.3 ± RVFAC (%) 42 ± TAPSE (cm) 2.4 ± 0.3 <0.01 Asc: ascending; EDV: end diastolic volume; EF: ejection fraction; ESV: end systolic volume; LV: left ventricular; RVD 1: tricuspid annulus diameter; RVD 2: mid right ventricular diameter; RVD 3: base-to-apex diameter; RVFAC: right ventricular fractional area change; ST: sino-tubular; TAPSE: tricuspid annular plane systolic excursion. 134
136 Chapter 8 Prognostic Value of Right Ventricular Function in Patients after Acute Myocardial Infarction Treated with Primary Percutaneous Coronary Intervention M Louisa Antoni Roderick WC Scherptong Jael Z Atary Eric Boersma Eduard R Holman Ernst E van der Wall Martin J Schalij Jeroen J Bax Circ Cardiovasc Imaging May;3(3):
137 Chapter 8 Abstract Background Data on the association between right ventricular (RV) function and adverse events after acute myocardial infarction (AMI) are scarce. The purpose of the current study was to evaluate the relation between RV function and adverse events, in patients treated with primary percutaneous coronary intervention (PCI) for AMI. Methods and Results Consecutive patients admitted with AMI treated with primary PCI underwent echocardiography within 48 hours of admission to assess left ventricular and RV function. RV function was quantified with RV fractional area change (RVFAC), tricuspid annular plane systolic excursion (TAPSE) and RV strain. The endpoint was defined as a composite of all-cause mortality, reinfarction and hospitalization for heart failure. All patients (n=621) were followed prospectively and during a mean follow-up of 24 months, 86 patients reached the composite endpoint. RVFAC, TAPSE and RV strain were all univariable predictors of worse outcome. After multivariable analysis, only RVFAC (HR 0.96, 95%CI ) and RV strain (HR 1.08, 95%CI ) independently predicted the composite endpoint. In addition, RV strain provided incremental value to clinical information, infarct characteristics, left ventricular function and RVFAC. Conclusions RV function provides strong prognostic information in patients treated with primary PCI for AMI. 136
138 RIGHT VENTRICULAR FUNCTION AFTER MYOCARDIAL INFARCTION Introduction The prognosis of patients after acute myocardial infarction (AMI) is determined by the interaction of a large number of factors. Besides the importance of clinical parameters, several studies have described the use of two-dimensional (2D) echocardiography for the identification of patients who are at risk of adverse outcome. 1 These investigations revealed that the presence of left ventricular (LV) dysfunction, on 2D-echocardiography shortly post-ami, is one of the most important prognostic parameters. 2, 3 Therefore, noninvasive assessment of LV function has become essential for post-ami risk stratification. The relevance of right ventricular (RV) function, on the other hand, is poorly defined in post-ami patients. The involvement of the RV during inferior AMI has been defined as a strong predictor of major complications and in-hospital mortality. 4, 5 Some evidence is available that RV dysfunction is associated with an adverse prognosis in post-ami patients with moderate to severe LV dysfunction. 6, 7 In patients who undergo primary percutaneous coronary intervention (PCI), however, the degree of LV dysfunction is generally mild and the clinical relevance of RV dysfunction in that currently growing population of post-ami patients is unknown. Therefore, the aim of the current study was to investigate the relation between RV function and adverse events, in post-ami patients treated with primary PCI. In addition to traditional measurements that are recommended to quantify RV function with 2D-echocardiography, RV strain was assessed. This novel technique enables direct quantification of myocardial deformation and is a sensitive tool to detect RV dysfunction Methods Patient Selection and Study Protocol Since February 2004, consecutive patients admitted with AMI, treated with primary PCI were included in an ongoing registry. All patients were treated according to the institutional AMI protocol, which is driven by the most recent guidelines. 1 This protocol, designed to improve care around AMI, includes structurized medical therapy and outpatient follow-up, as described previously. 12 In addition, 2D-echocardiography is performed within 48 hours of admission. This echocardiogram was used to assess LV and RV function. All patients were followed prospectively and the occurrence of adverse events was noted. Patients of whom more than 6 months follow-up data were lacking, were considered as lost to follow-up, and excluded from further analysis. 137
139 Chapter 8 Echocardiography Images were obtained with patients in the left lateral decubitus position using a commercially available system (Vivid 7, General Electric-Vingmed, Horton, Norway). Data acquisition was performed at a depth of 16cm in parasternal and apical views using a 3.5-MHz transducer. During breath hold, M-mode and 2D-images were obtained and 3 consecutive beats were saved in cine-loop format. Analysis was performed offline by 2 independent observers using dedicated software (EchoPac version , General Electric-Vingmed). The reference limits of all echocardiographic parameters were defined according to the American Society of Echocardiography s Guidelines. 13 The LV end-systolic volume (LVESV), end-diastolic volume (LVEDV) were assessed and LV ejection fraction (LVEF) was calculated using the biplane Simpson s method. 13 In addition, the LV was divided into 16 segments and each segment was analyzed individually and scored based on its motion and systolic thickening (1=normokinesis, 2=hypokinesis, 3=akinesis, 4=dyskinesis). Subsequently, wall motion score index (WMSI) was calculated as the sum of the segment scores divided by the number of segments scored. 13 Left atrial (LA) size was quantified by calculating the volume according to the ellipsoid model. 13 Severity of mitral regurgitation (MR) was graded semiquantitatively from the jet area of color-flow Doppler data and by measuring the width of the vena contracta. MR was characterized as: mild=jet area/la area < 20% and vena contracta width < 0.3 cm, moderate=jet area/la area 20% to 40% and vena contracta width cm, and severe=jet area/la area > 40% and vena contracta width 0.7 cm. 14 Tricuspid regurgitation (TR) severity was graded based on jet/right atrial area ratio. When the jet area occupied < 10% of the right atrial area, TR was graded as trivial, when it occupied 10% to < 20% as mild, when it occupied 20% to < 33% as moderate, and when it occupied 33% as severe. 15 In addition, the diameter of inferior vena cava and its respiratory variation were measured cm from the junction with the right atrium in the subcostal view, as recommended by the guidelines. 13 To assess diastolic function, pulsed-wave Doppler of the mitral valve inflow was obtained by placing the sample volume between the tips of the mitral leaflets. Peak early (E) and late (A) diastolic velocities and deceleration time (DT) were measured. The E/E -ratio was obtained by dividing E by E, which was measured using color-coded tissue Doppler imaging at the septal side of the mitral annulus in the apical 4-chamber view Right Ventricular Function Analysis RV fractional area change (RVFAC) was analyzed by tracing the RV end-diastolic area (RVDA) and end-systolic area (RVSA) in the apical 4-chamber view using the formula: (RVDA RVSA)/ 138
140 RIGHT VENTRICULAR FUNCTION AFTER MYOCARDIAL INFARCTION RVDA Tricuspid annular plane systolic excursion (TAPSE) was measured in the RV free wall. In the 4-chamber view, the M-mode cursor was placed through the tricuspid annulus in such a way that the annulus moved along the M-mode cursor and the total displacement of the RV base from end-diastole to end-systole was measured. 19 Peak systolic longitudinal strain of the RV free wall was measured in the 4-chamber view using speckle-tracking analysis. 20 This novel software analyzes motion by tracking frame-toframe movement of natural acoustic markers in 2 dimensions. All images were recorded with a frame rate of > 40fps for reliable analysis. The RV endocardial border was manually traced at end-systole and the automatically created region of interest was adjusted to the thickness of the myocardium. Peak systolic longitudinal strain was determined in the 3 segments of the RV free wall (basal, mid and apical) and RV strain was calculated as the mean value of all segments. Segments were discarded if tracking was of poor quality. Strain analysis was feasible in 85% of segments. Statistical Analysis Continuous data are presented as mean±standard deviation and categorical data are presented as frequencies and percentages. Differences in characteristics between patient groups were evaluated using the unpaired Student s t-test and chi-square test. The primary aim was to assess the association between RV function and adverse events after adjusting for clinical and echocardiographic covariates. Separate multivariable models were constructed for RVFAC, TAPSE and RV strain using Cox proportional hazards analysis to evaluate the individual prognostic importance of the different RV function measurements. Selection of parameters for consideration for entry in the multivariable models was based both on clinical judgment and univariable statistical significance. Based on these considerations, adjustments in the multivariable models were made for age, Killip class 2, right coronary artery (RCA) as culprit vessel, multivessel disease, peak cardiac troponin T (ctnt) level, LVEF, WMSI, E/E -ratio and moderate or severe MR. Peak creatine phosphokinase level and LVESV were not included in multivariable analyses to avoid co-linearity with peak ctnt level and LVEF. In addition, multiple variable analysis was performed for all events individually. Nonfatal reinfarction was defined based on criteria of typical chest pain, elevated cardiac enzyme levels, and typical changes on the electrocardiogram. 21 Hospitalization for heart failure (HF) was defined as hospitalization for new onset or worsening HF. As only a small number of 29 patients reached the endpoint of HF, no further subdivision was made for the cause of HF. To further investigate the clinical relevance of RV dysfunction, the population was stratified into 2 groups according to RV function. For RVFAC and TAPSE, cut-offs were defined according to the guidelines; 32% and 1.5 cm, respectively. 13 The normal value of RV strain has been 139
141 Chapter 8 reported to be -29.3±3.6%. 22 Patients were therefore divided according to the mean value plus 2SDs, which is the lower limit of normal RV strain (-22.1%). Event rates were plotted in Kaplan-Meier curves for the composite endpoint and the study population divided by the previously mentioned cut-offs, and groups were compared using the log-rank test. The date of last contact for patients without events was used in Kaplan-Meier analysis. Finally, univariable and multivariable Cox proportional hazards analyses were performed for RVFAC, TAPSE and RV strain, dichotomized by the cut-offs. The incremental value of RV function in addition to known risk factors for adverse outcome (age, Killip class 2, RCA as culprit vessel, multivessel disease, peak ctnt level, LVEF, WMSI, E/E -ratio and moderate or severe MR), was established. For this purpose, those characteristics were entered in the Cox proportional hazard model in a stepwise fashion. Subsequently, RVFAC and RV strain were entered individually. In addition, RV strain was entered into the model of RVFAC, to test further incremental value. Global chi-square values including significance levels were calculated. All statistical tests were two-sided, and a P value <0.05 was considered statistically significant. Results Patient Characteristics and Follow-Up A total of 682 patients were included. Nine (1.3%) patients died before echocardiographic assessment could be performed, and in 22 (3.2%) patients echocardiographic assessment was not available within 48 hours of admission due to logistic reasons. Thirty patients (4.4%) were lost to follow-up and were excluded from further analysis. The study population consisted of the remaining 621 consecutive patients admitted with AMI treated with primary PCI. Tables 1 and 2 summarize the clinical and echocardiographic characteristics of the population. Mean age was 60±12 years and most patients were men (78%). Mean LVEF, RVFAC, TAPSE and RV strain were 45±8%, 37±9% and 1.7±0.2 cm and -22±7%, respectively. Fifty-seven patients (10%) presented with congestive HF defined as Killip class 2. Patients with congestive HF had significantly lower TAPSE (1.6±0.2 cm vs. 1.7±0.2 cm, P=0.01) and RV strain (-19±6% vs. -22±7%, P=0.02). No differences were observed in RVFAC and patients with and without congestive HF (37±10% vs. 37±9%, P=0.71). The RCA was the culprit vessel in 217 patients (35%). No differences in RVFAC (36±9% vs. 38±9%, P=0.07), TAPSE (1.7±0.2 cm vs. 1.7±0.2 cm, P=0.28) and RV strain (-21±7% vs. -22±7%, P=0.38) were observed in patients with and without inferior AMI. LV dysfunction (defined as LVEF < 40%) was observed in 151 patients (24%). When comparing RV function in patients with and without LV dysfunction, no significant differences were 140
142 RIGHT VENTRICULAR FUNCTION AFTER MYOCARDIAL INFARCTION Table 1. Baseline clinical characteristics. All Patients (n=621) Event (n=86) Event-free (n=535) P (Event vs. event-free) Age (years) 60±12 65±14 60± Male gender 486 (78%) 67 (78%) 419 (78%) 0.93 Killip class 2 57 (10%) 26 (33%) 31 (6%) <0.001 Current smoking 313 (51%) 42 (49%) 271 (51%) 0.83 Diabetes 61 (10%) 14 (16%) 47 (9%) 0.03 Family history of CAD 253 (41%) 28 (33%) 225 (42%) 0.11 Hyperlipidemia 125 (20%) 19 (22%) 106 (20%) 0.64 Hypertension 190 (31%) 34 (40%) 156 (29%) 0.05 Prior myocardial infarction 45 (7%) 13 (15%) 32 (6%) RCA culprit vessel 217 (35%) 22 (26%) 195 (36%) 0.05 Multivessel disease 300 (49%) 53 (63%) 247 (46%) TIMI flow (1%) 2 (2%) 3 (1%) 2 28 (5%) 6 (7%) 22 (4%) (95%) 78 (91%) 510 (95%) Peak CPK level (U/l) 2508± ± ±1815 <0.001 Peak ctnt level (μg/l) 7.1± ± ±5.5 <0.001 Medication at 6-months follow-up ACE inhibitor/arb 575 (98%) 55 (98%) 520 (98%) 0.82 Antiplatelets 588 (100%) 56 (100%) 532 (100%) 1.00 Beta-blocker 538 (92%) 52 (93%) 486 (91%) 0.70 Statin 578 (98%) 55 (98%) 523 (98%) 0.96 ACE: angiotensin-converting enzyme; ARB: angiotensin receptor blocker; CAD: coronary artery disease; CPK: creatine phosphokinase; ctnt: cardiac troponin T; RCA: right coronary artery; TIMI: thrombolysis in myocardial infarction. observed in RVFAC (37±9% vs. 38±9%, P=0.31) and RV strain (-21±7% vs. -22±7%, P=0.09). However, TAPSE was significantly lower in patients with LV dysfunction compared to patients without LV dysfunction (1.6±0.2 cm vs. 1.7±0.2 cm, P=0.02). TAPSE was the only RV function measurement that differed significantly in patients with multivessel disease compared to patients without multivessel disease (1.6±0.2 cm vs. 1.7±0.2, P=0.03). During a mean follow-up of 24±15 months, 86 patients (14%) reached the composite endpoint: 51 patients died (8%), 16 patients (3%) had a nonfatal reinfarction and 29 patients (5%) were hospitalized for HF. Differences in clinical and echocardiographic characteristics between patients who reached the composite endpoint and patients who remained eventfree are shown in Tables 1 and
143 Chapter 8 Table 2. Baseline echocardiographic characteristics. All Patients (n=621) Event (n=86) Event-free (n=535) P (Event vs. event-free) LVESV (ml) 58±22 67±32 56± LVEDV (ml) 105±34 111±43 104± Left ventricular ejection fraction (%) 45±8 41±9 46±8 <0.001 Wall motion score index 1.5± ± ±0.3 <0.001 E/A-ratio 1.0± ± ± Deceleration time (ms) 211±74 199±68 213± E/E -ratio 13±6 15±8 13± Moderate or severe MR 44 (7%) 14 (17%) 30 (6%) <0.001 Moderate or severe PR 2 (0.3%) 0 (0%) 2 (0.4%) 0.60 Moderate or severe TR 24 (4%) 5 (7%) 19 (4%) 0.17 Left atrial volume index (ml/m2) 16±6 17±6 16± Right ventricular diastolic area (cm2) 15±4 17±5 15± Right ventricular systolic area (cm2) 10±4 11±4 9±3 <0.001 RVFAC (%) 37±9 33±8 38±9 <0.001 TAPSE 1.7± ± ± Right ventricular strain (%) -22±7-17±7-22±7 <0.001 E/A: mitral inflow peak early velocity(e)/mitral inflow peak late velocity(a); E/E : mitral inflow peak early velocity(e)/mitral annular peak early velocity(e ); LVEDV: left ventricular end-diastolic volume; LVESV: left ventricular end-systolic volume; MR: mitral regurgitation; PR: pulmonary regurgitation; RVFAC: right ventricular fractional area change; TAPSE: tricuspid annular plane systolic excursion; TR: tricuspid regurgitation. Right Ventricular Function and Association With Outcome Table 3 shows the significant univariable predictors of the composite endpoint. In addition to clinical characteristics and echocardiographic measurements of LV function, RV function significantly predicted worse outcome. RVFAC, TAPSE and RV strain were univariable predictors of the composite endpoint. After adjusting RVFAC, TAPSE and RV strain for other variables that predicted adverse outcome, RVFAC and RV strain independently predicted the occurrence of the composite endpoint (Tables 4 and 5). However, TAPSE did not remain significant in the multiple variable analysis (HR 0.88, 95%CI , P=0.88). In addition, analysis was performed for RVFAC, TAPSE and RV strain dichotomized according to normal and abnormal RV function with the above described cut-offs. Univariable analysis performed with the cut-offs demonstrated a HR of 2.22 (95%CI , P=0.001) for RVFAC. For TAPSE and RV strain, HRs of 4.00 (95%CI , P<0.001) and 3.43 (95%CI , P<0.001) were observed, demonstrating better discriminative power than RVFAC. Multiple variable analysis performed with the cut-offs showed smaller HRs of 1.97 (95%CI , P=0.02) for RVFAC, 2.19 (95%CI , P=0.02) for TAPSE and 2.18 (95%CI , P=0.03) for RV strain. Kaplan-Meier curves for the cut-offs of RVFAC, TAPSE and RV strain and the composite endpoint are shown in Figure 1. The 4-year event rate in patients with RVFAC < 32% (n=145) was 142
144 RIGHT VENTRICULAR FUNCTION AFTER MYOCARDIAL INFARCTION Table 3. Cox univariable predictors for the composite endpoint. Hazard Ratio 95%CI P Age (per 1-year increase) <0.001 Killip class 2 (yes/no) <0.001 Prior myocardial infarction (yes/no) Multivessel disease (yes/no) Peak creatine phosphokinase level (per 100-U/l increase) <0.001 Peak cardiac troponin T level (per 1-μg/l increase) <0.001 Left ventricular end-systolic volume (per 5-ml increase) Left ventricular ejection fraction (per 1% increase) <0.001 Wall motion score index (per 1-unit increase) <0.001 E/A-ratio (per 1-unit increase) E/E -ratio (per 1-unit increase) Moderate or severe mitral regurgitation (yes/no) <0.001 RVFAC (per 1% increase) <0.001 RVFAC < 32% (yes/no) TAPSE (per 1-cm increase) TAPSE < 1.5 cm (yes/no) <0.001 Right ventricular strain (per 1% increase) <0.001 Right ventricular strain < -22.1% (yes/no) <0.001 E/A: mitral inflow peak early velocity (E)/mitral inflow peak late velocity (A); E/E : mitral inflow peak early velocity(e)/mitral annular peak early velocity (E ); RVFAC: right ventricular fractional area change; TAPSE: tricuspid annular plane systolic excursion. Table 4. Cox multivariable model with right ventricular fractional area change for the composite endpoint. Hazard Ratio 95%CI P Killip class 2 (yes/no) Multivessel disease (yes/no) Peak cardiac troponin T level (per 1-μg/l increase) Left ventricular ejection fraction (per 1% increase) Right ventricular fractional area change (per 1% increase) Table 5. Cox multivariable model with right ventricular strain for the composite endpoint. Hazard Ratio 95%CI P Killip class 2 (yes/no) Multivessel disease (yes/no) Peak cardiac troponin T level (per 1-μg/l increase) Left ventricular ejection fraction (per 1% increase) Right ventricular strain (per 1% increase) % compared to 16% in patients with RVFAC 32% (n=454, P=0.01). The incidence of adverse events at 4 years was 45% in patients with TAPSE < 1.5 cm (n=180) and 9% in patients with TAPSE 1.5 cm (n=411, P<0.001). Patients divided in RV strain < -22.1% (n=256) and -22.1% (n=273) demonstrated a 4-year event rate at of 23% and 7%, respectively (P<0.001). With the exception of nonfatal reinfarction, multiple variable analysis showed that RVFAC and RV strain were independent predictors of all events. RVFAC demonstrated HRs of
145 Chapter 8 Figure 1. Cumulative incidence of adverse events. Patients stratified by right ventricular fractional area change (panel A), tricuspid annular plane systolic excursion (panel B) and right ventricle strain (panel C). (95%CI , P=0.001) and 0.94 (95% CI , P=0.05), and RV strain HRs of 1.10 (95%CI , P=0.003) and 1.16 (95%CI , P=0.001) for all-cause mortality and hospitalization for HF, respectively. In addition, when early deaths (defined as deaths occurring during index hospitalization) were excluded from multiple variable analysis, RVFAC and RV strain remained independent predictors of all-cause mortality (HR 0.93, 95%CI , P=0.001 and HR 1.07, 95%CI , P=0.04, respectively). 144
146 RIGHT VENTRICULAR FUNCTION AFTER MYOCARDIAL INFARCTION The Incremental Value of Right Ventricular Function in Addition to Traditional Risk Factors Global chi-square scores were calculated to assess the incremental value of RV function. RV function quantified by RVFAC and RV strain provided incremental value to clinical information (age and Killip class 2), infarct characteristics (RCA as culprit vessel, multivessel disease and peak ctnt level) and LV systolic and diastolic function (LVEF, WMSI, E/E -ratio and moderate or severe MR). In addition, RV strain was added to the RVFAC-model, which demonstrated to increase the predictive power of the model even further (Figure 2). Interestingly, TAPSE, did not have incremental value in addition to clinical information, infarct characteristics and LV function. Figure 2. Incremental value of right ventricular function. Bar graph illustrating the incremental value of right ventricular function (depicted by chi-square value on the y axis). The addition of right ventricular fractional area change and right ventricular strain provides incremental value to known risk factors for adverse outcome, related to clinical information (age, Killip class 2), infarct characteristics (RCA as culprit vessel, multivessel disease, peak ctnt level) and LV function (LVEF, WMSI, E/E -ratio, moderate or severe MR). Discussion The major finding of the present study was that RVFAC, TAPSE and RV strain were strong predictors of the composite endpoint all-cause mortality, reinfarction and hospitalization for HF. In addition, the prognostic value of several traditional risk factors including Killip class, peak cardiac enzymes, multivessel disease and LV function, was again confirmed. After adjusting for known risk factors of adverse outcome after AMI, RVFAC (HR 0.96, 95%CI ) and RV strain (HR 1.08, 95%CI ) independently predicted the composite endpoint. In addition, the cut-off for RV strain at < -22.1% was associated with an adjusted HR of 2.18 for the occurrence of the composite end-point. Moreover, RV strain < -22.1% provided 145
147 Chapter 8 incremental value over clinical information, infarct characteristics, LV function and RVFAC for the prediction of adverse outcome in post-ami patients. However, RV function failed to provide prognostic information for the prediction of nonfatal reinfarction individually. Quantification of Right Ventricular Function Multiple methods have been described to quantify RV function with 2D-echocardiography. In clinical practice, qualitative assessment of RV function is usually performed, whether or not in combination with TAPSE or RVFAC. 13 Both measurements are simple to perform and associated with prognosis, particularly in patients with LV dysfunction after AMI. 6, 7, 19 In contrast to previous studies, the current study evaluated the importance of RV function in a large population of post-ami patients, treated with primary PCI and relatively preserved LV function. In addition to TAPSE and RVFAC, we assessed RV strain. Although RVFAC, TAPSE, and RV strain are highly correlated, they measure different aspects of RV function. RVFAC is the most commonly used measurement to assess RV contractility. However, the measurement of RVFAC is experience-dependent and reproducibility is often poor. Therefore, RVFAC may not adequately reflect contractility. TAPSE is another frequently used measurement to assess RV function and reflects the longitudinal systolic excursion of the lateral tricuspid valve annulus, which may not fully reflect RV contractility. Strain is a novel technique that enables angleindependent measurement of active myocardial deformation. Previous studies indicated that subtle but clinically relevant decreases in ventricular function can be detected using strain and we therefore hypothesized that this may also apply for subtle changes in RV function post-ami Peak RV longitudinal strain, which quantitates the maximal shortening in the RV free wall from apex to base, is likely to be a good estimator of RV function since 80% of the stroke volume is generated by longitudinal shortening of the RV free wall. 27 The results of the current study point out, for the first time, that reduced strain of the RV is a strong independent predictor of adverse events in post-ami patients. RV strain, even after correction for clinical information, infarct characteristics and LV function, demonstrated to be of incremental value in addition to RVFAC. In addition, RV strain may detect RV dysfunction earlier than RVFAC as the Kaplan-Meier estimates showed earlier divergence for RV strain than RVFAC (Figure 1). TAPSE has been found to correlate with LVEF, which is an important predictor of adverse outcome in AMI patients and thus may explain the earlier separation on the graphs. This indicates that RV strain may be superior to traditional measures of RV function, for the prediction of adverse events after AMI. 146
148 RIGHT VENTRICULAR FUNCTION AFTER MYOCARDIAL INFARCTION Right Ventricular Function and Outcome In the past, the clinical importance of RV function has been underestimated. Although RV dysfunction was reported to recover to some extent after AMI, recently the value of RV function for the prediction of long-term outcome has been well recognized in patients with inferior AMI and LV dysfunction. 28, 29 Mehta et al. showed in a meta-analysis that patients with RV involvement in inferior AMI were at increased risk of adverse events and demonstrated that RV involvement is not due to more extensive infarction of the LV. 30 In post-ami patients with LV dysfunction, Zornoff et al. and Anavekar et al. confirmed that RV function is weakly correlated with LV function and demonstrated that RV function quantified with RVFAC was independently associated with an increased risk of mortality and HF. 6, 7 In the current study, RV function was studied extensively with assessments currently used in clinical practice (TAPSE, RVFAC) and novel speckle-tracking derived strain. All measurements of the RV were related to adverse prognosis. After adjusting for other variables that predicted adverse outcome, RVFAC and RV strain independently predicted the occurrence of the composite endpoint (all-cause mortality, reinfarction and hospitalization for HF. TAPSE, on the other hand, was a strong univariate predictor of adverse events, but did not remain significant in multivariable analysis. The prognostic value of TAPSE in AMI patients was investigated by Samad et al. In 194 AMI patients TAPSE was an independent predictor of mortality after adjustment for LVEF and age. 19 However, in the GISSI-3 echo substudy which included 500 AMI patients, TAPSE was significantly associated with LVEF, which may explain why TAPSE did not provide incremental value to clinical information, infarct characteristics and LV function and why TAPSE was not an independent predictor of adverse outcome. 29 Right Ventricular Strain Although, strain was primarily developed for the measurement of LV deformation, previous reports have demonstrated the usefulness of RV strain in several populations to detect subtle changes in RV function Measurement of longitudinal strain of the RV is a reliable method for the assessment of RV function, since 80% of the stroke volume is generated by longitudinal shortening of the RV free wall. 27 To our best knowledge, this is the first study to examine the value of RV strain in post-ami patients. RV strain provided incremental value to traditional measurements of RV function and the quantification of RV strain is simple to perform and highly feasible. 147
149 Chapter 8 Clinical Implications The results of the current study suggest that routine assessment of RV function should be implemented in the follow-up of AMI patients. RV strain measured early after AMI appeared to be superior to RVFAC and TAPSE for the risk stratification of AMI patients and could facilitate in the identification of patients who are at risk for adverse events. Limitations RV infarction complicates about 50 percent of inferior AMI. ST-segment elevations and Q- waves in the right precordial leads have shown to have a high diagnostic accuracy for RV infarctions. Unfortunately, in the present study right precordial leads were not applied during electrocardiography, however, no significant differences RV function parameters were observed in patients with and without inferior infarction. For the current study, the cut-off for RV strain was chosen at 2SDs from the normal RV strain in a group of 60 healthy subjects. 22 Normal limits of RV strain, derived from larger populations are currently lacking. Therefore, future research should aim at defining normal limits for RV strain and validating these cut-offs in relation to clinical endpoints. Although, RV function at baseline was a good predictor of outcome in AMI patients, the predictive value of RV function at different periods after AMI could not be addressed. Changes in RV function could occur in the first weeks after AMI and serial assessment of RV function would be interesting. Conclusion RV function provides strong prognostic information in AMI patients treated with primary PCI. RV strain is an independent predictor of all-cause mortality, reinfarction and hospitalization for HF. In addition, RV strain provides incremental value over clinical information, infarct characteristics, LV function and RVFAC. Quantitative assessment of RV function with RV strain may improve the risk stratification of patients after AMI. Disclosures Dr Bax received grants from GE Healthcare, BMS medical imaging, St. Jude Medical, Medtronic, Boston Scientific, Biotronik and Edwards Lifesciences. Dr Schalij received grants from Boston Scientific, Medtronic and Biotronik. The other authors report no conflicts. 148
150 RIGHT VENTRICULAR FUNCTION AFTER MYOCARDIAL INFARCTION References 1. Antman EM, Anbe DT, et al. ACC/AHA guidelines for the management of patients with ST-elevation myocardial infarction--executive summary: a report of the American College of Cardiology/ American Heart Association Task Force on Practice Guidelines (Writing Committee to Revise the 1999 Guidelines for the Management of Patients With Acute Myocardial Infarction). Circulation 2004; 110: Moller JE, Hillis GS, et al. Wall motion score index and ejection fraction for risk stratification after acute myocardial infarction. Am Heart J 2006; 151: White HD, Norris RM, et al. Left ventricular end-systolic volume as the major determinant of survival after recovery from myocardial infarction. Circulation 1987; 76: Bueno H, Lopez-Palop R, et al. In-hospital outcome of elderly patients with acute inferior myocardial infarction and right ventricular involvement. Circulation 1997; 96: Zehender M, Kasper W, et al. Right ventricular infarction as an independent predictor of prognosis after acute inferior myocardial infarction. N Engl J Med 1993; 328: Anavekar NS, Skali H, et al. Usefulness of right ventricular fractional area change to predict death, heart failure, and stroke following myocardial infarction (from the VALIANT ECHO Study). Am J Cardiol 2008; 101: Zornoff LA, Skali H, et al. Right ventricular dysfunction and risk of heart failure and mortality after myocardial infarction. J Am Coll Cardiol 2002; 39: Amundsen BH, Helle-Valle T, et al. Noninvasive myocardial strain measurement by speckle tracking echocardiography: validation against sonomicrometry and tagged magnetic resonance imaging. J Am Coll Cardiol 2006; 47: Teske AJ, De Boeck BW, et al. Echocardiographic assessment of regional right ventricular function: a head-to-head comparison between 2-dimensional and tissue Doppler-derived strain analysis. J Am Soc Echocardiogr 2008; 21: Borges AC, Knebel F, et al. Right ventricular function assessed by two-dimensional strain and tissue Doppler echocardiography in patients with pulmonary arterial hypertension and effect of vasodilator therapy. Am J Cardiol 2006; 98: Scherptong RW, Mollema SA, et al. Right ventricular peak systolic longitudinal strain is a sensitive marker for right ventricular deterioration in adult patients with tetralogy of Fallot. Int J Cardiovasc Imaging 2009; 25: Liem SS, van der Hoeven BL, et al. MISSION!: optimization of acute and chronic care for patients with acute myocardial infarction. Am Heart J 2007; 153: Lang RM, Bierig M, et al. Recommendations for chamber quantification: a report from the American Society of Echocardiography s Guidelines and Standards Committee and the Chamber Quantification Writing Group, developed in conjunction with the European Association of Echocardiography, a branch of the European Society of Cardiology. J Am Soc Echocardiogr 2005; 18: Zoghbi WA, Enriquez-Sarano M, et al. Recommendations for evaluation of the severity of native valvular regurgitation with two-dimensional and Doppler echocardiography. J Am Soc Echocardiogr 2003; 16: Matsunaga A, Duran CM. Progression of tricuspid regurgitation after repaired functional ischemic mitral regurgitation. Circulation 2005; 112: I453-I
151 Chapter Naqvi TZ, Padmanabhan S, et al. Comparison of usefulness of left ventricular diastolic versus systolic function as a predictor of outcome following primary percutaneous coronary angioplasty for acute myocardial infarction. Am J Cardiol 2006; 97: Lester SJ, Tajik AJ, et al. Unlocking the mysteries of diastolic function: deciphering the Rosetta Stone 10 years later. J Am Coll Cardiol 2008; 51: Ommen SR, Nishimura RA, et al. Clinical utility of Doppler echocardiography and tissue Doppler imaging in the estimation of left ventricular filling pressures: A comparative simultaneous Doppler-catheterization study. Circulation 2000; 102: Samad BA, Alam M, et al. Prognostic impact of right ventricular involvement as assessed by tricuspid annular motion in patients with acute myocardial infarction. Am J Cardiol 2002; 90: Sutherland GR, Di SG, et al. Strain and strain rate imaging: a new clinical approach to quantifying regional myocardial function. J Am Soc Echocardiogr 2004; 17: Alpert JS, Thygesen K, et al. Myocardial infarction redefined--a consensus document of The Joint European Society of Cardiology/American College of Cardiology Committee for the redefinition of myocardial infarction. J Am Coll Cardiol 2000; 36: Teske AJ, Prakken NH, et al. Echocardiographic tissue deformation imaging of right ventricular systolic function in endurance athletes. Eur Heart J 2009; 30: Prakasa KR, Wang J, et al. Utility of tissue Doppler and strain echocardiography in arrhythmogenic right ventricular dysplasia/cardiomyopathy. Am J Cardiol 2007; 100: Borges AC, Knebel F, et al. Right ventricular function assessed by two-dimensional strain and tissue Doppler echocardiography in patients with pulmonary arterial hypertension and effect of vasodilator therapy. Am J Cardiol 2006; 98: Giusca S, Dambrauskaite V, et al. Deformation Imaging Describes RV Function Better than Longitudinal Displacement of the Tricuspid Ring (TAPSE). Heart Haddad F, Hunt SA, et al. Right ventricular function in cardiovascular disease, part I: Anatomy, physiology, aging, and functional assessment of the right ventricle. Circulation 2008; 117: Carlsson M, Ugander M, et al. The quantitative relationship between longitudinal and radial function in left, right, and total heart pumping in humans. Am J Physiol Heart Circ Physiol 2007; 293: H636-H Haddad F, Doyle R, et al. Right ventricular function in cardiovascular disease, part II: pathophysiology, clinical importance, and management of right ventricular failure. Circulation 2008; 117: Popescu BA, ntonini-canterin F, et al. Right ventricular functional recovery after acute myocardial infarction: relation with left ventricular function and interventricular septum motion. GISSI-3 echo substudy. Heart 2005; 91: Mehta SR, Eikelboom JW, et al. Impact of right ventricular involvement on mortality and morbidity in patients with inferior myocardial infarction. J Am Coll Cardiol 2001; 37:
152
153 PART III Right Ventricular ELECTROCARDIOGRAPHY
154
155
156 Chapter 9 Pulmonary Hypertension: The Role of the Electrocardiogram Ivo R Henkens Roderick WC Scherptong Klaas W van Kralingen Salah AM Said Hubert W Vliegen Neth Heart J Aug;16(7-8):250-4.
157 Chapter 9 Abstract A 54-year-old female was referred to our centre for further evaluation of recently established severe pulmonary hypertension. Six months prior to presentation to the cardiologist of the referring centre, the patient had first experienced exertional dyspnoea. At the time of presentation to the referring cardiologist, the patient s ECG showed signs of an increased right heart load. Interestingly, this patient had undergone a thorough cardiac evaluation in the referring centre seven years before when she presented with severe hyperthyroidism. At that time there were no symptoms or signs of pulmonary hypertension on ECG, echocardiography, or at heart catheterisation. Thorough evaluation in cooperation with the referring centre demonstrated that this patient was suffering from idiopathic pulmonary arterial hypertension, a rare form of pulmonary hypertension. We conclude this report with a discussion on the potential use of the ECG for the diagnosis of increased right heart load. 156
. The patient had first experienced exertional dyspnoea six months prior to presentation to the referring cardiologist.")
158 THE ELECTROCARDIOGRAM IN PULMONARY HYPERTENSION Case In August 2005, a 54-year-old female was referred to our centre for additional evaluation into the aetiology of recently established severe pulmonary arterial hypertension (PAH). The patient had first experienced exertional dyspnoea six months prior to presentation to the referring cardiologist. There was no history of cardiac or pulmonary disease, but this patient had undergone an extensive cardiac evaluation seven years before, after a single episode Figure 1. A. ECG of the patient at first presentation, seven years before the diagnosis of PAH, demonstrated a regular sinus rhythm of 65 beats/min, a QRS axis of 36, normal P waves, conduction intervals within normal limits, and an inverted T waves in leads II, III, avf and V1 to V6. In short, there was no reason to suspect an increased right heart load at the time, based on this ECG. B. The ECG recorded at the time of renewed presentation showed a regular sinus rhythm of 84 beats/min, a QRS axis of 90, the R wave in lead V1 measured 6 mm in the absence of an S wave, and there were diffuse repolarisation abnormalities, all in agreement with an increased right heart load. Given this second ECG, especially with an ECG available from several years before, further investigation regarding an increased right heart load is warranted. 157
159 Chapter 9 Figure 2. Haemodynamics recorded at baseline (left) and at follow-up (right). Despite the fact that the systolic pulmonary artery pressure is increased after one year of treatment, PVR has decreased due to an improved cardiac output (from 5.5 l/min to 7.9 l/min). Essentially, right ventricular function seems improved, generating higher pulmonary artery pulse pressures and an increased cardiac output. of syncope. At that time, the ECG showed a sinus rhythm, a QRS axis of 36, normal P waves, conduction intervals within normal limits, and inverted T waves in leads I, III, avf and V1 to V6 (figure 1A). Because of the observed repolarisation abnormalities, a series of additional tests was performed. Apart from severe hyperthyroidism, there were no cardiac or pulmonary abnormalities found at echocardiography (tricuspid and pulmonary valve regurgitation gradients were within normal limits, there was no right atrial or ventricular dilatation, right ventricular hypertrophy, or paradoxical septal bowing), left heart and coronary catheterisation, or pulmonary function tests. At renewed presentation, the ECG now showed a QRS axis of 90, the R wave in lead V1 measured 6 mm in the absence of an S wave, and there were diffuse repolarisation abnormalities, all in agreement with an increased right heart load (figure 1B). At bicycle ergometry the patient performed 120 W (88% of predicted), without evidence of exercise-induced ischaemia. A pulmonary perfusion scan showed no signs of pulmonary embolism. Coronary angiography again revealed normal coronary arteries. The patient (height: 170 cm, weight: 90 kg) now had a normal thyroid function, and was not taking any medications. Haemodynamics at right heart catheterization are presented in figure 2. Pulmonary pressures and pulmonary vascular resistance approached systemic values, signifying that the degree of right heart load was severely elevated in this patient. According to the guidelines, 1 the patient was further evaluated, eliminating possible aetiological factors in a stepwise fashion. Our patient denied past use of anorexigens or 158


160 THE ELECTROCARDIOGRAM IN PULMONARY HYPERTENSION Figure 3. A. CT image which clearly shows the marked dilation of the right atrium and right ventricle, whereas the left atrium and left ventricle are considerably smaller. B. CT image of the aorta and pulmonary arteries. The diameter of the common pulmonary artery is almost twice that of the ascending aorta, and the right and left pulmonary arteries are also dilated. The severe dilatation of the pulmonary arteries indicates that the pulmonary arterial hypertension is not of recent onset, but a chronic condition. RA=right atrium, RV=right ventricle, LA=left atrium, LV=left ventricle, Ao=aorta, APC=common pulmonary artery, APD=right pulmonary artery, APS=left pulmonary artery. intravenous drugs. There were no relatives with similar symptoms or established pulmonary hypertension. There was a history of alcohol abuse, but our patient had managed to refrain from drinking alcohol for several years, and an abdominal echo showed normal hepatopetal flow in the portal vein, essentially excluding presence of portal hypertension. The patient consented to a HIV test, which was negative. The echocardiogram showed no signs of left ventricular dysfunction or incompetence of the aortic and mitral valve, hence there was no indication that the pulmonary hypertension as secondary to left-sided heart disease. Pulmonary function tests showed a mild obstruction pattern with a diffusion capacity of 68%, corrected for alveolar volume. Arterial blood gas analysis rendered the following values: O2 saturation 97% (94 to 99%), ph 7.47 (7.35 to 7.45), pco2 4.2 kpa (4.5 to 6.0 kpa), po kpa (10.6 to 13.3 kpa), base excess -0.4 mmol/l (-2 to 2 mmol/l) and bicarbonate concentration 22 mmol/l (22 to 29 mmol/l). Nocturnal oximetry showed no signs of desaturation or sleep apnoea. Additional CT imaging of the lungs and pulmonary arteries showed no signs of interstitial lung disease or thromboembolic disease, but dilatation of the right atrium, right ventricle, and central pulmonary arteries was striking (figure 3). Since no satisfactory explanation could be found for the pulmonary arterial hypertension, the patient was classified as having idiopathic PAH. Despite the impressive level of PAH, treatment would not be reimbursed, given the relatively mild symptoms of the patient (NYHA functional class II). Since the severity of the disease led us to believe that refraining from treatment would lead to deterioration in the near future, we suggested that the patient should consider taking part in a clinical trial evaluating the benefit of an endothelin antagonist. The patient gave informed consent, and reported an improvement in her overall well-being during the first months of treatment. After one year of treatment pulmonary artery pressures 159
161 Chapter 9 were virtually unchanged. However, systemic venous oxygen saturation had dramatically improved from 65 to 75%. Cardiac output calculated with the Fick method had increased from 5.5 l m-2 to 7.9 l m-2, meaning that PVR had dropped to approximately 600 dynes s cm-5. The ECG was unchanged compared with a year before. Since this pulmonary vascular resistance is still much higher than the upper limit of normal ( 240 dynes s cm-5), the patient received additional treatment with a phosphodiesterase inhibitor. PAH is a rare disease, with an estimated incidence of 2 to 16 per million. 2 PAH often remains undetected until there are already advanced pulmonary vascular abnormalities. 1,3 In recent years, however, awareness for this orphan disease has increased, mainly due to the advent of new drug therapies. 4 Historically, the time interval from symptoms to diagnosis has been substantial for PAH patients, rendering most patients in NYHA class III or IV before treatment initiation.3 Although ECG abnormalities corresponding with right heart overload are present in the majority of PAH patients at diagnosis, 3,5 the scalar ECG has been considered inadequate for screening.1 Recent studies in rats and humans have illustrated, however, that even a mildly increased right ventricular pressure load is associated with substantial changes in myocardial electrical properties, detectable in a standard 12-lead ECG recording. 6,7 A possible explanation for the reportedly lower sensitivity for right ventricular pressure overload of the ECG by conventional assessment is the wide range of normal ECG values, i.e. the normal heart axis ranges from -30 to +90 or even to +100, depending on the criteria used.8 In contrast to the wide inter-individual heterogeneity in ECG characteristics, the ECG is a very reliable tool to detect intra-individual changes over time. In this particular patient, there had been an extensive cardiac evaluation several years before. In the meantime, the patient developed PAH and the ECG changed markedly: the QRS axis turned rightward, changing from 36 to 90, the R in lead V1 became >0.5mV and was more pronounced than the S, and there were diffuse repolarisation abnormalities. Together, these abnormalities correspond with increased right heart load and right ventricular hypertrophy. 8 This particular patient had relatively mild symptoms, given the severity of the PAH. The fairly stable cardiac situation was reflected by a sinus rhythm of 84 beats/min, indicating that stroke volume is adequate at rest. 9 The absence of a P pulmonale (P wave >0.25 mv in lead II) signifies that PAH has not yet induced a significant retrograde atrial overload, which is otherwise an ominous sign of poor prognosis. 10,11 More specifically, P amplitude in lead II increases as a result of progressive RV hypertrophy-associated diastolic dysfunction, and RV dilatation-associated tricuspid regurgitation in PAH patients. 12 Karliner et al. documented an increase in P amplitude in lead II in healthy men who ascended from sea level to a height of 6300 meters above sea level on Mount Everest, and suffered from hypoxia-induced PAH. 12 Furthermore, QRS axis turned in a more rightward direction with increasing pulmonary vascular resistance at high altitude, a phenomenon also observed in our patient. Lastly, as QRS duration is related to ventricular size, function, and prognosis, here was no reason to believe that the right ventricle was performing poorly with a QRS duration of only 76 msec in this 160
162 THE ELECTROCARDIOGRAM IN PULMONARY HYPERTENSION patient. 13 There is fairly extensive knowledge on the ECG changes that can be observed with regression of right ventricular hypertrophy in developing newborns, as well as on the ECG abnormalities that remain present in people living at high altitudes. 10 Similarly, patients in whom PAH attenuating treatment is very effective such as the rare patients who respond to calcium channel blockers have shown dramatic ECG changes from a pattern corresponding with right ventricular hypertrophy to a (near)-normal pattern. 14 It is exceptionally rare that evolutionary ECG changes due to the development of PAH can be assessed. This is understandable, since PAH is an uncommon disease. Furthermore, PAH often presents relatively early in life, meaning patients lack cardiopulmonary comorbidity, and therefore prior ECG recordings. 2 Nevertheless, recording ECGs in patients at risk for developing PAH might be a cost-effective way of screening or longitudinal case-finding in selected groups of patients. Screening for PAH in patients at risk, such as patients with a genetic predisposition, HIV infection, portal hypertension, or systemic sclerosis, has been subject to debate for some time. 1 While results of clinical trials regarding earlier onset of treatment are awaited, critics claim that such screening is impracticable without properly validated tools. However, the results of improved ECG detection of increased right ventricular pressure load may well bring screening within reach. 7 Of course, pre-selecting patients at risk for pulmonary arterial hypertension will remain necessary, given the rarity of the disease. Now that the groups of patients at risk have been well identified, 1,2,15 there is ample opportunity to evaluate the diagnostic value of longitudinal ECG recordings in a clinical setting. 161
163 Chapter 9 References 1. McGoon M, Gutterman D, et al. Screening, early detection, and diagnosis of pulmonary arterial hypertension: ACCP evidence-based clinical practice guidelines. Chest 2004; 126: 14S-34S. 2. Peacock AJ, Murphy NF, et al. An epidemiological study of pulmonary arterial hypertension. Eur Respir J 2007; 30: Rich S, Dantzker DR, et al. Primary pulmonary hypertension. A national prospective study. Ann Intern Med 1987; 107: Badesch DB, Abman SH, et al. Medical therapy for pulmonary arterial hypertension: updated ACCP evidence-based clinical practice guidelines. Chest 2007; 131: Ahearn GS, Tapson VF, et al. Electrocardiography to define clinical status in primary pulmonary hypertension and pulmonary arterial hypertension secondary to collagen vascular disease. Chest 2002; 122: Henkens IR, Mouchaers KT, et al. Early changes in rat hearts with developing pulmonary arterial hypertension can be detected with three-dimensional electrocardiography. Am J Physiol Heart Circ Physiol 2007; 293: H Henkens IR, Mouchaers KT, et al. Improved ECG detection of presence and severity of right ventricular pressure load validated with cardiac magnetic resonance imaging. Am J Physiol Heart Circ Physiol 2008; 294: H Zipes DP, Libby P, et al. Heart Disease. Saunders, 2004; Holverda S, Gan CT, et al. Impaired stroke volume response to exercise in pulmonary arterial hypertension. J Am Coll Cardiol 2006; 47: Penaloza D, Rias-Stella J. The heart and pulmonary circulation at high altitudes: healthy highlanders and chronic mountain sickness. Circulation 2007; 115: Bossone E, Paciocco G, et al. The prognostic role of the ECG in primary pulmonary hypertension. Chest 2002; 121: Karliner JS, Sarnquist FF, et al. The electrocardiogram at extreme altitude: experience on Mt. Everest. Am Heart J 1985; 109: Gatzoulis MA, Till JA, et al. Mechanoelectrical interaction in tetralogy of Fallot. QRS prolongation relates to right ventricular size and predicts alignant ventricular arrhythmias and sudden death. Circulation 1995; 92: Rich S, Brundage BH. High-dose calcium channel-blocking therapy for primary pulmonary hypertension: evidence for longterm reduction in pulmonary arterial pressure and regression of right ventricular hypertrophy. Circulation 1987; 76: Humbert M, Sitbon O, et al. Pulmonary arterial hypertension in France: results from a national registry. Am J Respir Crit Care Med 2006; 173:
164 Chapter 10 Follow-Up after Pulmonary Valve Replacement in Adults with Tetralogy of Fallot: Association between QRS Duration and Outcome Roderick WC Scherptong Mark G Hazekamp Barbara JM Mulder Olivier Wijers Cees A Swenne Ernst E van der Wall Martin J Schalij Hubert W Vliegen J Am Coll Cardiol Oct 26;56(18):
165 Chapter 10 Abstract Objectives The aim of this study was to analyze whether QRS duration, before and after pulmonary valve replacement (PVR), is related to long-term outcome in patients with tetralogy of Fallot (TOF). Background Key factors which determine outcome after PVR in adult TOF patients are largely unknown. Recognition of such factors assists the identification of patients at increased risk of adverse events. Methods Adults who previously underwent total correction for TOF (n=90; age 31.4 ±10.3 years) and required PVR for pulmonary regurgitation were included. QRS duration was measured preoperatively and six months after PVR. The post-operative changes in QRS duration were calculated. Adverse events (death, re-pvr, ventricular tachycardia and symptomatic heart failure) were noted during follow-up. Results During 5.5 ±3.5 years follow-up, 13 adverse events occurred. The 5-year event-free survival rate was 76% in patients with a pre-operative QRS duration >180 ms and 90 % in patients with a QRS duration 180 ms (p=0.037). In patients with a post-operative QRS duration >180 ms, 5-year event-free survival was 71%, whereas it was 91% in patients with a post-operative QRS duration 180 ms (p=0.004). After multivariate correction, a post-operative QRS duration >180 ms (hazard ratio 3.685, 95%CI , p<0.05) and the absence of a reduction in QRS duration post-pvr (hazard ratio 6.767, 95%CI , p<0.01), was significantly associated with adverse outcome. 164
166 QRS AND OUTCOME AFTER PVR IN TETRALOGY OF FALLOT Conclusions Severe QRS prolongation, pre- or post-pvr, and the absence of a reduction in QRS duration after PVR, are major determinants of adverse outcome during long-term follow-up of patients with TOF. Introduction Progressive pulmonary regurgitation (PR) is a common complication after total surgical correction of tetralogy of Fallot (TOF). 1 Longstanding PR leads to right ventricular (RV) dilatation, which in turn causes RV dysfunction and reduced exercise tolerance. 2, 3 Pulmonary valve replacement (PVR) provides an adequate surgical therapy for PR as it leads to improvement of RV function and the patient s functional class. 4 Numerous studies indicated the beneficial effects of PVR in terms of improvement of RV volume and ejection fraction shortly after PVR. 5 7 In addition, it was demonstrated that RV de- and repolarization characteristics improve after PVR, partly in response to the reduction in RV volumes. 8, 9 Specifically QRS duration, which is strongly associated with RV function and prognosis in TOF, 10 tends to reduce after PVR. 8 In addition, it is known that TOF patients with severely prolonged QRS duration (>180ms) are at risk for adverse events. 11 Nevertheless, it is unclear whether an association exists between, on the one hand, pre-pvr QRS duration and post-pvr changes in QRS duration and, on the other hand, long-term outcome after PVR. Consequently, the clinical relevance of pre- and post-pvr QRS duration, and of changes in QRS duration after PVR, is presently unknown. The current study aimed to assess how pre-operative QRS duration and post-operative changes in QRS duration are related to outcome during long-term follow-up after PVR in TOF patients. Methods Study population In a prospective, multicenter cohort study, adult patients after prior total repair for TOF, who had undergone a PVR for PR, were followed. 12, 13 In all patients, primary surgical repair was performed during childhood. The indications for PVR were moderate to severe PR in combination with RV dilatation and impaired New York Heart Association (NYHA) functional status. 4 A standard 12-lead ECG was obtained immediately before and 6 months after PVR. If an ECG was not available at one of the time points, patients were excluded from further analysis. All patients were followed annually at the out-patient clinic and the occurrence of adverse events was noted during follow-up after PVR. Adverse events were defined as: death due 165
167 Chapter 10 to any cause, re-operation for recurrent pulmonary regurgitation, symptomatic heart failure and ventricular arrhythmias. Surgical procedures PVR was performed through median sternotomy. After release of adhesions, total cardiopulmonary bypass was started. A cryopreserved pulmonary homograft was implanted, usually on beating heart. If necessary, small residual ventricular septal defects were suture closed and RV outflow tract (RVOT) reconstruction was performed as described previously. 12 In addition, when pre-operative assessment revealed significant tricuspid regurgitation, tricuspid annuloplasty was performed. 14 Electrocardiographic analysis Electrocardiograms (ECGs) were stored digitally and exported from the ECG database management system for off-line analysis with the MATLAB-based (The MathWorks, Natick, MA) computer program LEADS (Leiden, the Netherlands). Details about the calculation methods used in LEADS have been reported previously. 15 The software averages a digitized version of the standard 12-lead surface ECG into a representative single-beat ECG in which all 12 leads are superimposed. The software is equipped with a cross-hair editor interface that allows magnification of the ECG and thereby facilitates accurate measurement of QRS duration according to the Minnesota criteria for population based ECG studies. 8 All ECGs were analyzed by a single observer blinded for the patient s clinical status and operation results. The cut-off 10, 11 for severely prolonged QRS duration was set at 180ms. Statistical analysis SPSS ( SPSS Inc., Chicago, IL) was used for statistical analysis. Graphpad Prism (4.00 for Windows, Graphpad Software Inc., La Jolla, CA) was used to obtain life tables and corresponding Kaplan Meier survival curves. First, pre- and post-operative QRS duration and NYHA functional class were compared using a paired t-test. Secondly, the association between QRS duration and the occurrence of adverse events during post-operative follow-up was assessed using Cox s proportional hazard regression analysis. Univariate hazard ratios were calculated with corresponding 95% confidence interval (CI) for the following variables: 1) pre- and post-operative QRS duration as a continuous variable, in ms; 2) pre- and post-operative QRS duration as a categorical variable, 180 ms or > 180 ms; 166
168 QRS AND OUTCOME AFTER PVR IN TETRALOGY OF FALLOT 3) changes in QRS duration, from pre- to post-operative, as a continuous variable, in ms; 4) changes in QRS duration, from pre- to post-operative, as a categorical variable, expressed as the presence or the absence of reduction in QRS duration. Afterwards, the hazard ratios were adjusted for age at PVR (below or above the median age of 30 years) and the presence of concomitant procedures during PVR, to obtain the multivariate HRs. Third, the annualized event rates were assessed in patient subgroups based on the preand post-operative QRS duration ( 180 ms or > 180 ms) in addition to the post-operative changes in QRS duration (reduction or no reduction). The number of observed events was normalized to100 patient years in each subgroup to facilitate comparison between groups. Afterwards the 95% CI of the observed event rate was calculated and the difference in event rate was compared to the overall event rate by assuming that the number of observed events has a Poisson distribution. Finally, to visualize the difference in event free survival between different QRS duration patient categories, Kaplan-Meier curves were drawn and logrank statistics were calculated for the following three patient subgroups: 1) pre-operative QRS duration 180 ms or > 180 ms; 2) post-operative QRS duration 180 ms or > 180 ms; 3) changes in QRS duration, expressed as the presence or absence of a post-operative reduction in QRS duration. Separate Kaplan- Meier curves were obtained in which death, symptomatic heart failure and ventricular arrhythmias were included as an end-point and re-pvr was excluded. Where appropriate, data are reported as mean ± standard deviation (SD), number (%) or as hazard ratio (HR) with (95% CI). P values <0.05 were considered statistically significant. Results Ninety-nine consecutive corrected TOF patients who underwent PVR at adulthood were considered for the study. Nine patients were excluded because of missing ECGs and the remaining 90 patients were all included in the study (Table 1). PVR was performed at an age of 31.4 ± 10.3 years and pre-operative NYHA functional class was 2.4 ± 0.7. The size of the implanted homografts was 25.6 ± 1.6 mm and concomitant surgical procedures, mostly RVOT reconstructions, were required in 42 patients (47%, Table 1). Clinical outcome No patients were lost to follow-up. After PVR, NYHA functional class improved from 2.4 ± 0.7 to 1.3 ± 0.6, p< During a mean follow-up duration of 5.5 ± 3.5 years (range years), 13 adverse events occurred (Figure 1A). The observed event free follow-up was 100% at 1 year, 96% at 2 years, 89% at 5 years, and 78 % at 10 years (Figure 1B). During follow-up, 167
169 Chapter 10 Table 1. Patient population. Patients 90 Sex Male 53 (59) Female 37 (41) Characteristics initial repair Age (years) 5.8 ± 5.5 Transannular patch 62 (69) RV patch 9 (10) RV to PA conduit 5 (6) No patch 14 (16) Characteristics PVR Pre-operative NYHA class 2.4 ± 0.7 Age (years) 31.4 ± 10.3 Homograft diameter (mm) 25.6 ± 1.6 Concomitant procedures Patients with concomitant procedures 42 (47) Ventricular septal defect closure 2 (2) RVOT reconstruction 27 (30) Tricuspid valvuloplasty 17 (19) QRS duration Pre-operative (ms) 158 ± 29 Changes from pre- to post-operative (ms) -4 ± 17* Post-operative (ms) 154 ± 32 Numbers correspond to n (%) or mean ± SD. NYHA: New York Heart Association; PA: pulmonary artery; PVR: pulmonary valve replacement; RV: right ventricular. *p = for the difference between pre- and postoperative QRS duration. A Pulmonary valve replacement (n=90) B 100 Events (n=13) Event-free (n=77) Event-free survival (%) Death (n=2) Re-PVR (n=5) VT (n=4) HF (n=2) Follow-up (years) PAR Figure B Patient population and follow-up characteristics. Overview of the events that occurred during follow-up of the study population (A) and the overall Kaplan-Meier survival curve of the patients (B). The numbers below signify patients at risk. HF: Heart Failure; PAR: patients at risk; PVR: pulmonary valve replacement; VT: ventricular tachycardia. 168
170 QRS AND OUTCOME AFTER PVR IN TETRALOGY OF FALLOT 2 patients died after respectively 1.4 years and 8.5 years due to sudden cardiac death (first patient) and fast-progressive, therapy refractory heart failure (second patient). Re-PVR was performed in 5 patients and ventricular tachycardia requiring implantation of an implantable cardioverter defibrillator, occurred in 4 patients. Prediction of patient outcome using QRS duration Before PVR QRS duration was 158 ± 29 ms, which reduced with 4 ± 17 ms to 154 ± 32 ms six months after surgery, p=0.027 (Table 1). Pre-operative NYHA functional class was not associated with pre- or post-operative QRS duration or the post-operative changes in QRS duration (black bars in Figure 2) and demonstrated to improve in all patientgroups based on QRS duration (Figure 2). However, in patients with a QRS duration > 180 ms, either pre- or post-operative, a less prominent improvement in NYHA functional class was observed as compared to patients with a QRS duration 180 ms pre-operative (p=0.002) or post-operative (p=0.045). Pre- and post-operative QRS duration, as well as post-operative change in QRS duration were significantly associated with adverse outcome after PVR (Table 2). The crude HRs of A Immediately pre-operativ e NYHA fu nc ti onal cl as s ms > 180 ms C B 6 Post-operative months post-operativ change s e B Post-operative change s NYHA fu nc ti onal cl as s reduction no reduction C 6 months post-operativ e NYHA fu nc ti onal cl as s ms > 180 ms 1. 8 A post-operativ e pre-operative Figure 2. NYHA functional class and QRS duration. Mean pre- and post-operative NYHA functional class (yaxis) depicted in relation to (x-axis) pre-operative QRS duration (A), post-operative changes in QRS duration (B) and QRS durations 6 months post-operative (C). 169
171 Chapter 10 Table 2. Prediction of outcome using QRS duration. Univariate Multivariate* HR 95% CI HR 95% CI Pre-operative Pre-operative > 180ms Post-operative Post-operative > 180ms Change in QRS duration No reduction in QRS duration *In the multivariate model, the hazard ratio was adjusted for age (below or above the median of 30 years) and concomitant surgical procedures during pulmonary valve replacement, hazard ratio per ms increase in QRS duration, hazard ratio per ms change in QRS duration, p < 0.05, p < pre- and post-operative QRS duration were and 1.026, respectively, per ms increase in QRS duration. This indicated that a longer QRS duration either pre- or post-operatively, was associated with a higher incidence of adverse events. Furthermore, the change in QRS duration from pre-operative to six months after PVR, was also related to post-operative outcome. The crude HR for the occurrence of adverse events was per ms change in QRS duration, demonstrating that a post-operative reduction in QRS duration was associated with a lower incidence of adverse events during follow-up. After multivariate correction, pre- and postoperative QRS duration and post-operative changes in QRS duration remained significantly related to the incidence of adverse events. Specifically a post-operative QRS duration >180 ms or the lack of a reduction in QRS duration, post-operatively, were strong predictors of adverse events with multivariate HRs of and 6.767, respectively. To further explore the association between QRS duration and event-free survival after PVR, the study population was subdivided based on QRS duration (pre- and post-operative; 180 or > 180 ms), and post-operative change in QRS duration (reduction or no reduction), which yielded 8 subgroups (Table 3). Subsequently, the annualized event rate, normalized to 100 patient years, was calculated for the overall study population and for the 8 subgroups (Table Table 3. Observed annualized event rate according to QRS duration. n Patient years Events Events/ 100 patient 95% CI years Overall Pre-operative QRS duration 180 ms + PO QRS reduction NA 180 ms PO QRS reduction > 180ms + PO QRS reduction > 180ms PO QRS reduction * Post-operative QRS duration 180 ms + PO QRS reduction ms PO QRS reduction > 180ms + PO QRS reduction > 180ms PO QRS reduction *p = vs. the overall group, p = vs. the overall group. PO: post-operative. 170
172 QRS AND OUTCOME AFTER PVR IN TETRALOGY OF FALLOT Re-PVR included A Immediately pre-operative Eventfree Survival (%) Eventfree Survival (%) QRS 180ms QRS > 180ms p=0.037 (n=71) (n=19) Follow-up (years) C Post-operative changes p= QRS reduction (n=58) no QRS reduction (n=32) Follow-up (years) E 6 months post-operative Re-PVR excluded B Immediately pre-operative Eventfree Survival (%) Eventfree Survival (%) QRS 180ms (n=71) QRS > 180ms (n=19) Follow-up (years) D Post-operative changes QRS reduction no QRS reduction P=0.002 (n=58) (n=32) Follow-up (years) F 6 months post-operative p=0.607 Eventfree Survival (%) QRS 180ms QRS > 180ms p=0.004 (n=73) (n=17) Follow-up (years) Eventfree Survival (%) p= QRS 180ms (n=73) QRS > 180ms (n=17) Follow-up (years) Figure 3. Kaplan Meier Survival curves and QRS duration. Kaplan Meier survival curves in patient subgroups stratified by pre-pvr QRS duration (A,B); post-operative changes in QRS duration (C,D); and 6-months postoperative QRS duration (E,F). Separate curves are provided in which re-pvr was excluded as an end-point (B,D,F). P-values denote the result of the logrank test. 3). The overall event rate in the study population was 2.7 (95% CI ) per 100 patient years. No events were observed in patients with a pre-operative QRS duration 180 ms, who demonstrated a post-operative reduction in QRS duration (n=44). On the contrary, a significantly higher event rate was observed in patients who did not demonstrate a reduction in 171
173 Chapter 10 QRS duration and had a QRS duration > 180 ms either pre- or post-operative. In those groups, the event rates were 20.6 (95% CI ; p=0.007 vs. the overall population) and 9.3 (95% CI ; p=0.030 vs. the overall population) events per 100 patient years (Table 3). The Kaplan Meier survival curves (Figure 3) confirmed that patients with significantly prolonged QRS duration (> 180 ms) demonstrated worse event-free survival as compared to patients with a QRS duration 180 ms. The observed 5-year event-free survival was 76 % in patients with a pre-operative QRS duration > 180 ms as compared to 90 % in patients with a QRS duration 180 ms, p = (Figure 3A). The observed 5-year event-free survival was 71% in patients with a post-operative QRS duration > 180 ms as compared to 91% in patients with a QRS duration 180 ms, p = (Figure 3E). Furthermore, 5-year event-free survival of patients in whom no reduction in QRS duration was observed six months after PVR, was worse as compared to patients with a reduction in QRS duration after PVR. The observed difference in event-free survival between those two groups was 24.5 % at 5 years, p = (Figure 3C). Exclusion of re-pvr as an endpoint in the Kaplan-Meier survival curve, demonstrated that event-free survival was 4.1% percent lower in patients with a pre-operative QRS duration > 180 ms as compared to 180 ms, which was not statistically significant, p=0.61 (Figure 3B). The Kaplan-Meier curves, in which the patient population was stratified according to post-operative QRS duration ( 180 ms or > 180 ms) or post-operative changes in QRS duration (reduction or no reduction), was similar whether or not re-pvr was excluded as an endpoint (Figure 3D,F). Discussion The main findings of this study were: 1) a QRS duration >180ms, either pre- or post-operatively, or the lack of a reduction in QRS duration after PVR, was significantly associated with adverse outcome after PVR; and 2) the highest incidence of adverse events was observed in patients with a severely prolonged QRS duration either pre- or post-operative, without a reduction in QRS duration after PVR. Progressive PR is one of the most common complications after total surgical repair of TOF. In response to the regurgitated volume, the right ventricle dilates to overcome the increased loading conditions. 1, 16 Longstanding PR will eventually lead to dysfunction of the right ventricle and patients may experience reduced exercise tolerance. 17 In such cases, PVR with a competent pulmonary valve provides a satisfactory solution with excellent short-term results in terms of ventricular function and NYHA functional class. 4, 18 Although long-term results are also good for PVR; a substantial number of patients still have adverse events during followup. 7 In the current study, event free survival was 76% after ten years which is similar to other studies in which long-term survival after PVR was reported. 12, 19 A number of factors that are important for post-pvr outcome have been identified. These mainly include post-operative 172
174 QRS AND OUTCOME AFTER PVR IN TETRALOGY OF FALLOT homograft-related factors such as early recurrence of PR or pulmonary stenosis. 12, 20 Interestingly, in the study by Oosterhof et al., 12 which was a large follow-up study that comprised of 158 adult TOF patients who underwent PVR, neither the type of initial TOF correction nor the PVR surgical characteristics were predictive of outcome after PVR. In that study, right ventricular volumes and ejection fraction, assessed pre-operatively with cardiovascular magnetic resonance imaging, were not predictive of post-pvr outcome. Although it is known that QRS duration is strongly associated with outcome in TOF patients, 10 no studies on the clinical application of QRS duration for the assessment of post-pvr outcome are available. The current study demonstrates that pre-operative QRS duration is associated with post-operative outcome. Longer QRS duration was significantly associated with increased incidence of adverse outcome after PVR. Furthermore, severe QRS prolongation (>180ms) after PVR and the absence of a reduction in QRS duration demonstrated an even stronger association with post-operative outcome. As re-pvr has an indirect association with ventricular function 12 separate Kaplan-Meier survival curves were obtained in which re-pvr was excluded as an endpoint. This confirmed that QRS duration has a strong association with post-pvr outcome in patients with TOF. The association between prolonged QRS duration and patient outcome in TOF was first recognized by Gatzoulis et al. 10 In a study on 178 adults with a previous total repair for TOF, it was demonstrated that ventricular tachycardia was associated with QRS prolongation beyond 180 ms. In addition, it was shown that patients with an enlarged right ventricle had a longer QRS duration. The relation between RV enlargement and QRS duration was confirmed thereafter in study by Book and colleagues. 21 They demonstrated that prolonged QRS duration (>150 ms), had a positive predictive value of 92% for the detection of RV dilatation on cardiovascular magnetic resonance imaging. In addition, Neffke and colleagues demonstrated that QRS duration was also correlated to RV mass. 22 Besides the relation between QRS duration and ventricular function, it was shown in a study Budts et al. that lack of reduction in QRS duration during exercise, is significantly related to reduced exercise capacity in adult TOF patients. 23 Furthermore, previous studies have indicated reduction of QRS duration in response to PVR. 8 This reduction in QRS duration was related to the reduction in RV end diastolic volume, which demonstrated that PVR improved the electrophysiological characteristics of the right ventricle. However, to date, it remained to be investigated whether these changes in electrophysiological characteristics were of relevance in terms of clinical outcome. The current study demonstrates for the first time that severe QRS prolongation (>180ms) either pre- or post-pvr, or the absence of a reduction in QRS duration post-pvr, is associated with the increased incidence of adverse outcome during long-term follow-up. It could be postulated that the patients who lack improvement in QRS duration have a poorer RV condition and thus exhibit a higher risk for adverse events as compared to the patients who improve in QRS duration after PVR. Analogous with this, the observation that longer QRS duration pre-pvr was associated with increased incidence of adverse events after PVR may also be related to a 173
175 Chapter 10 more deteriorated RV condition already before PVR. The fact that no events were observed in patients with a QRS duration <180ms who demonstrated improvement of QRS duration after PVR, may reflect the other end of the same pathophysiological spectrum. Limitations As with most studies on patients with congenital heart disease, a limitation of the current study is the relatively small number of patients. Therefore, a comprehensive multivariate Cox s regression analysis, in which the HRs are adjusted for all possible confounders could not be obtained. Furthermore, the subgroup analysis based on pre- and post-pvr QRS duration and post-pvr changes in QRS duration would benefit from a larger sample-size as this increases the precision of the event rate estimations. A large multi-center trial with sufficient power for a complete analysis of possible confounders is warranted to improve the quantification of the event rates and to confirm the differences between the subgroups. In addition, the fact that QRS duration was tested continuously as well as categorically using a predefined cut-off, may introduce type I statistical error in the current evaluation. However, a consistent association between QRS duration and patient outcome was observed whether QRS duration was entered continuously or categorically in the regression equation. Clinical implications The current study demonstrates that both QRS duration itself and the changes in QRS duration after PVR can be used to identify patients who are at increased risk for adverse events during follow-up after PVR. Therefore, the patients who have a QRS duration >180ms either pre- or post-pvr, and the patients who do not demonstrate improvement of QRS duration after PVR, may require a vigilant follow-up regimen, as those patients exhibit a high risk for adverse outcome. Currently, PVR is recommended when important PR and severe RV dilatation occur, specifically when this coincides with reduced NYHA functional class. 18, 24 As the current study demonstrates that severely prolonged QRS duration (>180ms) is associated with increased incidence of adverse outcome, it could be postulated that PVR should be performed before severe QRS prolongation occurs. The latter point, however, needs to be confirmed in a sufficiently powered clinical trial. 174
176 QRS AND OUTCOME AFTER PVR IN TETRALOGY OF FALLOT Conclusion QRS duration either before or after pulmonary valve replacement and the changes in QRS duration after pulmonary valve replacement are important determinants of long-term outcome in adults with tetralogy of Fallot and may serve as an easy screening tool to identify patients at high risk for adverse events after PVR. Disclosures Roderick WC Scherptong is supported by an unrestricted educational grant of Actelion Pharmaceuticals Nederland BV. Martin J Schalij receives research grants from Biotronik, Medtronic and Boston Scientific. 175
177 Chapter 10 References 1. Oosterhof T, Hazekamp MG, et al. Opportunities in pulmonary valve replacement. Expert Rev Cardiovasc Ther 2009; 7: Roest AA, Helbing WA, et al. Exercise MR imaging in the assessment of pulmonary regurgitation and biventricular function in patients after tetralogy of fallot repair. Radiology 2002; 223: Norozi K, Buchhorn R, et al. Elevated brain natriuretic peptide and reduced exercise capacity in adult patients operated on for tetralogy of fallot is due to biventricular dysfunction as determined by the myocardial performance index. Am J Cardiol 2006; 97: Vliegen HW, van SA, et al. Magnetic resonance imaging to assess the hemodynamic effects of pulmonary valve replacement in adults late after repair of tetralogy of fallot. Circulation 2002; 106: Adamson L, Vohra HA, et al. Does pulmonary valve replacement post repair of tetralogy of Fallot improve right ventricular function? Interact Cardiovasc Thorac Surg 2009; 9: Gengsakul A, Harris L, et al. The impact of pulmonary valve replacement after tetralogy of Fallot repair: a matched comparison. Eur J Cardiothorac Surg 2007; 32: Graham TP, Jr., Bernard Y, et al. Outcome of pulmonary valve replacements in adults after tetralogy repair: a multi-institutional study. Congenit Heart Dis 2008; 3: van Huysduynen BH, van SA, et al. Reduction of QRS duration after pulmonary valve replacement in adult Fallot patients is related to reduction of right ventricular volume. Eur Heart J 2005; 26: Hooft van HB, Henkens IR, et al. Pulmonary valve replacement in tetralogy of Fallot improves the repolarization. Int J Cardiol 2008; 124: Gatzoulis MA, Till JA, et al. Mechanoelectrical interaction in tetralogy of Fallot. QRS prolongation relates to right ventricular size and predicts malignant ventricular arrhythmias and sudden death. Circulation 1995; 92: Gatzoulis MA, Balaji S, et al. Risk factors for arrhythmia and sudden cardiac death late after repair of tetralogy of Fallot: a multicentre study. Lancet 2000; 356: Oosterhof T, Meijboom FJ, et al. Long-term follow-up of homograft function after pulmonary valve replacement in patients with tetralogy of Fallot. Eur Heart J 2006; 27: van SA, Vliegen HW, et al. Right ventricular function after pulmonary valve replacement in patients with tetralogy of Fallot. Radiology 2004; 233: Scherptong RW, Vliegen HW, et al. Tricuspid valve surgery in adults with a dysfunctional systemic right ventricle: repair or replace? Circulation 2009; 119: Scherptong RW, Henkens IR, et al. Normal limits of the spatial QRS-T angle and ventricular gradient in 12-lead electrocardiograms of young adults: dependence on sex and heart rate. J Electrocardiol 2008; 41: Scherptong RW, Mollema SA, et al. Right ventricular peak systolic longitudinal strain is a sensitive marker for right ventricular deterioration in adult patients with tetralogy of Fallot. Int J Cardiovasc Imaging 2009; 25: Giardini A, Specchia S, et al. Impact of pulmonary regurgitation and right ventricular dysfunction on oxygen uptake recovery kinetics in repaired tetralogy of Fallot. Eur J Heart Fail 2006; 8: Therrien J, Siu SC, et al. Pulmonary valve replacement in adults late after repair of tetralogy of fallot: are we operating too late? J Am Coll Cardiol 2000; 36: Troost E, Meyns B, et al. Homograft survival after tetralogy of Fallot repair: determinants of accelerated homograft degeneration. Eur Heart J 2007; 28:
178 QRS AND OUTCOME AFTER PVR IN TETRALOGY OF FALLOT 20. Fiore AC, Rodefeld M, et al. Pulmonary valve replacement: a comparison of three biological valves. Ann Thorac Surg 2008; 85: Book WM, Parks WJ, et al. Electrocardiographic predictors of right ventricular volume measured by magnetic resonance imaging late after total repair of tetralogy of Fallot. Clin Cardiol 1999; 22: Neffke JG, Tulevski II, et al. ECG determinants in adult patients with chronic right ventricular pressure overload caused by congenital heart disease: relation with plasma neurohormones and MRI parameters. Heart 2002; 88: Budts W, Defoor J, et al. Changes in QRS duration are associated with maximal exercise capacity in adult patients with repaired tetralogy of Fallot. Int J Cardiol 2005; 104: Oosterhof T, van SA, et al. Preoperative thresholds for pulmonary valve replacement in patients with corrected tetralogy of Fallot using cardiovascular magnetic resonance. Circulation 2007; 116:
179
180 Chapter 11 Normal Limits of the Spatial QRS-T angle and Ventricular Gradient in 12-lead ECGs of Young Adults: Dependence on Sex and Heart Rate Roderick WC Scherptong Ivo R Henkens Sum Che Man Saskia Le Cessie Hubert W Vliegen Harmen HM Draisma Arie C Maan Martin J Schalij Cees A Swenne J Electrocardiol Nov-Dec;41(6):
181 Chapter 11 Abstract Background & purpose Normal limits of the spatial QRS-T angle and spatial ventricular gradient (SVG) are only available from Frank vectorcardiograms (VCGs) of male subjects. We determined normal limits for these variables derived from standard 12-lead ECGs of 660 male and female students aged 18 to 29 years. Methods A computer algorithm was used that constructed approximated VCG leads by inverse Dower matrix transformation of the 12-lead ECG and subsequently calculated the spatial QRS-T angle, SVG magnitude and orientation. Results In female subjects, the QRS-T angle was more acute (females: 66 ±23, normal ; males: 80 ±24, normal ; P<0.001) and the SVG magnitude was smaller (females: 81 ±23 mv ms, normal mv ms; males: 110 ±29 mv ms, normal mv ms; P<0.001) than in male subjects. The male SVG magnitude in our study was larger than that computed in Frank VCGs (79 ±28 mv ms; P<0.001). Conclusions The spatial QRS-T angle and SVG depend strongly on sex. Furthermore, normal limits of SVG derived from Frank VCGs differ markedly from those derived from VCGs synthesized from the standard ECG. As nowadays VCGs are usually synthesized from the 12-lead ECG, normal limits derived from the standard ECG should preferably be used. 180
182 NORMAL LIMITS OF QRS-T ANGLE AND VENTRICULAR GRADIENT Introduction The spatial QRS-T angle and the spatial ventricular gradient (SVG) are classical electrocardiographic parameters that provide information on functioning of the cardiac conduction system and on heterogeneity in ventricular action potential durations. 1, 2 The spatial QRS-T angle is the angle between the QRS- and T-axis in the plane that these axes form. This angle differs from the commonly calculated angle between the projections of QRS- and T-axes in the frontal plane. In normal subjects, repolarization in the free lateral wall tends to proceed in opposite direction to that of depolarization. In the septum and other myocardial regions, these relationships vary. Overall, the mean direction of repolarization (T) is closer to perpendicular rather than strictly reverse to that of depolarization (QRS). 3 This results in an acute spatial QRS-T angle, which corresponds to a predominantly concordant ECG. When pathological changes occur, the ECG becomes more discordant and the spatial QRS-T angle widens. 4 A recent study by Kardys et al. demonstrated that in the general population the risk of cardiovascular death is higher for patients with a wide spatial QRS-T angle. 2 In a report by Yamazaki et al., a wide spatial QRS-T angle wider was associated with an increased risk of cardiovascular death in a clinical population. 5 Therefore, the spatial QRS-T angle is potentially a useful parameter for risk assessment in general and clinical populations. The ventricular gradient (VG) is defined as the QRST integral and can be determined in any ECG or VCG lead 6 by calculating the total area under the curve over the QT interval (positive deflections are counted positive, negative deflections are counted negative). By including directional characteristics of the cardiac vector in the calculation, the spatial ventricular gradient (SVG) can be obtained. This SVG vector is the vectorial sum of the (spatial) QRS and T integral vectors, which have the same orientations as the QRS and T axes. Hence, the spatial QRS-T angle relates to the SVG in the sense that the spatial QRS-T angle is equal to the angle between the QRS and T integral vectors and the SVG is the vectorial sum of these vectors (Figure 1). From a theoretical point of view, the SVG is not influenced by changes in ventricular conduction pattern; it only changes if the distribution of the action potential morphology and/or duration across the myocardium is altered. 1, 7, 8 In agreement with this, Mashima and colleagues demonstrated, in patients with left ventricular hypertrophy, that presence or absence of left bundle branch block was not associated with a different ventricular gradient magnitude. 9 Gärtner et al. 10 investigated whether frontal projections of the VG can discriminate health from cardiac disease and concluded that the VG lacks diagnostic accuracy. Simonson commented on this research by stating that frontal projections of the VG do not sufficiently reflect electrical activity in the other directions. 6 Nonetheless, after the first disappointing results were reported on the clinical applicability of the VG, it was largely abandoned. Unfortunately, this left multiple questions concerning the spatial VG unanswered and the clinical value of 181
183 Chapter 11 Figure 1. QRS- and T-integrals, spatial QRS-T angle and ventricular gradient. The black arrows denote the QRS- and T integrals, which have the same orientation as the QRS- and T axes (dashed lines). The spatial QRS-T angle is the angle between the QRS- and T axes and the spatial ventricular gradient (SVG, grey arrow) is the vectorial sum of the QRS- and T integrals. The geometrical relation between iqrs, it, spatial QRS-T angle and SVG is important for understanding the factors that affect the spatial ventricular gradient: the SVG decreases with decreasing iqrs and/or it and with increasing spatial QRS-T angle. For further explanation, see Draisma et al.. 1 the SVG, in combination with the spatial QRS-T angle, as general descriptors of the ECG, remains to be studied. For use of these parameters in clinical practice, knowledge about normal variations and the availability of normal limits, derived from healthy subjects, is of unequivocal importance. Pioneering work in this field was done by Pipberger and colleagues. They were the first to publish normal limits of spatial QRS-T angle and the SVG derived from 8-electrode 3-lead Frank vectorcardiograms (VCGs) of 518 normal men. 11, 12 Nowadays, the recording of Frank VCGs has passed into disuse and is replaced by VCGs that are synthesized from standard ECGs, using a conversion matrix. 13 To the best of our knowledge, no studies have been published that define standard ECG-based normal limits of the spatial QRS-T angle and SVG computed from large samples of young healthy males and females. Therefore, the aim of our study was to determine normal limits of the spatial QRS-T angle as well as the spatial ventricular gradient magnitude and orientation, as derived from synthesized VCGs of young adult males and females. 182
184 NORMAL LIMITS OF QRS-T ANGLE AND VENTRICULAR GRADIENT Methods The research protocol of this study was approved by our institutional Medical Ethics Committee. Subjects In the course of their education, standard 10-second 12-lead ECGs were obtained from medical students of the Leiden University. Participation was voluntary and all students gave written informed consent. Height and weight were measured, body mass index (BMI) was calculated, and body surface area (BSA) was assessed using Mosteller s formula. 14 All ECGs were scrutinized for normality based on the Minnesota ECG coding protocol 15 by an attending cardiologist. Normal ECGs were included when subjects fulfilled the following criteria: age between 18 yrs and 29 yrs and heart rate between 50 beats per minute (bpm) and 100 bpm (Minnesota criterion 8-7, 8-8). All ECGs were recorded with Megacart electrocardiographs (Type 4.9, Siemens, Germany) and electronically stored in a Megacare ECG management system (VF 2.1, Dräger, Germany.) Electrocardiographic Analysis ECGs were exported from the ECG database management system and analyzed with the MAT- LAB-based (The MathWorks, Natick, USA) computer program LEADS (Leiden ECG Analysis and Decomposition Software). 16 LEADS first detects all QRS complexes and corrects the baseline. Then, supervised beat selection for subsequent beat averaging is done; acceptation/rejection of beats is based on signal-to-noise ratio, on interbeat interval regularity and on representative QRS-T morphology. After computation of the averaged ECG complex, an averaged VCG complex is synthesized using the inverse Dower matrix. 13, 17 In the averaged ECG complex, the onset of the QRS complex, the J point and the end of the T wave are detected automatically. The default position of the J point can be adjusted manually with a crosshair-cursor procedure, facilitating accurate placement according to the Minnesota ECG coding protocol. Global end of T is calculated in the vector magnitude signal as the intersection of the steepest tangent to the descending limb of the T wave and the base-line. 18 Given these landmarks in time, the spatial QRS-T angle as well as the SVG azimuth, elevation and magnitude are computed as follows. First, the QRS and T integrals, i QRS and i T, are both approximated by calculating the numerical sum of X-Y-Z deflections (amplitudes of positive deflections are added and of negative deflections are subtracted) in 2 ms intervals (corresponding to 500 samples/s) covering the QRS complex and T wave. The spatial QRS-T angle is the angle between i QRS and i T and the SVG is calculated as the vectorial sum of i QRS and i T. Axis directions, defined as azimuth and elevation, are represented in accordance with the AHA vectorcardiography coordinates standard 19 in our study. 183
185 Chapter 11 Statistical Analysis SPSS (12.0.1, SPSS Inc., USA) was used for statistical analysis. Where appropriate, data are reported as mean with standard deviation (SD). Values of the spatial QRS-T angle and SVG were calculated separately for males and females and compared using an unpaired Student t-test. To identify factors that potentially explain differences in spatial QRS-T angle and SVG between males and females, differences in electrocardiographic characteristics (mean QRS vector magnitude/orientation, mean T vector magnitude/orientation, QRS integral, T integral) and anthropomorphic measurements (height, weight, BMI, BSA) were computed and compared. Moreover, Pearson correlation coefficients were calculated between the aforementioned electrocardiographic characteristics and the spatial QRS-T angle and SVG. Furthermore, Spearman rank correlations were calculated between the anthropomorphic measurements and the spatial QRS-T angle and SVG. Thereafter, multiple linear regression was used to correct male/female differences in spatial QRS-T angle and SVG for dissimilarities in anthropomorphic measurements between males and females. Normal limits were set at the 2 nd and 98 th percentile. 11 Single linear regression was used to calculate normal limits for SVG magnitudes depending on heart rate. Here SVG was logarithmically transformed to meet the assumptions for single linear regression (constant variance). Normal limits (2 nd and 98 th percentile) were obtained for the log-transformed SVG by adding and subtracting 2.05 times the residual SD to/from the regression equation. The obtained normal limits were then transformed back into the original scale. Results ECGs were made in 804 subjects. The ECGs of 67 subjects were excluded because of technical reasons (electrode displacement, missing leads, signal noise), 22 ECGs were considered abnormal according to the Minnesota criteria, in 41 subjects the heart rate criteria were not met and 14 subjects did not meet the age criteria. Thus, the ECGs of 660 (449 female, 211 male) subjects were included in the analysis. The anthropomorphic and demographic characteristics of this study group are presented in Table 1. Table 2 summarizes the descriptive statistics and the observed normal limits in the form of the 2 nd and 98 th percentile of all electrocardiographic characteristics. Furthermore, a graphical representation of SVG orientation in relation to SVG magnitude is given in Figure 2. The mean values of the spatial QRS-T angle and the SVG in males differed significantly from the mean values of female subjects. Male subjects had significantly wider spatial angles and larger SVG magnitudes as compared to female subjects. Furthermore, the SVG orientation in males was more anterior and slightly more superior than in female subjects. 184
186 NORMAL LIMITS OF QRS-T ANGLE AND VENTRICULAR GRADIENT Table 1. Characteristics of the female and male subjects. Female subjects (n=449) Male subjects (n=211) Age (yrs) 19.6 ± ± 1.6 Height (m) 1.71 ± ± 0.07 Weight (kg) 62.8 ± ± 10.0 BMI (kg/m²) 21.4 ± ± 2.7 BSA (m²) 1.7 ± ± 0.14 Heart rate (bpm) 73 ± ± 11 BMI: Body Mass Index; BSA: Body Surface Area; bpm: beats per minute. All data are presented as mean ±SD. Table 2. Normal limits of the spatial QRS-T angle and ventricular gradient. Female subjects Male subjects Mean SD Median 2 % 98 % Mean SD Median 2 % 98 % QRS-T angle (º) 66 a a SVG magnitude (mv*ms) 81 a a SVG azimuth (º) -13 a a SVG elevation (º) 30 a a QRS duration (ms) 87 a a Mean QRS vector (μv) 405 a a QRS axis azimuth (º) QRS axis elevation (º) QRS integral (mv*ms) 34.8 a a QTc interval (ms) 406 a a Mean T vector (μv) 214 a a T axis azimuth (º) -36 a a T axis elevation (º) 21 a a T integral (mv*ms) 60.8 a a Descriptive statistics and normal limits for females and males separately. SVG: spatial ventricular gradient. Bold numbers represent normal limits. a Difference between males and females, significant at the level. Table 3 lists the correlations between SVG magnitude, spatial QRS-T angle and vector characteristics, for males and for females. A weak inverse correlation was present between the spatial QRS-T angle and the SVG magnitude in males and females, indicating that wide spatial QRS-T angles were associated with small SVGs. The mean QRS vector magnitude and QRS integral correlated positively with the SVG magnitude and the correlation was stronger in females as compared to males. Strong, positive, correlations, similar in both sexes, were observed between the mean T vector magnitude, the T integral and the SVG magnitude. The correlation between the QRS and T integrals on one hand and SVG magnitude on the other hand is depicted in Figure 3. QRS duration was not correlated to SVG magnitude in females, but demonstrated a weak positive correlation in males. JT interval was correlated with SVG magnitude similarly in both sexes. The Spearman rank correlations between, on one hand, the spatial QRS-T angle and the SVG and, on the other hand, the anthropomorphic subject characteristics and heart rate are listed in 185
187 Chapter 11 Figure 2. Orientation and magnitude of the spatial ventricular gradient. Spatial ventricular gradients as measured in our study group. Grey squares = female subjects; black squares = male subjects. Panels A, B and C: Projections of the spatial ventricular gradients in the frontal, sagittal and transversal planes. The azimuth of SVG can readily be seen in the transversal plane. Combination of these figures demonstrates that the ventricular gradient vector points to the left, forward and downward, which is in the direction of the cardiac apex. Panel D: Elevation and magnitude of the spatial ventricular gradient. Azimuth, elevation, and directions of the positive X-, Y- and Z-axes are in accordance with the AHA vectorcardiography coordinate standard. 19 Table 4. Several correlations reached significance but were weak. A relatively strong correlation of in females and in males was found between SVG magnitude and heart rate. As readily appreciable in Figure 4, the distribution of the SVG magnitudes was wider for lower heart rates than for higher heart rates. Therefore, SVG magnitudes were logarithmically transformed after which a single linear regression of log (SVG magnitude ) on heart rate (HR) was made. The following regression equations were found: 186
188 NORMAL LIMITS OF QRS-T ANGLE AND VENTRICULAR GRADIENT Table 3. Correlation between the spatial ventricular gradient, QRS-T angle and the cardiac vector for males and females. QRS-T angle Mean QRS vector QRS duration QRS integral Mean T vector JT interval T integral Males SVGmagnitude a 0.24 a 0.17 b 0.30 a 0.72 b 0.29 a 0.82 a Females SVGmagnitude a 0.56 a 0.03 c 0.58 a 0.80 a 0.27 a 0.86 a Pearson correlation coefficients between SVG, QRS-T angle and vector characteristics. SVG, spatial ventricular gradient. a Significant at the P= 0.01 level; b Significant at the P= 0.05 level; c NS Figure 3. Association between QRS integral, T integral and SVG magnitude. Linear correlations between the integrals of QRS and T on one hand and SVG magnitude on the other hand. Panel A shows that a weak correlation was present between the QRS integral and SVG magnitude, whereas panel B demonstrates a strong correlation between the T integral and SVG magnitude, indicating that repolarization characteristics are most important for the SVG magnitude. Female subjects: 10log (SVG magnitude ) = *10-3 HR (SD = 0.12) Males subjects: 10log (SVG magnitude ) = *10-3 HR (SD = 0.11) Multiple linear regression analysis was performed to investigate the potential influence of height, weight, BMI and BSA on the female-male differences found in the SVG and the spatial QRS-T angle. This, however, did not yield significant further explanation of the female-male differences observed. Also, the sex coefficient did almost not change in the multiple linear regression model. 187
189 Chapter 11 Table 4. Correlation between anthropomorphic characteristics, the QRS-T angle and the spatial ventricular gradient. HR Height Weight BMI BSA Female QRS-T angle ( ) 0.11 b b SVG magnitude (mv*ms) a 0.14 a 0.11 b b SVG azimuth ( ) SVG elevation ( ) b Male QRS-T angle ( ) 0.21 a SVG magnitude (mv*ms) a SVG azimuth ( ) SVG elevation ( ) a Spearman rank correlation coefficients between subject characteristics, the QRS-T angle and the SVG. SVG: spatial ventricular gradient; HR: heart rate; BMI: body mass index; BSA: body surface area. a Correlation is significant at the 0.01 level. b Correlation is significant at the 0.05 level. Figure 4. Heart rate and the spatial ventricular gradient magnitude. Logarithmic regression of the spatial ventricular gradient magnitude on heart rate in male and female subjects. The upper and lower (dashed) lines denote the 96% prediction interval. Discussion In the present study, we established normal limits of the spatial QRS-T angle and the SVG in young adults. Key findings were that all values of male and female subjects, even after correction for anthropomorphic measurements, differed significantly. This underscores the necessity for defining distinct normal limits for male and female subjects. In addition, the correlation of SVG magnitude with the T integral was stronger than the correlation with the QRS integral, signifying that repolarization characteristics are more important than depolarization characteristics for the magnitude of SVG in ECGs of young adult normal subjects. Moreover, there was a significant influence of heart rate on the spatial ventricular gradient magnitude: Higher heart rates were associated with smaller magnitudes of the spatial ventricular gradient. 188
190 NORMAL LIMITS OF QRS-T ANGLE AND VENTRICULAR GRADIENT Differences between male and female subjects The spatial QRS-T angle and SVG both strongly depended on sex. In our study, male subjects had a larger spatial QRS-T angle and a larger SVG magnitude than female subjects. The most important sex-dependent difference in SVG orientation was found in the SVG azimuth, which was directed more anteriorly in males than in females. The difference in SVG elevation between males and females, albeit significant, was small (3 ). Also, normal limits of SVG elevation were almost equal in males and females, the actual difference in lower and upper bound of normal limits being 4 and 1 respectively. In our study, the mean spatial QRS-T angle was 80 for males and 66 for females. In a study by Rautaharju et al., 20 in which ECG predictors of mortality were investigated in a large (n=4,912) community-based population of older subjects (ages>65 yrs), similar differences between male and female subjects for the spatial QRS-T angle were found. They reported a mean spatial QRS-T angle of 81 for males (mean age 72.8 ± 5.7 yrs) and a mean spatial QRS-T angle of 67 for females (mean age 72.2 ± 5.3 yrs). Sex-related differences in SVG magnitude were investigated in a small young (ages yrs) group of 30 male and 30 female Japanese subjects, by Yamauchi and colleagues. 21 They found comparable differences between the SVG magnitude in males (105 mv ms vs. 110 mv ms in our subjects) and females (81 mv ms, vs. 81 mv ms in our subjects). It is unclear where the differences in spatial QRS-T angle and SVG between male and female subjects exactly originate. The orientation of the QRS axis was similar in male and female subjects (Table 2). The orientation of the T axis, however, was significantly more anterior in male (-47 ) as compared to female subjects (-36 ). As a consequence, the angle between the QRS- and T axis, the spatial QRS-T angle, was wider in male subjects. In general, widening of the angle between two vectors results in a smaller vectorial sum of these vectors (assuming a constant magnitude of these vectors, Figure 1). The inverse correlation between the spatial QRS-T angle and the SVG in the present study population underscores this principle (wide spatial QRS-T angles were associated to small SVGs). However, in our population, male subjects have larger QRS and T integrals and therefore we observed a greater SVG magnitude in spite of a wider spatial QRS-T angle in male subjects. In our population of normal subjects, significant correlations between the SVG magnitude and vector characteristics were present. Whereas the correlation between SVG magnitude and mean QRS vector magnitude was relatively weak, the correlation between SVG magnitude and the mean T vector magnitude was much stronger in both male and female subjects (Figure 4). This observation demonstrates that, in the normal heart, repolarization (T-wave) characteristics are more important for the magnitude of SVG than depolarization (QRS complex) characteristics. As a consequence, the observed differences in the spatial QRS-T angle and SVG between males and females are likely to originate from repolarization rather than from depolarization characteristics. The anthropomorphic measurements weight, height and 189
191 Chapter 11 thereof derived parameters correlated only weakly correlated to SVG and the spatial QRS-T angle (Table 3) in the present study. In a multiple linear regression model, these parameters were not explanatory for the differences in the SVG and the spatial QRS-T angle between male and female subjects. Possibly, explanation of the male-female difference is partially to be found in a different ratio between thorax dimensions and heart size, a different amount of subcutaneous fat, and presence of breast adipose tissue in female subjects. 22 Furthermore, parameters that relate to the difference in cardiac morphology between males and females (e.g., ventricular mass, wall thickness) may further explain the difference in spatial QRS-T 23, 24 angle, SVG magnitude and SVG orientation. Comparison with earlier published normal limits Until now, the publications of Pipberger and associates 11, 12 were the only source for normal limits of the spatial QRS-T angle and SVG. Important differences in both normal limits and means of the SVG magnitude and SVG elevation are present between our study and these former studies. The most striking differences in normal limits are found in the ventricular gradient magnitude and the ventricular gradient elevation upper limits. In our study, the upper normal limit of the ventricular gradient magnitude is 47 mv ms larger and the elevation is 16 smaller than reported by the Pipberger group. 11, 12 Moreover, differences of the same order of magnitude and direction are seen in the mean value of these parameters (31 mv ms and 9, respectively). Diversity in the composition of the study groups and/or a methodological difference may underlie these differences. Firstly, the study group of Pipberger and colleagues consisted of hospitalized men without evidence for cardiac disease. In that study group, non-cardiac disease and the administration of non-cardiac medication could have induced changes in cardiac electrophysiology resulting in (temporary) changes of the spatial QRS-T angle and/or SVG. 25 Secondly, life-style, dietary and racial differences between the study populations may also explain part of the observed differences. 26, 27 Thirdly, Pipberger and colleagues excluded heart rates lower than 60 bpm and, because lower heart rates are associated with larger SVG magnitudes (Figure 4), this may have selectively filtered out large SVG magnitudes. Finally, Pipberger and associates used 8-electrode 3-lead Frank VCGs instead of VCGs synthesized from standard 10-electrode 12-lead ECGs which is most commonly used nowadays. 2, 20 Obviously, this affects the shape of the vector loop and, consequently, may influence the spatial QRS-T angle and/or SVG. 190
192 NORMAL LIMITS OF QRS-T ANGLE AND VENTRICULAR GRADIENT Limitations In our study, normality of the subjects was not confirmed by obtaining a history, a physical exam or complementary investigations. However, the ECGs of included subjects were closely scrutinized for abnormalities, which makes the likelihood of systematical inclusion of abnormal subjects small. A second limitation is that only young subjects (18 29 yrs) were investigated in our study. Previous studies demonstrated that particularly SVG is a parameter that decreases with age. 12, 21 Therefore, further studies should include subjects from all ages. Implications Recently, the spatial QRS-T angle was described as a risk stratifier for cardiovascular death in a study by Kardys et al. 2 and by Yamazaki and colleagues. 5 In these studies, the upper limit of the spatial QRS-T angle in the low risk group was defined as 105 and as 100, respectively. However, our study demonstrates that the normal spatial QRS-T angle can range up to 116 in females and 130 in males. In our study group, 44 males and 33 females have a spatial QRS-T angle wider than 100 and 32 males and 22 females have a spatial QRS-T angle wider than 105. It is unlikely that all these subjects should be classified as at high risk for cardiovascular death. This indicates that risk stratification criteria for the occurrence of cardiovascular death as applied by Kardys and by Yamazaki may have been too strict. In addition, they should have been different for male and female subjects. Conclusions The spatial QRS-T angle and the spatial ventricular gradient orientation and magnitude differ significantly between female and male subjects. In male subjects, the spatial QRS-T angle is wider and the spatial ventricular gradient magnitude is larger. Furthermore, the spatial ventricular gradient orientation is more anterior in male subjects as compared to female subjects. In addition, the spatial ventricular gradient magnitude strongly depends on heart rate. High heart rates are associated with small spatial ventricular gradient magnitudes; this should be taken into account when assessing the normality of a spatial ventricular gradient magnitude. 191
193 Chapter 11 References 1. Draisma HHM, Schalij MJ, et al. Elucidation of the spatial ventricular gradient and its link with dispersion of repolarization. Heart Rhythm 2006; 3: Kardys I, Kors JA, et al. Spatial QRS-T angle predicts cardiac death in a general population. Eur Heart J 2003; 24: Durrer D, van Dam RT, et al. Total excitation of the isolated human heart. Circulation 1970; 41: van Huysduynen BH, Swenne CA, et al. Dispersion of repolarization in cardiac resynchronization therapy. Heart Rhythm 2005; 2: Yamazaki T, Froelicher VF, et al. Spatial QRS-T angle predicts cardiac death in a clinical population. Heart Rhythm 2005; 2: Ernst Simonson. Differentiation between normal and abnormal in electrocardiology. 1st ed. St Louis: The C.V. Mosby Company, Hurst JW. Thoughts about the ventricular gradient and its current clinical use (Part I of II). Clin Cardiol 2005; 28: Hurst JW. Thoughts about the ventricular gradient and its current clinical use (part II of II). Clin Cardiol 2005; 28: Mashima S, Fu L, et al. The ventricular gradient and the vectorcardiographic T loop in left ventricular hypertrophy. J Electrocardiol 1969; 2: Gartner W, Schaefer H. [Theory and clinical usefulness of the ventricular gradient in ECG.]. Arch Kreislaufforsch 1957; 27: Draper HW, Peffer CJ, et al. The Corrected Orthogonal Electrocardiogram and Vectorcardiogram in 510 Normal Men (Frank Lead System). Circulation 1964; 30: Pipberger HV, Goldman MJ, et al. Correlations of the orthogonal electrocardiogram and vectorcardiogram with consitutional variables in 518 normal men. Circulation 1967; 35: Kors JA, van Herpen G, et al. Reconstruction of the Frank vectorcardiogram from standard electrocardiographic leads: diagnostic comparison of different methods. Eur Heart J 1990; 11: Mosteller RD. Simplified calculation of body-surface area. N Engl J Med 1987; 317: Blackburn H, KEYS A, et al. The electrocardiogram in population studies. A classification system. Circulation 1960; 21: Draisma HHM, Swenne CA, et al. LEADS: An Interactive Research Oriented ECG/VCG Analysis System. Computers in Cardiology 2005; 32: Dower GE, Machado HB, et al. On deriving the electrocardiogram from vectoradiographic leads. Clin Cardiol 1980; 3: Lepeschkin E, Surawicz B. The measurement of the Q-T interval of the electrocardiogram. Circulation 1952; 6: Kossman CE, Brody DA, et al. Report of committee on electrocardiography, American Heart Association. Recommendations for standardization of leads and of specifications for instruments in electrocardiography and vectorcardiography. Circulation 1967; 35: Rautaharju PM, Ge S, et al. Comparison of mortality risk for electrocardiographic abnormalities in men and women with and without coronary heart disease (from the Cardiovascular Health Study). Am J Cardiol 2006; 97: Yamauchi K, Sotobata I. Sex and age differences in ventricular gradient. Jpn J Med 1991; 30: van Oosterom A, Hoekema R, et al. Geometrical factors affecting the interindividual variability of the ECG and the VCG. J Electrocardiol 2000; 33 Suppl:
194 NORMAL LIMITS OF QRS-T ANGLE AND VENTRICULAR GRADIENT 23. Surawicz B, Parikh SR. Differences between ventricular repolarization in men and women: description, mechanism and implications. Ann Noninvasive Electrocardiol 2003; 8: Sotobata I, Richman H, et al. Sex differences in the vectorcardiogram. Circulation 1968; 37: Albrecht CA. Proarrhythmia with non-antiarrhythmics. A review. Cardiology 2004; 102: Mozaffarian D, Prineas RJ, et al. Dietary fish and n-3 fatty acid intake and cardiac electrocardiographic parameters in humans. J Am Coll Cardiol 2006; 48: Djousse L, Rautaharju PM, et al. Dietary linolenic acid and adjusted QT and JT intervals in the National Heart, Lung, and Blood Institute Family Heart study. J Am Coll Cardiol 2005; 45:
195
196 Chapter 12 Diagnosis and Mortality Prediction in Pulmonary Hypertension: The Value of the ECG-derived Ventricular Gradient Roderick WC Scherptong Ivo R Henkens Gijs FL Kapel Cees A Swenne Klaas W van Kralingen Menno V Huisman Annemie JM Schuerwegh Jeroen J Bax Ernst E vd Wall Martin J Schalij Hubert W Vliegen J. Electrocardiol 2012 May: 45(3): 312-8
197 Chapter 12 Abstract Purpose The aim was to investigate the use of the ECG-derived ventricular gradient, projected on the x-axis (VGx), for detection of pulmonary hypertension (PH) and for prediction of all-cause mortality in PH patients. Methods In patients referred for PH screening (n=216), the VGx was calculated semi-automatically from the ECG and was defined as abnormal when <24 mv ms. The VGx of PH patients was compared to the VGx of patients without PH. The association between a reduced VGx and mortality was investigated in PH patients. Results PH patients (n=117) had a significantly reduced VGx:14 ±27 vs. 45 ±23 mv ms, p< Furthermore, a severely reduced VGx (<0 mv ms) was associated with increased mortality in PH patients: hazard ratio (95% CI , p=0.012), per mv ms VGx decrease. Conclusion Reduced VGx is associated with the presence of PH and, more importantly, within PH patients, a severely reduced VGx predicts mortality. 196
198 VENTRICULAR GRADIENT IN PULMONARY HYPERTENSION Introduction Pulmonary hypertension (PH) is an uncommon, but serious disease, characterized by a mean pulmonary artery pressure (MPAP) 25 mm Hg. 1 PH can be due to a primary disease process in the pulmonary arteries, referred to as pulmonary arterial hypertension (PAH). 2,3 Furthermore, PH can be secondary to e.g. left sided heart disease, pulmonary parenchyma abnormalities, thromboembolic occlusion of the pulmonary arteries or other diseases that lead to pulmonary vascular abnormalities. 2,3 As PH is a progressive disease, irrespective of the cause, timely detection and treatment is necessary to improve symptoms and prognosis. 4 6 However, symptoms are generally mild until advanced stages of the disease and regular screening for PH is frequently required, specifically in patients who are at risk for developing PAH (e.g. patients with inflammatory connective tissue diseases, portal hypertension, or congenital heart disease). 7 Currently, the gold-standard for PH screening is echocardiography, in which the systolic pulmonary artery pressure (SPAP) is derived through estimation of the peak systolic right ventricular pressure. 8 Recently, the vectorcardiogram (VCG), synthesized from the standard 12-lead ECG, demonstrated to be of use for detection of elevated right ventricular (RV) pressure as a consequence of PH. In a case-control study, the ECG of patients with idiopathic PAH was compared to the ECG of matched healthy subjects. 9 In that study, the ventricular gradient (VG) vector projected on the x-axis (VGx) was strongly associated with pulmonary artery pressure. It was shown that the VGx has a positive value in healthy subjects and steadily reduces to zero or becomes negative with increasing RV afterload. In addition, the VGx demonstrated to have a higher diagnostic accuracy for detecting elevated RV pressure, than other ECG and VCG parameters. This indicated that quantitative ECG screening could be a valuable tool for the recognition of elevated pulmonary pressure in suspected idiopathic PAH patients. However, it remained to be investigated whether the observations were also applicable in the regular patient population of suspected PH patients, in which comorbidity is common. 10 In addition, the association between a reduced VGx and patient survival was not investigated. Therefore, we investigated whether quantitative ECG screening with the VGx, could also be applied in the more heterogeneous patient population that is regularly referred for PAH screening. Furthermore, the association of a reduced VGx and all-cause mortality was assessed. Materials and Methods Consecutive patients who were referred for diagnosis and treatment of suspected PAH were included in the current analysis. First, all patients underwent the standard noninvasive screening protocol for PAH according to the international guidelines. 11,12 As part of this protocol, a 10s, 12-lead electrocardiogram (ECG) was obtained and echocardiography was performed. 197
199 Chapter 12 Second, if the noninvasive screening protocol indicated the presence of PAH or when the absence of elevated pulmonary artery pressure could not be established, right heart catheterization was performed. Thus, through combination of the results from the noninvasive screening protocol and right heart catheterization, the final PH diagnosis was established and patients were categorized into five different groups according to the WHO classification for PH etiology. Treatment was initiated subsequently, and the patients with PH were followed regularly during out-patient clinic visits according to current guidelines. 10,13,14 Patients with PAH were followed-up every three months, specifically when PAH-aimed therapy was initiated. Patients with other PH etiologies were followed less frequently, however at least bi-annually. For the purpose of the current evaluation; all-cause mortality was noted during follow-up. Electrocardiography The ECGs were first stored digitally, thereafter exported from the ECG database management system and analyzed with the MATLAB-based (The MathWorks, Natick, MA) computer program LEADS (Leiden, the Netherlands). Details on the technical background of LEADS have been reported previously. 15 In short, the standard 10s ECG was averaged into one single beat that was subsequently converted into a vectorcardiographic beat in a largely automated process. Besides heart rate, QRS duration and QT interval (corrected for heart rate according to the Fridericia formula), the software quantitated the magnitude and orientation of the mean QRS and T integral vectors, defined as azimuth (horizontal vector orientation, in degrees) and elevation (vertical vector orientation, in degrees). 16 Thus, the angle between QRS and T vectors, the QRS-T angle was calculated and ventricular gradient vector, including the projection of the VG vector on the x-axis (VGx), was derived (see Figure 1). 9 In a previous study, it was demonstrated that normal subjects had a VGx of 24 mv ms or higher. 9 Therefore, with the purpose to analyze this cut-off value in a clinical context, the current patient population was subdivided into a group with a VGx <24 mv ms and a group with a VGx 24 mv ms. Echocardiography Imaging took place in the left lateral decubitus position on a commercially available system (Vivid Seven, General Electric-Vingmed, Milwaukee, Wisconsin). Regular images were obtained and specific attention was addressed to the measurement of the RV to RA pressure gradient or tricuspid regurgitant jet gradient (TR gradient) and the derived estimation of the SPAP. 8 The estimated SPAP was defined as the RV to RA pressure gradient added to the right atrial pressure. Right atrial pressure was estimated 5 mmhg to 15 mmhg, according to 198
200 VENTRICULAR GRADIENT IN PULMONARY HYPERTENSION Figure 1. Orientation and size of the ventricular gradient. Panel A: The ventricular gradient is the resultant vector of the QRS and T integral vector, which have the same orientations as the regular QRS and T axes. Panel B: The ventricular gradient projected on the x-axis (VGx) previously demonstrated to be reduced in patients with idiopathic pulmonary arterial hypertension (dashed vector) as compared to healthy subjects (grey vector).(9) Positive X direction: right-to-left; positive Y direction: anterior-to-posterior. the diameter and inspiratory collapse of the inferior caval vein. 17 If adequate measurement of the TR gradient could not be obtained in the apical 4 chamber position, the measurement was repeated in the short-axis view at the level of the aorta and, if necessary, in the subcostal view. If this still did not result in adequate measurement of the TR gradient, agitated saline was used to improve the signal intensity of the tricuspid regurgitant jet. 14 Right heart catheterization Right heart catheterization was performed according to the international guidelines for invasive hemodynamic assessment of PAH. 18 For the current analysis, the SPAP, the diastolic pulmonary artery pressure (DPAP) and the mean pulmonary artery pressure (MPAP) were used. Measurements were obtained with the patient in supine position with a Swan-Ganz catheter placed in the pulmonary artery. 199
201 Chapter 12 Statistical analysis To investigate how elevated pulmonary pressure was reflected in ECG changes, Pearson correlation coefficients were determined between ECG characteristics and the echocardiographically estimated SPAP, which is currently the gold-standard for noninvasive pulmonary pressure estimation. Furthermore, the odds ratio of a VGx <24 mv ms as compared to 24 mv ms, was calculated for the presence of an estimated SPAP 40 mmhg, which corresponds to the echocardiographical diagnosis of pulmonary hypertension. In addition, the odds ratio of an abnormal VGx was calculated for the final diagnosis of PH, which was established after patients completed the noninvasive screening protocol and, if necessary, right heart catheterization. Furthermore, a receiver operating characteristic (ROC) curve analysis was performed, to determine the diagnostic accuracy of the above-described VGx cut-off (<24 mv ms) and three other cut-off levels (30, 35 and 40 mv ms). Thereafter, the 3-year survival characteristics were investigated in patients with PH. For this purpose, univariate and multivariate (adjusted for sex, age, heart rate and WHO PH classification) Cox s proportional hazard regression analysis was performed, in which the VGx was entered into the regression equation as a continuous variable. It was previously noted that PAH patients with most extensive RV disease typically present with a VGx <0 mv ms. 9 Therefore, all-cause mortality Kaplan Meier curve of patients with a VGx <0 mv ms was compared to the Kaplan Meier curve of patients with a VGx 0 mv ms. A logrank test was performed to assess whether the survival curves differed significantly between both groups. Where appropriate, continuous variables are reported as mean ± SD, binary logistic and Cox s proportional hazard regression coefficients are reported with 95% confidence interval. A p-value <0.05 was considered statistically significant. Results General and disease specific characteristics of the patient population A total of 216 patients (82 male, 38.8%) were screened for the presence of PAH. Overall the average age was 54.6 ±16.4 years at the time of screening. After initial noninvasive screening 143 patients were suspected of PH (see Figure 2), mainly due to an elevated SPAP ( 40 mmhg) as estimated echocardiographically (n=114). In 29 of the 143 patients, there was no echocardiographical evidence for PH. Nonetheless, a high suspicion of PAH was present in these patients, as a consequence of the severity of symptoms, as a result of abnormal functional tests or due to radiological findings. From the group of 143 suspected PH patients, 89 underwent right heart catheterization. Right heart catheterization was not performed in the remaining 54 patients in whom an 200
202 VENTRICULAR GRADIENT IN PULMONARY HYPERTENSION Figure 2. Results of the screening algorithm for patients suspected of PAH. In total, 216 patients were screened noninvasively. After noninvasive screening, 143 patients were suspected of PH and 73 patients had no PH. In 89 patients, suspected of PAH, right heart catheterization was performed, which confirmed PH in 63 patients. After noninvasive screening and right heart catheterization, PH was diagnosed in 117 patients. elevated SPAP was found echocardiographically. This group consisted of patients with clinically and echocardiographically established Eisenmenger syndrome, or patients in whom left sided heart failure was undisputable and right heart catheterization would have no further therapeutic consequences. After noninvasive screening of all patients, and right heart catheterization in the patients in whom it was indicated, PH was diagnosed in 117 patients. The characteristics of these patients are listed in Table 1. In 49 patients (42%) WHO group I (previously referred to as primary pulmonary hypertension) was diagnosed. Left ventricular or valvular disease and hypoxic lung disease were other frequently occurring causes of pulmonary hypertension (Table 1). Electrocardiographic diagnosis of elevated pulmonary pressure The ECG parameters are summarized in Table 2. PH patients had a higher heart rate, a longer QRS-duration and QTc-interval as compared to patients without PH. Furthermore, the angle 201
203 Chapter 12 Table 1. Patient characteristics. No pulmonary hypertension (n=99) Pulmonary hypertension (n=117) Clinical characteristics Age (years) 54.1 ± ± Range Sex (male/female) 39/60 43/ Functional class (NYHA) 1.9 ± ± 0.7 <0.001 Main risk factor for developing PH (n) Congenital systemic-pulmonary shunt 5 35 Connective tissue disease 27 7 Auto-immune disease 2 5 Liver Cirrhosis 9 4 Pulmonary embolism 23 6 Hypoxic lung disease Left ventricular/valvular disease 5 30 Other or no specific risk factor 15 4 Echocardiography Estimated SPAP (mmhg) 31 ± 9 61 ± 20 <0.001 Right heart catheterization SPAP (mmhg) 27 ± 6 65 ± 21 <0.001 DPAP (mmhg) 11 ± 4 27 ± 13 <0.001 MPAP (mmhg) 17 ± 4 40 ± 13 <0.001 WHO PH classification 117 I (%) 49 (42%) II (%) 31 (26%) III (%) 14 (12%) IV (%) 6 (5%) V (%) 3 (3%) Combined (%) 14 (12%) DPAP: diastolic pulmonary artery pressure; MPAP: mean pulmonary artery pressure; PH: pulmonary hypertension; SPAP: systolic pulmonary artery pressure. Numbers correspond to n, unless mentioned otherwise. between the de- and repolarization vector, or QRS-T angle, was significantly wider. However, as compared to the other ECG and VCG parameters, the most prominent difference between PH patients and patients without PH was observed in the VGx, which was significantly lower in PH patients. A less pronounced VGx difference between patients with and patients without PH, was observed in those who either had a history of left sided heart disease or a history of a WHO group V-related disease (e.g. sarcoidosis) (see Figure 3). The correlations between the SPAP, as estimated with echocardiography, and the ECG parameters are summarized in Table 2. The VG vector demonstrated to be inversely correlated with the estimated SPAP, as was the VGx, which demonstrated the strongest correlation with the SPAP (R=-0.64, p<0.001). The negative correlation denoted that an increasing SPAP was associated with a decreasing VGx. Hence, a reduced VGx represented an elevated SPAP. To further explore the clinical applicability of the VGx, patients with an abnormal VGx (<24 mv ms) were compared to patients with a normal VGx. Thereafter, the odds ratio of having a P 202
 Pulmonary hypertension (n=117) P R estimated SPAP (n=203) Heart rate (bpm) 72 ± 13 79 ± 17 <0.001 0.17 0.016 QRS duration (ms) 93 ± 22 102 ± 25 0.007 0.22 0.")
204 VENTRICULAR GRADIENT IN PULMONARY HYPERTENSION Table 2. ECG characteristics. No pulmonary hypertension (n=98) Pulmonary hypertension (n=117) P R estimated SPAP (n=203) Heart rate (bpm) 72 ± ± 17 < QRS duration (ms) 93 ± ± QTc interval (ms) 403 ± ± <0.001 Mean QRS vector magnitude (μv) 352 ± ± QRS axis azimuth (º) 38 ± ± QRS axis elevation (º) 15 ± ± Mean T vector magnitude (μv) 164 ± ± T axis azimuth (º) -40 ± ± 75 < <0.001 T axis elevation (º) 20 ± ± QRS-T angle (º) 83 ± ± 43 < <0.001 Ventricular gradient magnitude (mv*ms) 59 ± ± 22 < <0.001 Ventricular gradient azimuth (º) -6 ± ± 73 < Ventricular gradient elevation (º) 26 ± ± Projection of VG on x-axis (mv*ms) 44 ± ± 27 < <0.001 Azimuth: horizontal vector orientation (degrees), Elevation: vertical vector orientation (degrees). P Figure 3. Mean VGx according to patient history. Patients were subdivided into different groups according to the world health organization classification for pulmonary hypertension etiology. Group I refers to primary forms of pulmonary arterial hypertension. Patients in group II have a history of left sided heart disease. Patients in group III have a history of pulmonary disease. Group IV refers to a history of pulmonary embolism. Group V is the miscellaneous category and mostly existed of patients with sarcoidosis. Mean and SEM were plotted to visualize the differences in VGx between patients with and patient without pulmonary hypertension (PH). reduced VGx for the presence of elevated pulmonary pressure, was calculated. Patients with a reduced VGx (<24 mv ms, n=97), exhibited an odds ratio of 11.3 (95% CI , p<0.001) for the echocardiographic diagnosis of PH, as compared to patients with a normal VGx. Exclusion of patients with a history of left sided heart disease, resulted in an odds ratio of 17.4 (95% CI , p<0.001) Furthermore, in patients with a reduced VGx, the odds ratio for the presence of the final PH diagnosis, which was established after patients completed the noninvasive diagnostic algorithm and (if necessary) right heart catheterization, was 7.9 (95% 203
Echocardiographic evaluation of left ventricular function in ischemic heart disease. Sjoerd A. Mollema
 Echocardiographic evaluation of left ventricular function in ischemic heart disease Sjoerd A. Mollema The studies described in this thesis were performed at the Department of Cardiology of the Leiden University
Multimodality Imaging of Anatomy and Function in Coronary Artery Disease. Joanne D. Schuijf
 Multimodality Imaging of Anatomy and Function in Coronary Artery Disease Joanne D. Schuijf The research described in this thesis was performed at the departments of Cardiology and Radiology of the Leiden
Multimodality imaging in chronic coronary artery disease Maureen M. Henneman
 Multimodality imaging in chronic coronary artery disease Maureen M. Henneman 080237 Henneman boek.indb 1 03-11-2008 10:56:25 The studies described in this thesis were performed at the Department of Cardiology
Cardiac Bone Marrow Cell Injection for Chronic Ischemic Heart Disease
 Cardiac Bone Marrow Cell Injection for Chronic Ischemic Heart Disease Monique R.M. Jongbloed 070303 Beeres Boek.indb 1 06-09-2007 17:13:27 The studies described in this thesis were performed at the Department
Cover Page. The handle holds various files of this Leiden University dissertation
 Cover Page The handle http://hdl.handle.net/1887/38594 holds various files of this Leiden University dissertation Author: Haan, Melina C. den Title: Cell therapy in ischemic heart disease models : role
Cover Page. The handle holds various files of this Leiden University dissertation
 Cover Page The handle http://hdl.handle.net/1887/23056 holds various files of this Leiden University dissertation Author: Velders, Matthijs A. Title: Optimization of care for ST-elevation myocardial infarction
Cover Page. The handle holds various files of this Leiden University dissertation.
 Cover Page The handle http://hdl.handle.net/1887/42781 holds various files of this Leiden University dissertation. Author: Elbaz M.S.M.M. Title: Three-dimensional in-vivo intra-cardiac vortex flow from
Adult Echocardiography Examination Content Outline
 Adult Echocardiography Examination Content Outline (Outline Summary) # Domain Subdomain Percentage 1 2 3 4 5 Anatomy and Physiology Pathology Clinical Care and Safety Measurement Techniques, Maneuvers,
UvA-DARE (Digital Academic Repository) The systemic right ventricle van der Bom, T. Link to publication
 The systemic right ventricle van der Bom, T. Link to publication") UvA-DARE (Digital Academic Repository) The systemic right ventricle van der Bom, T. Link to publication Citation for published version (APA): van der Bom, T. (2014). The systemic right ventricle. General
UvA-DARE (Digital Academic Repository) The systemic right ventricle van der Bom, T. Link to publication Citation for published version (APA): van der Bom, T. (2014). The systemic right ventricle. General
"Lecture Index. 1) Heart Progenitors. 2) Cardiac Tube Formation. 3) Valvulogenesis and Chamber Formation. 4) Epicardium Development.
 Heart Progenitors. 2) Cardiac Tube Formation. 3) Valvulogenesis and Chamber Formation. 4) Epicardium Development.") "Lecture Index 1) Heart Progenitors. 2) Cardiac Tube Formation. 3) Valvulogenesis and Chamber Formation. 4) Epicardium Development. 5) Septation and Maturation. 6) Changes in Blood Flow during Development.
"Lecture Index 1) Heart Progenitors. 2) Cardiac Tube Formation. 3) Valvulogenesis and Chamber Formation. 4) Epicardium Development. 5) Septation and Maturation. 6) Changes in Blood Flow during Development.
Left atrial function. Aliakbar Arvandi MD
 In the clinic Left atrial function Abstract The left atrium (LA) is a left posterior cardiac chamber which is located adjacent to the esophagus. It is separated from the right atrium by the inter-atrial
Heart and Lungs. LUNG Coronal section demonstrates relationship of pulmonary parenchyma to heart and chest wall.
 Heart and Lungs Normal Sonographic Anatomy THORAX Axial and coronal sections demonstrate integrity of thorax, fetal breathing movements, and overall size and shape. LUNG Coronal section demonstrates relationship
Cardiac Radiology In-Training Test Questions for Diagnostic Radiology Residents
 Cardiac Radiology In-Training Test Questions for Diagnostic Radiology Residents March, 2013 Sponsored by: Commission on Education Committee on Residency Training in Diagnostic Radiology 2013 by American
Cover Page. The handle holds various files of this Leiden University dissertation.
 Cover Page The handle http://hdl.handle.net/1887/23937 holds various files of this Leiden University dissertation. Author: Liu, Zhen Title: Exploring the interplay between TGF-β and VEGF signalling in
When you see this diagram, remember that you are looking at the embryo from above, through the amniotic cavity, where the epiblast appears as an oval
 When you see this diagram, remember that you are looking at the embryo from above, through the amniotic cavity, where the epiblast appears as an oval disc 2 Why the embryo needs the vascular system? When
Cardiac MRI in ACHD What We. ACHD Patients
 Cardiac MRI in ACHD What We Have Learned to Apply to ACHD Patients Faris Al Mousily, MBChB, FAAC, FACC Consultant, Pediatric Cardiology, KFSH&RC/Jeddah Adjunct Faculty, Division of Pediatric Cardiology
Pediatric Echocardiography Examination Content Outline
 Pediatric Echocardiography Examination Content Outline (Outline Summary) # Domain Subdomain Percentage 1 Anatomy and Physiology Normal Anatomy and Physiology 10% 2 Abnormal Pathology and Pathophysiology
Little is known about the degree and time course of
 Differential Changes in Regional Right Ventricular Function Before and After a Bilateral Lung Transplantation: An Ultrasonic Strain and Strain Rate Study Virginija Dambrauskaite, MD, Lieven Herbots, MD,
CARDIAC DEVELOPMENT CARDIAC DEVELOPMENT
 CARDIAC DEVELOPMENT CARDIAC DEVELOPMENT Diane E. Spicer, BS, PA(ASCP) University of Florida Dept. of Pediatric Cardiology Curator Van Mierop Cardiac Archive This lecture is given with special thanks to
Tissue Doppler Imaging in Congenital Heart Disease
 Tissue Doppler Imaging in Congenital Heart Disease L. Youngmin Eun, M.D. Department of Pediatrics, Division of Pediatric Cardiology, Kwandong University College of Medicine The potential advantage of ultrasound
Echocardiographic assessment of the right ventricle in paediatric pulmonary hypertension.
 Echocardiographic assessment of the right ventricle in paediatric pulmonary hypertension. Mark K. Friedberg, MD No disclosures Outline RV response to increased afterload Echo assessment of RV function
Certificate in Clinician Performed Ultrasound (CCPU) Syllabus. Rapid Cardiac Echo (RCE)
 Syllabus. Rapid Cardiac Echo (RCE)") Certificate in Clinician Performed Ultrasound (CCPU) Syllabus Rapid Cardiac Echo (RCE) Purpose: Rapid Cardiac Echocardiography (RCE) This unit is designed to cover the theoretical and practical curriculum
Certificate in Clinician Performed Ultrasound (CCPU) Syllabus Rapid Cardiac Echo (RCE) Purpose: Rapid Cardiac Echocardiography (RCE) This unit is designed to cover the theoretical and practical curriculum
ECHOCARDIOGRAPHIC APPROACH TO CONGENITAL HEART DISEASE: THE UNOPERATED ADULT
 ECHOCARDIOGRAPHIC APPROACH TO CONGENITAL HEART DISEASE: THE UNOPERATED ADULT Karen Stout, MD, FACC Divisions of Cardiology University of Washington Medical Center Seattle Children s Hospital NO DISCLOSURES
Quantitation of right ventricular dimensions and function
 SCCS Basics of cardiac assessment Quantitation of right ventricular dimensions and function Tomasz Kukulski, MD PhD Dept of Cardiology, Congenital Heart Disease and Electrotherapy Silesian Medical University
Assessing the Impact on the Right Ventricle
 Advances in Tricuspid Regurgitation Congress of the European Society of Cardiology (ESC) Munich, August 25-29, 2012 Assessing the Impact on the Right Ventricle Stephan Rosenkranz, MD Clinic III for Internal
Congenital Heart Defects
 Normal Heart Congenital Heart Defects 1. Patent Ductus Arteriosus The ductus arteriosus connects the main pulmonary artery to the aorta. In utero, it allows the blood leaving the right ventricle to bypass
RIGHT VENTRICULAR SIZE AND FUNCTION
 RIGHT VENTRICULAR SIZE AND FUNCTION Edwin S. Tucay, MD, FPCC, FPCC, FPSE Philippine Society of Echocardiography Quezon City, Philippines Echo Mission, BRTTH, Legaspi City, July 1-2, 2016 NO DISCLOSURE
COMPLEX CONGENITAL HEART DISEASE: WHEN IS IT TOO LATE TO INTERVENE?
 COMPLEX CONGENITAL HEART DISEASE: WHEN IS IT TOO LATE TO INTERVENE? Aurora S. Gamponia, MD, FPPS, FPCC, FPSE OBJECTIVES Identify complex congenital heart disease at high risk or too late for intervention
Multimodality Imaging of Anomalous Left Coronary Artery from the Pulmonary
 1 IMAGES IN CARDIOVASCULAR ULTRASOUND 2 3 4 Multimodality Imaging of Anomalous Left Coronary Artery from the Pulmonary Artery 5 6 7 Byung Gyu Kim, MD 1, Sung Woo Cho, MD 1, Dae Hyun Hwang, MD 2 and Jong
Echocardiography in Adult Congenital Heart Disease
 Echocardiography in Adult Congenital Heart Disease Michael Vogel Kinderherz-Praxis München CHD missed in childhood Subsequent lesions after repaired CHD Follow-up of cyanotic heart disease CHD missed in
Introduction. Cardiac Imaging Modalities MRI. Overview. MRI (Continued) MRI (Continued) Arnaud Bistoquet 12/19/03
 MRI (Continued) Arnaud Bistoquet 12/19/03") Introduction Cardiac Imaging Modalities Arnaud Bistoquet 12/19/03 Coronary heart disease: the vessels that supply oxygen-carrying blood to the heart, become narrowed and unable to carry a normal amount
Introduction Cardiac Imaging Modalities Arnaud Bistoquet 12/19/03 Coronary heart disease: the vessels that supply oxygen-carrying blood to the heart, become narrowed and unable to carry a normal amount
Case 47 Clinical Presentation
 93 Case 47 C Clinical Presentation 45-year-old man presents with chest pain and new onset of a murmur. Echocardiography shows severe aortic insufficiency. 94 RadCases Cardiac Imaging Imaging Findings C
LV geometric and functional changes in VHD: How to assess? Mi-Seung Shin M.D., Ph.D. Gachon University Gil Hospital
 LV geometric and functional changes in VHD: How to assess? Mi-Seung Shin M.D., Ph.D. Gachon University Gil Hospital LV inflow across MV LV LV outflow across AV LV LV geometric changes Pressure overload
Index of subjects. effect on ventricular tachycardia 30 treatment with 101, 116 boosterpump 80 Brockenbrough phenomenon 55, 125
 145 Index of subjects A accessory pathways 3 amiodarone 4, 5, 6, 23, 30, 97, 102 angina pectoris 4, 24, 1l0, 137, 139, 140 angulation, of cavity 73, 74 aorta aortic flow velocity 2 aortic insufficiency
Follow-Up After Pulmonary Valve Replacement in Adults With Tetralogy of Fallot
 Journal of the American College of Cardiology Vol. 56, No. 18, 2010 2010 by the American College of Cardiology Foundation ISSN 0735-1097/$36.00 Published by Elsevier Inc. doi:10.1016/j.jacc.2010.04.058
The Circulatory System. The Heart, Blood Vessels, Blood Types
 The Circulatory System The Heart, Blood Vessels, Blood Types The Closed Circulatory System Humans have a closed circulatory system, typical of all vertebrates, in which blood is confined to vessels and
Principles of Anatomy and Physiology
 Principles of Anatomy and Physiology 14 th Edition CHAPTER 20 The Cardiovascular System: The Heart Introduction The purpose of the chapter is to: 1. Learn about the components of the cardiovascular system
MRI (AND CT) FOR REPAIRED TETRALOGY OF FALLOT
 FOR REPAIRED TETRALOGY OF FALLOT") MRI (AND CT) FOR REPAIRED TETRALOGY OF FALLOT Linda B Haramati MD, MS Departments of Radiology and Medicine Bronx, New York OUTLINE Pathogenesis Variants Initial surgical treatments Basic MR protocols
MRI (AND CT) FOR REPAIRED TETRALOGY OF FALLOT Linda B Haramati MD, MS Departments of Radiology and Medicine Bronx, New York OUTLINE Pathogenesis Variants Initial surgical treatments Basic MR protocols
Chapter 18 - Heart. I. Heart Anatomy: size of your fist; located in mediastinum (medial cavity)
") Chapter 18 - Heart I. Heart Anatomy: size of your fist; located in mediastinum (medial cavity) A. Coverings: heart enclosed in double walled sac called the pericardium 1. Fibrous pericardium: dense connective
Chapter 18 - Heart I. Heart Anatomy: size of your fist; located in mediastinum (medial cavity) A. Coverings: heart enclosed in double walled sac called the pericardium 1. Fibrous pericardium: dense connective
Lab 16. The Cardiovascular System Heart and Blood Vessels. Laboratory Objectives
 Lab 16 The Cardiovascular System Heart and Blood Vessels Laboratory Objectives Describe the anatomical structures of the heart to include the pericardium, chambers, valves, and major vessels. Describe
SUPPLEMENTARY INFORMATION
 doi:10.1038/nature10188 Supplementary Figure 1. Embryonic epicardial genes are down-regulated from midgestation stages and barely detectable post-natally. Real time qrt-pcr revealed a significant down-regulation
CARDIOVASCULAR SYSTEM
 CARDIOVASCULAR SYSTEM Overview Heart and Vessels 2 Major Divisions Pulmonary Circuit Systemic Circuit Closed and Continuous Loop Location Aorta Superior vena cava Right lung Pulmonary trunk Base of heart
Doppler-echocardiographic findings in a patient with persisting right ventricular sinusoids
 Zurich Open Repository and Archive University of Zurich Main Library Strickhofstrasse 39 CH-8057 Zurich www.zora.uzh.ch Year: 1990 Doppler-echocardiographic findings in a patient with persisting right
The Cardiovascular System Part I: Heart Outline of class lecture After studying part I of this chapter you should be able to:
 The Cardiovascular System Part I: Heart Outline of class lecture After studying part I of this chapter you should be able to: 1. Describe the functions of the heart 2. Describe the location of the heart,
DEVELOPMENT OF THE CIRCULATORY SYSTEM L E C T U R E 5
 DEVELOPMENT OF THE CIRCULATORY SYSTEM L E C T U R E 5 REVIEW OF CARDIAC ANATOMY Heart 4 chambers Base and apex Valves Pericardial sac 3 layers: epi, myo, endo cardium Major blood vessels Aorta and its
The Heart. Happy Friday! #takeoutyournotes #testnotgradedyet
 The Heart Happy Friday! #takeoutyournotes #testnotgradedyet Introduction Cardiovascular system distributes blood Pump (heart) Distribution areas (capillaries) Heart has 4 compartments 2 receive blood (atria)
LV FUNCTION ASSESSMENT: WHAT IS BEYOND EJECTION FRACTION
 LV FUNCTION ASSESSMENT: WHAT IS BEYOND EJECTION FRACTION Jamilah S AlRahimi Assistant Professor, KSU-HS Consultant Noninvasive Cardiology KFCC, MNGHA-WR Introduction LV function assessment in Heart Failure:
Chapter 20 (1) The Heart
 The Heart") Chapter 20 (1) The Heart Learning Objectives Describe the location and structure of the heart Describe the path of a drop of blood from the superior vena cava or inferior vena cava through the heart out
Chapter 20 (1) The Heart Learning Objectives Describe the location and structure of the heart Describe the path of a drop of blood from the superior vena cava or inferior vena cava through the heart out
Biventricular Enlargement/ Hypertrophy
 Biventricular Enlargement/ Hypertrophy Keywords congenital heart disease left ventricular hypertrophy right ventricular hypertrophy SR MITTAL Abstract Electrocardiographic diagnosis of early biventricular
Evaluation of Left Ventricular Diastolic Dysfunction by Doppler and 2D Speckle-tracking Imaging in Patients with Primary Pulmonary Hypertension
 ESC Congress 2011.No 85975 Evaluation of Left Ventricular Diastolic Dysfunction by Doppler and 2D Speckle-tracking Imaging in Patients with Primary Pulmonary Hypertension Second Department of Internal
Circulation. Circulation = is a process used for the transport of oxygen, carbon! dioxide, nutrients and wastes through-out the body
 Circulation Circulation = is a process used for the transport of oxygen, carbon! dioxide, nutrients and wastes through-out the body Heart = muscular organ about the size of your fist which pumps blood.
Radiology of the respiratory/cardiac diseases (part 2)
") Cardiology Cycle - Lecture 6 436 Teams Radiology of the respiratory/cardiac diseases (part 2) Objectives Done By Team Leaders: Khalid Alshehri Hanin Bashaikh Team Members: Leena Alwakeel Aroob Alhuthail
Cardiology Cycle - Lecture 6 436 Teams Radiology of the respiratory/cardiac diseases (part 2) Objectives Done By Team Leaders: Khalid Alshehri Hanin Bashaikh Team Members: Leena Alwakeel Aroob Alhuthail
Index. Note: Page numbers of article titles are in boldface type.
 Index Note: Page numbers of article titles are in boldface type. A Acute coronary syndrome(s), anticoagulant therapy in, 706, 707 antiplatelet therapy in, 702 ß-blockers in, 703 cardiac biomarkers in,
Unexpected resolution of first trimester fetal valve stenosis: consequence
 Unexpected resolution of first trimester fetal valve stenosis: consequence of developmental remodeling? Gardiner, Helena M. The Fetal Center, Children s Memorial Hermann Hospital, McGovern Medical School,
11/10/2014. Muscular pump Two atria Two ventricles. In mediastinum of thoracic cavity 2/3 of heart's mass lies left of midline of sternum
 It beats over 100,000 times a day to pump over 1,800 gallons of blood per day through over 60,000 miles of blood vessels. During the average lifetime, the heart pumps nearly 3 billion times, delivering
The Heart. Size, Form, and Location of the Heart. 1. Blunt, rounded point; most inferior part of the heart.
 12 The Heart FOCUS: The heart is composed of cardiac muscle cells, which are elongated, branching cells that appear striated. Cardiac muscle cells behave as a single electrical unit, and the highly coordinated
Mitral Valve Disease, When to Intervene
 Mitral Valve Disease, When to Intervene Swedish Heart and Vascular Institute Ming Zhang MD PhD Interventional Cardiology Structure Heart Disease Conflict of Interest None Current ACC/AHA guideline Stages
Heart Development and Congenital Heart Disease
 Heart Development and Congenital Heart Disease Sally Dunwoodie s.dunwoodie@victorchang.edu.au Developmental and Stem Cell Biology Division Victor Chang Cardiac Research Institute for the heart of Australia...
37 1 The Circulatory System
 H T H E E A R T 37 1 The Circulatory System The circulatory system and respiratory system work together to supply cells with the nutrients and oxygen they need to stay alive. a) The respiratory system:
PART II ECHOCARDIOGRAPHY LABORATORY OPERATIONS ADULT TRANSTHORACIC ECHOCARDIOGRAPHY TESTING
 PART II ECHOCARDIOGRAPHY LABORATORY OPERATIONS ADULT TRANSTHORACIC ECHOCARDIOGRAPHY TESTING STANDARD - Primary Instrumentation 1.1 Cardiac Ultrasound Systems SECTION 1 Instrumentation Ultrasound instruments
The Cardiovascular System
 The Cardiovascular System The Manila Times College of Subic Prepared by: Stevens B. Badar, RN, MANc THE HEART Anatomy of the Heart Location and Size approx. the size of a person s fist, hollow and cone-shaped,
Heart and Soul Evaluation of the Fetal Heart
 Heart and Soul Evaluation of the Fetal Heart Ivana M. Vettraino, M.D., M.B.A. Clinical Associate Professor, Michigan State University College of Human Medicine Objectives Review the embryology of the formation
THE HEART. A. The Pericardium - a double sac of serous membrane surrounding the heart
 THE HEART I. Size and Location: A. Fist-size weighing less than a pound (250 to 350 grams). B. Located in the mediastinum between the 2 nd rib and the 5 th intercostal space. 1. Tipped to the left, resting
Cardiovascular System Notes: Heart Disease & Disorders
 Cardiovascular System Notes: Heart Disease & Disorders Interesting Heart Facts The Electrocardiograph (ECG) was invented in 1902 by Willem Einthoven Dutch Physiologist. This test is still used to evaluate
THE HEART OBJECTIVES: LOCATION OF THE HEART IN THE THORACIC CAVITY CARDIOVASCULAR SYSTEM
 BIOLOGY II CARDIOVASCULAR SYSTEM ACTIVITY #3 NAME DATE HOUR THE HEART OBJECTIVES: Describe the anatomy of the heart and identify and give the functions of all parts. (pp. 356 363) Trace the flow of blood
ULTRASOUND OF THE FETAL HEART
 ULTRASOUND OF THE FETAL HEART Cameron A. Manbeian, MD Disclosure Statement Today s faculty: Cameron Manbeian, MD does not have any relevant financial relationships with commercial interests or affiliations
Adult Congenital Heart Disease: What All Echocardiographers Should Know Sharon L. Roble, MD, FACC Echo Hawaii 2016
 1 Adult Congenital Heart Disease: What All Echocardiographers Should Know Sharon L. Roble, MD, FACC Echo Hawaii 2016 DISCLOSURES I have no disclosures relevant to today s talk 2 Why should all echocardiographers
The Cardiovascular System (Heart)
") The Cardiovascular System The Cardiovascular System (Heart) A closed system of the heart and blood vessels The heart pumps blood Blood vessels allow blood to circulate to all parts of the body The function
The Cardiovascular System The Cardiovascular System (Heart) A closed system of the heart and blood vessels The heart pumps blood Blood vessels allow blood to circulate to all parts of the body The function
Squeeze, Squeeze, Squeeze: The Importance of Right Ventricular Function and PH
 Squeeze, Squeeze, Squeeze: The Importance of Right Ventricular Function and PH Javier Jimenez MD PhD FACC Director, Advanced Heart Failure and Pulmonary Hypertension Miami Cardiac & Vascular Institute
10. Thick deposits of lipids on the walls of blood vessels, called, can lead to serious circulatory issues. A. aneurysm B. atherosclerosis C.
 Heart Student: 1. carry blood away from the heart. A. Arteries B. Veins C. Capillaries 2. What is the leading cause of heart attack and stroke in North America? A. alcohol B. smoking C. arteriosclerosis
Assessment of right ventricular contraction by speckle tracking echocardiography in pulmonary hypertension patients.
 Biomedical Research 2017; 28 (1): 173-177 ISSN 0970-938X www.biomedres.info Assessment of right ventricular contraction by speckle tracking echocardiography in pulmonary hypertension patients. Yudong Peng,
Myocardial Strain Imaging in Cardiac Diseases and Cardiomyopathies.
 Myocardial Strain Imaging in Cardiac Diseases and Cardiomyopathies. Session: Cardiomyopathy Tarun Pandey MD, FRCR. Associate Professor University of Arkansas for Medical Sciences Disclosures No relevant
Echocardiographic Evaluation of the Cardiomyopathies. Stephanie Coulter, MD, FACC, FASE April, 2016
 Echocardiographic Evaluation of the Cardiomyopathies Stephanie Coulter, MD, FACC, FASE April, 2016 Cardiomyopathies (CMP) primary disease intrinsic to cardiac muscle Dilated CMP Hypertrophic CMP Infiltrative
the Cardiovascular System I
 the Cardiovascular System I By: Dr. Nabil A Khouri MD, MsC, Ph.D MEDIASTINUM 1. Superior Mediastinum 2. inferior Mediastinum Anterior mediastinum. Middle mediastinum. Posterior mediastinum Anatomy of
Development of the Heart
 Development of the Heart Thomas A. Marino, Ph.D. Temple University School of Medicine Stages of Development of the Heart 1. The horseshoe-shaped pericardial cavity. 2. The formation of the single heart
The right heart: the Cinderella of heart failure
 The right heart: the Cinderella of heart failure Piotr Ponikowski, MD, PhD, FESC Medical University, Centre for Heart Disease Clinical Military Hospital Wroclaw, Poland none Disclosure Look into the Heart
PRACTICAL GUIDE TO FETAL ECHOCARDIOGRAPHY IC Huggon and LD Allan
 PRACTICAL GUIDE TO FETAL ECHOCARDIOGRAPHY IC Huggon and LD Allan Fetal Cardiology Unit, Harris Birthright Research Centre for Fetal Medicine, King's College Hospital, London, UK IMPORTANCE OF PRENATAL
Anatomy of the Heart. Figure 20 2c
 Anatomy of the Heart Figure 20 2c Pericardium & Myocardium Remember, the heart sits in it s own cavity, known as the mediastinum. The heart is surrounded by the Pericardium, a double lining of the pericardial
Cover Page. The handle holds various files of this Leiden University dissertation.
 Cover Page The handle http://hdl.handle.net/1887/38506 holds various files of this Leiden University dissertation. Author: Nies, Jessica Annemarie Bernadette van Title: Early identification of rheumatoid
The cardiovascular system is composed of the heart and blood vessels that carry blood to and from the body s organs. There are 2 major circuits:
 1 The cardiovascular system is composed of the heart and blood vessels that carry blood to and from the body s organs. There are 2 major circuits: pulmonary and systemic. The pulmonary goes out to the
Three-dimensional Wall Motion Tracking:
 Three-dimensional Wall Motion Tracking: A Novel Echocardiographic Method for the Assessment of Ventricular Volumes, Strain and Dyssynchrony Jeffrey C. Hill, BS, RDCS, FASE Jennifer L. Kane, RCS Gerard
LAB 12-1 HEART DISSECTION GROSS ANATOMY OF THE HEART
 LAB 12-1 HEART DISSECTION GROSS ANATOMY OF THE HEART Because mammals are warm-blooded and generally very active animals, they require high metabolic rates. One major requirement of a high metabolism is
Anatomy of the Heart
 Biology 212: Anatomy and Physiology II Anatomy of the Heart References: Saladin, KS: Anatomy and Physiology, The Unity of Form and Function 8 th (2018). Required reading before beginning this lab: Chapter
Appendix II: ECHOCARDIOGRAPHY ANALYSIS
 Appendix II: ECHOCARDIOGRAPHY ANALYSIS Two-Dimensional (2D) imaging was performed using the Vivid 7 Advantage cardiovascular ultrasound system (GE Medical Systems, Milwaukee) with a frame rate of 400 frames
Fetal Tetralogy of Fallot
 36 Fetal Tetralogy of Fallot E.D. Bespalova, R.M. Gasanova, O.A.Pitirimova National Scientific and Practical Center of Cardiovascular Surgery, Moscow Elena D. Bespalova, MD Professor, Director Rena M,
Cover Page. The handle holds various files of this Leiden University dissertation
 Cover Page The handle http://hdl.handle.net/1887/22544 holds various files of this Leiden University dissertation Author: Speksnijder, Niels Title: Determinants of psychosis vulnerability : focus on MEF2
COMPREHENSIVE EVALUATION OF FETAL HEART R. GOWDAMARAJAN MD
 COMPREHENSIVE EVALUATION OF FETAL HEART R. GOWDAMARAJAN MD Disclosure No Relevant Financial Relationships with Commercial Interests Fetal Echo: How to do it? Timing of Study -optimally between 22-24 weeks
Right Ventricular Function
 Right Ventricular Function Jan Marek Professor of Cardiology Great Ormond Street Hospital & Institute of Cardiovascular Sciences, University College London No disclosures Right ventricular function: questions
Supplementary Figure S1 Enlarged coronary artery branches in Edn1-knockout mice. a-d, Coronary angiography by ink injection in wild-type (a, b) and
 and") Supplementary Figure S1 Enlarged coronary artery branches in Edn1-knockout mice. a-d, Coronary angiography by ink injection in wild-type (a, b) and Edn1-knockout (Edn1-KO) (c, d) hearts. The boxed areas
Supplementary Figure S1 Enlarged coronary artery branches in Edn1-knockout mice. a-d, Coronary angiography by ink injection in wild-type (a, b) and Edn1-knockout (Edn1-KO) (c, d) hearts. The boxed areas
Cardiovascular Nursing Practice: A Comprehensive Resource Manual and Study Guide for Clinical Nurses 2 nd Edition
 Cardiovascular Nursing Practice: A Comprehensive Resource Manual and Study Guide for Clinical Nurses 2 nd Edition Table of Contents Volume 1 Chapter 1: Cardiovascular Anatomy and Physiology Basic Cardiac
Heart. Heart 2-Tunica media: middle layer (media ='middle') muscle fibers (smooth or cardiac).
 muscle fibers (smooth or cardiac).") t. innermost lumenal General Circulatory system heart and blood vessels walls have 3 layers (inside to outside) 1-Tunica interna: aka tunica intima layer--lumenal layer epithelium--endothelium simple squamous
t. innermost lumenal General Circulatory system heart and blood vessels walls have 3 layers (inside to outside) 1-Tunica interna: aka tunica intima layer--lumenal layer epithelium--endothelium simple squamous
The right ventricle in chronic heart failure
 The right ventricle in chronic heart failure ESC 2012 Christian Opitz, Berlin There are no conflicts of interest relevant to this presentation Percent of Population Prevalence of Heart Failure by Age and
4. The two inferior chambers of the heart are known as the atria. the superior and inferior vena cava, which empty into the left atrium.
 Answer each statement true or false. If the statement is false, change the underlined word to make it true. 1. The heart is located approximately between the second and fifth ribs and posterior to the
THE RIGHT VENTRICLE IN PULMONARY HYPERTENSION R. DRAGU
 THE RIGHT VENTRICLE IN PULMONARY HYPERTENSION R. DRAGU Cardiology Dept. Rambam Health Care Campus Rappaport Faculty of Medicine Technion, Israel Why the Right Ventricle? Pulmonary hypertension (PH) Right
Uncommon Doppler Echocardiographic Findings of Severe Pulmonic Insufficiency
 Uncommon Doppler Echocardiographic Findings of Severe Pulmonic Insufficiency Rahul R. Jhaveri, MD, Muhamed Saric, MD, PhD, FASE, and Itzhak Kronzon, MD, FASE, New York, New York Background: Two-dimensional
Novel insights into the complexity of ischaemic heart disease derived from combined coronary pressure and flow velocity measurements van de Hoef, T.P.
 UvA-DARE (Digital Academic Repository) Novel insights into the complexity of ischaemic heart disease derived from combined coronary pressure and flow velocity measurements van de Hoef, T.P. Link to publication
가천의대길병원소아심장과최덕영 PA C IVS THE EVALUATION AND PRINCIPLES OF TREATMENT STRATEGY
 가천의대길병원소아심장과최덕영 PA C IVS THE EVALUATION AND PRINCIPLES OF TREATMENT STRATEGY PA c IVS (not only pulmonary valve disease) Edwards JE. Pathologic Alteration of the right heart. In: Konstam MA, Isner M, eds.
The HEART. What is it???? Pericardium. Heart Facts. This muscle never stops working It works when you are asleep
 This muscle never stops working It works when you are asleep The HEART It works when you eat It really works when you exercise. What is it???? Located between the lungs in the mid thoracic region Apex
Giovanni Di Salvo MD, PhD, FESC Second University of Naples Monaldi Hospital
 Giovanni Di Salvo MD, PhD, FESC Second University of Naples Monaldi Hospital VSD is one of the most common congenital cardiac abnormalities in the newborn. It can occur as an isolated finding or in combination
Ch 19: Cardiovascular System - The Heart -
 Ch 19: Cardiovascular System - The Heart - Give a detailed description of the superficial and internal anatomy of the heart, including the pericardium, the myocardium, and the cardiac muscle. Trace the