Lezione 3 Voltmetri Diagnostica strumentale in cardiologia ECG Applicazioni scientifiche della misura in medicina
|
|
|
- Georgiana Black
- 5 years ago
- Views:
Transcription
1 Corsi di Laurea in Tecniche Di Fisiopatologia Cardiocircolatoria E Perfusione Cardiovascolare Dr. Andrea Malizia 1 Lezione 3 Voltmetri Diagnostica strumentale in cardiologia ECG Applicazioni scientifiche della misura in medicina
2 2 Dispense in aula

3 3

4 4

5 5

6 6


7 7

8 8


9 9

10 10


11 11

12 12

13 13


14 14

15 15

16 16
17 17

18 18


19 19

20 20

21 21

22 22

23 23

24 24

25 25

26 26

27 27


28 28


29 29

30 30

31 31


32 32


33 A LabVIEW based real-time software to automatically recognize off-normal ECG values Dr. Riccardo Rossi Dr. Jean-François Ciparisse Dr. Gianluca Gentile Dr. Andrea Malizia

34 Aim of the Work Development of software able to recognise pathologies through ECG signal The software is developed in LabVIEW programming language The authors describe how the pathologies are detected and discuss the results The ECG signals and the clinical data are taken from an online database [1,2]

35 ECG signal Electrocardiography (ECG) is a medical test used to detect myocardial pathologies ECG records the electrical activity of the hearth by means of electrodes located in different body position ECG is compounded by 12 signal: Limb leads: I, II and III Augmented limb leads: avr, avl and avf Precordial leads: v1, v2, v3, v4, v5 and v6
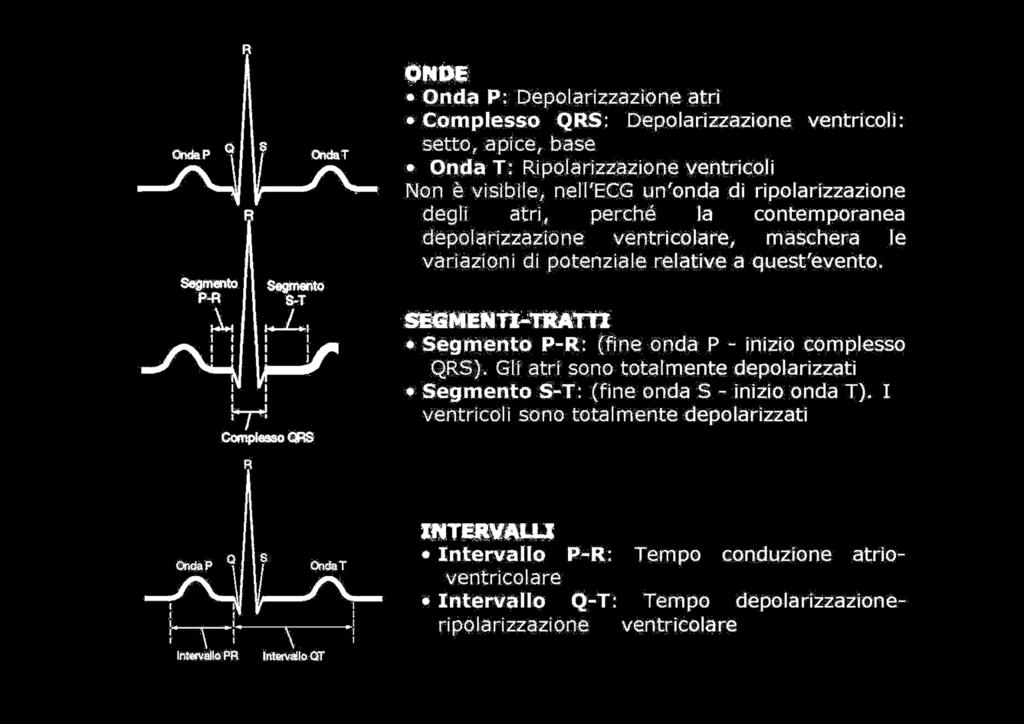
36 ECG signal The majority of pathologies can be detected analysing the characteristics of P wave, QRS complex, T wave and their relative distances ST interval PQ segment ST segment PQ interval
37 Software approach The high variability of ECG signals make difficult the development of software through a deterministic approach. Consequently, we realise the software using a tolerance approach We follow the guidelines in [3] in order to detect each pathologies In this work we discuss 5 detections: Hearth rate Atrial fibrillation Old inferior myocardial infarction Old lateral myocardial infarction Old septal myocardial infarction
38 Software Functioning: Wave detection Low pass filter and bias removing function is applied to the raw signal
39 Software Functioning: Wave detection QRS complex are identified through a maximum and minimum detection function in the precordial leads. R: Max > threshold Vi Q = Min < threshold Vi & t min i < t(r i ) S = Min < threshold Vi & t min i > t(r i ) P wave and T wave are then recognized lowering the maximum threshold P wave and T wave are searched in I and II P = Max > threshold Vi & t max i < t(r i ) T = Max > threshold Vi & t max i > t(r i )
40 Hearth Rate Hearth rate detection is performed making the average of QRS complex distances HR bpm = 60 t = 60 t R i t(r i 1 ) t t

41 Detection of myocardial pathologies: Atrial Fibrillation Atrial fibrillation is the irregular heart rate of the patient The software computes the pathology comparing each QRS distance with the heart rate reciprocal 2,5s 2 s 2,8s 2 s
42 Detection of myocardial pathologies: Old inferior myocardial infarction Old (or former) inferior myocardial infarction is detected if pathologic Q waves appear in two leads between II, III and avf Pathologic Q = if V Q i > 1 3 V R i II III avf Normal II III avf Old Inferior Infarction
43 Detection of myocardial pathologies: Old septal myocardial infarction Old (or former) septal myocardial infarction is detected if: R wave is absent in V1 and V2 V R i V2 < tolerance; V R i V1 < tolerance R wave in V2 is smaller than in V1 V R i V2 < V R i V1 V1 V2 Normal V1 V2 Old Septal Infarction V1 V2 Old Septal Infarction
44 Detection of myocardial pathologies: Old lateral myocardial infarction Old (or former) lateral myocardial infarction is detected if: There is a pathologic Q wave in V5 and V6 Pathologic Q = if V Q i > 1 3 V R i V5 V6 Normal V5 V6 Old Inferior Infarction

45 Software Output The software make a statistics of the detection of each pathologies: Pathology percentage: Number of detection Number of QRS complexes A medical examination is necessary if the pathology percentage exceeds a threshold.

46 Results Software detections are compared with clinical data Accuracy = Number of detection confirmed by clinical data Patient analysed
47 Conclusions The software is able to detect the pathologies with an acceptable accuracy. Anyway, some pathologies may involve the detection of other pathologies (false positive). Consequently, the software can be used as a tool by doctors and CANNOT replace them. Many other pathologies will be inserted into the software in order to have a more complete tool. References 1. A. L. Goldberger, L. A. N. Amaral, L. Glass, J. M. Hausdorff, P. C. Imanov, R. G. Mark, J. E. Mietus, G. B. Moody, C.-K. Peng and H. E. Stanley, PhysioBank, PhysioToolkit, and PhysioNet: Components of a New Research Resource for Complex Physiologic Signals, Circulation, vol. 101, no. 23, pp. e215-e220, PhysioNet, [Online]. Available: 3. R. Russo and G. Fadini, L'interpretazione dell'elettrocardiogramma - Manuale di rapido apprendimento, Piccin, 2004.

48 48

49 49
50 50
51 51

52 52
53 53

54 54
55 55
56 56

57 57

58 58

59 59

60 60
61 61

62 62

63 63

64 64

65 65
66 66

67 67
68 68

69 69
70 70
71 71
72 72

73 73

74 74

75 75

76 76

77 77

78 78
79 79
80 80
81 81

82 82

83 83

84 84
85 85

86 86

87 87
88 88 RIFERIMENTI 1. Elementi di Fisica Biomedica. Edises, E. Scannicchio E. Giroletti 2. Massimiliano Morena. Accuratezza, precisione, tipi di errori e cifre significative dei dati analitici». IIS Gobetti - Marchesini Casale sezione Tecnica Chimica e Materiali Analisi chimica, elaborazione dati e Laboratorio LIBRO DI TESTO Lezione 2
ECG INTERPRETATION MANUAL
 Lancashire & South Cumbria Cardiac Network ECG INTERPRETATION MANUAL THE NORMAL ECG Lancashire And South Cumbria Cardiac Physiologist Training Manual THE NORMAL ECG E.C.G CHECKLIST 1) Name, Paper Speed,
Robust Detection of Atrial Fibrillation for a Long Term Telemonitoring System
 Robust Detection of Atrial Fibrillation for a Long Term Telemonitoring System B.T. Logan, J. Healey Cambridge Research Laboratory HP Laboratories Cambridge HPL-2005-183 October 14, 2005* telemonitoring,
5- The normal electrocardiogram (ECG)
") 5- The (ECG) Introduction Electrocardiography is a process of recording electrical activities of heart muscle at skin surface. The electrical current spreads into the tissues surrounding the heart, a small
5- The (ECG) Introduction Electrocardiography is a process of recording electrical activities of heart muscle at skin surface. The electrical current spreads into the tissues surrounding the heart, a small
Electrocardiography Normal 5. Faisal I. Mohammed, MD, PhD
 Electrocardiography Normal 5 Faisal I. Mohammed, MD, PhD 1 Objectives 2 1. Describe the different waves in a normal electrocardiogram. 2. Recall the normal P-R and Q-T interval time of the QRS wave. 3.
Family Medicine for English language students of Medical University of Lodz ECG. Jakub Dorożyński
 Family Medicine for English language students of Medical University of Lodz ECG Jakub Dorożyński Parts of an ECG The standard ECG has 12 leads: six of them are considered limb leads because they are placed
ECG interpretation basics
 ECG interpretation basics Michał Walczewski, MD Krzysztof Ozierański, MD 21.03.18 Electrical conduction system of the heart Limb leads Precordial leads 21.03.18 Precordial leads Precordial leads 21.03.18
This presentation will deal with the basics of ECG description as well as the physiological basics of
 Snímka 1 Electrocardiography basics This presentation will deal with the basics of ECG description as well as the physiological basics of Snímka 2 Lecture overview 1. Cardiac conduction system functional
ECG ABNORMALITIES D R. T AM A R A AL Q U D AH
 ECG ABNORMALITIES D R. T AM A R A AL Q U D AH When we interpret an ECG we compare it instantaneously with the normal ECG and normal variants stored in our memory; these memories are stored visually in
ECG pre-reading manual. Created for the North West Regional EMET training program
 ECG pre-reading manual Created for the North West Regional EMET training program Author:- Dr Juan Carlos Ascencio-Lane juan.ascencio-lane@ths.tas.gov.au 1 Disclaimer This handbook has been created for
EKG. Danil Hammoudi.MD
 EKG Danil Hammoudi.MD What is an EKG? The electrocardiogram (EKG) is a representation of the electrical events of the cardiac cycle. Each event has a distinctive waveform, the study of which can lead to
12 Lead ECG Interpretation: Color Coding for MI s
 12 Lead ECG Interpretation: Color Coding for MI s Anna E. Story, RN, MS Director, Continuing Professional Education Critical Care Nurse Online Instructional Designer 2004 Anna Story 1 Objectives review
DR QAZI IMTIAZ RASOOL OBJECTIVES
 PRACTICAL ELECTROCARDIOGRAPHY DR QAZI IMTIAZ RASOOL OBJECTIVES Recording of electrical events in heart Established electrode pattern results in specific tracing pattern Health of heart i. e. Anatomical
Classification of Epileptic Seizure Predictors in EEG
 Classification of Epileptic Seizure Predictors in EEG Problem: Epileptic seizures are still not fully understood in medicine. This is because there is a wide range of potential causes of epilepsy which
Understanding basics of EKG
 Understanding basics of EKG By Alula A.(R III) www.le.ac.uk Topic for discussion Understanding of cellular electrophysiology Basics Rate Rhythm Axis Intervals P wave QRS ST/T wave Abnormal EKGs Understanding
12 LEAD EKG BASICS. By: Steven Jones, NREMT P CLEMC
 12 LEAD EKG BASICS By: Steven Jones, NREMT P CLEMC ECG Review Waves and Intervals P wave: the sequential activation (depolarization) of the right and left atria QRS complex: right and left ventricular
Spatiotemporal Cardiac Activation Sites Localization Using ECG Precordial Leads
 Spatiotemporal Cardiac Activation Sites Localization Using ECG Precordial Leads Jaime R. De La Cruz BSEE a, Joseph H.Pierluissi PhD a, Ubaldo Robles BSEE a, Zainul Abedin MD b a Electrical and Computer
Disclosure. 3. ST depression indicative of ischemia is most commonly observed in leads: 1. V1-V2. 2. I and avl 3. V
 Interpreting Stress Induced Ischemia by ECG, Bundle Branch Block & Arrhythmias Disclosure Gregory S Thomas MD, MPH Medical Director, MemorialCare Heart & Vascular Institute, Long Beach Memorial Astellas
Electrocardiography. Hilal Al Saffar College of Medicine,Baghdad University
 Electrocardiography Hilal Al Saffar College of Medicine,Baghdad University Which of the following is True 1. PR interval, represent the time taken for the impulse to travel from SA node to AV nose. 2.
By the end of this lecture, you will be able to: Understand the 12 lead ECG in relation to the coronary circulation and myocardium Perform an ECG
 By the end of this lecture, you will be able to: Understand the 12 lead ECG in relation to the coronary circulation and myocardium Perform an ECG recording Identify the ECG changes that occur in the presence
12 Lead Interpretation
 12 Lead Interpretation Objectives Ischemia, injury and infarction ECG complex review J point ST segment STEMI recognition Ischemia to Infarct Infarction is an evolving process As the infarct evolves ECG
Electrocardiography for Healthcare Professionals. Chapter 14 Basic 12-Lead ECG Interpretation
 Electrocardiography for Healthcare Professionals Chapter 14 Basic 12-Lead ECG Interpretation 2012 The Companies, Inc. All rights reserved. Learning Outcomes 14.1 Discuss the anatomic views seen on a 12-lead
ECG Interpretation Cat Williams, DVM DACVIM (Cardiology)
") ECG Interpretation Cat Williams, DVM DACVIM (Cardiology) Providing the best quality care and service for the patient, the client, and the referring veterinarian. GOAL: Reduce Anxiety about ECGs Back to
ECG Interpretation Cat Williams, DVM DACVIM (Cardiology) Providing the best quality care and service for the patient, the client, and the referring veterinarian. GOAL: Reduce Anxiety about ECGs Back to
ECG signal analysis for detection of Heart Rate and Ischemic Episodes
 ECG signal analysis for detection of Heart Rate and chemic Episodes Goutam Kumar Sahoo 1, Samit Ari 2, Sarat Kumar Patra 3 Department of Electronics and Communication Engineering, NIT Rourkela, Odisha,
Electrocardiography Abnormalities (Arrhythmias) 7. Faisal I. Mohammed, MD, PhD
 7. Faisal I. Mohammed, MD, PhD") Electrocardiography Abnormalities (Arrhythmias) 7 Faisal I. Mohammed, MD, PhD 1 Causes of Cardiac Arrythmias Abnormal rhythmicity of the pacemaker Shift of pacemaker from sinus node Blocks at different
Electrocardiography Abnormalities (Arrhythmias) 7 Faisal I. Mohammed, MD, PhD 1 Causes of Cardiac Arrythmias Abnormal rhythmicity of the pacemaker Shift of pacemaker from sinus node Blocks at different
INTERPRETAZIONE ECG NEL PAZIENTE CON SOSPETTO STEMI
 INTERPRETAZIONE ECG NEL PAZIENTE CON SOSPETTO STEMI Giacomo Veronese Scuola di Specializzazione Medicina d Emergenza e Urgenza Università Milano-Bicocca Siete d accordo se vi propongo per una relazione..
Abstract. Keywords. 1. Introduction. Goutam Kumar Sahoo 1, Samit Ari 2, Sarat Kumar Patra 3
 ECG signal analysis for detection of Heart Rate and chemic Episodes Goutam Kumar Sahoo 1, Samit Ari 2, Sarat Kumar Patra 3 Department of Electronics and Communication Engineering, NIT Rourkela, Odisha,
Basic electrocardiography reading. R3 lee wei-chieh
 Basic electrocardiography reading R3 lee wei-chieh The Normal Conduction System Lead Placement avf Limb Leads Precordial Leads Interpretation Rate Rhythm Interval Axis Chamber abnormality QRST change What
8/20/ Identify the functions of common ECG machines. 3.3 Explain how each ECG machine control is used. 3.4 Recognize common electrodes.
 1 2 Electrocardiography for Healthcare Professionals Chapter 3: The Electrocardiograph Learning Outcomes 3.1 Identify three types of leads, and explain how each is recorded. 3.2 Identify the functions
Electrocardiography for Healthcare Professionals
 Electrocardiography for Healthcare Professionals Kathryn A. Booth Thomas O Brien Chapter 5: Rhythm Strip Interpretation and Sinus Rhythms Learning Outcomes 5.1 Explain the process of evaluating ECG tracings
12 Lead Electrocardiogram (ECG) PFN: SOMACL17. Terminal Learning Objective. References
 PFN: SOMACL17. Terminal Learning Objective. References") 12 Lead Electrocardiogram (ECG) PFN: SOMACL17 Slide 1 Terminal Learning Objective Action: Communicate knowledge of 12 Lead Electrocardiogram (ECG) Condition: Given a lecture in a classroom environment
12 Lead Electrocardiogram (ECG) PFN: SOMACL17 Slide 1 Terminal Learning Objective Action: Communicate knowledge of 12 Lead Electrocardiogram (ECG) Condition: Given a lecture in a classroom environment
Introduction to Electrocardiography
 Introduction to Electrocardiography Class Objectives: Introduction to ECG monitoring Discuss principles of interpretation Identify the components and measurements of the ECG ECG analysis ECG Monitoring
12 Lead EKG. The Basics
 12 Lead EKG The Basics Objectives Demonstrate proper 12 EKG lead placement Determine electrical axis Identify ST and T wave changes as they relate to myocardial ischemia Describe possible complications
CORONARY ARTERIES HEART
 CARDIAC/ECG MODULE THE HEART CORONARY ARTERIES FIBRILLATING HEART CORONARY ARTERIES HEART PRACTICE RHYTHMS PRACTICE RHYTHMS ELECTRICAL CONDUCTION SA Node (60 100) Primary pacemaker AV Node (40 60) ***Creates
BTL CardioPoint ST Maps. ST maps. Graphic tool for displaying the spatial orientation of ST deviations
 TL CardioPoint ST Maps ST maps Graphic tool for displaying the spatial orientation of ST deviations TL CardioPoint ST Maps 2 Introduction Since the ST-segment analysis gives highly valuable information
Pennsylvania Academy of Family Physicians Foundation & UPMC 43rd Refresher Course in Family Medicine CME Conference March 10-13, 2016
 Pennsylvania Academy of Family Physicians Foundation & UPMC 43rd Refresher Course in Family Medicine CME Conference March 10-13, 2016 Disclosures: EKG Workshop Louis Mancano, MD Speaker has no disclosures
All About STEMIs. Presented By: Brittney Urvand, RN, BSN, CCCC. Essentia Health Fargo Cardiovascular Program Manager.
 All About STEMIs Presented By: Brittney Urvand, RN, BSN, CCCC Essentia Health Fargo Cardiovascular Program Manager Updated 10/2/2018 None Disclosures Objectives Identify signs and symptoms of a heart attack
The Fundamentals of 12 Lead EKG. ECG Recording. J Point. Reviewing the Cardiac Conductive System. Dr. E. Joe Sasin, MD Rusty Powers, NRP
 The Fundamentals of 12 Lead EKG Dr. E. Joe Sasin, MD Rusty Powers, NRP SA Node Intranodal Pathways AV Junction AV Fibers Bundle of His Septum Bundle Branches Purkinje System Reviewing the Cardiac Conductive
Understanding the 12-lead ECG, part II
 Bundle-branch blocks Understanding the 12-lead ECG, part II Most common electrocardiogram (ECG) abnormality Appears as a wider than normal S complex Occurs when one of the two bundle branches can t conduct
Ekg pra pr c a tice D.HAMMOUDI.MD
 Ekg practice D.HAMMOUDI.MD Anatomy Revisited RCA (Right Coronary Artery) Right ventricle Inferior wall of LV Posterior wall of LV (75%) SA Node (60%) AV Node (>80%) LCA (Left Coronary Artery) Septal wall
Section V. Objectives
 Section V Landscape of an MI Objectives At the conclusion of this presentation the participant will be able to Outline a systematic approach to 12 lead ECG interpretation Demonstrate the process for determining
Appendix D Output Code and Interpretation of Analysis
 Appendix D Output Code and Interpretation of Analysis 8 Arrhythmia Code No. Description 8002 Marked rhythm irregularity 8110 Sinus rhythm 8102 Sinus arrhythmia 8108 Marked sinus arrhythmia 8120 Sinus tachycardia
12 Lead ECG Interpretation
 12 Lead ECG Interpretation Julie Zimmerman, MSN, RN, CNS, CCRN Significant increase in mortality for every 15 minutes of delay! N Engl J Med 2007;357:1631-1638 Who should get a 12-lead ECG? Also include
Please check your answers with correct statements in answer pages after the ECG cases.
 ECG Cases ECG Case 1 Springer International Publishing AG, part of Springer Nature 2018 S. Okutucu, A. Oto, Interpreting ECGs in Clinical Practice, In Clinical Practice, https://doi.org/10.1007/978-3-319-90557-0
Electrocardiography II Laboratory
 Introduction As we saw in the first electrocardiography (ECG) laboratory session, surface electrodes can be used to measure the cardiac potential in the heart. The ECG signal can be correlated with specific
Electrocardiography Biomedical Engineering Kaj-Åge Henneberg
 Electrocardiography 31650 Biomedical Engineering Kaj-Åge Henneberg Electrocardiography Plan Function of cardiovascular system Electrical activation of the heart Recording the ECG Arrhythmia Heart Rate
Relax and Learn At the Farm 2012
 Relax and Learn At the Farm 2012 Session 2: 12 Lead ECG Fundamentals 101 Cynthia Webner DNP, RN, CCNS, CCRN-CMC, CHFN Though for Today Mastery is not something that strikes in an instant, like a thunderbolt,
The Electrocardiogram part II. Dr. Adelina Vlad, MD PhD
 The Electrocardiogram part II Dr. Adelina Vlad, MD PhD Basic Interpretation of the ECG 1) Evaluate calibration 2) Calculate rate 3) Determine rhythm 4) Determine QRS axis 5) Measure intervals 6) Analyze
ECG CONVENTIONS AND INTERVALS
 1 ECG Waveforms and Intervals ECG waveforms labeled alphabetically P wave== represents atrial depolarization QRS complex=ventricular depolarization ST-T-U complex (ST segment, T wave, and U wave)== V repolarization.
CASE 10. What would the ST segment of this ECG look like? On which leads would you see this ST segment change? What does the T wave represent?
 CASE 10 A 57-year-old man presents to the emergency center with complaints of chest pain with radiation to the left arm and jaw. He reports feeling anxious, diaphoretic, and short of breath. His past history
Diploma in Electrocardiography
 The Society for Cardiological Science and Technology Diploma in Electrocardiography The Society makes this award to candidates who can demonstrate the ability to accurately record a resting 12-lead electrocardiogram
12-Lead ECG Interpretation. Kathy Kuznar, RN, ANP
 12-Lead ECG Interpretation Kathy Kuznar, RN, ANP The 12-Lead ECG Objectives Identify the normal morphology and features of the 12- lead ECG. Perform systematic analysis of the 12-lead ECG. Recognize abnormalities
EKG Monitoring and Arrhythmia Detection
 EKG Monitoring and Arrhythmia Detection Amaris Chen Department of Computer Science & Engineering University of Washington Box 352350 Seattle, WA 98195-2350 amarisch@cs.washington.edu ABSTRACT Cardiovascular
Preface: Wang s Viewpoints
 AHA/ACCF/HRS Recommendations for the Standardization and Interpretation of the Electrocardiogram: Part IV, Ischemia and Infarction Presented by: WANG, TZONG LUEN, MD, PhD, JM, FACC, FESC, FCAPSC Professor,
Determining Axis and Axis Deviation on an ECG
 Marquette University e-publications@marquette Physician Assistant Studies Faculty Research and Publications Health Sciences, College of 7-15-2010 Determining Axis and Axis Deviation on an ECG Patrick Loftis
BASIC CONCEPT OF ECG
 BASIC CONCEPT OF ECG Electrocardiogram The electrocardiogram (ECG) is a recording of cardiac electrical activity. The electrical activity is readily detected by electrodes attached to the skin. After the
PECTUS EXCAVATUM WITH SPONTANEOUS TYPE 1 ECG BRUGADA PATTERN OR BRUGADA LIKE PHENOTYPE: ANOTHER BRUGADA ECG PHENOCOPY
 PECTUS EXCAVATUM WITH SPONTANEOUS TYPE 1 ECG BRUGADA PATTERN OR BRUGADA LIKE PHENOTYPE: ANOTHER BRUGADA ECG PHENOCOPY ANDRÉS RICARDO PÉREZ RIERA MD Chief of the Sector of Electro-Vectocardiography of the
Dynamic Time Warping As a Novel Tool in Pattern Recognition of ECG Changes in Heart Rhythm Disturbances
 2005 IEEE International Conference on Systems, Man and Cybernetics Waikoloa, Hawaii October 10-12, 2005 Dynamic Time Warping As a Novel Tool in Pattern Recognition of ECG Changes in Heart Rhythm Disturbances
Panorama. Arrhythmia Analysis Frequently Asked Questions
 Panorama Arrhythmia Analysis Frequently Asked Questions What ECG vectors are used for Beat Detection? 3-wire lead set 5-wire lead set and 12 lead What ECG vectors are used for Beat Typing? 3-wire lead
Introduction to ECG Gary Martin, M.D.
 Brief review of basic concepts Introduction to ECG Gary Martin, M.D. The electrical activity of the heart is caused by a sequence of rapid ionic movements across cell membranes resulting first in depolarization
ELECTROCARDIOGRAPHY (ECG)
") ELECTROCARDIOGRAPHY (ECG) The heart is a muscular organ, which pumps blood through the blood vessels of the circulatory system. Blood provides the body with oxygen and nutrients, as well as assists in
ELECTROCARDIOGRAPHY (ECG) The heart is a muscular organ, which pumps blood through the blood vessels of the circulatory system. Blood provides the body with oxygen and nutrients, as well as assists in
RATIO FEATURES AND K-NEAREST NEIGHBOR CLASSIFIER. Malaysia. 3 Microwave Research Institute, Universiti Teknologi MARA, Shah Alam, Selangor, Malaysia
 Journal of Fundamental and Applied Sciences ISSN 1112-9867 Research Article Special Issue Available online at http://www.jfas.info CHARACTERIZATION OF POST-MI ELECTROCARDIOGRAM USING POWER RATIO FEATURES
ECG based Atrial Fibrillation Detection using Cuckoo Search Algorithm
 ECG based Atrial Fibrillation Detection using Cuckoo Search Algorithm Padmavathi Kora, PhD Gokaraju Rangaraju Institute of Engineering and Technology, Hyderabad V. Ayyem Pillai, PhD Gokaraju Rangaraju
Gill R. Tsouri and Michael H. Ostertag
 476 IEEE JOURNAL OF BIOMEDICAL AND HEALTH INFORMATICS, VOL. 18, NO. 2, MARCH 2014 Patient-Specific 12-Lead ECG Reconstruction From Sparse Electrodes Using Independent Component Analysis Gill R. Tsouri
12 Lead ECG Interpretation: The Basics and Beyond
 12 Lead ECG Interpretation: The Basics and Beyond Cindy Weston, DNP, RN, CCRN, CNS-CC, FNP-BC Assistant Professor Texas A&M University College of Nursing cweston@tamhsc.edu Objectives Review the basics
ECG Interpretation Made Easy
 ECG Interpretation Made Easy Dr. A Tageldien Abdellah, MSc MD EBSC Lecturer of Cardiology- Hull University Hull York Medical School 2007-2008 ECG Interpretation Made Easy Synopsis Benefits Objectives Process
Electrocardiography. Figure 1: Conduction system of heart
 Electrocardiography Electrocardiography is a method for recording action potentials of the heart. The source of electric activity of the heart is situated in the sinus node (sinoatrial or SA node) which
ECG and Cardiac Electrophysiology
 ECG and Cardiac Electrophysiology Simon Some very basic electrophysiology Intracellular fluid: 10 mm Na, 140 mm K, etc. K Na-K ATPase Extracellular fluid: 140mM Na, 4mM K, etc. Na Ion gradient plus selective
ELECTROCARDIOGRAPH. General. Heart Rate. Starship Children s Health Clinical Guideline
 General Heart Rate QRS Axis T Wave Axis PR Interval according to Heart Rate & Age P Wave Duration and Amplitude QRS Duration according to Age QT Interval R & S voltages according to Lead & Age R/S ratio
The Efficient and Smart Methods for Diagnosis of SVT 대구파티마병원순환기내과정병천
 The Efficient and Smart Methods for Diagnosis of SVT 대구파티마병원순환기내과정병천 Differentiation Supraventricular Origin from Ventricular Origin on ECG. QRS-Complex Width. 1. Narrow QRS-Complex Tachycardia (
Acute Coronary Syndromes Unstable Angina Non ST segment Elevation MI (NSTEMI) ST segment Elevation MI (STEMI)
 ST segment Elevation MI (STEMI)") Leanna R. Miller, RN, MN, CCRN-CSC, PCCN-CMC, CEN, CNRN, CMSRN, NP Education Specialist LRM Consulting Nashville, TN Objectives Evaluate common abnormalities that mimic myocardial infarction. Identify
Leanna R. Miller, RN, MN, CCRN-CSC, PCCN-CMC, CEN, CNRN, CMSRN, NP Education Specialist LRM Consulting Nashville, TN Objectives Evaluate common abnormalities that mimic myocardial infarction. Identify
Foundations EKG I - Unit 1 Summary
 Foundations EKG I - Unit 1 Summary The accurate diagnosis of ST elevation myocardial infarction (STEMI) is one of the most time critical duties in the practice of EM. Diagnosis is not always easy so guidelines
TELEMETRY BASICS FOR NURSING STUDENTS
 TELEMETRY BASICS FOR NURSING STUDENTS Accuracy of cardiac monitoring is an important component of patient safety in hospitalized patients who meet the criteria for dysrhythmia monitoring. (AACN, 2016,
BIO 360: Vertebrate Physiology Performing and analyzing an EKG Lab 11: Performing and analyzing an EKG Lab report due April 17 th
 BIO 60: Vertebrate Physiology Lab : Lab report due April 7 th All muscles produce an electrical current when they contract. The heart is no exception. An electrocardiogram (ECG or EKG) is a graphical recording
ECG Signal Based Heart Disease Detection System for Telemedicine Application Using LabVIEW
 ECG Signal Based Heart Disease Detection System for Telemedicine Application Using LabVIEW Dr. Channappa Bhyri 1, Nishat Banu A.M 2 2 Student, Dept. of Electronics and Industrial Instrumentation, PDACE,
Sample Entropy Analysis of Heart Rhythm Following Cardiac Transplantation
 2005 IEEE International Conference on Systems, Man and Cybernetics Waikoloa, Hawaii October 10-12, 2005 Sample Entropy Analysis of Heart Rhythm Following Cardiac Transplantation Volkan Tuzcu, MD Arkansas
Bundle Branch & Fascicular Blocks. Reading Assignment (p53-58 in Outline )
") Bundle Branch & Fascicular Blocks Reading Assignment (p53-58 in Outline ) Objectives 1. QRS analysis of Right and Left BBB 2. Uncomplicated vs complicated BBB 3. Diagnosis of RBBB with LAFB and LPFB 4.
Bundle Branch & Fascicular Blocks Reading Assignment (p53-58 in Outline ) Objectives 1. QRS analysis of Right and Left BBB 2. Uncomplicated vs complicated BBB 3. Diagnosis of RBBB with LAFB and LPFB 4.
ECG (MCQs) In the fundamental rules of the ECG all the following are right EXCEP:
 In the fundamental rules of the ECG all the following are right EXCEP:") ECG (MCQs) 2010 1- In the fundamental rules of the ECG all the following are right EXCEP: a- It is a biphasic record of myocardial action potential fluctuations. b- Deflection record occurs only during
ECG (MCQs) 2010 1- In the fundamental rules of the ECG all the following are right EXCEP: a- It is a biphasic record of myocardial action potential fluctuations. b- Deflection record occurs only during
Chapter 2 Practical Approach
 Chapter 2 Practical Approach There are beginners in electrocardiogram (ECG) analysis who are fascinated by a special pattern (e.g., a bundle-branch block or a striking Q wave) and thereby overlook other
CRC 431 ECG Basics. Bill Pruitt, MBA, RRT, CPFT, AE-C
 CRC 431 ECG Basics Bill Pruitt, MBA, RRT, CPFT, AE-C Resources White s 5 th ed. Ch 6 Electrocardiography Einthoven s Triangle Chest leads and limb leads Egan s 10 th ed. Ch 17 Interpreting the Electrocardiogram
REtrive. REpeat. RElearn Design by. Test-Enhanced Learning based ECG practice E-book
 Test-Enhanced Learning Test-Enhanced Learning Test-Enhanced Learning Test-Enhanced Learning based ECG practice E-book REtrive REpeat RElearn Design by S I T T I N U N T H A N G J U I P E E R I Y A W A
Birmingham Regional Emergency Medical Services System
 Birmingham Regional Emergency Medical Services System 2018 ALCTE Summer Conference EKG Basics Brian Gober, MAT, ATC, NRP, CSCS Education Services Manager ECC Training Center Coordinator Birmingham Regional
12 Lead ECGs: Ischemia, Injury & Infarction. Kevin Handke NRP, FP-C, CCP, CMTE STEMI Coordinator Flight Paramedic
 12 Lead ECGs: Ischemia, Injury & Infarction Kevin Handke NRP, FP-C, CCP, CMTE STEMI Coordinator Flight Paramedic None Disclosures Objectives Upon completion of this program the learner will be able to
Proceedings of the World Small Animal Veterinary Association Sydney, Australia 2007
 Proceedings of the World Small Animal Sydney, Australia 2007 Hosted by: Next WSAVA Congress ECG INTERPRETATION Adrian Boswood MA VetMB DVC DECVIM-CA(Cardiology) MRCVS The Royal Veterinary College, Hawkshead
ST SEGMENT IN LEAD A VR IN ACUTE INFERIOR MYOCARDIAL INFARCTION
 ST SEGMENT IN LEAD A VR IN ACUTE INFERIOR MYOCARDIAL INFARCTION Pages with reference to book, From 365 To 366 Shehbaz A. Kureshi, Yoshiharu Yonekura, Yutaka Konishi, Kanji Torizuka ( Kyoto University School
12 Lead ECG. Presented by Rebecca Sevigny BSN, RN Professional Practice & Development Dept.
 12 Lead ECG Presented by Rebecca Sevigny BSN, RN Professional Practice & Development Dept. Two Main Coronary Arteries RCA LCA which branches into Left Anterior Descending Circumflex Artery Two Main Coronary
Complete Right Bundle Branch Block. associated to. Right Ventricular Hypertrophy
 Complete Right Bundle Branch Block associated to Right Ventricular Hypertrophy VCG classification of isolated Complete Right Bundle Branch Block in the HP Grishman or Kennnedy type I Cabrera or Kennedy
ECG Signal Classification with Deep Learning Techniques
 ECG Signal Classification with Deep Learning Techniques Chien You Huang, B04901147 Ruey Lin Jahn, B02901043 Sung-wei Huang, B04901093 Department of Electrical Engineering, National Taiwan University, Taipei,
Chapter 08. Health Screening and Risk Classification
 Chapter 08 Health Screening and Risk Classification Preliminary Health Screening and Risk Classification Protocol: 1) Conduct a Preliminary Health Evaluation 2) Determine Health /Disease Risks 3) Determine
Paediatric ECG Interpretation
 Paediatric ECG Interpretation Dr Sanj Fernando (thanks to http://lifeinthefastlane.com/ecg-library/paediatric-ecginterpretation/) 3 yo boy complaining of abdominal pain and chest pain Child ECG vs Adult
AUTOMATIC CLASSIFICATION OF HEARTBEATS
 AUTOMATIC CLASSIFICATION OF HEARTBEATS Tony Basil 1, and Choudur Lakshminarayan 2 1 PayPal, India 2 Hewlett Packard Research, USA ABSTRACT We report improvement in the detection of a class of heart arrhythmias
The Normal Electrocardiogram
 C H A P T E R 1 1 The Normal Electrocardiogram When the cardiac impulse passes through the heart, electrical current also spreads from the heart into the adjacent tissues surrounding the heart. A small
ECG Basics Sonia Samtani 7/2017 UCI Resident Lecture Series
 ECG Basics Sonia Samtani 7/2017 UCI Resident Lecture Series Agenda I. Introduction II.The Conduction System III.ECG Basics IV.Cardiac Emergencies V.Summary The Conduction System Lead Placement avf Precordial
ECG Workshop. Charles Bruen, MD. Emergency Medicine & Trauma Update resusreview.com/emtu16
 ECG Workshop Emergency Medicine & Trauma Update 2016 Charles Bruen, MD resusreview.com/emtu16 Mechanical-Electrical Cycle Leads A Lead is a picture You cannot point to a wire and say this lead is such
Myocardial Infarction. Reading Assignment (p66-78 in Outline )
") Myocardial Infarction Reading Assignment (p66-78 in Outline ) Objectives 1. Why do ST segments go up or down in ischemia? 2. STEMI locations and culprit vessels 3. Why 15-lead ECGs? 4. What s up with avr?
Myocardial Infarction Reading Assignment (p66-78 in Outline ) Objectives 1. Why do ST segments go up or down in ischemia? 2. STEMI locations and culprit vessels 3. Why 15-lead ECGs? 4. What s up with avr?
12 LEAD EKG & CXR INTERPRETATION.
 12 LEAD EKG & CXR INTERPRETATION www.cherylherrmann.com cherrmann@frontier.com Audio Product Recording discount for participants $60 Nonparticipants = $190 o Get CEs and manual https://catalog.vyne.com
Module 1: 12-Lead ECG Interpretation
 Module 1: 12-Lead ECG Interpretation York Region Base Hospital Program Markham Stouffville Hospital April 2003 Acknowledgements Prepared by: Edited by: John Anderson, Program Coordinator Warren Beckett,
ECG. Prepared by: Dr.Fatima Daoud Reference: Guyton and Hall Textbook of Medical Physiology,12 th edition Chapters: 11,12,13
 ECG Prepared by: Dr.Fatima Daoud Reference: Guyton and Hall Textbook of Medical Physiology,12 th edition Chapters: 11,12,13 The Concept When the cardiac impulse passes through the heart, electrical current
Computer-Aided Model for Abnormality Detection in Biomedical ECG Signals
 10, Issue 1 (2018) 7-15 Journal of Advanced Research in Computing and Applications Journal homepage: www.akademiabaru.com/arca.html ISSN: 2462-1927 Computer-Aided Model for Abnormality Detection in Biomedical
REAL-TIME R-SPIKE DETECTION IN THE CARDIAC WAVEFORM THROUGH INDEPENDENT COMPONENT ANALYSIS
 REAL-TIME R-SPIKE DETECTION IN THE CARDIAC WAVEFORM THROUGH INDEPENDENT COMPONENT ANALYSIS Harold Martin, Walter Izquierdo, Mercedes Cabrerizo, and Malek Adjouadi Center for Advanced Technology and Education,
A Review of Cardiac Pathophysiology and EKG. Jamie Dyson PT, DPT Kathy Swanick PT, DPT, OCS
 A Review of Cardiac Pathophysiology and EKG Jamie Dyson PT, DPT Kathy Swanick PT, DPT, OCS Cardiac Pathophysiology Coronary Artery Disease Congestive Heart Failure Valvular Heart Disease Athletic Heart