Electrocardiography Normal 5. Faisal I. Mohammed, MD, PhD
|
|
|
- Kevin Boone
- 6 years ago
- Views:
Transcription
1 Electrocardiography Normal 5 Faisal I. Mohammed, MD, PhD 1
2 Objectives 2 1. Describe the different waves in a normal electrocardiogram. 2. Recall the normal P-R and Q-T interval time of the QRS wave. 3. Distinguish the difference in depolarization and repolarization waves. 4. Recognize the voltage and time calibration of an electrocardiogram chart. 5. Point out the arrangement of electrodes in the bipolar limb leads, chest leads, and unipolar leads. 6. Describe Einthoven s law.
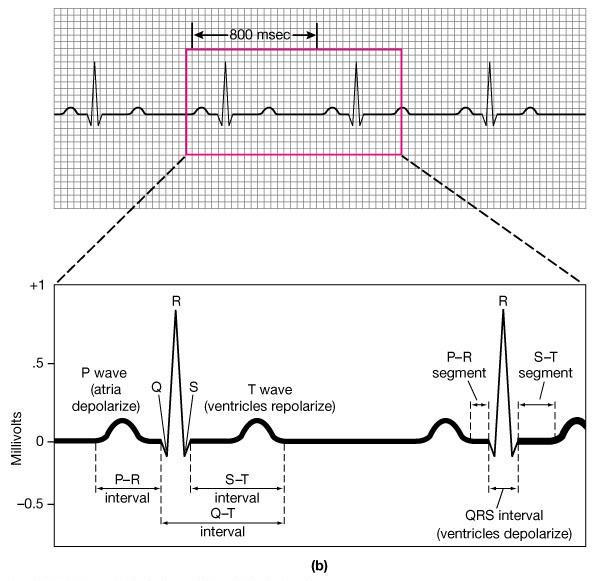
3 Depolarization and Repolarization Waves Note that no potential is recorded when the ventricular muscle is either completely depolarized or repolarized.
4 Normal EKG Q-T interval 0.35 sec P-R interval 0.16 sec R R P T P T Atrial depolarization Q S Ventricular repolarization Q S Ventricular depolarizatio n
5 SINGLE VENTRICULAR ACTION POTENTIAL ATRIAL FIBER ENDOCARDIAL FIBER EPICARDIAL FIBER R 1 mv ECG P Q S Depolarization of atria T Repolarization of ventricles Depolarization of ventricles

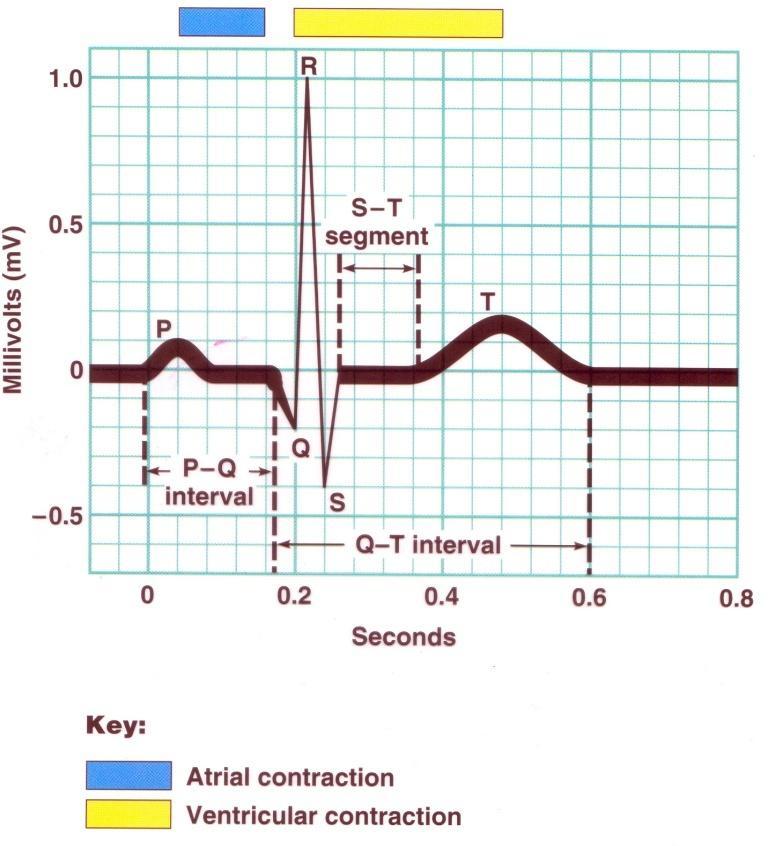
6 Standardized EKG s 6 Time and voltage calibrations are standardized
7 Electrocardiogram Record of electrical events in the myocardium that can be correlated with mechanical events P wave: depolarization of atrial myocardium. Signals onset of atrial contraction QRS complex: ventricular depolarization Signals onset of ventricular contraction.. T wave: repolarization of ventricles PR interval or PQ interval: 0.16 sec Extends from start of atrial depolarization to start of ventricular depolarization (QRS complex) contract and begin to relax Can indicate damage to conducting pathway or AV node if greater than 0.20 sec (200 msec) Q-T interval: time required for ventricles to undergo a single cycle of depolarization and repolarization Can be lengthened by electrolyte disturbances, conduction problems, coronary ischemia, myocardial damage
8 8 Electrocardiogram
9
10 Depolarization and Repolarization Waves Note that no potential is recorded when the ventricular muscle is either completely depolarized or repolarized.
11 Flow of Electrical Currents in the Chest Around the Heart Mean Vector Through the Partially Depolarized Heart _ _
12 Flow of Electrical Currents in the Chest Around the Heart (cont d) 12 Ventricular depolarization starts at the ventricular septum and the endocardial surfaces of the heart. The average current flows positively from the base of the heart to the apex. At the very end of depolarization the current reverses from 1/100 second and flows toward the outer walls of the ventricles near the base (S wave).
13 EKG Concepts 13 The P wave immediately precedes atrial contraction. The QRS complex immediately precedes ventricular contraction. The ventricles remain contracted until a few milliseconds after the end of the T repolarization wave. The atria remain contracted until the atria are repolarized, but an atrial repolarization wave cannot be seen on the electrocardiogram because it is masked by the QRS wave.
14 EKG Concepts (cont d) 14 The P-Q or P-R interval on the electrocardiogram has a normal value of 0.16 seconds and is the duration of time between the beginning of the P wave and the beginning of the QRS wave; this represents the time between the beginning of atrial contraction and the beginning of ventricular contraction.
15 EKG Concepts (cont d) 15 The Q-T interval has a normal value of 0.35 seconds and is the duration of time from the beginning of the Q wave to the end of the T wave; this approximates the time of ventricular contraction. The heart rate can be determined with the reciprocal of the time interval between each heartbeat.

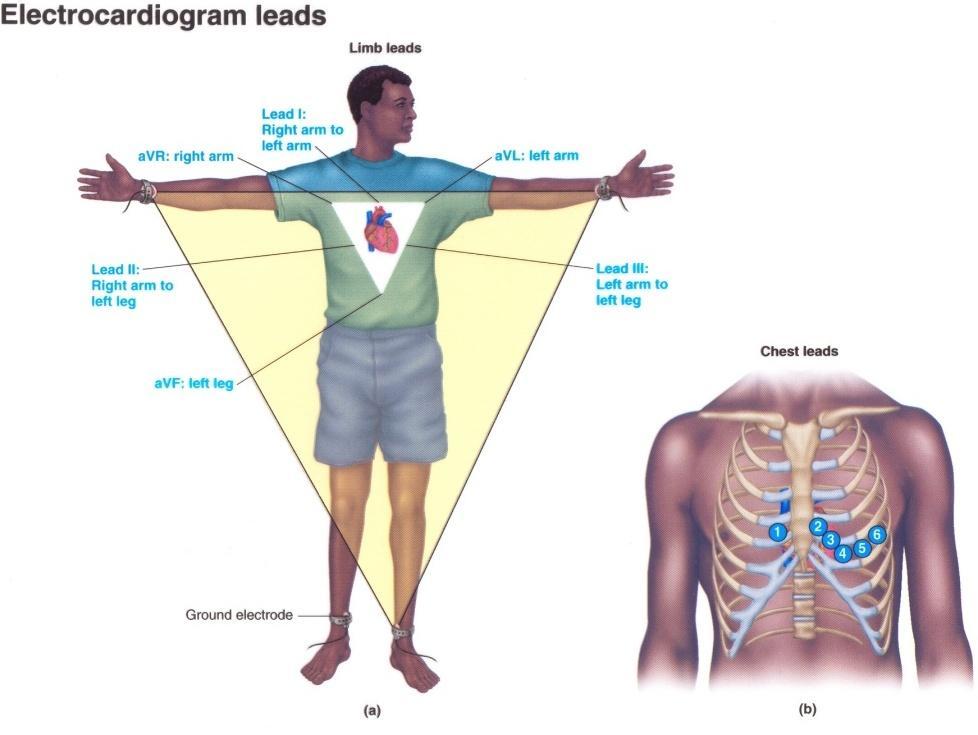
16 Bipolar Limb Leads Bipolar means that the EKG is recorded from two electrodes on the body.
17 Bipolar Limb Leads (cont d) 17 Lead I - The negative terminal of the electrocardiogram is connected to the right arm, and the positive terminal is connected to the left arm. Lead II - The negative terminal of the electrocardiogram is connected to the right arm, and the positive terminal is connected to the left leg.
18 Bipolar Limb Leads (cont d) Lead III - The negative terminal of the electrocardiogram is connected to the left arm, and the positive terminal is connected to the left leg. Einthoven s Law states that the electrical potential of any limb equals the sum of the other two (+ and - signs of leads must be observed). L II= L I + L III If lead I = 1.0 mv, Lead III = 0.5 mv, then Lead II = = 1.5 mv Kirchoff s second law of electrical circuits LI+LII+LIII=0 18
19 ECG Recordings (QRS Vector pointing leftward, inferiorly & anteriorly) 3 Bipolar Limb Leads: RA I = RA vs. LA (+) LA LL
20 ECG Recordings (QRS Vector pointing leftward, inferiorly & anteriorly) 3 Bipolar Limb Leads: RA I = RA vs. LA (+) LA II = RA vs. LL (+) LL
21 ECG Recordings (QRS Vector pointing leftward, inferiorly & anteriorly) 3 Bipolar Limb Leads: RA I = RA vs. LA (+) LA II = RA vs. LL (+) III = LA vs. LL (+) LL
 0.5 mv 1.2 mv 22 0.")
22 Bipolar Limb Leads (cont d) 0.5 mv 1.2 mv mv

23 Einthoven s triangle and law
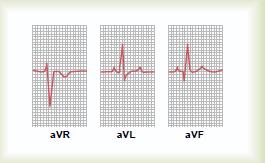
24 Other EKG Leads (cont d) Augmented Unipolar Limb Leads avr, avl, and avf are also in use. For avr the + electrode is the right arm, and the - electrode is the left arm + left leg; avl + electrode is left arm; avf + electrode is left foot and the negative electrode is the other two limbs 24

25 Unipolar Limb Leads
26 ECG Recordings (QRS Vector pointing leftward, inferiorly & anteriorly) 3 Bipolar Limb Leads: RA I = RA vs. LA (+) LA II = RA vs. LL (+) III = LA vs. LL (+) 3 Augmented Limb Leads: avr = (LA-LL) vs. RA(+) LL
27 ECG Recordings (QRS Vector pointing leftward, inferiorly & anteriorly) 3 Bipolar Limb Leads: RA I = RA vs. LA (+) LA II = RA vs. LL (+) III = LA vs. LL (+) 3 Augmented Limb Leads: avr = (LA-LL) vs. RA(+) LL avl = (RA-LL) vs. LA(+)
28 ECG Recordings (QRS Vector pointing leftward, inferiorly & anteriorly) 3 Bipolar Limb Leads: RA I = RA vs. LA (+) LA II = RA vs. LL (+) III = LA vs. LL (+) 3 Augmented Limb Leads: avr = (LA-LL) vs. RA(+) LL avl = (RA-LL) vs. LA(+) avf = (RA-LA) vs. LL(+)

29 29 Bipolar and Uniploar Limb Leads

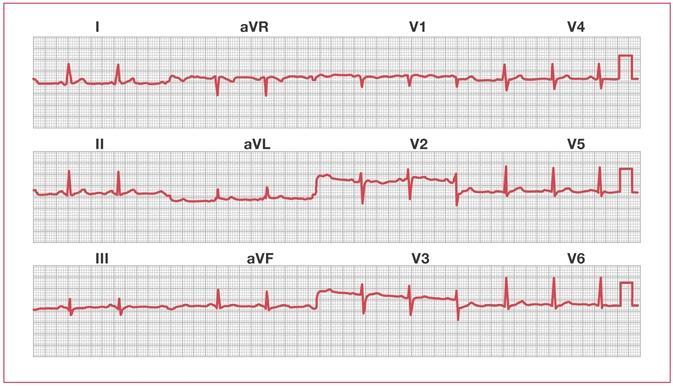
30 Other EKG Leads Chest Leads (Precordial Leads) known as V 1 -V 6 are very sensitive to electrical potential changes underneath the electrode. 30
31 6 PRECORDIAL (CHEST) LEADS Spine Sternum V 1 V 2 V 3 V 4 V 5 V 6

32 32 Chest leads (Unipolar)

33 33 Uniplolar Leads
34 34
35 ECG Recordings: (QRS vector---leftward, inferiorly and anteriorly 3 Bipolar Limb Leads I = RA vs. LA(+) II = RA vs. LL(+) III = LA vs. LL(+) 3 Augmented Limb Leads avr = (LA-LL) vs. RA(+) avl = (RA-LL) vs. LA(+) avf = (RA-LA) vs. LL(+) 6 Precordial (Chest) Leads: Indifferent electrode (RA-LA-LL) vs. chest lead moved from position V 1 through position V 6.
36 36

37 Electrocardiogram (ECG):Electrical Activity of the Heart Einthoven's triangle P-Wave atria QRS- wave ventricles T-wave repolarization


38 Thank You
INTRODUCTION TO ECG. Dr. Tamara Alqudah
 INTRODUCTION TO ECG Dr. Tamara Alqudah Excitatory & conductive system of the heart + - The ECG The electrocardiogram, or ECG, is a simple & noninvasive diagnostic test which records the electrical
ECG. Prepared by: Dr.Fatima Daoud Reference: Guyton and Hall Textbook of Medical Physiology,12 th edition Chapters: 11,12,13
 ECG Prepared by: Dr.Fatima Daoud Reference: Guyton and Hall Textbook of Medical Physiology,12 th edition Chapters: 11,12,13 The Concept When the cardiac impulse passes through the heart, electrical current
The Normal Electrocardiogram
 C H A P T E R 1 1 The Normal Electrocardiogram When the cardiac impulse passes through the heart, electrical current also spreads from the heart into the adjacent tissues surrounding the heart. A small
Sheet 5 physiology Electrocardiography-
 *questions asked by some students Sheet 5 physiology Electrocardiography- -why the ventricles lacking parasympathetic supply? if you cut both sympathetic and parasympathetic supply of the heart the heart
- why the T wave is deflected upwards although it's a repolarization wave?
 Cardiac Electrograph: - why the T wave is deflected upwards although it's a repolarization wave? After depolarization the ventricle contracts but since the heart is a volume conductor (3D not 2D), when
EKG. Danil Hammoudi.MD
 EKG Danil Hammoudi.MD What is an EKG? The electrocardiogram (EKG) is a representation of the electrical events of the cardiac cycle. Each event has a distinctive waveform, the study of which can lead to
ECG INTERPRETATION MANUAL
 Lancashire & South Cumbria Cardiac Network ECG INTERPRETATION MANUAL THE NORMAL ECG Lancashire And South Cumbria Cardiac Physiologist Training Manual THE NORMAL ECG E.C.G CHECKLIST 1) Name, Paper Speed,
Electrocardiography negative zero LA/VL RA/VR LL/VF recording electrode exploring electrode Wilson right arm right arm, left arm left arm
 Electrocardiography In the previous lecture, we were talking about the unipolar limb leads. We said that to make the unipolar lead, you have to make the negative electrode as zero electrode, this is done
ELECTROCARDIOGRAPHY (ECG)
") ELECTROCARDIOGRAPHY (ECG) The heart is a muscular organ, which pumps blood through the blood vessels of the circulatory system. Blood provides the body with oxygen and nutrients, as well as assists in
ELECTROCARDIOGRAPHY (ECG) The heart is a muscular organ, which pumps blood through the blood vessels of the circulatory system. Blood provides the body with oxygen and nutrients, as well as assists in
5- The normal electrocardiogram (ECG)
") 5- The (ECG) Introduction Electrocardiography is a process of recording electrical activities of heart muscle at skin surface. The electrical current spreads into the tissues surrounding the heart, a small
5- The (ECG) Introduction Electrocardiography is a process of recording electrical activities of heart muscle at skin surface. The electrical current spreads into the tissues surrounding the heart, a small
Electrocardiography Abnormalities (Arrhythmias) 7. Faisal I. Mohammed, MD, PhD
 7. Faisal I. Mohammed, MD, PhD") Electrocardiography Abnormalities (Arrhythmias) 7 Faisal I. Mohammed, MD, PhD 1 Causes of Cardiac Arrythmias Abnormal rhythmicity of the pacemaker Shift of pacemaker from sinus node Blocks at different
Electrocardiography Abnormalities (Arrhythmias) 7 Faisal I. Mohammed, MD, PhD 1 Causes of Cardiac Arrythmias Abnormal rhythmicity of the pacemaker Shift of pacemaker from sinus node Blocks at different
By the end of this lecture, you will be able to: Understand the 12 lead ECG in relation to the coronary circulation and myocardium Perform an ECG
 By the end of this lecture, you will be able to: Understand the 12 lead ECG in relation to the coronary circulation and myocardium Perform an ECG recording Identify the ECG changes that occur in the presence
Birmingham Regional Emergency Medical Services System
 Birmingham Regional Emergency Medical Services System 2018 ALCTE Summer Conference EKG Basics Brian Gober, MAT, ATC, NRP, CSCS Education Services Manager ECC Training Center Coordinator Birmingham Regional
Family Medicine for English language students of Medical University of Lodz ECG. Jakub Dorożyński
 Family Medicine for English language students of Medical University of Lodz ECG Jakub Dorożyński Parts of an ECG The standard ECG has 12 leads: six of them are considered limb leads because they are placed
BME 365 Website. Project Directions
 Lecture 17 EKG BME 365 Website Project Directions Heart rate Factors Affecting CO Parasympathetic activity decreases HR Sympathetic activity increases HR Stroke volume Depends on force generated by cardiac
DR QAZI IMTIAZ RASOOL OBJECTIVES
 PRACTICAL ELECTROCARDIOGRAPHY DR QAZI IMTIAZ RASOOL OBJECTIVES Recording of electrical events in heart Established electrode pattern results in specific tracing pattern Health of heart i. e. Anatomical
This presentation will deal with the basics of ECG description as well as the physiological basics of
 Snímka 1 Electrocardiography basics This presentation will deal with the basics of ECG description as well as the physiological basics of Snímka 2 Lecture overview 1. Cardiac conduction system functional
Introduction to Electrocardiography
 Introduction to Electrocardiography Class Objectives: Introduction to ECG monitoring Discuss principles of interpretation Identify the components and measurements of the ECG ECG analysis ECG Monitoring
The Fundamentals of 12 Lead EKG. ECG Recording. J Point. Reviewing the Cardiac Conductive System. Dr. E. Joe Sasin, MD Rusty Powers, NRP
 The Fundamentals of 12 Lead EKG Dr. E. Joe Sasin, MD Rusty Powers, NRP SA Node Intranodal Pathways AV Junction AV Fibers Bundle of His Septum Bundle Branches Purkinje System Reviewing the Cardiac Conductive
Farah Khreisat. Raghad Abu Jebbeh. Faisal Mohammad. 1 P a g e
 5 Farah Khreisat Raghad Abu Jebbeh Faisal Mohammad 1 P a g e بسم هللا الرحمن الرحيم Hello guys, hope you're doing well, as you've seen in the previous lecture, the Dr started with an extremely important
Electrocardiogram ECG. Hilal Al Saffar FRCP FACC College of medicine,baghdad University
 Electrocardiogram ECG Hilal Al Saffar FRCP FACC College of medicine,baghdad University Tuesday 29 October 2013 ECG introduction Wednesday 30 October 2013 Abnormal ECG ( ischemia, chamber hypertrophy, heart
CARDIOVASCULAR PHYSIOLOGY ECG. Dr. Ana-Maria Zagrean
 CARDIOVASCULAR PHYSIOLOGY ECG Dr. Ana-Maria Zagrean Electrocardiogram (ECG) ECG is a non-invasive method to record at the body surface the electrical activity of the heart. - the rate and regularity of
12 LEAD EKG BASICS. By: Steven Jones, NREMT P CLEMC
 12 LEAD EKG BASICS By: Steven Jones, NREMT P CLEMC ECG Review Waves and Intervals P wave: the sequential activation (depolarization) of the right and left atria QRS complex: right and left ventricular
CORONARY ARTERIES HEART
 CARDIAC/ECG MODULE THE HEART CORONARY ARTERIES FIBRILLATING HEART CORONARY ARTERIES HEART PRACTICE RHYTHMS PRACTICE RHYTHMS ELECTRICAL CONDUCTION SA Node (60 100) Primary pacemaker AV Node (40 60) ***Creates
ECG and Cardiac Electrophysiology
 ECG and Cardiac Electrophysiology Simon Some very basic electrophysiology Intracellular fluid: 10 mm Na, 140 mm K, etc. K Na-K ATPase Extracellular fluid: 140mM Na, 4mM K, etc. Na Ion gradient plus selective
Introduction to ECG Gary Martin, M.D.
 Brief review of basic concepts Introduction to ECG Gary Martin, M.D. The electrical activity of the heart is caused by a sequence of rapid ionic movements across cell membranes resulting first in depolarization
Chapter 12: Cardiovascular Physiology System Overview
 Chapter 12: Cardiovascular Physiology System Overview Components of the cardiovascular system: Heart Vascular system Blood Figure 12-1 Plasma includes water, ions, proteins, nutrients, hormones, wastes,
Ask Mish. EKG INTERPRETATION part i
 EKG INTERPRETATION part i What is EKG? EKG or ECG= electrocardiogram(~graphy) means the recording of the heart electrical activity from Greek kardio= heart, graphein= to write cardiac cell physiology Cardiac
12 Lead ECG Interpretation: Color Coding for MI s
 12 Lead ECG Interpretation: Color Coding for MI s Anna E. Story, RN, MS Director, Continuing Professional Education Critical Care Nurse Online Instructional Designer 2004 Anna Story 1 Objectives review
ELECTROCARDIOGRAM (ECG)
") ELECTROCARDIOGM (ECG) Some times it is called EKG from the German electrokardiogram. It is the study of the electrical activity of the heart muscles. ECG is the graphic recording or display of the timevariant
ELECTROCARDIOGM (ECG) Some times it is called EKG from the German electrokardiogram. It is the study of the electrical activity of the heart muscles. ECG is the graphic recording or display of the timevariant
Cardiac physiology. b. myocardium -- cardiac muscle and fibrous skeleton of heart
 I. Heart anatomy -- general gross. A. Size/orientation - base/apex B. Coverings D. Chambers 1. parietal pericardium 2. visceral pericardium 3. Layers of heart wall a. epicardium Cardiac physiology b. myocardium
The Electrocardiogram
 The Electrocardiogram Chapters 11 and 13 AUTUMN WEDAN AND NATASHA MCDOUGAL The Normal Electrocardiogram P-wave Generated when the atria depolarizes QRS-Complex Ventricles depolarizing before a contraction
Relax and Learn At the Farm 2012
 Relax and Learn At the Farm 2012 Session 2: 12 Lead ECG Fundamentals 101 Cynthia Webner DNP, RN, CCNS, CCRN-CMC, CHFN Though for Today Mastery is not something that strikes in an instant, like a thunderbolt,
Each student should record the ECG of one of the members of the lab group and have their own ECG recorded.
 EXPERIMENT 1 ELECTROCARDIOGRAPHY The purpose of this experiment is to introduce you to the techniques of electrocardiography and the interpretation of electrocardiograms. In Part A of the experiment, you
12 Lead ECG Interpretation: The Basics and Beyond
 12 Lead ECG Interpretation: The Basics and Beyond Cindy Weston, DNP, RN, CCRN, CNS-CC, FNP-BC Assistant Professor Texas A&M University College of Nursing cweston@tamhsc.edu Objectives Review the basics
12 LEAD EKG & CXR INTERPRETATION.
 12 LEAD EKG & CXR INTERPRETATION www.cherylherrmann.com cherrmann@frontier.com Audio Product Recording discount for participants $60 Nonparticipants = $190 o Get CEs and manual https://catalog.vyne.com
CRC 431 ECG Basics. Bill Pruitt, MBA, RRT, CPFT, AE-C
 CRC 431 ECG Basics Bill Pruitt, MBA, RRT, CPFT, AE-C Resources White s 5 th ed. Ch 6 Electrocardiography Einthoven s Triangle Chest leads and limb leads Egan s 10 th ed. Ch 17 Interpreting the Electrocardiogram
also aid the clinician in recognizing both the obvious and subtle abnormalities that may help guide therapy.
 Karen Lieberman, MS, CRNP f the many diagnostic tools used to screen for and evaluate cardiac abnormalities, the 12-lead electrocardiogram (ECG) is among the most basic. This inexpensive and noninvasive
12 Lead ECG Skills: Building Confidence for Clinical Practice. Presented By: Cynthia Webner, BSN, RN, CCRN-CMC. Karen Marzlin, BSN, RN,CCRN-CMC
 12 Lead ECG Skills: Building Confidence for Clinical Practice NTI 2009 Preconference Session 803 Presented By: Karen Marzlin, BSN, RN,CCRN-CMC 1 12 Lead ECG Fundamentals: The Starting Place for Linking
BASIC CONCEPT OF ECG
 BASIC CONCEPT OF ECG Electrocardiogram The electrocardiogram (ECG) is a recording of cardiac electrical activity. The electrical activity is readily detected by electrodes attached to the skin. After the
12 Lead ECG. Presented by Rebecca Sevigny BSN, RN Professional Practice & Development Dept.
 12 Lead ECG Presented by Rebecca Sevigny BSN, RN Professional Practice & Development Dept. Two Main Coronary Arteries RCA LCA which branches into Left Anterior Descending Circumflex Artery Two Main Coronary
ECG CONVENTIONS AND INTERVALS
 1 ECG Waveforms and Intervals ECG waveforms labeled alphabetically P wave== represents atrial depolarization QRS complex=ventricular depolarization ST-T-U complex (ST segment, T wave, and U wave)== V repolarization.
Ekg pra pr c a tice D.HAMMOUDI.MD
 Ekg practice D.HAMMOUDI.MD Anatomy Revisited RCA (Right Coronary Artery) Right ventricle Inferior wall of LV Posterior wall of LV (75%) SA Node (60%) AV Node (>80%) LCA (Left Coronary Artery) Septal wall
3/26/15 HTEC 91. EKG Sign-in Book. The Cardiac Cycle. Parts of the ECG. Waves. Waves. Review of protocol Review of placement of chest leads (V1, V2)
") EKG Sign-in Book HTEC 91 Review of protocol Review of placement of chest leads (V1, V2) Medical Office Diagnostic Tests Week 2 http://www.cvphysiology.com/arrhythmias/a013c.htm The Cardiac Cycle Represents
EKG Sign-in Book HTEC 91 Review of protocol Review of placement of chest leads (V1, V2) Medical Office Diagnostic Tests Week 2 http://www.cvphysiology.com/arrhythmias/a013c.htm The Cardiac Cycle Represents
11/18/13 ECG SIGNAL ACQUISITION HARDWARE DESIGN. Origin of Bioelectric Signals
 ECG SIGNAL ACQUISITION HARDWARE DESIGN Origin of Bioelectric Signals 1 Cell membrane, channel proteins Electrical and chemical gradients at the semi-permeable cell membrane As a result, we get a membrane
CARDIOVASCULAR SYSTEM
 CARDIOVASCULAR SYSTEM Overview Heart and Vessels 2 Major Divisions Pulmonary Circuit Systemic Circuit Closed and Continuous Loop Location Aorta Superior vena cava Right lung Pulmonary trunk Base of heart
12 Lead EKG. The Basics
 12 Lead EKG The Basics Objectives Demonstrate proper 12 EKG lead placement Determine electrical axis Identify ST and T wave changes as they relate to myocardial ischemia Describe possible complications
Atlantic Health System
 Atlantic Health System Morristown Medical Center Newton Medical Center Overlook Medical Center Basic Dysrhythmia Course Day 1 1 2 Chapter 1 Anatomy and Physiology Learning Objectives 1) Identify electrophysiology
Determining Axis and Axis Deviation on an ECG
 Marquette University e-publications@marquette Physician Assistant Studies Faculty Research and Publications Health Sciences, College of 7-15-2010 Determining Axis and Axis Deviation on an ECG Patrick Loftis
Electrocardiography I Laboratory
 Introduction The body relies on the heart to circulate blood throughout the body. The heart is responsible for pumping oxygenated blood from the lungs out to the body through the arteries and also circulating
Understanding basics of EKG
 Understanding basics of EKG By Alula A.(R III) www.le.ac.uk Topic for discussion Understanding of cellular electrophysiology Basics Rate Rhythm Axis Intervals P wave QRS ST/T wave Abnormal EKGs Understanding
iworx Sample Lab Experiment HH-4: The Six-Lead Electrocardiogram
 Experiment HH-4: The Six-Lead Electrocardiogram Background The cardiac cycle involves a sequential contraction of the atria and the ventricles. These contractions are triggered by the coordinated electrical
8/20/ Identify the functions of common ECG machines. 3.3 Explain how each ECG machine control is used. 3.4 Recognize common electrodes.
 1 2 Electrocardiography for Healthcare Professionals Chapter 3: The Electrocardiograph Learning Outcomes 3.1 Identify three types of leads, and explain how each is recorded. 3.2 Identify the functions
ECG interpretation basics
 ECG interpretation basics Michał Walczewski, MD Krzysztof Ozierański, MD 21.03.18 Electrical conduction system of the heart Limb leads Precordial leads 21.03.18 Precordial leads Precordial leads 21.03.18
CARDIOCOMP Electrocardiography Primer
 TM CARDIOCOMP Electrocardiography Primer Richmond, VA, USA 23230 CARDIOCOMP 1 Version 8 Electrocardiography Primer Revised: June 2015 Copyright 2015. Phipps & Bird, Inc. All Rights Reserved. This is a
Cardiac Telemetry Self Study: Part One Cardiovascular Review 2017 THINGS TO REMEMBER
 Please review the above anatomy of the heart. THINGS TO REMEMBER There are 3 electrolytes that affect cardiac function o Sodium, Potassium, and Calcium When any of these electrolytes are out of the normal
ECG (MCQs) In the fundamental rules of the ECG all the following are right EXCEP:
 In the fundamental rules of the ECG all the following are right EXCEP:") ECG (MCQs) 2010 1- In the fundamental rules of the ECG all the following are right EXCEP: a- It is a biphasic record of myocardial action potential fluctuations. b- Deflection record occurs only during
ECG (MCQs) 2010 1- In the fundamental rules of the ECG all the following are right EXCEP: a- It is a biphasic record of myocardial action potential fluctuations. b- Deflection record occurs only during
ELECTROCARDIOGRAPHY, ECG
 ELECTROCARDIOGRAPHY, ECG Introduction: Electrocardiography is a method to register the heart electric activity, e.g. electric potentials from outside of body. It is possible to record the changes of these
CASE 10. What would the ST segment of this ECG look like? On which leads would you see this ST segment change? What does the T wave represent?
 CASE 10 A 57-year-old man presents to the emergency center with complaints of chest pain with radiation to the left arm and jaw. He reports feeling anxious, diaphoretic, and short of breath. His past history
Chapter 08. Health Screening and Risk Classification
 Chapter 08 Health Screening and Risk Classification Preliminary Health Screening and Risk Classification Protocol: 1) Conduct a Preliminary Health Evaluation 2) Determine Health /Disease Risks 3) Determine
Cardiovascular System Notes: Heart Disease & Disorders
 Cardiovascular System Notes: Heart Disease & Disorders Interesting Heart Facts The Electrocardiograph (ECG) was invented in 1902 by Willem Einthoven Dutch Physiologist. This test is still used to evaluate
Full file at
 MULTIPLE CHOICE. Choose the one alternative that best completes the statement or answers the question. 1) What electrical event must occur for atrial kick to occur? 1) A) Atrial repolarization B) Ventricular
ECG Interpretation Cat Williams, DVM DACVIM (Cardiology)
") ECG Interpretation Cat Williams, DVM DACVIM (Cardiology) Providing the best quality care and service for the patient, the client, and the referring veterinarian. GOAL: Reduce Anxiety about ECGs Back to
ECG Interpretation Cat Williams, DVM DACVIM (Cardiology) Providing the best quality care and service for the patient, the client, and the referring veterinarian. GOAL: Reduce Anxiety about ECGs Back to
Electrocardiography. Figure 1: Conduction system of heart
 Electrocardiography Electrocardiography is a method for recording action potentials of the heart. The source of electric activity of the heart is situated in the sinus node (sinoatrial or SA node) which
Pennsylvania Academy of Family Physicians Foundation & UPMC 43rd Refresher Course in Family Medicine CME Conference March 10-13, 2016
 Pennsylvania Academy of Family Physicians Foundation & UPMC 43rd Refresher Course in Family Medicine CME Conference March 10-13, 2016 Disclosures: EKG Workshop Louis Mancano, MD Speaker has no disclosures
Interpreting Electrocardiograms (ECG) Physiology Name: Per:
 Physiology Name: Per:") Interpreting Electrocardiograms (ECG) Physiology Name: Per: Introduction The heart has its own system in place to create nerve impulses and does not actually require the brain to make it beat. This electrical
Interpreting Electrocardiograms (ECG) Physiology Name: Per: Introduction The heart has its own system in place to create nerve impulses and does not actually require the brain to make it beat. This electrical
Lab Activity 24 EKG. Portland Community College BI 232
 Lab Activity 24 EKG Reference: Dubin, Dale. Rapid Interpretation of EKG s. 6 th edition. Tampa: Cover Publishing Company, 2000. Portland Community College BI 232 Graph Paper 1 second equals 25 little boxes
Chad Morsch B.S., ACSM CEP
 What Is Cardiac Stress Testing? Chad Morsch B.S., ACSM CEP A Cardiac Stress Test is a test used to measure the heart's ability to respond to external stress in a controlled clinical environment. Cardiac
LABORATORY INVESTIGATION
 LABORATORY INVESTIGATION Recording Electrocardiograms The taking of an electrocardiogram is an almost universal part of any complete physical examination. From the ECG record of the electrical activity
All About STEMIs. Presented By: Brittney Urvand, RN, BSN, CCCC. Essentia Health Fargo Cardiovascular Program Manager.
 All About STEMIs Presented By: Brittney Urvand, RN, BSN, CCCC Essentia Health Fargo Cardiovascular Program Manager Updated 10/2/2018 None Disclosures Objectives Identify signs and symptoms of a heart attack
CHAPTER 13 Electrocardiography
 126 APTER Electrocardiography David M. Mirvis and Ary L. Goldberger FUNDAMENTAL PRINCIPLES, 126 Genesis of Cardiac Electrical Fields, 126 Recording Electrodes and Leads, 128 Electrocardiographic Processing
ECG WORKBOOK. Rohan Jayasinghe
 ECG WORKBOOK Rohan Jayasinghe Contents Preface vii Foreword viii Acknowledgements ix The author x Reviewers xi Section 1 Basics of the ECG 1 Section 2 ECG-based diagnosis: pathology by ECG 21 Section 3
Circulatory System. Functions and Components of the Circulatory System. Chapter 13 Outline. Chapter 13
 Circulatory System Chapter 13 Chapter 13 Outline Functions and Components of the Circulatory System Composition of Blood Structure of the Heart Cardiac Cycle and Heart Sounds Electrical Activity of the
Human Anatomy and Physiology II Laboratory Cardiovascular Physiology
 Human Anatomy and Physiology II Laboratory Cardiovascular Physiology 1 This lab involves two exercises: 1) Conduction System of the Heart and Electrocardiography and 2) Human Cardiovascular Physiology:
Cardiac Cycle. Each heartbeat is called a cardiac cycle. First the two atria contract at the same time.
 The Heartbeat Cardiac Cycle Each heartbeat is called a cardiac cycle. First the two atria contract at the same time. Next the two ventricles contract at the same time. Then all the chambers relax. http://www.youtube.com/watch?v=frd3k6lkhws
A Review of Cardiac Pathophysiology and EKG. Jamie Dyson PT, DPT Kathy Swanick PT, DPT, OCS
 A Review of Cardiac Pathophysiology and EKG Jamie Dyson PT, DPT Kathy Swanick PT, DPT, OCS Cardiac Pathophysiology Coronary Artery Disease Congestive Heart Failure Valvular Heart Disease Athletic Heart
Lect.6 Electrical axis and cardiac vector Cardiac vector: net result Vector that occurs during depolarization of the ventricles Figure:
 Lect.6 Electrical axis and cardiac vector Objectives: 1. State the relationship between the direction of cardiac vector with the direction (-ve, +ve) and amplitude of an ECG waves. 2. Draw diagram indicting
Analyzing the Heart with EKG
 Analyzing the Heart with EKG LabQuest An electrocardiogram (ECG or EKG) is a graphical recording of the electrical events occurring within the heart. In a healthy heart there is a natural pacemaker in
Section V. Objectives
 Section V Landscape of an MI Objectives At the conclusion of this presentation the participant will be able to Outline a systematic approach to 12 lead ECG interpretation Demonstrate the process for determining
Chapter 13 The Cardiovascular System: Cardiac Function
 Chapter 13 The Cardiovascular System: Cardiac Function Overview of the Cardiovascular System The Path of Blood Flow through the Heart and Vasculature Anatomy of the Heart Electrical Activity of the Heart
Figure 1 muscle tissue to its resting state. By looking at several beats you can also calculate the rate for each component.
 ANALYZING THE HEART WITH EKG WITH LABQUEST LAB From Human Physiology with Vernier Westminster College INTRODUCTION An electrocardiogram (ECG or EKG) is a graphical recording of the electrical events occurring
Chapter 20 (2) The Heart
 The Heart") Chapter 20 (2) The Heart ----------------------------------------------------------------------------------------------------------------------------------------- Describe the component and function of
Chapter 20 (2) The Heart ----------------------------------------------------------------------------------------------------------------------------------------- Describe the component and function of
12 Lead EKG. Brigham and Women's Hospital
 12 Lead EKG What is the heart? The heart is the organ that is responsible for pumping blood rich in oxygen to all parts of the body It is located in the center of the chest and is approximately the size
BEDSIDE ECG INTERPRETATION
 BEDSIDE ECG INTERPRETATION Presented by: Ryan Dean, RN, MSN, CCRN, CCNS, CFRN Flight Nurse 2017 Based on presentations originally by Gennifer DePaoli, RN Objectives Hospital policies Electrical conduction
ELECTROCARDIOGRAPHY (III) THE ANALYSIS OF THE ELECTROCARDIOGRAM
 THE ANALYSIS OF THE ELECTROCARDIOGRAM") ELECTROCARDIOGRAPHY (III) THE ANALYSIS OF THE ELECTROCARDIOGRAM Scridon Alina, Șerban Răzvan Constantin Recording and analysis of the 12-lead ECG is part of the basic medical assessment performed for every
ELECTROCARDIOGRAPHY (III) THE ANALYSIS OF THE ELECTROCARDIOGRAM Scridon Alina, Șerban Răzvan Constantin Recording and analysis of the 12-lead ECG is part of the basic medical assessment performed for every
12 Lead Electrocardiogram (ECG) PFN: SOMACL17. Terminal Learning Objective. References
 PFN: SOMACL17. Terminal Learning Objective. References") 12 Lead Electrocardiogram (ECG) PFN: SOMACL17 Slide 1 Terminal Learning Objective Action: Communicate knowledge of 12 Lead Electrocardiogram (ECG) Condition: Given a lecture in a classroom environment
12 Lead Electrocardiogram (ECG) PFN: SOMACL17 Slide 1 Terminal Learning Objective Action: Communicate knowledge of 12 Lead Electrocardiogram (ECG) Condition: Given a lecture in a classroom environment
COMENIUS UNIVERSITY IN BRATISLAVA JESSENIUS FACULTY OF MEDICINE IN MARTIN ELECTROCARDIOGRAPHY
 COMENIUS UNIVERSITY IN BRATISLAVA JESSENIUS FACULTY OF MEDICINE IN MARTIN ELECTROCARDIOGRAPHY Dysfunction of the electrophysiological processes in the heart mechanisms and manifestation Textbook for students
Preface: Wang s Viewpoints
 AHA/ACCF/HRS Recommendations for the Standardization and Interpretation of the Electrocardiogram: Part IV, Ischemia and Infarction Presented by: WANG, TZONG LUEN, MD, PhD, JM, FACC, FESC, FCAPSC Professor,
Lab 7. Physiology of Electrocardiography
 7.1 Lab 7. Physiology of Electrocardiography The heart is a muscular pump that circulates blood throughout the body. To efficiently pump the blood, cardiac contractions must be coordinated and are regulated
The Electrocardiogram part II. Dr. Adelina Vlad, MD PhD
 The Electrocardiogram part II Dr. Adelina Vlad, MD PhD Basic Interpretation of the ECG 1) Evaluate calibration 2) Calculate rate 3) Determine rhythm 4) Determine QRS axis 5) Measure intervals 6) Analyze
Practice Exercises for the Cardiovascular System
 Practice Exercises for the Cardiovascular System On the diagram below, color the oxygen-rich blood red and the oxygen-poor blood blue. Label the parts: Continued on the next page... Label the parts on
Collin County Community College
 Collin County Community College BIOL. 2402 Anatomy & Physiology WEEK 5 The Heart 1 The Heart Beat and the EKG 2 1 The Heart Beat and the EKG P-wave = Atrial depolarization QRS-wave = Ventricular depolarization
Sample. Analyzing the Heart with EKG. Computer
 Analyzing the Heart with EKG Computer An electrocardiogram (ECG or EKG) is a graphical recording of the electrical events occurring within the heart. In a healthy heart there is a natural pacemaker in
BIO 360: Vertebrate Physiology Performing and analyzing an EKG Lab 11: Performing and analyzing an EKG Lab report due April 17 th
 BIO 60: Vertebrate Physiology Lab : Lab report due April 7 th All muscles produce an electrical current when they contract. The heart is no exception. An electrocardiogram (ECG or EKG) is a graphical recording
ECG SIGNS OF HYPERTROPHY OF HEART ATRIUMS AND VENTRICLES
 Ministry of Health of Ukraine Kharkiv National Medical University ECG SIGNS OF HYPERTROPHY OF HEART ATRIUMS AND VENTRICLES Methodical instructions for students Рекомендовано Ученым советом ХНМУ Протокол
Chapter 3 Biological measurement 3.1 Nerve conduction
 Chapter 3 Biological measurement 3.1 Nerve conduction Learning objectives: What is in a nerve fibre? How does a nerve fibre transmit an electrical impulse? What do we mean by action potential? Nerve cells
Outline. Electrical Activity of the Human Heart. What is the Heart? The Heart as a Pump. Anatomy of the Heart. The Hard Work
 Electrical Activity of the Human Heart Oguz Poroy, PhD Assistant Professor Department of Biomedical Engineering The University of Iowa Outline Basic Facts about the Heart Heart Chambers and Heart s The
BASIC PRINCIPLES OF ECG INTERPRETATION
 Chapter 1 BASIC PRINCIPLES OF ECG INTERPRETATION Cardiac rhythm analysis may be accomplished informally via cardiac monitoring and more diagnostically via a 12-lead electrocardiogram (ECG). An electrocardiogram
Cardiovascular System Notes: Physiology of the Heart
 Cardiovascular System Notes: Physiology of the Heart Interesting Heart Fact Capillaries are so small it takes ten of them to equal the thickness of a human hair. Review What are the 3 parts of the cardiovascular
Science in Sport. 204a ECG demonstration (Graph) Read. The Electrocardiogram. ECG Any 12 bit EASYSENSE. Sensors: Loggers: Logging time: 10 seconds
 Read. The Electrocardiogram. ECG Any 12 bit EASYSENSE. Sensors: Loggers: Logging time: 10 seconds") Sensors: Loggers: ECG Any 12 bit EASYSENSE Science in Sport Logging time: 10 seconds 204a ECG demonstration (Graph) Read Regular medical check ups are essential part of the life of a professional sports
Sensors: Loggers: ECG Any 12 bit EASYSENSE Science in Sport Logging time: 10 seconds 204a ECG demonstration (Graph) Read Regular medical check ups are essential part of the life of a professional sports