Incomplete immune response to Coxsackie B viruses. associates with early autoimmunity against insulin
|
|
|
- Millicent Cummings
- 5 years ago
- Views:
Transcription
1 Incomplete immune response to Coxsackie B viruses associates with early autoimmunity against insulin Michelle P. Ashton 1, Anne Eugster 1, Denise Walther 1, Natalie Daehling 1, Stephanie Riethausen 2, Denise Kuehn 1, Karin Klingel 3, Andreas Beyerlein 2, Stephanie Zillmer 2, Anette-Gabriele Ziegler 2,4,5, Ezio Bonifacio 1,4,5,* 1 DFG-Center for Regenerative Therapies Dresden, Dresden, Germany 2 Institute of Diabetes Research, Helmholtz Zentrum München and Forschergruppe Diabetes, Klinikum rechts der Isar, Technische Universität München, Neuherberg, Germany 3 Department of Molecular Pathology, University Hospital Tübingen, Tübingen, Germany 4 Forschergruppe Diabetes e.v., Neuherberg, Germany 5 German Center for Diabetes Research (DZD), Neuherberg, Germany *ezio.bonifacio@crt-dresden.de 1

.")
2 Supplementary Figure 1: Anti-VP1, anti-vp2, and anti-vp4 CVB antibodies can be detected in serum LIPS measurement of anti-vp1, anti-vp2, anti-vp3 and anti-vp4 antibodies in sera from children and adolescents with recent onset of type 1 diabetes (open circles; n=78) and healthy controls (filled circles; n=78). Each point is an individual and the line indicates the median. 2
3 3
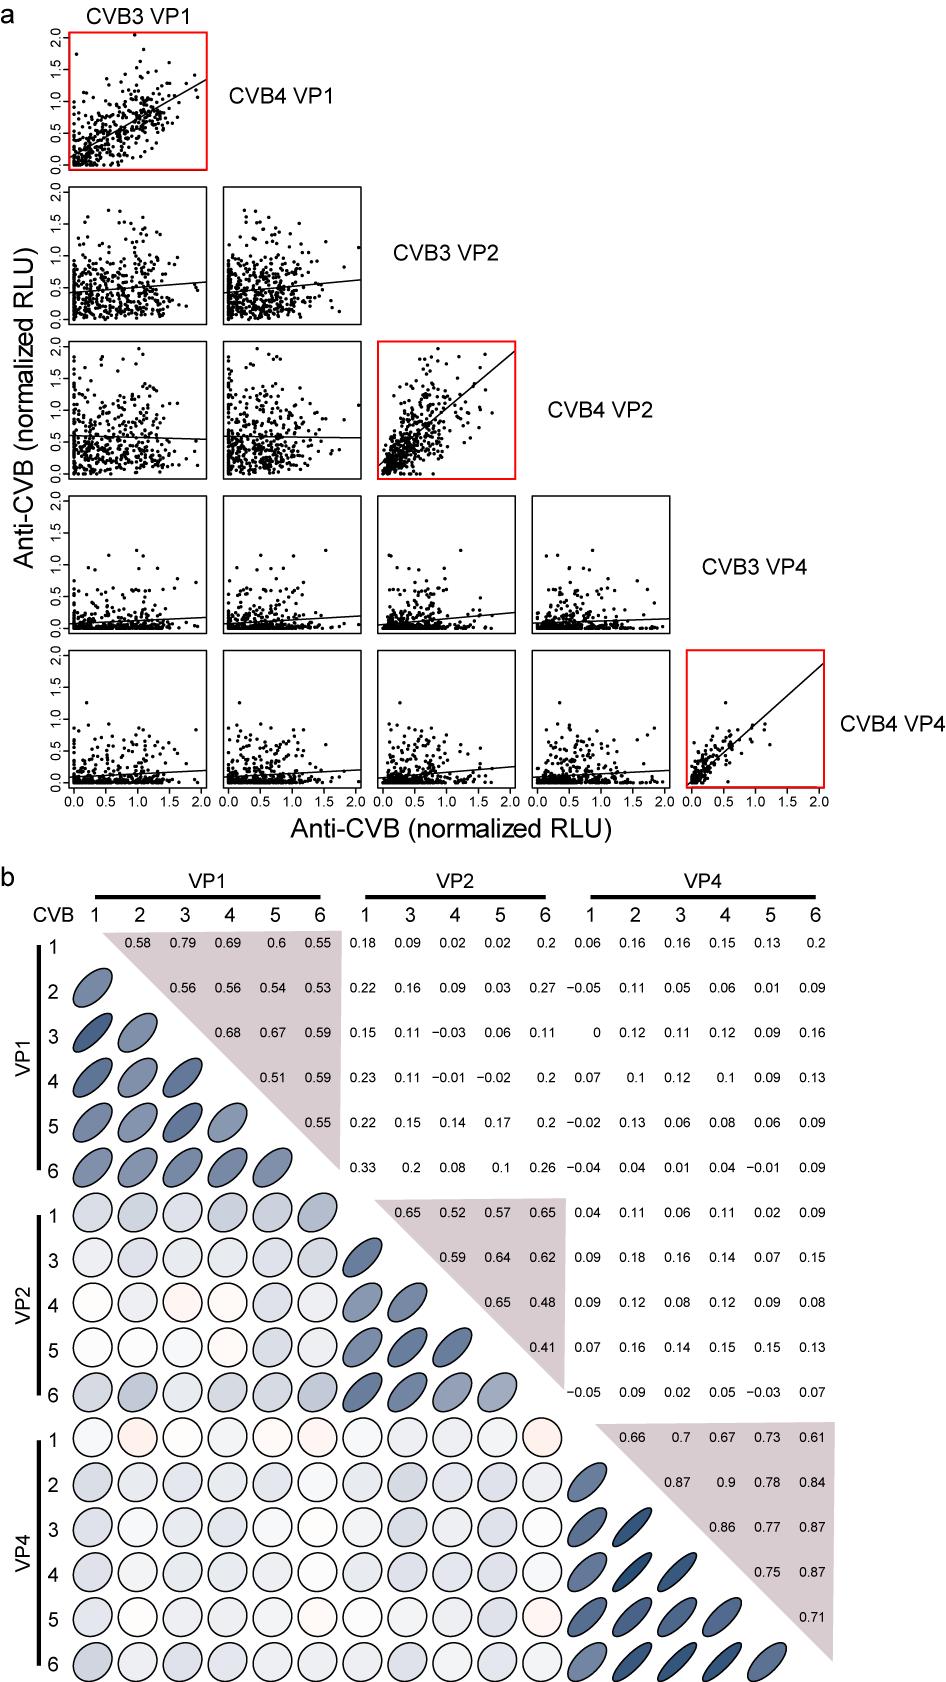
4 Supplementary Figure 2: Correlations between antibodies to viral capsid antigens from CVB1-6. (a) Scatter plot matrix of anti-cvb3 and anti-cvb4 antibody titers in all sera analyzed in this study. Each dot represents a sample and the line represents the linear regression. Plots with the same VP (but different serotype) plotted on both the x and y axes are highlighted with a red border. (b) A matrix summarizing the Pearson correlation between antibody titers for each CVB antigen. The upper right panel lists the correlation co-efficient for each comparison and values greater than 0.4 are shaded. The bottom left panel shows ellipses representative of the magnitude of the correlation. Blue ellipses with a positive slope, indicate a positive correlation and red ellipses with a negative slope indicate negative correlations, where a greater intensity in color indicates a correlation-coefficient closer to 1 (blue) or -1 (red). 4
 and anti-vp2 (open symbols) antibody titers of sera selected to be analyzed by the plaque neutralization test as determined by the LIPS assay.")
5 Supplementary Figure 3: Sera selected for analysis by plaque neutralization test. Anti-VP1 (filled symbols) and anti-vp2 (open symbols) antibody titers of sera selected to be analyzed by the plaque neutralization test as determined by the LIPS assay. Sera 1-4 have strong anti-vp1 and anti-vp2 antibody titers and sera 5-8 have strong anti-vp2 antibody titers. 5
 in longitudinal serum samples from children who developed beta cell autoantibody seroconversion before age 3 years")

6 Supplementary Figure 4: Anti-CVB antibodies in follow-up samples from children with early insulin autoimmunity. Anti-VP1 antibodies (y axis) in longitudinal serum samples from children who developed beta cell autoantibody seroconversion before age 3 years with IAA as the first detected autoantibodies. Titers are shown relative to the time of insulin autoantibody seroconversion (x axis). Each symbol and line represents a different child, each point represents the mean RLU for VP1 of all six CVB serotypes measured at a given time point, and error bars represent s.e.m. 6
7 Supplementary Figure 5: Anti-VP2 and anti-vp4 CVB antibodies in newborns are not associated with seroconversion. Anti-VP2 (a) and anti-vp4 (b) antibodies in cord blood serum of BABYDIAB study participants stratified as beta cell autoantibody negative throughout follow-up (no autoimmunity), beta cell autoantibody seroconversion before age 3 years with IAA as the first detected autoantibodies (early insulin), and beta cell autoantibody seroconversion with GAD as the first detected autoantibody target (GAD). Each point is an individual and the horizontal bar indicates the median. No significant differences based on comparison with early insulin autoimmunity group for the corresponding CVB serotype using the Mann Whitney U test. 7
 antigens of CVB1-6 in cord blood serum (Newborn), healthy control children and adolescents (Healthy controls), and children")
8 Supplementary Figure 6: Maternal anti-cvb antibody profiles in newborns differ from those observed in adolescents. The LIPS assay was used to detect antibodies to viral capsid protein (VP) antigens of CVB1-6 in cord blood serum (Newborn), healthy control children and adolescents (Healthy controls), and children and adolescents with recent onset type 1 diabetes (Recent onset T1D). (a) Antibody titers against VPs of CBV1-6 are represented as a heat map where each vertical line is a sample and the intensity of the color corresponds to the RLU measured by the LIPS assay. Data is sorted based on the clusters that were identified as described in Fig. 1. (b) The proportion of sera within the 4 clusters defined in Fig. 1 is represented by a stacked bar chart for each cohort. A higher proportion of samples from newborns were observed in cluster 4 (p>0.001 Healthy controls; p=0.004 Recent onset T1D) and a lower proportion of samples from newborns were observed in cluster 1 (p=0.002 Healthy controls; p=0.027 Recent onset T1D) as compared to the children/adolescent groups using the Z-score test statistic and two-tailed test. 8
9 Supplementary Figure 7: Gating strategy for isolation of peptide responsive CD45RO + T cells. CFSE-labeled CD45RO + T cells cultured with CVB4 p2c or GAD peptide loaded monocyte-derived dendritic cells for 5 days. Antigen-responsive memory T cells were identified by flow cytometry as 7AAD - CD4 + CD25 hi CFSE lo CD45RO + CD45RA -. 9
10 Supplementary table 1: Anti-VP1 and anti-vp4 antibody titers increase with age. Group 1 Group 2 (mean ± s.e.m) (mean ± s.e.m) Age (years) ± ± p-value* CVB ± ± > CVB ± ± > Relative light units (normalized) VP4 VP2 VP1 CVB ± ± > CVB ± ± > CVB ± ± > CVB ± ± > CVB ± ± CVB ± ± CVB ± ± CVB ± ± CVB ± ± CVB ± ± > CVB ± ± > CVB ± ± CVB ± ± > CVB ± ± CVB ± ± *p-values calculated using Mann Whitney U Test 10
11 Supplementary table 2: Paired TCR sequences not shared between CVB4 p2c peptide and GAD65 peptide responsive CD4 + CD45RO + T cells. Subject Antigen # cells TRAV TRAJ JunctionA TRBV TRBJ TRBD JunctionB BC928 CVB4 1 36/DV7*02 42*01 CAVEA#YGGSQGNLIF 20-1*01 2-7*01 2*02 CSARDLRELEQYF p2c /DV7*02 42*01 CAVEANMEXAK#NLIF 20-1*01 2-7*01 2*02 CSARDLRELEQYF 1 9-2*01 30*01 CALT#NRDDKIIF 28*01 2-3*01 1*01 CASSLAGQTPDTQ#F 1 9-2*01 30*01 CALTGTEMTRSS# 9*01 2-3*01 1*01 CASSLAGQTPDTQ#F 1 9-2*01 34*01 CVVSVGNTDKLIF 10-3*01 2-3*01 1*01 CASSLAGQTPDTQ#F 1 9-2*01 29*01 CAVGARGSGNTPLVF 30*01 2-3*01 1*01 CASSLAGQTPDTQ#F *01 42*01 CIVRG#YGGSQGNLIF 10-3*01 2-1*01 1*01 CASSIGGTFGPYNEQFF 1 22*01 28*01 CAVSGAGSYQLTF 5-1*01 2-5*01 2*01 CASSLSTSVAQETQYF 1 8-2*01 34*01 CVVSVGNTDKLIF 28*01 1-5*01 1*01 VPSVPRQE#QPQHF *01 58*01 CIVSKETSGSRLTF 6-1*01 2-1*01 1*01 CATRSTGNIYNEQFF *01 33*01 CIVRFGP#MDSNYQLIW 6-1*01 2-3*01 2*01 CRARVSATSTDTQ#F 1 36/DV7*02 54*01 CAVEAVIQGAQKLVF 2*01 2-3*01 2*02 CASSQDGASGRAYTQYF 1 36/DV7*02 42*01 CAVEXNMEEAXX#LIF 27*01 2-7*01 2*02 CRARDLRELXEQYF 1 9-2*01 21*01 CALLSYNFNKFYF 28*01 2-1*01 2*01 CASXKRD*RGGLQ*A#FF 1 23/DV6*01 13*02 CAASRTSGGYQKVTF 5-4*01 1-6*02 1*01 CASRGQGAASPLHF 1 17*01 56*01 CATDYTGANSKLTF 4-2*01 2-1*01 2*01 CSAQXTPRPVSS#F 1 23/DV6*01 29*01 CAARYSGNTPLVF 5-6*01 2-7*01 1*01 CRANGAR#EQYF 1 8-6*01 49*01 CAVILL#NQFYF 14*01 2-1*01 1*01 FTSSAARYEQFF 1 36/DV7*02 40*01 CAVEG#YKYIF 3-1*01 2-3*01 1*01 CRXGDRGTDTQ#F 1 9-2*01 52*01 CALSQNAGGTSYGKLTF 19*01 2-5*01 1*01 CASSSRDRPTQYF 1 9-2*01 30*01 CALTGTEMTSSS# 28*01 2-3*01 1*01 CASSLAGRPQIR##F 1 41*01 49*01 CADHTNTGNQFYF 2*01 2-5*01 2*01 CASSALSSVKKETQYF 1 17*01 23*01 CATLNVGNQGGKLIF 7-6*01 2-6*01 1*01 CASXEGQGLGGWVNXLTF 1 17*01 23*01 CATLNXGNQGGKLIF 5-5*01 2-6*01 1*01 CAXXEGRGWALGPTAX#F 1 8-6*02 52*01 CAVSYAGGTSYGKLTF 6-6*01 1-5*01 1*01 CASSGXGGQPQHF *01 26*01 CIVRVSHN*G#RDNYGQNFVF 10-3*01 2-5*01 1*01 CAS*GQGQETQNF 1 29/DV5*01 33*01 CAASDGSNYQLIW 27*01 2-7*01 1*01 CASSLPRTGKDEQYF 1 29/DV5*01 6*01 CAASGSGGSYIPTF 27*01 2-3*01 2*01 CARQGD*RKXDTQ#F 1 6*03 [] 4*01 CALDPGGYNKLFF 7-9*01 2-1*01 2*01 CSARTSGGYNEQFF 1 2*01 39*01 CAVEDHILLXNLLPF 5-1*01 2-1*01 2*01 CASSLVFTGSGYNEQFF 1 8-6*02 50*01 CAVRRASYDKVIF 7-9*01 2-2*01 2*02 CASKSSGRLTGELFF 1 3*01 6*01 CAVRVLGGSYIPTF 5-1*01 2-1*01 2*01 CTGTREYNEQFF 1 8-6*01 31*01 CAVSEGX#RLMF 28*01 2-2*01 2*01 CASTPRGRETGGLFF 1 8-2*01 56*01 CAVSGAA*GLX#NSKLTF 29-1*01 2-7*01 2*01 CASSERGGS#EQYF *01 42*01 CIVLRL#GSQGNLIF 28*01 2-2*01 2*02 CASRGLAGATGELFF *01 33*01 CIVRFGPKWI#NYQLIW 2*01 2-3*01 1*01 CSARVSATSTDTQYF *01 38*01 CIVRG*CWQQPYAEL# 6-5*01 2-3*01 2*01 CRAKLGLEATDTQ#F *01 38*01 CIVRG*CWQQPYPEP# 20-1*01 2-3*01 2*01 CSARLGLEATDTQYF 1 8-4*03 49*01 CVASLNTGNQFYF 20-1*03 2-5*01 1*01 CASSLDRVQETQYF 1 29/DV5*01 30*01 VQQE#DDKIIF 20-1*01 2-1*01 2*01 CASSVGLAKTIGEQFF 1 25*01 39*01 CAALVGWAGNMLTF 5-6*01 2-7*01 2*01 CVPAIIRGGGXYEEYF 1 2*01 29*01 CAASRNSGNTPLVF 1*01 2-3*01 1*01 CARSWEDTQXF B858 GAD GAD *02 20*01 CAVGSNDYKLSF 20-1*04 1-2*01 1*01 CSAPSGPP#NYGYTF 2 41*01 42*01 CAVMNYGGSQGNLIF 11-1*01 2-2*01 2*01 CASDRGGKPGGVVF D161 CVB4 p2c /DV5*01 31*01 CAAFRNNNARLMF 5-5*01 1-3*01 1*01 CASSLFSSGNTIYF 1 36/DV7*01 44*01 CAVEAAGTASKLTF 30*01 1-1*01 2*01 CAWGHSGGPTNTEAFF 11
Blood draws up to 3% of body weight in clinical trials are safe in children
 1 Blood draws up to 3% of body weight in clinical trials are safe in children Claudia Peplow a, Robin Assfalg PhD a, Andreas Beyerlein PhD a, Joerg Hasford MD d, Ezio Bonifacio PhD c, Anette-G. Ziegler
Islet autoantibody phenotypes and incidence in children at increased risk for type 1 diabetes
 Diabetologia (1) 8:317 33 DOI 1.17/s1-1-367-y ARTICLE Islet autoantibody phenotypes and incidence in children at increased risk for type 1 diabetes Eleni Z. Giannopoulou 1 & Christiane Winkler 1, & Ruth
Andreas Beyerlein, PhD; Ewan Donnachie, MSc; Anette-Gabriele Ziegler, MD
 Infections in early life and development of celiac disease Brief Original Contribution Andreas Beyerlein, PhD; Ewan Donnachie, MSc; Anette-Gabriele Ziegler, MD Corresponding author: Dr. Andreas Beyerlein,
Autoantibodies to N-terminally truncated GAD improve clinical phenotyping of individuals with adult-onset diabetes: Action LADA 12
 Diabetologia (2018) 61:1644 1649 https://doi.org/10.1007/s00125-018-4605-3 SHORT COMMUNICATION Autoantibodies to N-terminally truncated GAD improve clinical phenotyping of individuals with adult-onset
Reversion of b-cell Autoimmunity Changes Risk of Type 1 Diabetes: TEDDY Study DOI: /dc
 Diabetes Care 1 Reversion of b-cell Autoimmunity Changes Risk of Type 1 Diabetes: TEDDY Study DOI: 10.2337/dc16-0181 Kendra Vehik, 1 Kristian F. Lynch, 1 Desmond A. Schatz, 2 Beena Akolkar, 3 William Hagopian,
New biomarkers for diagnosis
 Diabetesforschung 07.11.2016 The presence of certain proteins in blood samples can predict incipient type 1 diabetes. The researchers identify these in their measurements using so-called peptide peaks
Low Avidity CMV + T Cells accumulate in Old Humans
 Supplementary Figure Legends Supplementary Figure 1. CD45RA expressing CMVpp65-specific T cell populations accumulate within HLA-A*0201 and HLA-B*0701 individuals Pooled data showing the size of the NLV/HLA-A*0201-specific
Supplementary Figure 1.
 Supplementary Figure 1. Female Pro-ins2 -/- mice at 5-6 weeks of age were either inoculated i.p. with a single dose of CVB4 (1x10 5 PFU/mouse) or PBS and treated with αgalcer or control vehicle. On day
Meaning-based guidance of attention in scenes as revealed by meaning maps
 SUPPLEMENTARY INFORMATION Letters DOI: 1.138/s41562-17-28- In the format provided by the authors and unedited. -based guidance of attention in scenes as revealed by meaning maps John M. Henderson 1,2 *
Nature Neuroscience: doi: /nn Supplementary Figure 1. Behavioral training.
 Supplementary Figure 1 Behavioral training. a, Mazes used for behavioral training. Asterisks indicate reward location. Only some example mazes are shown (for example, right choice and not left choice maze
IgG3 regulates tissue-like memory B cells in HIV-infected individuals
 SUPPLEMENTARY INFORMATION Articles https://doi.org/10.1038/s41590-018-0180-5 In the format provided by the authors and unedited. IgG3 regulates tissue-like memory B cells in HIV-infected individuals Lela
Supplementary Figure 1. Metabolic landscape of cancer discovery pipeline. RNAseq raw counts data of cancer and healthy tissue samples were downloaded
 Supplementary Figure 1. Metabolic landscape of cancer discovery pipeline. RNAseq raw counts data of cancer and healthy tissue samples were downloaded from TCGA and differentially expressed metabolic genes
Elimination of Dietary Gluten Does Not Reduce Titers of Type 1 Diabetes Associated Autoantibodies in High-Risk Subjects
 Clinical Care/Education/Nutrition O R I G I N A L A R T I C L E Elimination of Dietary Gluten Does Not Reduce Titers of Type 1 Diabetes Associated Autoantibodies in High-Risk Subjects MICHAEL HUMMEL, MD
SCATTER PLOTS AND TREND LINES
 1 SCATTER PLOTS AND TREND LINES LEARNING MAP INFORMATION STANDARDS 8.SP.1 Construct and interpret scatter s for measurement to investigate patterns of between two quantities. Describe patterns such as
Supplementary Figure 1
 Supplementary Figure 1 Identification of IFN-γ-producing CD8 + and CD4 + T cells with naive phenotype by alternative gating and sample-processing strategies. a. Contour 5% probability plots show definition
Supplementary Figure 1. Using DNA barcode-labeled MHC multimers to generate TCR fingerprints
 Supplementary Figure 1 Using DNA barcode-labeled MHC multimers to generate TCR fingerprints (a) Schematic overview of the workflow behind a TCR fingerprint. Each peptide position of the original peptide
Nature Biotechnology: doi: /nbt Supplementary Figure 1. Experimental design and workflow utilized to generate the WMG Protein Atlas.
 Supplementary Figure 1 Experimental design and workflow utilized to generate the WMG Protein Atlas. (a) Illustration of the plant organs and nodule infection time points analyzed. (b) Proteomic workflow
Infections in Early Life and Development of Celiac Disease
 Infections in Early Life and Development of Celiac Disease www.medscape.com Andreas Beyerlein; Ewan Donnachie; Anette-Gabriele Ziegler Am J Epidemiol. 2017;186(11):1277-1280. Abstract and Introduction
Nature Immunology: doi: /ni Supplementary Figure 1. RNA-Seq analysis of CD8 + TILs and N-TILs.
 Supplementary Figure 1 RNA-Seq analysis of CD8 + TILs and N-TILs. (a) Schematic representation of the tumor and cell types used for the study. HNSCC, head and neck squamous cell cancer; NSCLC, non-small
CD44
 MR1-5-OP-RU CD24 CD24 CD44 MAIT cells 2.78 11.2 WT RORγt- GFP reporter 1 5 1 4 1 3 2.28 1 5 1 4 1 3 4.8 1.6 8.1 1 5 1 4 1 3 1 5 1 4 1 3 3.7 3.21 8.5 61.7 1 2 1 3 1 4 1 5 TCRβ 2 1 1 3 1 4 1 5 CD44 1 2 GFP
Online Appendix Material and Methods: Pancreatic RNA isolation and quantitative real-time (q)rt-pcr. Mice were fasted overnight and killed 1 hour (h)
rt-pcr. Mice were fasted overnight and killed 1 hour (h)") Online Appendix Material and Methods: Pancreatic RNA isolation and quantitative real-time (q)rt-pcr. Mice were fasted overnight and killed 1 hour (h) after feeding. A small slice (~5-1 mm 3 ) was taken
Online Appendix Material and Methods: Pancreatic RNA isolation and quantitative real-time (q)rt-pcr. Mice were fasted overnight and killed 1 hour (h) after feeding. A small slice (~5-1 mm 3 ) was taken
Supplementary Figure 1. Localization of face patches (a) Sagittal slice showing the location of fmri-identified face patches in one monkey targeted
 Sagittal slice showing the location of fmri-identified face patches in one monkey targeted") Supplementary Figure 1. Localization of face patches (a) Sagittal slice showing the location of fmri-identified face patches in one monkey targeted for recording; dark black line indicates electrode. Stereotactic
Supplementary Figure 1. Localization of face patches (a) Sagittal slice showing the location of fmri-identified face patches in one monkey targeted for recording; dark black line indicates electrode. Stereotactic
Supplementary Figure 1. ALVAC-protein vaccines and macaque immunization. (A) Maximum likelihood
 Maximum likelihood") Supplementary Figure 1. ALVAC-protein vaccines and macaque immunization. (A) Maximum likelihood tree illustrating CRF01_AE gp120 protein sequence relationships between 107 Envs sampled in the RV144 trial
Supplementary Figure 1. ALVAC-protein vaccines and macaque immunization. (A) Maximum likelihood tree illustrating CRF01_AE gp120 protein sequence relationships between 107 Envs sampled in the RV144 trial
Supplemental Information. Checkpoint Blockade Immunotherapy. Induces Dynamic Changes. in PD-1 CD8 + Tumor-Infiltrating T Cells
 Immunity, Volume 50 Supplemental Information Checkpoint Blockade Immunotherapy Induces Dynamic Changes in PD-1 CD8 + Tumor-Infiltrating T Cells Sema Kurtulus, Asaf Madi, Giulia Escobar, Max Klapholz, Jackson
SUPPLEMENTARY INFORMATION
 Supplemental Figure 1. Furin is efficiently deleted in CD4 + and CD8 + T cells. a, Western blot for furin and actin proteins in CD4cre-fur f/f and fur f/f Th1 cells. Wild-type and furin-deficient CD4 +
The North Carolina Health Data Explorer
 The North Carolina Health Data Explorer The Health Data Explorer provides access to health data for North Carolina counties in an interactive, user-friendly atlas of maps, tables, and charts. It allows
Nature Immunology: doi: /ni Supplementary Figure 1. Gene expression profile of CD4 + T cells and CTL responses in Bcl6-deficient mice.
 Supplementary Figure 1 Gene expression profile of CD4 + T cells and CTL responses in Bcl6-deficient mice. (a) Gene expression profile in the resting CD4 + T cells were analyzed by an Affymetrix microarray
Nature Neuroscience: doi: /nn Supplementary Figure 1. Lick response during the delayed Go versus No-Go task.
 Supplementary Figure 1 Lick response during the delayed Go versus No-Go task. Trial-averaged lick rate was averaged across all mice used for pyramidal cell imaging (n = 9). Different colors denote different
Supplementary Figure S1. PTPN2 levels are not altered in proliferating CD8+ T cells. Lymph node (LN) CD8+ T cells from C57BL/6 mice were stained with
 CD8+ T cells from C57BL/6 mice were stained with") Supplementary Figure S1. PTPN2 levels are not altered in proliferating CD8+ T cells. Lymph node (LN) CD8+ T cells from C57BL/6 mice were stained with CFSE and stimulated with plate-bound α-cd3ε (10µg/ml)
Supplementary Figure S1. PTPN2 levels are not altered in proliferating CD8+ T cells. Lymph node (LN) CD8+ T cells from C57BL/6 mice were stained with CFSE and stimulated with plate-bound α-cd3ε (10µg/ml)
Supplementary Figure 1. IL-12 serum levels and frequency of subsets in FL patients. (A) IL-12
 IL-12") 1 Supplementary Data Figure legends Supplementary Figure 1. IL-12 serum levels and frequency of subsets in FL patients. (A) IL-12 serum levels measured by multiplex ELISA (Luminex) in FL patients before
1 Supplementary Data Figure legends Supplementary Figure 1. IL-12 serum levels and frequency of subsets in FL patients. (A) IL-12 serum levels measured by multiplex ELISA (Luminex) in FL patients before
Supplementary Fig. 1: Ex vivo tetramer enrichment with anti-c-myc beads
 Supplementary Fig. 1: Ex vivo tetramer enrichment with anti-c-myc beads Representative example of comparative ex vivo tetramer enrichment performed in three independent experiments with either conventional
Unit 7 Comparisons and Relationships
 Unit 7 Comparisons and Relationships Objectives: To understand the distinction between making a comparison and describing a relationship To select appropriate graphical displays for making comparisons
Supplementary Figures
 Supplementary Figures Supplementary Figure 1. Heatmap of GO terms for differentially expressed genes. The terms were hierarchically clustered using the GO term enrichment beta. Darker red, higher positive
1,000 in silico simulated alpha, beta, gamma and delta TCR repertoires were created.
 938 939 940 941 942 Figure S1 Schematic of the in silico TCRminer and MiXCR validation. 1,000 in silico simulated alpha, beta, gamma and delta TCR repertoires were created. Then, 100,000 simulated 80 bp
Nature Immunology: doi: /ni Supplementary Figure 1. Infection strategy.
 Supplementary Figure 1 Infection strategy. To test the antibody responses against influenza viruses, animals were sequentially infected with two divergent strains of the same subtype. For H1N1 infections,
Supplementary Table 1. Functional avidities of survivin-specific T-cell clones against LML-peptide
 Supplementary Table 1. Functional avidities of survivin-specific T-cell clones against LML-peptide pulsed T2 cells. clone avidity by 4-hour 51 Cr-release assay 50% lysis at E:T 10:1 [LML peptide, M] #24
Supplementary Table 1 Clinicopathological characteristics of 35 patients with CRCs
 Supplementary Table Clinicopathological characteristics of 35 patients with CRCs Characteristics Type-A CRC Type-B CRC P value Sex Male / Female 9 / / 8.5 Age (years) Median (range) 6. (9 86) 6.5 (9 76).95
Reward prediction based on stimulus categorization in. primate lateral prefrontal cortex
 Reward prediction based on stimulus categorization in primate lateral prefrontal cortex Xiaochuan Pan, Kosuke Sawa, Ichiro Tsuda, Minoro Tsukada, Masamichi Sakagami Supplementary Information This PDF file
Supplementary Figure 1. Nature Neuroscience: doi: /nn.4547
 Supplementary Figure 1 Characterization of the Microfetti mouse model. (a) Gating strategy for 8-color flow analysis of peripheral Ly-6C + monocytes from Microfetti mice 5-7 days after TAM treatment. Living
Supplementary Figure 1: Features of IGLL5 Mutations in CLL: a) Representative IGV screenshot of first
 Representative IGV screenshot of first") Supplementary Figure 1: Features of IGLL5 Mutations in CLL: a) Representative IGV screenshot of first intron IGLL5 mutation depicting biallelic mutations. Red arrows highlight the presence of out of phase
Supplementary Figure 1: Features of IGLL5 Mutations in CLL: a) Representative IGV screenshot of first intron IGLL5 mutation depicting biallelic mutations. Red arrows highlight the presence of out of phase
Isolation of human monoclonal autoantibodies derived from pancreatic lymph node and peripheral blood B cells of islet autoantibody-positive patients
 Diabetologia (216) 59:294 298 DOI 1.17/s125-15-3792-4 SHORT COMMUNICATION Isolation of human monoclonal autoantibodies derived from pancreatic lymph node and peripheral blood B cells of islet autoantibody-positive
Feature ranking of type 1 diabetes susceptibility genes improves prediction of type 1 diabetes
 Diabetologia (214) 57:2521 2529 DOI 1.17/s125-14-3362-1 ARTICLE Feature ranking of type 1 diabetes susceptibility genes improves prediction of type 1 diabetes Christiane Winkler & Jan Krumsiek & Florian
Expanded View Figures
 EMO Molecular Medicine Proteomic map of squamous cell carcinomas Hanibal ohnenberger et al Expanded View Figures Figure EV1. Technical reproducibility. Pearson s correlation analysis of normalised SILC
Supplementary Appendix
 Supplementary Appendix This appendix has been provided by the authors to give readers additional information about their work. Supplement to: Johnson DB, Balko JM, Compton ML, et al. Fulminant myocarditis
SUPPLEMENTARY INFORMATION
 doi:1.138/nature1554 a TNF-α + in CD4 + cells [%] 1 GF SPF 6 b IL-1 + in CD4 + cells [%] 5 4 3 2 1 Supplementary Figure 1. Effect of microbiota on cytokine profiles of T cells in GALT. Frequencies of TNF-α
<10. IL-1β IL-6 TNF + _ TGF-β + IL-23
 3 ns 25 ns 2 IL-17 (pg/ml) 15 1 ns ns 5 IL-1β IL-6 TNF
Immunophenotyping of rheumatoid arthritis reveals a linkage between. HLA-DRB1 genotype, CXCR4 expression on memory CD4 + T cells, and
 Supplementary Material Title: Immunophenotyping of rheumatoid arthritis reveals a linkage between HLA-DRB1 genotype, CXCR4 expression on memory CD4 + T cells, and disease activity. Authors: Yasuo Nagafuchi
Unit 1 Exploring and Understanding Data
 Unit 1 Exploring and Understanding Data Area Principle Bar Chart Boxplot Conditional Distribution Dotplot Empirical Rule Five Number Summary Frequency Distribution Frequency Polygon Histogram Interquartile
HD1 (FLU) HD2 (EBV) HD2 (FLU)
 HD2 (EBV) HD2 (FLU)") ramer staining + anti-pe beads ramer staining a HD1 (FLU) HD2 (EBV) HD2 (FLU).73.11.56.46.24 1.12 b CD127 + c CD127 + d CD127 - e CD127 - PD1 - PD1 + PD1 + PD1-1 1 1 1 %CD127 + PD1-8 6 4 2 + anti-pe %CD127
ramer staining + anti-pe beads ramer staining a HD1 (FLU) HD2 (EBV) HD2 (FLU).73.11.56.46.24 1.12 b CD127 + c CD127 + d CD127 - e CD127 - PD1 - PD1 + PD1 + PD1-1 1 1 1 %CD127 + PD1-8 6 4 2 + anti-pe %CD127
Detergent solubilised 5 TMD binds pregnanolone at the Q245 neurosteroid potentiation site.
 Supplementary Figure 1 Detergent solubilised 5 TMD binds pregnanolone at the Q245 neurosteroid potentiation site. (a) Gel filtration profiles of purified 5 TMD samples at 100 nm, heated beforehand for
Understandable Statistics
 Understandable Statistics correlated to the Advanced Placement Program Course Description for Statistics Prepared for Alabama CC2 6/2003 2003 Understandable Statistics 2003 correlated to the Advanced Placement
Nature Neuroscience doi: /nn Supplementary Figure 1. Characterization of viral injections.
 Supplementary Figure 1 Characterization of viral injections. (a) Dorsal view of a mouse brain (dashed white outline) after receiving a large, unilateral thalamic injection (~100 nl); demonstrating that
Supplementary Material for
 Supplementary Material for Selective neuronal lapses precede human cognitive lapses following sleep deprivation Supplementary Table 1. Data acquisition details Session Patient Brain regions monitored Time
Statistical Tools in Biology
 Statistical Tools in Biology Research Methodology Design protocol/procedure. (2 types) Cross sectional study comparing two different grps. e.g, comparing LDL levels between athletes and couch potatoes.
Introduction to Statistical Data Analysis I
 Introduction to Statistical Data Analysis I JULY 2011 Afsaneh Yazdani Preface What is Statistics? Preface What is Statistics? Science of: designing studies or experiments, collecting data Summarizing/modeling/analyzing
Supplementary information. Early development of broad neutralizing antibodies in HIV-1 infected infants
 Supplementary information Early development of broad neutralizing antibodies in HIV-1 infected infants Leslie Goo, Vrasha Chohan, Ruth Nduati, Julie Overbaugh Supplementary Figure 1. Neutralization profile
Diabetes Antibody Standardization Program: evaluation of assays for autoantibodies to glutamic acid decarboxylase and islet antigen-2
 Diabetologia (2008) 51:846 852 DOI 10.7/s00125-008-0967-2 ARTICLE Diabetes Antibody Standardization Program: evaluation of assays for autoantibodies to glutamic acid decarboxylase and islet antigen-2 C.
Supplementary Figure 1: TSLP receptor skin expression in dcssc. A: Healthy control (HC) skin with TSLP receptor expression in brown (10x
 skin with TSLP receptor expression in brown (10x") Supplementary Figure 1: TSLP receptor skin expression in dcssc. A: Healthy control (HC) skin with TSLP receptor expression in brown (10x magnification). B: Second HC skin stained for TSLP receptor in brown
Supplementary Figure 1: TSLP receptor skin expression in dcssc. A: Healthy control (HC) skin with TSLP receptor expression in brown (10x magnification). B: Second HC skin stained for TSLP receptor in brown
OBJECTIVE RESEARCH DESIGN AND METHODS RESULTS CONCLUSIONS. Diabetes Care 1
 Diabetes Care 1 First Infant Formula Type and Risk of Islet Autoimmunity in The Environmental Determinants of Diabetes in the Young (TEDDY) Study DOI: 10.2337/dc16-1624 OBJECTIVE Studies on the introduction
STATISTICS AND RESEARCH DESIGN
 Statistics 1 STATISTICS AND RESEARCH DESIGN These are subjects that are frequently confused. Both subjects often evoke student anxiety and avoidance. To further complicate matters, both areas appear have
SUPPLEMENTARY DATA. Supplementary Table S1. Clinical characteristics of the study subjects.*
 Supplementary Table S1. Clinical characteristics of the study subjects.* T2D ND n (F/M) 66 (21/45) 25 (7/18) Age (years) 61.8 ± 6.9 49.4 ± 7.3 # Body weight (kg) 95 ± 16 105 ± 13 # Body mass index (kg.
CD4 + T cells recovered in Rag2 / recipient ( 10 5 ) Heart Lung Pancreas
 Heart Lung Pancreas") a CD4 + T cells recovered in Rag2 / recipient ( 1 5 ) Heart Lung Pancreas.5 1 2 4 6 2 4 6 Ctla4 +/+ Ctla4 / Ctla4 / Lung Ctla4 / Pancreas b Heart Lung Pancreas Ctla4 +/+ Ctla4 / Ctla4 / Lung Ctla4 / Pancreas
a CD4 + T cells recovered in Rag2 / recipient ( 1 5 ) Heart Lung Pancreas.5 1 2 4 6 2 4 6 Ctla4 +/+ Ctla4 / Ctla4 / Lung Ctla4 / Pancreas b Heart Lung Pancreas Ctla4 +/+ Ctla4 / Ctla4 / Lung Ctla4 / Pancreas
Type 1 Diabetes Prevention: A Goal Dependent on Accepting a Diagnosis of an Asymptomatic Disease
 Diabetes Volume 65, November 2016 3233 Anette-G. Ziegler, 1,2 Ezio Bonifacio, 3,4,5 Alvin C. Powers, 6,7,8 John A. Todd, 9 Leonard C. Harrison, 10 and Mark A. Atkinson 11 Type 1 Diabetes Prevention: A
Nature Neuroscience: doi: /nn Supplementary Figure 1. Task timeline for Solo and Info trials.
 Supplementary Figure 1 Task timeline for Solo and Info trials. Each trial started with a New Round screen. Participants made a series of choices between two gambles, one of which was objectively riskier
Chapter 3 CORRELATION AND REGRESSION
 CORRELATION AND REGRESSION TOPIC SLIDE Linear Regression Defined 2 Regression Equation 3 The Slope or b 4 The Y-Intercept or a 5 What Value of the Y-Variable Should be Predicted When r = 0? 7 The Regression
Nature Immunology: doi: /ni Supplementary Figure 1. DNA-methylation machinery is essential for silencing of Cd4 in cytotoxic T cells.
 Supplementary Figure 1 DNA-methylation machinery is essential for silencing of Cd4 in cytotoxic T cells. (a) Scheme for the retroviral shrna screen. (b) Histogram showing CD4 expression (MFI) in WT cytotoxic
PATHOPHYSIOLOGY Diabetes Volume 65, July Diabetes 2016;65: DOI: /db
 1988 Diabetes Volume 65, July 2016 Helena Elding Larsson, 1 Kendra Vehik, 2 Michael J. Haller, 3 Xiang Liu, 2 Beena Akolkar, 4 William Hagopian, 5 Jeffrey Krischer, 2 Åke Lernmark, 1 Jin-Xiong She, 6 Olli
Supplemental Figure 1. Gating strategies for flow cytometry and intracellular cytokinestaining
 Supplemental Figure 1. Gating strategies for flow cytometry and intracellular cytokinestaining of PBMCs. Forward scatter area (FSC-A) versus side scatter area (SSC-A) was used to select lymphocytes followed
Supplementary Information
 Supplementary Information Vedolizumab is associated with changes in innate rather than adaptive immunity in patients with inflammatory bowel disease Sebastian Zeissig, Elisa Rosati, C. Marie Dowds, Konrad
Supplementary Figure 1. Efficiency of Mll4 deletion and its effect on T cell populations in the periphery. Nature Immunology: doi: /ni.
 Supplementary Figure 1 Efficiency of Mll4 deletion and its effect on T cell populations in the periphery. Expression of Mll4 floxed alleles (16-19) in naive CD4 + T cells isolated from lymph nodes and
Nature Genetics: doi: /ng Supplementary Figure 1. SEER data for male and female cancer incidence from
 Supplementary Figure 1 SEER data for male and female cancer incidence from 1975 2013. (a,b) Incidence rates of oral cavity and pharynx cancer (a) and leukemia (b) are plotted, grouped by males (blue),
WDHS Curriculum Map Probability and Statistics. What is Statistics and how does it relate to you?
 WDHS Curriculum Map Probability and Statistics Time Interval/ Unit 1: Introduction to Statistics 1.1-1.3 2 weeks S-IC-1: Understand statistics as a process for making inferences about population parameters
NORTH SOUTH UNIVERSITY TUTORIAL 2
 NORTH SOUTH UNIVERSITY TUTORIAL 2 AHMED HOSSAIN,PhD Data Management and Analysis AHMED HOSSAIN,PhD - Data Management and Analysis 1 Correlation Analysis INTRODUCTION In correlation analysis, we estimate
Surface plasmon resonance (SPR) analysis
 analysis") Surface plasmon resonance (SPR) analysis Soluble CD8αα and was manufactured as described previously. 1,2 The C12C heterodimeric TCR was produced using an engineered disulfide bridge between the constant
Surface plasmon resonance (SPR) analysis Soluble CD8αα and was manufactured as described previously. 1,2 The C12C heterodimeric TCR was produced using an engineered disulfide bridge between the constant
Additional File 3. Description of methods used for co-localization analysis and additional co-localization figures.
 Additional File 3. Description of methods used for co-localization analysis and additional co-localization figures. Methods. In order to determine the interaction between EGFR and F-actin, four independent
Supplementary Figure 1. BMS enhances human T cell activation in vitro in a
 Supplementary Figure 1. BMS98662 enhances human T cell activation in vitro in a concentration-dependent manner. Jurkat T cells were activated with anti-cd3 and anti-cd28 antibody in the presence of titrated
Supplemental Figure 1
 Supplemental Figure 1 1a 1c PD-1 MFI fold change 6 5 4 3 2 1 IL-1α IL-2 IL-4 IL-6 IL-1 IL-12 IL-13 IL-15 IL-17 IL-18 IL-21 IL-23 IFN-α Mut Human PD-1 promoter SBE-D 5 -GTCTG- -1.2kb SBE-P -CAGAC- -1.kb
Behavioral generalization
 Supplementary Figure 1 Behavioral generalization. a. Behavioral generalization curves in four Individual sessions. Shown is the conditioned response (CR, mean ± SEM), as a function of absolute (main) or
Supplemental Information. Systems Scale Interactive Exploration. Reveals Quantitative and Qualitative Differences
 Immunity, Volume 38 Supplemental Information Systems Scale Interactive Exploration Reveals Quantitative and Qualitative Differences in Response to Influenza and Pneumococcal Vaccines Gerlinde Obermoser,
Scientific Staff Mobility Diabetes and Depression Selected Institutions and Contacts at TU Dresden
 Scientific Staff Mobility 2018 - Diabetes and Depression Selected Institutions and Contacts at TU Dresden Department of Internal Medicine III; Carl Gustav Carus School of Medicine The department, led by
1.4 - Linear Regression and MS Excel
 1.4 - Linear Regression and MS Excel Regression is an analytic technique for determining the relationship between a dependent variable and an independent variable. When the two variables have a linear
Statistics for Psychology
 Statistics for Psychology SIXTH EDITION CHAPTER 12 Prediction Prediction a major practical application of statistical methods: making predictions make informed (and precise) guesses about such things as
Targeting the Trimolecular Complex for Immune Intervention. Aaron Michels MD
 Targeting the Trimolecular Complex for Immune Intervention Aaron Michels MD Disclosures Research Grant from Novartis. Research Grant from NovoNordisk. Take Home Points Type 1 diabetes is an immunologic
Sum of Neurally Distinct Stimulus- and Task-Related Components.
 SUPPLEMENTARY MATERIAL for Cardoso et al. 22 The Neuroimaging Signal is a Linear Sum of Neurally Distinct Stimulus- and Task-Related Components. : Appendix: Homogeneous Linear ( Null ) and Modified Linear
INTERPRET SCATTERPLOTS
 Chapter2 MODELING A BUSINESS 2.1: Interpret Scatterplots 2.2: Linear Regression 2.3: Supply and Demand 2.4: Fixed and Variable Expenses 2.5: Graphs of Expense and Revenue Functions 2.6: Breakeven Analysis
Statistical Methods and Reasoning for the Clinical Sciences
 Statistical Methods and Reasoning for the Clinical Sciences Evidence-Based Practice Eiki B. Satake, PhD Contents Preface Introduction to Evidence-Based Statistics: Philosophical Foundation and Preliminaries
RELATIONSHIP OF CLINICAL FACTORS WITH ADIPONECTIN AND LEPTIN IN CHILDREN WITH NEWLY DIAGNOSED TYPE 1 DIABETES. Yuan Gu
 RELATIONSHIP OF CLINICAL FACTORS WITH ADIPONECTIN AND LEPTIN IN CHILDREN WITH NEWLY DIAGNOSED TYPE 1 DIABETES by Yuan Gu BE, Nanjing Institute of Technology, China, 2006 ME, University of Shanghai for
Nature Genetics: doi: /ng Supplementary Figure 1. Country distribution of GME samples and designation of geographical subregions.
 Supplementary Figure 1 Country distribution of GME samples and designation of geographical subregions. GME samples collected across 20 countries and territories from the GME. Pie size corresponds to the
Aesthetic Response to Color Combinations: Preference, Harmony, and Similarity. Supplementary Material. Karen B. Schloss and Stephen E.
 Aesthetic Response to Color Combinations: Preference, Harmony, and Similarity Supplementary Material Karen B. Schloss and Stephen E. Palmer University of California, Berkeley Effects of Cut on Pair Preference,
Supplementary figure 1: LII/III GIN-cells show morphological characteristics of MC
 1 2 1 3 Supplementary figure 1: LII/III GIN-cells show morphological characteristics of MC 4 5 6 7 (a) Reconstructions of LII/III GIN-cells with somato-dendritic compartments in orange and axonal arborizations
Supplementary Figures
 Supplementary Figures Supplementary Figure 1 Characterization of stable expression of GlucB and sshbira in the CT26 cell line (a) Live cell imaging of stable CT26 cells expressing green fluorescent protein
Supplementary Figure 1 Information on transgenic mouse models and their recording and optogenetic equipment. (a) 108 (b-c) (d) (e) (f) (g)
 108 (b-c) (d) (e) (f) (g)") Supplementary Figure 1 Information on transgenic mouse models and their recording and optogenetic equipment. (a) In four mice, cre-dependent expression of the hyperpolarizing opsin Arch in pyramidal cells
Supplementary Figure 1 Information on transgenic mouse models and their recording and optogenetic equipment. (a) In four mice, cre-dependent expression of the hyperpolarizing opsin Arch in pyramidal cells
List of Figures. List of Tables. Preface to the Second Edition. Preface to the First Edition
 List of Figures List of Tables Preface to the Second Edition Preface to the First Edition xv xxv xxix xxxi 1 What Is R? 1 1.1 Introduction to R................................ 1 1.2 Downloading and Installing
Nature Neuroscience: doi: /nn Supplementary Figure 1. Trial structure for go/no-go behavior
 Supplementary Figure 1 Trial structure for go/no-go behavior a, Overall timeline of experiments. Day 1: A1 mapping, injection of AAV1-SYN-GCAMP6s, cranial window and headpost implantation. Water restriction
Nature Neuroscience: doi: /nn Supplementary Figure 1. Large-scale calcium imaging in vivo.
 Supplementary Figure 1 Large-scale calcium imaging in vivo. (a) Schematic illustration of the in vivo camera imaging set-up for large-scale calcium imaging. (b) High-magnification two-photon image from
Supplementary Materials for
 www.sciencesignaling.org/cgi/content/full/8/381/ra59/dc1 Supplementary Materials for Analysis of single-cell cytokine secretion reveals a role for paracrine signaling in coordinating macrophage responses
Lesson 9 Presentation and Display of Quantitative Data
 Lesson 9 Presentation and Display of Quantitative Data Learning Objectives All students will identify and present data using appropriate graphs, charts and tables. All students should be able to justify
CHAPTER ONE CORRELATION
 CHAPTER ONE CORRELATION 1.0 Introduction The first chapter focuses on the nature of statistical data of correlation. The aim of the series of exercises is to ensure the students are able to use SPSS to
Supplementary Figure 1. Example of gating strategy
 Supplementary Figure 1. Example of gating strategy Legend Supplementary Figure 1: First, gating is performed to include only single cells (singlets) (A) and CD3+ cells (B). After gating on the lymphocyte
B220 CD4 CD8. Figure 1. Confocal Image of Sensitized HLN. Representative image of a sensitized HLN
 B220 CD4 CD8 Natarajan et al., unpublished data Figure 1. Confocal Image of Sensitized HLN. Representative image of a sensitized HLN showing B cell follicles and T cell areas. 20 µm thick. Image of magnification