Figure 1. Effects of FGF21 on adipose tissue. (A) Representative histological. findings of epididymal adipose tissue (B) mrna expression of
|
|
|
- Jasmin Wilkins
- 5 years ago
- Views:
Transcription
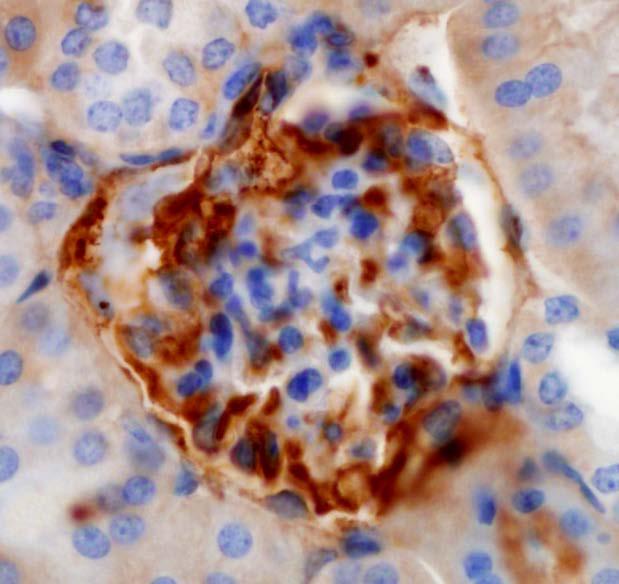
1 SUPPLEMENTAL MATERIAL EN Figure 1. Effects of FGF21 on adipose tissue. (A) Representative histological findings of epididymal adipose tissue (B) mrna expression of adipocytokines in adipose tissue. A, db/m control; B, db/db + vehicle; C, db/db + FGF21. A H&E stain of adipose tissue. Original magnification X400. PPARγ, peroxisome proliferator-activated receptor γ; Adipo, adiponectin; MCP-1, monocyte chemoattractant peptide-1; PAI-1, plasminogen activator inhibitor-1; TNFα, tumor necrosis factor α; Data are expressed as mean ± SEM. *p<0.05, **p<0.01 vs. db/m control; ##p<0.01 vs. db/db + vehicle. Figure 2. Representative renal histological findings in experimental animals. A, F, K, PAS stain; B, G, L, type IV collagen stain; C, H, M, TGFβ-1 stain; D, I, N, fibronectin stain; E, J, O, laminin stain; A-E, db/m control; F-J, db/db + vehicle; K-O, db/db + FGF21. Original magnification X400. PAS, periodic acid-schiff. Figure 3. Basal FGF21 expression in various renal cells. (A) mrna expression of FGF21 in renal cells under basal conditions (B) Representative western blot for FGF21 in renal cells under basal conditions. MMC, mouse 1
2 mesangial cell; HK2, human proximal tubule cells; Podocytes, mouse podocytes. Data are means ± SEM. **p<0.01 vs. MMC. Figure 4. Effects of high glucose (30mM) stimuli on FGF21 expression in cultured mesangial cells. (A) Effects of HG on FGF21 mrna expressions. (B) Representative western blot for FGF21. NG, normal glucose; HG, high glucose; Data are expressed as mean ± SEM. Figure 5. Basal FGF21 signaling as determined by the activation level of ERK1/2 from renal cortical tissues in experimental animals. Representative western blot for phophospecific-erk1/2 and total ERK1/2. Figure 6. Profibrotic molecule synthesis in response to high-glucose (30mM) stimulation with or without stealth small interfering (si) RNA of FGF21 in cultured mesangial cells. (A) mrna expression of profibrotic molecules under high-glucose (30mM) stimulation with or without gene silencing for FGF21 (B) Representative western blot for FGF21, TGFβ1, type IV collagen, PAI-1 with or without transfection with sirna against FGF21 under high-glucose stimulation. MMCs were treated with 30mM D-glucose medium for 72 h with or without transfection with sirna for FGF21. NG, normal glucose (5mM); HG, high-glucose (30mM); sicontrol; Stealth RNAi 2
3 negative control duplexes; Data are means ± SEM. *p<0.05 vs. NG; #p<0.05 vs. HG. Figure 7. Cholesterol, triglyceride content and lipid peroxidation in renal cortical tissue in control db/m mice based on age. (A) Cholesterol content in renal cortical tissue (B) Triglyceride content in renal cortical tissue (C) Lipid hydroperoxides (LPO) content in renal cortical tissue Data are means ± SEM. *p<0.05, **p<0.01 vs. db/m control at 8weeks of age. 3

4


5 A B C D E F G H I J K L M N O
6
7

8
9
10
11 Supplementary Table 1. Primer sequences for real-time quantitative PCR Target gene Primer sequence (5 to 3 ) Size (bp) MCP-1, forward CTGGATCGGAACCAAATGAG 95 MCP-1, reverse CGGGTCAACTTCACATTCAA PAI-1, forward TCCTCATCCTGCCTAAGTTCTC 365 PAI-1, reverse GTGCCGCTCTCGTTTACCTC TGFβ1, forward AGCCCGAAGCGGACTACTAT 96 TGFβ1, reverse CTGTGTGAGATGTCTTTGGTTTTC Col-IV, forward GCTCTGGCTGTGGAAAATGT 102 Col-IV, reverse CTTGCATCCCGGGAAATC Adiponectin, forward TGTTGGAATGACAGGAGCTGAA 121 Adiponectin, reverse CACACTGAAGCCTGAGCGATAC PPARγ, forward AGACCACTCGCATTCCTTTGACAT 271 PPARγ, reverse TCCCCACAGACTCGGCACTCAATG SREBP1, forward AAGATGTACCCGTCCGTGTC 80 SREBP1, reverse GGCTGTAGGATGGTGAGTGG HMG-CoA, forward AGCCGAAGCAGCACATGAT 201 HMG-CoA, reverse CTTGTGGAATGCCTTGTGATTG ABCA1, forward CGTTTCCGGGAAGTGTCCTA 246 ABCA1, reverse GCTAGAGATGACAAGGAGGATGGA FAS, forward CCTGGATAGCATTCCGAACCT 183 FAS, reverse Visfatin, forward Visfatin, reverse TNFα, forward TNFα, reverse FGF21, forward FGF21, reverse β-klotho, forward β-klotho, reverse FGFR1c, forward FGFR1c, reverse FGFR2c, forward FGFR2c, reverse FGFR3c, forward AGCCATCTCGAAGGCTACACA TGCCGTGAAAAGAAGACAGA ACTTCTTTGGCCTCCTGGAT CCGATGGGTTGTACCTTGTC GGCAGAGAGGAGGTTGACTTT GTCAAAGCCTCTAGGTTTCTTTGC GGCCTCAGGATCAAAGTGAG CAGGCCCATTGTTACCTTGT CTCCAAAGGTCTGGAAGCAG AATACCACCGACAAGGAAATGG AGTTACCCGCCAAGCACGTA GTTCTCTATATTCGGAATGTAACTTTTGAG AGG CGC TGG CAG AAC TGT ACG CCC TAC GTC ACT GTA CTC A FGFR3c, reverse GGT GAC ATT GTG CAA GGA CAG A FGFR4, forward GCTCGGAGGTAGAGGTCTTG 95 FGFR4, reverse GTAGGAAAGGCCGATGGAGT β-actin, forward β-actin, reverse GGACTCCTATGTGGGTGACG CTTCTCCATGTCGTCCCAGT 118 MCP-1, monocyte chemoattractant peptide-1; PAI-1, plasminogen activator inhibitor-1; TGFβ, transforming growth factor; Col-IV, type IV collagen; PPARγ, peroxisome proliferator-activated receptor γ; SREBP1, sterol regulatory element-binding protein-1; HMG-CoA, cholesterol 3-hydroxy-3-methylglutaryl (HMG)-CoA reductase; ABCA1, ATPbinding cassette transporter-1; FAS, fatty acid synthase; TNFα, tumor necrosis factor α; FGF21, fibroblast growth factor 21; FGFR, FGF receptor; In this experiment, each sample was run in triplicate, and the corresponding non-reverse transcribed mrna samples were used as negative controls. The mrna level of each sample was normalized to that of β-actin mrna.
Fibroblast Growth Factor 21 Improves Insulin Resistance and Ameliorates Renal Injury in db/db Mice
 Fibroblast Growth Factor 21 Improves Insulin Resistance and Ameliorates Renal Injury in db/db Mice Hyunwook Kim Department of Medicine The Graduate School, Yonsei University Fibroblast Growth Factor 21
Supplementary Materials
 Supplementary Materials 1 Supplementary Table 1. List of primers used for quantitative PCR analysis. Gene name Gene symbol Accession IDs Sequence range Product Primer sequences size (bp) β-actin Actb gi
Supplementary Figure 1 a
 Supplementary Figure a Normalized expression/tbp (A.U.).6... Trip-br transcripts Trans Trans Trans b..5. Trip-br Ctrl LPS Normalized expression/tbp (A.U.) c Trip-br transcripts. adipocytes.... Trans Trans
c Tuj1(-) apoptotic live 1 DIV 2 DIV 1 DIV 2 DIV Tuj1(+) Tuj1/GFP/DAPI Tuj1 DAPI GFP
 apoptotic live 1 DIV 2 DIV 1 DIV 2 DIV Tuj1(+) Tuj1/GFP/DAPI Tuj1 DAPI GFP") Supplementary Figure 1 Establishment of the gain- and loss-of-function experiments and cell survival assays. a Relative expression of mature mir-484 30 20 10 0 **** **** NCP mir- 484P NCP mir- 484P b Relative
Supplementary Figure 1 Establishment of the gain- and loss-of-function experiments and cell survival assays. a Relative expression of mature mir-484 30 20 10 0 **** **** NCP mir- 484P NCP mir- 484P b Relative
Supplementary Table 3. 3 UTR primer sequences. Primer sequences used to amplify and clone the 3 UTR of each indicated gene are listed.
 Supplemental Figure 1. DLKI-DIO3 mirna/mrna complementarity. Complementarity between the indicated DLK1-DIO3 cluster mirnas and the UTR of SOX2, SOX9, HIF1A, ZEB1, ZEB2, STAT3 and CDH1with mirsvr and PhastCons
2.5. AMPK activity
 Supplement Fig. A 3 B phos-ampk 2.5 * Control AICAR AMPK AMPK activity (Absorbance at 45 nm) 2.5.5 Control AICAR Supplement Fig. Effects of AICAR on AMPK activation in macrophages. J774. macrophages were
CD31 5'-AGA GAC GGT CTT GTC GCA GT-3' 5 ' -TAC TGG GCT TCG AGA GCA GT-3'
 Table S1. The primer sets used for real-time RT-PCR analysis. Gene Forward Reverse VEGF PDGFB TGF-β MCP-1 5'-GTT GCA GCA TGA ATC TGA GG-3' 5'-GGA GAC TCT TCG AGG AGC ACT T-3' 5'-GAA TCA GGC ATC GAG AGA
Abbreviations: P- paraffin-embedded section; C, cryosection; Bio-SA, biotin-streptavidin-conjugated fluorescein amplification.
 Supplementary Table 1. Sequence of primers for real time PCR. Gene Forward primer Reverse primer S25 5 -GTG GTC CAC ACT ACT CTC TGA GTT TC-3 5 - GAC TTT CCG GCA TCC TTC TTC-3 Mafa cds 5 -CTT CAG CAA GGA
SUPPLEMENTARY DATA. Supplementary Table 1. Primer sequences for qrt-pcr
 Supplementary Table 1. Primer sequences for qrt-pcr Gene PRDM16 UCP1 PGC1α Dio2 Elovl3 Cidea Cox8b PPARγ AP2 mttfam CyCs Nampt NRF1 16s-rRNA Hexokinase 2, intron 9 β-actin Primer Sequences 5'-CCA CCA GCG
Supplementary Table 2. Conserved regulatory elements in the promoters of CD36.
 Supplementary Table 1. RT-qPCR primers for CD3, PPARg and CEBP. Assay Forward Primer Reverse Primer 1A CAT TTG TGG CCT TGT GCT CTT TGA TGA GTC ACA GAA AGA ATC AAT TC 1B AGG AAA TGA ACT GAT GAG TCA CAG
Supplementary Figures
 Supplementary Figures Supplementary Figure 1. H3F3B expression in lung cancer. a. Comparison of H3F3B expression in relapsed and non-relapsed lung cancer patients. b. Prognosis of two groups of lung cancer
a) Primary cultures derived from the pancreas of an 11-week-old Pdx1-Cre; K-MADM-p53
 Primary cultures derived from the pancreas of an 11-week-old Pdx1-Cre; K-MADM-p53") 1 2 3 4 5 6 7 8 9 10 Supplementary Figure 1. Induction of p53 LOH by MADM. a) Primary cultures derived from the pancreas of an 11-week-old Pdx1-Cre; K-MADM-p53 mouse revealed increased p53 KO/KO (green,
1 2 3 4 5 6 7 8 9 10 Supplementary Figure 1. Induction of p53 LOH by MADM. a) Primary cultures derived from the pancreas of an 11-week-old Pdx1-Cre; K-MADM-p53 mouse revealed increased p53 KO/KO (green,
Supplementary Appendix
 Supplementary Appendix This appendix has been provided by the authors to give readers additional information about their work. Supplement to: Sherman SI, Wirth LJ, Droz J-P, et al. Motesanib diphosphate
Supplementary Figure 1 MicroRNA expression in human synovial fibroblasts from different locations. MicroRNA, which were identified by RNAseq as most
 Supplementary Figure 1 MicroRNA expression in human synovial fibroblasts from different locations. MicroRNA, which were identified by RNAseq as most differentially expressed between human synovial fibroblasts
Supplementary Information. Bamboo shoot fiber prevents obesity in mice by. modulating the gut microbiota
 Supplementary Information Bamboo shoot fiber prevents obesity in mice by modulating the gut microbiota Xiufen Li 1,2, Juan Guo 1, Kailong Ji 1,2, and Ping Zhang 1,* 1 Key Laboratory of Tropical Plant Resources
Supplemental Data. Shin et al. Plant Cell. (2012) /tpc YFP N
 /tpc YFP N") MYC YFP N PIF5 YFP C N-TIC TIC Supplemental Data. Shin et al. Plant Cell. ()..5/tpc..95 Supplemental Figure. TIC interacts with MYC in the nucleus. Bimolecular fluorescence complementation assay using
MYC YFP N PIF5 YFP C N-TIC TIC Supplemental Data. Shin et al. Plant Cell. ()..5/tpc..95 Supplemental Figure. TIC interacts with MYC in the nucleus. Bimolecular fluorescence complementation assay using
Fig. S1. Dose-response effects of acute administration of the β3 adrenoceptor agonists CL316243, BRL37344, ICI215,001, ZD7114, ZD2079 and CGP12177 at
 Fig. S1. Dose-response effects of acute administration of the β3 adrenoceptor agonists CL316243, BRL37344, ICI215,001, ZD7114, ZD2079 and CGP12177 at doses of 0.1, 0.5 and 1 mg/kg on cumulative food intake
Supplementary Fig. 1 eif6 +/- mice show a reduction in white adipose tissue, blood lipids and normal glycogen synthesis. The cohort of the original
 Supplementary Fig. 1 eif6 +/- mice show a reduction in white adipose tissue, blood lipids and normal glycogen synthesis. The cohort of the original phenotypic screening was n=40. For specific tests, the
Figure S1. Analysis of genomic and cdna sequences of the targeted regions in WT-KI and
 Figure S1. Analysis of genomic and sequences of the targeted regions in and indicated mutant KI cells, with WT and corresponding mutant sequences underlined. (A) cells; (B) K21E-KI cells; (C) D33A-KI cells;
Quantitative Real-Time PCR was performed as same as Materials and Methods.
 Supplemental Material Quantitative Real-Time PCR Quantitative Real-Time PCR was performed as same as Materials and Methods. Expression levels in the aorta were normalized to peptidylprolyl isomerase B
Nature Structural & Molecular Biology: doi: /nsmb Supplementary Figure 1
 Supplementary Figure 1 U1 inhibition causes a shift of RNA-seq reads from exons to introns. (a) Evidence for the high purity of 4-shU-labeled RNAs used for RNA-seq. HeLa cells transfected with control
Males- Western Diet WT KO Age (wks) Females- Western Diet WT KO Age (wks)
 Females- Western Diet WT KO Age (wks)") Relative Arv1 mrna Adrenal 33.48 +/- 6.2 Skeletal Muscle 22.4 +/- 4.93 Liver 6.41 +/- 1.48 Heart 5.1 +/- 2.3 Brain 4.98 +/- 2.11 Ovary 4.68 +/- 2.21 Kidney 3.98 +/-.39 Lung 2.15 +/-.6 Inguinal Subcutaneous
Relative Arv1 mrna Adrenal 33.48 +/- 6.2 Skeletal Muscle 22.4 +/- 4.93 Liver 6.41 +/- 1.48 Heart 5.1 +/- 2.3 Brain 4.98 +/- 2.11 Ovary 4.68 +/- 2.21 Kidney 3.98 +/-.39 Lung 2.15 +/-.6 Inguinal Subcutaneous
Supplementary Figure 1
 Supplementary Figure 1 3 3 3 1 1 Bregma -1.6mm 3 : Bregma Ref) Http://www.mbl.org/atlas165/atlas165_start.html Bregma -.18mm Supplementary Figure 1 Schematic representation of the utilized brain slice
Supplementary Figure 1. ROS induces rapid Sod1 nuclear localization in a dosagedependent manner. WT yeast cells (SZy1051) were treated with 4NQO at
 were treated with 4NQO at") Supplementary Figure 1. ROS induces rapid Sod1 nuclear localization in a dosagedependent manner. WT yeast cells (SZy1051) were treated with 4NQO at different concentrations for 30 min and analyzed for
Supplementary Figure 1. ROS induces rapid Sod1 nuclear localization in a dosagedependent manner. WT yeast cells (SZy1051) were treated with 4NQO at different concentrations for 30 min and analyzed for
Supplementary Document
 Supplementary Document 1. Supplementary Table legends 2. Supplementary Figure legends 3. Supplementary Tables 4. Supplementary Figures 5. Supplementary References 1. Supplementary Table legends Suppl.
Supplementary Figure 1.
 Supplementary Figure 1. FGF21 does not exert direct effects on hepatic glucose production. The liver explants from C57BL/6J mice (A, B) or primary rat hepatocytes (C, D) were incubated with rmfgf21 (2
Hmgcoar AGCTTGCCCGAATTGTATGTG TCTGTTGTAACCATGTGACTTC. Cyp7α GGGATTGCTGTGGTAGTGAGC GGTATGGAATCAACCCGTTGTC
 Supplement Table I: primers for Real Time RT-PCR Gene Foward Reverse Hmgcoar AGCTTGCCCGAATTGTATGTG TCTGTTGTAACCATGTGACTTC Cyp7α GGGATTGCTGTGGTAGTGAGC GGTATGGAATCAACCCGTTGTC Cyp27a1 GTGGTCTTATTGGGTACTTGC
Supplemental Table 1 Primer sequences (mouse) used for real-time qrt-pcr studies
 used for real-time qrt-pcr studies") Supplemental Table 1 Primer sequences (mouse) used for real-time qrt-pcr studies Gene symbol Forward primer Reverse primer ACC1 5'-TGAGGAGGACCGCATTTATC 5'-GCATGGAATGGCAGTAAGGT ACLY 5'-GACACCATCTGTGATCTTG
Supplemental Table 1 Primer sequences (mouse) used for real-time qrt-pcr studies Gene symbol Forward primer Reverse primer ACC1 5'-TGAGGAGGACCGCATTTATC 5'-GCATGGAATGGCAGTAAGGT ACLY 5'-GACACCATCTGTGATCTTG
Phylogenetic analysis of human and chicken importins. Only five of six importins were studied because
 Supplementary Figure S1 Phylogenetic analysis of human and chicken importins. Only five of six importins were studied because importin-α6 was shown to be testis-specific. Human and chicken importin protein
Supporting Information Table of content
 Supporting Information Table of content Supporting Information Fig. S1 Supporting Information Fig. S2 Supporting Information Fig. S3 Supporting Information Fig. S4 Supporting Information Fig. S5 Supporting
Supplementary fig. 1. Crystals induce necroptosis does not involve caspases, TNF receptor or NLRP3. A. Mouse tubular epithelial cells were pretreated
 Supplementary fig. 1. Crystals induce necroptosis does not involve caspases, TNF receptor or NLRP3. A. Mouse tubular epithelial cells were pretreated with zvad-fmk (10µM) and exposed to calcium oxalate
Description of Supplementary Files. File Name: Supplementary Information Description: Supplementary Figures and Supplementary Tables
 Description of Supplementary Files File Name: Supplementary Information Description: Supplementary Figures and Supplementary Tables Supplementary Figure 1: (A), HCT116 IDH1-WT and IDH1-R132H cells were
Supporting Information. Supporting Tables. S-Table 1 Primer pairs for RT-PCR. Product size. Gene Primer pairs
 Supporting Information Supporting Tables S-Table 1 Primer pairs for RT-PCR. Gene Primer pairs Product size (bp) FAS F: 5 TCTTGGAAGCGATGGGTA 3 429 R: 5 GGGATGTATCATTCTTGGAC 3 SREBP-1c F: 5 CGCTACCGTTCCTCTATCA
Formylpeptide receptor2 contributes to colon epithelial homeostasis, inflammation, and tumorigenesis
 Supplementary Data Formylpeptide receptor2 contributes to colon epithelial homeostasis, inflammation, and tumorigenesis Keqiang Chen, Mingyong Liu, Ying Liu, Teizo Yoshimura, Wei Shen, Yingying Le, Scott
Supplementary Table 2. Plasma lipid profiles in wild type and mutant female mice submitted to a HFD for 12 weeks wt ERα -/- AF-1 0 AF-2 0
 Supplementary Table 1. List of specific primers used for gene expression analysis. Genes Primer forward Primer reverse Hprt GCAGTACAGCCCCAAAATGG AACAAAGTCTGGCCTGTATCCA Srebp-1c GGAAGCTGTCGGGGTAGCGTC CATGTCTTCAAATGTGCAATCCAT
Advanced Subsidiary Unit 1: Lifestyle, Transport, Genes and Health
 Write your name here Surname Other names Edexcel GCE Centre Number Candidate Number Biology Advanced Subsidiary Unit 1: Lifestyle, Transport, Genes and Health Thursday 8 January 2009 Morning Time: 1 hour
Cross-talk between mineralocorticoid and angiotensin II signaling for cardiac
 ONLINE SUPPLEMENT TO Crosstalk between mineralocorticoid and angiotensin II signaling for cardiac remodeling An Di ZHANG,,3, Aurelie NGUYEN DINH CAT*,,3, Christelle SOUKASEUM *,,3, Brigitte ESCOUBET, 4,
Citation for published version (APA): Oosterveer, M. H. (2009). Control of metabolic flux by nutrient sensors Groningen: s.n.
: Oosterveer, M. H. (2009). Control of metabolic flux by nutrient sensors Groningen: s.n.") University of Groningen Control of metabolic flux by nutrient sensors Oosterveer, Maaike IMPORTANT NOTE: You are advised to consult the publisher's version (publisher's PDF) if you wish to cite from it.
University of Groningen Control of metabolic flux by nutrient sensors Oosterveer, Maaike IMPORTANT NOTE: You are advised to consult the publisher's version (publisher's PDF) if you wish to cite from it.
Supplementary Figure S1
 Lipidomic-based investigation into the regulatory effect of Schisandrin B on palmitic acid level in non-alcoholic steatotic livers Hiu Yee Kwan 1,2, Xuyan Niu 3, Wenlin Dai 4, Tiejun Tong 4, Xiaojuan Chao
Supplemental Figure 1. Western blot analysis indicated that MIF was detected in the fractions of
 Supplemental Figure Legends Supplemental Figure 1. Western blot analysis indicated that was detected in the fractions of plasma membrane and cytosol but not in nuclear fraction isolated from Pkd1 null
SUPPLEMENTARY DATA. Supplementary Table 1. Primers used in qpcr
 Supplementary Table 1. Primers used in qpcr Gene forward primer (5'-3') reverse primer (5'-3') β-actin AGAGGGAAATCGTGCGTGAC CAATAGTGATGACCTGGCCGT Hif-p4h-2 CTGGGCAACTACAGGATAAAC GCGTCCCAGTCTTTATTTAGATA
Beta Thalassemia Case Study Introduction to Bioinformatics
 Beta Thalassemia Case Study Sami Khuri Department of Computer Science San José State University San José, California, USA sami.khuri@sjsu.edu www.cs.sjsu.edu/faculty/khuri Outline v Hemoglobin v Alpha
Nature Immunology: doi: /ni.3836
 Supplementary Figure 1 Recombinant LIGHT-VTP induces pericyte contractility and endothelial cell activation. (a) Western blot showing purification steps for full length murine LIGHT-VTP (CGKRK) protein:
ZL ZDF ZDF + E2 *** Visceral (g) ZDF
 ZDF") Body Weight (g) 4 3 2 1 ** * ZL ZDF 6 8 1 12 14 16 Age (weeks) B * Sub-cutaneous (g) 16 12 8 4 ZL ZDF Visceral (g) 25 2 15 1 5 ZL ZDF Total fat pad weight (g) 4 3 2 1 ZDF ZL Supplemental Figure 1: Effect
Body Weight (g) 4 3 2 1 ** * ZL ZDF 6 8 1 12 14 16 Age (weeks) B * Sub-cutaneous (g) 16 12 8 4 ZL ZDF Visceral (g) 25 2 15 1 5 ZL ZDF Total fat pad weight (g) 4 3 2 1 ZDF ZL Supplemental Figure 1: Effect
Supplementary Information. MicroRNA-33b knock-in mice for an intron of sterol regulatory
 Supplementary Information MicroRNA-33b knock-in mice for an intron of sterol regulatory element-binding factor 1 (Srebf1) exhibit reduced HDL-C in vivo Takahiro Horie, Tomohiro Nishino, Osamu Baba, Yasuhide
BIOLOGY 621 Identification of the Snorks
 Name: Date: Block: BIOLOGY 621 Identification of the Snorks INTRODUCTION: In this simulation activity, you will examine the DNA sequence of a fictitious organism - the Snork. Snorks were discovered on
Supplementary Figure 1. DJ-1 modulates ROS concentration in mouse skeletal muscle.
 Supplementary Figure 1. DJ-1 modulates ROS concentration in mouse skeletal muscle. (a) mrna levels of Dj1 measured by quantitative RT-PCR in soleus, gastrocnemius (Gastroc.) and extensor digitorum longus
Supplementary Figure 1
 Metastatic melanoma Primary melanoma Healthy human skin Supplementary Figure 1 CD22 IgG4 Supplementary Figure 1: Immunohisochemical analysis of CD22+ (left) and IgG4 (right), cells (shown in red and indicated
Supplementary Figure 1. Expression of CUGBP1 in non-parenchymal liver cells treated with TGF-β
 Supplementary Figures Supplementary Figure 1. Expression of CUGBP1 in non-parenchymal liver cells treated with TGF-β and LPS. Non-parenchymal liver cells were isolated and treated with or without TGF-β
SUPPLEMENTARY INFORMATION
 SUPPLEMENTARY INFORMATION FOR Liver X Receptor α mediates hepatic triglyceride accumulation through upregulation of G0/G1 Switch Gene 2 (G0S2) expression I: SUPPLEMENTARY METHODS II: SUPPLEMENTARY FIGURES
Supplementary Figure 1 IMQ-Induced Mouse Model of Psoriasis. IMQ cream was
 Supplementary Figure 1 IMQ-Induced Mouse Model of Psoriasis. IMQ cream was painted on the shaved back skin of CBL/J and BALB/c mice for consecutive days. (a, b) Phenotypic presentation of mouse back skin
SUPPLEMENTARY INFORMATION
 doi: 10.1038/nature05883 SUPPLEMENTARY INFORMATION Supplemental Figure 1 Prostaglandin agonists and antagonists alter runx1/cmyb expression. a-e, Embryos were exposed to (b) PGE2 and (c) PGI2 (20μM) and
Supplementary Figure 1a
 Supplementary Figure 1a Hours: E-cadherin TGF-β On TGF-β Off 0 12 24 36 48 24 48 72 Vimentin βactin Fig. S1a. Treatment of AML12 cells with TGF-β induces EMT. Treatment of AML12 cells with TGF-β results
Supplementary Figure 1. DNA methylation of the adiponectin promoter R1, Pparg2, and Tnfa promoter in adipocytes is not affected by obesity.
 Supplementary Figure 1. DNA methylation of the adiponectin promoter R1, Pparg2, and Tnfa promoter in adipocytes is not affected by obesity. (a) Relative amounts of adiponectin, Ppar 2, C/ebp, and Tnf mrna
Toluidin-Staining of mast cells Ear tissue was fixed with Carnoy (60% ethanol, 30% chloroform, 10% acetic acid) overnight at 4 C, afterwards
 overnight at 4 C, afterwards") Toluidin-Staining of mast cells Ear tissue was fixed with Carnoy (60% ethanol, 30% chloroform, 10% acetic acid) overnight at 4 C, afterwards incubated in 100 % ethanol overnight at 4 C and embedded in
Toluidin-Staining of mast cells Ear tissue was fixed with Carnoy (60% ethanol, 30% chloroform, 10% acetic acid) overnight at 4 C, afterwards incubated in 100 % ethanol overnight at 4 C and embedded in
a. b. c. d. e. f. g. h. i. j. k. l. m. n. o. p.
 a. b. c. d. e. f. g. h. i. j. k. l. 2.5 2 1.5 1.5 IL-1β 12 8 6 4 2 IL-1β 9 8 7 6 4 3 3 2.9 IL-1β m. n. o. p. 1.8 1.6 1.4 1.2 1.8.6.4.2 6h LPS 2 15 1 5 6h LPS 2 6h LPS 6 4 3 6h LPS Supplementary Figure
Astaxanthin prevents and reverses diet-induced insulin resistance and. steatohepatitis in mice: A comparison with vitamin E
 Supplementary Information Astaxanthin prevents and reverses diet-induced insulin resistance and steatohepatitis in mice: A comparison with vitamin E Yinhua Ni, 1,2 Mayumi Nagashimada, 1 Fen Zhuge, 1 Lili
Supplementary Figure 1
 Supplementary Figure 1 A B mir-141, human cell lines mir-2c, human cell lines mir-141, hepatocytes mir-2c, hepatocytes Relative RNA.1.8.6.4.2 Relative RNA.3.2.1 Relative RNA 1.5 1..5 Relative RNA 2. 1.5
Plasmids Western blot analysis and immunostaining Flow Cytometry Cell surface biotinylation RNA isolation and cdna synthesis
 Plasmids psuper-retro-s100a10 shrna1 was constructed by cloning the dsdna oligo 5 -GAT CCC CGT GGG CTT CCA GAG CTT CTT TCA AGA GAA GAA GCT CTG GAA GCC CAC TTT TTA-3 and 5 -AGC TTA AAA AGT GGG CTT CCA GAG
SUPPLEMENTARY FIGURES
 SUPPLEMENTARY FIGURES Supplementary Figure S1: Fibroblast-induced elongation of cancer cells requires direct contact with living fibroblasts. A. Representative images of HT29-GFP cultured in the presence
Supplementary Information
 Supplementary Information Remodeling of heterochromatin structure slows neuropathological progression and prolongs survival in an animal model of Huntington s disease Junghee Lee, Yu Jin Hwang, Yunha Kim,
Figure S1. Reduction in glomerular mir-146a levels correlate with progression to higher albuminuria in diabetic patients.
 Supplementary Materials Supplementary Figures Figure S1. Reduction in glomerular mir-146a levels correlate with progression to higher albuminuria in diabetic patients. Figure S2. Expression level of podocyte
Supplementary Figure S1
 Supplementry Figure S Tissue weights (g).... Liver Hert Brin Pncres Len mss (g) 8 6 -% +% 8 6 Len mss Len mss (g) (% ody weight) Len mss (% ody weight) c Tiilis nterior weight (g).6...... Qudriceps weight
Supplementary Figure S I: Effects of D4F on body weight and serum lipids in apoe -/- mice.
 Supplementary Figures: Supplementary Figure S I: Effects of D4F on body weight and serum lipids in apoe -/- mice. Male apoe -/- mice were fed a high-fat diet for 8 weeks, and given PBS (model group) or
Table S1. Oligonucleotides used for the in-house RT-PCR assays targeting the M, H7 or N9. Assay (s) Target Name Sequence (5 3 ) Comments
 Target Name Sequence (5 3 ) Comments") SUPPLEMENTAL INFORMATION 2 3 Table S. Oligonucleotides used for the in-house RT-PCR assays targeting the M, H7 or N9 genes. Assay (s) Target Name Sequence (5 3 ) Comments CDC M InfA Forward (NS), CDC M
SUPPLEMENTAL INFORMATION 2 3 Table S. Oligonucleotides used for the in-house RT-PCR assays targeting the M, H7 or N9 genes. Assay (s) Target Name Sequence (5 3 ) Comments CDC M InfA Forward (NS), CDC M
Supplementary Figure 1. PAQR3 knockdown inhibits SREBP-2 processing in CHO-7 cells CHO-7 cells were transfected with control sirna or a sirna
 Supplementary Figure 1. PAQR3 knockdown inhibits SREBP-2 processing in CHO-7 cells CHO-7 cells were transfected with control sirna or a sirna targeted for hamster PAQR3. At 24 h after the transfection,
control kda ATGL ATGLi HSL 82 GAPDH * ** *** WT/cTg WT/cTg ATGLi AKO/cTg AKO/cTg ATGLi WT/cTg WT/cTg ATGLi AKO/cTg AKO/cTg ATGLi iwat gwat ibat
 body weight (g) tissue weights (mg) ATGL protein expression (relative to GAPDH) HSL protein expression (relative to GAPDH) ### # # kda ATGL 55 HSL 82 GAPDH 37 2.5 2. 1.5 1..5 2. 1.5 1..5.. Supplementary
ice-cold 70% ethanol with gentle vortexing, incubated at -20 C for 4 hours, and washed with PBS.
 Cell cycle analysis For cell cycle analysis, single cell suspensions of E12.5 fetal liver cells were suspended in 4 ml ice-cold 7% ethanol with gentle vortexing, incubated at -2 C for 4 hours, and washed
General Laboratory methods Plasma analysis: Gene Expression Analysis: Immunoblot analysis: Immunohistochemistry:
 General Laboratory methods Plasma analysis: Plasma insulin (Mercodia, Sweden), leptin (duoset, R&D Systems Europe, Abingdon, United Kingdom), IL-6, TNFα and adiponectin levels (Quantikine kits, R&D Systems
BHP 2-7 and Nthy-ori 3-1 cells were grown in RPMI1640 medium (Hyclone) supplemented with 10% fetal bovine serum (Gibco), 2mM L-glutamine, and 100 U/mL
 supplemented with 10% fetal bovine serum (Gibco), 2mM L-glutamine, and 100 U/mL") 1 2 3 4 Materials and Methods Cell culture BHP 2-7 and Nthy-ori 3-1 cells were grown in RPMI1640 medium (Hyclone) 5 supplemented with 10% fetal bovine serum (Gibco), 2mM L-glutamine, and 100 U/mL 6 penicillin-streptomycin.
1 2 3 4 Materials and Methods Cell culture BHP 2-7 and Nthy-ori 3-1 cells were grown in RPMI1640 medium (Hyclone) 5 supplemented with 10% fetal bovine serum (Gibco), 2mM L-glutamine, and 100 U/mL 6 penicillin-streptomycin.
Insulin-induced gene 1 (insig-1) mrna increases dramatically in
 mrna increases dramatically in") Insig-1 brakes lipogenesis in adipocytes and inhibits differentiation of preadipocytes Jinping Li*, Kiyosumi Takaishi*, William Cook*, Sara Kay McCorkle*, and Roger H. Unger* *Touchstone Center for Diabetes
Insig-1 brakes lipogenesis in adipocytes and inhibits differentiation of preadipocytes Jinping Li*, Kiyosumi Takaishi*, William Cook*, Sara Kay McCorkle*, and Roger H. Unger* *Touchstone Center for Diabetes
 www.lessonplansinc.com Topic: Protein Synthesis - Sentence Activity Summary: Students will simulate transcription and translation by building a sentence/polypeptide from words/amino acids. Goals & Objectives:
PATIENTS AND METHODS. Subjects
 PATIENTS AND METHODS Subjects Twenty-nine morbidly obese subjects involved in a gastric surgery program were enrolled in the study between October 25 and March 21. Bariatric surgery was performed in patients
Viral hepatitis, which affects half a billion people
 GASTROENTEROLOGY 2006;130:435 452 BASIC LIVER, PANCREAS, AND BILIARY TRACT Natural Killer Cells Ameliorate Liver Fibrosis by Killing Activated Stellate Cells in NKG2D-Dependent and Tumor Necrosis Factor
GPR120 *** * * Liver BAT iwat ewat mwat Ileum Colon. UCP1 mrna ***
 a GPR120 GPR120 mrna/ppia mrna Arbitrary Units 150 100 50 Liver BAT iwat ewat mwat Ileum Colon b UCP1 mrna Fold induction 20 15 10 5 - camp camp SB202190 - - - H89 - - - - - GW7647 Supplementary Figure
Diosgenin, antagonism of LXRs 36 DNA microarray, sesame seed lignan regulation of liver fatty acid metabolism gene expression 12 18, 22, 23
 Subject Index ACC, see Acyl-CoA carboxylase 1 -Acetoxychavicol acetate, inducible nitric oxide synthase suppression in cancer chemoprevention 199, 200 Acetylene carotenoids, anti-inflammatory activity
Supplementary Materials for
 advances.sciencemag.org/cgi/content/full/1/9/e1500781/dc1 Supplementary Materials for pnaktide inhibits Na/K-ATPase reactive oxygen species amplification and attenuates adipogenesis Komal Sodhi, Kyle Maxwell,
Supplementary Figure S1. Effect of Glucose on Energy Balance in WT and KHK A/C KO
 Supplementary Figure S1. Effect of Glucose on Energy Balance in WT and KHK A/C KO Mice. WT mice and KHK-A/C KO mice were provided drinking water containing 10% glucose or tap water with normal chow ad
Supplementary Information
 Supplementary Information TABLE S1. SUBJECT CHARACTERISTICS* Normal Control Subjects Subjects with Asthma p Value Number 23 48 Age (years) 35±10 35±10 0.75 Sex, M:F (% F) 9:12 (57) 17:26 (60) 0.76 FEV1
Supplemental Methods Supplemental Table 1. Supplemental Figure 1. Supplemental Figure 2. Supplemental Figure 3. Supplemental Figure 4.
 Supplemental Methods TGF-B1 ELISA Supernatants were collected from AT2 cells cultured for 1, 2, 3, or 4 days and frozen at -80 degrees C until use in the ELISA. A commercially available mouse TGF-B1 Duo
SUPPLEMENTAL METHODS Cell culture RNA extraction and analysis Immunohistochemical analysis and laser capture microdissection (LCM)
") SUPPLEMENTAL METHODS Cell culture Human peripheral blood mononuclear cells were isolated from healthy donors by Ficoll density gradient centrifugation. Monocyte differentiation to resting macrophages ()
SUPPLEMENTAL METHODS Cell culture Human peripheral blood mononuclear cells were isolated from healthy donors by Ficoll density gradient centrifugation. Monocyte differentiation to resting macrophages ()
Visfatin is upregulated in type-2 diabetic rats and targets renal cells
 original article http://www.kidney-international.org & 1 International Society of Nephrology is upregulated in type- diabetic rats and targets renal cells Young Sun Kang 1, Hye Kyoung Song 1, Mi Hwa Lee
SUPPORTING INFORMATION
 SUPPORTING INFORMATION Biology is different in small volumes: endogenous signals shape phenotype of primary hepatocytes cultured in microfluidic channels Amranul Haque, Pantea Gheibi, Yandong Gao, Elena
SUPPLEMENTARY RESULTS
 SUPPLEMENTARY RESULTS Supplementary Table 1. hfpr1- Flpln-CHO hfpr2-flpln-cho pec 50 E max (%) Log( /K A) Log( /K A) N pec 50 E max (%) Log( /K A) Log( /K A) n ERK1/2 phosphorylation fmlp 9.0±0.6 80±7
Supplementary Figure 1
 Supplementary Figure 1 Supplementary Figure 1. Lats1/2 deleted ihbs and ihps showed decreased transcripts of hepatocyte related genes (a and b) Western blots (a) and recombination PCR (b) of control and
Supplemental Information. Th17 Lymphocytes Induce Neuronal. Cell Death in a Human ipsc-based. Model of Parkinson's Disease
 Cell Stem Cell, Volume 23 Supplemental Information Th17 Lymphocytes Induce Neuronal Cell Death in a Human ipsc-based Model of Parkinson's Disease Annika Sommer, Franz Maxreiter, Florian Krach, Tanja Fadler,
Supplementary Table 1. Primer Sequences Used for Quantitative Real-Time PCR
 Supplementary Table 1. Primer Sequences Used for Quantitative Real-Time PCR Gene Forward Primer (5-3 ) Reverse Primer (5-3 ) cadl CTTGGGGGCGCGTCT CTGTTCTTTTGTGCCGTTTCG cyl-coenzyme Dehydrogenase, very
Single-Molecule Analysis of Gene Expression Using Two-Color RNA- Labeling in Live Yeast
 Supplemental Figures, Tables and Results Single-Molecule Analysis of Gene Expression Using Two-Color RNA- Labeling in Live Yeast Sami Hocine 1, Pascal Raymond 2, Daniel Zenklusen 2, Jeffrey A. Chao 1 &
Journal of Cell Science Supplementary information. Arl8b +/- Arl8b -/- Inset B. electron density. genotype
 J. Cell Sci. : doi:.4/jcs.59: Supplementary information E9. A Arl8b /- Arl8b -/- Arl8b Arl8b non-specific band Gapdh Tbp E7.5 HE Inset B D Control al am hf C E Arl8b -/- al am hf E8.5 F low middle high
McAlpine PERK-GSK3 regulates foam cell formation. Supplemental Material. Supplementary Table I. Sequences of real time PCR primers.
 Mclpine PERK-GSK3 regulates foam cell formation Supplemental Material Supplementary Table I. Sequences of real time PCR primers. Primer Name Primer Sequences (5-3 ) Product Size (bp) GRP78 (human) Fwd:
UNIVERSITY OF CAMBRIDGE INTERNATIONAL EXAMINATIONS General Certificate of Education Advanced Subsidiary Level and Advanced Level
 UNIVERSITY OF CAMBRIDGE INTERNATIONAL EXAMINATIONS General Certificate of Education Advanced Subsidiary Level and Advanced Level *9622949895* BIOLOGY 9700/21 Paper 2 Structured Questions AS October/November
Cornstarch
 Electronic Supplementary Material (ESI) for Food & Function. This journal is The Royal Society of Chemistry 2018 Supplementary data : Supplementary Table 1: Diet composition (g/kg) on the basis of the
Nature Medicine doi: /nm.3150
 Nature Medicine doi:10.1038/nm.3150 Supplementary Table 1 Primer sequences used for q-pcr analysis Gene Forward primer Reverse primer Abca1 CAGCTTCCATCCTCCTTGTC CCACATCCACAACTGTCTGG Abcg1 GTACCATGACATCGCTGGTG
On the relevance of carnosine and carnosinase for the development of diabetic nephropathy Riedl, Eva Maria Susanne
 University of Groningen On the relevance of carnosine and carnosinase for the development of diabetic nephropathy Riedl, Eva Maria Susanne IMPORTANT NOTE: You are advised to consult the publisher's version
Table S1. Primer sequences used for qrt-pcr. CACCATTGGCAATGAGCGGTTC AGGTCTTTGCGGATGTCCACGT ACTB AAGTCCATGTGCTGGCAGCACT ATCACCACTCCGAAGTCCGTCT LCOR
 Table S1. Primer sequences used for qrt-pcr. ACTB LCOR KLF6 CTBP1 CDKN1A CDH1 ATF3 PLAU MMP9 TFPI2 CACCATTGGCAATGAGCGGTTC AGGTCTTTGCGGATGTCCACGT AAGTCCATGTGCTGGCAGCACT ATCACCACTCCGAAGTCCGTCT CGGCTGCAGGAAAGTTTACA
Serum cytokine levels in control and tumor-bearing male and female mice at day 15.
 Supplementary Table 1. Serum cytokine levels in control and tumor-bearing male and female mice at day 15. Male Female Cytokine Control C-26 Control C-26 IL-1β 2.0 ± 0.8 9.6 ± 1.5* 1.8 ± 0.2 6.8 ± 1.4*
SUPPLEMENTARY INFORMATION
 doi: 1.138/nature7221 Brown fat selective genes 12 1 Control Q-RT-PCR (% of Control) 8 6 4 2 Ntrk3 Cox7a1 Cox8b Cox5b ATPase b2 ATPase f1a1 Sirt3 ERRα Elovl3/Cig3 PPARα Zic1 Supplementary Figure S1. stimulates
Supplementary Figure 1. mrna expression of chitinase and chitinase-like protein in splenic immune cells. Each splenic immune cell population was
 Supplementary Figure 1. mrna expression of chitinase and chitinase-like protein in splenic immune cells. Each splenic immune cell population was sorted by FACS. Surface markers for sorting were CD11c +
MCP-1 contributes to macrophage infiltration into adipose tissue, insulin resistance, and hepatic steatosis in obesity
 Research article MCP-1 contributes to macrophage infiltration into adipose tissue, insulin resistance, and hepatic steatosis in obesity Hajime Kanda, 1 Sanshiro Tateya, 1 Yoshikazu Tamori, 1 Ko Kotani,
Loyer, et al. microrna-21 contributes to NASH Suppl 1/15
 Loyer, et al. microrna-21 contributes to NASH Suppl 1/15 SUPPLEMENTARY MATERIAL: Liver MicroRNA-21 is Overexpressed in Non Alcoholic Steatohepatitis and Contributes to the Disease in Experimental Models