Supplementary Figure S1. Gene expression analysis of epidermal marker genes and TP63.
|
|
|
- Damon Cox
- 5 years ago
- Views:
Transcription
1 Supplementary Figure Legends Supplementary Figure S1. Gene expression analysis of epidermal marker genes and TP63. A. Screenshot of the UCSC genome browser from normalized RNAPII and RNA-seq ChIP-seq data during keratinocyte differentiation (day 0, 2, 4 and 7 after differentiation initiation) at gene loci of differentiation markers (KRT14, KRT10, and LOR). RNAPII dataset was generated from human primary keratinocytes of one donor (HKC1) and RNA-seq data sets were generated from human primary keratinocytes of two donors (HKC1 and HKC2). B. Protein immunoblot analysis of epidermal marker genes, p63, KRT14, KRT10, IVL, and LOR expression during differentiation (day 0, 2, 4 and 7 after differentiation initiation) in HKC1 cells. C. RT-qPCR analysis of expression of KRT5, KRT1, and IVL in differentiating keratinocytes from HKC1 and HKC2 at day 0, 2, 4 and 7, using the harp gene as internal control. KRT5 showed high expression in proliferating and early differentiating cells, KRT1 shows induced expression in early differentiating cells and is reduced in late differentiated cells, and IVL is only detectable at late differentiation stage. (n=1, confirmed by RT-qPCR with biological and technical replicas). D. Screenshot of the UCSC genome browser from normalized RNAPII and RNA-seq ChIP-seq data at the TP63 locus during keratinocyte differentiation in HKC1 and HKC2. Expression of exons that are specific for the TA isoform were not detected. 1
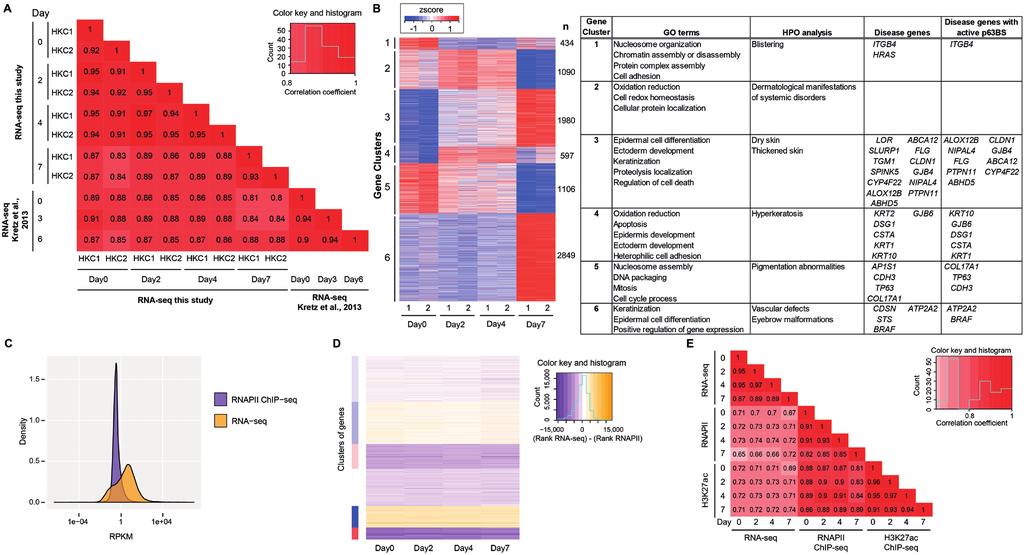
2 Supplementary Figure S2. Comparison of genome-wide data of RNA-seq, RNAPII ChIP-seq and H3K27ac ChIP-seq. A. Comparison of RNA-seq gene expression patterns between keratinocyte samples (HKC1 and HKC2) from this study and those of Kretz et al., The heatmap shows the Spearman rank correlation coefficients between each pair of samples, indicated by both color and number. Columns are in the same order as rows, with the diagonal indicating the correlation of each sample with itself. B. Heatmap of K-means clustering of RNA-seq expression patterns of differentially expression genes (P value < 0.05) from HKC1 (1) and HKC2 (2) at days 0, 2, 4, and 7 of differentiation. Only genes with high expression (RPKM > 10) at least at one stage are included. n= number of genes per cluster. Enriched GO terms, HPO terms, and associated disease genes and potential p63 target disease genes per gene cluster are summarized in the table on the right. Complete data are summarized in Supplementary Table S2. C. Distribution of gene expression levels (log10-transformed RPKM) for RNAPII ChIP-seq and RNA-seq data of HKC1. Data for all days are combined. D. Heatmap of PAM clustering (clusters 1-6, top to bottom) of per-gene rank differences between RNAPII ChIP-seq and RNA-seq expression levels of HKC1. Genes were ranked according to their RNA expression or RNAPII occupancy, and the difference in their RNA vs RNAPII rank is shown for each day. Y-axis: genes, X-axis: days. Colors indicate RNA-seq minus RNAPII rank difference, ranging from orange (RNA expression rank > RNAPII occupancy rank) to purple (RNAPII occupancy rank > RNA expression rank). Clusters are indicated in the color bar on the left, colored according to the degree of non-coding RNA enrichment (red) or 2
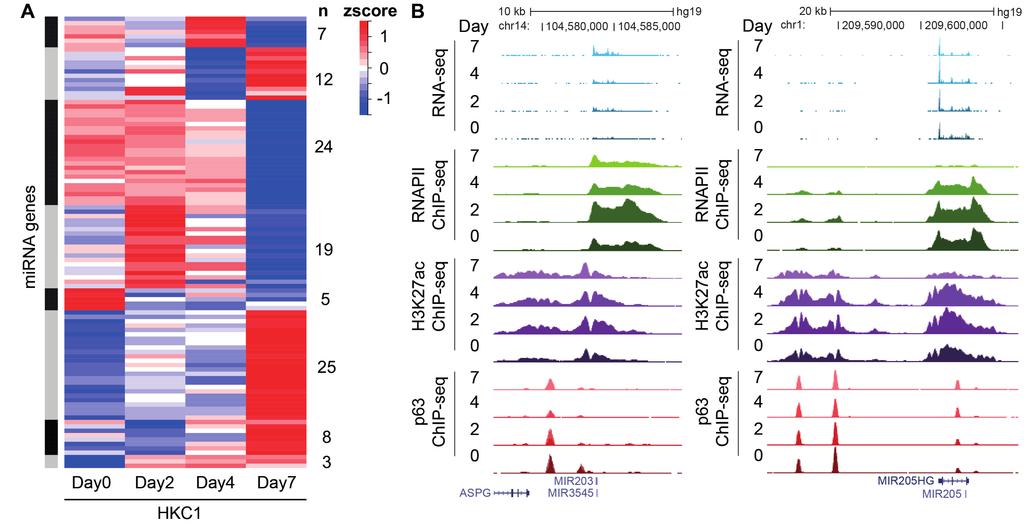
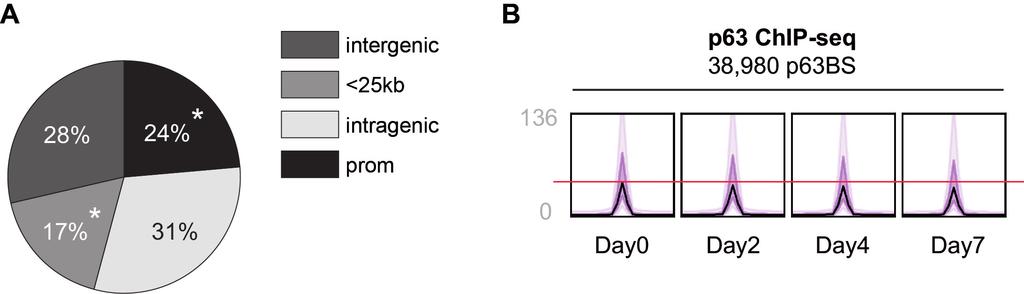
3 depletion (blue). The cluster at the bottom (red) showed higher expression detected by RNAPII ChIP-seq, and this cluster is enriched for non-coding RNAs. Complete data are summarized in Supplementary Table S3. E. Spearman correlation analysis of genome-wide RNA-seq, RNAPII-, and H3K27ac ChIP-seq signals (RPKM per gene) at the gene body during epidermal differentiation of HKC1. Supplementary Figure S3. Transcribed mirnas in keratinocytes. A. Heatmap of all identified transcribed mirnas outside gene body regions determined by RNAPII occupancy at the pri-mirna region at four stages of HKC1 keratinocyte differentiation. B. Screenshot from genome browser (UCSC) of normalized RNA-seq (shades of blue), RNAPII ChIP-seq (shades of green), H3K27ac ChIP-seq (shades of purple), and p63 ChIP-seq (shades of red) signals at mirna-203 and mirna-205 during HKC1 keratinocyte differentiation. Supplementary Figure S4. Genomic distribution of p63 binding sites relative to RefSeq genes. A. Peak detection analysis of p63 ChIP-seq data with a stringent statistical threshold (P value of 10-9 ) of HKC1 resulted in the identification of 32,888, 31,995, 29,539, and 28,169 p63 binding sites at differentiating day 0, 2, 4, and 7, respectively. The total of p63 binding sites identified in all datasets was 38,890. Genomic distribution of p63-binding site (p63bs) location of these 38,980 peaks relative to RefSeq genes was determined at promoters (5kb 3
4 upstream of TSS, first exon and first intron), in intragenic regions (all introns and exons except first), <25 kb (5-25 kb upstream or 25 kb downstream of last exon), and intergenic regions (everything else). The asterisk represents significant enrichment. B. Bandplot of p63 occupancy at all p63 binding sites (genomic regions of a 4kb window with summits of p63 binding sites in the middle in each panel) during HKC1 keratinocyte differentiation. The average p63 signal is depicted in black. p63 binding signal range of 50% and 90% of p63 binding sites is depicted in purple and light purple, respectively. Supplementary Figure S5. Screenshots of genome browser of RNA-seq, RNAPII ChIP-seq, H3K27ac ChIP-seq and p63 ChIP-seq data at RUNX1, CDH3, LCE1B/LCE1C, Involucrin, KRT1, and PRDM1 loci from four stages of keratinocyte differentiation of HKC1. A. Screenshot of the UCSC genome browser at the genomic locus surrounding GRASP and PRRX. H3K27me3 track generated from NHEK cells are depicted in pink. B. Screenshot of the UCSC genome browser at the genomic locus surrounding RUNX1. C. Screenshot of the UCSC genome browser at the genomic loci surrounding CDH3, LCE1B/LCE1C, and Involucrin (IVL). D. Screenshot of the UCSC genome browser at the genomic loci surrounding KRT1 and PRDM1 with clustered epidermal enhancer marked with a black box. Normalized RNA-seq, in decreasing shades of blue during differentiation; RNAPII ChIPseq, in decreasing shades of green; H3K27ac ChIP-seq, in decreasing shades of purple; and p63 ChIP-seq, in decreasing shades of red. Detected individual p63 binding sites and cl-p63bs are marked with a black box. 4
5 List of Supplementary tables: Supplementary Table S1: Nine clusters of genes with distinct expression patterns based on K-means clustering of genes identified in RNAPII ChIP-seq (RPKM.1.0) 1A: Gene clustering and RPKM of RNAPII ChIP-seq results 1B: Gene Ontology of gene clusters from RNAPII ChIP-seq 1C: HPO analysis of gene clusters from RNAPII ChIP-seq 1D: p63bs association to nearest genes identified in RNAPII ChIP-seq Supplementary Table S2: Six clusters of genes with distinct expression patterns based on K-means clustering of genes identified in RNA-seq (P value < 0.05, cuffdiff2 software, and with an RPKM >10) 2A: Gene clustering and RPKM of RNA-sequencing results 2B: Gene Ontology of gene clusters from RNA-seq 2C: HPO analysis of gene clusters from RNA-seq 2D: p63bs association to nearest genes identified in RNA-seq Supplementary Table S3: Comparison of RNAPII ChIP-seq and RNA-seq analysis 3A: Rank difference of RNA-seq gene rank - RNAPII ChIP-seq gene rank 3B: GO annotation of genes from different clusters with ranking differences between RNA ChIP-seq and RNA-seq 3C: non-coding RNA enrichment/depletion log2 fold changes per-cluster with rank differences RNAPII ChIP-seq versus RNA-seq 3D: P-values for tendency of non-coding RNAs to have higher RNAPII occupancy rank than RNA-seq expression rank (HKC1) Supplementary Table S4: micrornas 4A: Identified pri-mirnas using RNAPII ChIP-seq data 4B: Identified pri-mirnas with p63bs and information on their H3K27ac status 4C: Spearman correlation of pri-mirnas from RNAPII ChIP-seq signal versus RNA-seq signal Supplementary Table S5: p63 binding sites identified during epidermal differentiation 5A: P63 binding sites identified in HKC1 at day0 using MACS2 5
6 5B: P63 binding sites identified in HKC1 at day2 using MACS2 5A: P63 binding sites identified in HKC1 at day4 using MACS2 5A: P63 binding sites identified in HKC1 at day7 using MACS2 5E: All 38,980 identified p63 binding sites (p63bs) Supplementary Table S6: Co-localization of p63 binding sites and H3K27ac mark during epidermal differentiation 6A: p63bs that overlap H3K27ac marker from ENCODE NHEK cells 6B: H3K27ac peaks identified in HKC1 at day0 using MACS2 6C: H3K27ac peaks identified in HKC1 at day2 using MACS2 6D: H3K27ac peaks identified in HKC1 at day4 using MACS2 6E: H3K27ac peaks identified in HKC1 at day7 using MACS2 6F: p63bs that overlap H3K27ac occupancy identified at four stages of keratinocyte differentiation 6G: p63bs that overlap H3K27ac and nearby genes Supplementary Table S7: Motif enrichment at identified active and inactive p63bs Supplementary Table S8: Co-activator RUNX1 and TFAP2A binding to p63 binding sites 8A: RUNX1 motif location in active p63bs 8B: RUNX1 ChIP-qPCR results 8C: TFAP2 ChIP-qPCR results Supplementary Table S9: p63 binding sites clusters based on H3K27ac dynamics and associated motifs 9A: Clusters of active p63bs with dynamic H3K27ac occupancy 9B: Clusters of active p63bs with dynamic H3K27ac occupancy to nearby gene with associated RNAPII gene cluster information 9C: Motif enrichment at clusters of active p63bs with dynamically identified H3K27ac occupancy Supplementary Table S10: p63bs enrichment near transcribed genes (detected by RNAPII ChIP-seq) 6
7 Supplementary Table S11: clustered epidermal enhancers 11A: Identified clustered epidermal enhancers 11B: Identified genes near clustered epidermal enhancers 11C: GO analysis of genes near clustered epidermal enhancers 11D: HPO analysis of genes near clustered epidermal enhancers Supplementary Table S12: potential p63 target genes with p63 binding sites 12A: Genes identified near all 38,980 p63bs 12B: GO annotation of genes near all 38,980 p63bs Supplementary Table S13: previously reported epidermal disease genes and p63-regulated genes 13A: Gene list of genes with a known role in epidermal diseases and information from RNAPII ChIP-seq and RNA-seq 13B: Gene list of genes with a known role in epidermal diseases and information on their closest p63bs 13C: Gene list of genes with identified by p63 knock-down or knockout in previously described studies. 13D: Gene list of genes identified by p63 knock-down or knockout in previously described studies with p63bs information Supplementary Table S14: clustered p63 binding sites (cl-p63bs) 14A: clustered p63 binding sites (cl-p63bs) 14B: Nearby genes of cl-p63bs 14C: GO analysis of genes near cl-p63bs 14D: HPO association analysis of genes near cl-p63bs Supplementary Table S15: cl-p63bs that overlap clustered epidermal enhancers 15A: cl-p63bs that overlap clustered epidermal enhancers 15B: Genes nearby clustered epidermal enhancers which overlap cl-p63bs 15C: GO analysis of genes nearby clustered epidermal enhancers which overlap cl-p63bs 7
8 15D: HPO analysis of genes nearby clustered epidermal enhancers which overlap cl-p63bs Supplementary Table S16: Clustered epidermal enhancers that do not overlap cl-p63bs 16A: Clustered epidermal enhancers that do not overlap cl-p63bs 16B: Genes identified near clustered epidermal enhancers that do not overlap cl-p63bs 16C: GO analysis of genes near clustered epidermal enhancers that do not overlap cl-p63bs 16D: HPO analysis of genes near clustered epidermal enhancers that do not overlap clp63bs Supplementary Table S17: cl-p63bs that do not overlap clustered epidermal enhancers 17A: cl-p63bs that do not overlap clustered epidermal enhancers 17B: Genes identified near cl-p63bs that do not overlap clustered epidermal enhancers 17C: GO analysis of genes near cl-p63bs that do not overlap clustered epidermal enhancers 17D: HPO analysis of genes near cl-p63bs that do not overlap clustered epidermal enhancers Supplementary Table S18: RT q-pcr primers Supplementary Table S19: Statistics of sequencing. Supplementary Table S20: summary of average z-scores used in Figure 1C. 20A: Overview of average z-scores and standard deviations per stage for genes identified in both RNAPII ChIP-seq and RNA-seq for each genecluster identified using RNAPII ChIP-seq 20B: z-scores for genes identified in both RNAPII ChIP-seq and RNA-seq for gene cluster 1 20C: z-scores for genes identified in both RNAPII ChIP-seq and RNA-seq for gene cluster 2 20D: z-scores for genes identified in both RNAPII ChIP-seq and RNA-seq for gene cluster 3 20E: z-scores for genes identified in both RNAPII ChIP-seq and RNA-seq for gene cluster 4 20F: z-scores for genes identified in both RNAPII ChIP-seq and RNA-seq for gene cluster 5 8
9 20G: z-scores for genes identified in both RNAPII ChIP-seq and RNA-seq for gene cluster 6 20H: z-scores for genes identified in both RNAPII ChIP-seq and RNA-seq for gene cluster 7 20I: z-scores for genes identified in both RNAPII ChIP-seq and RNA-seq for gene cluster 8 20J: z-scores for genes identified in both RNAPII ChIP-seq and RNA-seq for gene cluster 9 9
10 Fig. S1
11 Fig. S2
12 Fig. S3
13 Fig. S4
14 Fig. S5
Transcription factor p63 bookmarks and regulates dynamic enhancers during epidermal differentiation
 Published online: June 1, 15 Article Transcription factor p63 bookmarks and regulates dynamic enhancers during epidermal differentiation Evelyn N Kouwenhoven 1,, Martin Oti, Hanna Niehues 3, Simon J van
7SK ChIRP-seq is specifically RNA dependent and conserved between mice and humans.
 Supplementary Figure 1 7SK ChIRP-seq is specifically RNA dependent and conserved between mice and humans. Regions targeted by the Even and Odd ChIRP probes mapped to a secondary structure model 56 of the
Nature Structural & Molecular Biology: doi: /nsmb Supplementary Figure 1
 Supplementary Figure 1 Effect of HSP90 inhibition on expression of endogenous retroviruses. (a) Inducible shrna-mediated Hsp90 silencing in mouse ESCs. Immunoblots of total cell extract expressing the
Comparison of open chromatin regions between dentate granule cells and other tissues and neural cell types.
 Supplementary Figure 1 Comparison of open chromatin regions between dentate granule cells and other tissues and neural cell types. (a) Pearson correlation heatmap among open chromatin profiles of different
Nature Structural & Molecular Biology: doi: /nsmb.2419
 Supplementary Figure 1 Mapped sequence reads and nucleosome occupancies. (a) Distribution of sequencing reads on the mouse reference genome for chromosome 14 as an example. The number of reads in a 1 Mb
Supplementary Figure 1. Efficiency of Mll4 deletion and its effect on T cell populations in the periphery. Nature Immunology: doi: /ni.
 Supplementary Figure 1 Efficiency of Mll4 deletion and its effect on T cell populations in the periphery. Expression of Mll4 floxed alleles (16-19) in naive CD4 + T cells isolated from lymph nodes and
Supplemental Figure S1. Tertiles of FKBP5 promoter methylation and internal regulatory region
 Supplemental Figure S1. Tertiles of FKBP5 promoter methylation and internal regulatory region methylation in relation to PSS and fetal coupling. A, PSS values for participants whose placentas showed low,
MIR retrotransposon sequences provide insulators to the human genome
 Supplementary Information: MIR retrotransposon sequences provide insulators to the human genome Jianrong Wang, Cristina Vicente-García, Davide Seruggia, Eduardo Moltó, Ana Fernandez- Miñán, Ana Neto, Elbert
a) List of KMTs targeted in the shrna screen. The official symbol, KMT designation,
 List of KMTs targeted in the shrna screen. The official symbol, KMT designation,") Supplementary Information Supplementary Figures Supplementary Figure 1. a) List of KMTs targeted in the shrna screen. The official symbol, KMT designation, gene ID and specifities are provided. Those highlighted
Supplementary Information Supplementary Figures Supplementary Figure 1. a) List of KMTs targeted in the shrna screen. The official symbol, KMT designation, gene ID and specifities are provided. Those highlighted
Accessing and Using ENCODE Data Dr. Peggy J. Farnham
 1 William M Keck Professor of Biochemistry Keck School of Medicine University of Southern California How many human genes are encoded in our 3x10 9 bp? C. elegans (worm) 959 cells and 1x10 8 bp 20,000
Nature Structural & Molecular Biology: doi: /nsmb Supplementary Figure 1
 Supplementary Figure 1 U1 inhibition causes a shift of RNA-seq reads from exons to introns. (a) Evidence for the high purity of 4-shU-labeled RNAs used for RNA-seq. HeLa cells transfected with control
Supplementary Figure 1 IL-27 IL
 Tim-3 Supplementary Figure 1 Tc0 49.5 0.6 Tc1 63.5 0.84 Un 49.8 0.16 35.5 0.16 10 4 61.2 5.53 10 3 64.5 5.66 10 2 10 1 10 0 31 2.22 10 0 10 1 10 2 10 3 10 4 IL-10 28.2 1.69 IL-27 Supplementary Figure 1.
Lung Met 1 Lung Met 2 Lung Met Lung Met H3K4me1. Lung Met H3K27ac Primary H3K4me1
 a Gained Met-VELs 1.5 1.5 -.5 Lung Met 1 Lung Met Lung Met 3 1. Lung Met H3K4me1 Lung Met H3K4me1 1 Lung Met H3K4me1 Lung Met H3K7ac 1.5 Lung Met H3K7ac Lung Met H3K7ac.8 Primary H3K4me1 Primary H3K7ac
Supplementary Figures
 Supplementary Figures Supplementary Figure 1. Heatmap of GO terms for differentially expressed genes. The terms were hierarchically clustered using the GO term enrichment beta. Darker red, higher positive
STAT1 regulates microrna transcription in interferon γ stimulated HeLa cells
 CAMDA 2009 October 5, 2009 STAT1 regulates microrna transcription in interferon γ stimulated HeLa cells Guohua Wang 1, Yadong Wang 1, Denan Zhang 1, Mingxiang Teng 1,2, Lang Li 2, and Yunlong Liu 2 Harbin
Supplemental Figure 1. Genes showing ectopic H3K9 dimethylation in this study are DNA hypermethylated in Lister et al. study.
 mc mc mc mc SUP mc mc Supplemental Figure. Genes showing ectopic HK9 dimethylation in this study are DNA hypermethylated in Lister et al. study. Representative views of genes that gain HK9m marks in their
Chromatin marks identify critical cell-types for fine-mapping complex trait variants
 Chromatin marks identify critical cell-types for fine-mapping complex trait variants Gosia Trynka 1-4 *, Cynthia Sandor 1-4 *, Buhm Han 1-4, Han Xu 5, Barbara E Stranger 1,4#, X Shirley Liu 5, and Soumya
Supplemental Information. Genomic Characterization of Murine. Monocytes Reveals C/EBPb Transcription. Factor Dependence of Ly6C Cells
 Immunity, Volume 46 Supplemental Information Genomic Characterization of Murine Monocytes Reveals C/EBPb Transcription Factor Dependence of Ly6C Cells Alexander Mildner, Jörg Schönheit, Amir Giladi, Eyal
Computational Analysis of UHT Sequences Histone modifications, CAGE, RNA-Seq
 Computational Analysis of UHT Sequences Histone modifications, CAGE, RNA-Seq Philipp Bucher Wednesday January 21, 2009 SIB graduate school course EPFL, Lausanne ChIP-seq against histone variants: Biological
Supplementary information
 Supplementary information High fat diet-induced changes of mouse hepatic transcription and enhancer activity can be reversed by subsequent weight loss Majken Siersbæk, Lyuba Varticovski, Shutong Yang,
Supplementary Figure 1: Features of IGLL5 Mutations in CLL: a) Representative IGV screenshot of first
 Representative IGV screenshot of first") Supplementary Figure 1: Features of IGLL5 Mutations in CLL: a) Representative IGV screenshot of first intron IGLL5 mutation depicting biallelic mutations. Red arrows highlight the presence of out of phase
Supplementary Figure 1: Features of IGLL5 Mutations in CLL: a) Representative IGV screenshot of first intron IGLL5 mutation depicting biallelic mutations. Red arrows highlight the presence of out of phase
Nature Immunology: doi: /ni Supplementary Figure 1. Characteristics of SEs in T reg and T conv cells.
 Supplementary Figure 1 Characteristics of SEs in T reg and T conv cells. (a) Patterns of indicated transcription factor-binding at SEs and surrounding regions in T reg and T conv cells. Average normalized
H3K4 demethylase KDM5B regulates global dynamics of transcription elongation and alternative splicing in embryonic stem cells
 Nucleic Acids Research, 2017 1 doi: 10.1093/nar/gkx251 H3K4 demethylase KDM5B regulates global dynamics of transcription elongation and alternative splicing in embryonic stem cells Runsheng He 1,2 and
Analysis of the peroxisome proliferator-activated receptor-β/δ (PPARβ/δ) cistrome reveals novel co-regulatory role of ATF4
 cistrome reveals novel co-regulatory role of ATF4") Khozoie et al. BMC Genomics 2012, 13:665 RESEARCH ARTICLE Open Access Analysis of the peroxisome proliferator-activated receptor-β/δ (PPARβ/δ) cistrome reveals novel co-regulatory role of ATF4 Combiz Khozoie
Khozoie et al. BMC Genomics 2012, 13:665 RESEARCH ARTICLE Open Access Analysis of the peroxisome proliferator-activated receptor-β/δ (PPARβ/δ) cistrome reveals novel co-regulatory role of ATF4 Combiz Khozoie
Heintzman, ND, Stuart, RK, Hon, G, Fu, Y, Ching, CW, Hawkins, RD, Barrera, LO, Van Calcar, S, Qu, C, Ching, KA, Wang, W, Weng, Z, Green, RD,
 Heintzman, ND, Stuart, RK, Hon, G, Fu, Y, Ching, CW, Hawkins, RD, Barrera, LO, Van Calcar, S, Qu, C, Ching, KA, Wang, W, Weng, Z, Green, RD, Crawford, GE, Ren, B (2007) Distinct and predictive chromatin
Table S1. Total and mapped reads produced for each ChIP-seq sample
 Tale S1. Total and mapped reads produced for each ChIP-seq sample Sample Total Reads Mapped Reads Col- H3K27me3 rep1 125662 1334323 (85.76%) Col- H3K27me3 rep2 9176437 7986731 (87.4%) atmi1a//c H3K27m3
Supplemental Figure S1. Expression of Cirbp mrna in mouse tissues and NIH3T3 cells.
 SUPPLEMENTAL FIGURE AND TABLE LEGENDS Supplemental Figure S1. Expression of Cirbp mrna in mouse tissues and NIH3T3 cells. A) Cirbp mrna expression levels in various mouse tissues collected around the clock
Dynamic reorganization of the AC16 cardiomyocyte transcriptome in response to TNFα signaling revealed by integrated genomic analyses. Luo et al.
 Dynamic reorganization of the AC1 cardiomyocyte transcriptome in response to TNFα signaling revealed by integrated genomic analyses Luo et al. Luo et al. BMC Genomics 1, 15:155 Luo et al. BMC Genomics
Nature Immunology: doi: /ni Supplementary Figure 1. DNA-methylation machinery is essential for silencing of Cd4 in cytotoxic T cells.
 Supplementary Figure 1 DNA-methylation machinery is essential for silencing of Cd4 in cytotoxic T cells. (a) Scheme for the retroviral shrna screen. (b) Histogram showing CD4 expression (MFI) in WT cytotoxic
Supplementary Information
 Supplementary Information 5-hydroxymethylcytosine-mediated epigenetic dynamics during postnatal neurodevelopment and aging By Keith E. Szulwach 1,8, Xuekun Li 1,8, Yujing Li 1, Chun-Xiao Song 2, Hao Wu
Broad H3K4me3 is associated with increased transcription elongation and enhancer activity at tumor suppressor genes
 Broad H3K4me3 is associated with increased transcription elongation and enhancer activity at tumor suppressor genes Kaifu Chen 1,2,3,4,5,10, Zhong Chen 6,10, Dayong Wu 6, Lili Zhang 7, Xueqiu Lin 1,2,8,
Supplemental Information For: The genetics of splicing in neuroblastoma
 Supplemental Information For: The genetics of splicing in neuroblastoma Justin Chen, Christopher S. Hackett, Shile Zhang, Young K. Song, Robert J.A. Bell, Annette M. Molinaro, David A. Quigley, Allan Balmain,
Nature Immunology: doi: /ni Supplementary Figure 1. Transcriptional program of the TE and MP CD8 + T cell subsets.
 Supplementary Figure 1 Transcriptional program of the TE and MP CD8 + T cell subsets. (a) Comparison of gene expression of TE and MP CD8 + T cell subsets by microarray. Genes that are 1.5-fold upregulated
Supplemental Figure S1. PLAG1 kidneys contain fewer glomeruli (A) Quantitative PCR for Igf2 and PLAG1 in whole kidneys taken from mice at E15.
 Quantitative PCR for Igf2 and PLAG1 in whole kidneys taken from mice at E15.") Supplemental Figure S1. PLAG1 kidneys contain fewer glomeruli (A) Quantitative PCR for Igf2 and PLAG1 in whole kidneys taken from mice at E15.5, E18.5, P4, and P8. Values shown are means from four technical
Supplemental Figure S1. PLAG1 kidneys contain fewer glomeruli (A) Quantitative PCR for Igf2 and PLAG1 in whole kidneys taken from mice at E15.5, E18.5, P4, and P8. Values shown are means from four technical
ChromHMM Tutorial. Jason Ernst Assistant Professor University of California, Los Angeles
 ChromHMM Tutorial Jason Ernst Assistant Professor University of California, Los Angeles Talk Outline Chromatin states analysis and ChromHMM Accessing chromatin state annotations for ENCODE2 and Roadmap
Relationship between genomic features and distributions of RS1 and RS3 rearrangements in breast cancer genomes.
 Supplementary Figure 1 Relationship between genomic features and distributions of RS1 and RS3 rearrangements in breast cancer genomes. (a,b) Values of coefficients associated with genomic features, separately
Table S1. Relative abundance of AGO1/4 proteins in different organs. Table S2. Summary of smrna datasets from various samples.
 Supplementary files Table S1. Relative abundance of AGO1/4 proteins in different organs. Table S2. Summary of smrna datasets from various samples. Table S3. Specificity of AGO1- and AGO4-preferred 24-nt
Histone Modifications Are Associated with Transcript Isoform Diversity in Normal and Cancer Cells
 Histone Modifications Are Associated with Transcript Isoform Diversity in Normal and Cancer Cells Ondrej Podlaha 1, Subhajyoti De 2,3,4, Mithat Gonen 5, Franziska Michor 1 * 1 Department of Biostatistics
Computational aspects of ChIP-seq. John Marioni Research Group Leader European Bioinformatics Institute European Molecular Biology Laboratory
 Computational aspects of ChIP-seq John Marioni Research Group Leader European Bioinformatics Institute European Molecular Biology Laboratory ChIP-seq Using highthroughput sequencing to investigate DNA
High Throughput Sequence (HTS) data analysis. Lei Zhou
 data analysis. Lei Zhou") High Throughput Sequence (HTS) data analysis Lei Zhou (leizhou@ufl.edu) High Throughput Sequence (HTS) data analysis 1. Representation of HTS data. 2. Visualization of HTS data. 3. Discovering genomic
High Throughput Sequence (HTS) data analysis Lei Zhou (leizhou@ufl.edu) High Throughput Sequence (HTS) data analysis 1. Representation of HTS data. 2. Visualization of HTS data. 3. Discovering genomic
The Epigenome Tools 2: ChIP-Seq and Data Analysis
 The Epigenome Tools 2: ChIP-Seq and Data Analysis Chongzhi Zang zang@virginia.edu http://zanglab.com PHS5705: Public Health Genomics March 20, 2017 1 Outline Epigenome: basics review ChIP-seq overview
SUPPLEMENTARY INFORMATION
 doi:10.1038/nature10866 a b 1 2 3 4 5 6 7 Match No Match 1 2 3 4 5 6 7 Turcan et al. Supplementary Fig.1 Concepts mapping H3K27 targets in EF CBX8 targets in EF H3K27 targets in ES SUZ12 targets in ES
Lentiviral Delivery of Combinatorial mirna Expression Constructs Provides Efficient Target Gene Repression.
 Supplementary Figure 1 Lentiviral Delivery of Combinatorial mirna Expression Constructs Provides Efficient Target Gene Repression. a, Design for lentiviral combinatorial mirna expression and sensor constructs.
Discovery of Novel Human Gene Regulatory Modules from Gene Co-expression and
 Discovery of Novel Human Gene Regulatory Modules from Gene Co-expression and Promoter Motif Analysis Shisong Ma 1,2*, Michael Snyder 3, and Savithramma P Dinesh-Kumar 2* 1 School of Life Sciences, University
MODULE 4: SPLICING. Removal of introns from messenger RNA by splicing
 Last update: 05/10/2017 MODULE 4: SPLICING Lesson Plan: Title MEG LAAKSO Removal of introns from messenger RNA by splicing Objectives Identify splice donor and acceptor sites that are best supported by
Comprehensive nucleosome mapping of the human genome in cancer progression
 /, Vol. 7, No. 12 Comprehensive nucleosome mapping of the human genome in cancer progression Brooke R. Druliner 1,5, Daniel Vera 1,6, Ruth Johnson 2, Xiaoyang Ruan 3, Lynn M. Apone 4, Eileen T. Dimalanta
Nature Structural & Molecular Biology: doi: /nsmb Supplementary Figure 1
 Supplementary Figure 1 Frequency of alternative-cassette-exon engagement with the ribosome is consistent across data from multiple human cell types and from mouse stem cells. Box plots showing AS frequency
Supplementary Figure 1: Attenuation of association signals after conditioning for the lead SNP. a) attenuation of association signal at the 9p22.
 attenuation of association signal at the 9p22.") Supplementary Figure 1: Attenuation of association signals after conditioning for the lead SNP. a) attenuation of association signal at the 9p22.32 PCOS locus after conditioning for the lead SNP rs10993397;
Supplementary Figure 1: Attenuation of association signals after conditioning for the lead SNP. a) attenuation of association signal at the 9p22.32 PCOS locus after conditioning for the lead SNP rs10993397;
Nature Genetics: doi: /ng Supplementary Figure 1. Assessment of sample purity and quality.
 Supplementary Figure 1 Assessment of sample purity and quality. (a) Hematoxylin and eosin staining of formaldehyde-fixed, paraffin-embedded sections from a human testis biopsy collected concurrently with
Nature Genetics: doi: /ng Supplementary Figure 1
 Supplementary Figure 1 Expression deviation of the genes mapped to gene-wise recurrent mutations in the TCGA breast cancer cohort (top) and the TCGA lung cancer cohort (bottom). For each gene (each pair
Supplementary Figures
 Supplementary Figures Supplementary Figure 1. Confirmation of Dnmt1 conditional knockout out mice. a, Representative images of sorted stem (Lin - CD49f high CD24 + ), luminal (Lin - CD49f low CD24 + )
Supplemental Figure S1. A. Venn diagram depicting overlap between anti-correlated genes of
 Supplemental Figure S1. A. Venn diagram depicting overlap between anti-correlated genes of 1,000 most differentially expressed genes with NKX2-1 amplification in lung adenocarcinoma cell lines and anti-correlated
Title: Epigenetic mechanisms underlying maternal diabetes-associated risk of congenital heart disease
 1 Supplemental Materials 2 3 Title: Epigenetic mechanisms underlying maternal diabetes-associated risk of congenital heart disease 4 5 6 Authors: Madhumita Basu, 1 Jun-Yi Zhu, 2 Stephanie LaHaye 1,3, Uddalak
Large conserved domains of low DNA methylation maintained by Dnmt3a
 Supplementary information Large conserved domains of low DNA methylation maintained by Dnmt3a Mira Jeong# 1, Deqiang Sun # 2, Min Luo# 1, Yun Huang 3, Grant A. Challen %1, Benjamin Rodriguez 2, Xiaotian
Comparative DNA methylome analysis of endometrial carcinoma reveals complex and distinct deregulation of cancer promoters and enhancers
 Zhang et al. BMC Genomics 2014, 15:868 RESEARCH ARTICLE Open Access Comparative DNA methylome analysis of endometrial carcinoma reveals complex and distinct deregulation of cancer promoters and enhancers
MODULE 3: TRANSCRIPTION PART II
 MODULE 3: TRANSCRIPTION PART II Lesson Plan: Title S. CATHERINE SILVER KEY, CHIYEDZA SMALL Transcription Part II: What happens to the initial (premrna) transcript made by RNA pol II? Objectives Explain
Supplementary Materials for
 advances.sciencemag.org/cgi/content/full/1/8/e1500296/dc1 Supplementary Materials for Transcriptional regulation of APOBEC3 antiviral immunity through the CBF- /RUNX axis This PDF file includes: Brett
Nature Structural & Molecular Biology: doi: /nsmb Supplementary Figure 1. Differential expression of mirnas from the pri-mir-17-92a locus.
 Supplementary Figure 1 Differential expression of mirnas from the pri-mir-17-92a locus. (a) The mir-17-92a expression unit in the third intron of the host mir-17hg transcript. (b,c) Impact of knockdown
Variant Classification. Author: Mike Thiesen, Golden Helix, Inc.
 Variant Classification Author: Mike Thiesen, Golden Helix, Inc. Overview Sequencing pipelines are able to identify rare variants not found in catalogs such as dbsnp. As a result, variants in these datasets
SUPPLEMENTARY INFORMATION
 Supplementary text Collectively, we were able to detect ~14,000 expressed genes with RPKM (reads per kilobase per million) > 1 or ~16,000 with RPKM > 0.1 in at least one cell type from oocyte to the morula
cis-regulatory enrichment analysis in human, mouse and fly
 cis-regulatory enrichment analysis in human, mouse and fly Zeynep Kalender Atak, PhD Laboratory of Computational Biology VIB-KU Leuven Center for Brain & Disease Research Laboratory of Computational Biology
Supplemental Figure 1. Small RNA size distribution from different soybean tissues.
 Supplemental Figure 1. Small RNA size distribution from different soybean tissues. The size of small RNAs was plotted versus frequency (percentage) among total sequences (A, C, E and G) or distinct sequences
Supplementary Figures
 Supplementary Figures Supplementary Figure 1. Pan-cancer analysis of global and local DNA methylation variation a) Variations in global DNA methylation are shown as measured by averaging the genome-wide
Supplemental Data. Integrating omics and alternative splicing i reveals insights i into grape response to high temperature
 Supplemental Data Integrating omics and alternative splicing i reveals insights i into grape response to high temperature Jianfu Jiang 1, Xinna Liu 1, Guotian Liu, Chonghuih Liu*, Shaohuah Li*, and Lijun
Nature Genetics: doi: /ng Supplementary Figure 1. Phenotypic characterization of MES- and ADRN-type cells.
 Supplementary Figure 1 Phenotypic characterization of MES- and ADRN-type cells. (a) Bright-field images showing cellular morphology of MES-type (691-MES, 700-MES, 717-MES) and ADRN-type (691-ADRN, 700-
Nature Genetics: doi: /ng.3731
 Supplementary Figure 1 Circadian profiles of Adarb1 transcript and ADARB1 protein in mouse tissues. (a) Overlap of rhythmic transcripts identified in the previous transcriptome analyses. The mouse liver
CTCF-Mediated Functional Chromatin Interactome in Pluripotent Cells
 SUPPLEMENTARY INFORMATION CTCF-Mediated Functional Chromatin Interactome in Pluripotent Cells Lusy Handoko 1,*, Han Xu 1,*, Guoliang Li 1,*, Chew Yee Ngan 1, Elaine Chew 1, Marie Schnapp 1, Charlie Wah
Supplemental Information. A Highly Sensitive and Robust Method. for Genome-wide 5hmC Profiling. of Rare Cell Populations
 Molecular ell, Volume 63 Supplemental Information Highly Sensitive and Robust Method for enome-wide hm Profiling of Rare ell Populations Dali Han, Xingyu Lu, lan H. Shih, Ji Nie, Qiancheng You, Meng Michelle
Figure S2. Distribution of acgh probes on all ten chromosomes of the RIL M0022
 96 APPENDIX B. Supporting Information for chapter 4 "changes in genome content generated via segregation of non-allelic homologs" Figure S1. Potential de novo CNV probes and sizes of apparently de novo
Supplementary Materials for
 www.sciencesignaling.org/cgi/content/full/8/375/ra41/dc1 Supplementary Materials for Actin cytoskeletal remodeling with protrusion formation is essential for heart regeneration in Hippo-deficient mice
SUPPLEMENTAL INFORMATION
 SUPPLEMENTAL INFORMATION GO term analysis of differentially methylated SUMIs. GO term analysis of the 458 SUMIs with the largest differential methylation between human and chimp shows that they are more
Gene and Genome Parameters of Mammalian Liver Circadian Genes (LCGs)
") Gene and Genome Parameters of Mammalian Liver Circadian Genes (LCGs) The Harvard community has made this article openly available. Please share how this access benefits you. Your story matters Citation
Gene and Genome Parameters of Mammalian Liver Circadian Genes (LCGs) The Harvard community has made this article openly available. Please share how this access benefits you. Your story matters Citation
Myogenic Differential Methylation: Diverse Associations with Chromatin Structure
 Biology 2014, 3, 426-451; doi:10.3390/biology3020426 Article OPEN ACCESS biology ISSN 2079-7737 www.mdpi.com/journal/biology Myogenic Differential Methylation: Diverse Associations with Chromatin Structure
Nature Genetics: doi: /ng Supplementary Figure 1. SEER data for male and female cancer incidence from
 Supplementary Figure 1 SEER data for male and female cancer incidence from 1975 2013. (a,b) Incidence rates of oral cavity and pharynx cancer (a) and leukemia (b) are plotted, grouped by males (blue),
The Insulator Binding Protein CTCF Positions 20 Nucleosomes around Its Binding Sites across the Human Genome
 The Insulator Binding Protein CTCF Positions 20 Nucleosomes around Its Binding Sites across the Human Genome Yutao Fu 1, Manisha Sinha 2,3, Craig L. Peterson 3, Zhiping Weng 1,4,5 * 1 Bioinformatics Program,
Nature Immunology: doi: /ni Supplementary Figure 1. RNA-Seq analysis of CD8 + TILs and N-TILs.
 Supplementary Figure 1 RNA-Seq analysis of CD8 + TILs and N-TILs. (a) Schematic representation of the tumor and cell types used for the study. HNSCC, head and neck squamous cell cancer; NSCLC, non-small
A novel ATAC-seq approach reveals lineage-specific reinforcement of the open chromatin landscape via cooperation between BAF and p63
 Bao et al. Genome Biology (2015) 16:284 DOI 10.1186/s13059-015-0840-9 RESEARCH A novel ATAC-seq approach reveals lineage-specific reinforcement of the open chromatin landscape via cooperation between BAF
SUPPLEMENTARY APPENDIX
 SUPPLEMENTARY APPENDIX 1) Supplemental Figure 1. Histopathologic Characteristics of the Tumors in the Discovery Cohort 2) Supplemental Figure 2. Incorporation of Normal Epidermal Melanocytic Signature
ESCs were lysed with Trizol reagent (Life technologies) and RNA was extracted according to
 and RNA was extracted according to") Supplemental Methods RNA-seq ESCs were lysed with Trizol reagent (Life technologies) and RNA was extracted according to the manufacturer's instructions. RNAse free DNaseI (Sigma) was used to eliminate
Supplemental Methods RNA-seq ESCs were lysed with Trizol reagent (Life technologies) and RNA was extracted according to the manufacturer's instructions. RNAse free DNaseI (Sigma) was used to eliminate
Nuclear RNA Sequencing of the Mouse Erythroid Cell Transcriptome
 Nuclear RNA Sequencing of the Mouse Erythroid Cell Transcriptome Jennifer A. Mitchell 1,2 *., Ieuan Clay 2., David Umlauf 2, Chih-yu Chen 1, Catherine A. Moir 2, Christopher H. Eskiw 2,3, Stefan Schoenfelder
Peak-calling for ChIP-seq and ATAC-seq
 Peak-calling for ChIP-seq and ATAC-seq Shamith Samarajiwa CRUK Autumn School in Bioinformatics 2017 University of Cambridge Overview Peak-calling: identify enriched (signal) regions in ChIP-seq or ATAC-seq
Fig. S1. Validation of ChIP-seq binding sites by single gene ChIP-PCR Fig. S2. Transactivation potential of PPAR
 Fig. S1. Validation of ChIP-seq binding sites by single gene ChIP-PCR ChIP-PCR was performed on PPARγ and RXR-enriched chromatin harvested during adipocyte differentiation at day and day 6 as described
PDF hosted at the Radboud Repository of the Radboud University Nijmegen
 PDF hosted at the Radboud Repository of the Radboud University Nijmegen The following full text is a publisher's version. For additional information about this publication click this link. http://hdl.handle.net/2066/156973
Supplementary Figure 1
 Supplementary Figure 1 Asymmetrical function of 5p and 3p arms of mir-181 and mir-30 families and mir-142 and mir-154. (a) Control experiments using mirna sensor vector and empty pri-mirna overexpression
Figure S1, Beyer et al.
 Figure S1, eyer et al. Pax7 Myogenin si sitrl Hoechst T = 72h 14 1.8.6.4.2 12 1 8 6 4 2 24h 48h 96h diff. sitrl siset1 212 72h diff. b1 td r t Se km MyH Vinculin Myogenin β-ctin Vinculin MW b1 ka td r
User Guide. Association analysis. Input
 User Guide TFEA.ChIP is a tool to estimate transcription factor enrichment in a set of differentially expressed genes using data from ChIP-Seq experiments performed in different tissues and conditions.
A Practical Guide to Integrative Genomics by RNA-seq and ChIP-seq Analysis
 A Practical Guide to Integrative Genomics by RNA-seq and ChIP-seq Analysis Jian Xu, Ph.D. Children s Research Institute, UTSW Introduction Outline Overview of genomic and next-gen sequencing technologies
Chip Seq Peak Calling in Galaxy
 Chip Seq Peak Calling in Galaxy Chris Seward PowerPoint by Pei-Chen Peng Chip-Seq Peak Calling in Galaxy Chris Seward 2018 1 Introduction This goals of the lab are as follows: 1. Gain experience using
SUPPLEMENTARY FIGURES
 SUPPLEMENTARY FIGURES 1 Supplementary Figure 1, Adult hippocampal QNPs and TAPs uniformly express REST a-b) Confocal images of adult hippocampal mouse sections showing GFAP (green), Sox2 (red), and REST
Supplementary Figure S1. Generation of LSL-EZH2 conditional transgenic mice.
 Downstream Col1A locus S P P P EP Genotyping with P1, P2 frt PGKneopA + frt hygro-pa Targeting vector Genotyping with P3, P4 P1 pcag-flpe P2 P3 P4 frt SApA CAG LSL PGKATG frt hygro-pa C. D. E. ormal KRAS
SUPPLEMENTAL DATA AGING, July 2014, Vol. 6 No. 7
 SUPPLEMENTAL DATA Figure S1. Muscle mass changes in different anatomical regions with age. (A) The TA and gastrocnemius muscle showed a significant loss of weight in aged mice (24 month old) compared to
Supplementary Figure 1 ITGB1 and ITGA11 increase with evidence for heterodimers following HSC activation. (a) Time course of rat HSC activation
 Time course of rat HSC activation") Supplementary Figure 1 ITGB1 and ITGA11 increase with evidence for heterodimers following HSC activation. (a) Time course of rat HSC activation indicated by the detection of -SMA and COL1 (log scale).
Supplementary Figure 1 ITGB1 and ITGA11 increase with evidence for heterodimers following HSC activation. (a) Time course of rat HSC activation indicated by the detection of -SMA and COL1 (log scale).
Nature Neuroscience: doi: /nn Supplementary Figure 1. Behavioral training.
 Supplementary Figure 1 Behavioral training. a, Mazes used for behavioral training. Asterisks indicate reward location. Only some example mazes are shown (for example, right choice and not left choice maze
Supplementary Information. Supplementary Figures
 Supplementary Information Supplementary Figures.8 57 essential gene density 2 1.5 LTR insert frequency diversity DEL.5 DUP.5 INV.5 TRA 1 2 3 4 5 1 2 3 4 1 2 Supplementary Figure 1. Locations and minor
Tutorial: RNA-Seq Analysis Part II: Non-Specific Matches and Expression Measures
 : RNA-Seq Analysis Part II: Non-Specific Matches and Expression Measures March 15, 2013 CLC bio Finlandsgade 10-12 8200 Aarhus N Denmark Telephone: +45 70 22 55 09 Fax: +45 70 22 55 19 www.clcbio.com support@clcbio.com
SUPPLEMENTARY INFORMATION
 doi:.38/nature8975 SUPPLEMENTAL TEXT Unique association of HOTAIR with patient outcome To determine whether the expression of other HOX lincrnas in addition to HOTAIR can predict patient outcome, we measured
Exploring DNA methylation changes in promoter, intragenic, and intergenic regions as early and late events in breast cancer formation
 Rauscher et al. BMC Cancer (2015) 15:816 DOI 10.1186/s12885-015-1777-9 RESEARCH ARTICLE Open Access Exploring DNA methylation changes in promoter, intragenic, and intergenic regions as early and late events
fl/+ KRas;Atg5 fl/+ KRas;Atg5 fl/fl KRas;Atg5 fl/fl KRas;Atg5 Supplementary Figure 1. Gene set enrichment analyses. (a) (b)
 (b)") KRas;At KRas;At KRas;At KRas;At a b Supplementary Figure 1. Gene set enrichment analyses. (a) GO gene sets (MSigDB v3. c5) enriched in KRas;Atg5 fl/+ as compared to KRas;Atg5 fl/fl tumors using gene set
KRas;At KRas;At KRas;At KRas;At a b Supplementary Figure 1. Gene set enrichment analyses. (a) GO gene sets (MSigDB v3. c5) enriched in KRas;Atg5 fl/+ as compared to KRas;Atg5 fl/fl tumors using gene set
PBZ FT01_PBZ FT01_TZ FT01_NZ. interface zone (I) tumor zone (TZ) necrotic zone (NZ)
 tumor zone (TZ) necrotic zone (NZ)") Oncotarget, Supplementary Materials www.impactjournals.com/oncotarget/ SUPPLEMENTRY FLES ndividuals factor map (P) FT_ FT_ FT_ Dim (.%) Dim (.%) >% peripheral brain zone () around % interface zone () FT
Oncotarget, Supplementary Materials www.impactjournals.com/oncotarget/ SUPPLEMENTRY FLES ndividuals factor map (P) FT_ FT_ FT_ Dim (.%) Dim (.%) >% peripheral brain zone () around % interface zone () FT
the reaction was stopped by adding glycine to final concentration 0.2M for 10 minutes at
 Supplemental Material Material and Methods. ChIP. Cells were crosslinked with formaldehyde 0.4% for 10 min at room temperature and the reaction was stopped by adding glycine to final concentration 0.2M