Nature Immunology: doi: /ni Supplementary Figure 1. DNA-methylation machinery is essential for silencing of Cd4 in cytotoxic T cells.
|
|
|
- Thomasina Robertson
- 5 years ago
- Views:
Transcription
1 Supplementary Figure 1 DNA-methylation machinery is essential for silencing of Cd4 in cytotoxic T cells. (a) Scheme for the retroviral shrna screen. (b) Histogram showing CD4 expression (MFI) in WT cytotoxic T cells infected with a Dnmt1 shrna-gfp retrovirus (shaded area) or sham shrna-gfp retrovirus (open area). Representative of 2 independent experiments. (c) Cytotoxic CD4-8 + cells from Dnmt1 Chip/Chip animals were loaded with e670 and cultured in vitro for 4 days after infection with Dnmt1 shrna retroviruses. Virus-infected cells were selected with puromycin. Gates define non-, low-, medium- and highly-cycled cells (i.e. e670 dilution), and the percentage of cells de-repressing CD4 in each gate is indicated. The red line shows the CD4 staining level used to determine de-repression. Representative of 2 independent experiments.
2 Supplementary Figure 2 Reproducibility and coverage of locus-wide bisulfite sequencing. Genomic DNA was prepared from biological replicates of the indicated samples, and then subjected to bisulfite CATCH-seq (Cd4 TSS +/- ~75kb). (a) For each replicate, the fraction methylation at CpG dinucleotides with at least 30x coverage is graphed. Linear regressions were performed (red lines) and R 2 calculated. (b) The median CpG sequencing coverage for the indicated samples is graphed. Error bars represent the 5 th and 95 th percentiles for CpG sequencing coverage.

3 Supplementary Figure 3 Silencer-dependent DMR in the first intron of Cd4.
4 Naïve (Thy1.2 + CD44 lo CD62L + CD25 - ) WT CD4 +, WT CD8 + and Cd4 S4Δ/S4Δ CD cells were isolated from LNs. Their genomic DNA was either isolated immediately or after 5 days of in vitro population expansion, using CFSE-labeling and dilution to identify and sort cells that had completed at least 5 divisions. Genomic DNA was then subjected to CATCH-seq. Percent CpG methylation was graphed on the UCSC genome browser for (a) Chromosome 6, positions 124,746, ,909,000 and (b) Chromosome 6, positions124,814, ,855,000 (UCSC Mus musculus genome assembly mm9). UCSC genes are indicated below the graphs. The samples correspond to those Fig. 2. Biological replicates were derived from two experiments.
 and four amplicons were chosen for methylation-sensitive restriction enzyme")
5 Supplementary Figure 4 Hypermethylation of the Cd4 locus in the cytotoxic lineage and immature T cell progenitors. To confirm locus-wide bisulfite sequencing, two amplicons were chosen for targeted bisulfite sequencing (a-b, d-h) and four amplicons were chosen for methylation-sensitive restriction enzyme digest analysis (c) (locus (not drawn to scale) and CpG analysis map at top:
6 S4: Silencer; black arrow: TSS; lollipops: CpG dinucleotides; blue bars: bisulfite sequencing amplicons; purple arrows: HpaII sites with positions relative to TSS). (a-b) Naïve WT CD4 + and CD8 + T cells were sorted, genomic DNA was prepared and bisulfite treated, and amplicons were cloned and sequenced. Filled circles indicate methylated CpG dinucleotides and empty circles indicate unmethylated CpG dinucleotides. Colored bars correspond to amplicons in map. The 5 and 3 amplicon methylation patterns are shown in (a) and (b), respectively. Data are from 3 mice from two experiments. (c) HpaII digestion of genomic DNA from naïve WT CD4 +, WT CD8 + and Cd4 S4Δ/S4Δ CD8 + T cells was assessed by qpcr at the indicated CpG dinucleotides. HpaII digests only unmethylated-ccgg motifs; thus, percent-undigested DNA corresponds to percent methylation. All samples were normalized to an HpaII-insensitive loading control amplicon in the Cd4 locus. Graphs represent the average (± s.d.) (n=2 for WT CD4 + and WT CD8 + ) or amount of undigested DNA (n=1 for Cd4 S4Δ/S4Δ ) are shown. Data are representative of at least two 2 experiments. Average (± s.d.) of percent methylation from locuswide bisulfite sequencing of biological replicates is presented in the graphs on the left for each CpG (n=2; samples correspond to those in Fig. 2). (d) CFSE-labeled naïve WT CD4 + and CD8 + T cell populations were expanded for 5 d in vitro with anti-cd3, anti-cd28 and IL-2, and cells that had undergone at least 6 divisions were sorted and subjected to bisulfite sequencing of the 3 amplicon (n = 1, one experiment). (e) CFSE-labeled naïve WT CD4 + and CD8 + T cells were injected into Rag2 -/- mice, and 20 days later CFSE-negative cells were sorted (>10 divisions) and subjected to amplicon bisulfite sequencing of the 3 amplicon (n = 1, one experiment). (f) DN3 and WT DP T cells were sorted and the 5 amplicon was sequenced as in (a). (g-h) Bisulfite analysis of the 3 intronic amplicon from WT (g) and Cd4 S4Δ/S4Δ (h) DP cells. (f-h) Data are from 1 (DN3), 2 (Cd4 S4Δ/S4Δ DP) or 3 (DP) mice from three experiments.

7 Supplementary Figure 5 Nucleosome positioning correlates with CD4 expression rather than with DNA methylation. Nuclei from the indicated samples were isolated and treated with micrococcal nuclease, and mono-nucleosome fragments from the Cd4 locus ~ +/-75kb were analyzed by CATCH-seq (without bisulfite treatment). The upper density graphs show nucleosome occupancy (blue = high nucleosome density, white: naked DNA). The lower graphs show coordinate-specific CpG methylation (data from samples in Fig. 2-4; red = hyper-methylation, green = hypo-methylation). Tracks were graphed with the IGV browser platform (Chromosome 6, positions 124,831, ,838,486 (UCSC Mus musculus genome assembly mm9)). For clarity, yellow lines separate CD4 high- and low-expressing samples (above and below, respectively). The red arrowhead indicates a region in which nucleosome paucity is highly correlated with CD4 expression. Replicate samples are from two experiments.
, WT and Cd4 E4PΔ/E4PΔ DP (TCR lo CD24 + CD69 - CD4 + CD8 + ), naïve (Thy1.2 + CD25 CD44 lo CD62L + ) WT CD4 +, WT CD8 +, Cd4 E4PΔ/E4PΔ CD4 + T, and Cd4 S4Δ/S4Δ CD8 + T cells.")
8 Supplementary Figure 6 E4 P controls proximal demethylation events early in T cell development. CATCH-seq was performed on sorted populations of WT DN3 (Thy1.2 + Lin-CD25 + CD44 - ), WT and Cd4 E4PΔ/E4PΔ DP (TCR lo CD24 + CD69 - CD4 + CD8 + ), naïve (Thy1.2 + CD25 CD44 lo CD62L + ) WT CD4 +, WT CD8 +, Cd4 E4PΔ/E4PΔ CD4 + T, and Cd4 S4Δ/S4Δ CD8 + T cells. The heat map depicts percentage CpG methylation from -9270bp to bp relative to the Cd4 TSS (Chromosome 6, positions ; UCSC Mus musculus genome assembly mm9). The approximate location of the region within the Cd4 locus is indicated above (genes, S4 and E4 P are noted), and the lone CpG within the proximal enhancer is indicated below the heat map (green arrow head). Replicates are from 2 independent mice or pools of mice from two independent experiments. 7 CpG dinucleotides in this region experienced complete or partial demethylation at the DN3 to DP transition, and this hypo-methylated state was preserved in mature T cell lineages. E4 P is responsible for de-methylation before the DN3 stage (note Cd4 E4PΔ/E4PΔ DP hyper-methylation compared to DN3 cells), as well as at the DN3 to DP transition (note that DN3 vs. DP differentially methylated CpG dinucleotides are all highly methylated in Cd4 E4PΔ/E4PΔ DP cells).
9 Supplementary Figure 7 Diminished Dnmt1 activity rescues CD4 expression in Cd4 E4PΔ/E4PΔ helper T cells. (a-c) Naïve CD4 + T cells (Thy1.2 + CD25 - CD8 - CD44 lo CD62L + ) from DNMT1-deficient and control mice, both with deletions of E4 P, were CFSE labeled and stimulated in vitro with anti-cd3, anti-cd28 and IL-2. Analysis was performed at 96 h and 120 h, to determine (a) the percentage of CD4 + cells, (b) the MFI of the CD4 + cells, and (c) the percentage of CD4 + cells at each cell division as measured by
10 CFSE dilution. Representative of at least 4 independent experiments. (d-e) CFSE stained Cd4 E4PΔ/E4PΔ CD4 + T cells were stimulated for 24 h with anti-cd3 and anti-cd28, infected with retroviral vectors expressing Puro, RFP and either Dnmt1 shrna in a mir30 context (red, shdnmt1) or an empty mir30 (blue, vector). Transduced cells were maintained with puromycin selection and analyzed by gating for RFP + cells. (a) The percentage of CD4 + cells, as well as the CD4 MFI of CD4 + cells, was measured by flow cytometry at 72 h, 96 h and 120 h. (b) CFSE dilution was used to measure the percentage CD4 + cells in each generation at 72 h, 96 h and 120 h. Representative of at least 4 independent experiments.
11
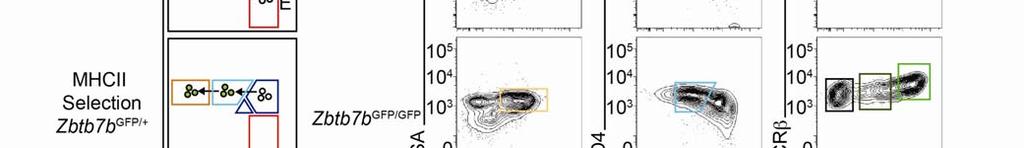
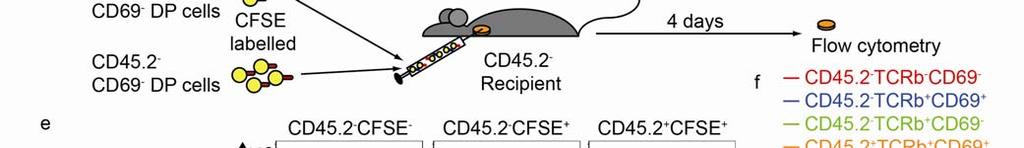
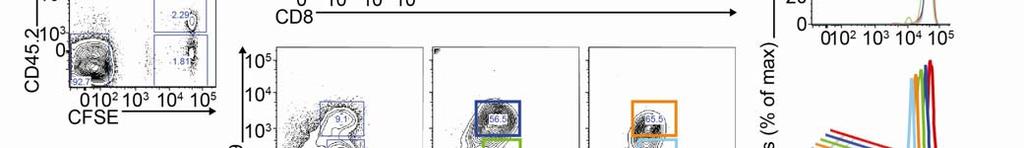
12 Supplementary Figure 8 ThPOK expression and cell division during helper T lineage differentiation. (a) Helper and cytotoxic T cell differentiation can be traced by CD4, CD8 and GFP (from the Zbtb7b GFP allele) expression (Egawa, T. & Littman, D.R. ThPOK acts late in specification of the helper T cell lineage and suppresses Runx-mediated commitment to the cytotoxic T cell lineage. Nat. Immunol. 9, /ni.1652 (2008)). Upon positive selection, DP T cells (A gate) up-regulate CD69 and TCR (not shown) and down-regulate CD8 expression, becoming CD4 + CD8 lo (B gate). MHCI-selected cells then up-regulate CD8 expression (D gate) before finally down-regulating HSA (not shown) and silencing CD4 expression (E gate). MHCII-selected Zbtb7b GFP/+ cells begin to express GFP at the CD4 + CD8 lo stage (green filled circles, B gate), before fully down regulating CD8 and HSA (C gate and not shown). In Zbtb7b GFP/GFP MHCII-selected cells, GFP expression is still induced at the CD4 + CD8 lo stage (green filled circles, B gate), but cells then up-regulate CD8 (D gate) before extinguishing CD4 expression to become GFP + cytotoxic T cells (E gate). (b) To sort CD4 + CD8 lo cells at different stages of helper cell differentiation, we enriched Zbtb7b GFP/+ and Zbtb7b GFP/GFP thymocytes for TCR expression using MACS beads, before sorting HSA + CD69 + CD4 + CD8 lo cells (middle panel) based on Zbtb7b expression: GFP - (MHCI- or early MHCII-selected), GFP mid (MHCII-selected, initiating commitment) and GFP + (MHCII-selected, late commitment). (c) MHCII-selected CD4SP (Zbtb7b GFP/+ ) and CD8SP (Zbtb7b GFP/GFP ) thymocytes were MACS enriched for TCR + expression, before gating of HSA - TCR hi CD69 - GFP + cells and sorting of CD4 + CD8 - and CD4 - CD8 + cells, respectively. (b-c) Stainings are representative of at least 3 experiments. (d) Scheme for thymic injection to assess cell division during helper T cell development. (e-f) 10 6 Tg(TcraTcrb)425Cbn(OT-IItg) + Δ/Δ H2-AbI Δ/Δ CD and 10 7 CD DP cells (HSA + CD69 - CD4 + CD8 + ) were CFSElabeled and injected intra-thymically into CD recipients. Tg(TcraTcrb)425Cbn + Δ/Δ H2-AbI Δ/Δ were used to ensure a homogenous population of unselected DP cells that would differentiate into the helper lineage. After four days, mice were sacrificed and thymocytes were analyzed for phenotype and CFSE dilution. (e) Gating of host and donor-derived cells in recipient thymus at day 4 after injection. (f) CFSE levels in cells from gates indicated in (e). Note that injected DP thymocytes do not dilute CFSE following positive selection. Representative of at least 2 experiments.
Nature Immunology: doi: /ni Supplementary Figure 1. Characteristics of SEs in T reg and T conv cells.
 Supplementary Figure 1 Characteristics of SEs in T reg and T conv cells. (a) Patterns of indicated transcription factor-binding at SEs and surrounding regions in T reg and T conv cells. Average normalized
Supplementary Figure 1 Cytokine receptors on developing thymocytes that can potentially signal Runx3d expression.
 Supplementary Figure 1 Cytokine receptors on developing thymocytes that can potentially signal Runx3d expression. (a) Characterization of c-independent SP8 cells. Stainings for maturation markers (top)
Supplementary Figure 1 IL-27 IL
 Tim-3 Supplementary Figure 1 Tc0 49.5 0.6 Tc1 63.5 0.84 Un 49.8 0.16 35.5 0.16 10 4 61.2 5.53 10 3 64.5 5.66 10 2 10 1 10 0 31 2.22 10 0 10 1 10 2 10 3 10 4 IL-10 28.2 1.69 IL-27 Supplementary Figure 1.
Supplementary Figures
 Supplementary Figures Supplementary Figure 1. Confirmation of Dnmt1 conditional knockout out mice. a, Representative images of sorted stem (Lin - CD49f high CD24 + ), luminal (Lin - CD49f low CD24 + )
Supplementary Materials for
 www.sciencesignaling.org/cgi/content/full/3/114/ra23/dc1 Supplementary Materials for Regulation of Zap70 Expression During Thymocyte Development Enables Temporal Separation of CD4 and CD8 Repertoire Selection
Supplementary Information
 Supplementary Information Supplementary Figure 1! a! b! Nfatc1!! Nfatc1"! P1! P2! pa1! pa2! ex1! ex2! exons 3-9! ex1! ex11!!" #" Nfatc1A!!" Nfatc1B! #"!" Nfatc1C! #" DN1! DN2! DN1!!A! #A!!B! #B!!C! #C!!A!
Nature Immunology: doi: /ni Supplementary Figure 1. Huwe1 has high expression in HSCs and is necessary for quiescence.
 Supplementary Figure 1 Huwe1 has high expression in HSCs and is necessary for quiescence. (a) Heat map visualizing expression of genes with a known function in ubiquitin-mediated proteolysis (KEGG: Ubiquitin
Supplementary Figure 1. Efficiency of Mll4 deletion and its effect on T cell populations in the periphery. Nature Immunology: doi: /ni.
 Supplementary Figure 1 Efficiency of Mll4 deletion and its effect on T cell populations in the periphery. Expression of Mll4 floxed alleles (16-19) in naive CD4 + T cells isolated from lymph nodes and
Nature Structural & Molecular Biology: doi: /nsmb.2419
 Supplementary Figure 1 Mapped sequence reads and nucleosome occupancies. (a) Distribution of sequencing reads on the mouse reference genome for chromosome 14 as an example. The number of reads in a 1 Mb
Supporting Information Table of Contents
 Supporting Information Table of Contents Supporting Information Figure 1 Page 2 Supporting Information Figure 2 Page 4 Supporting Information Figure 3 Page 5 Supporting Information Figure 4 Page 6 Supporting
Nature Immunology: doi: /ni Supplementary Figure 1. Gene expression profile of CD4 + T cells and CTL responses in Bcl6-deficient mice.
 Supplementary Figure 1 Gene expression profile of CD4 + T cells and CTL responses in Bcl6-deficient mice. (a) Gene expression profile in the resting CD4 + T cells were analyzed by an Affymetrix microarray
Supplemental Information. Genomic Characterization of Murine. Monocytes Reveals C/EBPb Transcription. Factor Dependence of Ly6C Cells
 Immunity, Volume 46 Supplemental Information Genomic Characterization of Murine Monocytes Reveals C/EBPb Transcription Factor Dependence of Ly6C Cells Alexander Mildner, Jörg Schönheit, Amir Giladi, Eyal
CD4 + T cells recovered in Rag2 / recipient ( 10 5 ) Heart Lung Pancreas
 Heart Lung Pancreas") a CD4 + T cells recovered in Rag2 / recipient ( 1 5 ) Heart Lung Pancreas.5 1 2 4 6 2 4 6 Ctla4 +/+ Ctla4 / Ctla4 / Lung Ctla4 / Pancreas b Heart Lung Pancreas Ctla4 +/+ Ctla4 / Ctla4 / Lung Ctla4 / Pancreas
a CD4 + T cells recovered in Rag2 / recipient ( 1 5 ) Heart Lung Pancreas.5 1 2 4 6 2 4 6 Ctla4 +/+ Ctla4 / Ctla4 / Lung Ctla4 / Pancreas b Heart Lung Pancreas Ctla4 +/+ Ctla4 / Ctla4 / Lung Ctla4 / Pancreas
Supplemental Figure S1. Tertiles of FKBP5 promoter methylation and internal regulatory region
 Supplemental Figure S1. Tertiles of FKBP5 promoter methylation and internal regulatory region methylation in relation to PSS and fetal coupling. A, PSS values for participants whose placentas showed low,
Supplementary Information. Supplementary Figure 1
 Supplementary Information Supplementary Figure 1 1 Supplementary Figure 1. Functional assay of the hcas9-2a-mcherry construct (a) Gene correction of a mutant EGFP reporter cell line mediated by hcas9 or
Supplementary Figure S1. Gene expression analysis of epidermal marker genes and TP63.
 Supplementary Figure Legends Supplementary Figure S1. Gene expression analysis of epidermal marker genes and TP63. A. Screenshot of the UCSC genome browser from normalized RNAPII and RNA-seq ChIP-seq data
SUPPLEMENTARY INFORMATION. Supp. Fig. 1. Autoimmunity. Tolerance APC APC. T cell. T cell. doi: /nature06253 ICOS ICOS TCR CD28 TCR CD28
 Supp. Fig. 1 a APC b APC ICOS ICOS TCR CD28 mir P TCR CD28 P T cell Tolerance Roquin WT SG Icos mrna T cell Autoimmunity Roquin M199R SG Icos mrna www.nature.com/nature 1 Supp. Fig. 2 CD4 + CD44 low CD4
Supplemental Figure 1. Protein L
 Supplemental Figure 1 Protein L m19delta T m1928z T Suppl. Fig 1. Expression of CAR: B6-derived T cells were transduced with m19delta (left) and m1928z (right) to generate CAR T cells and transduction
Lentiviral Delivery of Combinatorial mirna Expression Constructs Provides Efficient Target Gene Repression.
 Supplementary Figure 1 Lentiviral Delivery of Combinatorial mirna Expression Constructs Provides Efficient Target Gene Repression. a, Design for lentiviral combinatorial mirna expression and sensor constructs.
7SK ChIRP-seq is specifically RNA dependent and conserved between mice and humans.
 Supplementary Figure 1 7SK ChIRP-seq is specifically RNA dependent and conserved between mice and humans. Regions targeted by the Even and Odd ChIRP probes mapped to a secondary structure model 56 of the
Transcriptional control of CD4 and CD8 coreceptor expression during T cell development
 Cell. Mol. Life Sci. (2013) 70:4537 4553 DOI 10.1007/s00018-013-1393-2 Cellular and Molecular Life Sciences Review Transcriptional control of CD4 and CD8 coreceptor expression during T cell development
a) List of KMTs targeted in the shrna screen. The official symbol, KMT designation,
 List of KMTs targeted in the shrna screen. The official symbol, KMT designation,") Supplementary Information Supplementary Figures Supplementary Figure 1. a) List of KMTs targeted in the shrna screen. The official symbol, KMT designation, gene ID and specifities are provided. Those highlighted
Supplementary Information Supplementary Figures Supplementary Figure 1. a) List of KMTs targeted in the shrna screen. The official symbol, KMT designation, gene ID and specifities are provided. Those highlighted
Supplemental Information. Aryl Hydrocarbon Receptor Controls. Monocyte Differentiation. into Dendritic Cells versus Macrophages
 Immunity, Volume 47 Supplemental Information Aryl Hydrocarbon Receptor Controls Monocyte Differentiation into Dendritic Cells versus Macrophages Christel Goudot, Alice Coillard, Alexandra-Chloé Villani,
Computational Analysis of UHT Sequences Histone modifications, CAGE, RNA-Seq
 Computational Analysis of UHT Sequences Histone modifications, CAGE, RNA-Seq Philipp Bucher Wednesday January 21, 2009 SIB graduate school course EPFL, Lausanne ChIP-seq against histone variants: Biological
SUPPLEMENT Supplementary Figure 1: (A) (B)
 (B)") SUPPLEMENT Supplementary Figure 1: CD4 + naïve effector T cells (CD4 effector) were labeled with CFSE, stimulated with α-cd2/cd3/cd28 coated beads (at 2 beads/cell) and cultured alone or cocultured with
SUPPLEMENT Supplementary Figure 1: CD4 + naïve effector T cells (CD4 effector) were labeled with CFSE, stimulated with α-cd2/cd3/cd28 coated beads (at 2 beads/cell) and cultured alone or cocultured with
Nature Immunology: doi: /ni Supplementary Figure 1 33,312. Aire rep 1. Aire rep 2 # 44,325 # 44,055. Aire rep 1. Aire rep 2.
 a 33,312 b rep 1 rep 1 # 44,325 rep 2 # 44,055 [0-84] rep 2 [0-84] 1810043G02Rik Pfkl Dnmt3l Icosl rep 1 [0-165] rep 2 [0-165] Rps14 Cd74 Mir5107 Tcof1 rep 1 [0-69] rep 2 [0-68] Id3 E2f2 Asap3 rep 1 [0-141]
Supplemental Figure 1
 Supplemental Figure 1 1a 1c PD-1 MFI fold change 6 5 4 3 2 1 IL-1α IL-2 IL-4 IL-6 IL-1 IL-12 IL-13 IL-15 IL-17 IL-18 IL-21 IL-23 IFN-α Mut Human PD-1 promoter SBE-D 5 -GTCTG- -1.2kb SBE-P -CAGAC- -1.kb
activation with anti-cd3/cd28 beads and 3d following transduction. Supplemental Figure 2 shows
 Supplemental Data Supplemental Figure 1 compares CXCR4 expression in untreated CD8 + T cells, following activation with anti-cd3/cd28 beads and 3d following transduction. Supplemental Figure 2 shows the
Gene+c fate mapping. x loxp. Foxp3 3 UTR ROSA26 RFP IRES GFP CRE. STOP loxp. Stable Foxp3 expression. Foxp3 expression in new Treg.
 1 Introduc+on (CD4 + CD25 + Foxp3 + )are indispensable for immune homeostasis. Muta+ons in Foxp3 gene leads to fatal autoimmune disorder. Condi+onal dele+on of Foxp3 reprograms cells into pathogenic Th
5/1/13. The proportion of thymus that produces T cells decreases with age. The cellular organization of the thymus
 T cell precursors migrate from the bone marrow via the blood to the thymus to mature 1 2 The cellular organization of the thymus The proportion of thymus that produces T cells decreases with age 3 4 1
Supplemental Figure S1. Expression of Cirbp mrna in mouse tissues and NIH3T3 cells.
 SUPPLEMENTAL FIGURE AND TABLE LEGENDS Supplemental Figure S1. Expression of Cirbp mrna in mouse tissues and NIH3T3 cells. A) Cirbp mrna expression levels in various mouse tissues collected around the clock
Supplementary Fig. 1 No relative growth advantage of Foxp3 negative cells.
 Supplementary Fig. 1 Supplementary Figure S1: No relative growth advantage of Foxp3 negative cells. itreg were induced from WT (A) or FIR (B) CD4 + T cells. FIR itregs were then removed from the TCR signal
Nature Immunology: doi: /ni Supplementary Figure 1. Transcriptional program of the TE and MP CD8 + T cell subsets.
 Supplementary Figure 1 Transcriptional program of the TE and MP CD8 + T cell subsets. (a) Comparison of gene expression of TE and MP CD8 + T cell subsets by microarray. Genes that are 1.5-fold upregulated
T cell development October 28, Dan Stetson
 T cell development October 28, 2016 Dan Stetson stetson@uw.edu 441 Lecture #13 Slide 1 of 29 Three lectures on T cells (Chapters 8, 9) Part 1 (Today): T cell development in the thymus Chapter 8, pages
Tbk1-TKO! DN cells (%)! 15! 10!
! 15! 10!") a! T Cells! TKO! B Cells! TKO! b! CD4! 8.9 85.2 3.4 2.88 CD8! Tbk1-TKO! 1.1 84.8 2.51 2.54 c! DN cells (%)! 4 3 2 1 DP cells (%)! 9 8 7 6 CD4 + SP cells (%)! 5 4 3 2 1 5 TKO! TKO! TKO! TKO! 15 1 5 CD8
a! T Cells! TKO! B Cells! TKO! b! CD4! 8.9 85.2 3.4 2.88 CD8! Tbk1-TKO! 1.1 84.8 2.51 2.54 c! DN cells (%)! 4 3 2 1 DP cells (%)! 9 8 7 6 CD4 + SP cells (%)! 5 4 3 2 1 5 TKO! TKO! TKO! TKO! 15 1 5 CD8
Supplementary. presence of the. (c) mrna expression. Error. in naive or
 mrna expression. Error. in naive or") Figure 1. (a) Naive CD4 + T cells were activated in the presence of the indicated cytokines for 3 days. Enpp2 mrna expression was measured by qrt-pcrhr, infected with (b, c) Naive CD4 + T cells were activated
Figure 1. (a) Naive CD4 + T cells were activated in the presence of the indicated cytokines for 3 days. Enpp2 mrna expression was measured by qrt-pcrhr, infected with (b, c) Naive CD4 + T cells were activated
DNA methylation & demethylation
 DNA methylation & demethylation Lars Schomacher (Group Christof Niehrs) What is Epigenetics? Epigenetics is the study of heritable changes in gene expression (active versus inactive genes) that do not
SUPPLEMENTARY FIGURES
 SUPPLEMENTARY FIGURES 1 Supplementary Figure 1, Adult hippocampal QNPs and TAPs uniformly express REST a-b) Confocal images of adult hippocampal mouse sections showing GFAP (green), Sox2 (red), and REST
Nature Immunology: doi: /ni.3412
 Supplementary Figure 1 Gata1 expression in heamatopoietic stem and progenitor populations. (a) Unsupervised clustering according to 100 top variable genes across single pre-gm cells. The two main cell
Nature Immunology: doi: /ni Supplementary Figure 1. Cellularity of leukocytes and their progenitors in naive wild-type and Spp1 / mice.
 Supplementary Figure 1 Cellularity of leukocytes and their progenitors in naive wild-type and Spp1 / mice. (a, b) Gating strategies for differentiated cells including PMN (CD11b + Ly6G hi and CD11b + Ly6G
Supplementary Figure 1. Using DNA barcode-labeled MHC multimers to generate TCR fingerprints
 Supplementary Figure 1 Using DNA barcode-labeled MHC multimers to generate TCR fingerprints (a) Schematic overview of the workflow behind a TCR fingerprint. Each peptide position of the original peptide
Nature Neuroscience: doi: /nn Supplementary Figure 1. Neuron class-specific arrangements of Khc::nod::lacZ label in dendrites.
 Supplementary Figure 1 Neuron class-specific arrangements of Khc::nod::lacZ label in dendrites. Staining with fluorescence antibodies to detect GFP (Green), β-galactosidase (magenta/white). (a, b) Class
What determines the CD4:CD8 T cell ratio in the immune system?
 What determines the CD4:CD8 T cell ratio in the immune system? Insights from genetic and mathematical modelling of thymocyte development Benedict Seddon 1 Cell of the immune system 2 Maintaining homeostasis
MODULE 4: SPLICING. Removal of introns from messenger RNA by splicing
 Last update: 05/10/2017 MODULE 4: SPLICING Lesson Plan: Title MEG LAAKSO Removal of introns from messenger RNA by splicing Objectives Identify splice donor and acceptor sites that are best supported by
Supplementary Figure S1. PTPN2 levels are not altered in proliferating CD8+ T cells. Lymph node (LN) CD8+ T cells from C57BL/6 mice were stained with
 CD8+ T cells from C57BL/6 mice were stained with") Supplementary Figure S1. PTPN2 levels are not altered in proliferating CD8+ T cells. Lymph node (LN) CD8+ T cells from C57BL/6 mice were stained with CFSE and stimulated with plate-bound α-cd3ε (10µg/ml)
Supplementary Figure S1. PTPN2 levels are not altered in proliferating CD8+ T cells. Lymph node (LN) CD8+ T cells from C57BL/6 mice were stained with CFSE and stimulated with plate-bound α-cd3ε (10µg/ml)
% of live splenocytes. STAT5 deletion. (open shapes) % ROSA + % floxed
 % ROSA + % floxed") Supp. Figure 1. a 14 1 1 8 6 spleen cells (x1 6 ) 16 % of live splenocytes 5 4 3 1 % of live splenocytes 8 6 4 b 1 1 c % of CD11c + splenocytes (closed shapes) 8 6 4 8 6 4 % ROSA + (open shapes) % floxed
Supp. Figure 1. a 14 1 1 8 6 spleen cells (x1 6 ) 16 % of live splenocytes 5 4 3 1 % of live splenocytes 8 6 4 b 1 1 c % of CD11c + splenocytes (closed shapes) 8 6 4 8 6 4 % ROSA + (open shapes) % floxed
Nature Structural & Molecular Biology: doi: /nsmb Supplementary Figure 1
 Supplementary Figure 1 Effect of HSP90 inhibition on expression of endogenous retroviruses. (a) Inducible shrna-mediated Hsp90 silencing in mouse ESCs. Immunoblots of total cell extract expressing the
SUPPLEMENTARY INFORMATION
 doi:10.1038/nature10866 a b 1 2 3 4 5 6 7 Match No Match 1 2 3 4 5 6 7 Turcan et al. Supplementary Fig.1 Concepts mapping H3K27 targets in EF CBX8 targets in EF H3K27 targets in ES SUZ12 targets in ES
SUPPLEMENTAL INFORMATION
 SUPPLEMENTAL INFORMATION GO term analysis of differentially methylated SUMIs. GO term analysis of the 458 SUMIs with the largest differential methylation between human and chimp shows that they are more
Sirt1 Hmg20b Gm (0.17) 24 (17.3) 877 (857)
 24 (17.3) 877 (857)") 3 (0.17) 24 (17.3) Sirt1 Hmg20 Gm4763 877 (857) c d Suppl. Figure 1. Screen validation for top candidate antagonists of Dot1L (a) Numer of genes with one (gray), two (cyan) or three (red) shrna scored
3 (0.17) 24 (17.3) Sirt1 Hmg20 Gm4763 877 (857) c d Suppl. Figure 1. Screen validation for top candidate antagonists of Dot1L (a) Numer of genes with one (gray), two (cyan) or three (red) shrna scored
fl/+ KRas;Atg5 fl/+ KRas;Atg5 fl/fl KRas;Atg5 fl/fl KRas;Atg5 Supplementary Figure 1. Gene set enrichment analyses. (a) (b)
 (b)") KRas;At KRas;At KRas;At KRas;At a b Supplementary Figure 1. Gene set enrichment analyses. (a) GO gene sets (MSigDB v3. c5) enriched in KRas;Atg5 fl/+ as compared to KRas;Atg5 fl/fl tumors using gene set
KRas;At KRas;At KRas;At KRas;At a b Supplementary Figure 1. Gene set enrichment analyses. (a) GO gene sets (MSigDB v3. c5) enriched in KRas;Atg5 fl/+ as compared to KRas;Atg5 fl/fl tumors using gene set
Supplementary Figure 1. Double-staining immunofluorescence analysis of invasive colon and breast cancers. Specimens from invasive ductal breast
 Supplementary Figure 1. Double-staining immunofluorescence analysis of invasive colon and breast cancers. Specimens from invasive ductal breast carcinoma (a) and colon adenocarcinoma (b) were staining
Supplementary Figure 1. Nature Neuroscience: doi: /nn.4547
 Supplementary Figure 1 Characterization of the Microfetti mouse model. (a) Gating strategy for 8-color flow analysis of peripheral Ly-6C + monocytes from Microfetti mice 5-7 days after TAM treatment. Living
SUPPLEMENTARY INFORMATION
 -. -. SUPPLEMENTARY INFORMATION DOI: 1.1/ncb86 a WAT-1 WAT- BAT-1 BAT- sk-muscle-1 sk-muscle- mir-133b mir-133a mir-6 mir-378 mir-1 mir-85 mir-378 mir-6a mir-18 mir-133a mir- mir- mir-341 mir-196a mir-17
The development of T cells in the thymus
 T cells rearrange their receptors in the thymus whereas B cells do so in the bone marrow. The development of T cells in the thymus The lobular/cellular organization of the thymus Immature cells are called
SUPPLEMENTARY INFORMATION
 doi:1.138/nature1554 a TNF-α + in CD4 + cells [%] 1 GF SPF 6 b IL-1 + in CD4 + cells [%] 5 4 3 2 1 Supplementary Figure 1. Effect of microbiota on cytokine profiles of T cells in GALT. Frequencies of TNF-α
Nature Immunology: doi: /ni Supplementary Figure 1. Id2 and Id3 define polyclonal T H 1 and T FH cell subsets.
 Supplementary Figure 1 Id2 and Id3 define polyclonal T H 1 and T FH cell subsets. Id2 YFP/+ (a) or Id3 GFP/+ (b) mice were analyzed 7 days after LCMV infection. T H 1 (SLAM + CXCR5 or CXCR5 PD-1 ), T FH
Supplemental Information. CD4 + CD25 + Foxp3 + Regulatory T Cells Promote. Th17 Cells In Vitro and Enhance Host Resistance
 Immunity, Volume 34 Supplemental Information D4 + D25 + + Regulatory T ells Promote Th17 ells In Vitro and Enhance Host Resistance in Mouse andida albicans Th17 ell Infection Model Pushpa Pandiyan, Heather
Supplementary Materials for
 www.sciencesignaling.org/cgi/content/full/8/375/ra41/dc1 Supplementary Materials for Actin cytoskeletal remodeling with protrusion formation is essential for heart regeneration in Hippo-deficient mice
Nature Neuroscience: doi: /nn Supplementary Figure 1. Behavioral training.
 Supplementary Figure 1 Behavioral training. a, Mazes used for behavioral training. Asterisks indicate reward location. Only some example mazes are shown (for example, right choice and not left choice maze
and follicular helper T cells is Egr2-dependent. (a) Diagrammatic representation of the
 Diagrammatic representation of the") Supplementary Figure 1. LAG3 + Treg-mediated regulation of germinal center B cells and follicular helper T cells is Egr2-dependent. (a) Diagrammatic representation of the experimental protocol for the
Supplementary Figure 1. LAG3 + Treg-mediated regulation of germinal center B cells and follicular helper T cells is Egr2-dependent. (a) Diagrammatic representation of the experimental protocol for the
Nature Genetics: doi: /ng Supplementary Figure 1. SEER data for male and female cancer incidence from
 Supplementary Figure 1 SEER data for male and female cancer incidence from 1975 2013. (a,b) Incidence rates of oral cavity and pharynx cancer (a) and leukemia (b) are plotted, grouped by males (blue),
Supplementary Figure 1 Protease allergens induce IgE and IgG1 production. (a-c)
") 1 Supplementary Figure 1 Protease allergens induce IgE and IgG1 production. (a-c) Serum IgG1 (a), IgM (b) and IgG2 (c) concentrations in response to papain immediately before primary immunization (day
1 Supplementary Figure 1 Protease allergens induce IgE and IgG1 production. (a-c) Serum IgG1 (a), IgM (b) and IgG2 (c) concentrations in response to papain immediately before primary immunization (day
The autoimmune disease-associated PTPN22 variant promotes calpain-mediated Lyp/Pep
 SUPPLEMENTARY INFORMATION The autoimmune disease-associated PTPN22 variant promotes calpain-mediated Lyp/Pep degradation associated with lymphocyte and dendritic cell hyperresponsiveness Jinyi Zhang, Naima
Supplemental Materials
 Supplemental Materials Programmed death one homolog maintains the pool size of regulatory T cells by promoting their differentiation and stability Qi Wang 1, Jianwei He 1, Dallas B. Flies 2, Liqun Luo
Nature Medicine: doi: /nm.2109
 HIV 1 Infects Multipotent Progenitor Cells Causing Cell Death and Establishing Latent Cellular Reservoirs Christoph C. Carter, Adewunmi Onafuwa Nuga, Lucy A. M c Namara, James Riddell IV, Dale Bixby, Michael
Supplementary Materials for
 advances.sciencemag.org/cgi/content/full/1/8/e1500296/dc1 Supplementary Materials for Transcriptional regulation of APOBEC3 antiviral immunity through the CBF- /RUNX axis This PDF file includes: Brett
Supplementary Fig. 1 p38 MAPK negatively regulates DC differentiation. (a) Western blot analysis of p38 isoform expression in BM cells, immature DCs
 Western blot analysis of p38 isoform expression in BM cells, immature DCs") Supplementary Fig. 1 p38 MAPK negatively regulates DC differentiation. (a) Western blot analysis of p38 isoform expression in BM cells, immature DCs (idcs) and mature DCs (mdcs). A myeloma cell line expressing
Supplementary Fig. 1 p38 MAPK negatively regulates DC differentiation. (a) Western blot analysis of p38 isoform expression in BM cells, immature DCs (idcs) and mature DCs (mdcs). A myeloma cell line expressing
SUPPLEMENTARY INFORMATION
 a. Smo+/+ b. Smo+/+ 5.63 5.48 c. Lin- d. e. 6 5 4 3 Ter119 Mac B T Sca1 Smo+/+ 25 15 2 o BMT 2 1 5 * Supplementary Figure 1: Deletion of Smoothened does not alter the frequency of hematopoietic lineages
High Throughput Sequence (HTS) data analysis. Lei Zhou
 data analysis. Lei Zhou") High Throughput Sequence (HTS) data analysis Lei Zhou (leizhou@ufl.edu) High Throughput Sequence (HTS) data analysis 1. Representation of HTS data. 2. Visualization of HTS data. 3. Discovering genomic
High Throughput Sequence (HTS) data analysis Lei Zhou (leizhou@ufl.edu) High Throughput Sequence (HTS) data analysis 1. Representation of HTS data. 2. Visualization of HTS data. 3. Discovering genomic
Supplementary Figure 1. mrna expression of chitinase and chitinase-like protein in splenic immune cells. Each splenic immune cell population was
 Supplementary Figure 1. mrna expression of chitinase and chitinase-like protein in splenic immune cells. Each splenic immune cell population was sorted by FACS. Surface markers for sorting were CD11c +
Development of all CD4 T lineages requires nuclear factor TOX
 ARTICLE Development of all CD4 T lineages requires nuclear factor TOX Parinaz Aliahmad and Jonathan Kaye Department of Immunology, The Scripps Research Institute, La Jolla, CA 92037 The Journal of Experimental
Nature Genetics: doi: /ng Supplementary Figure 1. HOX fusions enhance self-renewal capacity.
 Supplementary Figure 1 HOX fusions enhance self-renewal capacity. Mouse bone marrow was transduced with a retrovirus carrying one of three HOX fusion genes or the empty mcherry reporter construct as described
IKK-dependent activation of NF-κB contributes to myeloid and lymphoid leukemogenesis by BCR-ABL1
 Supplemental Figures BLOOD/2014/547943 IKK-dependent activation of NF-κB contributes to myeloid and lymphoid leukemogenesis by BCR-ABL1 Hsieh M-Y and Van Etten RA Supplemental Figure S1. Titers of retroviral
D CD8 T cell number (x10 6 )
") IFNγ Supplemental Figure 1. CD T cell number (x1 6 ) 18 15 1 9 6 3 CD CD T cells CD6L C CD5 CD T cells CD6L D CD8 T cell number (x1 6 ) 1 8 6 E CD CD8 T cells CD6L F Log(1)CFU/g Feces 1 8 6 p
IFNγ Supplemental Figure 1. CD T cell number (x1 6 ) 18 15 1 9 6 3 CD CD T cells CD6L C CD5 CD T cells CD6L D CD8 T cell number (x1 6 ) 1 8 6 E CD CD8 T cells CD6L F Log(1)CFU/g Feces 1 8 6 p
SUPPLEMENTARY INFORMATION
 doi: 1.138/nature775 4 O.D. (595-655) 3 1 -ζ no antibody isotype ctrl Plated Soluble 1F6 397 7H11 Supplementary Figure 1 Soluble and plated anti- Abs induce -! signalling. B3Z cells stably expressing!
Peli1 negatively regulates T-cell activation and prevents autoimmunity
 Peli1 negatively regulates T-cell activation and prevents autoimmunity Mikyoung Chang 1,*, Wei Jin 1,5,*, Jae-Hoon Chang 1, Yi-chuan Xiao 1, George Brittain 1, Jiayi Yu 1, Xiaofei Zhou 1, Yi-Hong Wang
SUPPLEMENTARY FIGURES
 SUPPLEMENTARY FIGURES Supplementary Figure 1: Chemokine receptor expression profiles of CCR6 + and CCR6 - CD4 + IL-17A +/ex and Treg cells. Quantitative PCR analysis of chemokine receptor transcript abundance
Nature Genetics: doi: /ng Supplementary Figure 1. Assessment of sample purity and quality.
 Supplementary Figure 1 Assessment of sample purity and quality. (a) Hematoxylin and eosin staining of formaldehyde-fixed, paraffin-embedded sections from a human testis biopsy collected concurrently with
Development of B and T lymphocytes
 Development of B and T lymphocytes What will we discuss today? B-cell development T-cell development B- cell development overview Stem cell In periphery Pro-B cell Pre-B cell Immature B cell Mature B cell
Supplementary Figure S1: Alignment of CD28H. (a) Alignment of human CD28H with other known B7 receptors. (b) Alignment of CD28H orthologs.
 Alignment of human CD28H with other known B7 receptors. (b) Alignment of CD28H orthologs.") Supplementary Figure S1: Alignment of CD28H. (a) Alignment of human CD28H with other known B7 receptors. (b) Alignment of CD28H orthologs. Predicted CD28H protein sequences from human, chimpanzee (pan
Supplementary Figure S1: Alignment of CD28H. (a) Alignment of human CD28H with other known B7 receptors. (b) Alignment of CD28H orthologs. Predicted CD28H protein sequences from human, chimpanzee (pan
Supplementary Information. Tissue-wide immunity against Leishmania. through collective production of nitric oxide
 Supplementary Information Tissue-wide immunity against Leishmania through collective production of nitric oxide Romain Olekhnovitch, Bernhard Ryffel, Andreas J. Müller and Philippe Bousso Supplementary
E Protein Transcription Factors Are Required for the Development of CD4 + Lineage T Cells
 Article E Protein Transcription Factors Are Required for the Development of CD4 + Lineage T Cells Mary Elizabeth Jones-Mason, 1 Xudong Zhao, 2 Dietmar Kappes, 6 Anna Lasorella, 2,3,4 Antonio Iavarone,
Analysis of shotgun bisulfite sequencing of cancer samples
 Analysis of shotgun bisulfite sequencing of cancer samples Kasper Daniel Hansen Postdoc with Rafael Irizarry Johns Hopkins Bloomberg School of Public Health Brixen, July 1st, 2011 The
Supplemental Table S1
 Supplemental Table S. Tumorigenicity and metastatic potential of 44SQ cell subpopulations a Tumorigenicity b Average tumor volume (mm ) c Lung metastasis d CD high /4 8. 8/ CD low /4 6./ a Mice were injected
B6.SJL (Ly5.2) mice were obtained from Taconic Farms. Rag1-deficient mice were
 mice were obtained from Taconic Farms. Rag1-deficient mice were") Supplementary Methods Mice. B6.SJL (Ly5.2) mice were obtained from Taconic Farms. Rag1-deficient mice were purchased from The Jackson Laboratory. Real-time PCR Total cellular RNA was extracted from the
Supplementary Methods Mice. B6.SJL (Ly5.2) mice were obtained from Taconic Farms. Rag1-deficient mice were purchased from The Jackson Laboratory. Real-time PCR Total cellular RNA was extracted from the
Supplementary Figure 1. Successful excision of genes from WBM lysates and
 Supplementary Information: Supplementary Figure 1. Successful excision of genes from WBM lysates and survival of mice with different genotypes. (a) The proper excision of Pten, p110α, p110α and p110δ was
Supplementary Figure 1: Features of IGLL5 Mutations in CLL: a) Representative IGV screenshot of first
 Representative IGV screenshot of first") Supplementary Figure 1: Features of IGLL5 Mutations in CLL: a) Representative IGV screenshot of first intron IGLL5 mutation depicting biallelic mutations. Red arrows highlight the presence of out of phase
Supplementary Figure 1: Features of IGLL5 Mutations in CLL: a) Representative IGV screenshot of first intron IGLL5 mutation depicting biallelic mutations. Red arrows highlight the presence of out of phase
SUPPLEMENTARY INFORMATION
 Complete but curtailed T-cell response to very-low-affinity antigen Dietmar Zehn, Sarah Y. Lee & Michael J. Bevan Supp. Fig. 1: TCR chain usage among endogenous K b /Ova reactive T cells. C57BL/6 mice
Nature Neuroscience: doi: /nn Supplementary Figure 1. MADM labeling of thalamic clones.
 Supplementary Figure 1 MADM labeling of thalamic clones. (a) Confocal images of an E12 Nestin-CreERT2;Ai9-tdTomato brain treated with TM at E10 and stained for BLBP (green), a radial glial progenitor-specific
CD90 + Human Dermal Stromal Cells Are Potent Inducers of FoxP3 + Regulatory T Cells
 CD90 + Human Dermal Stromal Cells Are Potent Inducers of FoxP3 + Regulatory T Cells Karin Pfisterer, Karoline M Lipnik, Erhard Hofer and Adelheid Elbe-Bürger Journal of Investigative Dermatology (2015)
Akt and mtor pathways differentially regulate the development of natural and inducible. T H 17 cells
 Akt and mtor pathways differentially regulate the development of natural and inducible T H 17 cells Jiyeon S Kim, Tammarah Sklarz, Lauren Banks, Mercy Gohil, Adam T Waickman, Nicolas Skuli, Bryan L Krock,
Kerdiles et al - Figure S1
 Kerdiles et al - Figure S1 a b Homo sapiens T B ce ce l ls c l M ls ac r PM oph N ag es Mus musculus Foxo1 PLCγ Supplementary Figure 1 Foxo1 expression pattern is conserved between mouse and human. (a)
Nature Genetics: doi: /ng Supplementary Figure 1
 Supplementary Figure 1 MSI2 interactors are associated with the riboproteome and are functionally relevant. (a) Coomassie blue staining of FLAG-MSI2 immunoprecipitated complexes. (b) GO analysis of MSI2-interacting
Breeding scheme, transgenes, histological analysis and site distribution of SB-mutagenized osteosarcoma.
 Supplementary Figure 1 Breeding scheme, transgenes, histological analysis and site distribution of SB-mutagenized osteosarcoma. (a) Breeding scheme. R26-LSL-SB11 homozygous mice were bred to Trp53 LSL-R270H/+
Modulation de la différenciation lymphocytaire T par thérapie cellulaire et génique dans le thymus. Valérie Zimmermann
 Modulation de la différenciation lymphocytaire T par thérapie cellulaire et génique dans le thymus Valérie Zimmermann Thymopoiesis Bone Marrow 2-28 days Thymus Periphery Hematopoietic progenitor Hematopoietic
T Cell Development. Xuefang Cao, MD, PhD. November 3, 2015
 T Cell Development Xuefang Cao, MD, PhD November 3, 2015 Thymocytes in the cortex of the thymus Early thymocytes development Positive and negative selection Lineage commitment Exit from the thymus and
L1 on PyMT tumor cells but Py117 cells are more responsive to IFN-γ. (A) Flow
 Flow") A MHCI B PD-L1 Fold expression 8 6 4 2 Fold expression 3 2 1 No tx 1Gy 2Gy IFN Py117 Py117 Supplementary Figure 1. Radiation and IFN-γ enhance MHCI expression and PD- L1 on PyMT tumor cells but Py117 cells
A MHCI B PD-L1 Fold expression 8 6 4 2 Fold expression 3 2 1 No tx 1Gy 2Gy IFN Py117 Py117 Supplementary Figure 1. Radiation and IFN-γ enhance MHCI expression and PD- L1 on PyMT tumor cells but Py117 cells
The Insulator Binding Protein CTCF Positions 20 Nucleosomes around Its Binding Sites across the Human Genome
 The Insulator Binding Protein CTCF Positions 20 Nucleosomes around Its Binding Sites across the Human Genome Yutao Fu 1, Manisha Sinha 2,3, Craig L. Peterson 3, Zhiping Weng 1,4,5 * 1 Bioinformatics Program,
Generation of ST2-GFP reporter mice and characterization of ILC1 cells following infection
 Supplementary Figure 1 Generation of ST2-GFP reporter mice and characterization of ILC1 cells following infection with influenza virus. (a) ST2-GFP reporter mice were generated as described in Methods.