Supplementary Figure 1. Estimation of tumour content
|
|
|
- Maude Ellis
- 5 years ago
- Views:
Transcription

1 Supplementary Figure 1. Estimation of tumour content a, Approach used to estimate the tumour content in S13T1/T2, S6T1/T2, S3T1/T2 and S12T1/T2. Tissue and tumour areas were evaluated by two independent pathologist on three 2 μm-thick sections at the beginning, in the middle and at the end of the tissue block. The tumour content of these sections was calculated as the percentage of tumour area over the total tissue area. b, Approach used to estimate the tumour content in UH1T1/T2, UH2T1/T2, UH5T1/T2, UH6T1/T2, UH8T1/T2 and UH11T1/T2. Two μm-thick FFPE section at the beginning of the block was stained for haematoxylin and eosin and the tumour area was delimited by pathologist. This was used as a reference to macrodissect the tumour. 1
 were performed for both tumours of patients S13, S6, S3 and S12.")
2 Supplementary Figure 2. Sequencing throughput a, Percentage of reads retained at each filtering steps over the total number of aligned sequencing reads. Two distinct exome sequencing rounds (r1 and r2) were performed for both tumours of patients S13, S6, S3 and S12. b, Percentage of targeted base pairs that were sequenced at different depth of coverage. 2
3 Supplementary Figure 3. Variant calling pipelines a, Identification of somatic mutations in tumours of patients UH1, UH2, UH5, UH6, UH8 and UH11. Mutations were called and filtered based on quality metrics on tumour and matched normal independently. Somatic mutations were then identified as tumour-specific mutations and all manually inspected. b, Identification of germline mutations in normal samples of patients S13, S6, S3, and S12 that underwent two rounds of whole exome sequencing. Mutations were first called and filtered for quality in each sequencing round and then merged into a single set. 3
4 c, Identification of somatic mutations in tumours of patients S13, S6, S3, and S12 that underwent two rounds of whole exome sequencing. Mutations were called and filtered for quality in each experiment independently and retained only if found in the other sequencing round. The two confirmed sets were merged, somatic mutations were identified as tumourspecific mutations and manually inspected. 4

5 Supplementary Figure 4. Signatures of somatic and germline mutations a, Average percentage of base substitutions in FFPE tumours sequenced in this study and fresh frozen colorectal cancers collected from TCGA. The mutational signature is the most prevalent in CRC 1. b, Average percentage of base substitutions in normal DNA from FFPE blocks, from blood sequenced in this study and from TCGA samples. The mutational signature is in agreement with previous report 2. 5
6 Supplementary Figure 5. Coverage of mutated sites in paired lesions For each patient, reported are the allele frequency of somatic mutations in one tumour and the depth of coverage of the corresponding position in the other tumour. 6

7 Supplementary Figure 6. Altered cancer genes in lesions of patients S3, S12, UH5 a, Mutations in APC found in tumours of patients S3 and S12. Mutations are indicated according to the Human Genome Variation Society ( 7
8 b, Allele-specific copy number of all assayed loci in tumours of patients S3, S12 and UH5. Alleles with highest copy number (A) and with lowest copy number (B) are shown. Highlighted are chromosomes with shared caner genes between paired lesions of a patient. 8
9 Supplementary Figure 7. Allele frequency in whole exome and deep sequencing Allele frequencies of somatic mutations in 151 cancer genes in tumours of patients UH1, UH2 and UH11 as detected by whole exome and deep sequencing. Pearson s correlation coefficient (R) and the corresponding p-value are reported. 9


10 Supplementary Figure 8. Clone composition of sycrcs 10
11 11
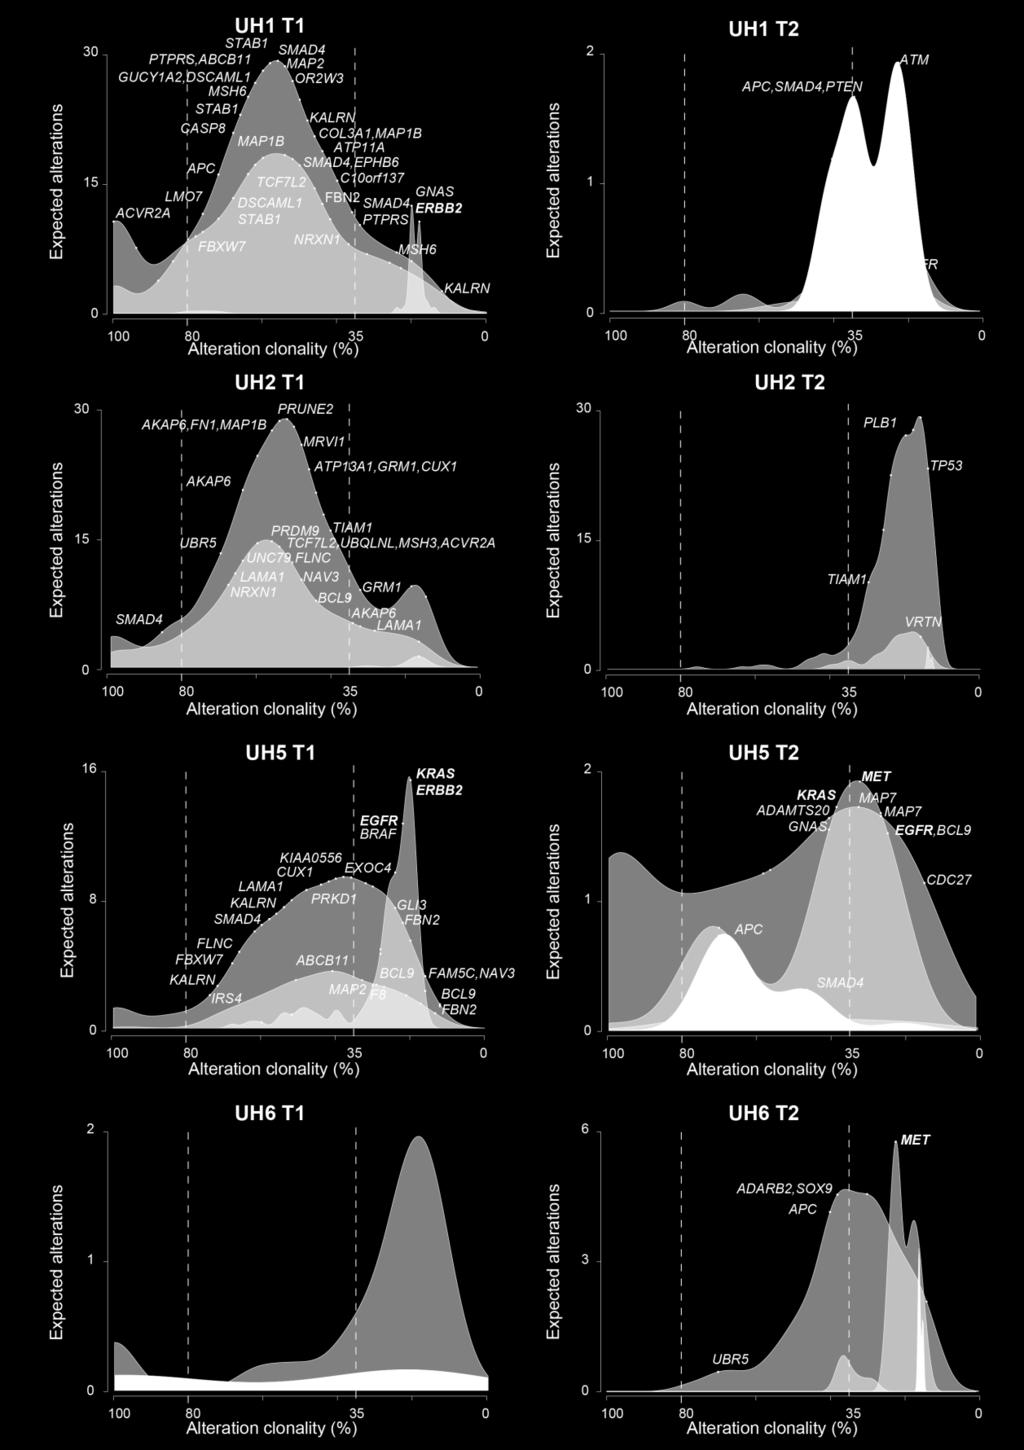
 is reported. Dots represent driver alterations in known colorectal cancer genes. 12")
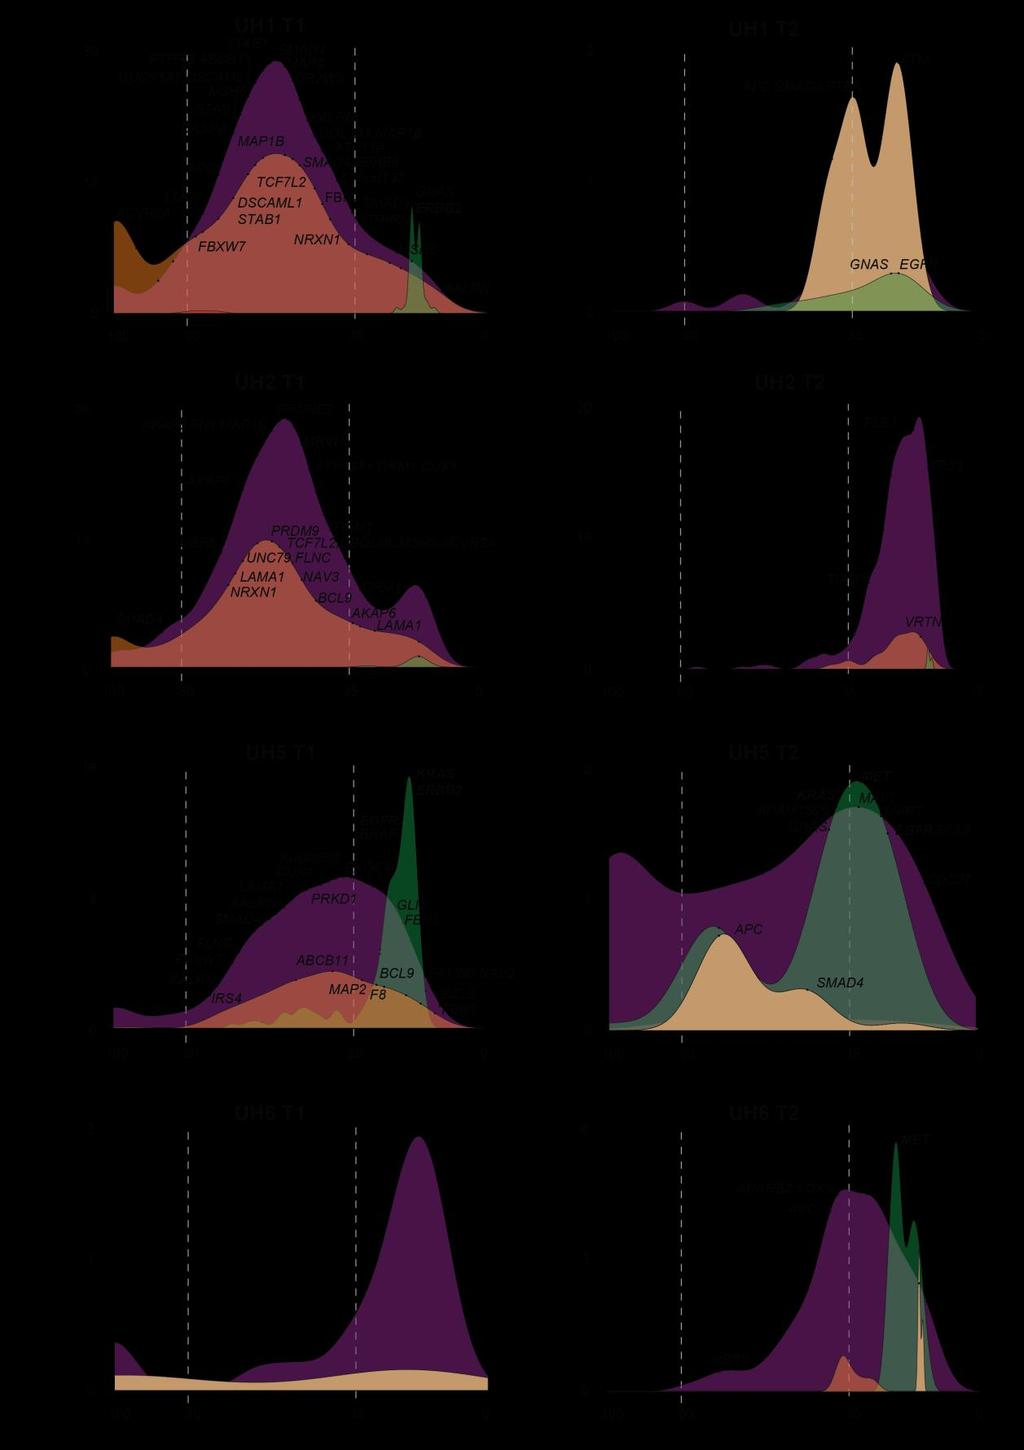
12 For each lesion of all patients, the density distribution of clonality for each type of alteration (SNVs, InDels, amplifications and deletions) is reported. Dots represent driver alterations in known colorectal cancer genes. 12

13 Supplementary Figure 9. Clone composition estimated with our method and with CCF In each tumour, alteration clonality was measured with our method and considering the Cancer Cell Fraction (CCF) 3. From these measures the corresponding clone composition was derived. To apply CCF, we first estimated the cancer cell fraction of all somatic mutations in each tumour and then used these measures to calculate the clone composition. In 17 out of 20 tumours, we find highly comparable clonality estimations resulting in identical clone composition. In three cases (S6T2, UH5T2 and UH8T2) our method detected slightly higher fractions of subclonal mutations. This is likely due to the fact that we also account for the clonality of copy number variant regions, which are instead excluded in CCF. 13
.")
14 Supplementary Figure 10. Alteration clonality of actionable genes in sycrcs Clonality of alterations in actionable genes relevant in cancer therapy (see main text). Genes are grouped according to pathways. Tumours of patients S12 and S3 showed several clonal CNVs in chromosomes 1 and 3 (Supplementary Fig. 6). 14
 and socrc (406) cohorts in terms of gender, ethnicity, type of colorectal cancer, and presence of extra-colonic malignancies.")
15 Supplementary Figure 11. Clinical features of sycrc and socrc patients a, Distributions of age at initial diagnosis of sycrc (33) and socrc (406) patients. b-e Composition of sycrc (33) and socrc (406) cohorts in terms of gender, ethnicity, type of colorectal cancer, and presence of extra-colonic malignancies. 15
16 Supplementary Figure 12. Neutrophils and lymphocytes in sycrcs and socrcs Comparison of neutrophils and lymphocyte between sycrcs and socrcs overall (a) and considering MSI and MSS samples separately (b). Comparison of neutrophils and lymphocyte between MSI and MSS (c) and T1 and T2 (d) sycrcs. Distributions were compared using one-tailed Wilcoxon rank-sum test. Boxes represent to the 25th and 75th percentiles of each distribution, and the horizontal bars correspond to the median value. Whiskers indicate the values observed within up to 1.5 times the interquartile range above and below each box. 16
17 Supplementary Figure 13. Permutation tests on gene expression Percentage of statistically significant comparisons between 14 sycrcs and 14 randomly extracted socrcs (Fisher s exact text). Only results for the KEGG gene sets that were enriched in not expressed and lowly expressed genes are shown. NE = not expressed; LE = lowly expressed. 17

 of mutated and wild-type genes in the pathways")
18 Supplementary Figure 14. Expression levels of genes with rare damaging SNPs Distribution of expression values (Transcripts per Million, TPM) of mutated and wild-type genes in the pathways enriched in Fig. 3c and Fig. 4h in TCGA sycrcs. 18
19 Supplementary Table 1. Clinical information of 20 sycrcs sequenced in the study Patient ID S13 Other malignancies Papillar Carcinoma S6 - S3 - S12 - UH1 - UH2 Breast Cancer UH5 - UH6 - UH8 - UH11 - Lesion Source Anatomical site Tumour Stage Size (cm) Tumour Content (%) Microsatellite instability Markers Unstable MMR immune histochemestry T1 FFPE Ascending Colon T BAT-26, BAT-25, NR-21, NR-24, MONO-27 5 Loss of MLH1 T2 FFPE Ascending Colon T BAT-26, BAT-25, NR-21, NR-24, MONO-27 5 Loss of MLH1 T1 FFPE Ascending Colon T BAT-26, BAT-25, NR-21, NR-24, MONO-27 5 Loss of MSH2 T2 FFPE Ascending Colon T BAT-26, BAT-25, NR-21, NR-24, MONO-27 5 Loss of MSH2 T1 Fresh frozen Rectum T BAT-26, BAT-25, NR-21, NR-24, MONO-27 0 Not investigated T2 FFPE Descending Colon T BAT-26, BAT-25, NR-21, NR-24, MONO-27 0 Not investigated T1 FFPE Descending Colon T BAT-26, BAT-25, NR-21, NR-24, MONO-27 0 Not investigated T2 FFPE Descending Colon T BAT-26, BAT-25, NR-21, NR-24, MONO-27 0 Not investigated T1 FFPE Caecum T Not investigated None detected T2 FFPE Ascending Colon T Not investigated None detected T1 FFPE Ascending Colon T Not investigated None detected T2 FFPE Transverse Colon T Not investigated None detected T1 FFPE Hepatic Flexure T Not investigated Loss of MLH1, PMS2 T2 FFPE Rectum T Not investigated Loss of MLH1, PMS2 T1 FFPE Rectum T Not investigated None detected T2 FFPE Rectum T Not investigated None detected T1 FFPE Descending Colon T Not investigated None detected T2 FFPE Descending Colon T Not investigated None detected T1 FFPE Caecum T Not investigated Loss of MLH1, PMS2 T2 FFPE Transverse Colon T Not investigated Loss of MLH1, PMS2 For each patient, reported are other malignancies (if any), the preservation method of the tissue and pathological information on both lesions. MMR: mismatch repair proteins. 19
20 Supplementary Table 2. Sequencing statistics for whole exome sequencing in 20 tumour and 10 normal samples Patient ID S13 S6 S3 S12 UH1 Sample Type N Sequencing round Sequenced Gbp Aligned Gbps Gbps after removal of duplicates 20 On Target Gbps Mean coverage overall (reads) Mean coverage on cancer genes (reads) T T N T T N T T N T T N T T N T T N T T N T T N T T
21 UH2 UH5 UH6 UH8 UH11 N T T N T T N T T N T T N T T For each sample, sequenced, aligned, aligned after removal of PCR duplicates, and on target Giga base pairs (Gbps) are provided. The mean depth of coverage considering on target reads across the all exome and on cancer genes is also provided. 21
22 Supplementary Table 3. Quality controls on variant calling Patient ID S13 S6 S3 S12 UH1 UH2 UH5 UH6 UH8 Lesion Sequencing round VarScan 10x, freq>5%, >1% on both strands Confirmed in the other Round overlap (%) T ,500 42,657 38,268 90% T ,492 50,055 42,836 86% T ,217 48,714 42,245 87% T ,745 49,338 42,510 86% T ,615 45,314 40,117 89% T ,487 29,800 27,028 91% T ,121 44,431 38,489 87% T ,005 22,345 19,997 89% T ,346 45,314 40,117 89% T ,122 29,800 27,028 91% T ,704 44,431 38,489 87% T ,877 22,345 19,997 89% T ,073 41,003 21,682 53% T ,876 5,754 4,287 75% T ,773 42,268 17,334 41% T2 2 82,795 3,565 2,554 72% 22 Union Somatic SNVs/InDels Somatic SNVs SNVs confirmed with MuTect (%) Somatic InDels Confirmed with Strelka (%) 43,466 1, % % 43,861 1,659 1,153 95% % 55,495 2,891 1,842 99% 1, % 49,606 1, % % 40, % 2 74% 38, % 1 67% 21, % 0 100% 17, % 5 80% T ,994 42, ,740 1,654 94% 1,086 61% T ,666 37, % 3 33% T ,515 41, ,739 1,174 94% % T ,796 37, % 62 89% T ,797 43, , % % T ,864 44, % 9 56% T ,675 41, % 2 100% T ,682 42, % 6 100% T ,248 40, % 5 80% T ,477 38, % 4 50% UH11 T ,739 46, % %
23 T ,024 49, ,164 1,468 93% % For each tumour, reported are the number of mutations at each step of the variant calling pipeline, as described in Supplementary Fig. 3. Tumors of patients S13, S6, S3 and S12 underwent two rounds of sequencing and the overlap between the two rounds is shown. The second round of S12T1 and S12T2 had lower coverage (Supplementary Fig. 2) and therefore the overlap d is lower. Finally, the percentage of somatic SNVs and InDels that were confirmed with MuTect and Strelka are also reported. 23
24 Supplementary Table 4. Sequencing statistics for deep sequencing of a cancer gene panel in 6 tumour samples Patient ID Sample Type Sequenced Gbps Aligned Gbps Gbps after removal of duplicates On Target Gbps Mean coverage (reads) UH1 UH2 UH11 T T T T T T For each sample, sequenced, aligned, aligned after removal of PCR duplicates, and on target Giga base pairs (Gbps) are provided. The mean depth of coverage considering on target reads on 151 cancer genes is provided. 24
25 Supplementary Table 5. Results of the Sanger sequencing validation Coordinate (Hg19) Ref Var Gene Mutation type SNP ID (dbsnp138) Mutated sample (ID) 25 Forward primer sequence Reverse primer sequence Amplicon size (bp) 2: T -A ACVR2A frameshift deletion - UH1T1 GAGGAAATTGGCCAGCATCC TGCAGAAGAAAGAGAAATGTGC 190 TRUE 5: C T APC Stopgain - UH8T1 CCTGAGCTTTTAAGTGGTAGCC GCTTCTGTTGCTTGGGACTG 171 TRUE 5: T -A APC frameshift deletion - UH8T1 CATGCCACCAAGCAGAAGTA CACTCAGGCTGGATGAACAA 233 TRUE 5: C T APC Stopgain - S3T2 CTGCCACTTGCAAAGTTTCT AAACATGAGTGGGGTCTCCT 416 TRUE 5: A +A APC frameshift insertion - S3T1 CCATTCCTACAGAAGGCAGA TGAGGTGAATCAAAAGCAAA 466 TRUE 5: G A APC1 nonsynonymous rs UH1T1 AAACTCATTTGGCCCACAGG GCTGGATGAGGAGAGGAAGA 161 TRUE 5: T -AAAAG APC2 frameshift deletion - UH1T2 ATCAGACGACACAGGAAGCA TGCCTGGCTGATTCTGAAGA 178 TRUE 5: A -T APC3 frameshift deletion - UH5T2 ACCAAGAGAAAGAGGCAGAAA GTACACAGGCAGCTGACTTG 203 FALSE 1: T +G ARID1A frameshift insertion rs UH6T1 GTGCAGGAGTTTGACAGTGG TCTGTTGTCCCTGGTGTACC 179 FALSE 20: C T BPIFB3 nonsynonymous - UH6T2 ACAGATGGATGGAGGCAGAC GATGCTCAAGAAACGGGAGG 238 TRUE 11: G A CBL nonsynonymous - UH8T2 AGAGGCCTCCAAAACCATTC GGCCATCTCGATGTTGTTCT 203 TRUE 16: G A CCDC105 nonsynonymous rs UH6T1 ACTCTGTCTTCTCCTCCCCT GTCTGGAGGAGGCGTTTTCT 207 FALSE 3: A G CTNNB1 nonsynonymous rs UH11T2 ATGGAGTTGGACATGGCCAT TCCACATCCTCTTCCTCAGG 152 TRUE 21: C T DYRK1A Stopgain - UH2T1 GGCATATGATCGTGTGGAGC AAGTTTTGGTGTGGGTTGGG 190 TRUE 6: G A FAM26F nonsynonymous - UH6T1 GCCTGGTCTTCTTGCTGGT CACTCGTAAAAGGCGCCC 223 TRUE 4: G A FBXW7 nonsynonymous - UH5T1 GGGCAGGGAGTATATCGTCT AGTCACATTGGAGAGTGGGG 197 TRUE 2: G A FN1 nonsynonymous - UH8T2 CATCTCCCTCCTCACTCAGC TAAAATGATGTTGGCGACGA 240 TRUE 22: C A FOXRED2 stopgain - UH5T1 TGGGAGCTTAAGTTACCTGCA, CTCTCCTCCCCACAGAACAG 202 TRUE 7: T -A MLL3 frameshift deletion - UH11T1 TAGCAATCTGTCGCACCTCA TGCCACAGATTTCGATGCAC 190 TRUE 2: C T MSH6 stopgain rs UH1T1 GTAGGAACCGTTACCAGC TCCCTCCGTTCTTCAGCATT 160 TRUE 2: A -T MYL1 frameshift - UH5T2 CTTCTTTGGGTTTGGCTGGG ACCACCACTCCTCTTCCAAG 192 TRUE 12: T +G NACA frameshift insertion - UH1T1 GCAAGATGAGAGCCCAGAGA ATCGCTTCCCCTCAAGTCAA 209 TRUE 7: G -C NOS3 frameshift deletion - UH11T2 CTGTCCTGACCTTTGCACTC CGGGAAGCTGTCACCTCTTA 194 TRUE 5: C T PAM nonsynonymous - UH5T2 CCCATCACCTCCCACCATG AGCTGAACATAAGACCACCCA 204 TRUE 12: T C POLE nonsynonymous - UH11T2 ACCCATCAGAGAGAGACCCT CTGTTCTCTGTGCCCGTTTC 188 TRUE 9: T C PRSS3;PRSS3 nonsynonymous - S13T2 CTCACCTGCCGTCATCAATG GGCATGCTTCGTTCTGGAAA 177 TRUE 18: A G SMAD4 nonsynonymous - UH1T1 ACCCAAGACAGAGCATCAAAG TAAGGTTAAGGGCCCCAACG 152 TRUE Confirmed
26 18: T C SMAD4 stoploss - UH2T1 AGACAAGGTGGAGAGAGTGA TGAAGCCTCCCATCCAATGT 170 TRUE 18: G A SMAD4 nonsynonymous rs UH5T1 GCTCCTGAGTATTGGTGTTCC ACCTTGCTCTCTCAATGGCT 187 TRUE 17: C T TP53 nonsynonymous - UH8T1 CTCCGTCATGTGCTGTGACT GTTTCTTTGCTGCCGTCTTC 221 TRUE 17: G C TP53 stopgain - S12T1 CCCAGTTGCAAACCAGAC CACTTGTGCCCTGACTTTC 442 TRUE 6: G A TXLNB stopgain - UH2T2 ACAACTTGCTCAGAGTGTCTC CAGAAGCTGGTGGATGCAAA 153 TRUE 8: G A UBR5 stopgain - UH6T2 CTGCTCGCAAACCACTACTC ACACAGATGCTAGGGAAGGA 227 TRUE 17: C G USP6 nonsynonymous - S13T1 AGAGCCCAAGACTCAGCATC GCCTCTCCCTCCACACATTA 181 TRUE 4: G -C WHSC1 frameshift deletion - UH1T1 TTCATTTTGCCACCTCTGCC TTTGCCCTCTGTGACTCTCC 217 TRUE For each of the 35 mutations, genomic coordinates, reference allele (Ref), variant allele (Var), gene symbol, type of mutation, SNP identifier, mutated sample identifier, sequence of PCR primers, amplicon size and validation result are reported. 26
27 Supplementary Note 1 To compare the clone composition of paired tumours, we classified them as monoclonal, biclonal and polyclonal based on the clonality of their somatic alterations, measured as described in Fig. 2a and Methods. In each tumour, we counted how many alterations (SNVs, InDels, amplifications and deletions) had clonality >80%; 35%-80%; and <35% and identified the largest group of the three. On average the largest group accounted for 64% of all somatic alterations of a tumour (Fig. 2b). The two thresholds of clonality (80% and 35%) that were used to define the three groups allowed the identification of three well distinct scenarios: - If alterations with clonality >80% were the largest group, the majority of cells shared the same (almost clonal) alterations and the tumour could be considered as mostly composed of a dominant clone (i.e. monoclonal); - If alterations with <35% clonality were the largest group, the tumour could be considered as polyclonal because multiple clones co-existed and contributed with a similar share to the tumour mass (for example there were at least three clones each accounting for ~33% of the mass); - In the intermediate situation where alterations with 35%< clonality <80% were the largest group, the tumour could be considered as biclonal because this range of frequency is compatible with two main clones forming the tumour mass. It should be noted that the density distributions that are used to infer the peaks of clonality provide only an estimation of the expected number of mutations at each clonality. 27
28 Supplementary References 1. Alexandrov LB, et al. Signatures of mutational processes in human cancer. Nature 500, (2013). 2. Rahbari R, et al. Timing, rates and spectra of human germline mutation. Nat Genet, (2015). 3. McGranahan N, Favero F, de Bruin EC, Birkbak NJ, Szallasi Z, Swanton C. Clonal status of actionable driver events and the timing of mutational processes in cancer evolution. Sci Transl Med 7, 283ra254 (2015). 28
Supplementary Materials for
 www.sciencetranslationalmedicine.org/cgi/content/full/7/283/283ra54/dc1 Supplementary Materials for Clonal status of actionable driver events and the timing of mutational processes in cancer evolution
NGS in tissue and liquid biopsy
 NGS in tissue and liquid biopsy Ana Vivancos, PhD Referencias So, why NGS in the clinics? 2000 Sanger Sequencing (1977-) 2016 NGS (2006-) ABIPrism (Applied Biosystems) Up to 2304 per day (96 sequences
Nature Genetics: doi: /ng Supplementary Figure 1. Rates of different mutation types in CRC.
 Supplementary Figure 1 Rates of different mutation types in CRC. (a) Stratification by mutation type indicates that C>T mutations occur at a significantly greater rate than other types. (b) As for the
Single-strand DNA library preparation improves sequencing of formalin-fixed and paraffin-embedded (FFPE) cancer DNA
 cancer DNA") www.impactjournals.com/oncotarget/ Oncotarget, Supplementary Materials 2016 Single-strand DNA library preparation improves sequencing of formalin-fixed and paraffin-embedded (FFPE) DNA Supplementary Materials
www.impactjournals.com/oncotarget/ Oncotarget, Supplementary Materials 2016 Single-strand DNA library preparation improves sequencing of formalin-fixed and paraffin-embedded (FFPE) DNA Supplementary Materials
Integration of Cancer Genome into GECCO- Genetics and Epidemiology of Colorectal Cancer Consortium
 Integration of Cancer Genome into GECCO- Genetics and Epidemiology of Colorectal Cancer Consortium Ulrike Peters Fred Hutchinson Cancer Research Center University of Washington U01-CA137088-05, PI: Peters
COMPUTATIONAL OPTIMISATION OF TARGETED DNA SEQUENCING FOR CANCER DETECTION
 COMPUTATIONAL OPTIMISATION OF TARGETED DNA SEQUENCING FOR CANCER DETECTION Pierre Martinez, Nicholas McGranahan, Nicolai Juul Birkbak, Marco Gerlinger, Charles Swanton* SUPPLEMENTARY INFORMATION SUPPLEMENTARY
Whole Genome and Transcriptome Analysis of Anaplastic Meningioma. Patrick Tarpey Cancer Genome Project Wellcome Trust Sanger Institute
 Whole Genome and Transcriptome Analysis of Anaplastic Meningioma Patrick Tarpey Cancer Genome Project Wellcome Trust Sanger Institute Outline Anaplastic meningioma compared to other cancers Whole genomes
MSI positive MSI negative
 Pritchard et al. 2014 Supplementary Figure 1 MSI positive MSI negative Hypermutated Median: 673 Average: 659.2 Non-Hypermutated Median: 37.5 Average: 43.6 Supplementary Figure 1: Somatic Mutation Burden
Enterprise Interest Thermo Fisher Scientific / Employee
 Enterprise Interest Thermo Fisher Scientific / Employee A next-generation sequencing assay to estimate tumor mutation load from FFPE research samples Fiona Hyland. Director of R&D, Bioinformatics Clinical
Supplementary Figure 1. Schematic diagram of o2n-seq. Double-stranded DNA was sheared, end-repaired, and underwent A-tailing by standard protocols.
 Supplementary Figure 1. Schematic diagram of o2n-seq. Double-stranded DNA was sheared, end-repaired, and underwent A-tailing by standard protocols. A-tailed DNA was ligated to T-tailed dutp adapters, circularized
Tumor mutational burden and its transition towards the clinic
 Tumor mutational burden and its transition towards the clinic G C C A T C A C Wolfram Jochum Institute of Pathology Kantonsspital St.Gallen CH-9007 St.Gallen wolfram.jochum@kssg.ch 30th European Congress
ACE ImmunoID Biomarker Discovery Solutions ACE ImmunoID Platform for Tumor Immunogenomics
 ACE ImmunoID Biomarker Discovery Solutions ACE ImmunoID Platform for Tumor Immunogenomics Precision Genomics for Immuno-Oncology Personalis, Inc. ACE ImmunoID When one biomarker doesn t tell the whole
Dr Rick Tearle Senior Applications Specialist, EMEA Complete Genomics Complete Genomics, Inc.
 Dr Rick Tearle Senior Applications Specialist, EMEA Complete Genomics Topics Overview of Data Processing Pipeline Overview of Data Files 2 DNA Nano-Ball (DNB) Read Structure Genome : acgtacatgcattcacacatgcttagctatctctcgccag
DNA-seq Bioinformatics Analysis: Copy Number Variation
 DNA-seq Bioinformatics Analysis: Copy Number Variation Elodie Girard elodie.girard@curie.fr U900 institut Curie, INSERM, Mines ParisTech, PSL Research University Paris, France NGS Applications 5C HiC DNA-seq
AVENIO family of NGS oncology assays ctdna and Tumor Tissue Analysis Kits
 AVENIO family of NGS oncology assays ctdna and Tumor Tissue Analysis Kits Accelerating clinical research Next-generation sequencing (NGS) has the ability to interrogate many different genes and detect
Frequency(%) KRAS G12 KRAS G13 KRAS A146 KRAS Q61 KRAS K117N PIK3CA H1047 PIK3CA E545 PIK3CA E542K PIK3CA Q546. EGFR exon19 NFS-indel EGFR L858R
 KRAS G12 KRAS G13 KRAS A146 KRAS Q61 KRAS K117N PIK3CA H1047 PIK3CA E545 PIK3CA E542K PIK3CA Q546. EGFR exon19 NFS-indel EGFR L858R") Frequency(%) 1 a b ALK FS-indel ALK R1Q HRAS Q61R HRAS G13R IDH R17K IDH R14Q MET exon14 SS-indel KIT D8Y KIT L76P KIT exon11 NFS-indel SMAD4 R361 IDH1 R13 CTNNB1 S37 CTNNB1 S4 AKT1 E17K ERBB D769H ERBB
Frequency(%) 1 a b ALK FS-indel ALK R1Q HRAS Q61R HRAS G13R IDH R17K IDH R14Q MET exon14 SS-indel KIT D8Y KIT L76P KIT exon11 NFS-indel SMAD4 R361 IDH1 R13 CTNNB1 S37 CTNNB1 S4 AKT1 E17K ERBB D769H ERBB
Plasma-Seq conducted with blood from male individuals without cancer.
 Supplementary Figures Supplementary Figure 1 Plasma-Seq conducted with blood from male individuals without cancer. Copy number patterns established from plasma samples of male individuals without cancer
Development of Carcinoma Pathways
 The Construction of Genetic Pathway to Colorectal Cancer Moriah Wright, MD Clinical Fellow in Colorectal Surgery Creighton University School of Medicine Management of Colon and Diseases February 23, 2019
Transform genomic data into real-life results
 CLINICAL SUMMARY Transform genomic data into real-life results Biomarker testing and targeted therapies can drive improved outcomes in clinical practice New FDA-Approved Broad Companion Diagnostic for
Nature Genetics: doi: /ng Supplementary Figure 1. SEER data for male and female cancer incidence from
 Supplementary Figure 1 SEER data for male and female cancer incidence from 1975 2013. (a,b) Incidence rates of oral cavity and pharynx cancer (a) and leukemia (b) are plotted, grouped by males (blue),
Abstract. Optimization strategy of Copy Number Variant calling using Multiplicom solutions APPLICATION NOTE. Introduction
 Optimization strategy of Copy Number Variant calling using Multiplicom solutions Michael Vyverman, PhD; Laura Standaert, PhD and Wouter Bossuyt, PhD Abstract Copy number variations (CNVs) represent a significant
Molecular Subtyping of Endometrial Cancer: A ProMisE ing Change
 Molecular Subtyping of Endometrial Cancer: A ProMisE ing Change Charles Matthew Quick, M.D. Associate Professor of Pathology Director of Gynecologic Pathology University of Arkansas for Medical Sciences
Table S2 Study group sample sizes for CEA, CYFRA21-1 and CA125 determinations.
 Supplementary Data Table S Clinico-pathological data associated with malignant and benign cases Primary site Early stage Late stage Caecum 3 (5%) 4 (20%) (5%) Ascending colon 6 (30%) 2 (0%) 0 (0%) Transverse
Mutation Detection and CNV Analysis for Illumina Sequencing data from HaloPlex Target Enrichment Panels using NextGENe Software for Clinical Research
 Mutation Detection and CNV Analysis for Illumina Sequencing data from HaloPlex Target Enrichment Panels using NextGENe Software for Clinical Research Application Note Authors John McGuigan, Megan Manion,
NGS ONCOPANELS: FDA S PERSPECTIVE
 NGS ONCOPANELS: FDA S PERSPECTIVE CBA Workshop: Biomarker and Application in Drug Development August 11, 2018 Rockville, MD You Li, Ph.D. Division of Molecular Genetics and Pathology Food and Drug Administration
Supplementary Methods
 Supplementary Methods Short Read Preprocessing Reads are preprocessed differently according to how they will be used: detection of the variant in the tumor, discovery of an artifact in the normal or for
Accel-Amplicon Panels
 Accel-Amplicon Panels Amplicon sequencing has emerged as a reliable, cost-effective method for ultra-deep targeted sequencing. This highly adaptable approach is especially applicable for in-depth interrogation
Nature Genetics: doi: /ng.2995
 Supplementary Figure 1 Kaplan-Meier survival curves of patients with brainstem tumors. (a) Comparison of patients with PPM1D mutation versus wild-type PPM1D. (b) Comparison of patients with PPM1D mutation
ARTICLE RESEARCH. Macmillan Publishers Limited. All rights reserved
 Extended Data Figure 6 Annotation of drivers based on clinical characteristics and co-occurrence patterns. a, Putative drivers affecting greater than 10 patients were assessed for enrichment in IGHV mutated
Using the Bravo Liquid-Handling System for Next Generation Sequencing Sample Prep
 Using the Bravo Liquid-Handling System for Next Generation Sequencing Sample Prep Tom Walsh, PhD Division of Medical Genetics University of Washington Next generation sequencing Sanger sequencing gold
The Next Generation of Hereditary Cancer Testing
 The Next Generation of Hereditary Cancer Testing Why Genetic Testing? Cancers can appear to run in families. Often this is due to shared environmental or lifestyle patterns, such as tobacco use. However,
Case Study. Overview. Deleterious MLH1 mutation detected on sequencing 10/16/2014
 The Role of Next Generation Sequencing for Hereditary Cancer Syndromes: A Focus on Endometrial Cancer Laura J. Tafe, MD Assistant Professor of Pathology Assistant Director, Molecular Pathology Dartmouth-Hitchcock
Supplemental Figure legends
 Supplemental Figure legends Supplemental Figure S1 Frequently mutated genes. Frequently mutated genes (mutated in at least four patients) with information about mutation frequency, RNA-expression and copy-number.
Comprehensive genomic profiling for various solid tumors
 Content Highlight Test Specification Test Content Performance Validation Test Report I II III IV V The NovoPM TM comprehensive cancer genomic profiling test Comprehensive genomic profiling for various
Case Presentation Diana Lim, MBBS, FRCPA, FRCPath Senior Consultant Department of Pathology, National University Health System, Singapore Assistant Pr
 Case Presentation Diana Lim, MBBS, FRCPA, FRCPath Senior Consultant Department of Pathology, National University Health System, Singapore Assistant Professor Yong Loo Lin School of Medicine, National University
Performance Characteristics BRCA MASTR Plus Dx
 Performance Characteristics BRCA MASTR Plus Dx with drmid Dx for Illumina NGS systems Manufacturer Multiplicom N.V. Galileïlaan 18 2845 Niel Belgium Table of Contents 1. Workflow... 4 2. Performance Characteristics
Characterisation of structural variation in breast. cancer genomes using paired-end sequencing on. the Illumina Genome Analyser
 Characterisation of structural variation in breast cancer genomes using paired-end sequencing on the Illumina Genome Analyser Phil Stephens Cancer Genome Project Why is it important to study cancer? Why
Dr Yvonne Wallis Consultant Clinical Scientist West Midlands Regional Genetics Laboratory
 Dr Yvonne Wallis Consultant Clinical Scientist West Midlands Regional Genetics Laboratory Personalised Therapy/Precision Medicine Selection of a therapeutic drug based on the presence or absence of a specific
BWA alignment to reference transcriptome and genome. Convert transcriptome mappings back to genome space
 Whole genome sequencing Whole exome sequencing BWA alignment to reference transcriptome and genome Convert transcriptome mappings back to genome space genomes Filter on MQ, distance, Cigar string Annotate
AD (Leave blank) TITLE: Genomic Characterization of Brain Metastasis in Non-Small Cell Lung Cancer Patients
 TITLE: Genomic Characterization of Brain Metastasis in Non-Small Cell Lung Cancer Patients") AD (Leave blank) Award Number: W81XWH-12-1-0444 TITLE: Genomic Characterization of Brain Metastasis in Non-Small Cell Lung Cancer Patients PRINCIPAL INVESTIGATOR: Mark A. Watson, MD PhD CONTRACTING ORGANIZATION:
AD (Leave blank) Award Number: W81XWH-12-1-0444 TITLE: Genomic Characterization of Brain Metastasis in Non-Small Cell Lung Cancer Patients PRINCIPAL INVESTIGATOR: Mark A. Watson, MD PhD CONTRACTING ORGANIZATION:
LYNCH SYNDROME: IN YOUR FACE BUT LOST IN SPACE (MOUNTAIN)!
!") LYNCH SYNDROME: IN YOUR FACE BUT LOST IN SPACE (MOUNTAIN)! Kathryn Singh, MPH, MS, LCGC Associate Clinical Professor Assistant Director, Graduate Program in Genetic Counseling Division of Genetic and Genomic
LYNCH SYNDROME: IN YOUR FACE BUT LOST IN SPACE (MOUNTAIN)! Kathryn Singh, MPH, MS, LCGC Associate Clinical Professor Assistant Director, Graduate Program in Genetic Counseling Division of Genetic and Genomic
Fluxion Biosciences and Swift Biosciences Somatic variant detection from liquid biopsy samples using targeted NGS
 APPLICATION NOTE Fluxion Biosciences and Swift Biosciences OVERVIEW This application note describes a robust method for detecting somatic mutations from liquid biopsy samples by combining circulating tumor
MEDICAL GENOMICS LABORATORY. Next-Gen Sequencing and Deletion/Duplication Analysis of NF1 Only (NF1-NG)
") Next-Gen Sequencing and Deletion/Duplication Analysis of NF1 Only (NF1-NG) Ordering Information Acceptable specimen types: Fresh blood sample (3-6 ml EDTA; no time limitations associated with receipt)
Next-Gen Sequencing and Deletion/Duplication Analysis of NF1 Only (NF1-NG) Ordering Information Acceptable specimen types: Fresh blood sample (3-6 ml EDTA; no time limitations associated with receipt)
Nature Medicine: doi: /nm.4439
 Figure S1. Overview of the variant calling and verification process. This figure expands on Fig. 1c with details of verified variants identification in 547 additional validation samples. Somatic variants
Supplementary Information. Supplementary Figures
 Supplementary Information Supplementary Figures.8 57 essential gene density 2 1.5 LTR insert frequency diversity DEL.5 DUP.5 INV.5 TRA 1 2 3 4 5 1 2 3 4 1 2 Supplementary Figure 1. Locations and minor
Reporting TP53 gene analysis results in CLL
 Reporting TP53 gene analysis results in CLL Mutations in TP53 - From discovery to clinical practice in CLL Discovery Validation Clinical practice Variant diversity *Leroy at al, Cancer Research Review
Colorectal Cancer - Working in Partnership. David Baty Genetics, Ninewells Hospital
 Colorectal Cancer - Working in Partnership David Baty Genetics, Ninewells Hospital Genetics and Pathology National initiatives Colorectal cancer Inherited CRC Sporadic CRC The Liquid Biopsy The future?
Next generation histopathological diagnosis for precision medicine in solid cancers
 Next generation histopathological diagnosis for precision medicine in solid cancers from genomics to clinical application Aldo Scarpa ARC-NET Applied Research on Cancer Department of Pathology and Diagnostics
Relationship between genomic features and distributions of RS1 and RS3 rearrangements in breast cancer genomes.
 Supplementary Figure 1 Relationship between genomic features and distributions of RS1 and RS3 rearrangements in breast cancer genomes. (a,b) Values of coefficients associated with genomic features, separately
NEXT GENERATION SEQUENCING. R. Piazza (MD, PhD) Dept. of Medicine and Surgery, University of Milano-Bicocca
 Dept. of Medicine and Surgery, University of Milano-Bicocca") NEXT GENERATION SEQUENCING R. Piazza (MD, PhD) Dept. of Medicine and Surgery, University of Milano-Bicocca SANGER SEQUENCING 5 3 3 5 + Capillary Electrophoresis DNA NEXT GENERATION SEQUENCING SOLEXA-ILLUMINA
NEXT GENERATION SEQUENCING R. Piazza (MD, PhD) Dept. of Medicine and Surgery, University of Milano-Bicocca SANGER SEQUENCING 5 3 3 5 + Capillary Electrophoresis DNA NEXT GENERATION SEQUENCING SOLEXA-ILLUMINA
TumorNext-Lynch. genetic testing for hereditary colorectal or uterine cancer
 TumorNet-Lynch genetic testing for hereditary colorectal or uterine cancer What Are the Causes of Hereditary Colorectal Cancer? sporadic 70% familial 20% hereditary 10% Lynch syndrome, up to 4% Familial
Measure Description. Denominator Statement
 CMS ID/CMS QCDR ID: CAP 18 Title: Mismatch Repair (MMR) or Microsatellite Instability (MSI) Biomarker Testing to Inform Clinical Management and Treatment Decisions in Patients with Primary or Metastatic
Colorectal cancer Chapelle, J Clin Oncol, 2010
 Colorectal cancer Chapelle, J Clin Oncol, 2010 Early-Stage Colorectal cancer: Microsatellite instability, multigene assay & emerging molecular strategy Asit Paul, MD, PhD 11/24/15 Mr. X: A 50 yo asymptomatic
NGS IN ONCOLOGY: FDA S PERSPECTIVE
 NGS IN ONCOLOGY: FDA S PERSPECTIVE ASQ Biomed/Biotech SIG Event April 26, 2018 Gaithersburg, MD You Li, Ph.D. Division of Molecular Genetics and Pathology Food and Drug Administration (FDA) Center for
Serrated Polyps and a Classification of Colorectal Cancer
 Serrated Polyps and a Classification of Colorectal Cancer Ian Chandler June 2011 Structure Serrated polyps and cancer Molecular biology The Jass classification The familiar but oversimplified Vogelsteingram
underlying metastasis and recurrence in HNSCC, we analyzed two groups of patients. The
 Supplementary Figures Figure S1. Patient cohorts and study design. To define and interrogate the genetic alterations underlying metastasis and recurrence in HNSCC, we analyzed two groups of patients. The
Anatomic Molecular Pathology: An Emerging Field
 Anatomic Molecular Pathology: An Emerging Field Antonia R. Sepulveda M.D., Ph.D. University of Pennsylvania asepu@mail.med.upenn.edu 2008 ASIP Annual Meeting Anatomic pathology (U.S.) is a medical specialty
Supplementary Tables. Supplementary Figures
 Supplementary Files for Zehir, Benayed et al. Mutational Landscape of Metastatic Cancer Revealed from Prospective Clinical Sequencing of 10,000 Patients Supplementary Tables Supplementary Table 1: Sample
Precision Genetic Testing in Cancer Treatment and Prognosis
 Precision Genetic Testing in Cancer Treatment and Prognosis Deborah Cragun, PhD, MS, CGC Genetic Counseling Graduate Program Director University of South Florida Case #1 Diana is a 47 year old cancer patient
Genomic tests to personalize therapy of metastatic breast cancers. Fabrice ANDRE Gustave Roussy Villejuif, France
 Genomic tests to personalize therapy of metastatic breast cancers Fabrice ANDRE Gustave Roussy Villejuif, France Future application of genomics: Understand the biology at the individual scale Patients
To test the possible source of the HBV infection outside the study family, we searched the Genbank
 Supplementary Discussion The source of hepatitis B virus infection To test the possible source of the HBV infection outside the study family, we searched the Genbank and HBV Database (http://hbvdb.ibcp.fr),
Nature Medicine: doi: /nm.3967
 Supplementary Figure 1. Network clustering. (a) Clustering performance as a function of inflation factor. The grey curve shows the median weighted Silhouette widths for varying inflation factors (f [1.6,
Genome. Institute. GenomeVIP: A Genomics Analysis Pipeline for Cloud Computing with Germline and Somatic Calling on Amazon s Cloud. R. Jay Mashl.
 GenomeVIP: the Genome Institute at Washington University A Genomics Analysis Pipeline for Cloud Computing with Germline and Somatic Calling on Amazon s Cloud R. Jay Mashl October 20, 2014 Turnkey Variant
Nature Biotechnology: doi: /nbt.1904
 Supplementary Information Comparison between assembly-based SV calls and array CGH results Genome-wide array assessment of copy number changes, such as array comparative genomic hybridization (acgh), is
Supplementary information to:
 Supplementary information to: Digital Sorting of Pure Cell Populations Enables Unambiguous Genetic Analysis of Heterogeneous Formalin-Fixed Paraffin Embedded Tumors by Next Generation Sequencing Authors
Supplementary Figure 1
 Supplementary Figure 1 Supplementary Fig. 1: Quality assessment of formalin-fixed paraffin-embedded (FFPE)-derived DNA and nuclei. (a) Multiplex PCR analysis of unrepaired and repaired bulk FFPE gdna from
Lynch Syndrome Screening for Endometrial Cancer: Basic Concepts 1/16/2017
 1 Hi, my name is Sarah Kerr. I m a pathologist at Mayo Clinic, where I participate in our high volume Lynch syndrome tumor testing practice. Today I hope to cover some of the basics needed to understand
Analysis of Massively Parallel Sequencing Data Application of Illumina Sequencing to the Genetics of Human Cancers
 Analysis of Massively Parallel Sequencing Data Application of Illumina Sequencing to the Genetics of Human Cancers Gordon Blackshields Senior Bioinformatician Source BioScience 1 To Cancer Genetics Studies
Supplementary Figure 1: Features of IGLL5 Mutations in CLL: a) Representative IGV screenshot of first
 Representative IGV screenshot of first") Supplementary Figure 1: Features of IGLL5 Mutations in CLL: a) Representative IGV screenshot of first intron IGLL5 mutation depicting biallelic mutations. Red arrows highlight the presence of out of phase
Supplementary Figure 1: Features of IGLL5 Mutations in CLL: a) Representative IGV screenshot of first intron IGLL5 mutation depicting biallelic mutations. Red arrows highlight the presence of out of phase
Figure S4. 15 Mets Whole Exome. 5 Primary Tumors Cancer Panel and WES. Next Generation Sequencing
 Figure S4 Next Generation Sequencing 15 Mets Whole Exome 5 Primary Tumors Cancer Panel and WES Get coverage of all variant loci for all three Mets Variant Filtering Sequence Alignments Index and align
ACE ImmunoID. ACE ImmunoID. Precision immunogenomics. Precision Genomics for Immuno-Oncology
 ACE ImmunoID ACE ImmunoID Precision immunogenomics Precision Genomics for Immuno-Oncology Personalis, Inc. A universal biomarker platform for immuno-oncology Patient response to cancer immunotherapies
Immunotherapy in Colorectal cancer
 Immunotherapy in Colorectal cancer Ahmed Zakari, MD Associate Professor University of Central Florida, College of Medicine Medical Director, Gastro Intestinal Cancer Program Florida Hospital Cancer Institute
Analysis with SureCall 2.1
 Analysis with SureCall 2.1 Danielle Fletcher Field Application Scientist July 2014 1 Stages of NGS Analysis Primary analysis, base calling Control Software FASTQ file reads + quality 2 Stages of NGS Analysis
Nature Genetics: doi: /ng Supplementary Figure 1
 Supplementary Figure 1 Multiple samples from five patients (P4, P8, P14, P15 and P17) with Barrett s esophagus and adjacent EAC show that the poor overlap is not a result of sampling bias. Bar graphs showing
MRC-Holland MLPA. Description version 29;
 SALSA MLPA KIT P003-B1 MLH1/MSH2 Lot 1209, 0109. As compared to the previous lots 0307 and 1006, one MLH1 probe (exon 19) and four MSH2 probes have been replaced. In addition, one extra MSH2 exon 1 probe,
NGS for Cancer Predisposition
 NGS for Cancer Predisposition Colin Pritchard MD, PhD University of Washington Dept. of Lab Medicine AMP Companion Society Meeting USCAP Boston March 22, 2015 Disclosures I am an employee of the University
(a) Schematic diagram of the FS mutation of UVRAG in exon 8 containing the highly instable
 Schematic diagram of the FS mutation of UVRAG in exon 8 containing the highly instable") Supplementary Figure 1. Frameshift (FS) mutation in UVRAG. (a) Schematic diagram of the FS mutation of UVRAG in exon 8 containing the highly instable A 10 DNA repeat, generating a premature stop codon
Supplementary Figure 1. Frameshift (FS) mutation in UVRAG. (a) Schematic diagram of the FS mutation of UVRAG in exon 8 containing the highly instable A 10 DNA repeat, generating a premature stop codon
CDH1 truncating alterations were detected in all six plasmacytoid-variant bladder tumors analyzed by whole-exome sequencing.
 Supplementary Figure 1 CDH1 truncating alterations were detected in all six plasmacytoid-variant bladder tumors analyzed by whole-exome sequencing. Whole-exome sequencing of six plasmacytoid-variant bladder
Importance of minor TP53 mutated clones in the clinic
 Importance of minor TP53 mutated clones in the clinic Davide Rossi, M.D., Ph.D. Hematology IOSI - Oncology Institute of Southern Switzerland IOR - Institute of Oncology Reserach Bellinzona - Switzerland
Nature Neuroscience: doi: /nn Supplementary Figure 1. Missense damaging predictions as a function of allele frequency
 Supplementary Figure 1 Missense damaging predictions as a function of allele frequency Percentage of missense variants classified as damaging by eight different classifiers and a classifier consisting
Research Strategy: 1. Background and Significance
 Research Strategy: 1. Background and Significance 1.1. Heterogeneity is a common feature of cancer. A better understanding of this heterogeneity may present therapeutic opportunities: Intratumor heterogeneity
Supplementary Figure 1: Classification scheme for non-synonymous and nonsense germline MC1R variants. The common variants with previously established
 Supplementary Figure 1: Classification scheme for nonsynonymous and nonsense germline MC1R variants. The common variants with previously established classifications 1 3 are shown. The effect of novel missense
EXAMPLE. - Potentially responsive to PI3K/mTOR and MEK combination therapy or mtor/mek and PKC combination therapy. ratio (%)
") Dr Kate Goodhealth Goodhealth Medical Clinic 123 Address Road SUBURBTOWN NSW 2000 Melanie Citizen Referring Doctor Your ref Address Dr John Medico 123 Main Street, SUBURBTOWN NSW 2000 Phone 02 9999 9999
Dr Kate Goodhealth Goodhealth Medical Clinic 123 Address Road SUBURBTOWN NSW 2000 Melanie Citizen Referring Doctor Your ref Address Dr John Medico 123 Main Street, SUBURBTOWN NSW 2000 Phone 02 9999 9999
Nature Genetics: doi: /ng Supplementary Figure 1. Mutational signatures in BCC compared to melanoma.
 Supplementary Figure 1 Mutational signatures in BCC compared to melanoma. (a) The effect of transcription-coupled repair as a function of gene expression in BCC. Tumor type specific gene expression levels
Management of higher risk of colorectal cancer. Huw Thomas
 Management of higher risk of colorectal cancer Huw Thomas Colorectal Cancer 41,000 new cases pa in UK 16,000 deaths pa 60% 5 year survival Adenoma-carcinoma sequence (Morson) Survival vs stage (Dukes)
Biology of cancer development in the GI tract
 1 Genesis and progression of GI cancer a genetic disease Colorectal cancer Fearon and Vogelstein proposed a genetic model to explain the stepwise formation of colorectal cancer (CRC) from normal colonic
LESSON 3.2 WORKBOOK. How do normal cells become cancer cells? Workbook Lesson 3.2
 For a complete list of defined terms, see the Glossary. Transformation the process by which a cell acquires characteristics of a tumor cell. LESSON 3.2 WORKBOOK How do normal cells become cancer cells?
Breast and ovarian cancer in Serbia: the importance of mutation detection in hereditary predisposition genes using NGS
 Breast and ovarian cancer in Serbia: the importance of mutation detection in hereditary predisposition genes using NGS dr sc. Ana Krivokuća Laboratory for molecular genetics Institute for Oncology and
FAMILIAL COLORECTAL CANCER. Lyn Schofield Manager Familial Cancer Registry
 FAMILIAL COLORECTAL CANCER Lyn Schofield Manager Familial Cancer Registry Cancer in WA 2004 4000 3500 ASPR, rate per 100,000 3000 2500 2000 1500 1000 Male incidence Female incidence Male mortality Female
An integrated map of genetic variation from 1092 human genomes
 SUPPLEMENTAL METHODS AND MATERIALS Whole genome sequencing Alignment: Short insert paired-end reads were aligned to the GRCh37 reference human genome with 1000 genomes decoy contigs using BWA-mem(1). Somatic
Illumina Trusight Myeloid Panel validation A R FHAN R A FIQ
 Illumina Trusight Myeloid Panel validation A R FHAN R A FIQ G E NETIC T E CHNOLOGIST MEDICAL G E NETICS, CARDIFF To Cover Background to the project Choice of panel Validation process Genes on panel, Protocol
Nature Genetics: doi: /ng Supplementary Figure 1. PCA for ancestry in SNV data.
 Supplementary Figure 1 PCA for ancestry in SNV data. (a) EIGENSTRAT principal-component analysis (PCA) of SNV genotype data on all samples. (b) PCA of only proband SNV genotype data. (c) PCA of SNV genotype
MEDICAL GENOMICS LABORATORY. Peripheral Nerve Sheath Tumor Panel by Next-Gen Sequencing (PNT-NG)
") Peripheral Nerve Sheath Tumor Panel by Next-Gen Sequencing (PNT-NG) Ordering Information Acceptable specimen types: Blood (3-6ml EDTA; no time limitations associated with receipt) Saliva (OGR-575 DNA Genotek;
Peripheral Nerve Sheath Tumor Panel by Next-Gen Sequencing (PNT-NG) Ordering Information Acceptable specimen types: Blood (3-6ml EDTA; no time limitations associated with receipt) Saliva (OGR-575 DNA Genotek;
TP53 mutational profile in CLL : A retrospective study of the FILO group.
 TP53 mutational profile in CLL : A retrospective study of the FILO group. Fanny Baran-Marszak Hopital Avicenne Bobigny France 2nd ERIC workshop on TP53 analysis in CLL, Stresa 2017 TP53 abnormalities :
WHOLE EXOME SEQUENCING PIPELINE EVALUATION AND MUTATION DETECTION IN ESOPHAGEAL CANCER PATIENTS
 WHOLE EXOME SEQUENCING PIPELINE EVALUATION AND MUTATION DETECTION IN ESOPHAGEAL CANCER PATIENTS SUMMARY Tran Thi Bich Ngoc 1 ; Ho Viet Hoanh 2 ; Vu Phuong Nhung 1 ; Nguyen Hai Ha 1 Nguyen Van Ba 2 ; Nguyen
Secuenciación masiva: papel en la toma de decisiones
 Secuenciación masiva: papel en la toma de decisiones Cancer is a Genetic Disease Development of cancer is driven by the acquisition of somatic genetic alterations: Nonsynonymous point mutations: missense.
TP53 ABERRATIONS Methodical considerations
 TP53 ABERRATIONS Methodical considerations Sarka Pavlova University Hospital and Masaryk University, Brno, Czech republic Belgrade March 16-17, 2018 TP53 gene in CLL: modes of inactivation mutation(s)
Computer Science, Biology, and Biomedical Informatics (CoSBBI) Outline. Molecular Biology of Cancer AND. Goals/Expectations. David Boone 7/1/2015
 Outline. Molecular Biology of Cancer AND. Goals/Expectations. David Boone 7/1/2015") Goals/Expectations Computer Science, Biology, and Biomedical (CoSBBI) We want to excite you about the world of computer science, biology, and biomedical informatics. Experience what it is like to be a
Goals/Expectations Computer Science, Biology, and Biomedical (CoSBBI) We want to excite you about the world of computer science, biology, and biomedical informatics. Experience what it is like to be a
Expanded View Figures
 EMO Molecular Medicine Proteomic map of squamous cell carcinomas Hanibal ohnenberger et al Expanded View Figures Figure EV1. Technical reproducibility. Pearson s correlation analysis of normalised SILC
Colon Cancer and Hereditary Cancer Syndromes
 Colon Cancer and Hereditary Cancer Syndromes Gisela Keller Institute of Pathology Technische Universität München gisela.keller@lrz.tum.de Colon Cancer and Hereditary Cancer Syndromes epidemiology models