Fold change jhd2δ vs WT
|
|
|
- Clifford Singleton
- 5 years ago
- Views:
Transcription
1 Strand a a a Fold change jhdδ v WT Fold change et1δ v WT Gene name YMR11C MTD SOM ARG YJR79W BNA. 1.9 YJR15W DSF YGL13C. 1. GON FLO SPO YSN FLO SKN YDR1W 1..1 Supplementary Figure 1. Lit of ene and antiene trancript counter-regulated by Set1 and Jhd. Fold change in ene () or antiene (a) trancript level for the indicated gene in jhdδ or et1δ mutant relative to the control wild type (WT) are hown. Fold change in trancript level were calculated uing equencing read obtained from three independent RNA ample each iolated for control WT and deletion mutant (jhdδ or et1δ). Red arrow denote down-regulation of the trancript in the mutant, and green arrow indicate up-regulation of the trancript in the mutant.


2 1.5-fold up-regulated Antiene 1.5-fold down-regulated Antiene jhdδ et1δ jhdδ et1δ Supplementary Figure. Venn diagram howing the number of up- or down-regulated antiene trancript unique to and common to jhdδ and et1δ mutant. Interection p-value <1 - (hypergeometric tet).

 SRG1 trancription i unaffected by the abence of Set1 or Jhd.")
3 a jhdδ et1δ SER CHA Fold down-regulated relative to wild-type b Read SRG1 SER3 WT jhdδ et1δ Supplementary Figure 3. SER3 and CHA1 gene involved in erine metabolim are target gene of Set1 and Jhd. (a) Fold decreae in the RNAeq read for SER3 and CHA1 trancript in jhdδ or et1δ mutant relative to control wild type. (b) SRG1 trancription i unaffected by the abence of Set1 or Jhd. RNA-eq read obtained for SRG1 and SER3 trancript in control wild type (WT), jhdδ and et1δ are hown. SRG1 code for an uptream non-coding RNA involved in negatively regulating SER3 trancription.
4 a b Fold change in trancript level 3 1 PHO5 WT et1δ jhdδ et1δjhdδ et1-c119a jhd-h7a JHD WT DBP et1δ jhdδ et1δjhdδ et1-c119a jhd-h7a JHD Supplementary Figure. Set1 and Jhd control trancriptional repreion or attenuation at PHO5 and DBP gene. Fold-change in PHO5 and DBP ene trancript level in deletion mutant (et1δ, jhdδ and et1δjhdδ), catalytic-dead mutant (et1-c119a and jhd-h7a) or a train overexpreing Jhd (JHD) relative to the control WT train are hown. Error bar denote ±SEM from four independent experiment (n=). Statitical ignificance calculated uing Student t- tet, *p-value.5, **p-value <1 -.
5 Fold change in trancript level SER3 CHA1 PHO9 PHO5 LCP5 DBP Supplementary Figure 5. Hitone H3KR mutation alter target gene expreion. Fold-change in trancript level for the indicated target gene in the H3KR mutant relative to wild type H3 train are hown. Error bar denote ±SEM from four independent experiment (n=). Statitical ignificance calculated uing Student t-tet, *p-value <.5.


6 a SENSE ANTISENSE 1.5-fold change FDR 5% Total Up Down Total Up Down jhdδ et1δ FlagSET FlagSET1-G99E fold change FDR 1% Total Up Down Total Up Down jhdδ et1δ FlagSET FlagSET1-G99E b Antiene trancript up-regulated 1.5-fold relative to wild-type Antiene trancript down-regulated 1.5-fold relative to wild-type et1δ SET1 et1δ SET jhdδ SET1-G99E jhdδ SET1-G99E Supplementary Figure. Sene and antiene trancription are altered upon deletion of SET1 or JHD or following overexpreion of SET1 or hyperactive SET1-G99E. (a) The total number of ene or antiene trancript undergoing a 1.5-fold (at a fale dicovery rate (FDR) 5%) or a -fold (FDR 1%) change in expreion in the four indicated mutant compared to the control wild type are hown. The number of ene or antiene trancript either up- or downregulated in each of the four mutant train are alo indicated. (b) Four-way Venn diagram howing the number of unique or hared up- or down-regulated antiene trancript in each combination of the indicated deletion or overexpreion mutant train. Interection p-value <1 - (hypergeometric tet).
7 a GO term riboomal mall ubunit biogenei RNA proceing ncrna metabolic proce rrna proceing ncrna proceing rrna metabolic proce ribonucleoprotein complex biogenei riboome biogenei p-value 1 - glycogen bioynthetic proce b GO term polyaccharide metabolic proce cellular polyaccharide metabolic proce glucan metabolic proce energy derivation by oxidation of organic compound oxidation-reduction proce glycogen metabolic proce energy reerve metabolic proce p-value Supplementary Figure 7. Gene for glycogen metabolim and riboome biogenei are enitive to the deletion of SET1 or JHD or overexpreion of SET1 or hyperactive SET1- G99E. (a) GO term ignificantly enriched in the up-regulated ene trancript common to deletion (et1δ or jhdδ) and overexpreion mutant (SET1 or SET1-G99E). (b) GO term enriched in ene trancript down-regulated in all four mutant train.
 and C. glabrata (reference genome).")
8 kda α-h3kme1 α-h3kme α-h3kme3 α-h3 Supplementary Figure. H3K methylation occur in Candida glabrata. Wetern blot howing H3Kme1, H3Kme and H3Kme3 level in whole cell lyate prepared from S. cereviiae (experimental genome) and C. glabrata (reference genome). H3 erve a loading control. The full-image of the blot i alo hown and panel at the top are indicated.
9 a Common up-regulated gene in et1δ or jhdδ H3Kme1 H3Kme H3Kme3 [-log 1 (q-value)] b Common down-regulated gene in et1δ or jhdδ H3Kme1 H3Kme H3Kme3 [-log 1 (q-value)] jhdδ/wt Set1G99E/WT Supplementary Figure 9. Statitical ignificance are hown for the change in H3K methylation level at Set1 and Jhd co-repreed (a) or co-activated (b) target gene in jhdδ or Set1G99E mutant compared to wild type.
10 a Common up-regulated gene in et1δ or jhdδ b Common down-regulated gene in et1δ or jhdδ Normalized Read Count Normalized Read Count Midpoint - - Midpoint H3Kme1_WT H3Kme1_et1Δ H3Kme_WT H3Kme_et1Δ H3Kme3_WT H3Kme3_et1Δ Supplementary Figure 1. H3K methylation i abolihed at hared target gene in the et1δ mutant. Normalized read count profile for H3K monomethyl (me1), dimethyl (me) and trimethy (me3) mark acro bp region uptream (-) or downtream (+) of the TSS () at gene co-repreed (a) or co-activated (b) by Set1 and Jhd in BY71 (WT) and et1δ null mutant. Read count for et1δ null mutant and it control wild type train BY71 were obtained from publihed dataet of Chabbert et al (15).
 digeted DNA iolated from three independent culture each for the wild type (WT), et1δ and jhdδ train i")
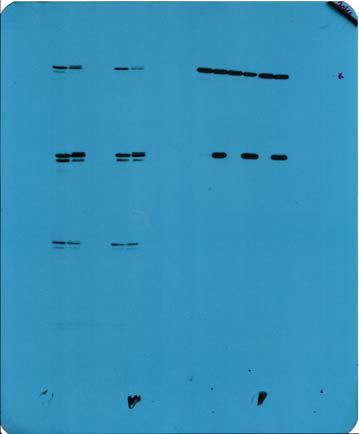
11 WT et1δ jhdδ M mononucleoome Supplementary Figure 11. Bulk chromatin tructure in wild type, et1δ and jhdδ train. A % agaroe gel tained with ethidium bromide and containing limited micrococcal nucleae (MNae) digeted DNA iolated from three independent culture each for the wild type (WT), et1δ and jhdδ train i hown. Thee MNae-digeted DNA were ubjected to library preparation. Adaptor-ligated DNA correponding to mononucleoome wa ize elected by gel purification and ubjected to next generation equencing. M, 1kb DNA ladder.
12 a b [-log 1 (q-value)] [-log 1 (q-value)] c d [-log 1 (q-value)] [-log 1 (q-value)] jhdδ/wt et1δ//wt Supplementary Figure 1. Statitical ignificance are hown for the hitone turnover change at Set1 and Jhd co-repreed (a) or co-activated (b) target gene, all yeat ribi gene (c) and acro all yeat gene (d) in jhdδ or et1δ mutant compared to wild type.
 + Δ(et1Δ WT) 1 WT 1 jhdδ 1 et1δ - -1 +1 + Pho binding ite PHO9")
13 Nucleoome occupancy (MNae-eq read) H3K methylation occupancy Enzyme occupancy Fold change in H3K methylation in jhdδ/wt Fold change in H3K methylation In et1δ/wt Change in nucleoome occupancy RNA-eq read 35 WT 3 H3Kme1 3 H3Kme 3 H3Kme3 15 Jhd 15 Set1 +3 ΔH3Kme ΔH3Kme 3 +3 ΔH3Kme ΔH3Kme1 +1 ΔH3Kme +1 ΔH3Kme3 + Δ(jhdΔ WT) + Δ(et1Δ WT) 1 WT 1 jhdδ 1 et1δ Pho binding ite PHO9 Supplementary Figure 13. Occupancy of a PHO9 promoter nucleoome containing the Pho binding ite i reduced in et1δ or jhdδ mutant. Change to H3K methylation level, nucleoomal occupancy and trancript at the PHO9 gene in jhdδ or et1δ are hown. The normal nucleoomal, H3K methylation, Jhd and Set1 occupancie at thee gene are alo hown: Read for mononucleoomal DNA in wild type (WT) how the native chromatin organization (brown). Read for H3K monomethyl (me1, magenta), H3K dimethyl (me, cyan) and H3K trimethyl (me3, green) mark in WT how their ditribution over the PHO9 gene. Jhd (black) and Set1 (pink) occupancy (qpoi) in WT train at the PHO9 gene are hown. Fold change in the level of H3Kme1, H3Kme and H3Kme3 mark in jhdδ or et1δ relative to that in WT are hown. Fold change in H3K methylation in et1δ relative to WT wa calculated uing data from Chabbert et al (15). Increae or decreae in a given H3K methyl mark in the mutant i hown in red or blue, repectively. Mononucleoomal DNA from WT were ubtracted from thoe obtained from jhdδ or et1δ and viualized uing a genome brower. Gain or lo in nucleoome occupancy in the mutant i repreented in red or blue, repectively. RNA-eq read for PHO9 trancript level in WT, jhdδ or et1δ train are alo hown (orange). Schematic diagram at top how the nucleoome organization over promoter and TSS region of the PHO9 gene. Circle, well-poitioned promoter nucleoome; black arrow, TSS; and pink box, Pho binding ite, predicted from the publihed tudie of Badi et al. () and Harbion et al. (). Grape colored arrow and dotted line indicate decreae in nucleoomal occupancy at one of the two predicted Pho binding ite.
 H3K methylation occupancy Enzyme occupancy Fold change in H3K methylation in")
 jhdδ et1δ + + Δ(et1Δ WT) 15 WT 15 15 Change in nucleoome occupancy RNA-eq read Δ(jhdΔ WT) + Δ(et1Δ WT) 15 WT jhdδ et1δ + 15 15 LCP5 DBP Supplementary Figure 1.")
14 a Nucleoome occupancy (MNae-eq read) H3K methylation occupancy Enzyme occupancy Fold change in H3K methylation in jhdδ/wt Fold change in H3K methylation In et1δ/wt 35 WT 5 H3Kme1 5 H3Kme 5 H3Kme3 Jhd Set ΔH3Kme ΔH3Kme 3 +3 ΔH3Kme ΔH3Kme1 +1 ΔH3Kme +1 ΔH3Kme3 b Nucleoome occupancy (MNae-eq read) H3K methylation occupancy Enzyme occupancy Fold change in H3K methylation in jhdδ/wt Fold change in H3K methylation In et1δ/wt 35 WT 5 H3Kme1 5 H3Kme 5 H3Kme3 Jhd Set ΔH3Kme ΔH3Kme 3 +3 ΔH3Kme ΔH3Kme1 +1 ΔH3Kme +1 ΔH3Kme3 Change in nucleoome occupancy RNA-eq read Δ(jhdΔ WT) jhdδ et1δ + + Δ(et1Δ WT) 15 WT Change in nucleoome occupancy RNA-eq read Δ(jhdΔ WT) + Δ(et1Δ WT) 15 WT jhdδ et1δ LCP5 DBP Supplementary Figure 1. Set1 and Jhd co-regulate H3K methylation, nucleoomal occupancy and expreion of candidate Ribi gene, LCP5 and DBP. (a-b) Change in H3K methylation level, nucleoomal occupancy and trancript level for LCP5 and DBP gene in jhdδ or et1δ are hown. The normal nucleoomal, H3K methylation, Jhd and Set1 occupancie at thee gene are alo hown. Read for mononucleoomal DNA in wild type (WT) how the native chromatin organization (brown). Read for H3K monomethyl (me1, magenta), H3K dimethyl (me, cyan) and H3K trimethyl (me3, green) mark in WT how their ditribution over the LCP5 and DBP gene. Jhd (black) and Set1 (pink) occupancy (qpoi) in WT train at the LCP5 and DBP gene are hown. Fold change in the level of H3Kme1, H3Kme and H3Kme3 mark in jhdδ or et1δ relative to that in WT are hown. Fold change in H3K methylation in et1δ relative to WT wa calculated uing data from Chabbert et al (15). Increae or decreae in a given H3K methyl mark in the mutant i hown in red or blue, repectively. Mononucleoomal DNA from WT were ubtracted from thoe obtained from jhdδ or et1δ and viualized uing a genome brower. Gain or lo in nucleoome occupancy in the mutant i repreented in red or blue, repectively. RNA-eq read for LCP5 and DBP trancript level in WT, jhdδ or et1δ train are alo hown (orange).
15 a 1 Cluter 1 Cluter Cluter 3 Cluter Cluter 5 Cluter Normalized Read Count b H3Kme1_WT H3Kme1_jhdΔ H3Kme_WT H3Kme_jhdΔ H3Kme3_WT H3Kme3_jhdΔ Cluter 1 Cluter Cluter 3 Cluter Cluter 5 Cluter Normalized Read Count H3Kme1_WT H3Kme1_et1Δ H3Kme_WT H3Kme_et1Δ H3Kme3_WT H3Kme3_et1Δ c 1 Cluter 1 Cluter Cluter 3 Cluter Cluter 5 Cluter Normalized Read Count H3Kme1_WT H3Kme1_Set1G99E H3Kme_WT H3Kme_Set1G99E H3Kme3_WT H3Kme3_Set1G99E Supplementary Figure 15. Deletion of JHD or SET1 or the expreion of hyperactive Set1- G99E alter H3K methylation level at all ix k-mean cluter. Normalized read count profile for H3Kme1, H3Kme and H3Kme3 mark acro bp region uptream (-) or downtream (+) of the TSS () at gene within the ix k-mean cluter (Fig. a-b) in control wild type (WT), jhdδ or et1δ null mutant and hyperactive Set1-G99E expreing train are hown. Read count for et1δ null mutant and it control wild type train BY71were obtained from publihed dataet of Chabbert et al (15).
16 H3Kme1 H3Kme H3Kme3 Cluter 1 [-log 1 (q-value)] Cluter [-log 1 (q-value)] Cluter 3 [-log 1 (q-value)] Cluter [-log 1 (q-value)] Cluter 5 [-log 1 (q-value)] Cluter [-log 1 (q-value)] jhdδ/wt Set1G99E/WT Supplementary Figure 1. Statitical ignificance are hown for the change in H3K methylation level at the ix gene cluter in jhdδ or Set1G99E mutant compared to control wild type.
..... - - Cluter 3 1. 1. Rpb3 occupancy (log enrichment)..... - - Rpo1 occupancy (log enrichment)..... - - Cluter 1. 1. 5-1 +1 1 Rpb3 occupancy (log enrichment) Rpb3 occupancy (log enrichment).")
17 a 1 Rpo1 occupancy b Rpb3 occupancy (log enrichment) Rpb3 occupancy (log enrichment) Rpo1 occupancy (log enrichment) Rpo1 occupancy (log enrichment) Cluter 1 Cluter 3 Rpb3 occupancy (log enrichment) Rpo1 occupancy (log enrichment) Cluter Rpb3 occupancy (log enrichment) Rpo1 occupancy (log enrichment) Cluter Rpb3 occupancy (log enrichment) Rpb3 occupancy (log enrichment) Rpo1 occupancy (log enrichment) Rpo1 occupancy (log enrichment) Cluter 5 Cluter Relative to TSS Relative to TSS Supplementary Figure 17. Occupancy and ditribution of Rpb3 and Rpo1 at all ix k- mean cluter. (a) Heat map for Rpo1 occupancy within the ix k-mean cluter, uing data from Venter and Pugh (9), i hown. Rpo1 occupancy above global mean i in orange. The mean occupancy profile over each of the ix k-mean cluter (hown in Fig. a-b) are hown for two RNA polymerae II (Pol) ubunit, Rpb3 and Rpo1 (Venter and Pugh, 9). Dotted line mark TSS (). In the chematic at the bottom, circle denote the poition of -1, +1 and coding region nucleoome and the arrow denote the TSS.
18 WT et1δ jhdδ Cluter 1 Cluter Cluter 3 H3 turnover (log) Midpoint Midpoint Midpoint Cluter Cluter 5 Cluter H3 turnover (log) Midpoint Midpoint Midpoint Supplementary Figure 1. Set1 and/or Jhd control nucleoomal turnover at gene within the ix k-mean cluter. Mean profile for hitone H3 turnover acro bp region uptream (-) or downtream (+) of the TSS () at gene within the ix k-mean cluter (Fig. a-b) are hown in wild type (WT), et1δ and jhdδ train.
19 Cluter 1 Cluter Cluter 3 [-log 1 (q-value)] Cluter Cluter 5 Cluter [-log 1 (q-value)] jhdδ/wt et1δ//wt Supplementary Figure 19. Statitical ignificance are hown for the hitone turnover change at the ix k-mean cluter in jhdδ or et1δ mutant compared to wild type.


20 H3Kme1 H3 H3Kme H3Kme3 Supplementary Figure. Full-length image of the blot hown in Fig. a. Panel diplayed in Fig. a are hown within rectangle.


21 H3Kme1 H3Kme H3Kme3 H3 Supplementary Figure 1. Full-length image of the blot hown in Fig. d. Panel diplayed in Fig. d are hown within rectangle.


22 H3Kme1 H3Kme H3Kme3 V5 Flag H3 Supplementary Figure. Full-length image of the blot hown in in Fig. c. Panel hown are within rectangle.
23 Supplementary Table 1. Saccharomyce cereviiae train ued Strain Genotype Source FY Mat a hta1-htb1δ hta-htbδ ly-1δhi3δ ura3-5 psab [HTA1-HTB1 (CEN URA3)] (1) HTABWT HTA1-HTB1 (CEN HIS3); derived from FY () YZS515 Mat a ura3-5 leu-3,11 hi3 trp1δ et1δ::kanmx (3) YZS5 jhdδ::kanmx; derived from FY () YMC ADH1p-FlagSET1::URA3 HTA1-HTB1 (CEN HIS3); derived from HTABWT Thi tudy YMC3 ADH1p-FlagSET1G99E::URA3 HTA1-HTB1 (CEN HIS3); derived from HTABWT Thi tudy YMC ADH1p-JHD-9myc::URA3 HTA1-HTB1 (CEN HIS3); derived from HTABWT Thi tudy YMC et1δ::kanmx HTA1-HTB1 (CEN HIS3); derived from HTABWT () YMC5 jhdδ::natmx et1δ::kanmx HTA1-HTB1 (CEN HIS3); derived from YMC Thi tudy YMC7 jhdδ::kanmx HTA1-HTB1 (CEN HIS3); derived from YZS5 () YMC7 ADH1p-jhdH7A-9myc::URA3 HTA1-HTB1 (CEN HIS3); derived from YMC7 Thi tudy YMC Jhd-1V5::KanMX; derived from FY () YMC5 Jhd-1V5::KanMX HTA1-HTB1 (CEN HIS3); derived from YMC () YMC17 V5-Set1::URA3; derived from HTABWT Thi tudy YMC1 P TDH3 -Cre-EBD7::URA3; derived from HTABWT Thi tudy YMC1 HHT1-V5-LoxP-HphMX-LoxP-FLAG; derived from YMC1 Thi tudy YMC1 (hht-hhf)δ::natmx; derived from YMC1 Thi tudy YMC15 et1δ::kanmx; derived from YMC1 Thi tudy YMC1 jhdδ::kanmx; derived from YMC1 Thi tudy 1. Hirchhorn, J. N., Bortvin, A. L., Ricupero-Hovae, S. L., and Winton, F. (1995) A new cla of hitone HA mutation in Saccharomyce cereviiae caue pecific trancriptional defect in vivo. Mol Cell Biol 15, Huang, F., Ramakrihnan, S., Pokhrel, S., Pflueger, C., Parnell, T. J., Katen, M. M., Currie, S. L., Bhachech, N., Horikohi, M., Grave, B. J., Cairn, B. R., Bhakara, S., and Chandraekharan, M. B. (15) Interaction of the Jhd H3K demethylae with chromatin i controlled by hitone HA urface and retricted by HB ubiquitination. J Biol Chem 9, Huang, F., Chandraekharan, M. B., Chen, Y. C., Bhakara, S., Hiebert, S. W., and Sun, Z. W. (1) The JmjN domain of Jhd i important for it protein tability, and the plant homeodomain (PHD) finger mediate it chromatin aociation independent of H3K methylation. J Biol Chem 5, 5-51
24 Supplementary Table. Primer ued in qrt-pcr Primer Sequence PHO5 Sene For CAGATACGTCATTAACGATGCTGTT PHO5 Sene Rev CCGGCTACTCTCTTTTCAGCA PHO5 Antiene For CCTCGACTTAGCAAAACATCA PHO5 Antiene Rev CGCACATGCCAAATTATCAA PHO9 Sene For TCAATTGAACTAGCTGTTGCTATTACT PHO9 Sene Rev AACCAACAGCGACAATACCA PHO9 Antiene For GTCACTCATTCTATGACAATTCATGT PHO9 Antiene Rev TAAGCCCGGTTTTCGATATGA 5 -SER3-For GACCAAGAGAACACTGTGCGTGTG 3 -SER3-Rev GAGATCTTAGCAGAGGTTTGATTTAG 5 -CHA1-For TTGTAATAGAGGACAAAGATGTTATTG 3 -CHA1-Rev AAATTGTCAGCGACTTCTATTACAGG LCP5-For CAGAGAAGGAACGTAGAGTCACTTC LCP5-Rev TACAGTCTCCTTTGAGCTCTATCCC DBP-For CATAGATCTGGTCGTACGGCCC DBP-Rev TCAAGAGCGCAAACTTTTCCCGTC
7SK ChIRP-seq is specifically RNA dependent and conserved between mice and humans.
 Supplementary Figure 1 7SK ChIRP-seq is specifically RNA dependent and conserved between mice and humans. Regions targeted by the Even and Odd ChIRP probes mapped to a secondary structure model 56 of the
Nature Structural & Molecular Biology: doi: /nsmb Supplementary Figure 1
 Supplementary Figure 1 Effect of HSP90 inhibition on expression of endogenous retroviruses. (a) Inducible shrna-mediated Hsp90 silencing in mouse ESCs. Immunoblots of total cell extract expressing the
Seismic Response Control of Structures using Liquid Column Vibration Absorber Considering Real Earthquake Ground Motions
 Seimic Repone Control of Structure uing iquid Column Vibration Aborber Conidering Real Ground Motion Debai Panda M. Tech Scholar National Intitute of Technology Agartala Agartala, India Dr. Rama Debbarma
a) List of KMTs targeted in the shrna screen. The official symbol, KMT designation,
 List of KMTs targeted in the shrna screen. The official symbol, KMT designation,") Supplementary Information Supplementary Figures Supplementary Figure 1. a) List of KMTs targeted in the shrna screen. The official symbol, KMT designation, gene ID and specifities are provided. Those highlighted
Supplementary Information Supplementary Figures Supplementary Figure 1. a) List of KMTs targeted in the shrna screen. The official symbol, KMT designation, gene ID and specifities are provided. Those highlighted
Histone H3K4 and K36 Methylation, Chd1 and Rpd3S Oppose the Functions of Saccharomyces cerevisiae Spt4 Spt5 in Transcription
 Supporting Information http://www.genetics.org/cgi/content/full/genetics.109.111526/dc1 Histone H3K4 and K36 Methylation, Chd1 and Rpd3S Oppose the Functions of Saccharomyces cerevisiae Spt4 Spt5 in Transcription
Supplementary Information
 Supplementary Information HBV maintains electrostatic homeostasis by modulating negative charges from phosphoserine and encapsidated nucleic acids Authors: Pei-Yi Su 1,2,3, Ching-Jen Yang 2, Tien-Hua Chu
Supplementary Figures
 Supplementary Figures Supplementary Figure 1. Confirmation of Dnmt1 conditional knockout out mice. a, Representative images of sorted stem (Lin - CD49f high CD24 + ), luminal (Lin - CD49f low CD24 + )
SUPPLEMENTARY INFORMATION
 doi:10.1038/nature23267 Discussion Our findings reveal unique roles for the methylation states of histone H3K9 in RNAi-dependent and - independent heterochromatin formation. Clr4 is the sole S. pombe enzyme
Supplementary Figure S1: Defective heterochromatin repair in HGPS progeroid cells
 Supplementary Figure S1: Defective heterochromatin repair in HGPS progeroid cells Immunofluorescence staining of H3K9me3 and 53BP1 in PH and HGADFN003 (HG003) cells at 24 h after γ-irradiation. Scale bar,
Supplemental Figure 1. Genes showing ectopic H3K9 dimethylation in this study are DNA hypermethylated in Lister et al. study.
 mc mc mc mc SUP mc mc Supplemental Figure. Genes showing ectopic HK9 dimethylation in this study are DNA hypermethylated in Lister et al. study. Representative views of genes that gain HK9m marks in their
LETTER. PML-RARA mutations confer varying arsenic trioxide resistance. Protein & Cell. Protein Cell 2017, 8(4): DOI /s
: DOI /s") Protein Cell 2017, 8(4):296 301 DOI 10.1007/13238-016-0356-4 mutation confer varying arenic trioxide reitance Dear Editor, Acute promyelocytic leukemia (APL) caued by the malignant proliferation of bone
Protein Cell 2017, 8(4):296 301 DOI 10.1007/13238-016-0356-4 mutation confer varying arenic trioxide reitance Dear Editor, Acute promyelocytic leukemia (APL) caued by the malignant proliferation of bone
SUPPLEMENTARY INFORMATION
 doi:10.1038/nature12652 Supplementary Figure 1. PRDM16 interacts with endogenous EHMT1 in brown adipocytes. Immunoprecipitation of PRDM16 complex by flag antibody (M2) followed by Western blot analysis
SUPPLEMENTARY INFORMATION
 doi:10.1038/nature10866 a b 1 2 3 4 5 6 7 Match No Match 1 2 3 4 5 6 7 Turcan et al. Supplementary Fig.1 Concepts mapping H3K27 targets in EF CBX8 targets in EF H3K27 targets in ES SUZ12 targets in ES
Nature Immunology: doi: /ni Supplementary Figure 1. Characteristics of SEs in T reg and T conv cells.
 Supplementary Figure 1 Characteristics of SEs in T reg and T conv cells. (a) Patterns of indicated transcription factor-binding at SEs and surrounding regions in T reg and T conv cells. Average normalized
Functional analysis of the Antirrhinum floral homeotic DEFICIENS gene in vivo and in vitro by using a temperature-sensitive mutant
 Development 121, 2861-2875(1995) Printed in Great Britain The Company of Biologit Limited 1995 2861 Functional analyi of the Antirrhinum floral homeotic DEFICIENS gene in vivo and in vitro by uing a temperature-enitive
Table S1. Relative abundance of AGO1/4 proteins in different organs. Table S2. Summary of smrna datasets from various samples.
 Supplementary files Table S1. Relative abundance of AGO1/4 proteins in different organs. Table S2. Summary of smrna datasets from various samples. Table S3. Specificity of AGO1- and AGO4-preferred 24-nt
reads observed in trnas from the analysis of RNAs carrying a 5 -OH ends isolated from cells induced to express
 Supplementary Figure 1. VapC-mt4 cleaves trna Ala2 in E. coli. Histograms representing the fold change in reads observed in trnas from the analysis of RNAs carrying a 5 -OH ends isolated from cells induced
Evaluation of a Program to Enhance Young Drivers Safety in Israel
 Evaluation of a Program to Enhance Young Driver Safety in Irael Tomer Toledo* Technion Irael Intitute of Technology, Haifa, Irael Tippy Lotan Or Yarok, Hod Haharon, Irael Orit Taubman - Ben-Ari Bar-Ilan
Supplementary Fig. S1. Schematic diagram of minigenome segments.
 open reading frame 1565 (segment 5) 47 (-) 3 5 (+) 76 101 125 149 173 197 221 246 287 open reading frame 890 (segment 8) 60 (-) 3 5 (+) 172 Supplementary Fig. S1. Schematic diagram of minigenome segments.
Comparison of open chromatin regions between dentate granule cells and other tissues and neural cell types.
 Supplementary Figure 1 Comparison of open chromatin regions between dentate granule cells and other tissues and neural cell types. (a) Pearson correlation heatmap among open chromatin profiles of different
Nature Immunology: doi: /ni Supplementary Figure 1 33,312. Aire rep 1. Aire rep 2 # 44,325 # 44,055. Aire rep 1. Aire rep 2.
 a 33,312 b rep 1 rep 1 # 44,325 rep 2 # 44,055 [0-84] rep 2 [0-84] 1810043G02Rik Pfkl Dnmt3l Icosl rep 1 [0-165] rep 2 [0-165] Rps14 Cd74 Mir5107 Tcof1 rep 1 [0-69] rep 2 [0-68] Id3 E2f2 Asap3 rep 1 [0-141]
EXPLORING COGNITIVE STRATEGIES FOR INTEGRATING MULTIPLE-VIEW VISUALIZATIONS
 EXPLORING COGNITIVE STRATEGIES FOR INTEGRATING MULTIPLE-VIEW VISUALIZATIONS Young Sam Ryu 1, Beth Yot 2, Gregorio Convertino 2, Jian Chen 2, and Chri North 2 Grado Department of Indutrial and Sytem Engineering
Nature Genetics: doi: /ng Supplementary Figure 1. Immunofluorescence (IF) confirms absence of H3K9me in met-2 set-25 worms.
 confirms absence of H3K9me in met-2 set-25 worms.") Supplementary Figure 1 Immunofluorescence (IF) confirms absence of H3K9me in met-2 set-25 worms. IF images of wild-type (wt) and met-2 set-25 worms showing the loss of H3K9me2/me3 at the indicated developmental
Supplementary Figure 1 Immunofluorescence (IF) confirms absence of H3K9me in met-2 set-25 worms. IF images of wild-type (wt) and met-2 set-25 worms showing the loss of H3K9me2/me3 at the indicated developmental
Data for MBI Workshop Statistics of Time Warpings and Phase Variations. Three-dimensional vascular geometry dataset
 Data for MBI Workhop Statitic of Time Warping and Phae Variation Mathematical Biocience Intitute, November 13-16, 2012 Three-dimenional vacular geometry dataet May 30, 2012 1 Data background Thee data
Supplementary Figure 1. Efficiency of Mll4 deletion and its effect on T cell populations in the periphery. Nature Immunology: doi: /ni.
 Supplementary Figure 1 Efficiency of Mll4 deletion and its effect on T cell populations in the periphery. Expression of Mll4 floxed alleles (16-19) in naive CD4 + T cells isolated from lymph nodes and
QUANTITATIVE STUDIES ON THE CILIATE GLAUCOMA
 422 QUANTITATIVE STUDIES ON THE CILIATE GLAUCOMA I. THE REGULATION OF THE SIZE AND THE FISSION RATE BY THE BACTERIAL FOOD SUPPLY BY J. P. HARDING, PH.D. Zoological Laboratory, Cambridge (Received 2 February
Supplementary Figure 1. Schematic diagram of o2n-seq. Double-stranded DNA was sheared, end-repaired, and underwent A-tailing by standard protocols.
 Supplementary Figure 1. Schematic diagram of o2n-seq. Double-stranded DNA was sheared, end-repaired, and underwent A-tailing by standard protocols. A-tailed DNA was ligated to T-tailed dutp adapters, circularized
An Unexpected Function of the Prader-Willi Syndrome Imprinting Center in Maternal Imprinting in Mice
 An Unexpected Function of the Prader-Willi Syndrome Imprinting Center in Maternal Imprinting in Mice Mei-Yi Wu 1 *, Ming Jiang 1, Xiaodong Zhai 2, Arthur L. Beaudet 2, Ray-Chang Wu 1 * 1 Department of
H3K4 demethylase KDM5B regulates global dynamics of transcription elongation and alternative splicing in embryonic stem cells
 Nucleic Acids Research, 2017 1 doi: 10.1093/nar/gkx251 H3K4 demethylase KDM5B regulates global dynamics of transcription elongation and alternative splicing in embryonic stem cells Runsheng He 1,2 and
Investigative and mechanistic toxicology Mechanism-based problem solving
 Invetigative and mechanitic toxicology Mechanim-baed problem olving the invetigative & exploratory toxicology company www.cxrbiocience.com Invetigative and mechanitic toxicology CXR Biocience : Our approach
Supplementary Appendix
 Supplementary Appendix This appendix has been provided by the authors to give readers additional information about their work. Supplement to: Choi YL, Soda M, Yamashita Y, et al. EML4-ALK mutations in
Supporting Online Material for
 www.sciencemag.org/cgi/content/full/1171320/dc1 Supporting Online Material for A Frazzled/DCC-Dependent Transcriptional Switch Regulates Midline Axon Guidance Long Yang, David S. Garbe, Greg J. Bashaw*
Supplemental Information. Genomic Characterization of Murine. Monocytes Reveals C/EBPb Transcription. Factor Dependence of Ly6C Cells
 Immunity, Volume 46 Supplemental Information Genomic Characterization of Murine Monocytes Reveals C/EBPb Transcription Factor Dependence of Ly6C Cells Alexander Mildner, Jörg Schönheit, Amir Giladi, Eyal
fl/+ KRas;Atg5 fl/+ KRas;Atg5 fl/fl KRas;Atg5 fl/fl KRas;Atg5 Supplementary Figure 1. Gene set enrichment analyses. (a) (b)
 (b)") KRas;At KRas;At KRas;At KRas;At a b Supplementary Figure 1. Gene set enrichment analyses. (a) GO gene sets (MSigDB v3. c5) enriched in KRas;Atg5 fl/+ as compared to KRas;Atg5 fl/fl tumors using gene set
KRas;At KRas;At KRas;At KRas;At a b Supplementary Figure 1. Gene set enrichment analyses. (a) GO gene sets (MSigDB v3. c5) enriched in KRas;Atg5 fl/+ as compared to KRas;Atg5 fl/fl tumors using gene set
Supplementary Materials for
 www.sciencesignaling.org/cgi/content/full/8/375/ra41/dc1 Supplementary Materials for Actin cytoskeletal remodeling with protrusion formation is essential for heart regeneration in Hippo-deficient mice
File name: Supplementary Information Description: Supplementary figures and supplementary tables. File name: Peer review file Description:
 File name: Supplementary Information Description: Supplementary figures and supplementary tables. File name: Peer review file Description: Supplementary Figure 1. Schematic of Ras biochemical coupled assay.
Supplementary Figure 1
 Supplementary Figure 1 Asymmetrical function of 5p and 3p arms of mir-181 and mir-30 families and mir-142 and mir-154. (a) Control experiments using mirna sensor vector and empty pri-mirna overexpression
AP VP DLP H&E. p-akt DLP
 A B AP VP DLP H&E AP AP VP DLP p-akt wild-type prostate PTEN-null prostate Supplementary Fig. 1. Targeted deletion of PTEN in prostate epithelium resulted in HG-PIN in all three lobes. (A) The anatomy
An economic analysis of a methionine source comparison response model
 An economic analyi of a methionine ource comparion repone model D. Vedenov and G. M. Peti 1 Department of Agricultural Economic, Texa A&M Univerity, 2124 TAMU, College Station 77843-2124; and Department
Protein Structure Prediction using 2D HP Lattice Model Based on Integer Programming Approach
 212 International Congre on Informatic, Environment, Energy and Application-IEEA 212 IPCSIT vol.38 (212) (212) IACSIT Pre, Singapore Protein Structure Prediction uing 2D HP Lattice Model Baed on Integer
Supplementary Figure 1. SC35M polymerase activity in the presence of Bat or SC35M NP encoded from the phw2000 rescue plasmid.
 1 2 3 4 5 6 7 8 9 10 11 12 13 14 15 16 17 18 19 20 21 22 23 24 25 26 27 Supplementary Figure 1. SC35M polymerase activity in the presence of Bat or SC35M NP encoded from the phw2000 rescue plasmid. HEK293T
Supplementary Figure S1. Gene expression analysis of epidermal marker genes and TP63.
 Supplementary Figure Legends Supplementary Figure S1. Gene expression analysis of epidermal marker genes and TP63. A. Screenshot of the UCSC genome browser from normalized RNAPII and RNA-seq ChIP-seq data
Numerical Simulation of Scour Depth Variation Around Vertical Wall Abutments
 World Journal of Reearch and Review (WJRR) ISSN:2455-3956, Volume-5, Iue-6, December 2017 Page 25-30 Numerical Simulation of Scour Depth Variation Around Vertical Wall Abutment Evangelia Farirotou, Nikolao
Nature Structural & Molecular Biology: doi: /nsmb.2419
 Supplementary Figure 1 Mapped sequence reads and nucleosome occupancies. (a) Distribution of sequencing reads on the mouse reference genome for chromosome 14 as an example. The number of reads in a 1 Mb
Supplementary Information
 Supplementary Information Supplementary Figure 1! a! b! Nfatc1!! Nfatc1"! P1! P2! pa1! pa2! ex1! ex2! exons 3-9! ex1! ex11!!" #" Nfatc1A!!" Nfatc1B! #"!" Nfatc1C! #" DN1! DN2! DN1!!A! #A!!B! #B!!C! #C!!A!
Cortical representations of confidence in a visual perceptual decision
 Received Feb Accepted Apr Publihed 5 Jun DOI:.8/ncomm9 Cortical repreentation of confidence in a viual perceptual deciion Leopold Zizlperger,, *, Thoma Sauvigny, *, Barbara Händel & Thoma Haarmeier,5 To
Spinal Flexibility and Individual Factors That Influence It
 Spinal lexibility and Individual actor That Influence It ICHELE C. BATTI'E, STANLEY J. BIGOS, ANN SHEEHY, and ARK D. WORTLEY We conducted an invetigation to examine the pinal flexibility of a large, adult
INTEGRATION OF GENERAL AMINO ACID CONTROL AND TOR REGULATORY PATHWAYS IN NITROGEN ASSIMILATION IN YEAST
 INTEGRATION OF GENERAL AMINO ACID CONTROL AND TOR REGULATORY PATHWAYS IN NITROGEN ASSIMILATION IN YEAST Kirk A. Staschke 1, Souvik Dey 1, John M. Zaborske 2, Lakshmi Reddy Palam 1, Jeanette N. McClintick
p.r623c p.p976l p.d2847fs p.t2671 p.d2847fs p.r2922w p.r2370h p.c1201y p.a868v p.s952* RING_C BP PHD Cbp HAT_KAT11
 ARID2 p.r623c KMT2D p.v650fs p.p976l p.r2922w p.l1212r p.d1400h DNA binding RFX DNA binding Zinc finger KMT2C p.a51s p.d372v p.c1103* p.d2847fs p.t2671 p.d2847fs p.r4586h PHD/ RING DHHC/ PHD PHD FYR N
EFFECTS OF BARLEY PROCESSING ON THE BIO- PRODUCTIVE INDICES IN FATTENING WEANED LAMBS
 Lucrări ştiinńifice Zootehnie şi Biotehnologii, vol. 41(1) (2008) Timişoara EFFECTS OF BARLEY PROCESSING ON THE BIO- PRODUCTIVE INDICES IN FATTENING WEANED LAMBS EFECTUL PROCESĂRII ORZULUI ASUPRA INDICILOR
SUPPLEMENTARY INFORMATION
 doi:.38/nature8975 SUPPLEMENTAL TEXT Unique association of HOTAIR with patient outcome To determine whether the expression of other HOX lincrnas in addition to HOTAIR can predict patient outcome, we measured
Classifying Knee Pathologies using Instantaneous Screws of the Six Degrees-of-Freedom Knee Motion
 Proceeding of the 26 IEEE International Conference on Robotic and Automation Orlando, Florida - May 26 Claifying Knee Pathologie uing Intantaneou Screw of the Six Degree-of-Freedom Knee Motion Alon Wolf
Nature Biotechnology: doi: /nbt Supplementary Figure 1. PL gene expression in tomato fruit.
 Supplementary Figure 1 PL gene expression in tomato fruit. Relative expression of five PL-coding genes measured in at least three fruit of each genotype (cv. Alisa Craig) at four stages of development,
Alpha thalassemia mental retardation X-linked. Acquired alpha-thalassemia myelodysplastic syndrome
 Alpha thalassemia mental retardation X-linked Acquired alpha-thalassemia myelodysplastic syndrome (Alpha thalassemia mental retardation X-linked) Acquired alpha-thalassemia myelodysplastic syndrome Schematic
SUPPLEMENTARY INFORMATION
 DOI: 10.1038/ncb2607 Figure S1 Elf5 loss promotes EMT in mammary epithelium while Elf5 overexpression inhibits TGFβ induced EMT. (a, c) Different confocal slices through the Z stack image. (b, d) 3D rendering
Nature Immunology: doi: /ni Supplementary Figure 1. Huwe1 has high expression in HSCs and is necessary for quiescence.
 Supplementary Figure 1 Huwe1 has high expression in HSCs and is necessary for quiescence. (a) Heat map visualizing expression of genes with a known function in ubiquitin-mediated proteolysis (KEGG: Ubiquitin
Genome-editing via Oviductal Nucleic Acids Delivery (GONAD) system: a novel microinjection-independent genome engineering method in mice
 system: a novel microinjection-independent genome engineering method in mice") Supplementary Information Genome-editing via Oviductal Nucleic Acids Delivery (GONAD) system: a novel microinjection-independent genome engineering method in mice Gou Takahashi, Channabasavaiah B Gurumurthy,
Supplementary Information Genome-editing via Oviductal Nucleic Acids Delivery (GONAD) system: a novel microinjection-independent genome engineering method in mice Gou Takahashi, Channabasavaiah B Gurumurthy,
Contour Integration in Anisometropic Amblyopia
 Pergamon PII: 0042-6989(97)00233-2 Viion Re., Vol. 38, No. 6, pp. 889-894, 1998 1998 Elevier cience Ltd. All right reerved Printed in Great Britain 0042-6989/98 $19.00 + 0.00 Contour Integration in Aniometropic
T H E J O U R N A L O F C E L L B I O L O G Y
 T H E J O U R N A L O F C E L L B I O L O G Y Supplemental material Stelter et al., http://www.jcb.org/cgi/content/full/jcb.201105042/dc1 S1 Figure S1. Dyn2 recruitment to edid-labeled FG domain Nups.
Title: Smooth muscle cell-specific Tgfbr1 deficiency promotes aortic aneurysm formation by stimulating multiple signaling events
 Title: Smooth muscle cell-specific Tgfbr1 deficiency promotes aortic aneurysm formation by stimulating multiple signaling events Pu Yang 1, 3, radley M. Schmit 1, Chunhua Fu 1, Kenneth DeSart 1, S. Paul
Appendix Am A Comparison of the National Cancer Institute s and the International Agency for Research on Cancer s Evaluation of Bioassay Results
 Appendixe.. Content Page Appendix A: A Comparion of the National Cancer ntitute and the nternational Agency for Reearch on Cancer Evaluation of Bioaay Reult...........................................211
Nature Structural & Molecular Biology: doi: /nsmb.3218
 Supplementary Figure 1 Endogenous EGFR trafficking and responses depend on biased ligands. (a) Lysates from HeLa cells stimulated for 2 min. with increasing concentration of ligands were immunoblotted
SUPPLEMENTARY INFORMATION
 SUPPLEMENTARY INFORMATION Supplementary Figure 1. Generation of a conditional allele of the Kindlin-2 gene. (A) A restriction map of the relevant genomic region of Kindlin-2 (top), the targeting construct
High Throughput Sequence (HTS) data analysis. Lei Zhou
 data analysis. Lei Zhou") High Throughput Sequence (HTS) data analysis Lei Zhou (leizhou@ufl.edu) High Throughput Sequence (HTS) data analysis 1. Representation of HTS data. 2. Visualization of HTS data. 3. Discovering genomic
High Throughput Sequence (HTS) data analysis Lei Zhou (leizhou@ufl.edu) High Throughput Sequence (HTS) data analysis 1. Representation of HTS data. 2. Visualization of HTS data. 3. Discovering genomic
65 ISSN East Cent. Afr. J. surg
 65 ISSN 2073-9990 Eat Cent. Afr. J. urg Pattern and and Outcome of Surgical Management of Potrenal Acute Renal Failure Over Three Year Period at Tikur Anbea Specialized Hopital. L. Samodai, D. Andualem,
Supplementary Information. Preferential associations between co-regulated genes reveal a. transcriptional interactome in erythroid cells
 Supplementary Information Preferential associations between co-regulated genes reveal a transcriptional interactome in erythroid cells Stefan Schoenfelder, * Tom Sexton, * Lyubomira Chakalova, * Nathan
Nature Immunology: doi: /ni Supplementary Figure 1. DNA-methylation machinery is essential for silencing of Cd4 in cytotoxic T cells.
 Supplementary Figure 1 DNA-methylation machinery is essential for silencing of Cd4 in cytotoxic T cells. (a) Scheme for the retroviral shrna screen. (b) Histogram showing CD4 expression (MFI) in WT cytotoxic
Broad H3K4me3 is associated with increased transcription elongation and enhancer activity at tumor suppressor genes
 Broad H3K4me3 is associated with increased transcription elongation and enhancer activity at tumor suppressor genes Kaifu Chen 1,2,3,4,5,10, Zhong Chen 6,10, Dayong Wu 6, Lili Zhang 7, Xueqiu Lin 1,2,8,
Biophysical Regulation of Lipid Biosynthesis in the Plasma Membrane
 2938 Biophyical Journal Volume 94 April 2008 2938 2954 Biophyical Regulation of Lipid Bioynthei in the Plama Membrane Stephen H. Alley,* Ocar Ce, y Richard H. Templer, y and Mauricio Barahona* z *Department
(B D) Three views of the final refined 2Fo-Fc electron density map of the Vpr (red)-ung2 (green) interacting region, contoured at 1.4σ.
 Three views of the final refined 2Fo-Fc electron density map of the Vpr (red)-ung2 (green) interacting region, contoured at 1.4σ.") Supplementary Figure 1 Overall structure of the DDB1 DCAF1 Vpr UNG2 complex. (A) The final refined 2Fo-Fc electron density map, contoured at 1.4σ of Vpr, illustrating well-defined side chains. (B D) Three
Supplementary Figure 1 Overall structure of the DDB1 DCAF1 Vpr UNG2 complex. (A) The final refined 2Fo-Fc electron density map, contoured at 1.4σ of Vpr, illustrating well-defined side chains. (B D) Three
Effect of Graded Electrical Stimulation on Blood Flow to Healthy Muscle
 Effect of Graded Electrical Stimulation on Blood Flow to Healthy Mucle DEAN P. CURRIER, CYNTHIA REED PETRILLI, and A. JOSEPH THRELKELD The purpoe of thi tudy wa to determine whether 2,500-Hz ine-wave electrical
Supplementary Information
 Supplementary Information Precursors of trnas are stabilized by methylguanosine cap structures Takayuki Ohira and Tsutomu Suzuki Department of Chemistry and Biotechnology, Graduate School of Engineering,
Supplementary Figure-1. SDS PAGE analysis of purified designed carbonic anhydrase enzymes. M1-M4 shown in lanes 1-4, respectively, with molecular
 Supplementary Figure-1. SDS PAGE analysis of purified designed carbonic anhydrase enzymes. M1-M4 shown in lanes 1-4, respectively, with molecular weight markers (M). Supplementary Figure-2. Overlay of
Nature Structural & Molecular Biology: doi: /nsmb Supplementary Figure 1
 Supplementary Figure 1 Design of isolated protein and RNC constructs, and homogeneity of purified RNCs. (a) Schematic depicting the design and nomenclature used for all the isolated proteins and RNCs used
Nature Getetics: doi: /ng.3471
 Supplementary Figure 1 Summary of exome sequencing data. ( a ) Exome tumor normal sample sizes for bladder cancer (BLCA), breast cancer (BRCA), carcinoid (CARC), chronic lymphocytic leukemia (CLLX), colorectal
Patellofemoral Joint Forces During Ergometric Cycling
 Patellofemoral Joint Force During Ergometric Cycling MATS O. ERICSON and RALPH NISELL We etimated the patellofemoral joint force generated during pedaling on a bicycle ergometer. Our calculation were baed
Figure S1 Expression of AHL gene family members in diploid (Ler Col) and triploid (Ler
 and triploid (Ler") Supplemental material Supplemental figure legends Figure S Expression of AHL gene family members in diploid (Ler ) and triploid (Ler osd) seeds. AHLs from clade B are labelled with (I), and AHLs from clade
Supplemental material Supplemental figure legends Figure S Expression of AHL gene family members in diploid (Ler ) and triploid (Ler osd) seeds. AHLs from clade B are labelled with (I), and AHLs from clade
Department of Chemistry, Université de Montréal, C.P. 6128, Succursale centre-ville, Montréal, Québec, H3C 3J7, Canada.
 Phosphoproteome dynamics of Saccharomyces cerevisiae under heat shock and cold stress Evgeny Kanshin 1,5, Peter Kubiniok 1,2,5, Yogitha Thattikota 1,3, Damien D Amours 1,3 and Pierre Thibault 1,2,4 * 1
(a) Schematic diagram of the FS mutation of UVRAG in exon 8 containing the highly instable
 Schematic diagram of the FS mutation of UVRAG in exon 8 containing the highly instable") Supplementary Figure 1. Frameshift (FS) mutation in UVRAG. (a) Schematic diagram of the FS mutation of UVRAG in exon 8 containing the highly instable A 10 DNA repeat, generating a premature stop codon
Supplementary Figure 1. Frameshift (FS) mutation in UVRAG. (a) Schematic diagram of the FS mutation of UVRAG in exon 8 containing the highly instable A 10 DNA repeat, generating a premature stop codon
EPIGENETIC RE-EXPRESSION OF HIF-2α SUPPRESSES SOFT TISSUE SARCOMA GROWTH
 EPIGENETIC RE-EXPRESSION OF HIF-2α SUPPRESSES SOFT TISSUE SARCOMA GROWTH Supplementary Figure 1. Supplementary Figure 1. Characterization of KP and KPH2 autochthonous UPS tumors. a) Genotyping of KPH2
Supplementary Information A Hydrophobic Barrier Deep Within the Inner Pore of the TWIK-1 K2P Potassium Channel Aryal et al.
 Supplementary Information A Hydrophobic Barrier Deep Within the Inner Pore of the TWIK-1 K2P Potassium Channel Aryal et al. Supplementary Figure 1 TWIK-1 stability during MD simulations in a phospholipid
Nature Genetics: doi: /ng.3731
 Supplementary Figure 1 Circadian profiles of Adarb1 transcript and ADARB1 protein in mouse tissues. (a) Overlap of rhythmic transcripts identified in the previous transcriptome analyses. The mouse liver
Supplementary Figure 1. Baf60c and baf180 are induced during cardiac regeneration in zebrafish. RNA in situ hybridization was performed on paraffin
 Supplementary Figure 1. Baf60c and baf180 are induced during cardiac regeneration in zebrafish. RNA in situ hybridization was performed on paraffin sections from sham-operated adult hearts (a and i) and
Supplementary Figures
 Supplementary Figures Supplementary Figure 1. Pan-cancer analysis of global and local DNA methylation variation a) Variations in global DNA methylation are shown as measured by averaging the genome-wide
Non Palpable Breast Mass : Radiological & Pathological Evaluation
 Reearch Article Non Palpable Breat Ma : Radiological & Pathological Evaluation Waan Imail Al-Saadi, Iraa Qader, Qahtan Adnan Mahdi, Yaarub Idree Date Submitted: 30/6/2015 Date Accepted:11/11/2015 Addre
ddm1a (PFG_3A-51065) ATG ddm1b (PFG_2B-60109) ATG osdrm2 (PFG_3A-04110) osdrm2 osdrm2 osdrm2
 ATG ddm1b (PFG_2B-60109) ATG osdrm2 (PFG_3A-04110) osdrm2 osdrm2 osdrm2") Relative expression.6.5.4.3.2.1 OsDDM1a OsDDM1b OsDRM2 TG TG TG ddm1a (PFG_3-5165) P1 P3 ddm1b (PFG_2-619) P2 531bp 5233bp P1 P4 P3 P2 F1 R1 F1 TG TG TG F1 R1 C ddm1a -/- -/- ddm1b -/- +/- +/- -/- D (PFG_3-411)
Relative expression.6.5.4.3.2.1 OsDDM1a OsDDM1b OsDRM2 TG TG TG ddm1a (PFG_3-5165) P1 P3 ddm1b (PFG_2-619) P2 531bp 5233bp P1 P4 P3 P2 F1 R1 F1 TG TG TG F1 R1 C ddm1a -/- -/- ddm1b -/- +/- +/- -/- D (PFG_3-411)
Supplementary Figure 1
 Supplementary Figure 1 Supplementary Figure 1 Schematic depiction of the tandem Fc GDF15. Supplementary Figure 2 Supplementary Figure 2 Gfral mrna levels in the brains of both wild-type and knockout Gfral
ACT1 PACT1-RFP PFLO1-YFP
 Saccharomyces cerevisiae Saccharomyces cerevisiae, FLO1 POL3 ACT1 P ACT1 -RFP P FLO1 -YFP P ACT1 i.e. SIR4 YJL070C sir4-100 scw11-e261* vps5-s520l, pet127- D650N whi2-r127* HBN1IDS2YJL070C HBN1IDS2
Investigation On The Occurrence of Yeast Species in the Digestive Tracts of Broiler
 Invetigation On The Occurrence of Yeat Specie in the Digetive Tract of Broiler Fadhil.A.ALShimmery Abtract : From the intetinal tract of 35 out of 50 bird 58 yeat iolate belonging to 3 genu and 6 pecie
Point defects in silicon after zinc diffusion a deep level transient spectroscopy and spreading-resistance profiling study
 Semicond. Sci. Technol. 14 (1999) 435 440. Printed in the UK PII: S0268-1242(99)93053-5 Point defect in ilicon after zinc diffuion a deep level tranient pectrocopy and preading-reitance profiling tudy
SUPPLEMENTARY INFORMATION
 DOI:.38/ncb3399 a b c d FSP DAPI 5mm mm 5mm 5mm e Correspond to melanoma in-situ Figure a DCT FSP- f MITF mm mm MlanaA melanoma in-situ DCT 5mm FSP- mm mm mm mm mm g melanoma in-situ MITF MlanaA mm mm
A high-throughput ChIP-Seq for large-scale chromatin studies
 Article A high-throughput ChIP-Seq for large-scale chromatin studies Christophe D Chabbert,1, Sophie H Adjalley,1, Bernd Klaus 1, Emilie S Fritsch 1, Ishaan Gupta 1, Vicent Pelechano 1,* & Lars M Steinmetz
SUPPLEMENTARY INFORMATION
 In the format provided by the authors and unedited. SUPPLEMENTARY INFORMATION VOLUME: 2 ARTICLE NUMBER: 17084 Metabolic anticipation in Mycobacterium tuberculosis Hyungjin Eoh, Zhe Wang, Emilie Layre,
ORIGINAL ARTICLE. Key Words: Glutathione-S-transferase, Acute lymphocytic leukemia, polymorphic enzymes
 ORIGINAL ARTICLE Genetic Polymorphim of Glutathione-S-Tranferae P1, T1 and M1 in Pediatric with Acute Lymphocytic Leukemia in a Philippine Tertiary Hopital Maria Melanie Liberty B. Alcauin 1, Pamela D.
SUPPLEMENTARY FIGURES
 SUPPLEMENTARY FIGURES Figure S1. Clinical significance of ZNF322A overexpression in Caucasian lung cancer patients. (A) Representative immunohistochemistry images of ZNF322A protein expression in tissue
Figure S1A. Blood glucose levels in mice after glucose injection
 ## Figure S1A. Blood glucose levels in mice after glucose injection Blood glucose (mm/l) 25 2 15 1 5 # 15 3 6 3+3 Time after glucose injection (min) # Figure S1B. α-kg levels in mouse livers after glucose
Comparison of Selected Pulse Frequencies from Two Different Electrical Stimulators on Blood Flow in Healthy Subjects
 Comparion of Selected Pule Frequencie from Two Different Electrical Stimulator on Blood Flow in Healthy Subject JAMES E. TRACY, DEAN P. CURRIER, and A. JOSEPH THRELKELD The purpoe of thi tudy wa to meaure
Supplementary Figure 1.TRIM33 binds β-catenin in the nucleus. a & b, Co-IP of endogenous TRIM33 with β-catenin in HT-29 cells (a) and HEK 293T cells
 and HEK 293T cells") Supplementary Figure 1.TRIM33 binds β-catenin in the nucleus. a & b, Co-IP of endogenous TRIM33 with β-catenin in HT-29 cells (a) and HEK 293T cells (b). TRIM33 was immunoprecipitated, and the amount of
Supplementary Figure 1.TRIM33 binds β-catenin in the nucleus. a & b, Co-IP of endogenous TRIM33 with β-catenin in HT-29 cells (a) and HEK 293T cells (b). TRIM33 was immunoprecipitated, and the amount of
THE INVESTIGATION OF THE EFFECT OF THE REINFORCEMENT S KIND ON THE TENSILE STRENGTH IN THE FIBER REINFORCED COMPOSITE MATERIALS
 Trakia Journal of Science, Vol. 7, Suppl. 2, pp 15-19, 2009 Copyright 2009 Trakia Univerity Available online at: http://www.uni-z.bg ISSN 1313-7050 (print) ISSN 1313-3551 (online) Original Contribution
Lipid Segregation on Cylindrically and Spherically Curved Membranes
 Lipid Segregation on Cylindrically and Spherically Curved Membrane where n and u are unit vector repreenting, repectively, lipid orientation and membrane normal, repreent the two-dimenional derivative