ABSTRACT PLASTICITY. Kaiwen He,Ph.D,2009. Long-term changes in synaptic strength, such as long-term potentiation (LTP) and
|
|
|
- Samuel Atkins
- 5 years ago
- Views:
Transcription
1 ABSTRACT Title of Document: AMPA RECEPTOR AND SYNAPTIC PLASTICITY Kaiwen He,Ph.D,2009 Directed By: Professor Hey-Kyoung Lee Department of Biology / NACS Long-term changes in synaptic strength, such as long-term potentiation (LTP) and long-term depression (LTD), have been proposed to be the cellular correlates of learning and memory formation. In the hippocampus, an area of the brain associated with memory formation, LTP and LTD require functional modification of AMPA receptors (AMPARs). Since AMPARs are the major ionotropic glutamate receptors in the brain, changing the single channel properties and/or the number at synapses can greatly affect excitatory synaptic function. Recent studies highlight that functional recruitment of Ca 2+ -permeable AMPARs (CP-AMPARs) at synapses is another key regulatory mechanism that alter excitatory synaptic transmission. By combining electrophysiology, biochemistry, and imaging methods, I found that phosphorylation of the GluR1 subunit of AMPAR on the serine-845 site (GluR1- S845) is critical for the functional recruitment of CP-AMPARs. This has functional consequences as CP-AMPARs can be expressed at synapses by various neuronal activities both in vitro and in vivo, such as by LTP, sensory experiences, brain
2 diseases and drug addiction. On the other hand, dephosphorylation of the GluR1- S845 is necessary for producing long-term synaptic depression, which is accompanied by a loss in functional CP-AMPARs. Interestingly, the GluR1-S845 site is not required for the plasticity of dendritic spine structures, which is considered an important mechanism for long-term synaptic plasticity as well as learning and memory formation. These results suggest that the functional change in synaptic transmission and the structural synaptic plasticity may utilize separate signaling cascades. In a parallel study, I demonstrated that the beta-site cleaving enzyme 1 (BACE1), which cleaves the amyloid precursor protein (APP) to release the amyloid β peptide (Aβ), is also involved in regulating synaptic plasticity. Using mice lacking the BACE1 gene, I found that BACE1 is involved in specific forms of synaptic plasticity as well as presynaptic function. Abnormal accumulation of Aβ by excessive BACE1 activity is thought responsible for triggering the pathology of Alzheimer s disease (AD). However, my results caution the development of AD therapeutics targeting the BACE1 activity. In summary, my studies demonstrate that the function of AMPA receptors can be regulated in multiple ways, including phosphorylation of a single amino acid, and is critically involved in synaptic plasticity that underlies learning and memory formation.
3 AMPA RECEPTOR AND SYNAPTIC PLASTICITY By Kaiwen He Dissertation submitted to the Faculty of the Graduate School of the University of Maryland, College Park, in partial fulfillment of the requirements for the degree of Doctor of Philosophy 2009 Advisory Committee: Dr. Hey-Kyoung Lee, Chair Dr. Jens Herberholz Dr. Mary Ann Ottinger Dr. Elizabeth Quinlan Dr. Sameer Shah
4 Copyright by [Kaiwen He] [2009]
5 Dedication To my parents, Jianhua and Yingxia ii
6 Acknowledgements First of all, I would like to express my deep and sincere gratitude to my advisor Dr. Hey-Kyoung Lee. She not only opened the door to the world of neuroscience for me, but also guided me through step by step during these years. She is such a great scientist and thoughtful mentor; it is her strict but extremely patient guidance and continuous encouragement and support that helped me over come all the confusion and obstacles. I would also like to thank all my committee members who always showed their support and gave me very helpful suggestions on my study and research. In addition, I am grateful to all the other NACS/Biol faculty and staff, who helped me with all the academic-related and non-related issues. I want to thank all my friends who shared my joy, comforted my sadness, and helped me getting throught many difficulties. Lastly, and most importantly, I wish I could express enough thankfulness to my families: My beloved parents, who not only gave birth to me, raised and taught me, but also unselfishly love me and support me all my life. My dearest husband Zhen, who understands me, tolerates me, encourages me and supports me all the time. Without him, I could ve never finished my thesis. My priceless daughter Jing-yun gives me countless happiness, which has been so helpful in releasing pressure. My elder sister Zhiwen with whom I can share a lot of things even though we are far away from each other. I also want to thank my parents-in-law for their love and support. iii
7 Table of Contents Dedication... ii Acknowledgements... iii Table of Contents... ii List of Figures... v Chapter 1: Introduction... 1 Section 1 Synaptic plasticity and learning and memory... 1 Subsection 1. Synaptic plasticity as the cellular basis for learning and memory formation... 1 Subsection 2. Homeostatic plasticity is required to stabilize the neural network and maintain its capacity to learn and store new information... 2 Section 2 Cellular and molecular mechanism of long-term synaptic plasticity... 3 Subsection 1. NMDAR-dependent LTP... 4 Subsection 2. NMDAR-dependent LTD Section 3 Regulation of AMPA receptor function Subsection 1. AMPAR functions regulated by subunit composition Subsection 2. Regulation of AMPAR functions by phosphorylation Section 4 Structural plasticity of dendritic spines Subsection 1. A brief introduction to the dendritic spine morphology Subsection 2. Alteration in dendritic spine morphology associated with longterm synaptic plasticity and learning and memory Subsection 3. Important signaling molecules involved in the plasticity of spine structure Section 5 Cellular and molecular basis of Alzheimer s disease (AD) Subsection 1. A brief introduction to AD Subsection 2. Synaptic mechanism of ADs based on the amyloid hypothesis 40 Subsection 3. Neuronal function of BACE1 and its significance Chapter 2: β-site APP cleaving enzyme 1 (BACE1) knockouts have abnormal synaptic properties in the hippocampus Section 1 Introduction Section 2 Methods and Materials Subsection 1. Acute hippocampus slices preparation for electrophysiology Subsection 2. Electrophysiological Recordings Subsection 3. Analysis of Electrophysiology data Section 3 Results Subsection 1. BACE1 knockout mice have deficit in presynaptic release Subsection 2. The basal synaptic transmissions are normal in the BACE1 knockout mice Subsection 3. BACE1 knockout mice exhibit a specific deficit in synaptic plasticity Section 4 Discussion Subsection 1: BACE1 and basal synaptic transmission Subsection 2. BACE1 regulates synaptic plasticity ii
8 Section 5 Conclusion Chapter3: Regulation of synaptic AMPA receptor subunit composition by GluR1- S845 phosphorylation Section 1 Introduction Section 2 Methods and Materials Subsection 1. Acute hippocampus slices preparation for electrophysiology Subsection 2. Field potential recording from Schaffer collateral synapses in CA1 area Subsection 3. Whole cell recording of evoked AMPAR currents Subsection 4. Postsynaptic density (PSD) preparation Subsection 5. Biotinylation of surface AMPAR Subsection 6. Co-immunoprecipitation (CoIP) Subsection 7. Immunoblot analysis Section 3 Results Subsection 1. Subunit composition of synaptic AMPARs is altered in GluR1- S845A mutant mice Subsection 2. GluR1-S845A mutants have altered AMPAR subunit composition across the membrane surface Subsection 3. More GluR1/GluR2 heteromers in the GluR1-S845A mutant mouse Subsection 4. GluR1-S845A mutants have less GluR1 homomers Subsection 5. Inhibiting lysosomal activity restores the functional GluR1 homomer in the GluR1-S845A mutants Subsection 6. Loss of GluR1 homomers at synapses following chemical longterm depression (chemltd) Subsection 7. Low frequency stimulation (LFS)-induced LTD is also associated with a loss of functional GluR1 homomers Section 4 Discussion Subsection 1. Functional GluR1 homomers require GluR1-S845 phosphorylation site Subsection 2. Lack of GluR1-S845 phosphorylation alters functional AMPAR subunit composition by selective degradation of GluR1 homomers Subsection 3. LTD is associated with a reduction in the level of functional GluR1 homomers Subsection 4. A working model for regulating synaptic AMPAR subunit composition by GluR1-S845 phosphorylation Section 5 Conclusion Section 6 Supplementary data Chapter 4: GluR1-S845 dephosphoryaltion is required for chemltd induced synaptic plasticity but not spine morphological plasticity Section 1 Introduction Section 2 Methods and Materials Subsection 1. Acute hippocampus slices preparation for electrophysiology and imaging Subsection 2. Field potential recording from Schaffer collateral synapses in CA1 area iii
9 Subsection 3. Whole cell recording of AMPAR mediated mepscs and evoked AMPAR currents Subsection 4. Laser scanning confocal microscopy of fixed tissues and image analysis Subsection 5. Two-photon microcopy of dendritic spines in acute hippocampal slices Subsection 6. Images analysis Section 3 Results Subsection 1. Chemical-induced LTD (chemltd) causes rapid shrinkage of the spine head, with no effect on the spine density of the hippocampus CA1 pyramidal neurons Subsection 2. Mice lacking GluR1-S845 phosphorylation have altered synaptic transmission and spine morphology Subsection 3. Chemical-induced LTD (chemltd) causes spine morphological changes in hippocampus CA1 pyramidal neurons of the S845A-2J mice Subsection 4. Spine head shrinkage observed in individual spines after chemltd induction in both WT-2J and S845A-2J mice Section 4 Discussion Subsection 1. Spine structural plasticity associated with chemltd induction 116 Subsection 2. S845A mutation impairs chemltd induction and alters synaptic transmission Subsection 3. Separate signaling pathways for long-term synaptic depression and spine morphological changes after chemltd Subsection 4. ChemLTD induction causes loss of spines in the S845A-2J mice Subsection 5. Dissociation between spine head size and synaptic AMPAR content Chapter 5: General discussions and Future directions Section 1 Physiological function of BACE Section 2 BACE1 may be a therapeutic target for treating ADs Section 3 GluR1 homomers in the hippocampus Schaffer collateral to CA1 synapses Subsection 1. Evidence for synaptic GluR1 homomers Subsection 2. Hypothesis on the existence of two populations of synapses Subsection 3. Hypothesis on the existence of two populations of spines Subsection 4. Testing the two populations of synapse hypothesis Subsection 5. Alternative explanation for the presence of functional GluR1 homomers at the CA1 synapses Subsection 6. A brief summary on GluR1 homomers Section 4 Critical role of GluR1 S845 phosphorylation in synaptic function Section 5 Dissociation between spine morphological plasticity and synaptic plasticity Bibliography iv
10 List of Figures The α- and β-cleavage pathways of APP The formation of NFTs The BACE1 knockouts have presynaptic deficit Synaptic transmission is normal in the BACE1 knockout mice Synaptic plasticity in BACE1 knockout mice Change in synaptic AMPAR subunit composition in GluR1-S845A mutant mice Increased surface GluR2 levels in GluR1-S845A mutants More GluR2 is associated with GluR1 in GluR1-S845A mutants A reduction of GluR1 homomers in GluR1-S845A mutants Inhibiting lysosomal degradation recovers functional GluR1 homomers in GluR1-S845A mutants Loss of synaptic GluR1 homomers after chemltd in wildtype mice LFS-induced LTD removes functional GluR1 homomers Proposed model for the function of GluR1 S845 phosphorylation in regulating synaptic AMPAR subunit composition 93 Supplementary 3.1 Single pulse stimulation fails to reveal PhTX-sensitivity of AMPAR responses in wildtype hippocampal slices 94 Supplemenary 3.2 Top panel, the configuration of the two pathway LFS-induced LTD field potential recording ChemLTD induction is associated with a rapid and persistent shrinkage of spine head volume Lack of S845 phosphorylation alters spine morphology and AMPAR-mediated synaptic transmission ChemLTD induction causes spine morphological changes in the S845A-2J mice Rapid shrinkage of individual spines following chemltd induction was observed by 2 photon time-lapse imaging of live slices from both WT-2J and S845A- 2J mice Dissociation between the NMDA-induced long-term synaptic depression and long-term spine morphological change 120 v
11 Chapter 1: Introduction Section 1 Synaptic plasticity and learning and memory Subsection 1. Synaptic plasticity as the cellular basis for learning and memory formation It is widely believed that long-term changes in the strength of synaptic transmission underlie formation of memories. Hebb is often recognized as the first person to crystallize this idea by proposing that coincident activity of pre- and postsynaptic neurons strengthens the synaptic connections (Hebb, 1949). It was subsequently recognized that uncorrelated activity between two neurons should decrease the strength of synaptic transmission between them (Stent, 1973). It has been demonstrated experimentally that high frequency stimulations, which can lead to correlated activity in pre- and postsynaptic cells, can indeed strengthen synapses (Bliss and Lomo, 1973). On the other hand, a prolonged low frequency stimulation of afferents, which would lead to presynaptic activation in the absence of correlated postsynaptic activity, produces longterm decrease in synaptic transmission (Dudek and Bear, 1992; Mulkey and Malenka, 1992). The strengthening of synaptic connections is termed long-term potentiation (LTP), while the weakening of synaptic transmission is called long-term depression (LTD). Since its initial discovery, both LTP and LTD has been demonstrated to occur in diverse sets of synapses across many different brain areas [reviewed in (Malenka and Bear, 2004)]. These long lasting forms of synaptic plasticity share similar mechanisms of induction, expression and maintenance as those involved in long-term consolidation of several forms of memory [for more detail see (Lisman, 1989; Bailey et al., 1996; Bear, 1
12 1996; Martin et al., 2000; Paulsen and Sejnowski, 2000; Bliss et al., 2003; Lynch, 2004; Barco et al., 2006; Morris, 2006; Sigurdsson et al., 2007)]. In addition, long-term enhancement of synaptic transmission in different brain regions, similar in characteristics to LTP, has been observed both in vivo and ex vivo after various learning paradigms (Rioult-Pedotti et al., 1998; Rosenkranz and Grace, 2002; Goosens et al., 2003; Stefan et al., 2006; Whitlock et al., 2006). On the other hand, LTD has been proposed to be the cellular mechanism for behavioral sensitization (Brebner et al., 2005) and visual recognition memory (Griffiths et al., 2008). Most importantly, the expression of LTP and learning are found to occlude each other (Rioult-Pedotti et al., 1998; Stefan et al., 2006; Whitlock et al., 2006), which further supports the concept that long-term synaptic plasticity, especially LTP, may be a cellular substrate for memory formation. A detailed comparison of the cellular and molecular mechanisms underlying synaptic plasticity and learning and memory will be given in Section 2. Subsection 2. Homeostatic plasticity is required to stabilize the neural network and maintain its capacity to learn and store new information The three characteristics of long-term synaptic plasticity: cooperativity, associativity and synapse specificity, and durability, make it a suitable cellular mechanism for learning and encoding memories (Bliss and Collingridge, 1993). According to the Hebb s learning rule, coincidence of pre- and postsynaptic activity results in LTP, and uncorrelated preand postsynaptic activity produces LTD. However, synaptic modification models that are solely based on LTP and LTD have innate positive feedback, which destabilizes the neuronal circuits and hinders encoding of new information (Turrigiano and Nelson, 2004; Perez-Otano and Ehlers, 2005). Therefore, additional mechanisms are needed to maintain 2
13 the homeostasis of neurons. This can be achieved by either i) changing the excitability of postsynaptic neurons by either globally increase or decrease the synaptic strength in a multiplicative manner to conserve the weight of each synapse as well as the total output of neuron (synaptic scaling) [review in (Turrigiano and Nelson, 2004)], ii) altering the threshold for inducing future synaptic plasticity (Bienenstock, Cooper and Munro (BCM) theory of sliding threshhold) (Bienenstock et al., 1982; Bear et al., 1987), iii) modulating the intrinsic excitability of neurons by manipulating ion channel properties and densities [review in (Marder and Goaillard, 2006; Schulz, 2006)], iv) differentially regulating the inhibitory circuits (Kilman et al., 2002; Morales et al., 2002; Maffei et al., 2004; Maffei et al., 2006; Echegoyen et al., 2007; Bartley et al., 2008) depending on the interneuron cell types (Bartley et al., 2008), or v) altering presynaptic function in response to brief or prolong changes in synaptic activities, which requires retrograde signal from postsynaptic neurons (Thiagarajan et al., 2005; Frank et al., 2006). Section 2 Cellular and molecular mechanism of long-term synaptic plasticity Long-term potentiation (LTP) of synaptic strength was experimentally demonstrated in the perforant pathway of hippocampus for the first time in 1970s (Bliss and Gardner- Medwin, 1973; Bliss and Lomo, 1973). About 20 years later, long-term depression (LTD) was obtained in the hippocampal CA1 neurons by a prolong low frequency stimulation (LFS) of the Schaffer collateral inputs (Dudek and Bear, 1992). During the past three decades, these two types of long-term alteration in synaptic strength have been found in various brain regions. However, the underlying mechanisms of long-term synaptic plasticity can differ depending on the neural circuits (Malenka and Bear, 2004; Citri and 3
14 Malenka, 2008). The majority of knowledge on the molecular mechanisms of long-term synaptic plasticity comes from studies in the hippocampus, a brain region critical for several forms of learning and short-term memory formation (Lynch, 2004). Here I will summarize the known mechanisms of N-methyl D-aspartate receptor (NMDAR)- dependent LTP and LTD mainly based on studies carried out at the Schaffer collateral inputs to CA1 in the hippocampus, because my thesis research focused on these particular forms of synaptic plasticity. Subsection 1. NMDAR-dependent LTP i) Induction of NMDAR-dependent LTP The NMDAR-dependent LTP is the most studied form of synaptic plasticity and its underlying mechanism is well characterized mainly based on studying the LTP induced in the hippocampal Schaffer collateral to CA1 synapses. At this set of synapses, LTP can be induced by either i) deliverying high frequency stimulation (HFS) to the afferents, ii) using a pairing protocol in which a low frequency stimulation (LFS) of afferents is paired with a substantial depolarization of the postsynaptic membrane (> -30 mv), or iii) utilizing a spike-timing dependent protocol that pairs the presynaptic action potential (AP) with a back propagating AP (BAP) in the postsynaptic cell at positive intervals (pre post). All the LTP induction protocols cause strong activation of postsynaptic NMDARs and a large influx of Ca 2+ mainly through the NMDAR channel [review in (Malenka and Bear, 2004; Citri and Malenka, 2008)]. During the LTP induction process, NMDAR serves an important role as a coincidence detector due to its voltage dependency -- the extracellular Mg 2+ block of the NMDAR channel is only relieved when 4
15 the membrane is sufficiently depolarized (Mayer et al., 1984). Hence, the activation of NMDAR requires a coincident depolarization of the postsynaptic membrane and presynaptic release of glutamate. NMDAR activation is indeed necessary for LTP induction, because application of either competitive (APV) or non-competitive (MK-801) antagonists of NMDAR prevents LTP [review in (Lynch, 2004)]. An increase in postsynaptic Ca 2+ is necessary and sufficient for LTP induction, because preventing postsynaptic Ca 2+ rise by Ca 2+ chelators blocks LTP (Lynch et al., 1983; Malenka et al., 1988), and increasing the postsynaptic Ca 2+ level alone can produce LTP (Malenka et al., 1988). In contrast, even though NMDAR activation and a subsequent Ca 2+ influx are critical for LTP induction, there is evidence suggesting that Ca 2+ influx through NMDARs may not be the only source required for LTP induction under certain circumstances. For example, depleting the internal Ca 2+ store by thapsigargin abolishes LTP induction but not expression (Harvey and Collingridge, 1992), which suggests that Ca 2+ released from internal store contributes to the Ca2+ signal needed for LTP induction. A later study suggests that the dependence of LTP on internal Ca 2+ stores may be stimulus specific: LTP induced by a weak tetanic stimulation (1 episode of high frequency tetanus) is blocked by thapsigargin but not the one induced by a stronger induction protocol (3 episodes of tetanic stimulation) (Behnisch and Reymann, 1995). ii) Protein kinases involved in LTP An increase in postsynaptic Ca 2+ triggers downstream signaling cascades that lead to the expression of LTP. Multiple protein kinases are known to transduce the Ca 2+ signal to downstream events (Lynch, 2004; Malenka and Bear, 2004; Citri and Malenka, 2008). Ca2+/calmodulin (CaM)-dependent kinase II (CaMKII) 5
16 There is very strong support for the involvement of Ca 2+ /calmodulin (CaM)-dependent kinase II (CaMKII) in LTP. CaMKII is one of the most abundant proteins in the neurons and highly expressed at the postsynaptic density, hence it is able to rapidly response to changes in postsynaptic Ca 2+ levels (Lynch, 2004). In addition, after the initial activation by Ca 2+, CaMKII can autophosphorylate itself at the Threonine-286 (T286) site and maintain its activity in a Ca 2+ -independent manner (Miller et al., 1988; Schworer et al., 1988; Thiel et al., 1988). The latter property allows CaMKII to in essence remember the transient increase in Ca 2+ during LTP induction (Malenka et al., 1992). Substantial evidence has been collected to support the critical role of CaMKII activation and its autophosphorylation in LTP induction. Blocking the activity of CaMKII by specific inhibitors (Malenka et al., 1989; Malinow et al., 1989), genetically deleting the αcamkii gene (Silva et al., 1992b; Silva et al., 1992a), or generating a specific point mutation of the autophosphorylation site (T286A mutation) on the αcamkii (Giese et al., 1998), cause impairment in LTP as well as spatial learning (Silva et al., 1992b; Silva et al., 1992a; Giese et al., 1998). In contrast, inclusion of constitutively active form of CaMKII into neurons is sufficient to cause LTP-like synaptic potentiation that occludes further LTP induction (Pettit et al., 1994; Lledo et al., 1995). Cyclic adenosine monophosphate (camp)-dependent protein kinase (PKA) In addition to CaMKII, activation of cyclic adenosine monophosphate (camp)-dependent protein kinase (PKA) is also implicated in the induction and expression of LTP [review in (Lynch, 2004)]. PKA is activated by binding of camp, whose level can be augmented by the activation of Ca 2+ /calmodulin-dependent adenylyl cyclases (Wong et al., 1999) during LTP induction (Chetkovich et al., 1991). The activation of PKA has been found to be 6
17 transient after LTP induction (Roberson and Sweatt, 1996), suggesting that PKA is involved in the induction of LTP, probably by facilitating the activity of CaMKII via blocking the protein phosphatase 1 (PP1) (Blitzer et al., 1998). The role of PKA in LTP induction is further supported by a later study, which showed that either bath application or intracellularly perfusion of PKA inhibitors impair the early phase of LTP induced by a single tetanic stimulation (Otmakhova et al., 2000). It is generally agreed that PKA is critical for LTP expression by phosphorylating the S845 site of AMPAR GluR1 subunit (Roche et al., 1996), which can prime the GluR1-AMPARs for activity-dependent synaptic insertion (Esteban et al., 2003; Oh et al., 2006; Seol et al., 2007). Besides the importance of PKA during the early phase of LTP (E-LTP, last for 1-2 h post induction), evidence from other studies supports the role of PKA in the maintenance of late phase LTP (L-LTP, at least 2 h post induction) as well as long-term memory formation (Huang and Kandel, 1994; Huang et al., 1995; Nguyen and Kandel, 1996; Huang et al., 2000). Consistent with these findings, activation of PKA by forskolin, an activator of adenylyl cyclase, can mimic L-LTP and occlude further LTP induction (Huang and Kandel, 1994; Nguyen and Kandel, 1996; Huang et al., 2000). The fact that the forskolin effect on L- LTP can be blocked by inhibiting transcription (Nguyen and Kandel, 1996; Huang et al., 2000) or protein synthesis (Nayak et al., 1998), and the coincident time course for the requirement of PKA and protein synthesis for L-LTP (Huang and Kandel, 1994; Nguyen and Kandel, 1996; Nayak et al., 1998), indicate that PKA may be linked to protein synthesis. This is directly supported by the finding that forskolin application not only mimics L-LTP induction, but also activates a transcription factor CREB (camp-response element-binding proteins) (Huang et al., 2000). 7
18 Protein kinase C (PKC) Another protein kinase involved in LTP is protein kinase C (PKC), supported by observations that PKC inhibitors prevent LTP (Malenka et al., 1989; Malinow et al., 1989), and that PKC activity is persistently increased during both early and late phases of LTP (Klann et al., 1993). Results from several studies support the idea that the critical role of PKC is in the maintenance of L-LTP, but not the initiation. For instance, blocking the PKC activity by selective inhibitors does not affect the initial induction of LTP but causes rapid decay of LTP (Lovinger et al., 1987; Reymann et al., 1988a; Reymann et al., 1988b). Inhibition of PKC 1h post-ltp induction also destabilizes the LTP, further supporting that PKC is crucial for LTP maintenance (Lovinger et al., 1987). However, there is controversy as a later study showed that inhibition of PKC activity prevents LTP induction as well as the maintenance of L-LTP (Wang and Feng, 1992). Among the various isoforms of PKC, an atypical isoform of PKC - PKMξ receives much attention as it is implicated to be necessary and sufficient for the L-LTP formation (Ling et al., 2002) as well as memory maintenance [review in (Sacktor, 2008)]. Extracellular signal-regulated kinase (Erk)/mitogen-activated protein kinase (MAPK) Extracellular signal-regulated kinase (Erk)/mitogen-activated protein kinase (MAPK) has been found to be crucial for the maintenance of LTP [review in (Lynch, 2004)]. Activation of Erk/MAPK pathway leads to varied cellular events [review in (Lynch, 2004)], the one that is most relevant to LTP is the requirement of Erk/MAPK activity in CREB activation (Impey et al., 1998), which explains why Erk/MAPK pathway is critical for maintaining L-LTP. Erk/MAPK signaling cascade is also required for maintaining 8
19 different forms of long-term but not short-term memory [review in (Adams and Sweatt, 2002)], including the one induced by fear-conditioning learning (Atkins et al., 1998; Schafe et al., 2000) and the hippocampus-dependent spatial memory (Blum et al., 1999; Selcher et al., 1999). iii) Expression of NMDAR-dependent LTP Even though the induction of LTP relies heavily on the NMDAR activation, the expression of LTP mainly depends on the functional alteration of another type of glutamatergic receptor--α-amino-3-hydroxy-5-methyl-4-isoxazolepropionic acid (AMPA) receptor (AMPAR). AMPARs are the major mediators of fast excitatory synaptic transmission in the central nervous system (CNS), therefore their function directly dictates synaptic strength. Majority of AMPARs are heteromers composed with four glutamate subunits: GluR1-GluR4 (Hollmann and Heinemann, 1994; Rosenmund et al., 1998; Dingledine et al., 1999). Multiple phosphorylation sites have been identified in each of the glutamate subunits (Lee, 2006a). Among them, serine 831, serine 845, and serine 818 of GluR1 subunits (R1-S831, R1-S845, and R1-S818), and serine 880 of GluR2 (R2-S880), receive most of the attention as they are found to be involved in synaptic plasticity (Lee, 2006a). GluR1-S831 is phosphorylated by CaMKII (Barria et al., 1997a) and PKC (Roche et al., 1996). LTP induction in CA1 neurons correlates with an increase in the R1-S831 phosphorylation (Barria et al., 1997b; Lee et al., 2000), which can be blocked by a CaMKII specific inhibitor (Barria et al., 1997b). Phosphorylation of R1-S831 has been known to increase the single channel conductance of AMPARs (Derkach et al., 1999; Oh and Derkach, 2005), which is thought to contribute to the potentiation of synaptic transmission (Benke et al., 1998). 9
20 Several studies demonstrated that LTP increases synaptic content of AMPA receptors, predominantly by an activity-dependent insertion of receptors containing the GluR1 subunit (Shi et al., 1999; Hayashi et al., 2000; Shi et al., 2001). The trafficking of AMPAR into the synapses has been found to be triggered by phosphorylation of AMPAR subunits (Lee, 2006a). Phosphorylation of R1-S845 by PKA (Roche et al., 1996) is necessary for LTP induction (Esteban et al., 2003) as it is known to deliver the AMPARs to the extrasynaptic sites (Oh et al., 2006) for later synaptic insertion that depends on the activation of CaMKII (Esteban et al., 2003). In addition, recently phosphorylation of R1- S818 by PKC has been implicated to be a critical event for LTP induced AMPAR synaptic insertion (Boehm et al., 2006). In this study, Boehm et al. found that LTP induction is associated with an increase in R1-S818 phosphorylation. Furthermore, enhancing the R1-S818 phosphorylation level by PKC or by a point mutation promotes synaptic insertion of GluR1-containing AMPARs, while blocking its phosphorylation impairs LTP and prevents synaptic trafficking of AMPARs. For a more detailed regulatory mechanism of AMPAR trafficking, refer to Chapter1-section 3. Synaptic incorporation of AMPARs after LTP induction is best supported from studies of silent synapses, which are a population of synapses only containing functional NMDARs but not AMPARs. Silent synapses are experimentally defined as synapses that display minimal stimulation-induced excitatory postsynaptic current (ESPC) at positive membrane potentials (mediated by NMDARs) but not at negative membrane potentials (mediated by AMPARs) [review in (Isaac, 2003; Kerchner and Nicoll, 2008)]. LTP induction has been shown to recruit AMPARs into the previously silent synapses (a process that is called un-silencing or AMPAfication ). This is supported directly by 10
21 the appearance of AMPAR-mediated EPSC in the previously silent synapses (Montgomery et al., 2001). Similar to LTP induction in AMPAR containing synapses, un-silencing synapses also requires the activity of CaMKII (Lledo et al., 1995; Wu et al., 1996; Derkach et al., 1999) as well as postsynaptic membrane fusion (Ward et al., 2006). Taken together, these results suggest that recruitment of AMPARs into the synapses (either silent or non-silent) mediates the strengthening of synaptic transmission following NMDAR-dependent LTP induction. iv) Maintenance of NMDAR-dependent LTP LTP is generally divided into two phases according to the time window: early phase of LTP (E-LTP) that lasts for 1-2 hours; late phase of LTP (L-LTP) induced by a strong tetanic stimulation that potentitates synaptic transmission for longer than two hours (Pang and Lu, 2004). L-LTP is recognized as a cellular mechanism underlying consolidation of long-term memory, as both depend on gene transcription [review in (Kandel, 2001; Lynch, 2004; Bramham et al., 2008)] and new protein synthesis [review in (Sutton and Schuman, 2006)]. CREB-dependent gene transcription LTP requires the activation of multiples protein kinases like CaMKII, PKA, PKC and Erk/MARK, all of which have been found to directly or indirectly phosphorylate and activate the transcription factor CREB [review in (Lynch, 2004)]. Activated CREB binds to the camp responsive element (CRE) promoter site and initiate gene transcription [reviewed in (Silva et al., 1998)]. The importance of CREB activity for L-LTP is first evidenced by studying the gill and siphon withdrawal reflex in Aplysia (Dash et al., 1990). In this study, Dash et al. found that inhibition of CREB activity by microinjection 11
22 of CRE sequence into the nucleus prevents the serotonin-induced long-term, but not short-term facilitation of synapses on sensory neurons. Further studies support the role of CREB-mediated gene transcription in LTP and long-term memory in varied animal models, including Aplysia, Drosophila, and rodents [review in (Silva et al., 1998; Kandel, 2001)]. Recently, it has been found that the CREB coactivator TORC1 (transducer of regulated CREB activity 1) undergoes activity-dependent nuclear translocation, which is required for the CREB-mediated gene transcription and L-LTP induction (Zhou et al., 2006). Furthermore, they found that it is the nuclear level of TORC1, but not the level of CREB phosphorylation, which correlates with L-LTP expression. These results suggest that the recruitment of TORC1 into the nucleus is a required step to execute the gene transcription mediated by CREB phosphorylation (Zhou et al., 2006). Local protein synthesis Early evidence supporting the role of local protein synthesis in long term synaptic plasticity comes from a study that showed neurotrophin-induced synaptic facilitation in the hippocampal neuropil isolated from the cell bodies (Kang and Schuman, 1996). As the neurotrophin-induced synaptic plasticity requires protein synthesis, this result suggested that new proteins can be synthesized locally in the dendrites (Kang and Schuman, 1996). The requirement of local protein synthesis for L-LTP is further confirmed in another study, which showed that local inhibition of protein synthesis in the apical dendrites of CA1 neurons selectively impairs L-LTP induced in the apical synapses without affecting L-LTP induced in the basal dendrites, and vice versa (Bradshaw et al., 2003). mrna of several proteins have been found to accumulate and translate locally along the dendrites in an activity-dependent manner, including the 12
23 GluR1 and GluR2 subunit of AMPARs (Ju et al., 2004; Grooms et al., 2006), CaMKII (Mayford et al., 1996), and the immediate-early gene Arc (activity-regulated cytoskeleton-associated protein) (Steward et al., 1998; Yin et al., 2002; Moga et al., 2004; Rodriguez et al., 2005). Subsection 2. NMDAR-dependent LTD i) Induction of NMDAR-dependent LTD The NMDAR-dependent LTD can be induced by a prolonged low frequency stimulation (LFS) of afferents (Dudek and Bear, 1992; Mulkey and Malenka, 1992), pairing a short train of LFS with a moderate depolarization (-40 mv) of the postsynaptic membrane (Selig et al., 1995), and a spike-timing protocol which pairs the presynaptic action potential (AP) with a back propagating AP (BAP) in the postsynaptic cell with a negative time interval (post pre, STDP) [review in (Caporale and Dan, 2008)]. Similar to the NMDAR-dependent LTP, the induction of this form of LTD requires Ca 2+ influx through postsynaptic NMDARs (Mulkey and Malenka, 1992; Bi and Poo, 1998). However, the Ca 2+ signal required for LTD induction may be less than that for LTP, as supported by the finding that a LTP inducing tetanic stimulation can produce LTD when the postsynaptic Ca 2+ is reduced (Cummings et al., 1996). ii) Protein phosphatases required for LTD In contrast to the protein kinase activation required for LTP, protein phosphatases are found to be critical for LTD expression. Application of protein phosphatase 1 and 2A (PP1 and PP2A) inhibitors before or after LTD induction both block LTD, indicating 13
24 activities of PP1 and PP2A are required for the expression of LTD (Mulkey et al., 1993). Consistent with this, in vivo LTD induction has been shown to associated with transient and persistent increases in the activity of PP1 and PP2A, respectively (Thiels et al., 1998). The activity-driven activation of PP1 is mediated by another crucial protein phosphatase calcineurin (also called protein phosphatase 2B or PP2B), which dephosphorylates and inactivate inhibitor-1, an inhibitor of PP1 (Mulkey et al., 1994). Activity of calcineurin is Ca 2+ /calmodulin dependent [review in (Xia and Storm, 2005)] and is required for LTD induction (Mulkey et al., 1994). PP2A is probably activated by calcineurin/pp1-mediated dephosphorylation. It has been recently proposed that PP2A mediates the maintenance of LTD due to two key properties: auto-dephosphorylation, which maintain its activity, and dephosphorylation of CaMKII (Pi and Lisman, 2008). Taken together, NMDAR-dependent LTD induction recruits the protein phosphatase signaling cascade, likely a sequential activation of calcineurin, PP1 and PP2A. iii) Expression of NMDAR-dependent LTD One of the substrates of the activated protein phosphatase cascade is the PKA site of GluR1 subunit, as protein phosphatase inhibitors prevent LTD induction as well as the dephosphorylation of GluR1-S845 (Lee et al., 2000). Dephosphorylation of S845 downregulates AMPAR function (Banke et al., 2000) and is implicated in the LTD expression (Lee et al., 2003). This is further supported by the impaired LTD in the mutant mice specifically lacking the GluR1-S845 site (GluR1-S845A mutants) (unpublished data). My study reveals that dephosphorylation of S845 may specifically destabilize and promote the internalization of GluR1 homomers (for further discussion, see Chapter 3), which is 14
25 in agreement with a previous study correlating S845 dephosphorylation and surface AMPARs internalization (Ehlers, 2000). As LTP expression is proposed to require synaptic insertion of AMPARs, endocytosis of synaptic AMPARs has been considered a major mediator of LTD expression [review in (Malenka and Bear, 2004; Citri and Malenka, 2008)]. AMPAR endocytosis is clathrindependent (Carroll et al., 1999), which is probably initiated by the direct binding of GluR2 subunit to AP2, a clathrin adaptor complex (Lee et al., 2002). Disrupting the GluR2-AP2 interaction blocked NMDAR-dependent LTD and AMPAR endocytosis (Lee et al., 2002), as well as the visual recognition memory that uses LTD as the cellular mechanism (Griffiths et al., 2008), further supporting GluR2-dependent AMPAR endocytosis in mediating the synaptic depression. GluR2-dependent AMPAR endocytosis requires phosphorylation of GluR2-S880 site by PKC (Matsuda et al., 1999; Chung et al., 2000), which dictates the binding preference of GluR2 to GRIP and PICK-1 (further discuss in section 3). Despite all the evidence supporting the role of GluR2-mediated AMPAR endocytosis, whether GluR2 is critical for LTD expression remains to be further tested as the GluR2/GluR3 double-knockout mice can express normal LTD (Meng et al., 2003). Section 3 Regulation of AMPA receptor function α-amino-3-hydroxy-5-methyl-4-isoxazolepropionate receptors (AMPARs) is the major glutamatergic receptor in the brain, named after its specific agonist AMPA (Ozawa and Iino, 1993). Unlike NMDARs, which are normally silent during resting membrane potential due to the Mg 2+ block, AMPARs mediate most of fast excitatory synaptic transmission (Dingledine et al., 1999). As a result, changes in AMPAR functions, 15
26 including channel properties and synaptic expression, directly alter the strength of synaptic transmission and is considered a key mechanism in the expression of multiple forms of synaptic plasticity [review in (Malenka and Bear, 2004; Citri and Malenka, 2008) and homeostatic plasticity [review in (Turrigiano and Nelson, 2004)]. Therefore, studying the regulation of AMPAR function is pivotal for understanding the mechanism of synaptic plasticity. Many studies indicate that AMPARs are mainly regulated via two mechanisms: subunit composition and glutamate subunit phosphorylation. Subsection 1. AMPAR functions regulated by subunit composition AMPARs are tetramers composed of four glutamate subunits: GluR1 to GluR4 (Hollmann and Heinemann, 1994; Rosenmund et al., 1998; Dingledine et al., 1999). Several features of the AMPAR ion channel are determined by its subunit composition, including the Ca 2+ permeability, inwardly rectifying current-voltage (I-V) relationship [review in (Jonas and Burnashev, 1995)], sensitivity to the channel blockade by polyamine (Bowie et al., 1998), and the single channel conductance (Swanson et al., 1997). Early studies found that the four subunits can form a functional channel in any combination when expressed in a heterologous system, like the Xenopus Oocyte (Boulter et al., 1990; Hollmann et al., 1991; Washburn et al., 1997). Later findings suggest that AMPAR subunit assembly happens sequentially through dimerization followed by tetramerization (Ayalon and Stern-Bach, 2001; Mansour et al., 2001; Greger et al., 2003; Greger et al., 2007). Dimerization occurs between the same subunits and is mediated by the N-terminal LIVBP (leucine/isoleucine/valine-binding protein-like domain) (Kuusinen et al., 1999; Ayalon and Stern-Bach, 2001). Interestingly, the tetramerization of dimmers tends to form heteromer rather than homomer with preferred stoichiometries: GluR1 16
27 associated with GluR2, GluR2 associated with GluR3 (Wenthold et al., 1996; Mansour et al., 2001; Greger et al., 2003). The mechanism determining AMPAR stoichiometry is far from clear. One candidate mechanism proposed to regulate the AMPAR tetramerization is the mrna Q (glutamine)/r (arginine) editing of the GluR2 subunit (Greger et al., 2003). By over-expressing GluR2(Q) (unedited) or GluR2(R) (edited) in the culture neurons, Greger and colleagues found that compared to the GluR2(Q), the GluR2(R) are largely unassembled and retained within the endoplasmic reticulum (ER). The high concentration of GluR2(R) in the ER may promote the formation of heterotetramers that contain the edited GluR2, consistent with what has been found in the brain (Wenthold et al., 1996; Ozawa et al., 1998; Seeburg, 2002). Understanding how the subunit composition of synaptic AMPARs, especially the switch between the Ca 2+ -permeable and Ca 2+ -impermeable subtypes, is regulated is becoming quite important in light of the fact that the synaptic expression of Ca 2+ -permeable AMPARs can be rapidly modified by synaptic activities (Liu and Cull-Candy, 2000; Liu and Cull-Candy, 2002; Ju et al., 2004; Thiagarajan et al., 2005; Plant et al., 2006), by experience (Bellone and Luscher, 2006; Clem and Barth, 2006; Goel et al., 2006; Conrad and Wolf, 2008), during development (Kumar et al., 2002; Shin et al., 2005), and under pathological conditions (Grooms et al., 2000; Liu et al., 2006). I found that phosphorylation of the S845 site on GluR1 subunit is critically involved in maintaining functional Ca 2+ -permeable AMPARs, possibly via either stabilizing the synaptic or perisynaptic receptors, or favoring the recycling rather than degradation of internalized Ca 2+ -permeable AMPARs (see Chapter 3). i) Regulation of AMPAR channel properties by subunit composition 17
28 Three major properties of AMPAR ion channels will be discussed, including the Ca 2+ - permeability, vulnerability to polyamine blockade that alters the I-V relationship, and the single channel conductance. All of these characteristics are determined by whether the AMPAR contains the GluR2 subunit. GluR2 is the only glutamate subunit among the four which undergoes mrna editing to replace a glutamine (Q) residue within the pore loop with an arginine(r) (Seeburg et al., 1998). The Q->R editing renders the GluR2- containing AMPARs impermeable to Ca 2+ (Jonas and Burnashev, 1995), insensitive to the polyamine blockade resulting in a linear or outwardly rectified I-V relationship (Seeburg, 1993; Hollmann and Heinemann, 1994), and a relatively low channel conductance (Hollmann et al., 1991; Jonas and Burnashev, 1995; Swanson et al., 1997; Derkach et al., 2007). Almost all of the GluR2 in the mature brain are edited at this site (Burnashev et al., 1992), suggesting that the majority of AMPARs are Ca 2+ -impermeable (Jonas et al., 1994; Geiger et al., 1995). GluR2-containing AMPARs are found mainly as GluR1/GluR2 or GluR2/GluR3 heteromers, and make up about 90% of total AMPARs in the CA1 and CA2 areas of hippocampus (Wenthold et al., 1996). In contrast, AMPARs lacking GluR2, which are mainly GluR1 homomers in the hippocampus (Wenthold et al., 1996), are highly permeable to Ca 2+ (Jonas and Burnashev, 1995). In addition, GluR1 homomers are blocked by polyamines. Polyamines such as spermine and spermindine are small intracellular molecules that carry positive charges and bind to the negatively charged pore region formed by the non-glur2 subunits, like in the GluR1 homomers, when the channel is opened. The blockade by polyamine occurs in a voltage-dependent manner, such that the more positive ( -50 mv) the membrane potential the easier it is for the polyamine to get into the open channel and block the current flow. As a result, the I-V 18
29 relationship of these receptors display a strong inward rectification (Bowie and Mayer, 1995; Donevan and Rogawski, 1995), which has been used as a signature to identify the presence of these receptors. Polyamine is also found to facilitate the synaptic transmission mediated by the GluR2-lacking AMPARs via a use-dependent unblocking process (Shin et al., 2005), which suggests that regulation of intracellular polyamine levels may modulate synaptic responses generated by GluR2-lacking AMPARs (Aizenman et al., 2003; Shin et al., 2005; Shin et al., 2007). Compared to the edited GluR2(R)-containing AMPARs, receptors lacking GluR2 or with unedited GluR2(Q) have much higher single channel conductance (Swanson et al., 1997). Recent findings suggest that the presence of GluR2(R) in the AMPARs not only determine the intrinsic channel properties, but also modulates the functional regulation by subunit phosphorylation. Oh and Derkach found that the CaMKII phosphorylation of GluR1-S831 can only enhance the channel conductance of GluR1 homomers but has no effect on GluR1/GluR2 heteromers (Oh and Derkach, 2005). ii) Regulation of AMPAR trafficking by the subunit composition Under the basal condition, both GluR1 and GluR2 subunit undergo exocytosis (Passafaro et al., 2001). Synaptic insertion of GluR1 is dependent on activity and mainly targeted to extrasynaptic locations, while GluR2 undergoes more constitutive rapid insertion (Passafaro et al., 2001; Shi et al., 2001). The trafficking of these two subunits response very differently to synaptic activity like NMDAR activation, after which the synaptic insertion of GluR1 is greatly promoted while the GluR2 is unaffected (Shi et al., 1999; Passafaro et al., 2001; Shi et al., 2001). These results are obtained by over-expressing either GluR1-GFP or GluR2-GFP in culture hippocampal neurons, which favors the 19
30 formation of GluR1 or GluR2 homomers. In the mature brains, as discussed above, the majority of AMPARs are GluR1/GluR2 and GluR2/GluR3 heteromers with only a small population of GluR1 homomers. When GluR1 and GluR2 or GluR2 and GluR3 are coexpressed in cultured neurons to allow the formation of GluR1/GluR2 or GluR2/GluR3 heteromers, respectively, it turns out that the presence of GluR1 dictates the activitydependence of synaptic insertion (Passafaro et al., 2001; Shi et al., 2001). Further the c- terminus of both GluR1 and GluR2 have been identified as the sequences determining the trafficking pattern (Passafaro et al., 2001; Shi et al., 2001), as over-expressing the GluR2 c-terminus dramatically reduces basal synaptic transmission but not LTP expression, while GluR1 c-terminus transfection does not affect basal synaptic transmission but prevents the stabilization of LTP (Shi et al., 2001). The activity-dependent synaptic insertion of GluR2-containing native AMPARs (presumably GluR1/GluR2) is further confirmed by another study (Bagal et al., 2005). GluR1/GluR2 is not the only type of AMPAR that can be driven into synapses by activity. Later studies found that GluR2-lacking AMPARs, presumably GluR1 homomers, can also undergo rapid synaptic insertion following multiple conditions. LTP induction has been shown to cause a transient recruitment of GluR1 homomers into synapses, which are later replaced by GluR2-containing AMPARs (Plant et al., 2006; Lu et al., 2007; Guire et al., 2008), but a contradictory result is observed by another group (Adesnik and Nicoll, 2007). The enhanced synaptic insertion of GluR2-lacking AMPARs following LTP induction depends on the activity of CaMKK (CaMK kinase) and CaMKI. Inhibition of CaMKK by STO-609 (1,8-naphthoylene benzimidazole-3-carboxylic) abolished the transient synaptic incorporation of GluR2-lacking AMPARs, while 20
31 constitutively active CaMKI is sufficient to increase synaptic strength by recruiting GluR2-lacking AMPARs to the synapses (Guire et al., 2008). In vivo experience also causes synaptic incorporation of GluR2-lacking AMPARs. For example, one week of visual deprivation increases GluR2-lacking AMPAR content at synapses in layer II/III of primary visual cortex as reflected by a higher synaptic GluR1 level but no change in GluR2, and an inwardly rectifying I-V relationship (Goel et al., 2006). Single whisker experience (with all other whiskers removed) strengthens the synaptic transmission of neurons in the spared barrel (barrel corresponding to the remain whisker), and also enhances synaptic incorporation of GluR2-lacking AMPARs (Clem and Barth, 2006). Single episode of cocaine injection has been shown to promote synaptic delivery of GluR2-lacking AMPARs (Bellone and Luscher, 2006). The increase in synaptic GluR2-lacking AMPAR is also proposed to mediate the incubation of cocaine craving after withdrawal (Conrad and Wolf, 2008). Subsection 2. Regulation of AMPAR functions by phosphorylation Each of the four glutamates subunits has multiple phosphorylations sites on its c- terminus, which have been found to directly regulate either the intrinsic channel properties and/or the receptor trafficking [review in (Song and Huganir, 2002; Lee, 2006a)]. Among these phosphorylation sites, the serine 831 (S831), serine 845 (S845) and serine 818(S818) of GluR1 subunit and serine 880 of GluR2 subunit receive most of the attention as evidence supports their role in mediating the expression of long-term synaptic plasticity. i) AMPAR channel properties regulated by phosphorylation 21
32 GluR1-S831 is a substrate of PKC and CaMKII (Roche et al., 1996; Barria et al., 1997a; Mammen et al., 1997). Phosphorylation of this site by CaMKII increases the AMPAR single channel conductance (Derkach et al., 1999). As LTP induction has been found to correlate with an increase in S831 phosphorylation (Barria et al., 1997b; Lee et al., 2000; Lee et al., 2003), this phosphorylation site was initially thought to mediate the strengthening of synaptic transmission during LTP. This is challenged by a later finding that the CaMKII-phosphorylation of S831 only augments the single channel conductance of GluR1 homomer but not of AMPARs formed as GluR1/GluR2 heteromers (Oh and Derkach, 2005). Considering that the majority of AMPARs at synapses are likely GluR1/GluR2 heteromers (Wenthold et al., 1996), it seemed unlikely that the S831 phosphorylation alone could account for the LTP. However, a recent study estimates that the presence of a very small amount of GluR1 homomers (around 2% of synaptic AMPARs) can account for 30-40% synaptic potentiation by TBS (theta burst stimulation)-ltp. This is because phosphorylation of the S831 site, which can increase the channel conductance of GluR1 homomers to nearly four-folds (Guire et al., 2008). These results suggest that GluR1-S831 phosphorylation will greatly contribute to LTP via enhancing single channel conductance of GluR1 homomer even when the synaptic content of GluR1 homomers are quite small. This is consistent with the previous observations that there is a population of synapses which increases single channel conductance after LTP induction (Benke et al., 1998; Luthi et al., 2004). Phosphorylation of GluR1-S845 by PKA (Roche et al., 1996) is known to increase the peak open probability of the channel (Banke et al., 2000). Increasing phosphorylation of this site by PKA activators results in a 40% potentiation of current mediated by GluR1 22
33 homomers expressed in HEK 293 cells (Roche et al., 1996), suggesting that PKA phosphorylation of S845 may play a role in LTP expression. Later it was found that the S845 phosphorylation only increases after de-depression (reversal of LTD) but not LTP (Lee et al., 2000), indicating the recruitment of S845 phosphorylation may depend on the history of the synaptic activity (Lee et al., 2000). ii) AMPAR trafficking regulated by phosphorylation Trafficking of AMPARs into or out of synapses are regulated by many factors (Greger and Esteban, 2007). Phosphorylation of glutamate subunits, especially GluR1 and GluR2 is tightly associated with the expression of long-term synaptic plasticities (Song and Huganir, 2002; Lee, 2006b). The activity-induced synaptic AMPAR insertion requires phosphorylation of the GluR1-S845 site (Esteban et al., 2003; Oh et al., 2006), which is needed to bring the AMPARs to extrasynaptic sites and prime them for later activitydependent synaptic insertion (Oh et al., 2006). A new study supports the role of S845 phosphorylation in extrasynaptic delivery of AMPARs as they found that repeated morphine administration, which increases S845 phosphorylaiton, leads to addition of AMPARs to extrasynaptic location (Billa et al., 2009). The priming role of S845 phosphorylation is also supported by another study, which showed that the phosphorylation of S845 is necessary and sufficient to prime the synapses for associative LTP induction (Seol et al., 2007). However, whether GluR1 S845 phosphorylation is also crucial for the TBS-induced LTP is still under question. One concern arises from the fact that the S845 phosphorylation is only increased with dedepression (reversal of LTD) but not significantly altered after LTP (Lee et al., 2000). In addition, mutant mice lacking both S831 and S845 sites (S831A/S845A double phospho- 23
34 mutants) have normal TBS-induced LTP at the Shaffer collateral to CA1 synapses when the animals are young, and the LTP in the adult mutants is impaired but not completely abolished (Lee et al., 2003). Furthermore, mice specifically lacking only the S845 site (GluR1-S845A mutant) also express normal LTP (unpublished data). It is possible that the GluR1-S845A or GluR1-S831A/S845A mutants may have other compensatory regulation, hence it is premature to discount the role of GluR1-S845 phosphorylation in priming AMPARs for synaptic delivery. In any case, a role of GluR1-S845 in priming AMPARs during de-depression is reported by a recent in vivo experiment. Hardingham and colleagues found a larger LTP in the somatosensory cortex deprived from whisker experience. As the whisker deprivation depresses synaptic transmission and occludes further LTD induction, the LTP induced in the deprived cortex is thought of as dedepression. In addition, they found that the additional LTP (compared to the LTP in the non-deprived cortex) can be blocked by PKA antagonist. These results suggest that PKAdependent S845 phosphorylation may be responsible for the additional LTP by increasing the repertoire of AMPARs primed for synaptic delivery (Hardingham et al., 2008). Phosphorylation of S818, another GluR1 C-terminus amino acid has been recently proposed to be critical for LTP-induced AMPARs synaptic insertion (Boehm et al., 2006). In this study, they found LTP induction increases S818 phosphorylation by PKC. Preventing the S818 phosphorylated by PKC attenuates LTP and inhibits the synaptic insertion of GluR1-containing AMPARs driven by PKC. On the other hand, enhancing S818 phosphorylation either acutely or chronically via genetically mutation elevates the synaptic level of GluR1-containing AMPARs (Boehm et al., 2006). 24
35 In addition to PKA- and PKC-dependent phosphorylation, the activity-induced synaptic delivery of AMPARs also depends on the activation of CaMKII (Hayashi et al., 2000; Esteban et al., 2003; Oh et al., 2006). In this case, other substrates of CaMKII such as the PDZ proteins that interact with GluR1 rather than GluR1-S831 may be responsible, because the CaMKII-driven AMPARs synaptic delivery during LTP is not affected by the absence of the S831 site but by a mutation disrupting the interaction between the C- terminus of GluR1 and PDZ proteins (Hayashi et al., 2000). One candidate PDZ protein is the synapse associated protein 97 (SAP97), whose phosphorylation by CaMKII has been shown to regulate the trafficking of a critical subunit of A-type K + channel to the dendrites and spines (Gardoni et al., 2007). LTD, as well as in vivo experience like monocular deprivation, is accompanied by a longterm dephosphorylation of S845 site (Kameyama et al., 1998; Lee et al., 1998; Lee et al., 2000; Heynen et al., 2003), and a reduction in surface AMPARs (Lee et al., 2003; Brown et al., 2005; Oh et al., 2006; Holman et al., 2007). This suggests that dephosphorylation of the PKA site may be involved in the removal of synaptic GluR1-containing AMPARs during synaptic depression. This idea is further supported by studies using mutant mice with S831A/S845A double mutations (Lee et al., 2003) or S845A single mutation (unpublished data), where LTD is completely abolished or severely impaired. Blocking the activity of protein phosphatases, such as calcineurin or protein phosphotase 1(PP1), prevents the induction and expression of LTD (Mulkey et al., 1993; Mulkey et al., 1994), which is consistent with the requirement of S845 dephosphorylation for LTD expression. About 15% of total GluR1 is estimated to be phosphorylated on (Oh et al., 2006), which is dependent on the PKA brought in proximity to the GluR1 c-terminus by A-kinase 25
36 anchoring protein 97/150 (AKAP97/150) (Colledge et al., 2000; Tavalin et al., 2002). The PKA-mediated S845 basal phosphorylation is crucial for LTD induction in naïve synapses, as reducing PKA activity by either PKA inhibitor (Kameyama et al., 1998; Hardingham et al., 2008) or interrupting the PKA-AKAP79/150 association by genetically truncating the C-terminal residuals of AKAP79/150 (Lu et al., 2008) occlude or significantly impair LTD. Dephosphorylation of S845 is thought to remove synaptic AMPARs via endocytosis. Consistent with this idea, results from my study suggest that S845 phosphorylation is critical in maintaining GluR1 homomers at the synapses. Dephosphorylation of this site, as during NMDAR-dependent LTD, destabilizes and removes GluR1 homomers from synapses (see Chapter 3). The destination of the internalized AMPARs is also determined by the S845 phosphorylation as rephosphorylation of S845 enables the AMPARs to be recycled back to the surface; otherwise, they are targeted to lysosome for degradation (Ehlers, 2000). Endocytosis of synaptic AMPARs during LTD is also known to rely on the phosphorylation of the S880 site on GluR2 subunits (Lee, 2006b). Phosphorylation of this site by PKC has been shown to shift the binding preference of GluR2 from GRIP (glutamate receptor interacting protein) (Matsuda et al., 1999; Chung et al., 2000) towards PICK-1 (protein interacting with C-kinase-1), which enhances internalization of surface GluR2-containing AMPARs (Chung et al., 2000; Terashima et al., 2004; Lu and Ziff, 2005). Therefore, GluR2-S880 phosphorylation is thought to destabilize the synaptic GluR2-containing AMPARs. Interestingly, a recent study showed that S880 phosphorylation by PKC activation stabilizes the majority of synaptic AMPARs, suggesting that S880 phosphorylation may serve to stabilize these receptors (States et al., 26
37 2008). Whether there are different populations of GluR2 that are differentially regulated by S880 phosphorylation remains to be determined. Section 4 Structural plasticity of dendritic spines Subsection 1. A brief introduction to the dendritic spine morphology Dendritic spines are the major excitatory synaptic contact sites in the central nervous system [review in (Nimchinsky et al., 2002; Alvarez and Sabatini, 2007)]. Morphologically, they are small protrusions on the dendrites, and are composed of a head and a neck. The prevalent classification method categorizes dendritic spines into three groups based on the head volume as well as the ratio between the head and the neck diameter: 1) thin spines which have a small head connected to the dendrites via a narrow neck; 2) stubby spines which have no obvious distinction between the head and the neck; and 3) mushroom spines which have a bulbous head and a narrow neck (Nimchinsky et al., 2002). Dendritic spines are not permanent static structures, in contrast, both the density and the subtle structural details, such as the spine head volume and neck length and width, are subject to tight regulation during development and by synaptic activity in vitro and in vivo. The dynamics of spine morphology are considered an important structural mechanism underlying long-term synaptic plasticity as well as learning and memory (Yuste and Bonhoeffer, 2001; Muller et al., 2002; Nikonenko et al., 2002; Nimchinsky et al., 2002; Alvarez and Sabatini, 2007). Additionally, abnormalities in spine structure are associated with many types of brain diseases [review in (Fiala et al., 2002)]. 27
38 Several intrinsic properties of spines make the structural plasticity an attracting mechanism for long-term changes in excitatory synaptic strength. First of all, almost every spine contains a synapse and most of the excitatory synapses are formed on spines [review in (Nimchinsky et al., 2002; Alvarez and Sabatini, 2007)], implicating that the alteration in the spine density can directly reflect the changes in excitatory synaptic strength. Furthermore, the size of the postsynaptic density (PSD), an electron dense zone associated with postsynaptic membrane enriched in glutamate receptors, ion channels, scaffolding proteins, cytoskeletal proteins and signaling molecules [review in (Okabe, 2007; Bourne and Harris, 2008)], is highly correlated with the size of the spine head (Harris and Stevens, 1989). Since the PSD size correlates with the quantity of synaptic AMPARs (Nusser et al., 1998; Takumi et al., 1999), this suggests that the spine head volume would reflect the number of synaptic AMPARs. This is confirmed by a positive correlation between the number of synaptic AMPAR and synaptic size and the spine head volume (Baude et al., 1995; Nusser et al., 1998; Lendvai et al., 2000; Matsuzaki et al., 2001). Taken together, these observations suggest that changing the spine head volume would directly affect AMPAR-mediated synaptic transmission. Indeed, the correlation between the spine density and/or spine head volume with synaptic function has been observed, especially during LTP and LTD [review in (Yuste and Bonhoeffer, 2001; Bourne and Harris, 2008)], which will be further discussed in the following subsection. Subsection 2. Alteration in dendritic spine morphology associated with longterm synaptic plasticity and learning and memory i) LTP induction correlates with spine changes 28
39 Early EM (electron microscopy) studies of the spine structural plasticity following LTP induction produced contradictory results on the two aspects of changes: increase in spine density and enlargement of spine size [review in (Yuste and Bonhoeffer, 2001)]. Since then, accumulating evidence suggests that LTP induction is associated with spine morphological changes. Especially the development of two-photon microscope and the experimental protocols that allow monitoring of specific spines which undergo synaptic plasticity has revolutionized the field and provided clearer evidence that spine morphology changes during LTP. Spinogenesis In 1999, Maletic-Savatic found that local tetanic stimulation of Schaffer collateral inputs to CA1 pyramidal neurons in organotypic hippocampal slices causes formation of filopodia-like small protrusions along the dendrites, which could be observed up to 40 min. The changes were input-specific and NMDAR-dependent similar to the tetanusinduced LTP (Maletic-Savatic et al., 1999). Interestingly, about 27% of the new filopodia-like protrusions transformed into spine-like shapes with a bulbous head within one hour post-ltp. This suggests that the newly formed filopodia may mature into spines with functional synapses to contribute to the maintenance of LTP (Maletic-Savatic et al., 1999). The outgrowth of dendritic spines following LTP induction has also been observed in another study, in which they restricted the perimeter of LTP to a small area by locally perfusing normal recording medium while blocking synaptic activity in the rest of the slice with high Cd 2+ /low Ca 2+ buffer (Engert and Bonhoeffer, 1999). An EM study provided indirect evidence of new spine formation during LTP (Toni et al., 1999). By focusing on the synaptically activated spines, which accumulate Ca2+ precipitates, this 29
40 group found that after LTP a larger proportion of presynaptic boutons make contact with multiple spines having Ca 2+ precipitates. This result was interpreted to suggest that newly formed spines may make synaptic contacts with pre-existing presynaptic boutons nearby. These results showed a correlation between the LTP and the growth of new spines, but whether these new spines are functionally involved in LTP was not tested. To answer this question, Krucker and colleagues examined whether LTP is affected when disrupting actin dynamics (Krucker et al., 2000), which is involved in the motility and genesis of spines [review in (Matus, 2000)]. They found that preventing actin polymerization only impaired the maintenance of LTP, but not the basal synaptic transmission or the initial expression of LTP (Krucker et al., 2000). Because the time course reported for the conversion of new filopodia-like protrusions into mature spines following LTP (Maletic- Savatic et al., 1999) is similar to when actin depolymerizing agents affect LTP maintenance, these results imply that the formation of new spines may play a role in LTP maintenance. Enlargement of spine head volume In addition to an increase in spine density after LTP induction, enlargement of spines is also observed following HFS-induced LTP, which can be reversed by LFS (Zhou et al., 2004). One study found that the spine enlargement is long lasting in the initially small spines but only transient in the larger spines (Matsuzaki et al., 2004). Chemical LTP (chemltp) induction by bath application of a solution that coactivates NMDARs and adenylyl cyclase also causes rapid spine enlargement (Kopec et al., 2006). Interestingly, the robust exocytosis of AMPARs driven by the chemltp induction is found to occur well after the spine enlargement, suggesting the signaling cascades leading to the two 30
41 events may be distinct (Kopec et al., 2006). A more direct correlation between LTP and spine swelling is further confirmed by studies targeted at the level of a single spine (Harvey and Svoboda, 2007; Tanaka et al., 2008). These studies reveal similarities between long-term spine structural plasticity and LTP, for example, the spine enlargement during LTP can be divided into two phases, where the second phase is dependent on protein synthesis (Tanaka et al., 2008) which is also required for the maintenance of LTP. Interestingly, LTP induction in a single spine can reduce the threshold for LTP induction in close neighbor spines (Harvey and Svoboda, 2007), which is in line with a previously finding showing that LTP is not really restricted to a single synapse, but can spread to ~70 µm distance of the target synapse (Engert and Bonhoeffer, 1997). ii) LTD induction correlates with spine changes LTP and LTD are bidirectional modifications of the synaptic strength and they use quite opposite mechanisms, suggesting that the spine structural changes associated with LTD may be a reverse of that during LTP. Indeed, both loss of spine and shrinkage of spine head volume are detected after LTD induction in organotypic hippocampal slice cultures (Nagerl et al., 2004; Zhou et al., 2004). Spine shrinkage happens rapidly after LFS and reaches a steady-state around 40 min post-ltd (Zhou et al., 2004). Spine retraction and loss of spine occur at a slower rate and are reported to stabilize around 5 hr after LFS (Nagerl et al., 2004). Taken together these results suggest that the two phenomena may underlie the initial expression and late maintenance of LTD, respectively. As will be discussed in Chapter 4, I found that induction of LTD by bath application of 20 µm NMDA for 3 min (chemltd) in acute hippocampus slices results in a rapid and 31
42 persistent shrinkage of spine head volume but no change in spine density. Recently, a study focused on changes in synapse density (as defined as the density of spines associated with presynaptic boutons) and found a significantly decrease after LFS induced LTD in the CA1 pyramidal neurons in cultured slices. Interestingly, the spine head volume was not correlated with the synapse loss (Bastrikova et al., 2008). These data suggest that the loss of synapses is probably mediated by a retraction of presynaptic boutons rather than by changes in postsynaptic spine number or structure. This has been confirmed by another group who found that LFS-induced LTD is associated with an increase in the turnover rate and a net loss of presynaptic boutons which are independent of postsynaptic spine changes (Becker et al., 2008). Taken together, the spine morphological changes associated with LTD induction in the mature neurons may include both retraction of presynaptic boutons and rapid shrinkage of spine head volume, while loss of spines is more prominent in the younger age. Even if the spine shrinkage and the depression of synaptic strength occur simultaneously after LFS, they may utilize separate signaling cascades. It has been demonstrated that both events depend on the activity of NMDAR and calcineurin, but only synaptic depression requires the activation of PP1/PP2A, while depolymerization of actin filament by cofilin is needed for spine shrinkage (Zhou et al., 2004; Wang et al., 2007a). In addition, synaptic depression induced by insulin application is not associated with change in spine size (Wang et al., 2007a). In my study, I also found evidence that functional and structural changes following LTD may occur via two independent signaling pathways downstream of NMDAR activation (see Chapter 4 for details). 32
43 Subsection 3. Important signaling molecules involved in the plasticity of spine structure Spine cytoskeleton is composed with actin filaments (F-actin) that aggregate into bundle [review in (Matus, 2000)]. The spontaneous changes in spine shapes but not size is known to depend on the actin dynamics as it can be completely inhibited by blocking actin polymerization (Fischer et al., 1998). The actin-based spine morphological changes are also critically required for the long-term spine structural plasticity and synaptic plasticity. Interfering with actin dynamics can impair the maintenance of LTP (Kim and Lisman, 1999; Krucker et al., 2000; Fukazawa et al., 2003) as well as the spine shrinkage associated with LFS-LTD (Zhou et al., 2004; Wang et al., 2007a). Using fluorescence resonance energy tranfer (FRET) to monitor the conversion between G-actin (globular actin) and F-actin (filamentous actin), Okamoto and colleagues corroborated that tetanic stimulation enhances actin polymerization and enlarges spines, which is in line with findings that LTP induction increases F-actin content in dendritic spines (Fukazawa et al., 2003; Lin et al., 2005). On the other hand, LFS promotes actin depolymerization leading to a loss of postsynaptic actin and shrinkage of spine head (Okamoto et al., 2004). Overall, regulation of actin dynamics is crucial for plasticity of both spine structure and synaptic strength. EphB receptors EphB receptors are tyrosine kinases that co-localize with PDZ proteins at the synapses (Torres et al., 1998; Klein, 2009). They are activated when bound by their presynaptic ligand ephrin-b, and are considered an important signal for spine morphogenesis [review in (Carlisle and Kennedy, 2005; Aoto and Chen, 2007; Klein, 2009)]. Genetic deletion of 33
44 EphB1-3 in the hippocampus results in no spine formation in vitro and reduced spine density in vivo, while activation of EphB receptors by their ligand ephrin-b2 promotes spine development (Henkemeyer et al., 2003). Among these three isoforms, EphB2 is found to be the most important, as expression of EphB2 receptor in the brain slices from the EphB1-3 null mice is sufficient to rescue the spine abnormality (Kayser et al., 2006). Interesting, EphB2 has been observed to directly interact with NMDARs at synapses and is required for synaptic plasticity [review in (Aoto and Chen, 2007; Klein, 2009)]. These results suggest that EphB receptors may be critical signaling molecules that bridge spine morphological changes and synaptic plasticity. The signaling cascade initiated by EphB receptor activation is heavily studied and reviewed [review in (Carlisle and Kennedy, 2005; Aoto and Chen, 2007; Klein, 2009)]. The simplified model is that activated EphB receptors phosphorylate and activate the Rac1 guanine nucleotide exchange factor (GEF) kalirin-7, which then converts the inactive Rac1-GDP into the active Rac1-GTP. Rac1-GTP then binds to and activates PAK (p21-activated kinase), which can phosphorylate LIMK1 (LIM kinase 1). Lastly, LIMK1 inactivates the actin binding protein ADF (actin-depolymerizing factor)/cofilin by phosphorylation, and prevents actin depolymerization. Actin binding proteins Several actin binding proteins are known to play a role in spine plasticity. As mentioned above, ADF/cofilin severs actin filaments when it is activated by dephosphorylation, and LTP increases the level of inactive ADF/cofilin (phosphorylated cofilin, p-cofilin) in the spines (Chen et al., 2007; Fedulov et al., 2007). In contrast, spine shrinkage associated with LTD requires activation of cofilin probably directly or indirectly via calcineurin 34
45 activity, and can be blocked by infusing postsynaptic neurons with the p-cofilin (Zhou et al., 2004). Another actin binding protein profilin, a regulator of actin polymerization, is also found to be driven into spines in an activity-dependent manner both in vitro and in vivo (Ackermann and Matus, 2003; Neuhoff et al., 2005; Lamprecht et al., 2006). Inhibiting profilin from entering spines causes spine destabilization (Ackermann and Matus, 2003). Others Many other molecules are implicated in the activity-dependent regulation of spine structural plasticity [review in (Carlisle and Kennedy, 2005; Lippman and Dunaevsky, 2005; Tada and Sheng, 2006)]. Some of them seem to signal both changes in synaptic plasticity and spine structural plasticity, for example, CaMKII (Jourdain et al., 2003; Penzes et al., 2008) and calcineurin (Zhou et al., 2004), suggesting that functional and structural plasticity share at least part of the signaling cascade. Recently, microtubule, a dendritic cytoskeletal element, has been implicated in modulation of spine structure by affecting actin dynamics (Hu et al., 2008; Jaworski et al., 2009), indicating there is cross talk between the dynamics of dendritic and spine cytoskeleton. Section 5 Cellular and molecular basis of Alzheimer s disease (AD) Subsection 1. A brief introduction to AD i) What is AD? First described by the German psychiatrist Alois Alzheimer in 1906, Alzheimer s disease (AD) has been recognized as one of the most common form of senile dementia around 35
46 the world. More than a hundred years after its discovery, AD is still an incurable brain disease, which normally starts out as a loss of memory, and progressively causes neurodegeneration and corruption of cognitive abilities of the patients. ii) Two major types of AD Depending on the major risk factors, AD is classified into two major types: The first is an early-onset autosomal dominant form of AD (familial AD or FAD) that is diagnosed in the < 60 years old population. FAD is caused by mutations in at least three amyloid β (Aβ)-relevant genes: amyloid precursor protein (APP), presenilin 1 (PS1), and presenilin 2 (PS2) (Levy-Lahad et al., 1995; Sherrington et al., 1995; Lendon et al., 1997; Price et al., 1998; Harman, 2006; Bertram and Tanzi, 2008). The second type is called a lateonset AD or sporadic AD (SAD), for which aging is the major risk [review in (Harman, 2006)]. Apolipoprotein E4 (ApoE4) is known to modulate the onset time of the SAD in a dose-dependent manner [review in (Small and Duff, 2008)]. There is evidence supporting that accumulation of genetic mutations also contributes to the onset of SAD (Harman, 2006; Bertram and Tanzi, 2008) iii) Pathological landmarks Even if SAD and FAD have different determinants, they share similar pathological hallmarks, including degeneration of neurons in specific brain regions, deposition of extracellular senile plaques, and neurofibrillary tangles (NFTs). Neurodegeneration One prominent characteristic of the brains of AD patients is the extensive neuronal degeneration and cell death in specific areas [review in (Price et al., 1998; Selkoe, 2002; Hof and Morrison, 2004)]. Early in 1980s, a postmortem study by Whitehouse and 36
47 colleagues found that more than 75% of neurons in the nucleus basalis of Meynert, a specific area in the basal forebrain that provide major cholinergic input to hippocampus and cerebral cortex, are degenerated (Whitehouse et al., 1982). In a later study, a strong correlation between the neuronal loss in the nucleus basalis of Meynert with the severity of AD was found in a group of AD patients (Dickson et al., 1995). In addition to cell death, synapses in certain locations seem to be highly vulnerable especially during the early stages of AD [review in (Selkoe, 2002; Hof and Morrison, 2004)]. Dramatic reductions in both synaptic density and number of synapses per neuron have been detected in layer II/III and V of frontal and temporal cortex in early onset AD patients (< 65 year old) (Davies et al., 1987), and the density of synapses in the neocortex strongly correlates with psychometric indices (Terry et al., 1991). The decrease in synapse number is further confirmed by examining the level of presynaptic markers, like synaptophysin, synaptotagmin, et al., in the AD brains. For example, a reduction in synaptophysin level has been found in both hippocampus (Sze et al., 1997) and frontal cortex (Masliah et al., 2001) of AD patients. Furthermore, the hippocampal synaptophysin level correlates well with the severity of AD (Sze et al., 1997). In mouse models of AD the decrease in the density of presynaptic boutons and neurons are detected in the young adults well before the formation of plaques and tangles (Hsia et al., 1999). In summary, cell death and reduction in synaptic density occur early during the development of AD and correlate well with the cognitive decline in AD patients. Aβ and extracellular senile plaques Aβ peptides, especially the one containing 42 amino acids (Aβ42), are the core chemical elements of the extracellular senile plaques found in AD patient s brain. Aβ is a normal 37
.")
48 metabolized product of its precursor protein (APP) after cleavage by two endoproteolytic enzymes: β-secretase and γ-secretase (Figure 1.5.1). Aβ can be detected from culture media of primary neurons under normal conditions and cerebrospinal fluid from healthy people (Haass et al., 1992; Seubert et al., 1992; Shoji et al., 1992). However, in the brains of AD patients, the Aβ, especially the Aβ42 is highly expressed and accumulated as extracellular plaques (Tanzi and Bertram, 2005). From the molecular and genetic studies of FAD, the increase in Aβ production is mainly due to the mutations found in APP and presenilins (PS) (Hardy and Selkoe, 2002; Goedert and Spillantini, 2006; Bertram and Tanzi, 2008). Majority of the FAD-linked mutations are found in the PS, which is the key component of the γ-secretase complex (De Strooper et al., 1998; Wolfe et al., 1999). Mutations in PS increase the Aβ42 to Aβ40 ratio (Citron et al., 1997; Xia et al., 1997), possibly due to a gain-of-function (Citron et al., 1997). Mutations in APP mostly cluster at or near the cleavage sites by secretases, and increase the Aβ production by favoring the cleavage by BACE1 over α-secretase (Citron et al., 1992; Cai et al., 1993). The other mutations on APP locate within the Aβ sequence, and promote the production of Aβ42 over Aβ40 (Suzuki et al., 1994). 38
49 Figure The α- and β-cleavage pathways of APP There are two enzymatic processing pathways of APP in the brains. If the APP is first accessed by α-secretase that cleaves within the Aβ sequence, non-amyloidogenic products are generated among which secreted APP α (sappα) has neurotrophic and neuroprotected effects [review in (Turner et al., 2003)] that can promote neurite outgrowth via the activation of MARK/ERK signaling cascade (Gakhar-Koppole et al., 2008). Alternatively, APP can be cleaved by β- secretase, which is BACE1 in the brain, to generate secreted APP β (sappβ). Compared to the sappα, sappβ has very little or even negative effect in nutrition and neuroprotection (Turner et al., 2003). When the carboxyl-terminal fragment β (CTFβ) is further cleaved by γ-secretase, Aβ peptide is released into the extracellular domain. Depending on the cleavage sites by γ-secretease, either the short form (Aβ40) or the long form (Aβ42) will be produced. The APP intracellular domain (AICD) released as an end product in both pathways can regulate the transcriptional events as well as modulate apoptosis and cytoskeletal dynamics (Turner et al., 2003; Muller et al., 2008). Tau and neurofibrillary tangles (NFTs) Tau is a microtubule-associated protein (MAP) that is normally expressed in the neuronal axons to maintain their integrity along with other MAPs (Weingarten et al., 1975). The NFTs detected in cell bodies and proximal dendrites of the AD brains are mainly formed by the aggregation of hyperphosphorylated tau, which have been shown to gradually replace the microtubules and disintegrate neurons (Figure 1.5.2) (Gray et al., 1987; Price et al., 1998; Mudher and Lovestone, 2002; Gotz and Ittner, 2008). Figure The formation of NFTs. Tau normally binds to microtubules (MT) to stabilize the cytoskeleton. In AD brain, tau is found to be hyperphosphorylated and dissociated from MTs. These free hyperphosphorylated tau proteins aggregate and form NFTs in the cell body, causing disintegration of MTs and further cell death [review in (Mudher and Lovestone, 2002)]. 39
50 i) The amyloid hypothesis of AD The origin of the amyloid hypothesis of AD can be traced back to 1984, when Aβ was discovered as the core element in the senile plaques (Glenner and Wong, 1984). Since then new findings, including the isolation of the amyloid precursor protein (APP) and its FAD-related mutations and the identification of the mutations on presenilins that promotes Aβ42 production, provided strong support for this hypothesis [For a review on the history of amyloid hypothesis, refer to (Tanzi and Bertram, 2005)]. Basically, this hypothesis emphasizes the causative role of Aβ in AD, proposing that it is the altered level of Aβ, particularly the level of Aβ42 either by increased production due to the missense mutations in APP and PS, or dysfunction in the clearance and degradation process of Aβ, that leads to the plaque formation, neurodegeneration, and finally dementia (Hardy and Higgins, 1992; Tanzi and Bertram, 2005). Subsection 2. Synaptic mechanism of ADs based on the amyloid hypothesis i) Altered synaptic functions in AD model animals Studies of mutated human APP transgenic mice Since the discovery of mutations on APP that are associated with FAD, several strains of AD model mice that express different mutated forms of APP were developed. Transgenic (Tg) mice expressing human APP with the Swedish mutation (APP SWE ) have been found to develop several symptoms similar to AD, including age-dependent accumulation of Aβ, formation of senile plaques, and deficits in learning and memory (Hsiao et al., 1996; Chapman et al., 1999). However, data on the basal synaptic transmission and synaptic plasticity of these APP SWE Tg mice are of controversy. Chapman and colleagues (1999) 40
51 found that APP SWE Tg mice have normal basal synaptic transmission in all age groups, but show impaired LTP in both hippocampal CA1 and dentate gyrus areas in older Tg mice (15-17 month old). A later study by Seebrook s group showed opposite results: reduced basal synaptic transmission in the 18-month old APP SWE Tg mice, and normal CA1 and dentate gyrus LTP across all age (Fitzjohn et al., 2001). The inconsistency in basal synaptic transmission between these two studies may have stemmed from differences in experimental conditions or the exact age of the animals used (15-17 month old versus 18 month old), and the resulting differences in the basal synaptic transmission might have caused the varied outcome in LTP. In another strain of APP transgenic mice, which bears a V717F mutation on APP (FADlinked APP Indiana mutation, APP Ind ), a reduction in basal synaptic transmission was observed (Hsia et al., 1999; Larson et al., 1999). As for LTP, one study found that hippocampal CA1 LTP could be normally induced at least up to 10 months of age (Hsia et al., 1999), while another group reported an impairment of CA1 LTP in young (4-5 month) but not older (27-29 month) Tg mice (Larson et al., 1999). The impaired LTP in young Tg mice was found to result from altered summation of synaptic responses during LTP induction, suggesting a deficit in induction rather than the expression of LTP. Majority of the data on older APP SWE and APP Ind Tg mice are consistent in that they show a reduction in basal synaptic transmission but unaffected hippocampal LTP. The synaptic deficits are not necessarily correlated with amyloid plaque formation as plaques only appear at older ages, but synaptic transmission deficits can be seen in young mice in some cases (Hsia et al., 1999; Giacchino et al., 2000; Gruart et al., 2008). The current understanding is that synaptic deficits are likely due to soluble Abeta or Abeta oligomers 41
52 (Walsh et al., 2002; Gong et al., 2003; Lacor et al., 2004; Walsh and Selkoe, 2004; Selkoe, 2008). This is in agreement with other studies showing a better correlation between the level of soluble Aβ and the cognitive decline in the AD patients (Kuo et al., 1996; Naslund et al., 2000). Loss of presynaptic terminals is already detected in very young Tg mice or neuronal cultures derived from early postnatal Tg mice (Hsia et al., 1999; Kamenetz et al., 2003; Almeida et al., 2005) as well as AD patients (Davies et al., 1987; Sze et al., 1997), along with reduced synaptic expression of key postsynaptic proteins, PSD95 and GluR1 (Almeida et al., 2005; Roselli et al., 2005). Reduction in functional synapses and shrinkage of postsynaptic spines may explain the decrease in basal synaptic transmission in mice over-expressing mutant APP. Another possible cause of synaptic deficits seen in these transgenic mice is the disturbance of presynaptic Ca 2+ homeostasis (Larson et al., 1999). Recently it was found that the APPswe expressing cultured hippocampal neurons have altered spontaneous intracellular Ca 2+ oscillations, which was not due to changes in the function of either nicotinic acetylcholine receptors or NMDA receptors (Kloskowska et al., 2008), possibly mediated directly by the increase in the level of soluble Aβ peptides (Mattson et al., 1992). Studies of mutant presenilin transgenic mice Presenilin (PS) is a key component of the γ-secretase [review on the γ-secretase (De Strooper, 2003)]. Since the cloning of the first two FAD-linked mutations on PS1 and PS2 (Levy-Lahad et al., 1995; Sherrington et al., 1995), 176 pathogenic mutations (which accounts for 85% of all identified FAD-linked mutations) have been identified on these two genes (Bertram and Tanzi, 2008), most of which locate on PS1, suggesting a strong contribution of these missense mutations to the onset of FAD. These findings triggered 42
53 the generation of a large number of transgenic mouse lines over-expressing FAD-related PS1 mutations. All of these transgenic mice have increased expression of Aβ42, but not Aβ40 (Borchelt et al., 1996; Duff et al., 1996; Citron et al., 1997), suggesting a gain-offunction by the mutations. The effects of over-expressing mutant PS1 on synaptic properties are less severe compared to the mutant APP Tg mice. Investigations on different lines of PS1 Tg mice show similar enhancement of LTP at the CA3-CA1 synapses (Parent et al., 1999; Barrow et al., 2000; Zaman et al., 2000; Wang et al., 2007b; Dewachter et al., 2008), with no change in PPF (paired-pulse facilitation) ratio and basal synaptic transmission (Parent et al., 1999; Zaman et al., 2000). In line with these results, an in vivo study of the PS1 M146L Tg mice showed no activity-induced potentiation at the CA3-CA1 synapses (Gruart et al., 2008). There are conflicting results on the measurement of postsynaptic NMDA receptor responses in different PS1 mutant mouse lines. One group found a reduction of NMDA receptor response in the PS1 M146V Tg mice (Wang et al., 2007b), while the other saw a larger NMDA receptor-mediated synaptic transmission (Dewachter et al., 2008) in the PS1 A246E Tg mice. The difference in the mutation site or the age of the animal used may have resulted in the opposite outcome (Wang et al. used 9-12 month old mice and Dewachter et al. used 4-6 month old mice). Similar to the synaptic deficits found in other AD model animals, the enhanced synaptic potentiation in the mutant PS1 Tg mice does not correlate with the extent of plaque formation (Chui et al., 1999; Gruart et al., 2008), suggesting that this might be caused by other factors. For example, the toxic effect of soluble Aβ or disturbances in the intracellular Ca 2+ homeostasis may be responsible for the synaptic phenotypes seen in mutant PS1 Tg mice [review in (LaFerla, 2002)]. Studies from both cell lines and 43
54 transgenic mice show that mutations on PS can imbalance the intracellular Ca 2+ signaling (Guo et al., 1997; Barrow et al., 2000; Chan et al., 2000) probably by promoting the storage of Ca 2+ in the ER (LaFerla, 2002). Double/triple transgenic mouse models of AD There are many more studies on transgenic mice with different mutations on APP or combination of mutant APP and other AD related proteins, such as PS1 and tau. These mice develop AD-like symptoms [for a general review, see (Price et al., 1998; Gotz and Ittner, 2008)] and exhibit varied phenotypes on synaptic functions. For example, a triple transgenic (triple-tg) mouse expressing APP SWE, PS1 M146V, and tau P301L have reduced basal synaptic transmission and CA1 LTP at 6 months of age (Oddo et al., 2003). The synaptic dysfunctions observed in the triple-tg line are correlated with the Aβ levels. A double transgenic (double-tg) mouse expressing both APP SWE and PS1 L166P shows a reduction in both evoked AMPA receptor- and NMDA receptor-mediated responses, probably due to a decrease in synaptic density as well as the number of readily releasable synaptic vesicles (Priller et al., 2007). ii) Direct effects of exogenously applied Aβ on synaptic function Although different AD mouse models show deficits in synaptic functions, it cannot be taken for granted that these deficits are caused solely by the enhanced production of Aβ peptides. In order to directly test the role of Aβ in altering synaptic functions, many studies have been done to characterize synaptic properties and plasticity following exogenous application of various Aβ peptides. 44
55 In vitro studies done in either the medial perforant path to dentate granule cells or the Schaffer collateral inputs to CA1 neurons reported that application of subneurotoxic concentrations of Aβ peptides (i.e. Aβ42, Aβ40, or Aβ ) inhibits LTP induction (Lambert et al., 1998; Chen et al., 2000; Chen et al., 2002; Zhao et al., 2004; Knobloch et al., 2007) without affecting basal synaptic transmission (Chen et al., 2000). Miniature EPSCs recorded from organotypic hippocampal slice cultures treated with naturally released Aβ oligomers are smaller in amplitude and lower in frequency compared to the non-treated neurons (Shankar et al., 2007), suggesting that both pre- and post-synaptic properties are affected. A recent study in cultured hippocampal neurons found that exogenous application of Aβ42 globulomers suppresses the frequency of spontaneous synaptic activity by reducing synaptic vesicle release from both GABAergic and glutamatergic synapses (Nimmrich et al., 2008). Inhibition of LTP by Aβ is also reported from in vivo studies. Walsh and colleagues show that injecting the naturally secreted Aβ, collected from cells expressing mutated APP (V717F mutation in APP 751 ), into the CA1 region prevents stable LTP maintenance (Walsh et al., 2002). In a line of AD Tg mice expressing APP Swedish and Arctic mutations, which leads to production of Aβ oligomers in the brain, LTP is also impaired (Knobloch et al., 2007). Collectively, these studies suggest it is the soluble Aβ, but not its aggregated form, that causes synaptic dysfunction. Furthermore, selective degradation of the Aβ monomers by insulindegrading enzyme could not rescue the impaired LTP, indicating that it is the soluble Aβ oligomers, not the monomers, which are responsible for blocking LTP (Walsh et al., 2002). In addition to its effect on LTP, in vivo injection of Aβ peptides (i.e. Aβ42 or the C-terminal of APP containing the Aβ fragment) is reported to facilitate LTD and LTP 45
56 reversal (called depotentiation) in the CA1 region (Kim et al., 2001). In sum, majority of studies suggest that while fibrillar Aβ accumulation seem in the senile plaques is a hallmark of AD, it is the soluble Aβ oligomers that disturb synaptic functions and lead to neurodegeneration in AD (Tanzi, 2005). Cellular and molecular mechanism of AD Soluble Aβ oligomers in the AD brains have been found to bind to neuronal surfaces (Gong et al., 2003), specifically to a subset of synapses where they colocalize with a postsynaptic density marker PSD95 (Lacor et al., 2004), suggesting that Aβ may regulate postsynaptic functions directly. One candidate target of Aβ is NMDA receptors. Synthetic Aβ40 peptide selectively augments NMDA receptor current without affecting AMPA receptor current in the dentate gyrus of acute hippocampus slices (Wu et al., 1995). Consistent with this, APP Ind (V717F mutation) Tg mice show an enhancement in the ratio of NMDAR-to-AMPAR-mediated synaptic transmission in the CA1 region (Hsia et al., 1999). However, contradictory results are reported in later studies. In one study, both synthetic Aβ42 and naturally secreted Aβ from APP SWE Tg mice have been found to promote endocytosis of surface NMDAR and hence depress NMDAR current in cultured cortical neurons (Snyder et al., 2005). Moreover, they also found a reduction in the surface expression of NMDAR in cultured cortical neurons from APP SWE Tg mice (Snyder et al., 2005). These results are indirectly confirmed by a later study in which they mimicked the effects of Aβ oligomer on dendritic spine loss by partially inhibiting the NMDAR activity (Shankar et al., 2007). Other studies report a down-regulation of surface AMPARs in neurons over-expressing either wildtype or Swedish mutated APP or treating wildtype neurons with exogenous Aβ42 peptides (Almeida et al., 2005; Hsieh et 46
57 al., 2006). The down-regulation of AMPARs by Aβ overproduction is associated with endocytosis of synaptic AMPARs via mechanisms similar to LTD (Hsieh et al., 2006). Contradictory reports on the effects of Aβ on AMPAR and NMDAR regulation may be due to several variables. First, there is evidence that Aβ40 and Aβ42 may have distinct function in AD pathology. For example, majority of FADs caused by presenilin-1 mutation have reduced Aβ40 and therefore an increase in the Aβ42/Aβ40 ratio (Borchelt et al., 1996; Thinakaran and Sisodia, 2006). Second, there are differences in the experimental preparations. Both Wu et al. (1995) and Hsia et al. (1999) were working with acute adult hippocampal slices, while Snyder et al. (2005), Almeida (2005) and Hsieh (2006) were using either cultured neurons from embryonic mice or organotypic hippocampal slice cultures prepared from early postnatal mice. Third, the presence or absence of APP itself may have also affected the results. In any case, alterations in NMDAR function by Aβ suggest that Aβ will affect downstream Ca 2+ -dependent signaling pathways. Calcineurin, a protein phosphatase activated by Ca 2+, may be one of the downstream signaling molecules affected by Aβ, as it is required for the inhibition of perforant pathway LTP (Chen et al., 2002), endocytosis of surface AMPARs (Hsieh et al., 2006), and loss of spines (Hsieh et al., 2006; Shankar et al., 2007) by Aβ. The upstream phosphatase of calcineurin, PP1, is also found to be involved in the Aβ-induced neurotoxicity as inhibition of PP1 can rescue the LTP deficit both in vitro and in vivo (Knobloch et al., 2007). In addition to activating protein phosphatases, Aβ prevents the activation of CaMKII, a Ca 2+ -dependent protein kinase necessary for LTP, and phosphorylation of AMPA receptors (Zhao et al., 2004). 47
58 Besides NMDA receptors, Aβ may act directly on the L-type Ca 2+ channels to increase the intracellular Ca 2+ level (Mattson et al., 1992; Weiss et al., 1994). Recently, an impaired p21-activated kinase (PAK)-cofilin signaling pathway has been found in both human AD brains and AD mouse models (Zhao et al., 2006). This signaling pathway is critically involved in the dendritic spine morphogenesis and actin dynamics (Meng et al., 2002; Hayashi et al., 2004), and its dysfunction is associated with neurodegeneration observed in the AD brains (Zhao et al., 2006). Interestingly, the authors found that the defect in PAK-cofilin pathways is likely caused by Aβ oligomers, as reducing Aβ level by immunizing mice with anti-aβ antibody can rescue the signaling (Zhao et al., 2006). Dendritic spine degeneration induced by Aβ oligomers is also observed in a later study, which proposed that a partial inhibition of NMDA receptor by Aβ oligomer causes less Ca 2+ influx leading to a loss in dendritic spines (Shankar et al., 2007). In addition to changing the postsynaptic Ca 2+ signal, Aβ also likely affects presynaptic Ca 2+, as Aβ globulomers are reported to specifically inhibit presynaptic P/Q type calcium channels (Nimmrich et al., 2008). There are reports that Aβ can even regulate gene expression. Treating cultured hippocampal neurons with soluble Aβ oligomers induces rapid expression of an immediate early gene (IEG) Arc/Arg 3.1 (Lacor et al., 2004). Interestingly, a decrease in the expression of multiple synaptic plasticity related genes, including Arc/Arg 3.1 and zif268, have been observed in transgenic mice expressing APP and presenilin-1 (Dickey et al., 2003) and transgenic mice expressing happ with Swedish and Arctic mutation, which are prone to produce Aβ oligomers (Knobloch et al., 2007). In any case, changes in the expression of IEG, especially the Arc/Arg 3.1, are implicated in the alteration of 48
59 synaptic plasticity (Guzowski et al., 2000; Steward and Worley, 2001; Shepherd et al., 2006). It is known that over-expression of Arc/Arg 3.1 causes learning dysfunctions (Guzowski, 2002), possibly via reducing surface GluR1-containing AMPARs expression (Shepherd et al., 2006). On the other hand, mice lacking Arc/Arg 3.1 show an increase in surface GluR1-containing AMPARs (Shepherd et al., 2006). Subsection 3. Neuronal function of BACE1 and its significance i) Physiological functions of BACE1 Substrates of BACE1 Besides cleaving APP to produce Aβ, BACE1 is likely to have other substrates as it is widely distributed in the CNS (Vassar et al., 1999; Kitazume et al., 2001; Gruninger- Leitch et al., 2002; Lichtenthaler et al., 2003; Li and Sudhof, 2004). One substrate is the beta-subunit of voltage-gated sodium channels (VGSC β ) (Wong et al., 2005). It is found that reducing BACE1 activity decreases the expression of VGSC β (Wong et al., 2005). Interestingly, a later study in which BACE1 is over-expressed in the neuroblastoma cells, the α subunit of the VGSC (VGSC α ) level as well as the cell surface expression of VGSC are reduced due to the cleavage of VGSC β by BACE1 (Kim et al., 2007). Another substrate of BACE1 is neuregulin-1 (Nrg1), which is an axonal signaling molecule critical for regulating myelination (Lemke, 2006). Consistent with this, BACE1-/- mice show hypomyelination of the peripheral nerves (Willem et al., 2006) as well as the central nerves (Hu et al., 2006). Both of these studies showed an accumulation of unprocessed Nrg1 and a reduction in its cleavage product in BACE1-/- mice suggesting that Nrg1 cleavage by BACE1 is important for myelination (Hu et al., 2006; Willem et 49
60 al., 2006). A recent study reported alterations in neuregulin-1/erbb4 signaling in the BACE1-/- mouse (Savonenko et al., 2008) providing further support that BACE1 is involved in Nrg1 signaling. Synaptic deficits in BACE1 -/- mice Mice lacking BACE1 gene showed no β secretase activity and much less Aβ production in the brain compared to wildtype littermates. Initial characterization of the BACE1 knockouts showed that they are viable and fertile, with no gross difference in behavior and development (Cai et al., 2001; Luo et al., 2001; Roberds et al., 2001; Ohno et al., 2004). Furthermore, knocking out the BACE1 gene in mouse models of AD can rescue the hippocampus-specific memory deficits (Ohno et al., 2004; Laird et al., 2005; Ohno et al., 2006) and ameliorate the impaired hippocampal cholinergic regulation of neuronal excitability (Ohno et al., 2004). These findings were quite encouraging and suggested that BACE1 may be a good therapeutic target for treating AD (Citron, 2002; Vassar, 2002; Citron, 2004). However, further investigations, including my work (for details see Chapter 2), of the synaptic properties in the BACE -/- mouse unveiled an important role of BACE1 in synaptic transmission and plasticity. I found that in the hippocampus CA3-CA1 synapses, BACE1-/- mice display normal AMPAR-mediated and pharmacologically isolated NMDAR-mediated synaptic transmission, but show larger paired-pulse facilitation (PPF) ratio, indicating a reduction in presynaptic release (Laird et al., 2005). While TBS-induced LTP and LTD induced by either one (non-saturated) or three (saturated) episodes of paired-pulse 1 Hz protocol are normal, BACE1 -/- displays significantly enhanced de-depression (reversal of LTD) (Laird et al., 2005) (see Chapter 2). 50
61 While BACE1 is expressed at the CA3-CA1 synapses, its expression is much higher at the mossy-fiber synapses in CA3 (Laird et al., 2005). Recently as a follow-up of my initial study, the synaptic function at mossy fiber-ca3 synapses was characterized in the BACE1-/-. BACE1-/- displayed a much more severe deficit in presynaptic release at the mossy fiber synapses, as reflected by a dramatic increase in PPF ratio and a loss of a presynaptic form of LTP (mfltp). The mfltp was rescued by increasing extracellular Ca 2+ concentration, indicating that the presynaptic Ca 2+ regulation may be abnormal in the BACE1-/- mice (Wang et al., 2008). One possible mechanism for the presynaptic Ca 2+ defect in the BACE1 -/- may be the alteration in Nrg1/ErbB4 signaling (Savonenko et al., 2008). Nrg1/ErbB4 signaling is known to promote the α7 nicotinic receptor (nachr) expression (Liu et al., 2001), the activation of which allows Ca 2+ entry into the presynaptic boutons (Seguela et al., 1993). The altered synaptic properties found in the BACE1 -/- could interfere with memory formation and storage. Consistent with this interpretation, detailed behavioral studies on BACE1 -/- mice reported problems in both cognitive and emotional memory tests (Harrison et al., 2003; Laird et al., 2005; Ma et al., 2007; Savonenko et al., 2008). 51
62 Chapter 2: β-site APP cleaving enzyme 1 (BACE1) knockouts have abnormal synaptic properties in the hippocampus The data in this chapter are part of a paper published in the Journal of Neuroscience: Laird FM, Cai H, Savonenko AV, Farah MH, He K, Melnikova T, Wen H, Chiang HC, Xu G, Koliatsos VE, Borchelt DR, Price DL, Lee HK, Wong PC, Journal of Neuroscience 2005; 50: My contribution: All of the electrophysiological characterization of the BACE1 knockouts. Section 1 Introduction Alzheimer s disease (AD) is a progressive neurodegenerative disorder, which starts out as a loss of memory. It is widely believed that AD is initiated by synaptic dysfunction, which may be the basis for the loss in memory function in the early stages of the disease (Selkoe, 2002; Walsh and Selkoe, 2004a, 2004b). Ultimately the disease progresses into severe loss in cognition and neurodegeneration. Current understanding of the disease suggests production of amyloid β peptide (Aβ) as the key molecular event that ultimately leads to neuronal degeneration and clinical pathology (Hardy and Selkoe, 2002). Aβ is produced by a sequential proteolytic cleavage of the amyloid precursor protein (APP) by two endoproteolytic enzymes initially described as gamma- and beta-secretases. In the brain, beta-site APP cleaving enzyme (BACE1), a transmembrane aspartic protease has been found to be the major neuronal β-secretase (Vassar et al., 1999; Cai et al., 2001; Luo et al., 2001; Roberds et al., 2001). Mice lacking BACE1 gene showed no β secretase activity and much less Aβ production in the brain compared to wildtype littermates. 52
63 Initial characterization of the BACE1 knockouts showed that they are viable and fertile, with no gross difference in behavior and development (Cai et al., 2001; Luo et al., 2001; Roberds et al., 2001; Ohno et al., 2004). Furthermore, knocking out the BACE1 gene in mouse models of AD can rescue the hippocampus-specific memory deficits (Laird et al., 2005) and ameliorate the impaired hippocampal cholinergic regulation of neuronal excitability (Ohno et al., 2004). These findings were quite encouraging and suggested that BACE1 may be a good therapeutic target for treating AD (Citron, 2002; Vassar, 2002; Citron, 2004). However, as BACE1 is widely distributed in the CNS (Vassar et al., 1999; Kitazume et al., 2001; Gruninger-Leitch et al., 2002; Lichtenthaler et al., 2003; Li and Sudhof, 2004), it is likely to have other substrates besides APP. One of them is the APP-like protein (APLP), who belongs to the same gene family as APP and the cleavage products by BACE1 plays a role in transcriptional activation (Li and Sudhof, 2004). Later Wong and colleagues found that reducing BACE1 activity decreases the expression of the beta-subunit of voltage-gated sodium channel (VGSC β ), and suggested VGSC β as another substrate of BACE1 (Wong et al., 2005). In order to use BACE1 as a drug target in treating ADs, it is critical to understand the role of BACE1 in normal neuronal functions. To do that, we studied synaptic properties, including basal synaptic transmission and synaptic plasticity in the adult BACE1 knockout mice. Here we found that the BACE1 knockouts have normal basal synaptic transmission as well as long-term potentiation (LTP) and long-term depression (LTD); however, there was an increase in paired-pulse facilitation (PPF) ratio and de-depression, indicating that the BACE1 knockouts have deficits in presynaptic function as well as 53
64 bidirectional regulation of synaptic plasticity. Our data suggest a specific role of BACE1 in normal synaptic physiology. Section 2 Methods and Materials Subsection 1. Acute hippocampus slices preparation for electrophysiology Hippocampal slices were prepared from adult (3-6 months old) male BACE1 knock-out or wild-type mice as described previously (Lee et al., 1998). Briefly, under deep anesthesia by halothane, mice were killed by decapitation, and their brains were removed quickly and transferred to the ice-cold dissection buffer containing the following (in mm): sucrose, 2.6 KCl, 1.23 NaH 2 PO 4, 26 NaHCO 3, 10 dextrose, 3 MgCl 2, and 1 CaCl 2 (bubbled with a mixture of 5% CO 2 and 95% O 2 ). A block of hippocampus was removed and sectioned into 400 µm-thick slices using a vibratome. The slices were recovered for 1.5 h at room temperature in artificial CSF (ACSF) (in mm): 124 NaCl, 5 KCl, 1.25 NaH 2 PO 4, 26 NaHCO 3, 10 dextrose, 1.5 MgCl 2, and 2.5 CaCl 2 (bubbled with a mixture of 5% CO 2 and 95% O 2 ). Subsection 2. Electrophysiological Recordings All recordings were done in a submersion recording chamber perfused with ACSF ( C, 2 ml/min). Synaptic responses were evoked by stimulating the Schaffer collaterals with 0.2 ms pulses delivered through concentric bipolar stimulating electrodes (Frederick Haer Company, Bowdoinham, ME) and recorded extracellularly in CA1 stratum radiatum. Baseline responses were recorded using half-maximal stimulation intensity at Hz. To induce long-term potentiation (LTP), four trains of theta-burst 54
65 stimulation (TBS) were delivered at 0.1 Hz. Each train consists of 10 bursts (four pulses at 100 Hz per burst) repeated at 5 Hz frequency. Long-term depression (LTD) was induced by a paired-pulse 1 Hz protocol (PP-1 Hz) (paired pulses with 50 ms interstimulus interval (ISI) delivered at 1 Hz for 15 min). We used three episodes of paired-pulse 1 Hz stimulation to induce the saturated LTD. For measurement of pairedpulse facilitation (PPF), we used ISIs of 25, 50, 100, 200, 400, 1000, and 2000 ms. Pharmacologically isolated NMDA receptor-mediated synaptic responses were measured using 0 mm MgCl 2 ACSF with 10 µm NBQX. 100 µm of APV was added at the end of each experiment to confirm the NMDA receptor-mediated responses. Subsection 3. Analysis of Electrophysiology data The evoked extracellular field potential were digitized and stored in the computer by the Igor software (WaveMetrics). Using a custom-made Igor program, either the initial slope (for measurement of AMPA receptor responses) or the amplitude (for pharmacologically isolated NMDA receptor responses) of population field potential was measured as the strength of synaptic transmission. For statistic, Fisher s PLSD post hoc test was used to compare the pair-pulse facilitation ratio. For the LTP and LTD data, the measurements at the end of each recording (60 min after baseline for LTD, 120 min for LTP and saturated LTD, 30 min for de-depression ) were compared using student s t-test. Section 3 Results Subsection 1. BACE1 knockout mice have deficit in presynaptic release. 55
66 The immunostaining experiment carried out by our collaborators indicated that BACE1 is highly expressed in the presynaptic boutons, which suggest that BACE1 may play a role in the presynaptic function. To examine whether presynaptic function is altered in BACE1 knockout mice, paired-pulse facilitation (PPF ratio) was measured by giving pairpulse stimulations at different ISIs. Interestingly, we found that there is a significant increase in the PPF ratio in BACE1 knockout mice compared with littermate controls (Fig. 2.1) at 25 and 50 ms interstimulus interval (PPF ratio at 25 ms ISI: BACE1 wildtype, 1.52 ± 0.03, n = 40 slices, 12 mice; BACE1 knockout, 1.65 ± 0.06, n = 43 slices, 12 mice; Fisher s PLSD post hoc analysis, p < 0.03; at 50 ms ISI: BACE1 wildtype, 1.59 ± 0.03, n = 40 slices, 12 mice; BACE1 knockout, 1.75 ± 0.06, n = 43 slices, 12 mice; Fisher s PLSD post hoc analysis, p < 0.004). Because changes in PPF ratio have been attributed to alterations in presynaptic release probability (Manabe et al., 1993), the increased PPF ratio observed in BACE1 knockout mice may indicate a deficit in presynaptic release. Figure 2.1. The BACE1 knockouts have presynaptic deficit. An increase in PPF ratio in the BACE1 knockouts. PPF ratio was measured at different ISIs, as shown in the bottom panel. Example field potential traces taken at an ISI of 50 ms are shown for both BACE1 wildtypes (WT, open circle) and BACE1 knockouts (KO, filled circle) in the top panel. Asterisk: p < 0.03 for 25 ms ISI, p < for 50 ms ISI, Fisher s PLSD post hoc analysis. 56
67 Subsection 2. The basal synaptic transmissions are normal in the BACE1 knockout mice. To further investigate the role of BACE1 in synaptic transmission, we measured the AMPA receptor mediated basal synaptic transmission by examining the input-output relationship. To do this, extracellular field potentials were recorded in the stratum radiatum of CA1 following a gradual increase in stimulation intensity. The resulting synaptic responses were plotted against the presynaptic fiber volley amplitude to control for the number of axons recruited by each stimulation intensity. We found that the BACE1 knockouts display similar input-output relationship of AMPA receptor-mediated responses as the wildtype littermates (Figure 2.2 A), suggesting there is no alteration in basal synaptic transmission. Even though NMDA receptors are normally inactive during basal synaptic transmission (Dingledine et al., 1999), their activation is critical for the induction of synaptic plasticity (Nicoll and Malenka, 1995; Lynch, 2004). To study whether lacking BACE1 activity affects NMDA receptor-mediated synaptic transmission, NMDA receptor-mediated responses were pharmacologically isolated by addition of NBQX (10 µm) and the inputoutput curve was generated by varying the stimulation intensity. Again, we did not detect a significant difference in the NMDA receptor-mediated basal synaptic transmission between the wildtypes and the knockouts (Figure 2.2 B). Taken together, these results indicate that the basal synaptic transmission of Schaffer collateral inputs to CA1 is unaffected by lacking BACE1. 57
68 Figure 2.2. Synaptic transmission is normal in the BACE1 knockout mice. A. No change in AMPA receptormediated basal synaptic transmission in BACE1 knockout. Input output curves were generated by gradually increasing stimulus intensity and measuring the initial slope of the FP (left panel). The measured FP slopes are plotted against the amplitude of presynaptic fiber volley, a measure of presynaptic action potentials. Example field potential traces taken at all stimulation intensities are shown for both wildtype and BACE1 knockout mice on the right side. B. Normal NMDA receptor-mediated basal synaptic transmission in BACE1 knockouts. Pharmacologically isolated NMDA receptor-mediated synaptic transmission was measured by generating input output curves. Example FP traces are shown in the top panel. Top two traces show the pharmacological isolation of NMDA receptor mediated responses in wildtypes and BACE1 knockouts. Gray traces are AMPA receptormediated responses recorded in normal ACSF. Thick black traces are field potentials after switching to ACSF with 0 mm MgCl 2 and 10 mm NBQX to isolate NMDA receptor-mediated responses. At the end of all experiments, 100 µm APV was added, which completely blocked the NMDA receptor-mediated FP (thin black traces). The bottom two traces show NMDA receptormediated FPs recorded during the generation of the input-output curves from the wildtypes (left) and knockouts (right). Wildtype (WT, open circles) and BACE1 knockout (KO, filled circles) Subsection 3. BACE1 knockout mice exhibit a specific deficit in synaptic plasticity. To determine whether synaptic plasticity is altered in the BACE1 knockout mice, first we examined LTP using four trains of TBS. We found that there is no difference in the magnitude of LTP up to 2 h after the TBS protocol (Wildtype, 165 ± 11% at 2 h after TBS, n = 18 slices, 10 mice; BACE1 knockout, 151 ± 10%, n = 7 slices, 5 mice) (Fig. 2.3 A). Similarly, we did not find a deficit in LTD induced with one train of paired-pulse 1 Hz protocol (PP-1 Hz, 15 min, ISI = 50 ms) (wildtype, 75 ± 4% at 1 h post-onset of PP-1 Hz, n = 12 slices, 5 mice; BACE1 knockout, 78 ± 5%, n = 12 slices, 5 mice) (Fig. 2.3 B). Because one episode of PP-1 Hz does not saturate LTD, we repeated the study with 3 58
69 trains of PP-1 Hz to determine whether the lower ceiling of synaptic plasticity has changed in BACE1 knockout mice. As shown in Figure 2.3 C, we did not find a difference between control and BACE1 knockout mice (Wildtype: 58 ± 4% at 1 h post onset of last PP-1 Hz, n = 16, 7 mice; BACE1 knockout: 63 ± 6%, n = 18, 8 mice). To determine whether LTD reversal (de-depression) is affected in BACE1 knockout mice, we delivered four trains of TBS after LTD saturation. Surprisingly, we found that BACE1 knockout mice produced a significantly larger de-depression compared with control mice (Wildtype, 168 ± 16% at 30 min after TBS, n = 13 slices, 7 mice; BACE1 knockout, 252 ± 27%, n = 13 slices, 7 mice; Student s t test, p < 0.01) (Fig. 2.3 D). Both LTP and dedepression are induced by the same TBS protocol, but our data indicate that BACE1 knockout mice show a selective increase in de-depression. To determine whether this is attributable to differential summation of responses during TBS, we compared the total charge transfer (area under the field potentials) during the TBS (Fig. 2.3 E). We found a significant increase in responses during TBS in the BACE1 knockouts only during the dedepression (ANOVA, repeated measures, F(1,23) = 6.573; p < 0.02) (Fig. 2.3 E). Figure 2.3. Synaptic plasticity in BACE1 knockout mice. A. No change in LTP in BACE1 knockout mice. Grouped averages are shown on the left graph. There is no difference in LTP magnitude in BACE1 knockouts (filled circles) compared with wiltype mice (open circles). Example field potential traces taken before and 2 h after TBS are overlapped and shown in the right panel for both wildtype mice (left) and BACE1 knockouts (right). B. No change in LTD in BACE1 knockout mice. LTD induced by 15 min of PP-1 Hz are shown for wildtype mice (open circles) and BACE1 knockout mice (filled circles). Example field potential traces taken before and 1 h after the onset of PP-1 Hz are shown in the right panel. C. No difference in LTD saturation in BACE1 knockout mice. Three episodes of PP-1 Hz were repeated at 15 min intervals to saturate LTD in both wildtyps (open circles) and knockouts (filled circles). Top panel shows example field potential traces taken from the baseline and 1 h after the onset of the third PP-1 Hz overlapped for both wildtypes (left) and BACE1 knockouts (right) for comparison. D. Larger de-depression (LTD reversal) in the BACE1 knockout mice. After the saturation of LTD (shown in C), TBS was delivered to induce de-depression. Bottom panel shows the average data in which BACE1 knockouts (filled circles) show a significantly larger dedepression compared with wildtypes (open circles). Baseline in this graph was renormalized to the 20 min before TBS for better comparison. Example traces taken before TBS and 30 min 59
70 afterward are overlapped for comparison for wildtypes (left) and BACE1 knockouts (right). E. Larger summation of TBS responses only during the de-depression in the BACE1 knockout mice. Responses during TBS were compared between wildtypes and BACE1 knockouts during LTP and de-depression induction. Top panel shows example traces taken from the first train of TBS. The traces were taken to match the initial field potential size. Traces from wildtype (gray lines) and BACE1 knockout (black lines) are overlapped for comparison. Note larger responses in BACE1 knockout during the de-depression but not LTP. To quantify these differences, the area under the TBS responses were calculated and normalized to the area under a single field potential (bottom panel). There was a significant increase in the normalized TBS area from the BACE1 knockouts only during the de-depression compared with wildtypes. The asterisk indicates statistically significant difference in normalized TBS area during all four TBS trains. P < 0.02 ANOVA repeated measurement. KO, Knock-out mice; WT, wild-type mice. 60
71 Section 4. Discussion We found that the BACE1 knockout mice have specific deficits in synaptic transmission and plasticity. Compared to the wildtype littermates, the BACE1 knockout mice have normal basal synaptic transmission mediated by both AMPA receptor and NMDA receptor, but the PPF ratio is significantly larger when measured at 50 ms ISI. Both TBSinduced LTP and PP-1 Hz-induced LTD are comparable between the knockouts and wildtypes. However, the de-depression induced by TBS after saturated LTD is greatly increased in the BACE1 knockout mice. Subsection 1: BACE1 and basal synaptic transmission. While BACE1 knockout mice display normal AMPA receptor-mediated and pharmacologically isolated NMDA receptor-mediated synaptic transmission at the hippocampal Schaffer-Collateral input to CA1 synapses (Figure 2.2), these synapses showed larger PPF ratio compared to wildtype littermates when tested with using 25 and 50 ms ISIs (Figure 2.1). Changes in PPF ratio is linked to alterations in presynaptic release probabilities (Manabe et al., 1993). Therefore, the increase in PPF ratio observed in BACE1 knockout mice indicates a reduction in presynaptic release, which is consistent with the high expression of BACE1 in presynaptic terminals (Laird et al., 2005). This implies that one of the physiological functions of BACE1 in the wildtype mice may be to positively regulate the presynaptic release. How BACE1 regulates this process is still unclear. BACE1 knockout mice might have alteration in the expression of beta-subunit of voltage-gated sodium channel (VGSCß) (Wong et al., 2005), but it doesn t seem to be responsible for the presynaptic deficit, which may affect whether the presynaptic release will be trigger but the probability of release is mainly determined by the Ca 2+ entry into 61
72 the presynaptic bouton (Rusakov, 2006). Besides monitoring presynaptic release, recent data suggest that changes in the PPF ratio can also be caused by postsynaptic modifications, such as by varying the subunit composition of AMPA receptors (Rozov et al., 1998; Shin et al., 2005). Therefore, there is a possibility that knockout of BACE1 may also affect postsynaptic AMPA receptor function, which may explain why the AMPA receptor-mediated synaptic transmission is normal in the knockout mice even when the presynaptic release is reduced. Subsection 2. BACE1 regulates synaptic plasticity. Regardless of the exact role BACE1 plays in synaptic functions, the increase in the PPF ratio indicates that a lack of BACE1 may affect synaptic integration at higher frequencies. This observation may explain the larger de-depression in BACE1 knockout mice compared with control mice. However, contrary to our expectations, we did not observe any increase in LTP in BACE1 knockout mice, which is induced by the same TBS protocol. One possibility is that the expression of LTP and de-depression use different molecular mechanisms (Abeliovich et al., 1993; Lee et al., 2000). In this case, BACE1- dependent pathways may act as a negative regulator of de-depression mechanisms, while leaving LTP mechanisms intact. Our data show an enhanced summation of responses during TBS in BACE1 knockouts only during de-depression (Fig. 2.3 E) indicating that the BACE1 probably acts selectively on the induction mechanisms of de-depression. Regardless of the mechanism, the enhanced transmission of information at higher frequencies (as shown by an increase in the ratio of PPF) suggests that altered BACE1 function may interfere with information transfer across synapses. Additionally, the 62
73 enhanced de-depression (LTD reversal) observed in BACE1 knockout mice may prevent stable expression of LTD and hence would interfere with information storage/memory. Section 5 Conclusion We speculate that the enhanced PPF and/or de-depression may be responsible for the behavioral deficits (Laird et al., 2005) seen in the BACE1 null mice by either preventing effective transmission and/or storage of relevant information. In future studies, it will be interesting to clarify whether abnormalities in synaptic plasticity reported here in BACE1 knockout mice are dependent on APP processing. Crosses of APP transgenic mice to BACE1 knockout mice should be of value in clarifying this issue. Because BACE1 is highly expressed at the mossy fiber terminals that synapse onto CA3 neurons in the hippocampus (Laird et al., 2005), it will be important to examine synaptic transmission and plasticity at theses synapses in BACE1 knockout mice. 63
74 Chapter3: Regulation of synaptic AMPA receptor subunit composition by GluR1-S845 phosphorylation Paper in preparation for submission: Kaiwen He, Lihua Song, Laurel W. Cummings, Jonathan Goldman, and Hey-Kyoung Lee My contribution: All of the experiments except the surface biotinylation and part of the co-immunoprecipitation experiments. Section 1 Introduction α-amino-3-hydroxy-5-methyl-4-isoxazolepropionate receptors (AMPARs) are ionotropic glutamate receptors that mediate most of the fast excitatory synaptic transmission in the brain (Dingledine et al., 1999). AMPARs are composed of four subunits, GluR1 to GluR4 (Hollmann and Heinemann, 1994; Rosenmund et al., 1998; Dingledine et al., 1999), which are thought to assemble into dimers and further form a tetrameric ion channel (Ayalon and Stern-Bach, 2001; Mansour et al., 2001; Sun et al., 2002; Greger et al., 2003; Greger et al., 2007). Unique among the four subunits, GluR2 undergoes mrna editing at the Q/R site within the pore loop (Seeburg et al., 1998), which makes GluR2- containing AMPARs impermeable to Ca 2+, insensitive to blockade by polyamines, and have relatively low single channel conductance (Hollmann et al., 1991; Jonas and Burnashev, 1995; Swanson et al., 1997; Washburn et al., 1997; Derkach et al., 2007). In the hippocampus, the majority of AMPARs are either GluR1/GluR2 or GluR2/GluR3 heteromers with only about 10% being GluR1 homomers (Wenthold et al., 1996) suggesting that most are impermeable to Ca 2+. Recent evidence suggests that some forms of neural activity can alter synaptic AMPAR subunit composition, which affects its Ca 2+ permeability. In cerebellar stellate cells, high 64
75 frequency afferent stimulation triggers the appearance of Ca 2+ -impermeable AMPARs (Liu and Cull-Candy, 2000; Liu and Cull-Candy, 2002) in a process referred to as Ca 2+ - permeable AMPAR plasticity (CARP) (Gardner et al., 2005). On the other hand, high frequency stimulation of Schaffer collateral inputs to CA1, which produces long-term potentiation (LTP), leads to transient synaptic incorporation of Ca 2+ -permeable AMPARs under certain conditions (Plant et al., 2006) (but see (Adesnik and Nicoll, 2007)). Homeostatic plasticity triggered in vitro by prolonged blockade of neural activity also leads to the appearance of Ca 2+ -permeable AMPARs (Kelleher et al., 2004; Thiagarajan et al., 2005; Sutton and Schuman, 2006) (but see (Becker et al., 2008)). In vivo, there is evidence supporting a change in Ca 2+ -permeability of AMPARs in neocortical pyramidal neurons during development (Kumar et al., 2002; Shin et al., 2005). Furthermore, in vivo experience, such as single whisker stimulation (Clem and Barth, 2006), visual deprivation (Goel et al., 2006), a single exposure to cocaine (Bellone and Luscher, 2006), and cocaine withdrawal (Conrad and Wolf, 2008) have been shown to promote the incorporation of Ca 2+ -permeable AMPARs at synapses. Pathological conditions, like ischemia (Liu et al., 2006) and epilepsy (Grooms et al., 2000), are also known to increase synaptic Ca 2+ -permeable AMPARs. Collectively, these reports indicate that the regulation of AMPAR subunit composition is an important event for many neuronal functions, as well as dysfunction. There are several reports supporting the regulation of GluR2 as a mechanism for activitydependent alterations in synaptic AMPAR subunit composition. For example, CARP in cerebellar stellate cells is associated with synaptic incorporation of GluR2-containing AMPARs, which is dependent on its interaction with Pick1 (Brebner et al., 2005; Gardner 65
76 et al., 2005). Similarly, the appearance of Ca 2+ -permeable AMPARs at synapses by ischemia (Liu et al., 2006) or cocaine injection (Bellone and Luscher, 2006) is dependent on GluR2-Pick1 interaction. However, the appearance of synaptic Ca 2+ -permeable AMPARs is often associated with an increase in the GluR1 subunit with little change in the GluR2 levels (Thiagarajan et al., 2005; Goel et al., 2006; Sutton and Schuman, 2006; Conrad and Wolf, 2008) implicating a GluR1-dependent mechanism. Previously, we found that experience-dependent appearance of Ca 2+ -permeable AMPARs in visual cortex is correlated with an increase in the phosphorylation of S845 on the GluR1 subunit (Goel et al., 2006). This suggests that phosphorylation of GluR1-S845 may be a candidate to regulate synaptic AMPAR subunit composition. GluR1-S845 is a substrate of protein kinase A (PKA) (Roche et al., 1996), which when phosphorylated enhances channel mean open probability (Banke et al., 2000) and also promotes synaptic trafficking of GluR1-containing AMPARs (Esteban et al., 2003; Oh et al., 2006). To examine whether GluR1-S845 phosphorylation plays a role in regulating synaptic AMPAR subunit composition, we performed a series of experiments using a line of mutant mice specifically lacking the S845 site (GluR1-S845A mutants) (Seol et al., 2007). Here we report that GluR1-S845A homozygous (HM) mice have less GluR1 homomers in the hippocampus and lack functional GluR1 homomers at the Schaffer collateral to CA1 synapses. The loss of functional GluR1 homomers in GluR1-S845A was rescued by blocking lysosomal protease activity suggesting that it was likely due to rapid internalization and degradation. Acute dephosphorylation of the GluR1-S845 site in wildtype mice by NMDA application, which induces chemical LTD (chemltd) (Kameyama et al., 1998; Lee et al., 1998), mimicked the loss of functional GluR1 66
77 homomers in the S845A HM mice. Moreover, low frequency stimulation (LFS)-induced LTD was also accompanied by a reduction in functional GluR1 homomers. These results support the hypothesis that GluR1-S845 phosphorylation regulates AMPAR subunit composition by stabilizing functional GluR1 homomers, and that LTD is associated with the removal of these Ca 2+ -permeable AMPARs. Section 2 Methods and Materials Subsection 1. Acute hippocampus slices preparation for electrophysiology Hippocampal slices were prepared from 3 to 4 week old mice (S845A mutants and their wildtype littermates or regular wildtype mice) as described previously (Lee et al., 1998). Briefly, under deep anesthesia by halothane or isoflurant, mice were killed by decapitation, and their brains were removed quickly and transferred to the ice-cold dissection buffer containing the following (in mm): sucrose, 2.6 KCl, 1.23 NaH 2 PO 4, 26 NaHCO 3, 10 dextrose, 3 MgCl 2, and 1 CaCl 2 (bubbled with a mixture of 5% CO 2 and 95% O 2 ). A block of hippocampus was removed and sectioned into 400 µmthick slices using a vibratome. The slices were recovered for 1.5 h at room temperature in artificial CSF (ACSF) (in mm): 124 NaCl, 5 KCl, 1.25 NaH 2 PO 4, 26 NaHCO 3, 10 dextrose, 1.5 MgCl 2, and 2.5 CaCl 2 (bubbled with a mixture of 5% CO 2 and 95% O 2 ). All procedures for animal use followed the NIH guidelines, and were approved by the University of Maryland College Park Institutional Animal Care and Use Committee (IACUC). 67
78 Subsection 2. Field potential recording from Schaffer collateral synapses in CA1 area All recordings were done in a submersion-type recording chamber perfused with ACSF ( C, 2 ml/min). Synaptic responses were evoked by stimulating the Schaffer collaterals with 0.2 ms pulses delivered through either concentric bipolar stimulating electrodes (Frederick Haer Co., Bowdoinham, ME) or double barrel glass electrodes (Sutter Instrument Co., Novato, CA) filled with ACSF, and recorded extracellularly in the CA1 stratum radiatum. Baseline responses were recorded using a half-maximal stimulation intensity at Hz. For PhTX (philanthotoxin-433) sensitivity experiment, 100 μm D,L-APV was added to the ACSF either at the beginning of the recording or after the chemltd/lfs-ltd induction to isolate the AMPAR-mediated response. To induce chemltd, 20 μm NMDA was infused for 3 min after at least 20 min of stable baseline. LFS-LTD was induced by delivering 1 Hz stimulation for 15 min. Subsection 3. Whole cell recording of evoked AMPAR currents All evoked AMPAR current recordings were done in ACSF with low K + and high divalents (2.5 mm KCl, 4 mm MgCl 2, and 4 mm CaCl 2 ; C, 2 ml/min, saturated with 5% CO 2 /95% O 2 ). The slices were visualized using an upright microscope (Nikon E600FN) equipped with infrared oblique illumination. Pyramidal neurons in the CA1 area were visually identified and patched using a glass pipette (Sutter Instrument Co., Novato, CA) with tip resistance of MΩ. To record evoked AMPAR currents, 40 μm bicuculline and 100 μm DL-APV were added to the ACSF to isolate AMPAR component. Additionally, μm 2-chloride adenosine was added to prevent polysynaptic responses. Internal solution containing 200 μm spermine was used for 68
79 rectification measurements. A double barrel glass electrode filled with ACSF was used to stimulate the Schaffer collaterals. The distance between stimulation and recording electrodes were kept at µm. For measuring AMPAR rectification, I-V curve was generated by holding the membrane potential at -60, -40, -20, 0, +20 and +40 mv. Only cells with input resistance 100 MΩ and less than 25% change in series resistance (ranged from MΩ) were analyzed. Reversal potential (V rev ) of each cell was calculated by fitting a linear regression line for the currents measured at -60, -40, -20, and 0 mv. Cells with V rev 15 mv were excluded from analysis. Subsection 4. Postsynaptic density (PSD) preparation The PSD was prepared according to the procedure described previously (Goel et al., 2006). In brief, hippocampi were quickly dissected and homogenized in ice-cold HEPESbuffered sucrose [0.32 M sucrose, 4 mm HEPES (ph 7.4) containing 2 mm EGTA, 50 mm NaF, 10 mm sodium pyrophosphate, 1 mm sodium orthovanadate, 1 μm okadaic acid (Calbiochem), and protease inhibitors (Protease Inhibitor Cocktail, Pierce)] using glass-teflon tissue homogenizers (Pyrex). The homogenates were centrifuged at 800 g for 10 min (4 C) to remove the nuclear pellets (P1), and the remaining supernatants (S1) were centrifuged at 10,000 g for 15 min (4 C) to yield the crude membrane pellets (P2). P2 fractions were resuspended in HEPES-buffered sucrose and re-spun at 10,000 g for 15 min (4 C) to yield the washed crude membrane fractions (P2 ). P2 fractions were then lysed in ice-cold 4 mm HEPES (ph 7.4, with protease inhibitors) for at least 30 min before 20 min of centrifugation at 25,000 g to yield lysed synaptosomal membrane fractions (P3). P3 were subsequently resuspended in HEPES-buffered sucrose, and loaded on a discontinuous sucrose gradient (1.2 M, 1.0 M, and 0.8 M sucrose with 69
80 inhibitors) for 2 hours at at 150,000 g (4 C). Synaptic plasma membrane (SPM) fractions were collected between 1.0 M and 1.2 M sucrose. After dilution with 2.5 volumes of 4 mm HEPES with inhibitors, the SPM pellets were collected by centrifugation at 150,000 g for 30 min (4 C). The pellets were then resuspended in 0.5% Triton X-100, HEPES-EDTA solution (50 mm HEPES, 2 mm EDTA, ph 7.4) with protease inhibitors, and lysed for 15 min at 4 C. The lysed SPM were then centrifuged at 32,000 g for 20 min (4 C) to yield the postsynaptic density fraction (PSD). Subsection 5. Biotinylation of surface AMPAR Hippocampus slices (400 μm thick) lacking the CA3 area were prepared according to the methods listed above. After recovery, slices were transferred to ice-cold ACSF containing 2 mg/ml biotin (EZ-Link Sulfo-NHS-Biotin, Pierce) bubbled with 5% CO 2 /95% O 2 for 10 min. Then the slices were washed in tris-buffered saline (TBS: 50 mm Tris, 0.9% NaCl, ph 7.4) 1 min x 5 before homogenized in ice-cold 1% Triton X- 100 IPB (20 mm NaPO 4, 150 mm NaCl, 10 mm EDTA, 10 mm EGTA, 10 mm NaPPi, 50 mm NaF, and 1 mm NaVO 3, ph 7.4). The homogenates were centrifuged for 10 min at 14,000 x g, 4 C. Some of the supernatants were saved as inputs by adding gel sampling buffer and boiled for 5 min. The remaining supernatants were mixed with Neutravidin slurry (1:1 in 1% Triton X-100 IPB) and rotated for 2 hrs at 4 C. The neutravidin beads were isolated by brief centrifugation at 1,000 x g, and biotinylated surface proteins were eluded by boiling in gel sampling buffer for 5 min. 70
81 Subsection 6. Co-immunoprecipitation (CoIP) Hippocampus tissue (either whole hippocampi or hippocampal slices) were freshly collected and homogenized in ice-cold 1% Triton X-100 IPB with 1 μm okadaic acid and protease inhibitor cocktail (Pierce) using glass-teflon homogenizers. The homogenates were centrifuged at 10,000 x g for 10 min (4 C), and the supernatants were collected. 200 μg of the supernatants were rotated with 50 μl Protein A bead (Pierce; 1:1 diluted in 1% Triton X-100 IPB) for 1 hr at 4 C to preabsorb. Then the samples were moved to tubes containing either 2 μg of monoclonal GluR1 c-terminal antibody (Chemicon) or 3 μg of polyclonal GluR2/3 c-terminal antibody mixed with 50 μl Protein A beads (1:1 in 1% Triton X-100 IPB) for at least 3 hr or overnight at 4 C. Some of the samples were saved as inputs. The beads were spun down and gently washed 3 times with 1% Triton X-100 IPB and 1 time with IPB. Then the proteins were separated from the beads by adding gel sample buffer and boiled for 5 min. Subsection 7. Immunoblot analysis Samples prepared from PSD preparation, subcellular fractionation, CoIP, and surface biotinylation were loaded and run on 6% SDS-PAGE gels (4-15 μg/lane). The gels were then transferred onto the polyvinyl difluoride (PVDF) membranes, which were then incubated in blocking buffer (ph7.4 PBS containing 5% of bovine serine albumin and 0.1% Tween-20) for about 1 hr. Blots were incubated in specific primary antibodies for 1-2 hr at room temperature or overnight at 4 C, then washed in blocking buffer 4 x 5 min each, and incubated in corresponding secondary antibodies at room temperature for 1 hr. Enhanced chemifluorescence substrate (ECF, Amersham) was used to develop the blots after washing the membranes 4 times with blocking buffer. ECF blots were scanned using 71
82 a Versadoc 3000 TM gel imaging system (Biorad). Alternatively, ECLplex (GE Health) system was used, in which Cy3 and Cy5 conjugated secondary antibodies were used and the blots were scanned on a Typhoon Trio (GE Health). The digitized fluorescence signals were quantified. Section 3 Results Subsection 1. Subunit composition of synaptic AMPARs is altered in GluR1- S845A mutant mice The phosphorylation status of GluR1-S845 is associated with bidirectional synaptic plasticity (Lee et al., 2000; Lee et al., 2003), as well as experience-dependent homeostatic plasticity (Goel et al., 2006). One proposed mechanism is that phosphorylation of GluR1- S845 primes AMPARs for synaptic delivery (Oh et al., 2006; Seol et al., 2007), and dephosphorylation of S845 destabilizes synaptic AMPARs to promote endocytosis (Ehlers, 2000; Lee et al., 2003). To gain insight on how S845 phosphorylation may regulate synaptic AMPARs, postsynaptic density (PSD) fractions were purified from GluR1-S845A mutant (HM) mice and their wildtype (WT) littermates (Figure 1A). The synaptic levels of GluR1 and GluR2 subunits were quantified by immunoblot analysis. The success of purifying the PSD was noted by the enrichment of a PSD marker PSD-95 and a loss of a presynaptic marker synaptophysin in the PSD fraction (Figure 3.1A). GluR1 content in the PSD fraction appeared normal in the mutant mice (WT: 100 ± 10.52% of average WT, n = 12; HM: ± 16.99%, n = 11; Figure 3.1B). Surprisingly, the GluR2 level in the PSD was significantly elevated in the S845A mutants 72
83 (WT: 100 ± 11.53%, n = 12; HM: ± 29.07%, n = 11; p < 0.002, Student s t-test; Figure 3.1B) resulting in a significant reduction in the GluR1/GluR2 ratio (WT: 100 ± 9.53%, n = 12; HM: ± 8.33%, n = 11; p < 0.006, Student s t-test; Figure 3.1B). These data suggest that lacking the GluR1-S845 phosphorylation site increases the proportion of GluR2-containing AMPARs at synapses. The synaptic content of GluR2-containing AMPARs can lead to alterations in the currentvoltage (I-V) relationship of AMPAR-mediated synaptic responses such that GluR2- lacking AMPARs display inward rectifying current (Verdoorn et al., 1991; Bowie and Mayer, 1995; Swanson et al., 1997; Washburn et al., 1997). Consistent with previous studies, wildtype mice displayed a relatively linear I-V relationship (Figure 3.1C); however, GluR1-S845A mutants produced a supralinear I-V curve at positive holding potentials. The outward rectifying I-V curve was similar to that seen in wildtype cells when intracellular polyamines are washed out by using spermine-free (WT-Sp ) internal solution for recording (amplitude of outward current at +40 mv normalized to the current amplitude at -60 mv: WT = ± 3.86%, n = 7; HM = ± 4.08%, n = 8; WT-Sp = ± 12.95%, n = 4; ANOVA: F(2,15) = 6.194, p < 0.02; Fisher s PLSD posthoc: difference between WT and HM, p < 0.02, WT and WT-Sp, p < 0.01; Figure 3.1C). As a result, the calculated inward rectification index (I 60 mv /I +40 mv ) of GluR1-S845A mutants was significantly smaller than that of wildtypes, similar to the value obtained from wildtypes in spermine-free internal solution (WT = 1.93 ± 0.14, n = 7; HM = 1.44 ± 0.08, n = 7; WT-Sp = 1.37 ± 0.10, n = 4; ANOVA: F(2,15) = 7.177, p < 0.04; Figure 3.1D). This result is consistent with the interpretation that GluR1-S845A mutants lack functional GluR1 homomers. 73
84 To further confirm the change in subunit composition of functional AMPARs in the GluR1-S845A mutants, we compared the sensitivity of AMPAR-mediated synaptic transmission to exogenous application of philanthotoxin-433 (PhTX) (Figure 3.1E), which specifically blocks GluR2-lacking AMPARs. In wildtype mice, bath application of 3 µm PhTX in the presence of 100 µm D,L-APV caused a depression of AMPARmediated synaptic responses in the CA3 to CA1 pathway (79.09 ± 4.02% of baseline at 60 min post-phtx, n = 9; p < 0.002, paired t-test; Figure 3.1E). This result indicates that about 20% of the synaptic transmission is mediated by GluR2-lacking AMPARs, which presumably are GluR1 homomers (Wenthold et al., 1996). Interestingly, the PhTX sensitivity in wildtypes was only apparent using a paired-pulse stimulation (interstimulus interval (ISI) = 50 msec; Figure 3.1E), and not when using a single pulse stimulation ( ± 2.60% of baseline at 60 min post-phtx, n = 7; Figure 3.1F). In contrast, PhTX caused no depression in the GluR1-S845A mutant mice using the paired-pulse stimulation ( ± 2.72%, n = 8; Figure 3.1E) suggesting that a lack of detectable functional GluR1 homomers. These results suggest that lacking the GluR1-S845 site alters the subunit composition of functional AMPAR. Taken together with the data that the synaptic GluR1 content is not altered (Figure 3.1B), our data support an interpretation that the synaptic population of GluR1 homomers is replaced by GluR1/GluR2 heteromers 74
85 Figure 3.1. Change in synaptic AMPAR subunit composition in GluR1-S845A mutant mice. A. Sample blots showing successful isolation of the PSD fraction. Note enrichment of PSD-95 in the PSD fraction, but a loss of a presynaptic protein synaptophysin. For explanation of abbreviations, see Methods. B. Comparison of GluR1 and GluR2 levels in the PSD of GluR1-S845A HM and WT. Left, synaptic GluR1 from WT and S845A HM are comparable. Middle, S845A HM has more synaptic GluR2 than WT (***p < 0.002). Right, reduction in the synaptic GluR1/GluR2 ratio in HM (**p < 0.006). C. The I-V curve of AMPAR-mediated EPSCs. Left, superimposed curves of WT and GluR1-S845A HM. Note, recordings were done with intracellular spermine (200 µm). Right, WT recorded with internal solution lacking spermine (WT-Sp ). D. Left, inward rectification index (IR, I-60mV/I+40mV) of AMPAR-mediated synaptic current in CA1 neurons measured with sperminecontaining intracellular solution is significantly smaller in S845A HM (black bar) compared to WT (white bar). WT display comparable IR as that in S845A HM when using sperminefree internal solution (gray bar, WT- Sp ). *p < 0.01, Fisher s PLSD posthoc. Right, superimposed AMPAR-EPSC traces (taken at -60 mv and +40 mv). Scale bars: 20 pa and 20 ms. E. In the presence of 100 µm D,L- APV, 3 µm PhTX depresses synaptic AMPAR-mediated response in WT (open circles), but not in S845A HM (black circles). The graph plots the % of field potential (FP) normalized to the baseline. Right, superimposed traces taken during baseline and 1 hour post-phtx. Note paired-pulse stimulation with 50 msec ISI was used. The graph on the left side plots only the changes in the first pulse responses over time. The dashed traces were taken after adding 10 µm of NBQX at the end of the experiment. Scale bars: 1 mv and 5 ms. 75
86 Subsection 2. GluR1-S845A mutants have altered AMPAR subunit composition across the membrane surface To determine whether the changes in AMPAR subunit composition are restricted to synaptic locations, AMPARs were quantified from the total surface proteins isolated by steady-state surface biotinylation of hippocampal slices (Figure 3.2A). Similar to what we observed in isolated PSDs, GluR1-S845A mutants expressed normal surface GluR1 levels (WT, ± 7.80% of total GluR1, n = 7; HM, ± 7.67% of total GluR1, n = 7; Figure 3.2B), but significantly increased surface GluR2 levels (WT, ± 4.23% of total GluR2, n = 7; HM, ± 9.85% of total GluR2, n = 7; p < 0.004, Student s t-test; Figure 3.2B). This resulted in a 2.5 fold reduction in the GluR1/GluR2 ratio at the plasma membrane (WT: 2.50 ± 0.38, n = 7; HM: 0.96 ± 0.18, n = 7; p < 0.007, Student s t-test; Figure 3.2B). However, the change in the GluR1/GluR2 ratio was restricted to the plasma membrane population, because there was no significant difference in GluR1, GluR2, or the GluR1/GluR2 ratio in the total homogenate fraction between GluR1-S845A mutants and wildtypes (Figure 3.2C). These results suggest that mutation of the S845 site globally alters the GluR1/GluR2 ratio across the plasma membrane. 76
, supernatant (S), and biotinylated surface proteins (Biotin) were loaded on the same gel for quantification.")
87 Figure 3.2. Increased surface GluR2 levels in GluR1-S845A mutants. A. Sample blots of biotinylation results. Total (input, I), supernatant (S), and biotinylated surface proteins (Biotin) were loaded on the same gel for quantification. Specificity of surface labeling is shown by the lack of actin in the biotin lanes. B. Left, the surface GluR1 expression is normal in the GluR1-S845A HM. Middle, the mutant mice have significantly increased surface GluR2 levels. Right, the mutant mice display a significant reduction in the surface GluR1/GluR2 ratio. **p < 0.004, *p < 0.007, Student s t-test. C. GluR1 (left), GluR2 (middle), and GluR1/GluR2 ratio (right) in the total homogenate of WT and HM are comparable. Subsection 3. More GluR1/GluR2 heteromers in the GluR1-S845A mutant mouse To directly verify that there is a change in the population of GluR1/GluR2 heteromers in GluR1-S845A mutants, co-immunoprecipitation (CoIP) between GluR1 and GluR2 subunits was performed using a GluR1 c-terminal specific antibody (Figure 3.3A). Nonsaturating conditions, verified by having a detectable GluR1 band in the unbound supernatant fraction, were used to pull-down equivalent amounts of GluR1 from each sample. Quantification of the amount of GluR2 co-immunoprecipitated by the GluR1 antibody allows estimation of the fraction of GluR1 forming heteromeric complexes with GluR2 in each sample. In the antibody-bound fraction, there was a trend of an increase in the amount of GluR2 subunit in the mutants (WT: 100 ± 9.70%, n = 12; HM: ± 77
.")
88 13.98%, n = 12; p = 0.13, Student s t-test; Figure 3.3B), while the GluR1 levels were comparable (WT: 100 ± 7.47%, n = 12; HM: ± 8.07%, n = 12; Figure 3.3B). This resulted in a significant increase in the GluR2/GluR1 ratio (WT = 100 ± %; HM = ± %; p < 0.03, Student s t-test; Figure 3.3B). These results suggest that more GluR2 subunits form complexes with GluR1 in the GluR1-S845A mutants, which is consistent with an interpretation that there is an increase in GluR1/GluR2 heteromers. Figure 3.3. More GluR2 is associated with GluR1 in GluR1-S845A mutants. A. Validation of the non-saturating GluR1 coimmunoprecipitation protocol. Immunoprecipitation (IP) using GluR1 c- terminal (c-t) specific antibody pulled down GluR1 (top) and associated GluR2 (middle). Non-saturating IP condition can be seen by the detection of GluR1 in the supernatant. No NR1 is detected in the IP lane (bottom). B. GluR1 pulled down by GluR1 c-terminal antibody in WT and S845A HM are comparable (left). GluR1-S845A HM shows a trend of having more GluR2 subunit associated with GluR1 than the WT (middle), which leads to a significantly larger GluR2/GluR1 ratio in the HM (right). *p < 0.03, Student s t-test. Subsection 4. GluR1-S845A mutants have less GluR1 homomers GluR1 homomers make up a small fraction of total AMPARs in the hippocampus (Wenthold et al., 1996), however, they play an important role in both basal synaptic transmission and synaptic plasticity due to their high single channel conductance and Ca 2+ permeability (Hollmann et al., 1991; Swanson et al., 1997; Guire et al., 2008). Our results suggest that alteration in synaptic AMPAR subunit composition in the S845A 78
89 mutant mouse is likely due to a replacement of GluR1 homomers with GluR1/GluR2 heteromers. To determine whether there is a cell-wide loss of GluR1 homomers in the mutants, we by performed immunoprecipitation using GluR2/3 c-terminal antibody and quantified the remaining GluR1 in the unbound fraction to assess the level of GluR1 homomers (Figure 3.4A). Under our experimental conditions, less than 3% of total GluR2/3 subunits remained in the unbound fraction (data not shown) suggesting that the unbound GluR1 represents mostly Ca 2+ -permeable GluR1 homomers. Our calculations indicate that in wildtypes about 17% of GluR1 exist as homomers (GluR1 left in supernatant: ± 4.18 % of total GluR1, n = 4), which is similar to the level reported previously (Wenthold et al., 1996). Consistent with our prediction, GluR1-S845A mutants had significantly less unbound GluR1 than the wildtype littermates (WT: 100 ±12.82%, n = 10; HM: ± 5.32%, n = 10; p < , Student s t-test; Figure 3.4B), and had about two times more GluR1 associated with GluR2/3 (WT: 100 ± 10.72%, n = 10; HM: ± 25.05%, n = 10; p < 0.005, Student s t-test; Figure 3.4B). Taken together, these results suggest that lacking the GluR1-S845 site causes a cell-wide reduction in GluR1 homomers and an increase in GluR1/GluR2 complexes. 79
.")
90 Figure 3.4. A reduction of GluR1 homomers in GluR1-S845A mutants. A. Validation of the saturated GluR2/3 coimmunoprecipitation protocol. Almost all GluR2/3 subunits are pulled down by IP using GluR2/3 c-terminal antibody,as seen from an absence of GluR2/3 signal in the supernatant lane (top). The GluR1 subunits left in the supernatant are presumably the ones that form GluR1 homomers (middle). No NR1 in the co- IP fraction (bottom). B. Left, significantly less unbound GluR1 in the GluR1-S845A HM compared to WT (**p < ). Middle, more GluR1 subunits co-ip with the GluR2/3 antibody in HM (*p < 0.005). Right, the amount of GluR2/3 pulled down by GluR2/3 antibody is not different between WT and HM. Subsection 5. Inhibiting lysosomal activity restores the functional GluR1 homomer in the GluR1-S845A mutants Dephosphorylation of the GluR1-S845 site correlates with activity-induced endocytosis of surface AMPARs (Ehlers, 2000; Lee et al., 2003). These internalized AMPARs are either recycled back to the surface after rephosphorylation at the S845 site or targeted to late endosomes and degraded by lysosomes (Ehlers, 2000). To test whether the loss of synaptic GluR1 homomers in GluR1-S845A mutants is due to degradation by lysosomes, we incubated hippocampal slices of mutant mice with 50 µm leupeptin (a lysosomal protease inhibitor) for at least two hours before testing the sensitivity of AMPARmediated synaptic transmission to PhTX. We found that leupeptin treatment restored AMPAR sensitivity to PhTX in the S845A mutants to a similar level as wildtypes, while 10 µm MG-132 (a proteasome inhibitor) did not (HM without drugs, ± 6.32% of 80
91 baseline 60 min after adding PhTX, n = 8; HM treated with leupeptin, ± 2.98% of baseline 60 min after adding PhTX, n = 7; HM treated with MG-132, ± 5.77% of baseline 60 min after adding PhTX, n = 7; one-way ANOVA: F(2,19) = 4.56, p < 0.03, Fisher s PLSD posthoc test, p < between control and leupeptin group; Figure 3.5A). These results suggest that the GluR1 homomer formation and surface delivery still occur in the GluR1-S845A mutant mouse. However, as these homomers lack S845 phosphorylation, they are perhaps rapidly endocytosed and further degraded by lysosomes. Leupeptin did not significantly alter the PhTX sensitivity of AMPARmediated synaptic transmission in the wildtype mouse (WT: ± 2.03 % of baseline, n = 6; WT with Leu: ± 3.17 % of baseline, n = 7; Figure 3.5B) indicating that functional GluR1 homomers in wildtypes are quite stable under basal conditions. Figure 3.5. Inhibiting lysosomal degradation recovers functional GluR1 homomers in GluR1-S845A mutants. PhTX sensitivity of GluR1-S845A HM was tested by recording field potentials at the CA3 to CA1 pathway in the presence of 100 µm D,L-APV with or without 10 µm MG-132 or 50 µm leupeptin (Leu). The acute hippocampal slices were preincubated in either regular extracellular solution or extracellular solution with MG-132 or Leu for at least 1 hr before recording. 3 µm PhTX was added to the recording chamber to test PhTXsensitivity. Note paired-pulse stimulation (ISI = 50 msec) was used for all the recordings. A. In GluR1-S845A HM, preincubation with Leu reveals PhTX sensitivity (black circles), but not preincubation with MG-132 (gray circles). B. Leu treatment in wildtype slices does not enhance PhTX sensitivity of AMPAR responses. Top panels, superimposed representative traces taken before and 1 hour after PhTX, as well as addition of NBQX at the end of the experiment (dotted trace). Scale bars: 0.5 mv and 10 ms. 81
92 Subsection 6. Loss of GluR1 homomers at synapses following chemical longterm depression (chemltd) In GluR1-S845A mutants, there is a loss of functional GluR1 homomers. However, it is unclear whether this also occurs in wildtypes under conditions when the GluR1-S845 site is acutely dephosphorylated. To determine this, we pharmacologically dephosphorylated the GluR1-S845 site by inducing chemltd (Kameyama et al., 1998; Lee et al., 1998) in wildtype hippocampal slices. ChemLTD was induced by incubating hippocampal slices with 20 µm NMDA for 3 min, which causes a rapid and prolonged dephosphorylation at the GluR1-S845 site (Lee et al., 1998). Here we extended this finding to show that the dephosphorylation of GluR1-S845 can last as long as 2 hours after chemltd induction (ctl = 100 ± 4.77 %, n = 8; 1 h = ± 5.00 %, n = 8; 2 h = ± 7.16 %, n = 8; ANOVA: F(2,14) =, p < 0.001; Figure 3.6A). PhTX sensitivity of the AMPAR-mediated synaptic transmission was measured in the presence of 100 µm D,L-APV at 80 min after inducing chemltd. Similar to the results from GluR1-S845A mutants, acute dephosphorylation of GluR1-S845 in wildtypes by chemltd abolished PhTX sensitivity of AMPARs (No PhTX, ± 6.24% of baseline renormalized to 20 min average immediately prior to PhTX application, n = 8; With PhTX, ± 5.48 % of renormalized baseline, n = 7, 1 hr post-phtx; Figure 3.6D). This result suggests that acute dephosphorylation of S845 can remove functional GluR1 homomers. The change in synaptic AMPAR subunit composition was further verified by comparing the I-V curve of AMPAR-EPSCs in control and chemltd-induced slices (Figure 3.7). The measurements were done between 1 2 hours after chemltd induction when the synaptic transmission was re-stabilized (Figure 3.6C) and the GluR1-S845 remained 82
93 dephosphorylated (Figure 3.6A). In slices expressing chemltd, AMPAR current displayed a supralinear I-V curve at positive holding potentials compared to linear I-V seen in control slices (Figure 3.6E). The relatively larger outward current in chemltd slices resulted in a significantly smaller inward rectification index than control slices (CTL, IR = 2.19 ± 0.21, n = 8; chemltd, IR = 1.40 ± 0.11, n = 7; p < 0.01, Student s t- test; Figure 3.7F). The average IR of chemltd slices was similar to that of the S845A mutant mouse (Figure 3.1D). 83
94 E F Figure 3.6. Loss of synaptic GluR1 homomers after chemltd in wildtype mice. A. ChemLTD induction causes a prolonged dephosphorylation of GluR1- S845. *p < 0.003, ANOVA. B. Representative traces taken at times indicated in C and D. Addition of NBQX at the end of the experiment completely blocked the responses. C. A brief application of 20 µm NMDA (3 min) produces a long-term depression of AMPAR-mediated synaptic transmission, and abolished PhTX sensitivity of AMPAR responses. Open circles, control chemltd chased by 100µM DL-APV, but without PhTX application. Black circles, chemltd chased by 100 µm DL- APV followed by 3 µm PhTX application. Scale bars: 0.5 mv and 10 ms. D. The last 60 min of synaptic responses in C are renormalized using the previous 20 min as baseline, which further verifies that the bath application of 3 µm PhTX in the presence of 100 µm DL- APV does not affect the synaptic strength following chemltd (black circles). E. Comparison of I-V curves of AMPAR- EPSCs from control (open circles) and chemltd-induced slices (black circles). F. The inward rectification (IR) index after inducing chemltd is significantly smaller than that of control slices (*p < 0.01). Right, superimposed AMPAR- EPSC traces measured at -60 mv and +40 mv from control and chemltd slices. Scale bars: 20 pa and 20 ms. 84
95 Subsection 7. Low frequency stimulation (LFS)-induced LTD is also associated with a loss of functional GluR1 homomers Similar to chemltd, low frequency stimulation (LFS)-induced LTD is also associated with a dephosphorylation of GluR1-S845 (Lee et al., 2000). This suggests a possibility that LFS-LTD may also accompany a loss of functional GluR1 homomers. To test this, we performed a two-pathway experiment in hippocampal slices obtained from wildtype mice. We isolated two independent inputs, as determined by a lack of cross-pathway facilitation (Figure 3.7D) that converge onto the same population of CA1 neurons (Figure 3.7A). After a stable baseline in both pathways, LFS (1 Hz, 15 min) was delivered to one pathway to induce LTD (LTD pathway). Stimulation in the other pathway (control pathway) was turned off for the duration of LFS. After LFS, stimulation was resumed in both pathways, and 100 µm APV was added to block NMDA receptors. Once responses in both pathways were stabilized, 100 µm spermine was bath applied to block GluR2 lacking AMPARs. We found that spermine produces less depression in the LTD pathway when compared to the control pathway (CTL: 83.7 ± 2.0% of renormalized baseline measured 40 min after the onset of spermine application, LTD: 91.6 ± 2.9%; n = 9, paired t-test: p < 0.005; Figure 3.7B). We verified that in the absence of spermine, both control and LTD pathways are quite stable over the same period of time (CTL: ± 3.7% of renormalized baseline, LTD: 97.7 ± 1.5%; n = 5, paired t-test: p > 0.4: Figure 3.7C). 85
96 Figure 3.7. LFS-induced LTD removes functional GluR1 homomers. A. The configuration of two pathway recording. B. Simultaneous recording of slices receiving baseline stimulation (CTL, open circles) and LFS (LTD, closed circles, n=9). When the synaptic strength was restablized after LFS, 100 µm spermine was bath applied. The last 60 min recording was renormalized using the initial 20 min as baseline and field potential at the end was plotted as a pair in the right panel, further showing the different levels of depression caused by spermine in the control versus the LTD pathway (*p < 0.004, t-test). C. The two pathway recording can be pretty stable for the same duration as (B) in both pathways (n = 5). E. Top panel, the configuration of the two pathways LFSinduced LTD field potential recording. Lower two panels, representative traces from two pathways of a single recording. The independence of the two pathways was confirmed by not seeing crosspathway facilitation when two stimulations with 50 ms interval delivered to the two pathways. Section 4. Discussion One way to regulate glutamatergic synaptic strength is by changing the properties of synaptic AMPARs, which can be achieved by subunit phosphorylation or alteration in subunit composition (Lee, 2006b; Isaac et al., 2007; McConlogue et al., 2007). Here we report that GluR1-S845 phosphorylation plays a critical role in regulating the subunit composition of functional AMPARs. This is in line with our previous study showing a correlated increase in GluR1-S845 phosphorylation with the appearance of synaptic 86
97 GluR1 homomers (Goel et al., 2006). The phosphorylation status of GluR1-S845 can be adjusted by neural activity both in vivo (Goel et al., 2006; Vyazovskiy et al., 2008) and in vitro (Lee et al., 1998; Lee et al., 2000), as well as by activation of neuromodulators linked to PKA (Chao et al., 2002; Vanhoose and Winder, 2003; Gao et al., 2006; Seol et al., 2007). Furthermore, phosphorylation of GluR1-S845 has been reported to prime LTP induction (Oh et al., 2006; Seol et al., 2007). Collectively, these observations suggest that phosphorylation of the GluR1-S845 site can reflect changes in synaptic activity and/or behavioral state of the animal to affect synaptic plasticity mechanisms. Subsection 1: Functional GluR1 homomers require GluR1-S845 phosphorylation site By combining electrophysiological recordings and biochemical quantifications, here we demonstrated that the GluR1-S845 phosphorylation site is critical for functional AMPAR subunit composition. Specifically, we found that in the absence of the GluR1-S845 phosphorylation site, there is a higher proportion of GluR2-containing AMPARs (likely GluR1/GluR2 heteromers) at the PSD (Figure 1B) at the expense of GluR2-lacking AMPARs (likely GluR1 homomers). This is confirmed by a smaller inward rectification index (Figure 3.1D) and a loss of sensitivity to PhTX of AMPAR-mediated synaptic currents in the GluR1-S845A mutant mouse (Figure 3.1E). In our hands, bath application of PhTX caused about 20% depression of synaptic transmission in the wildtype mouse hippocampus (Figure 3.1E and 3.5B), indicating that there is a population of GluR1 homomers present at the surface, very likely at synapses. A recent study estimates that adding about 2% of Ca 2+ -permeable AMPA receptors at synapses may cause a 30-40% increase in synaptic transmission due to their high single channel conductance (Guire et 87
98 al., 2008). This suggests that the number of GluR1 homomers present basally at synapses is likely quite small. However, there are many reports showing that the basal synaptic transmission in the hippocampus is not sensitive to PhTX (Adesnik and Nicoll, 2007; Gray et al., 2007; Guire et al., 2008; Plant et al., 2006). The likely explanation for the discrepancy is that other studies have used single pulse stimulation and voltage clamp to examine PhTX-sensitivity. We found that PhTX-sensitivity is only revealed using pairedpulse stimulation (Figure 3.1E and 3.5B), but not when using single pulse stimulation (Supplementary Figure 3.1). This may reflect the voltage-dependence of PhTX block (Bowie and Mayer, 1995; Kamboj et al., 1995; Verdoorn et al., 1991), which occurs at more positive membrane potentials. An alternative explanation is that paired-pulse stimulation may recruit perisynaptic AMPARs due to spill-over of glutamate released by two consecutive pulses (Mainen et al., 1998). If the paired-pulse stimulation results in sufficient glutamate spill-over, the synaptic depression by PhTX may be simply reflect activation of perisynaptic GluR1 homomers. While the concentration of spilled-over glutamate is likely too low to activate perisynaptic AMPARs, we cannot rule out this possibility and will require additional experiments to clarify this issue. Another possible explanation for the discrepancy may be the age of the animals used, as it is reported that there is an age-dependence to the appearance of GluR1 homomers following LTP induction (Lu et al., 2007). Additionally, PhTX blockade of synaptic transmission may be sensitive to experimental conditions as seen from conflicting reports on the presence of GluR1 homomers following LTP even when using similar aged animals (Adesnik and Nicoll, 2007; Gray et al., 2007; Lu et al., 2007; Plant et al., 2006). Furthermore, synaptic expression of Ca 2+ -permeable AMPARs may be regulated by the basal synaptic activity 88
99 of the neurons, in such a way that neurons with lower synaptic activity express more Ca 2+ -permeable AMPARs (Goel et al., 2006; Ju et al., 2004; Thiagarajan et al., 2005). Our result suggesting a role for S845 phosphorylation in regulating the levels of Ca 2+ - permeable AMPARs would further imply that endogenous levels of neuromodulators linked to PKA or basal PKA activity may dictate the observance of synaptic Ca 2+ - permeable AMPARs. Subsection 2: Lack of GluR1-S845 phosphorylation alters functional AMPAR subunit composition by selective degradation of GluR1 homomers The change in AMPAR subunit composition in GluR1-S845A mutants was not restricted to synaptic sites, but was observed across the surface membrane (Figure 3.2), and was detected cell-wide (Figure 3.3 and 3.4). Interestingly, the GluR1 homomers could be functionally detected in the mutants when lysosomal protein degradation was blocked by leupeptin (Figure 3.5A). Our data is consistent with an interpretation that the loss of GluR1 homomers is not at the level that controls their formation, but at the level that regulates their retention at the plasma membrane, including synaptic sites. Our results also suggest that the surface delivery of GluR1 homomers can occur independently of S845 phosphorylation, but retention requires it. GluR1 homomers not phosphorylated at the S845 site may be unstable and undergo fast endocytosis (Lee et al., 2000; Lee et al., 2003; Lee, 2006b; Man et al., 2007), perhaps due to its Ca 2+ permeability (Biou et al., 2008). Our data suggest that phosphorylation of the S845 site may protect the internalized GluR1 homomers from lysosomal degradation, perhaps by promoting recycling back to the synapse (Ehlers, 2000). The leupeptin effect was specific to the GluR1-S845A mutants and did not further increase the PhTX sensitivity of AMPAR synaptic 89
100 transmission in wildtypes (Figure 3.5B). This suggests that the synaptic GluR1 homomers may be fully phosphorylated on the S845 site, likely due to a tight association of PKA to synaptic GluR1 via SAP97-AKAP complexes (Colledge et al., 2000; Smith et al., 2006). The phosphorylation of S845 may act to stabilize GluR1 homomers at synapses (Lee et al., 2003; Lee, 2006b; Man et al., 2007) or help sort the internalized receptors to the recycling pathway (Ehlers, 2000; Lin et al., 2000). Interestingly, GluR1 homomers seem to be the only population of GluR1-containing AMPARs that is affected by lacking phosphorylation of the S845 site, as the GluR1/GluR2 heteromers are expressed at synapses, likely at increased levels as deduced from the equivalent GluR1 expression at the PSD of mutants and wildtypes (Figure 3.1). One explanation is that the GluR2-containing AMPARs are more stable at the synapses as it is impermeable to Ca 2+ (Biou et al., 2008) and its interaction with NSF (Luscher et al., 1999; Lee et al., 2002). Alternatively, the trafficking pattern of the heteromeric GluR1-S845A/GluR2 AMPAR may be dominated by the GluR2 subunit allowing them to recycle back to the synapses in a constitutive manner (Lee et al., 2004). Subsection 3: LTD is associated with a reduction in the level of functional GluR1 homomers Our results from the GluR1-S845A mouse support the role of GluR1-S845 phosphorylation in regulating the functional AMPAR subunit composition. We further provide evidence that this type of regulation happens in wildtype hippocampal slices during LTD. Both chemltd and LFS-LTD cause acute dephosphorylation of the GluR1- S845 site (Lee et al., 2000; Lee et al., 1998). We now report that the induction of these two forms of LTD reduces the level of functional GluR1 homomers. 90
101 ChemLTD induction by brief bath application of NMDA produces a persistent dephosphorylation of the GluR1-S845 site (Lee et al., 1998), which we now verify that it lasts up to 2 hours (Figure 3.6A). The induction of chemltd abolished the PhTX sensitivity of AMPAR synaptic transmission (Figure 3.6C, D), which suggests that an acute dephosphorylation of the GluR1-S845 site removes homomeric GluR1 from the surface including synapse and hence changes the synaptic AMPAR subunit composition. This alteration is further verified by a relatively larger outward current through synaptic AMPARs in the chemltd-induced slices, which is measured as a decrease in the inward rectification index (Figure 3.6E, F). Slices that express chemltd displayed comparable AMPAR I-V curve and inward rectification index as the GluR1-S845A mutants indicating that the dephosphorylation induced by chemltd is sufficient to remove most, if not all, synaptic GluR1 homomers. Interestingly, GluR1-S845A mutants do not express normal levels of chemltd (data not shown) suggesting that chemltd is partly expressed as a loss of synaptic GluR1 homomers. Similarly, LFS-LTD reduced spermine-sensitivity of AMPAR-mediated synaptic responses (Figure 3.7B), which suggests that it is expressed at least in part by the removal of functional GluR1 homomers. Because LFS-LTD is also associated with a dephosphorylation of GluR1-S845 (Lee et al., 2000), it further supports a role of GluR1- S845 dephosphorylation in affecting the stability of synaptic GluR1 homomers. Subsection 4: A working model for regulating synaptic AMPAR subunit composition by GluR1-S845 phosphorylation Based on our results, we propose the following model to describe the role of GluR1-S845 phosphorylation in regulating the subunit composition of synaptic AMPARs (Figure 3.8). 91
102 In the wildtype hippocampal CA1 pyramidal neurons, the synaptic AMPARs undergo endocytosis and are either recycled back to the surface or targeted to lysosomes for degradation determined by whether the GluR1-S845 site is phosphorylated. Under the basal condition, most of the internalized GluR1 homomers may enter the recycling pathway, perhaps due to the high levels of S845 phosphorylation. Dephosphorylation of the GluR1-S845 site (as occurs in LTD) prevents the internalized GluR1 homomers from recycling back to the synapse by promoting targeting to the lysosome. In the GluR1- S845A mutant mouse, the synaptic localization and endocytosis of GluR1 homomers may still occur. However, as the GluR1-S845 site cannot be phosphorylated, the internalized GluR1 homomers are sorted to late endosomes and further degraded by lysosomes. Even though there are new GluR1 homomers inserted into the synapses, the rate of exocytosis may be slower than the rate of endocytosis due to the lack of S845 phosphorylation and, possibly, also Ca 2+ permeability. Overall, the outcome of lacking S845 phosphorylation is a loss of synaptic GluR1 homomers, hence a change in the synaptic AMPAR subunit composition. 92
103 Figure 3.8. Proposed model for the function of GluR1 S845 phosphorylation in regulating synaptic AMPAR subunit composition. A. In wildtypes, S845 phosphorylation is required for stabilization of synaptic GluR1 homomers and/or recycling of the internalized receptors back to the synapses. The internalized GluR1 homomers are degraded by lysosomes if the GluR1-S845 site is not re-phosophorylated. B. In the S845A mutant mouse, the GluR1-homomers can be inserted into synapses (dotted line). However, without phosphorylation at the S845 site, these receptors are not stable, hence rapidly internalized and targeted to lysosomes for degradation. Section 5 Conclusion We provide evidence that the GluR1-S845 phosphorylation site is crucial in regulating the subunit composition of functional AMPARs. We found that GluR1 homomers lacking S845 phosphorylation, as in the GluR1-S845A mutants, are rapidly internalized and further degraded by lysosomes, hence altering the GluR1/GluR2 ratio of functional AMPARs. Furthermore, acute dephosphorylation of the GluR1-S845 site, as occurs during LTD, is also able to alter the AMPAR subunit composition by removing functional GluR1 homomers. Taken together, we conclude that the phosphorylation of 93
104 GluR1-S845 is an important signaling event that regulates the subunit composition of functional AMPARs. Section 6. Supplementary data Supplementary Figure 3.1. Single pulse stimulation fails to reveal PhTX-sensitivity of AMPAR responses in wildtype hippocampal slices. Single pulse stimulation was given once every 30 sec. Application of 3 µm PhTX in the presence of 100 µm DL-APV does not reduce AMPARmediated responses (left). Right, superimposed traces taken before and after PhTX application (black traces). Application of NBQX at the end of the experiment completely blocked the response (gray trace). Scale bars: 0.5 mv, 10 msec. Supplemenary Figure 3.2. Top panel, the configuration of the two pathway LFS-induced LTD field potential recording. Lower two panels, representative traces from two pathways of a single recording. The independence of the two pathways was confirmed by not seeing cross-pathway facilitation when two stimulations with 50 ms interval delivered to the two pathways. 94
105 Chapter 4: GluR1-S845 dephosphoryaltion is required for chemltd induced synaptic plasticity but not spine morphological plasticity My contribution: All electrophysiological and imaging experiments and most the biochemical experiments. Lihua Song helped with some of the immunoblots.. Section 1 Introduction Dendritic spines are specialized neuronal structures that host most of the excitatory synapses. They are small protrusions composed of a head and a neck, and distribute along the dendrites. The spine structures, such as the spine length, head volume, and the neck diameter, as well as the spine density, are very plastic that can be regulated by many events. For example, there is evidence showing that the spine density and the spine turnover rate are altered during development (Alvarez and Sabatini, 2007). Sensory experiences and learning are also found to modulate the density and morphology of spines (Nimchinsky et al., 2002; Alvarez and Sabatini, 2007; Harms and Dunaevsky, 2007). Therefore, structural plasticity of spines is thought of as an important cellular mechanism, in addition to long-term functional plasticity of synaptic transmission, for learning and memory (Yuste and Bonhoeffer, 2001; Muller et al., 2002; Nikonenko et al., 2002; Nimchinsky et al., 2002; Alvarez and Sabatini, 2007). It has been shown for a decade now that long-term potentiation (LTP) of synaptic strength is associated with either increase in spine density (Engert and Bonhoeffer, 1999; Maletic-Savatic et al., 1999; Nagerl et al., 2004) or enlargement of spine head volume (Matsuzaki et al., 2004; Zhou et al., 2004; Kopec et al., 2006; Harvey and Svoboda, 2007; Tanaka et al., 2008). In contrast to LTP, low-frequency stimulation (LFS)-induced 95
106 long-term depression (LTD) has been demonstrated to correlate with rapid spine head shrinkage (Zhou et al., 2004; Wang et al., 2007) or loss of spines (Nagerl et al., 2004). In addition, a recent study demonstrated that LFS-LTD is associated with retraction of presynaptic boutons leading to loss of synapses (Bastrikova et al., 2008; Becker et al., 2008). The changes in spine morphology and synaptic strength seem to happen simultaneously after synaptic stimulation, implicating that the signaling cascades for these two events might overlap. However, it is still unclear whether this is the case, and if so to what extent the two signaling pathways overlap with each other. There is evidence suggesting a disconnection between the functional and structural changes during LTD. For example, even though both spine shrinkage and synaptic depression after LFS depend on the activation of NMDARs and calcineurin, it is only the synaptic depression that requires the activity of PP1/PP2A (Zhu et al., 2000). On the other hand, inhibiting global actin depolymerization prevents both spine shrinkage and synaptic depression, but specific interference of cofilin-targeted actin depolymerization only affects spine shrinkage (Wang et al., 2007). To further investigate the relationship between long-term synaptic plasticity and spine structural plasticity, we studied spine morphological changes after chemical LTD (chemltd) induction. ChemLTD shares similar induction and expression mechanisms as LFS-LTD (Lee et al., 1998; Lee et al., 2000). The advantage of using chemltd over the conventional electrical stimulation-induced LFS-LTD is that in principle, most synapses will be depressed by the chemical stimulation. Therefore, it maximizes the probability of detecting spine changes after LTD. Similar to what is reported for LFS-LTD, we found that chemltd induction causes long-term (up to 1 hour) spine head shrinkage without 96
107 changes in the spine density. To see whether the chemltd-induced functional synaptic depression is required to trigger structural plasticity of spines, we examined chemltdinduced spine changes in the GluR1-S845A mutant mice. These mice have a specific alanine mutation at the serine-845 residue of the GluR1 subunit of AMPA receptors, which prevents phosphorylation. Importantly, GluR1-S845A mutants lack LFS-LTD (unpublished data) and show severe impairment of chemltd. In order to observe spine structures, we crossed the GluR1-S845A mutants with a line of transgenic mice expressing yellow fluorescence protein (YFP) in a subset of neurons (YFP-2J line) to generate a S845A-2J line. Surprisingly, spine head shrinkage, comparable to that seen in wild type mice (WT-2J), was observed in the S845A-2J mice after chemltd induction. Our results suggest dissociation between the modulation of synaptic function and spine morphology. Interestingly, S845A-2J mice exhibit higher density of spines under basal conditions, which correlated with alterations in basal synaptic function. Unlike in wild types, S845A-2J mice display a significant spine loss 1 hour after chemltd. Section 2 Methods and Materials Subsection 1. Acute hippocampus slices preparation for electrophysiology and imaging Hippocampal slices were prepared from 3 to 4 week old WT-2J and S845A-2J mice following procedures described previously (Lee et al., 1998). Briefly, under deep anesthesia by halothane or isoflurane, mice were euthanized by decapitation, and their brains were removed quickly and transferred to the ice-cold dissection buffer containing the following (in mm): sucrose, 2.6 KCl, 1.23 NaH 2 PO 4, 26 NaHCO 3, 10 dextrose, 97
108 3 MgCl 2, and 1 CaCl 2 (bubbled with a mixture of 5% CO 2 and 95% O 2 ). A block of hippocampus was removed and sectioned by a vibratome into 400 µm thick slices for field potential recording and imaging and 300 µm thick slices for whole cell recording. The slices were recovered for 1 h at room temperature in artificial cerebrospinal fluid (ACSF) (in mm): 124 NaCl, 5 KCl, 1.25 NaH 2 PO 4, 26 NaHCO 3, 10 dextrose, 1.5 MgCl 2, and 2.5 CaCl 2 (bubbled with a mixture of 5% CO 2 and 95% O 2 ) before all other procedures. All procedures for animal use followed the NIH guidelines, and were approved by the University of Maryland College Park Institutional Animal Care and Use Committee (IACUC). Subsection 2. Field potential recording from Schaffer collateral synapses in CA1 area All recordings were done in a submersion-type recording chamber perfused with ACSF ( C, 2 ml/min). Synaptic responses were evoked by stimulating the Schaffer collaterals with 0.2 ms pulses delivered through either concentric bipolar stimulating electrodes (Frederick Haer Co., Bowdoinham, ME) or double-barreled glass electrodes (Sutter Instrument Co., Novato, CA) filled with ACSF, and recorded extracellularly in the CA1 stratum radiatum. Baseline responses were recorded using a half-maximal stimulation intensity at Hz. To induce chemltd, 20 μm NMDA was infused for 3 min after at least 20 min of stable baseline. 98
109 Subsection 3. Whole cell recording of AMPAR mediated mepscs and evoked AMPAR currents All mepsc recordings were done in a submersion recording chamber perfused with perfusion buffer, and all evoked AMPAR current recordings were done with modified ACSF (everything was the same as in the regular ACSF, except: 2.5 mm KCl, 4 mm MgCl 2, and 4 mm CaCl 2 ) ( C, 2 ml/min, bubbled with 5% CO 2 /95% O 2 ). The slices were visualized by an upright microscope (Nikon E600FN) equipped with infra-red (IR) oblique illumination. Pyramidal neurons in the CA1 area were visually identified and patched by a glass pipette with tip resistance of MΩ. For AMPAR mediated mepscs recording, the recording pipette was filled with internal solution A (120 mm CH 3 O 3 SCs, 5 mm MgCl 2, 8 mm NaCl, 10 mm EGTA, 10 mm HEPES, 1mM QX-314, 0.5 mm Na3GTP, and 2 mm Mg ATP, ph 7.25, mosm). In the perfusion buffer, 1 μm TTX, 20 μm bicuculline, and 100 μm DL-APV were added to isolate the mepscs mediated by AMPARs. The membrane potential was held at -70 mv for recording mepscs. The responses were recorded by an Axopatch amplifier (Axon instruments), and digitized at 10 KHz through a data acquisition board (National Instruments) and stored using Igor Pro software (WaveMetrics). Data were analyzed by MiniAnalysis Software (Synaptosoft) and the detecting threshold was set to be 3 times of the Root Mean Square (RMS) noise. mepscs with rise time larger than 3 ms were excluded as they may reflect dendritic filtering. Average mepscs amplitude and frequency were calculated across groups. To measure the I AMPAR /I NMDAR ratio, 20 μm bicuculline was added to the bath to isolate the excitatory synaptic transmission. Additionally, μm adenosine was added to prevent polysynaptic responses. Double- 99
110 barreled glass electrodes filled with ACSF (124 mm NaCl, 5 mm KCl, 1.25 mm NaH 2 PO 4, 26 mm NaHCO 3, 10 mm dextrose) was used as stimulation electrode to activate the Schaffer collateral pathway. The neurons were held at -60 mv to measure the I AMPAR, and +40 mv for the I NMDAR. Only cells with input resistance 100 MΩ and series resistance changed less than 10% during the whole recording were analyzed. The peak amplitude of the EPSC at -60 mv (EPSC -60mV ) was used as the I AMPAR. I NMDAR was measured as the amplitude of EPSC +40mV at three times the EPSC -60mV decay time constant (τ). 100 µm DL-APV was added at the end of some experiments to verify that the I NMDAR measurement was not contaminated by AMPAR component. Subsection 4. Laser scanning confocal microscopy of fixed tissues and image analysis After recovery from chemltd induction (all groups were kept in the incubation chamber for the same amount of time), acute hippocampus slices were placed in 4% paraformaldehyde at 4 C overnight and transferred to sterilized 30% sucrose (in PBS, ph 7.4) overnight before re-sectioning into 40 μm slices using a freezing microtome (Leica). The re-sectioned slices were collected in a cryoprotectant solution (20% sucrose, 30% ethylene glycol in ph 7.4 sodium phosphoate buffer) and kept at -20 C until use. Before imaging, slices were rinsed in PBS and mounted on glass slides (Plain selected precleaned microslides, VWR) and air dried in the dark. The slides were coverslipped with Prolong TM mounting solution (Molecular Probe), and sealed with a nail polish. Dendritic spines on secondary or tertiary proximal dendrites of CA1 pyramidal neurons were chosen, and imaged using a Zeiss LSM 510 confocal microscope with a 100x oil immersion objective lens (with a 1.44 numerical aperture). A 488 nm wavelength laser 100
111 was used to excite the YFP and 3D images with x/y/z resolution of 0.06/0.06/0.27 μm/pixel were digitized and recorded by the Zeiss LSM 510 software. The z-stacked images of dendritic spines were used to reconstruct a 3D image and analyzed using Volocity software (Improvision). Only dendritic protrusions with length 4 μm were counted as spines. The spine density was calculated as the number of spines per 10 μm dendritic segment. Subsection 5. Two-photon microcopy of dendritic spines in acute hippocampal slices After at least 1 h recovery, acute hippocampal slices were transferred to the imaging chamber perfused with ACSF. The whole experiment was performed at room temperature. Customer-built two-photon laser scanning microscopy (Dr. Patrick Kanold) was used to image the spines located on the secondary or tertiary dendrites of CA1 pyramidal neurons by a 40x lens (Zeiss, NA = 0.8). Z stack images were taken every 5 min during the 20-30min baseline and every 10 min after chemltd induction. The x/y/z resolution was either x x 0.3 or x x 0.3 µm/pixel. But the resolution of images within a single experiment was kept the same. Subsection 6. Images analysis All images were analyzed using the Volocity software (Improvision). The confocal images were analyzed mainly by manually selecting the spines using the lasso tool (tolerance of signal detection was kept to be 40%). The spines in the two-photon images were selected by the magic wand function within the Volocity software. The tolerance of signal detection varied among spines but was kept the same for each spine for all images 101
112 taken. The representative images shown are the 3D view of the stacked images. The spine head volume was calculated by the Volocity software using the voxel (volume pixel) information. Both spine density and spine head volume were averaged within group and compared between different groups. Section 3 Results Subsection 1. Chemical-induced LTD (chemltd) causes rapid shrinkage of the spine head, with no effect on the spine density of the hippocampus CA1 pyramidal neurons In the acute hippocampus slice, infusion of 20 μm NMDA for 3 min reliably produces a long-term depression of excitatory synaptic transmission on CA1 pyramidal neurons (Lee et al., 1998). This chemical-induced LTD (chemltd) is ideal for studying synaptic plasticity associated with spine morphological changes as compared to LFS-induced LTD, most synapses in a slice are likely to undergo LTD. This increases the probability of detecting the spine changes following LTD. To visualize the dendritic spines, transgenic mice expressing yellow fluorescence protein (YFP) in a subset of CA1 pyramidal neurons (YFP-2J line, Jackson Laboratory) was used. The chemltd elicited in the 3 weeks old YFP-2J mice was similar to the regular wildtypes and the data were averaged together (Figure 4.1B, ± 5.29 % of baseline at 80 min after baseline, n = 12). It is known that chemltd occludes LFS-LTD (Lee et al., 1998) suggesting that their underlying mechanisms overlap at least to some degree. Both spine shrinkage and loss of 102
113 spines have been observed following LFS-induced LTD (Nagerl et al., 2004; Zhou et al., 2004; Wang et al., 2007a). To understand the relationship between LTD and spine morphology changes, chemltd was induced in acute hippocampal slices prepared from the 3 to 4 week old YFP-2J mice. After recovering in normal ACSF for varied durations (0 min, 30 min, and 60 min), the slices were fixed and imaged using a confocal microscope (see detailed methods). We found that chemltd induction does not affect the spine density [Fig 4.1 D 1,D 2 ; CTL, 100 ± 1.99 % of CTL (14.22 ± 0.62 /10 µm segment of dendrite); 0 min after chemltd induction, ± 9.10 % (15.22 ± 1.06 /10 µm segment of dendrite); 30 min after chemltd induction, ± 9.72 % (13.55 ± 0.59 /10 µm segment of dendrite); 60 min after chemltd induction, ± 7.65 % (13.44 ± 0.68 /10 µm segment of dendrite)], but produces a rapid and persistent shrinkage of spine head volume [Fig 4.1 C 1,C 2 ; CTL, ± 5.01% of CTL (0.18 ± 0.01 µm 3 ), 578 spines from 15 dendritic segments, 3 mice; 0 min after chemltd induction, ± 5.30 % (0.14 ± 0.01 µm 3 ), 568 spines from 12 dendritic segments, 3 mice; 30 min after chemltd induction, ± 4.06 % (0.12 ± 0.01 µm 3 ), 636 spines from 18 dendritic segments, 3 mice; 60 min after chemltd induction, ± 3.60 % (0.13 ± 0.01 µm 3 ), 589 spines from 12 dendritic segments, 3 mice. Data normalized to the control from the same animal. ANOVA: F(3,59) = , P < 0.001]. The change in spine head volume is also revealed by a significant difference in the cumulative probability of spine head volume in chemltd groups compared to that in the control group (Fig 4.1 C 3 ; Kolmogorov-Smirnov test: p < 0.001) 103
114 Figure 4.1. ChemLTD induction is associated with a rapid and persistent shrinkage of spine head volume. (A) Two sets of representative spine images taken from control (CTL) and chemltd induced slices. ChemLTD induced slices were fixed at specified times as noted. Each picture is a projected three dimensional image obtained by reconstruction of sections taken at 0.27 µm z-axis intervals. (B) ChemLTD induced by 3 min infusion of 20 µm NMDA caused a long-lasting synaptic depression measured by extracellular field potential recording (p < using a two-tailed paired t-test comparing averages of 10 min baseline before chemltd and the last 10 min of recording). (C 1 ) The average spine head volume was immediately reduced after chemltd induction, which persisted up to 1 h post induction (*ANOVA: F(3,59) = , p < ). (C 2 ) Normalized spine head volume (to control spines from each mouse) shows about 30% reduction in the average spine head volume after chemltd induction (* ANOVA: F(3,59) = , p < ). (C 3 ) The cumulative probability curve of the spine head volume for the chemltd induced groups are all shifted to smaller values compared to the control curve (p < , Kolmogorov Smirnov test). (D 1 ) The density of spine was not significantly altered up to 1 hour post chemltd induction. (D 2 ) The normalized spine density (to control from each mouse) was not different among all four groups. 104
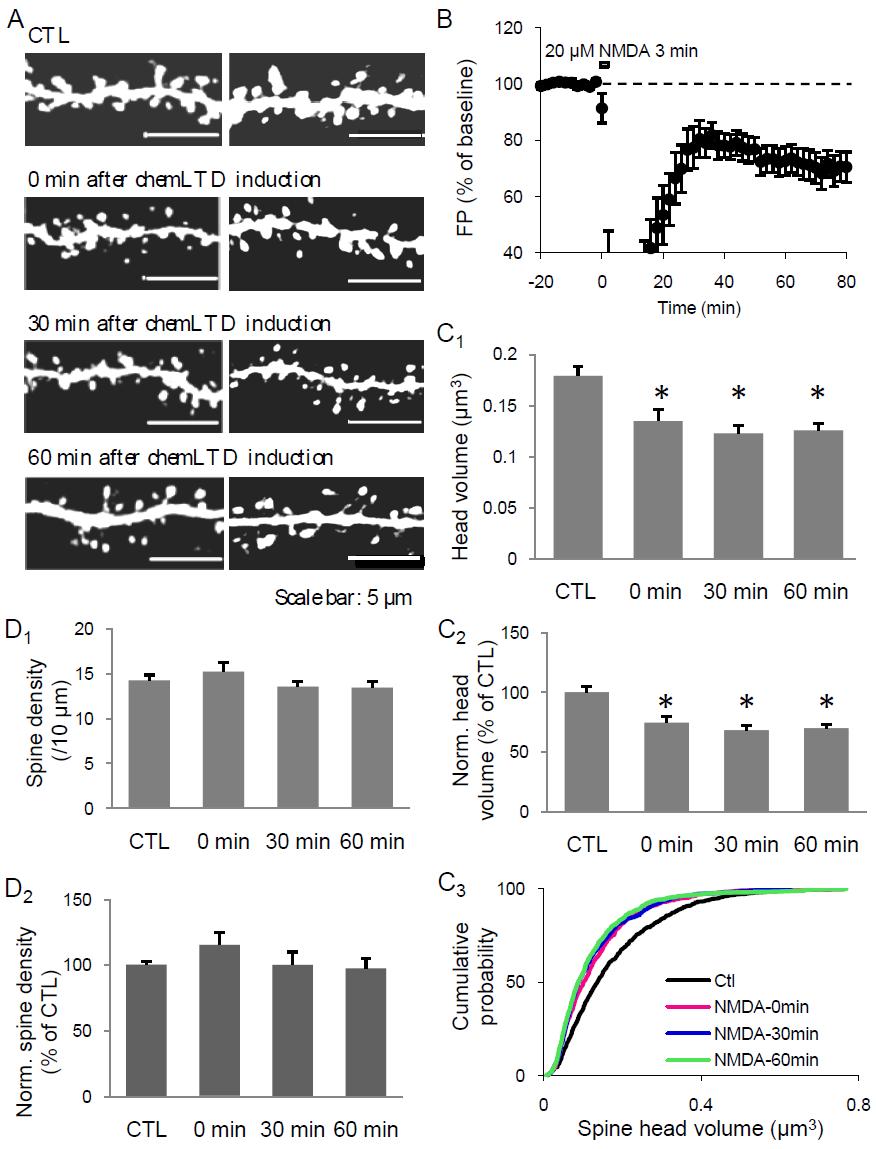
115 105 *
116 Subsection 2. Mice lacking GluR1-S845 phosphorylation have altered synaptic transmission and spine morphology After confirming that chemltd can cause long-term spine morphological changes along with the synaptic depression, we wanted to further test whether the spine changes and synaptic depression are mediated by independent pathways as it has been suggested before from studying the LFS-LTD (Zhou et al., 2004; Wang et al., 2007a). Specifically, we wanted to test the role of GluR1-S845 dephosphorylation in spine structural plasticity, as this site has been implicated in NMDAR-dependent LTD (Kameyama et al., 1998) and AMPAR endocytosis [my data in Chapter 3 and (Man et al., 2007)]. Because the levels of synaptic AMPAR is reported to correlate with spine size (Harris and Stevens, 1989; Baude et al., 1995; Nusser et al., 1998; Lendvai et al., 2000; Matsuzaki et al., 2001), we hypothesized that removing GluR1-S845 phosphorylation site would interfere with spine shrinkage following chemltd. To test this, we investigated the chemltd-induced spine structural plasticity in the S845A mutant mice. S845A mutant mice have no LFS-induced LTD (unpublished data) which may be due to two reasons: 1) destabilization of GluR1 homomers whose removal contributes greatly to the synaptic depression, and/or 2) a lack or a reduction in the internalization of synaptic GluR1/GluR2 heteromers triggered by GluR1-S845 dephosphorylation (see chapter 3 for data and discussion). In order to visualize the spine morphology in the S845A mutant mice, we crossed the S845A mutant with the YFP-2J transgenic to obtain mice with the GluR1-S845A mutation and the YFP transgene (S845-2J). The production of S845A-2J mice was confirmed by polymerase chain reactions (PCRs) using primers specific to GluR1-S845A mutation and the YFP transgene (data not shown), and further tested for protein expression using immunoblot 106
117 analysis (Fig. 4.2A). As shown in Fig. 4.2A, cross-breeding GluR1-S845A+/- mouse carrying a YFP transgene (hemizygote) led to the production of 4 different genotypes. First, we used the S845A-2J (mouse carrying homozygous GluR1-S845A knockin mutation and a YFP transgene) to compare the spine morphology under basal condition and compared to that of WT-2J (mouse carrying wildtype GluR1 gene and a YFP transgene) mice. Interestingly, S845A-2J mice exhibited a significant increase in the basal spine density in the CA1 pyramidal neurons compared to WT-2J mice (Fig 4.2B 1. WT-2J, ± 0.62 /10 µm, 578 spines from 15 dendritic segments, 3 mice; S845A-2J, ± 0.94 / 10µm, 1038 spines from 18 dendritic segments, 3 mice; P < Student s t-test). The average spine head volume (Fig 4.2B 3 top panel, WT-2J, 0.18 ± 0.01 µm 3 ; S845A-2J, 0.19 ± 0.01 µm 3 ) as well as the distribution of spine size when they were grouped into 3 categories according the spine head volume (small: < 0.3 µm 3 ; medium: 0.3 µm 3 and < 0.6 µm 3 ; large: 0.6 µm 3 ) were not affected (Fig 4.2B 3 lower panel. Small: WT-2J = ± 3.05 %, S845A-2J = ± 2.35 %; Medium: WT-2J = ± 3.00 %, S845A-2J = ± 2.02 %; Large: WT-2J = 1.23 ± 0.49 %, S845A-2J = 3.96 ± 0.97 %; two way ANOVA, P = 0.4). The increase in basal spine density implies that the S845A-2J mice may have altered basal synaptic transmission. To test this, the AMPAR-mediated miniature excitatory postsynaptic current (mepsc) was measured from both the S845A mutant (homozygote, HM) and wildtype (WT) mice. Consistent with the increase in synaptic AMPARs level (data in Chapter 3), the average mepsc amplitude was larger in the S845A mutants (Fig 4.2D 1, P < Kolmogorov Smirnov test; insert, WT, 9.43 ± 0.34 Hz, n = 10; HM, ± 0.64, n = 8; P < Student s t-test). However, the mepsc frequency, which 107
118 reflects either the presynaptic release property or the number of synapses, was not significantly different between the S845A mutant and wildtype mice (Fig 4.2D 2, WT, 0.83 ± 0.12 Hz, n = 10; HM, 0.77 ± 0.14, n = 8). The higher spine density in the S845A- 2J mice predicts an increase in the number of synapses as there is a one to one relationship between the spine and synapse (Nimchinsky et al., 2002; Alvarez and Sabatini, 2007). Thus, a lack of change in mepsc frequency may have been caused by a reduced presynaptic release probability, which could have masked the increase in synapse number, or a higher proportion of silent synapses, which would not be detected functionally, in the S845A-2J mice. We tested the first possibility by measuring the pairpulse facilitation (PPF) ratio. Delivering two consecutive pulses with a 50 ms interstimulus interval (ISI) is known to cause a larger synaptic response to the second stimulation, a phenomenon termed paired-pulse facilitation (PPF). It is known that when the presynaptic release probability is reduced, synaptic responses exhibit a larger PPF ratio (Manabe et al., 1993). We found no difference in the PPF ratio between the wildtype and S845A mutant (Fig 4.2F, WT, 1.84 ± 0.05 Hz, n = 14; HM, 1.84 ± 0.11, n = 14), indicating that there is no change in presynaptic release. Therefore, we tested whether the S845A mutation leads to a higher proportion of silent synapses, which are not activated by spontaneous glutamate release as they lack functional AMPARs. In line with this idea, we found similar AMPAR to NMDAR current ratio between the wildtype and S845A mutant (Fig 4.2E, WT, 3.37 ± 0.45 Hz, n = 12; HM, 2.82 ± 0.32, n = 11), which suggests the NMDAR response may be enhanced proportional to the increased AMPAR current. The strengthening of NMDAR synaptic transmission is further supported by the close to significant increase in the synaptic NR1, an obligatory subunit of NMDAR, levels in the 108
119 S845A mutant mice (Fig 4.2G 1, WT, 100 ± 4.21 %, n = 10; HM, ± 26.75, n = 11; P = 0.05 Student s t-test). This was not due to a general increase in NR1 synthesis, as there was no significant difference in the total expression level of NR1 between WT and S845A mutants (Fig 4.2G 2, WT, 100 ± 6.92 %, n = 8; HM, ± 11.67, n = 9). Our data are consistent with an interpretation that the S845A mutants have more synapses than WT, but these additional synapses likely lack functional AMPARs and are silent. Figure 4.2. Lack of S845 phosphorylation alters spine morphology and AMPAR-mediated synaptic transmission. (A) Generation of the S845A-2J mice. Representative immunoblots probed with phosphorylation site-specific antibody against GluR1-S845 (upper blot) and an antibody against GFP, which is known to cross-react with YFP (bottom blot). Hippocampal samples were obtained from offsprings of the cross between S845+/- and YFP transgenics. S845_WT/2J_WT: carrying wildtype GluR1 with S845 intact and not carrying YFP transgene. S845_WT/2J_Tg (WT-2J): carrying wildtype GluR1 and transgenic for YFP. S845A/2J_Tg (S845A-2J): carrying GluR1 with the S845A mutation and transgenic for YFP. S845A/2J_WT: carrying GluR1-S845A and not carrying YFP. (B 1 ) Three sets of representative spine images from WT-2J and S845A-2J mice. (B 2 ) S845A-2J mice have higher spine density than the WT-2J mice (* p < 0.007, Student s t-test). (B 3 ) Neither the average spine head volume (top panel) nor the distribution of spine size (lower panel) is different between the WT-2J and S845A-2J mice. (C 1 ) Whole cell recording configuration. (C 2 ) Representative recordings (5 sec traces) from wildtype (WT) and S845A mutant mice (HM). Right, the average mepsc traces from WT and HM. After scaling the WT average mepsc traces to match the one of HM, the two traces completely overlap with each other, suggesting no change in mepsc kinetics. Scale bars: 10 ms and 3 pa (D 1 ) The cumulative probability curve of the mepsc amplitude of the mutant mouse is shifted to the right of the wildtype s (p < , Kolmogorov Smirnov test). Inset: the average AMPAR mepsc amplitude is significantly larger in the S845A mutants (*p < 0.01, Student s t-test). (D 2 ) Both frequency and (D 3 ) decay kinetics of AMPAR mepsc are normal in the S845A mutants. (E) The presynaptic release probability is normal in the mutant mouse as measured by PPF ratio (slope of second FP/slope of first FP). Scale bars: 1mV and 10 ms. (F) The I AMPAR /I NMDAR are not different between the wildtype and the mutant mouse. Scale bars: 20 pa and 20 ms. (G) S845A mutants display a nearly significant increase in the NR1 content at the PSDs (p = , Student s t-test) but not in the total homogenates. 109
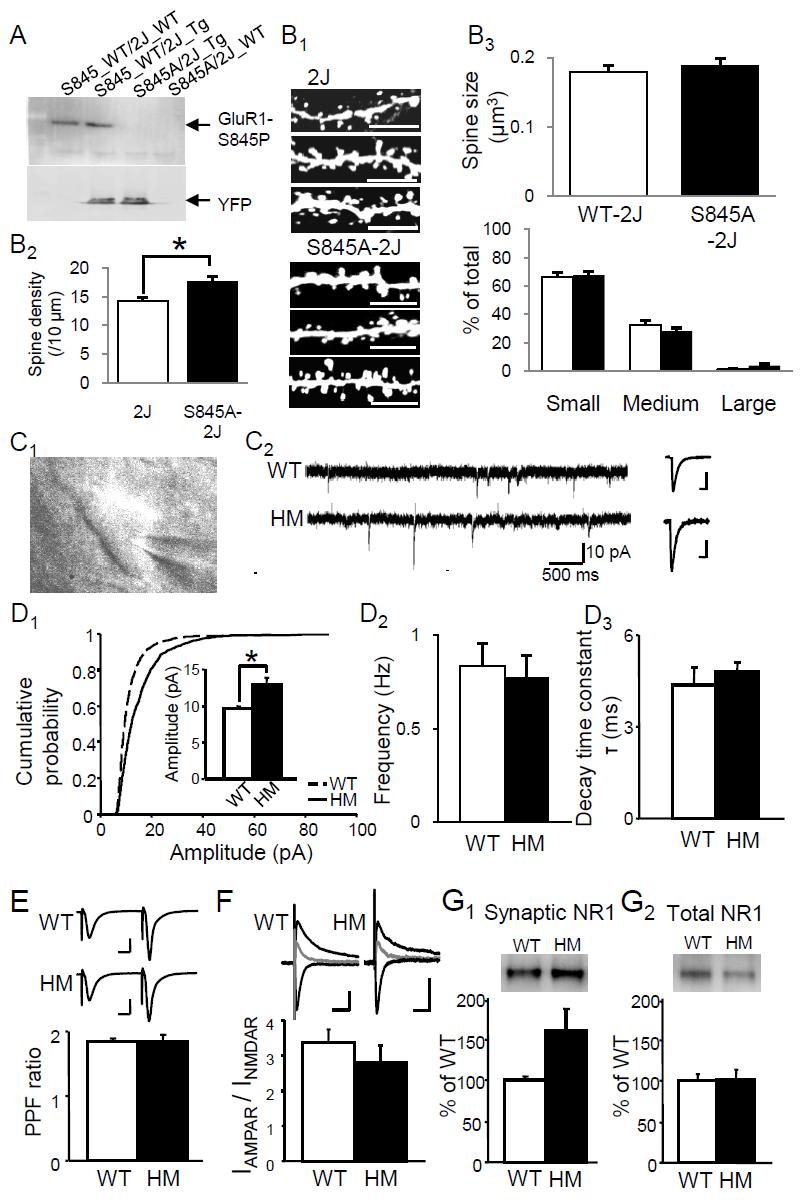
120 110
121 Subsection 3. Chemical-induced LTD (chemltd) causes spine morphological changes in hippocampus CA1 pyramidal neurons of the S845A-2J mice. LTD of synaptic strength is associated with and requires dephosphorylation of GluR1- S845 (Lee et al., 2000; Lee et al., 2003), which is linked to AMPARs internalization (Ehlers, 2000). Because the number of synaptic AMPARs correlates with spine size (Harris and Stevens, 1989; Baude et al., 1995; Nusser et al., 1998; Lendvai et al., 2000; Matsuzaki et al., 2001) we hypothesized that the removal of AMPARs by GluR1-S845 dephosphorylation may cause the shrinkage of spines observed after LTD. To test this hypothesis, we induced chemltd in the S845A-2J mouse hippocampus. In line with the proposed role of GluR1-S845 dephosphorylation in LTD induction (Kameyama et al., 1998; Lee et al., 2000; Lee et al., 2003), the S845A-2J mice showed a significant reduction in chemltd (Figure 3B, ± 4.44 % of baseline at 80 min after the onset of chemltd, n = 12, data from S845A (n = 8) and S845A-2J (n = 4) mice were pooled together) compared to the wildtype mice of comparable age (P < 0.05 when comparing the magnitude of LTD measured 80 min after chemltd induction between S845A and wildtype mice, Student s t-test). ChemLTD in S845A-2J resulted in a significant reduction in spine head volume [Fig 4.3C 1, C 2. CTL, 100 ± 4.88% of CTL (0.19 ± 0.01 µm 3 ), 1038 spines from 18 dendritic segments, 3 mice; 0 min after chemltd induction, ± 4.02 % (0.13 ± 0.01 µm 3 ), 849 spines from 18 dendritic segments, 3 mice; 30 min after chemltd induction, ± 4.80 % (0.14 ± 0.01 µm 3 ), 642 spines from 17 dendritic segments, 3 mice; 60 min after chemltd induction, ± 4.94 % (0.14 ± 0.01 µm 3 ), 749 spines from 19 dendritic segments, 3 mice. ANOVA: F(3, 68) = 7.599, P 111
122 = ], which was similar in magnitude and time course as those observed in WT-2J (not significantly different from WT-2J in the : t-test, p > 0.4 for the 0 min and 30 min groups; p > 0.1 for the 60 min groups). This result suggests that there is likely dissociation between the functional and the morphological alterations after chemltd. To be more specific, the GluR1-S845 while important for the functional depression of synaptic transmission, is not likely required for the spine structural plasticity associated with chemltd. Unexpectedly, unlike in WT-2J, the spine density of the CA1 pyramidal neurons in the S845A-2J mice was significantly reduced 60 min post-chemltd induction [Figure 4.3D 1,D 2. CTL, 100 ± 8.17% of CTL (17.57 ± 0.94 / 10µm); 0 min after chemltd induction, ± 8.85 % (17.88 ± 1.00 / 10µm); 30 min after chemltd induction, ± % (15.79 ± 0.94 / 10µm); 60 min after chemltd induction, ± 6.80 % (14.22 ± 0.88 / 10µm). P < 0.02 between the CTL and the 60 min group, Fisher s PSLD]. Interestingly, because the spine density was higher in the S845A-2J under basal conditions, the spine density after chemltd was comparable to what was seen under control conditions in WT-2J. Figure 4.3. ChemLTD induction causes spine morphological changes in the S845A-2J mice. (A) Two sets of representative spine images taken from control (CTL) and chemltd slices of S845A-2J. ChemLTD slices were fixed at specified times indicated. (B) NMDA infusion (20 µm, 3 min) only led to a modest synaptic depression in the CA3-CA1 synapses of the S845A-2J mice (p < 0.02 with two-tailed paired t-test of averages of 10 min baseline before chemltd and the last 10min of recording). Note the level of synaptic depression is significantly less (p < 0.05, t-test) than that observed in WT (Fig. 4.1B). (C 1 ) ChemLTD induction triggered rapid spine shrinkage that lasted up to 1 hour (* ANOVA: F(3, 68) = 7.599, P = ). (C 2 ) Normalized spine head volume to the control from the same animal (* ANOVA: F(3,68) = 8.632, P < ). (C 3 ) The cumulative probability curves of spine head volume in chemltd groups were all shifted to the left of control. (D 1 ) Significant spine loss was also observed 60 min after chemltd induction (* ANOVA: F(3, 68) = 3.354, P = 0.024; Fisher s PLSD test between CTL and 60 min post chemltd P < 0.02). (D 2 ) There was about 20 % reduction in spine density 60 min after chemltd induction (* 112

123 ANOVA: F(3, 68) = 4.522, P = 0.006; Fisher s PLSD test between CTL and 60 min post chemltd P < ) 113
124 Subsection 4. Spine head shrinkage observed in individual spines after chemltd induction in both WT-2J and S845A-2J mice Laser scanning confocal microscopy provides high resolution images (0.006 x x 0.27 µm / pixel in the x/y/z direction), and allows analysis of a large population of spines from a single slice preparation. However, we can only compare the average effects across different slices for each experimental condition, because the slices need to be fixed and resectioned before being imaged. In order to better determine the spine changes over time, we used two-photon microscopy on living hippocampal slices. While the disadvantage of using the two-photon microscopy is that it has a lower resolution than the confocal microscopy and we can only monitor a small number of synapses, this method allows us to track spine size in real-time. We imaged a small segment of dendrite (average length = µm), which had on average 6 stable spines. Z-stacked images (25-35 sections at 0.3 µm z-interval) of the dendritic segment were taken at 5 min intervals during the baseline period and at 10 min interval after chemltd induction. Only spines that were stable for the min baseline period and were constantly visible during the whole experiment were used for data analysis. Similar to the global change in spine head volume from the fix tissues, chemltd induced a rapid and persistent shrinkage of spine head volume of single spines imaged from both WT-2J (Fig 4.4A, ± 4.27% of baseline, average across images taken from 45 to 85 min postchemltd induction, 25 spines from 4 dendrites, 3 mice) and S845A-2J mice (Fig 4.4B, 68.68± 5.76% of baseline, average across images taken from 45 to 85 min post-chemltd induction, 29 spines from 5 dendrites, 3 mice). Due to the small number of spines imaged, we did not analyze the spine density. But we did observe few spines 114


125 disappearing during the experiments (1 from the WT-2J and 3 from S845A-2J). The spine loss was not necessarily correlated with chemltd induction as it may reflect a basal turnover of spines. It was also common for the small spines to disappear transiently right after chemltd induction, either due to temporary elimination or due to the phdependent dimming of YFP signal by NMDA application. By monitoring individual spines during the course of the experiment, we also observed that the persistent spine shrinkage is not a global phenomenon as few spines almost completely recovered the head volume by the end of the imaging session (data not shown, 2 out of 25 spines from WT-2J; 5 out of 29 spines from S845A-2J.) Figure 4.4. Rapid shrinkage of individual spines following chemltd induction was observed by 2 photon time-lapse imaging of live slices from both WT-2J and S845A-2J mice. (A 1 ) Representative spine images from WT-2J mice taken at varied time points. 0 min refers to the beginning of chemltd induction. Arrows point to the spines, which were stable for at least 15 min before chemltd induction and used for data analysis. (A 2 ) ChemLTD induction leads to about 40% reduction in the average spine head volume in the WT-2J mice. (B 2 ) Representative spine images from S845A-2J mice. Arrows point to the spines that were stable for at least 15 min during baseline observation and used for data analysis. (B 2 ) ChemLTD induction leads to about 40% reduction in the average spine head size in the S845A-2J mice. 115
Synaptic plasticityhippocampus. Neur 8790 Topics in Neuroscience: Neuroplasticity. Outline. Synaptic plasticity hypothesis
 Synaptic plasticityhippocampus Neur 8790 Topics in Neuroscience: Neuroplasticity Outline Synaptic plasticity hypothesis Long term potentiation in the hippocampus How it s measured What it looks like Mechanisms
BIPN 140 Problem Set 6
 BIPN 140 Problem Set 6 1) Hippocampus is a cortical structure in the medial portion of the temporal lobe (medial temporal lobe in primates. a) What is the main function of the hippocampus? The hippocampus
BIPN 140 Problem Set 6
 BIPN 140 Problem Set 6 1) The hippocampus is a cortical structure in the medial portion of the temporal lobe (medial temporal lobe in primates. a) What is the main function of the hippocampus? The hippocampus
BIPN140 Lecture 12: Synaptic Plasticity (II)
") BIPN140 Lecture 12: Synaptic Plasticity (II) 1. Early v.s. Late LTP 2. Long-Term Depression 3. Molecular Mechanisms of Long-Term Depression: NMDA-R dependent 4. Molecular Mechanisms of Long-Term Depression:
BIPN140 Lecture 12: Synaptic Plasticity (II) 1. Early v.s. Late LTP 2. Long-Term Depression 3. Molecular Mechanisms of Long-Term Depression: NMDA-R dependent 4. Molecular Mechanisms of Long-Term Depression:
Part 11: Mechanisms of Learning
 Neurophysiology and Information: Theory of Brain Function Christopher Fiorillo BiS 527, Spring 2012 042 350 4326, fiorillo@kaist.ac.kr Part 11: Mechanisms of Learning Reading: Bear, Connors, and Paradiso,
Cellular mechanisms of information transfer: neuronal and synaptic plasticity
 Cellular mechanisms of information transfer: neuronal and synaptic plasticity Ivan Pavlov (UCL Institute of Neurology, UK) Anton Chizhov (Ioffe Physical Technical Institute) Pavel Zykin (St.-Petersburg
Ionotropic glutamate receptors (iglurs)
") Ionotropic glutamate receptors (iglurs) GluA1 GluA2 GluA3 GluA4 GluN1 GluN2A GluN2B GluN2C GluN2D GluN3A GluN3B GluK1 GluK2 GluK3 GluK4 GluK5 The general architecture of receptor subunits Unique properties
Ionotropic glutamate receptors (iglurs) GluA1 GluA2 GluA3 GluA4 GluN1 GluN2A GluN2B GluN2C GluN2D GluN3A GluN3B GluK1 GluK2 GluK3 GluK4 GluK5 The general architecture of receptor subunits Unique properties
Synaptic Plasticity and the NMDA Receptor
 Synaptic Plasticity and the NMDA Receptor Lecture 4.2 David S. Touretzky November, 2015 Long Term Synaptic Plasticity Long Term Potentiation (LTP) Reversal of LTP Long Term Depression (LTD) Reversal of
Cellular Neurobiology / BIPN 140
 SECOND MIDTERM EXAMINATION Fall, 2015 GENERAL INSTRUCTIONS 1. Please write your name on ALL 6 pages. 2. Please answer each question IN THE SPACE ALLOTTED. 1) /10 pts 2) /10 pts 3) /15 pts 4) /15 pts 5)
Chapter 9: Biochemical Mechanisms for Information Storage at the Cellular Level. From Mechanisms of Memory, second edition By J. David Sweatt, Ph.D.
 Chapter 9: Biochemical Mechanisms for Information Storage at the Cellular Level From Mechanisms of Memory, second edition By J. David Sweatt, Ph.D. Chapter 9: Dendritic Spine Figure 1 Summary: Three Primary
Synaptic Plasticity and Memory
 Synaptic Plasticity and Memory Properties and synaptic mechanisms underlying the induction of long-term potentiation (LTP) The role of calcium/calmodulin-dependent kinase II (CamKII) in the induction,
CONTEXT. LTP (long term potentiation) definition. LTP as a interesting mechanism for learning and memory
 definition. LTP as a interesting mechanism for learning and memory") CONTEXT LTP (long term potentiation) definition LTP as a interesting mechanism for learning and memory LTP is due primarily to a pre or post- synaptic modification? (Increased Glut release or increased
CONTEXT LTP (long term potentiation) definition LTP as a interesting mechanism for learning and memory LTP is due primarily to a pre or post- synaptic modification? (Increased Glut release or increased
Memory Systems II How Stored: Engram and LTP. Reading: BCP Chapter 25
 Memory Systems II How Stored: Engram and LTP Reading: BCP Chapter 25 Memory Systems Learning is the acquisition of new knowledge or skills. Memory is the retention of learned information. Many different
CASE 49. What type of memory is available for conscious retrieval? Which part of the brain stores semantic (factual) memories?
 memories?") CASE 49 A 43-year-old woman is brought to her primary care physician by her family because of concerns about her forgetfulness. The patient has a history of Down syndrome but no other medical problems.
CASE 49 A 43-year-old woman is brought to her primary care physician by her family because of concerns about her forgetfulness. The patient has a history of Down syndrome but no other medical problems.
BISP194: MOLECULAR MECHANISM OF SYNAPTIC PLASTICITY Spring Quarter
 BISP194: MOLECULAR MECHANISM OF SYNAPTIC PLASTICITY Spring Quarter 2011 Instructor: Class Website: Gentry N. Patrick (gpatrick@ucsd.edu) http://www.biology.ucsd.edu/classes/bisp194.sp11 Class Meetings:
Synaptic Transmission: Ionic and Metabotropic
 Synaptic Transmission: Ionic and Metabotropic D. Purves et al. Neuroscience (Sinauer Assoc.) Chapters 5, 6, 7. C. Koch. Biophysics of Computation (Oxford) Chapter 4. J.G. Nicholls et al. From Neuron to
Synaptic plasticity. Activity-dependent changes in synaptic strength. Changes in innervation patterns. New synapses or deterioration of synapses.
 Synaptic plasticity Activity-dependent changes in synaptic strength. Changes in innervation patterns. New synapses or deterioration of synapses. Repair/changes in the nervous system after damage. MRC Centre
AMPA RECEPTOR TRAFFICKING AND SYNAPTIC PLASTICITY
 Annu. Rev. Neurosci. 2002. 25:103 26 doi: 10.1146/annurev.neuro.25.112701.142758 Copyright c 2002 by Annual Reviews. All rights reserved AMPA RECEPTOR TRAFFICKING AND SYNAPTIC PLASTICITY Roberto Malinow
Supporting Information
 ATP from synaptic terminals and astrocytes regulates NMDA receptors and synaptic plasticity through PSD- 95 multi- protein complex U.Lalo, O.Palygin, A.Verkhratsky, S.G.N. Grant and Y. Pankratov Supporting
Synaptic plasticity. Mark van Rossum. Institute for Adaptive and Neural Computation University of Edinburgh
 Synaptic plasticity Mark van Rossum Institute for Adaptive and Neural Computation University of Edinburgh 1 Human memory systems 2 Psychologists have split up memory in: Declarative memory * Episodic memory
When cells are already maximally potentiated LTP is occluded.
 When cells are already maximally potentiated LTP is occluded. Stein, V et al., (2003) J Neurosci, 23:5503-6606. Also found in Rat Barrel Cortex Ehrlich & Malinow (2004) J. Neurosci. 24:916-927 Over-expression
Synaptic plasticity and hippocampal memory
 Synaptic plasticity and hippocampal memory Tobias Bast School of Psychology, University of Nottingham tobias.bast@nottingham.ac.uk Synaptic plasticity as the neurophysiological substrate of learning Hebb
Cellular Neurobiology BIPN140
 Cellular Neurobiology BIPN140 1st Midterm Exam Ready for Pickup By the elevator on the 3 rd Floor of Pacific Hall (waiver) Exam Depot Window at the north entrance to Pacific Hall (no waiver) Mon-Fri, 10:00
Synaptic plasticity and addiction
 Synaptic plasticity and addiction Julie A. Kauer* and Robert C. Malenka Abstract Addiction is caused, in part, by powerful and long-lasting memories of the drug experience. Relapse caused by exposure to
Modeling the role of AMPA receptor trafficking in the expression of long-term potentiation/depression
 Modeling the role of AMPA receptor trafficking in the expression of long-term potentiation/depression Berton Earnshaw Department of Mathematics Michigan State University October 8, 29 Earnshaw (MSU) AMPAR
9.01 Introduction to Neuroscience Fall 2007
 MIT OpenCourseWare http://ocw.mit.edu 9.01 Introduction to Neuroscience Fall 2007 For information about citing these materials or our Terms of Use, visit: http://ocw.mit.edu/terms. Working memory short-term
The Neurobiology of Learning and Memory
 The Neurobiology of Learning and Memory JERRY W. RUDY University of Colorado, Boulder Sinauer Associates, Inc. Publishers Sunderland, Massachusetts 01375 Table of Contents CHAPTER 1 Introduction: Fundamental
SUPPLEMENTARY INFORMATION
 Supplementary Figure 1. Normal AMPAR-mediated fepsp input-output curve in CA3-Psen cdko mice. Input-output curves, which are plotted initial slopes of the evoked fepsp as function of the amplitude of the
Cognitive Enhancement Strategies. Florian Plattner, James A. Bibb
 Cognitive Enhancement Strategies Florian Plattner, James A. Bibb A decline in memory and cognitive function is a natural aspect of aging. In addition, cognitive deficits are comorbid with many mental disorders
Biophysical model of AMPA receptor trafficking and its regulation during LTP/LTD
 Biophysical model of AMPA receptor trafficking and its regulation during LTP/LTD Berton A. Earnshaw and Paul C. Bressloff Department of Mathematics, University of Utah Salt Lake City, Utah 84112 Biophysical
Notes: Synapse. Overview. PSYC Summer Professor Claffey PDF. Conversion from an signal to a signal - electrical signal is the
 PSYC 170 - Summer 2013 - Professor Claffey Notes: Synapse PDF Overview Conversion from an signal to a signal - electrical signal is the - chemical signal is the Presynaptic - refers to that sends/receives
Synaptic Plasticity: Multiple Forms, Functions, and Mechanisms
 (2008) 33, 18 41 & 2008 Nature Publishing Group All rights reserved 0893-133X/08 $30.00... 18 www.neuropsychopharmacology.org REVIEW Synaptic Plasticity: Multiple Forms, Functions, and Mechanisms Ami Citri
Synapses and synaptic plasticity. Lubica Benuskova Lecture 8 How neurons communicate How do we learn and remember
 Synapses and synaptic plasticity Lubica Benuskova Lecture 8 How neurons communicate How do we learn and remember 1 Brain is comprised of networks of neurons connected and communicating via synapses ~10
Serotonergic Control of the Developing Cerebellum M. Oostland
 Serotonergic Control of the Developing Cerebellum M. Oostland Summary Brain development is a precise and crucial process, dependent on many factors. The neurotransmitter serotonin is one of the factors
Beyond Vanilla LTP. Spike-timing-dependent-plasticity or STDP
 Beyond Vanilla LTP Spike-timing-dependent-plasticity or STDP Hebbian learning rule asn W MN,aSN MN Δw ij = μ x j (v i - φ) learning threshold under which LTD can occur Stimulation electrode Recording electrode
The synaptic Basis for Learning and Memory: a Theoretical approach
 Theoretical Neuroscience II: Learning, Perception and Cognition The synaptic Basis for Learning and Memory: a Theoretical approach Harel Shouval Phone: 713-500-5708 Email: harel.shouval@uth.tmc.edu Course
Supplementary Figure 1. Basic properties of compound EPSPs at
 Supplementary Figure 1. Basic properties of compound EPSPs at hippocampal CA3 CA3 cell synapses. (a) EPSPs were evoked by extracellular stimulation of the recurrent collaterals and pharmacologically isolated
MOLECULAR BIOLOGY OF DRUG ADDICTION. Sylvane Desrivières, SGDP Centre
 1 MOLECULAR BIOLOGY OF DRUG ADDICTION Sylvane Desrivières, SGDP Centre Reward 2 Humans, as well as other organisms engage in behaviours that are rewarding The pleasurable feelings provide positive reinforcement
Activity-Dependent Development II April 25, 2007 Mu-ming Poo
 Activity-Dependent Development II April 25, 2007 Mu-ming Poo 1. The neurotrophin hypothesis 2. Maps in somatic sensory and motor cortices 3. Development of retinotopic map 4. Reorganization of cortical
Synapse. Structure & Function. Neurotransmitter Sequence. Integration. History: 10/4/12 original version
 Synapse History: 10/4/12 original version Structure & Function (This content is covered in Sinjin's presentation, see link in calendar) Neurotransmitters Synaptic cleft Post-synaptic potential Excitation
Problem Set 3 - Answers. -70mV TBOA
 Harvard-MIT Division of Health Sciences and Technology HST.131: Introduction to Neuroscience Course Director: Dr. David Corey HST 131/ Neuro 200 18 September 05 Explanation in text below graphs. Problem
Signal Transduction: G-Protein Coupled Receptors
 Signal Transduction: G-Protein Coupled Receptors Federle, M. (2017). Lectures 4-5: Signal Transduction parts 1&2: nuclear receptors and GPCRs. Lecture presented at PHAR 423 Lecture in UIC College of Pharmacy,
Neuronal Plasticity, Learning and Memory. David Keays Institute of Molecular Pathology
 Neuronal Plasticity, Learning and Memory David Keays Institute of Molecular Pathology http://keayslab.org Structure 1. What is learning and memory? 2. Anatomical basis 3. Cellular basis 4. Molecular
9.01 Introduction to Neuroscience Fall 2007
 MIT OpenCourseWare http://ocw.mit.edu 9.01 Introduction to Neuroscience Fall 2007 For information about citing these materials or our Terms of Use, visit: http://ocw.mit.edu/terms. Declarative memory conscious,
Lipids and Membranes
 Lipids and Membranes Presented by Dr. Mohammad Saadeh The requirements for the Pharmaceutical Biochemistry I Philadelphia University Faculty of pharmacy Membrane transport D. Endocytosis and Exocytosis
Lecture 22: A little Neurobiology
 BIO 5099: Molecular Biology for Computer Scientists (et al) Lecture 22: A little Neurobiology http://compbio.uchsc.edu/hunter/bio5099 Larry.Hunter@uchsc.edu Nervous system development Part of the ectoderm
SYNAPTIC PLASTICITY SHORT-TERM SYNAPTIC PLASTICITY
 11 SYNAPTIC PLASTICITY ROBERT C. MALENKA The most fascinating and important property of the mammalian brain is its remarkable plasticity, which can be thought of as the ability of experience to modify
How Synapses Integrate Information and Change
 How Synapses Integrate Information and Change Rachel Stewart class of 2016 http://neuroscience.uth.tmc.edu/s1/chapter06.html http://neuroscience.uth.tmc.edu/s1/chapter07.html Chris Cohan, Ph.D. Dept. of
Dania Ahmad. Tamer Barakat + Dania Ahmad. Faisal I. Mohammed
 16 Dania Ahmad Tamer Barakat + Dania Ahmad Faisal I. Mohammed Revision: What are the basic types of neurons? sensory (afferent), motor (efferent) and interneuron (equaled association neurons). We classified
SUPPLEMENTARY INFORMATION. Supplementary Figure 1
 SUPPLEMENTARY INFORMATION Supplementary Figure 1 The supralinear events evoked in CA3 pyramidal cells fulfill the criteria for NMDA spikes, exhibiting a threshold, sensitivity to NMDAR blockade, and all-or-none
A form of long-lasting, learning-related synaptic plasticity in the hippocampus induced by heterosynaptic low-frequency pairing
 A form of long-lasting, learning-related synaptic plasticity in the hippocampus induced by heterosynaptic low-frequency pairing Yan-You Huang, Christopher Pittenger*, and Eric R. Kandel Center for Neurobiology
International Journal of. Peptides. Hindawi Publishing Corporation. Submit your manuscripts at. Anatomy Research International
 Directions in Science TheScientificWorld (2001) 1, 530 533 ISSN 1532-2246; DOI 10.1100/tsw.2001.259 Calcineurin, Synaptic Plasticity, and Memory Carl Weitlauf and Danny Winder Vanderbilt University School
Ligand-Gated Ion Channels
 Ligand-Gated Ion Channels The Other Machines That Make It Possible... Topics I Introduction & Electrochemical Gradients Passive Membrane Properties Action Potentials Voltage-Gated Ion Channels Topics II
ABSTRACT. Professor Elizabeth Quinlan Department of Biology / NACS University of Maryland
 ABSTRACT Title of Document: CIRCUIT ANALYSIS OF SYNAPTIC DYSFUNCTIONS IN THE CA3 AREA OF BACE1 KNOCKOUT MICE Hui Wang, Ph.D, 2012 Directed By: Professor Elizabeth Quinlan Department of Biology / NACS University
7.06 Spring of PROBLEM SET #6
 7.6 Spring 23 1 of 6 7.6 PROBLEM SET #6 1. You are studying a mouse model of hypercholesterolemia, a disease characterized by high levels of cholesterol in the blood. In normal cells, LDL particles in
Long-term Potentiation
 John Lisman, Brandeis University, Massachusetts, USA Long-term potentiation is an activity-dependent strengthening of synapses that is thought to underlie memory. Introduction One of the major unsolved
Synap&c Plas&city. long-term plasticity (~30 min to lifetime) Long-term potentiation (LTP) / Long-term depression (LTD)
 Long-term potentiation (LTP) / Long-term depression (LTD)") Synap&c Plas&city synaptic connectivity constantly changes in response to activity and other factors During development: provides the basic wiring of the brain s circuits Throughout rest of life: basis
Synap&c Plas&city synaptic connectivity constantly changes in response to activity and other factors During development: provides the basic wiring of the brain s circuits Throughout rest of life: basis
Postsynaptic scaffold proteins in health and disease Dr. Jonathan Hanley
 Postsynaptic Scaffold Proteins in Health and Disease 1 School of Biochemistry University of Bristol, UK Talk outline Introduction to synapses, their plasticity and molecular organization Focus on excitatory
Fig. 4. The activity of Pkc -transduced neurons is required for enhanced learning. After gene transfer, rats were tested on [] vs. +.
![Fig. 4. The activity of Pkc -transduced neurons is required for enhanced learning. After gene transfer, rats were tested on [] vs. +.](/thumbs/90/102196023.jpg "Fig. 4. The activity of Pkc -transduced neurons is required for enhanced learning. After gene transfer, rats were tested on [] vs. +.") Research Interests Advanced cognitive learning is encoded in distributed circuits that span multiple forebrain areas. Further, synaptic plasticity and neural network theories hypothesize that essential
Research Interests Advanced cognitive learning is encoded in distributed circuits that span multiple forebrain areas. Further, synaptic plasticity and neural network theories hypothesize that essential
Chapter 11 Introduction to the Nervous System and Nervous Tissue Chapter Outline
 Chapter 11 Introduction to the Nervous System and Nervous Tissue Chapter Outline Module 11.1 Overview of the Nervous System (Figures 11.1-11.3) A. The nervous system controls our perception and experience
Ca 2 calmodulin-kinase II enhances channel conductance of. of the -amino-3-hydroxy-5-methyl-4-isoxazolepropionate. glutamate receptors
 Proc. Natl. Acad. Sci. USA Vol. 96, pp. 3269 3274, March 1999 Neurobiology Ca 2 calmodulin-kinase II enhances channel conductance of -amino-3-hydroxy-5-methyl-4-isoxazolepropionate type glutamate receptors
CELLULAR NEUROPHYSIOLOGY
 CELLULAR NEUROPHYSIOLOGY CONSTANCE HAMMOND 4. SYNAPTIC TRANSMISSION II: GLUTAMATERGIC TRANSMISSION Video 4-1: Observations and glutamate receptor channels Synaptic transmission II 1 Constance Hammond Observation
63 Cellular Mechanisms of Learning and the Biological Basis of Individuality
 Back 63 Cellular Mechanisms of Learning and the Biological Basis of Individuality Eric R. Kandel THROUGHOUT THIS BOOK we have emphasized that all behavior is a function of the brain and that malfunctions
MCB MIDTERM EXAM #1 MONDAY MARCH 3, 2008 ANSWER KEY
 MCB 160 - MIDTERM EXAM #1 MONDAY MARCH 3, 2008 ANSWER KEY Name ID# Instructions: -Only tests written in pen will be regarded -Please submit a written request indicating where and why you deserve more points
A Model of Spike-Timing Dependent Plasticity: One or Two Coincidence Detectors?
 RAPID COMMUNICATION J Neurophysiol 88: 507 513, 2002; 10.1152/jn.00909.2001. A Model of Spike-Timing Dependent Plasticity: One or Two Coincidence Detectors? UMA R. KARMARKAR AND DEAN V. BUONOMANO Departments
Synaptic Plasticity and NO-cGMP-PKG Signaling Regulate Pre- and Postsynaptic Alterations at Rat Lateral Amygdala Synapses Following Fear Conditioning
 Synaptic Plasticity and NO-cGMP-PKG Signaling Regulate Pre- and Postsynaptic Alterations at Rat Lateral Amygdala Synapses Following Fear Conditioning Kristie T. Ota 1, Melissa S. Monsey 1, Melissa S. Wu
63 Cellular Mechanisms of Learning and the Biological Basis of Individuality
 Back 63 Cellular Mechanisms of Learning and the Biological Basis of Individuality Eric R. Kandel THROUGHOUT THIS BOOK we have emphasized that all behavior is a function of the brain and that malfunctions
Enhancement of synaptic transmission by cyclic AMP modulation of presynaptic I h channels. Vahri Beaumont and Robert S. Zucker
 Enhancement of synaptic transmission by cyclic AMP modulation of presynaptic I h channels Vahri Beaumont and Robert S. Zucker Background I h channels discovered in 1976 (Noma A. and Irisawa H.) Voltage-gated
NEURONS COMMUNICATE WITH OTHER CELLS AT SYNAPSES 34.3
 NEURONS COMMUNICATE WITH OTHER CELLS AT SYNAPSES 34.3 NEURONS COMMUNICATE WITH OTHER CELLS AT SYNAPSES Neurons communicate with other neurons or target cells at synapses. Chemical synapse: a very narrow
VISUAL CORTICAL PLASTICITY
 VISUAL CORTICAL PLASTICITY OCULAR DOMINANCE AND OTHER VARIETIES REVIEW OF HIPPOCAMPAL LTP 1 when an axon of cell A is near enough to excite a cell B and repeatedly and consistently takes part in firing
Synaptic transmission
 Outline Synaptic transmission Sompol Tapechum M.D., Ph.D. Department of Physiology Faculty of Medicine Siriraj Hospital, Bangkok, Thailand. sisth@mahidol.ac.th 2 Structure of synapse Modes of synaptic
Basal Ganglia Anatomy, Physiology, and Function. NS201c
 Basal Ganglia Anatomy, Physiology, and Function NS201c Human Basal Ganglia Anatomy Basal Ganglia Circuits: The Classical Model of Direct and Indirect Pathway Function Motor Cortex Premotor Cortex + Glutamate
serotonin in learning and plasticity
 serotonin in learning and plasticity pt.1 immediate action L P H N NRX N N R X N CDH RhoA/ROCK RAC1 DAG [Ca2+] camp GIRK2 P11 Gq CASK PICK1 VELI MINT-1 CaMK Ca2+ channel AC Gi mglur7 mglur5 Glutamate NMDAR
Hippocampal synapses are known to be highly plastic. Their
 N-methyl-D-aspartate receptor blockade during development lowers long-term potentiation threshold without affecting dynamic range of CA3-CA1 synapses Nataša Savić, Andreas Lüthi, Beat H. Gähwiler, and
Axon initial segment position changes CA1 pyramidal neuron excitability
 Axon initial segment position changes CA1 pyramidal neuron excitability Cristina Nigro and Jason Pipkin UCSD Neurosciences Graduate Program Abstract The axon initial segment (AIS) is the portion of the
Cellular and Molecular Mechanisms of Learning and Memory
 Cellular/Molecular Mechanisms of Learning and Memory 27 Cellular and Molecular Mechanisms of Learning and Memory 2 Matthew Lattal and Ted Abel The nature of the cellular basis of learning and memory remains
Cell Signaling part 2
 15 Cell Signaling part 2 Functions of Cell Surface Receptors Other cell surface receptors are directly linked to intracellular enzymes. The largest family of these is the receptor protein tyrosine kinases,
Signal Transduction Cascades
 Signal Transduction Cascades Contents of this page: Kinases & phosphatases Protein Kinase A (camp-dependent protein kinase) G-protein signal cascade Structure of G-proteins Small GTP-binding proteins,
Memory retention the synaptic stability versus plasticity dilemma
 Memory retention the synaptic stability versus plasticity dilemma Paper: Abraham, Wickliffe C., and Anthony Robins. "Memory retention the synaptic stability versus plasticity dilemma." Trends in neurosciences
Neurotransmitter Systems II Receptors. Reading: BCP Chapter 6
 Neurotransmitter Systems II Receptors Reading: BCP Chapter 6 Neurotransmitter Systems Normal function of the human brain requires an orderly set of chemical reactions. Some of the most important chemical
Chapter 6 subtitles postsynaptic integration
 CELLULAR NEUROPHYSIOLOGY CONSTANCE HAMMOND Chapter 6 subtitles postsynaptic integration INTRODUCTION (1:56) This sixth and final chapter deals with the summation of presynaptic currents. Glutamate and
Neurons! John A. White Dept. of Bioengineering
 Neurons! John A. White Dept. of Bioengineering john.white@utah.edu What makes neurons different from cardiomyocytes? Morphological polarity Transport systems Shape and function of action potentials Neuronal
Synapses throughout the brain are bidirectionally modifiable.
 A unified model of NMDA receptor-dependent bidirectional synaptic plasticity Harel Z. Shouval*, Mark F. Bear*, and Leon N Cooper* *Institute for Brain and Neural Systems, Departments of Physics and Neuroscience,
DNA and Histone Methylation in Learning and Memory
 EXPERIMENTAL BIOLOGY ANNUAL MEETING April 2010 DNA and Histone Methylation in Learning and Memory J. David Sweatt Dept of Neurobiology McKnight Brain Institute UAB School of Medicine The Molecular Basis
Supplementary Information
 Supplementary Information D-Serine regulates cerebellar LTD and motor coordination through the 2 glutamate receptor Wataru Kakegawa, Yurika Miyoshi, Kenji Hamase, Shinji Matsuda, Keiko Matsuda, Kazuhisa
Time-Dependent Postsynaptic AMPA GluR1 Receptor Recruitment in the Cingulate Synaptic Potentiation
 Time-Dependent Postsynaptic AMPA GluR1 Receptor Recruitment in the Cingulate Synaptic Potentiation Hiroki Toyoda,* Long-Jun Wu,* Ming-Gao Zhao,* Hui Xu, Min Zhuo Department of Physiology, Faculty of Medicine,
Section: Chapter 5: Multiple Choice. 1. The structure of synapses is best viewed with a(n):
:") Section: Chapter 5: Multiple Choice 1. The structure of synapses is best viewed with a(n): p.155 electron microscope. light microscope. confocal microscope. nissle-stained microscopic procedure. 2. Electron
Section: Chapter 5: Multiple Choice 1. The structure of synapses is best viewed with a(n): p.155 electron microscope. light microscope. confocal microscope. nissle-stained microscopic procedure. 2. Electron
Glutamate receptor subunit GluA1 is necessary for longterm potentiation and synapse unsilencing, but not longterm depression in mouse hippocampus
 Glutamate receptor subunit GluA1 is necessary for longterm potentiation and synapse unsilencing, but not longterm depression in mouse hippocampus The MIT Faculty has made this article openly available.
University of Bristol - Explore Bristol Research
 Henley, J., & Wilkinson, K. (2016). Synaptic AMPA receptor composition in development, plasticity and disease. Nature Reviews Neuroscience, 17(6), 337 350. DOI: 10.1038/nrn.2016.37 Peer reviewed version
What effect would an AChE inhibitor have at the neuromuscular junction?
 CASE 4 A 32-year-old woman presents to her primary care physician s office with difficulty chewing food. She states that when she eats certain foods that require a significant amount of chewing (meat),
How Synapses Integrate Information and Change
 How Synapses Integrate Information and Change Rachel Stewart class of 2016 https://nba.uth.tmc.edu/neuroscience/s1/chapter06.html https://nba.uth.tmc.edu/neuroscience/s1/chapter07.html Chris Cohan, Ph.D.
1) Drop off in the Bi 150 box outside Baxter 331 or to the head TA (jcolas).
 Drop off in the Bi 150 box outside Baxter 331 or to the head TA (jcolas).") Bi/CNS/NB 150 Problem Set 3 Due: Tuesday, Oct. 27, at 4:30 pm Instructions: 1) Drop off in the Bi 150 box outside Baxter 331 or e-mail to the head TA (jcolas). 2) Submit with this cover page. 3) Use a
Bi/CNS/NB 150 Problem Set 3 Due: Tuesday, Oct. 27, at 4:30 pm Instructions: 1) Drop off in the Bi 150 box outside Baxter 331 or e-mail to the head TA (jcolas). 2) Submit with this cover page. 3) Use a
Chapter 15: Signal transduction
 Chapter 15: Signal transduction Know the terminology: Enzyme-linked receptor, G-protein linked receptor, nuclear hormone receptor, G-protein, adaptor protein, scaffolding protein, SH2 domain, MAPK, Ras,
Introduction to Neurobiology
 Biology 240 General Zoology Introduction to Neurobiology Nervous System functions: communication of information via nerve signals integration and processing of information control of physiological and
Activity-Dependent Change in AMPA Receptor Properties in Cerebellar Stellate Cells
 The Journal of Neuroscience, May 15, 2002, 22(10):3881 3889 Activity-Dependent Change in AMPA Receptor Properties in Cerebellar Stellate Cells Siqiong June Liu and Stuart G. Cull-Candy Department of Pharmacology,
Neuromorphic computing
 Neuromorphic computing Robotics M.Sc. programme in Computer Science lorenzo.vannucci@santannapisa.it April 19th, 2018 Outline 1. Introduction 2. Fundamentals of neuroscience 3. Simulating the brain 4.
Chapter 3 subtitles Action potentials
 CELLULAR NEUROPHYSIOLOGY CONSTANCE HAMMOND Chapter 3 subtitles Action potentials Introduction (3:15) This third chapter explains the calcium current triggered by the arrival of the action potential in
The molecular analysis of long-term plasticity in the mammalian
 Genetic evidence for a protein-kinase-a-mediated presynaptic component in NMDA-receptor-dependent forms of long-term synaptic potentiation Yan-You Huang*, Stanislav S. Zakharenko*, Susanne Schoch, Pascal
Basics of Computational Neuroscience: Neurons and Synapses to Networks
 Basics of Computational Neuroscience: Neurons and Synapses to Networks Bruce Graham Mathematics School of Natural Sciences University of Stirling Scotland, U.K. Useful Book Authors: David Sterratt, Bruce