Treg depletion inhibits efficacy of cancer immunotherapy: implications for clinical trials.
|
|
|
- Noah Morton
- 6 years ago
- Views:
Transcription

1 Dublin Institute of Technology Articles School of Biological Sciences Treg depletion inhibits efficacy of cancer immunotherapy: implications for clinical trials. James Curtin Dublin Institute of Technology, Marianela Candolfi Cedars-Sinai Medical Center Tamer Fakhouri Cedars-Sinai Medical Center Chunyan Liu Cedars-Sinai Medical Center Anderson Alden Cedars-Sinai Medical Center See next page for additional authors Follow this and additional works at: Part of the Biochemistry Commons, Biotechnology Commons, Cancer Biology Commons, Molecular and Cellular Neuroscience Commons, Molecular Biology Commons, and the Therapeutics Commons Recommended Citation Curtin JF, Candolfi M, Fakhouri TM, Liu C, Alden A, Edwards M, Lowenstein PR, Castro MG. Treg depletion inhibits efficacy of cancer immunotherapy: implications for clinical trials. PLoS One Apr 23;3(4):e1983. doi: /journal.pone This Article is brought to you for free and open access by the School of Biological Sciences at It has been accepted for inclusion in Articles by an authorized administrator of For more information, please contact This work is licensed under a Creative Commons Attribution- Noncommercial-Share Alike 3.0 License
2 Authors James Curtin, Marianela Candolfi, Tamer Fakhouri, Chunyan Liu, Anderson Alden, Matthew Edwards, Pedro Lowenstein, and Maria Castro This article is available at
3 PLoS One Apr 23;3(4):e1983. Pubmed ID: Treg Depletion Inhibits Efficacy of Cancer Immunotherapy: Implications for Clinical Trials. James F. Curtin, Marianela Candolfi, Tamer M. Fakhouri, Chunyan Liu, Anderson Alden, Matthew Edwards, Pedro R. Lowenstein, Maria G. Castro Gene Therapeutics Research Institute; Department of Biomedical Sciences; Cedars Sinai Medical Center; 8700 Beverly Blvd, Davis Building, Rm: R5090, Los Angeles, CA 90048; Department of Medicine, Department of Molecular and Medical Pharmacology, The Brain Research Institute, and Jonsson Comprehensive Cancer Center, David Geffen School of Medicine, UCLA, Los Angeles, CA, 90095, USA. Current Address: School of Biological Sciences, Dublin Institute of Technology, Ireland. Corresponding author: Telephone: Fax: M. G. Castro, Running Title: CD25 depletion in glioma Page 1 of 39
4 Abstract Background Regulatory T lymphocytes (Treg) infiltrate human glioblastoma (GBM); are involved in tumor progression and correlate with tumor grade. Transient elimination of Tregs using CD25 depleting antibodies (PC61) has been found to mediate GBM regression in preclinical models of brain tumors. Clinical trials that combine Treg depletion with tumor vaccination are underway to determine whether transient Treg depletion can enhance anti-tumor immune responses and improve long term survival in cancer patients. Findings Using a syngeneic intracrabial glioblastoma (GBM) mouse model we show that systemic depletion of Tregs 15 days after tumor implantation using PC61 resulted in a decrease in Tregs present in tumors, draining lymph nodes and spleen and improved long-term survival (50% of mice survived >150 days). No improvement in survival was observed when Tregs were depleted 24 days after tumor implantation, suggesting that tumor burden is an important factor for determining efficacy of Treg depletion in clinical trials. In a T cell dependent model of brain tumor regression elicited by intratumoral delivery of adenoviral vectors (Ad) expressing Fms-like Tyrosine Kinase 3 ligand (Flt3L) and Herpes Simplex Type 1-Thymidine Kinase (TK) with ganciclovir (GCV), we demonstrate that administration of PC61 24 days after tumor implantation (7 days after treatment) inhibited T cell dependent tumor regression and long term survival. Further, depletion with PC61 completely inhibited clonal expansion of tumor antigen-specific T lymphocytes in response to the treatment. Page 2 of 39
5 Conclusions Our data demonstrate for the first time, that although Treg depletion inhibits the progression/eliminates GBM tumors, its efficacy is dependent on tumor burden. We conclude that this approach will be useful in a setting of minimal residual disease. Further, we also demonstrate that Treg depletion, using PC61 in combination with immunotherapy, inhibits clonal expansion of tumor antigen-specific T cells, suggesting that new, more specific targets to block Tregs will be necessary when used in combination with therapies that activate anti-tumor immunity. Page 3 of 39
6 Introduction Glioblastoma multiforme (GBM) is a deadly primary brain tumor which is highly invasive with tumor cells infiltrating the surrounding healthy brain tissue [1]. The median survival of patients diagnosed with GBM is one year (4-6 months after recurrence), with less than 5% of the patients remaining alive 5 years after diagnosis [2]. Improvements in surgery, chemotherapy and radiotherapy have not been translated into significantly improved prognosis for patients with GBM; long term survival (5 years after diagnosis) has not improved since 1950 [3]. Tumor recurrence almost always occurs even if surgery successfully removes the majority of the primary tumor mass. Novel therapies to prevent or treat tumor recurrence are urgently needed to treat patients diagnosed with GBM. Immunotherapy has been proposed as a powerful approach to prevent tumor recurrence by eliminating tumor cells while sparing normal surrounding healthy cells [4,5]. Several clinical trials are now underway to test whether immunotherapy is safe and effective to treat GBM [6,7]. GBMs over express tumor antigens such as MAGE, Her2/neu, Tyrosinase, Trp-1, Trp-2, gp100, IL13Rα2, Survivin (reviewed in [8]) and EphA2 [9]. The immune system ordinarily sculpts tumors resulting the loss of tumor antigen expression [10,11], however, the location of GBM in the brain, a site of immune privilege [12,13], or the presence of a highly immunosuppressive environment in brain tumors [14,15] may be reasons why GBM commonly over express tumor antigens in patients. Autologous dendritic cells (DC) loaded with GBM tumor peptides [16] or autologous tumor lysate [17] have been used to vaccinate patients in two recent Phase I clinical trials. No significant increase in survival was observed using autologous tumor lysates [17]. However, the median time to progression and median survival of patients treated with Page 4 of 39
7 peptide based vaccines was increased compared with patients that were treated during the same time period with conventional therapies [16]. Interestingly, a subpopulation of responders to the treatment were identified by the expression of low concentrations of TGFβ in the brain. Intratumoral expression of TGFβ can suppress adaptive immune responses against antigen [4,5] and was predictive of clinical outcome after vaccination [16]. In addition, circulating tumor antigen specific CD8+ T lymphocytes have been identified in GBM patients [18], but the immunosuppressive environment in the tumor prevents the elimination of GBM from these patients. T cell responses against tumor antigen measured by tetramers and ELISPOT do not always correlate with tumor regression in clinical trials testing immunotherapies for human GBM [19]. This suggests that suppression of effective immune responses against tumor antigens can interfere with immune dependent tumor regression. Recently, researchers have investigated whether depletion of a subset of T lymphocytes called regulatory T lymphocytes (Tregs) can potentiate immunotherapies against cancer. Tregs are a subpopulation of CD4+ T lymphocytes that constitutively express the transcription factor Foxp3, the high affinity IL2 receptor CD25 and the B7 ligand CTLA4 [20]. Tregs are required for the maintenance of tolerance throughout the lifetime of the organism [21] and mutations in Foxp3 are known to cause acute autoimmune disorders in humans [22]. Foxp3+ Tregs accumulate within human gliomas during tumor progression and have been found to correlate with tumor grade [23]. Survival was improved when Tregs were depleted from GL261 tumor bearing mice using CD25 antibodies administered 7 days after tumor implantation and three times per week for 3 weeks thereafter [24]. Also, administration of CD25 depleting antibodies were also shown to improve survival when Page 5 of 39
8 administered in combination with DC transfected with tumor mrna in a GBM model [25]. We have recently developed a combined gene therapeutic approach aimed at engineering the tumor microenvironment to induce the migration into the tumor mass of APCs and elicit tumor cell death [26]. Our approach consists of expressing Fms-like tyrosine kinase 3 ligand (Flt3L) which induces dendritic cell (DC) infiltration into the brain parenchyma [27] in combination with the conditional cytotoxic gene Thymidine Kinase (TK) [26,28], which in the presence of GCV induces tumor cell death. This combined approach induces T cell dependent tumor regression [26]. We wished to assess the effects elicited by depletion of Tregs; on tumor progression in untreated GBM bearing mice and on T celldependent brain tumor regression elicited by Ad-Flt3L and Ad-TK treatment. Our data demonstrated that depletion of Tregs using the CD25 specific hybridoma PC61 induced tumor regression and long term survival when administered 15 days after tumor implantation, independent of tumor antigen specific T lymphocytes. In combination with intratumoral delivery of Ad-Flt3L and Ad-TK, however, we found that PC61 administration 24 days after tumor implantation (7 days after treatment) completely suppressed adaptive immune responses against GL26 tumor antigens. In addition to Tregs, CD25 is also expressed on the cell surface of precursor B and T lymphocytes and a mature subpopulation of DC [29] and is also upregulated on the cell surface of all activated T lymphocytes and B lymphocytes [30]. In our model, administration of CD25- antibodies also eliminated activated, CD25+ T lymphocytes and prevented clonal expansion of tumor antigen specific T cells. Our data suggest that the use of PC61 aiming Page 6 of 39
9 at Treg depletion could reduce the efficacy of immunotherapeutic regimes by suppressing activation and clonal expansion of tumor antigen specific T lymphocytes. Page 7 of 39
10 Results Syngeneic intracranial GBM tumors are densely infiltrated with Immune cells, including Tregs. Accumulation of Foxp3+ Tregs in human gliomas correlates with the grade of the tumor and patient survival [23]. Accumulation of Foxp3+ Tregs in syngeneic mouse gliomas has also been described and depletion of Tregs with CD25-specific immunoglobulins can induce tumor regression and improve survival in these preclinical models [24,31,32]. In order to investigate whether Treg depletion could improve therapeutic outcome in combination with immunotherapy/gene therapy, we first established whether Tregs infiltrated into the syngeneic mouse glioma arising from the intracranial implantation of GL26 cells into the brain striatum. Implantation of syngeneic GL26 cells reproducibly led to the linear growth of tumors (R2>0.99) with a mean tumor volume of approximately 0.5mm3 at day 15 and 30 times larger (15mm3) at day 24 (Fig. 1A). These tumors exhibit profuse infiltration of CD45+ and F4/80+ cells, which are evident throughout the tumor mass and also at the borders (Fig 1B). Immune cell infiltration into the tumors was also assessed by flow cytometry 24 days after tumor implantation (Fig. 1 C). We detected tumor infiltrating mdc (CD11c+ CD45+ I-Ab+, Fig. 1Ci) and MΦ (CD11b+ CD45+ I-Ab+, Fig. 1Cii) that represented 3.5% and 19% of the total number of CD45+ immune cells present in the tumor respectively. Lymphocytes were also identified and constituted ~80% of the total number of CD45+ immune cells infiltrating the tumors (Fig. 1 C iii-vi). These included CD4+ T cells (CD3ε+ CD4+ CD8a-, 26%), CD8a+ T cells (CD3ε+ CD4- CD8a+, 18%), Foxp3+ Tregs (CD3ε+ CD4+ Foxp3+, 8.4%), NK cells (CD3ε- NK1.1+ CD45+, 18%), NK-T cells (CD3ε+ NK1.1+ CD45+, 7%) and B cells (CD3ε- CD19+ CD45+, 5%). The presence of CD4+, CD8a+, CD19+ lymphocytes as well as CD205 mdc Page 8 of 39
11 were also observed by immunofluorescence (Fig. 1 D). In addition, large numbers of lymphocytes that were immunoreactive for CD25 were observed within the tumor using confocal microscopy (Fig. 1 D) and flow cytometry (CD3ε+ CD25+ CD45+) (Fig. 1 E, F). Moreover, the percentage of CD3ε+ T cells that expressed cell surface CD25 was ~40% of the total number of tumor infiltrating T cells and was greatly elevated in the draining (cervical) lymph node (dln) (p<0.05) and tumor (p<0.01) when compared with the spleen of tumor bearing mice (Fig. 1 E). Depletion of Tregs using PC61 induces brain tumor regression but also reduces T cells in tumor and dln. Considering that we detected extensive infiltration of T regs within the intracranial GL26 tumors, we aimed to deplete this immune cell population in order to determine their effect on tumor cell progression and on anti-tumor immune response induced by a T-cell dependent immunotherapeutic approach, i.e. Ad-Flt3L/TK. The rat IgG1 hybridoma PC61 was found to bind with mouse high affinity IL-2 receptor (CD25) [33] and in vivo administration of PC61 to mice causes the depletion of Tregs for more than a week [32,34]. Thus, we used this antibody to induce T reg depletion in vivo in a syngeneic mouse intracranial glioma model. We first determined whether PC61 would affect tumor cell viability and growth in vitro and in vivo. Incubation of GL26 cells with PC61 did not affect GL26 cell viability (Fig. 2A) or proliferation in vitro (Fig. 2B). We then administered PC61 or isotype control IgG to tumor-bearing athymic nu/nu mice, which have been shown to be deficient in T regs [25,35]. Tallying with other reports [25], we found that tumor growth in T reg deficient nu/nu immune deficient mice was not affected Page 9 of 39
12 by PC61; both isotype control or PC61-injected mice succumbed due to tumor burden days after tumor implantation. After ruling out any direct effect of PC61 on tumor cell growth we studied the effect of T reg depletion in wild type C57/B6 mice bearing intracranial GL26 glioma. The experimental paradigm used is depicted in Fig. 3A. Depletion of Tregs 15 days after tumor cell implantation significantly increased the number of long term survivors with 40% of mice were still alive 150 days later (p<0.05, Fig. 3B). This was more than 5 times longer than the mean survival of control tumor bearing mice (Fig. 3B). No significant increase in long term survival was observed when Tregs were depleted in larger tumors (24 days) (p>0.05) and only 10% of mice survived long term from this group (Fig. 3B). Interestingly, we did not observe any DTH responses when we injected irradiated GL26 cells into the footpad of long term survivors from Treg depleted mice (Fig. 3C). In order to assess the effects of treatment with PC61 in vivo, we analyzed the presence of Foxp3+ CD4+ Tregs infiltrating the GBM mass as well as in the draining lymph nodes and the spleen after intraperitoneal injection of PC61 (days 15 and 24) or the rat IgG1 isotype control (day 15 days) into tumor bearing mice. PC61 injection on day 15 led to a 9 fold reduction (p<0.001) in the number of tumor infiltrating Tregs when measured using flow cytometry 12 days later (day 27), and injection of PC61 on day 24 led to the almost complete depletion of Tregs (p<0.001) in the tumor 3 days later (day 27) (Fig. 3D). As expected, peripheral Treg populations in the draining lymph nodes (Fig. 3E) and spleens (Fig. 3F) were also significantly reduced compared with isotype treated controls (p<0.001). Interestingly, we observed a 3 fold decrease in the absolute percentage of CD4+ T cells (Fig. 4A) and CD8a+ T cells (Fig. 4B) infiltrating into the tumor after administration of PC61. Furthermore, PC61 significantly depleted populations of CD4+ T Page 10 of 39
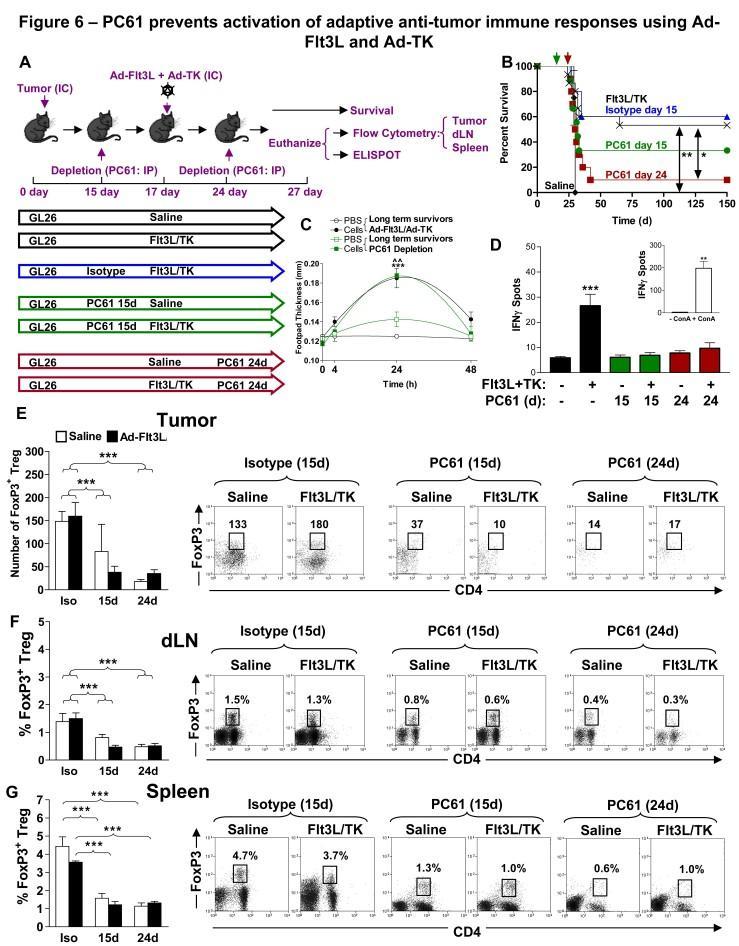
13 cells (p<0.05, Fig. 4C) and CD8+ T cells (p<0.01, Fig. 4D) in the tumor draining lymph nodes. There was no change noted in the percentages of CD4+ T cells and CD8a+ T cells in the spleen (p>0.05, Fig. 4E-F) and MΦ and DC remained unchanged in tumors and draining lymph nodes although increased slightly in spleen (Fig. 5). Treatment with PC61 prevents activation of adaptive anti-tumor immune responses and inhibits tumor regression when used in combination with Ad-Flt3L and Ad-TK We also aimed to investigate the effects of depletion of Tregs using an anti-cd25 immunoglobulin on the efficacy of the T cell-dependent immunotherapy mediated by intratumoral delivery of Ad-Flt3L and Ad-TK [26,36]. Activated CD4+ and CD8+ T lymphocytes upregulate cell surface CD25 after initial binding of the TCR with antigen displayed on MHC [29,30] and this might explain the apparent decrease in T cells that was observed in tumors (Fig. 4A-B) and dln (Fig. 4C-D) following administration of PC61. To investigate this further, and determine whether elimination of Tregs using PC61 could adversely affect T cell dependent immunotherapy of GBM, we implanted tumors in the striatum on day 0 and mice were treated with Ad-Flt3L and Ad-TK 17 days later, whilst PC61 or isotype control immunoglobulins were administered to groups on day 15 or day 24 (Fig. 6A). When we injected Ad-Flt3L and Ad-TK into the tumor on day 17 (when the tumor was 1mm3 in size (Fig. 1A) we observed a robust increase in survival with 50% of mice alive 150 d later (p<0.01, Fig. 6B) that was not adversely affected by administration of rat IgG1 isotype control (p>0.05). PC61 administered 2 days before injection of Ad-Flt3L and Ad-TK reduced survival to 30%, although this was not statistically different from isotype treated controls (p>0.05, Fig. 6B). However, when we treated mice with Ad-Flt3L and Ad-TK on day 17 and depleted Tregs on day 24, we Page 11 of 39
14 found that long term survival was significantly reduced compared with mice that did not receive PC61 (p<0.05, Fig. 6B). Only 10% of tumor bearing mice survived 150 days later, suggesting that administration of PC6 17 d after intratumoral delivery of Ad-Flt3L and Ad-TK adversely affects T cell dependent brain tumor regression. In long term survivors after treatment with Ad-Flt3L and Ad-TK, a DTH response to irradiated GL26 cells in the footpad was observed when mice had been administered either PC61 (p<0.01) or isotype controls (p<0.001) (Fig. 6C). Moreover, treatment of tumor bearing mice with Ad-Flt3L and Ad-TK induced a robust increase in the total number of tumor responsive T cells that secreted IFNγ when co-incubated with BMDC loaded with GL26 cell extracts (p<0.001, Fig. 6D). Interestingly we did not observe any increase in IFNγ secreting T lymphocytes in response to BMDC loaded with GL26 cell extracts when PC61 was injected either prior to (15 days) or post (24 days) treatment using Ad-Flt3L and Ad-TK (p>0.05, Fig. 6D). The number of tumor infiltrating Tregs was reduced after systemic delivery of PC61 (p<0.001, Fig. 6E) and the percentage of Tregs was also significantly reduced in dln and spleen, (p<0.001, Fig. 6F-G) irrespective of whether the mice were treated with saline or with Ad-Flt3L and Ad-TK. Treatment with PC61 prevents increases in tumor infiltrating T cells and MΦ but not DCs following treatment with Ad-Flt3L and Ad-TK In agreement with others, our data indicate that systemic delivery of PC61 causes the depletion of Foxp3+ Tregs [24,32,34]. Our results demonstrate that PC61 interferes with the induction of adaptive immune responses against brain tumor antigen. Further, administration of PC61 depleted 60% of spleen CD25+ T cells (Fig. 7A). Since clonal expansion of tumor antigen specific T cells induced by Ad-Flt3L-TK was inhibited by Page 12 of 39
15 PC61 administration, we next determined whether PC61 affects the influx of CD4+ and CD8a+ T cells into the tumor, the draining lymph nodes and the spleen after treatment with Ad-Flt3L and Ad-TK (Fig. 7 B). The total number of CD45+ tumor infiltrating immune cells increased 10 d after intratumoral delivery of Ad-Flt3L and Ad-TK (p<0.001, Fig. 7 C), as did the numbers of CD4+ T cells (p<0.001, Fig. 7 D) and CD8a+ T cells (p<0.001, Fig. 7 E). This observation was consistent with the induction of adaptive immune responses against tumor antigen by intratumoral delivery of Ad-Flt3L and Ad- TK. Co-administration of PC61 either on day 15 or day 24, however, completely blocked the Ad-Flt3L and Ad-TK dependent increase in total numbers of tumor infiltrating immune cells (p>0.05, Fig. 7 C), and CD8a+ T cells (p>0.05, Fig. 7 E). Increased tumor infiltrating CD4+ T cells following treatment with Ad-Flt3L and Ad-TK was only inhibited when PC61 was administered on day 24 (p>0.05, Fig. 7 D). No changes were observed in the number of T cells in the dln (Fig. 7 F-G) or spleen (Fig. 8). Moreover, increase in numbers of tumor infiltrating macrophages (p<0.01, Fig. 9 A) was also blocked by PC61 administration but infiltration of mdcs into tumors after administration of Ad-Flt3L and Ad-TK (p<0.001, Fig. 9B) was not suppressed. Together, our data suggest that infiltration of mdc was an early event, probably induced by expression of Flt3L, whereas infiltration of T cells occurred later and was dependent on the successful initiation of adaptive immune responses against tumor antigens. MΦ increased in dln and spleen, while mdc only increased significantly in the spleen (Fig. 9 C-F). Page 13 of 39
16 Discussion Elimination of Tregs using depleting antibodies in combination with existing immunotherapies has been proposed to enhance anti-tumor immunity [37]. Herein we show in a syngeneic mouse model of GBM that depletion of Tregs using PC61, a CD25 specific immunoglobulin can also deplete activated T cells, and in doing so can interfere with the clonal expansion of tumor antigen specific T cells during immunotherapy. In agreement with previous reports [32,34,38,39], we observed that tumors, and dln were heavily infiltrated with CD25+ T cells. Previously, it was shown that administration of 250 μg CD25-depleting immunoglobulins 3 days before tumor implantation [31] and long-term administration of CD25-depleting immunoglobulins after tumor implantation (0.5μg / injection, beginning 1 week after tumor implantation and given three times per week for 3 weeks) [24] can induce long term survival in about half of GL261 tumor bearing C57BL/6 mice. To determine the role of Tregs in tumor regression in a clinically more relevant scenario of a large, pre-established tumor mass, we gave a single dose of PC61 hybridoma at two time points, either day 15 when the tumor was approximately 0.5mm3 or day 24 when the tumor was 15mm3. Herein we show that elimination of CD25+ T lymphocytes by a single injection of PC61 15 days after tumor implantation mediated tumor regression and improved long term survival in almost 50% of mice. However, Treg depletion increased the survival of tumor bearing mice only if depletion was done when the tumors were very small, i.e., 0.45mm3. These findings are in agreement with other reports that show an anti-tumor effect of T reg depletion in mouse models of neuroblastoma [40], leukemia, fibrosarcoma and myeloma [34]. We observed that the antitumor effects of Treg depletion were not mediated by a T cell dependent antitumor immune response. Our results show that Treg depletion did not generate tumor- Page 14 of 39
17 specific T cells as assed by ELISPOT assay nor did it induce anti-tumor immunological memory. These data suggest that the innate immune system could play a role in the antitumor effect elicited by Treg depletion in this model. In fact, T regs have been shown to inhibit the activity of the innate immune system by directly suppressing the cytotoxic effect of NK cells [41]. This inhibitory mechanism is dependent on TGF-β and cell-cell contacts [41-44]. Since we found that NK cells comprise ~20% of the immune cells that infiltrate GL26 intracranial tumor, the cytotoxic activity of these cells could be involved in the antitumor effects observed after T reg depletion at day 15 after tumor implantation. Interestingly, no increase in survival was observed when PC61 was administered to tumor bearing mice 24 days after tumor implantation, this was probably due to the size of the tumor and the relatively short life expectancy of these mice (<5 d to death). It is likely that the tumor burden will be an important factor in the clinic when patients are treated by depletion of Tregs, we would expect from these data that Treg depletion might show efficacy when treating minimal, residual tumors. Further, we wished to determine whether depletion of Tregs with CD25-specific immunoglobulins would affect survival when implemented in combination with intratumoral delivery of Ad-Flt3L and Ad-TK. Along these lines, it has been reported that depletion of Tregs using PC61 improved survival when GBM bearing mice were vaccinated with DC transfected with tumor cell mrna [25]. However, that study assessed the prophylactic, not therapeutic effects of PC61 against brain tumors; since tumor cells were implanted 10 days after depletion of Tregs and 7 days after vaccination with DC pulsed with tumor cell mrna [25]. In our model, tumors were already well established (17 days) prior to intratumoral delivery of Ad-Flt3L and Ad-TK to induce T cell-dependent tumor regression. Administration of PC61, 2 days before treatment (15 Page 15 of 39
18 days after tumor implantation) induced tumor regression in about 50% of mice which was not significantly different to treatment with Ad-Flt3L and Ad-TK alone. However, when PC61 was administered 7 days after injection of Ad-Flt3L and Ad-TK, therapeutic improvement in survival was almost completely abolished, due to the depletion and/or functionally inactivated tumor antigen specific T lymphocytes that had become activated in response to the therapy. Our results highlight that depletion of Tregs by targeting CD25 might interfere with the induction of adaptive immune responses against brain tumor antigen. A cell surface marker specific for Tregs that could be targeted with immunoglobulins to specifically deplete Tregs would beneficial to overcome immunological tolerance/ignorance to brain tumor antigens. Unfortunately, the cell surface proteins on Tregs (for example; CD25, CTLA4) are also expressed on other immune cells such as activated T lymphocytes [45]. CTLA4 has also been widely studied as a target to specifically deplete Tregs. Intracellular CTLA4 is expressed at high levels in Tregs and is also expressed at much lower levels on the cell surface of resting Tregs. Activation of Tregs stimulates the upregulation of CTLA4 on their cell surface and may thus be a useful target to specifically inhibit Tregs. Depletion of Tregs using immunoglobulins against CTLA4 has been found to improve survival in mouse models of glioma [25,31]. CTLA4 is also expressed in the ER of helper and effector T lymphocytes and cell surface expression is upregulated 24 to 48 h after activation of TCR [46]. It remains to be investigated, however, whether CTLA4 depletion might also interfere with the clonal expansion of tumor-antigen specific T lymphocytes. Page 16 of 39
19 Our results suggest that while elimination of Tregs might be sufficient to eliminate smaller tumors, the depletion of Tregs using CD25-targetting strategy might interfere with the clonal expansion of tumor antigen specific T lymphocytes if used in combination with another immunotherapeutic strategy. Foxp3 is currently the only marker that has been identified that is exclusively expressed on Tregs and not on other immune cells. However, Foxp3 is intranuclear and therefore cannot be easily depleted using immunoglobulins. Further study on the mechanism of action of Foxp3 and/or cell surface Treg specific markers might highlight molecular targets that could be useful to specifically eliminate Tregs. Our results indicate that clinical trials which propose to utilize CD25 depleting antibodies, or similar Treg depleting approaches, must carefully monitor the effects on normal activated T cells, and adjust dosing schedules accordingly. Further, the use of Treg depleting strategies will only be useful in the context of minimal residual disease. Materials and Methods Adenoviral vectors, Cell Lines, plasmids, and reagents We used first generation, recombinant adenoviral vectors (serotype 5) expressing Herpes Simplex Virus Type I Thymidine Kinase (Ad-TK) [26,28] and Fms-like tyrosine kinase 3 ligand (Ad-Flt3L)[27,47] in this study. The methods for adenoviral generation, purification, characterization and scale up have been previously described by our lab[26,28,47]. GL26 cells were obtained from ATCC (Manassas, VA) and were grown in DMEM culture media supplemented with 10% FCS and 1% Pen-Strep and passaged routinely every 2-3 days. Ascites fluid from the PC61 hybridoma was purchased from Page 17 of 39
20 BioExpress Cell Culture Services (West Lebanon, NH) and isotype rat IgG1 control was purchased from Sigma (St Louis MO). Foxp3-FITC was purchased from ebioscience, primary antibodies for immunofluorescence and immunohistochemistry (CD45, F4/80, CD205, CD4, CD8, CD19, CD25 and GFAP) were all purchased from Serotec and biotinylated secondary antibodies were purchased from Dako (Denmark) and fluorescent tagged secondary antibodies were purchased from Invitrogen (Carlsbad, CA). All antibodies used for flow cytometry were purchased from BD Pharmingen (San Diego, CA). Recombinant human Annexin V-FITC was purchased from BenderMedSystems (Vienna, Austria) and the BrdU DNA labeling and detection kit was procured from Exalpha Biologicals Inc (Maynard MA). All other chemicals were purchased from Sigma. Mouse glioblastoma model Wild type C57BL/6J mice were purchased from Jackson Laboratories (Bar Harbor, ME, USA). To establish a syngeneic tumor model, we used GL26 cells that were derived from a chemically induced glioma in a female C57BL/6 mouse. Female mice (6-12 weeks) were anesthetized with an IP injection of Ketamine (75 mg/kg) and Medetomidine (0.5 mg/kg), placed in a stereotactic apparatus modified for mice, and a hole was drilled in the skull. 20,000 GL26 cells in 0.5 µl PBS were deposited unilaterally into the right striatum (+0.5 mm AP, +2.2 mm ML, -3.0 mm DV from bregma) using a 5µl Hamilton syringe with a 33-gauge needle. The needle was left in place for 3 minutes prior to removal to allow tumor cells to settle at the injection site. Mice were resuscitated using atipamazole (IP) and administered buprinex (SQ dose) as an analgesic. 17 days after tumor implantation and using the same stereotactic coordinates, mice received an intratumoral Page 18 of 39
21 injection of 5x10⁷ iu Ad-Flt3L and 5x10⁷ iu Ad-TK in 1 µl saline. Alternatively, mice were injected with 1 µl saline as a control. Mice treated with Ad-Flt3L and Ad-TK also received 25 μg/kg GCV (IP, Roche, Boulder CO) twice daily for 7 days starting the day after vector injection. CD25+ Tregs were depleted by a single ip injection of 1mg ascites fluid (600 µl) from the PC61 hybridoma. Alternatively GL26 tumors were implanted into female T reg deficient athymic nude mice (Simonsen labs) and PC61 or control IgG was administered ip 15 days later as described. All animals were housed in specific pathogen free environment, and were closely monitored All animal experiments were performed after prior approval by the Institutional Animal Care and Use Committee at Cedars-Sinai Medical Center and conformed to the policies and procedures of the Cedars-Sinai Medical Center Comparative Medicine Department. Mice used in this study were monitored for signs of moribund behavior and euthanized when their health status reached criteria established by the guidelines of the IACUC. Animals were euthanized at first signs of moribund behavior, by terminal perfusion with oxygenated, heparinized Tyrode s solution (132 mm NaCl, 1.8 mm CaCl2, 0.32 mm NaH2PO4, 5.56 mm glucose, 11.6 mm NaHCO3, and 2.68 mm KCl) and were fixed with 4%PFA in PBS for immunofluorescence and immunohistochemistry. Immunohistochemistry and Immunofluorescence Fifty micrometer-thick coronal sections were cut through the striatum using a vibratome. Free-floating immunohistochemistry was performed to detect inflammatory and immune cell markers. Endogenous peroxidase was inactivated with 0.3% hydrogen peroxide (only for IHC). Sections were subjected to antigen retrieval by incubation in 10mM Citrate at 60ºC for 10 minutes before washing and blocked with 10% horse serum (Life Technologies, Carlsbad, CA) in TBS + 0.5% Triton X-100 (Sigma) before incubating for Page 19 of 39
22 72 h with primary antibodies CD45 (1:1000), F4/80 (1:1,000), CD205 (1:500), CD4 (1:1000), CD8a (1:5,000), CD19 (1:1000), CD25 (1:500) and GFAP (1:1000). Biotinylated secondary antibodies for IHC (Dako) were incubated with sections (1:1,000 in 1% horse serum in TBST) for 4 h and detected using the Vectastain Elite ABC horseradish peroxidase method (Vector Laboratories, Burlingame, CA). Immunoreactive cells were developed with diaminobenzidone (Sigma) and glucose oxidase (Sigma). Sections were mounted on gelatinized glass slides and dehydrated through graded ethanol solutions. Secondary antibodies for IF (Alexa-488 conjugated) were purchased from Molecular probes and sections were stained for 4 h (1:1000 in 1% horse serum in TBST). Sections were stained with DAPI (1µg/ml in PBS) for 20 minutes and mounted on glass slides. Prolong Gold anti-fade reagent (Invitrogen) was used to attach coverslips. A Zeiss Axioplan 2 microscope was used to visualize IHC staining. Flow Cytometry To isolate tumor infiltrating immune cells, mice were perfused with 100 ml heparinized Tyrode's Solution 7 days after intratumoral injection of virus or saline. Brains were separated from the meninges and removed from the skull. The tumor was carefully dissected and removed, taking care to avoid the ventricles. The tumor tissue was then diced with a razor blade before homogenizing in RPMI medium using a glass Tenbroeck homogenizer. Mononuclear cells were purified from brain tissue by centrifugation (600xg) through a Percol gradient; mononuclear cells migrate to the interface between 30% and 70% Percol. Cells were counted and labeled with antibodies for analysis by flow cytometry. Splenocytes were harvested and removed of red blood cells using ACK solution (0.15 mm NH4Cl, 10 mm KHCO3, and 0.1 mm disodium EDTA at ph 7.2). Page 20 of 39
23 Lymph nodes were homogenized in a Tenbroeck homogenizer. Immune cells were labeled with antibodies in cell surface staining buffer (0.1M PBS, w/o Ca++, Mg++, with 1% FBS, 0.1% Sodium Azide) for analysis by flow cytometry using a FACScan flow cytometer (Beckton Dickenson). To analyze Foxp3+ Tregs (CD3+ CD4+ Foxp3+), we stained with CD3-PE, CD4-PerCP and Foxp3-FITC. CD25+ T cells were stained with CD3-PE, CD4-PerCP, CD25-Biotin and streptavidin-fitc (BD-Pharmingen). mdc (CD11c+ MHC II+ CD45+) were stained with CD11c-PE, MHC II-FITC and CD45- PerCP. Macrophages (CD11b+ MHC II+ CD45+) were stained with CD11c-PE, MHC II- FITC and CD45-PerCP. CD4+ and CD8a+ T lymphocytes were stained with CD3-PE, CD4-PerCP and CD8a-FITC. Other immune cells analyzed during this study (not shown) were NK cells (CD3- CD161+ CD45+), NK-T cells (CD3+ CD161+ CD45+), and B lymphocytes (CD3- CD19+ CD45+). Analysis was performed using between 5 and 10 mice per group. All percentages were calculated based on the total number of CD45+ immune cells in the tumor. For example, to calculate the percentage of mdc in the tumor, the total number of gated mdc (CD11c+ MHCII+ CD45+) were counted and the percentage of mdc in the tumor was determined by dividing the total number of mdc by the total number of CD45+ cells in the tumor. In Fig. 1 E and F we calculated the percentage of Tregs based on the total number of T cells (number of CD25+CD4+ cells/number of CD3ε+ cells). Annexin V vs Propidium Iodide staining Annexin V-FITC and propidium iodide were used to detect apoptosis by flow cytometry as described previously [48]. Briefly cells were growin in 96 well plates (20,000 cells per well) and incubated with 100 μg/ml PC61 or 100 μg/ml rat IgG1 isotype control for 48 h. Page 21 of 39
24 Cells were then harvested gently using Trypsin and resuspended in 100 μl Annexin V Binding Buffer (150mM NaCl, 18mM CaCl2, 10mM HEPES, 5mM KCl, 1mM MgCl2). Cells were incubated at room temperature (21 C) for 5 minutes in the dark, before adding propidium iodide (5 μg/ml) for 1 minute. Cells were analyzed on a FACScan flow cytometer (BD Biosciences). Cell Quest software (BD Biosciences) was used to analyze the data. BrdU labeling and detection GL26 cell proliferation was assessed using a BrdU colorimetric ELISA (ExAlpha Biologicals, Inc.). Briefly, GL26 cells were incubated in 96 well plates at 20,000 cells per well. 100 μg/ml PC61 or the rat IgG1 isotype control were added to wells and cells were incubated for 24 h. 1x BrdU was added to the wells for 4 h and BrdU incorporation into newly synthesized DNA strands was detected exactly as recommended by the manufacturer. ELISPOT 105 splenocytes from tumor bearing mice (wild type C57BL/6 or TLR2-/-) treated with saline or Ad-Flt3L and Ad-TK were prestimulated on a monolayer of GL26 cells (fixed in 1% PFA for 15 min at RT) in the presence of 10 U/ml IL-2 for 14 days. Fresh IL-2 was added every 4th day. BMDC (CD11c+, CD45+, MHC II +) were cultured as described previously[49]. Briefly, bone marrow was flushed out from the long bones of mice using 0.5 ml RPMI media. A single cell suspension was created by pipetting up and down with a P1000 pipette. BMDC were cultured from hematopoietic stem cell precursors by supplementing the media with 10 ng/ml Flt3L conditioned media. Fresh GMCSF and IL4 Page 22 of 39
25 (10ng/ml each) was added every 2-3 days. By day 7, >90% of loosely adherent cells were CD11c+ (data not shown). Loosely adherent cells were removed and were loaded with 100 μg/ml GL26 cell extract (prepared fresh by freeze/thawing) for 6 h at 37 before washing 3 times with PBS. 1x10⁵ stimulator cells (BMDC loaded with GL26 or LLc1 cell extract) were incubated with 1x10⁵ responder cells (prestimulated T cells) in triplicate for 48 h on precoated 96 well mouse IFNγ ELISPOT plates. IFNγ spots were developed as recommended by the manufacturer s detailed instructions (R&D Systems). ConA (1ug/ml, 4 h) stimulation of WT and TLR2-/- splenocytes was used as a control. Delayed Type Hypersensitivity (DTH) Test DTH test was performed on long-term survivor mice 60 d after tumor implantation as follows. 50,000 irradiated GL26 cells (30 Gy using a 137Cs source) were injected in 100 μl PBS in the right rear footpad (right) or 100 μl PBS control in the left rear footpad (left) of mice. The thickness of the footpad (left and right) was recorded 0 h (immediately prior to depositing cells in the footpad), 4 h, 24 h and 48 h after injection of irradiated cells or PBS using a vernier microcalipers. Statistical Analysis Kaplain-Meier survival curves were analyzed using the logrank test (GraphPad Prism Version 3.03). One- or Two-way ANOVA followed by Tukey s test or unpaired twotailed Student s t test were used to analyze all other data as indicated in the results and the figure legends (NCSS software; NCSS, Kaysville, UT). When data failed normality test or Levene equal-variance test, they were square-root transformed. Results were Page 23 of 39
26 expressed as the mean ± SEM. A p value <0.05 was considered the cut off for significance. All experiments were performed at least twice. Acknowledgements This work is supported by National Institutes of Health/National Institute of Neurological Disorders & Stroke (NIH/NINDS) Grant 1R01 NS , Minority Supplement NS ; 1R21-NSO ; 1UO1 NS , 1 RO3 TW to M.G.C.; NIH/NINDS Grants 1 RO1 NS ; RO1 NS , U54 NS and 1R21 NS to P.R.L. The Bram and Elaine Goldsmith and the Medallions Group Endowed Chairs in Gene Therapeutics to PRL and MGC, respectively, The Linda Tallen & David Paul Kane Foundation Annual Fellowship and the Board of Governors at CSMC. M.C is supported by NIH/NINDS 1F32 NS We thank S. Melmed, R. Katzman, and D. Meyer for their support and academic leadership. The authors have no conflicting financial interests. Page 24 of 39
27 References 1. Ohgaki H, Kleihues P (2005) Epidemiology and etiology of gliomas. Acta Neuropathol (Berl) 109: Behin A, Hoang-Xuan K, Carpentier AF, Delattre JY (2003) Primary brain tumours in adults. Lancet 361: McLendon RE, Halperin EC (2003) Is the long-term survival of patients with intracranial glioblastoma multiforme overstated? Cancer 98: Curtin JF, King GD, Candolfi M, Greeno RB, Kroeger KM, et al. (2005) Combining cytotoxic and immune-mediated gene therapy to treat brain tumors. Curr Top Med Chem 5: King GD, Curtin JF, Candolfi M, Kroeger K, Lowenstein PR, et al. (2005) Gene therapy and targeted toxins for glioma. Curr Gene Ther 5: Barzon L, Zanusso M, Colombo F, Palu G (2006) Clinical trials of gene therapy, virotherapy, and immunotherapy for malignant gliomas. Cancer Gene Ther 13: Skog J (2006) Glioma-specific antigens for immune tumor therapy. Expert Rev Vaccines 5: Prins RM, Liau LM (2004) Cellular immunity and immunotherapy of brain tumors. Front Biosci 9: Wykosky J, Gibo DM, Stanton C, Debinski W (2005) EphA2 as a novel molecular marker and target in glioblastoma multiforme. Mol Cancer Res 3: Dunn GP, Old LJ, Schreiber RD (2004) The three Es of cancer immunoediting. Annu Rev Immunol 22: Page 25 of 39
28 11. Dunn GP, Old LJ, Schreiber RD (2004) The immunobiology of cancer immunosurveillance and immunoediting. Immunity 21: Galea I, Bechmann I, Perry VH (2007) What is immune privilege (not)? Trends Immunol 28: Lowenstein PR (2002) Immunology of viral-vector-mediated gene transfer into the brain: an evolutionary and developmental perspective. Trends Immunol 23: Gomez GG, Kruse CA (2006) Mechanisms of malignant glioma immune resistance and sources of immunosuppression. Gene Ther Mol Biol 10: Whiteside TL (2006) Immune suppression in cancer: effects on immune cells, mechanisms and future therapeutic intervention. Semin Cancer Biol 16: Liau LM, Prins RM, Kiertscher SM, Odesa SK, Kremen TJ, et al. (2005) Dendritic cell vaccination in glioblastoma patients induces systemic and intracranial T-cell responses modulated by the local central nervous system tumor microenvironment. Clin Cancer Res 11: Yamanaka R, Abe T, Yajima N, Tsuchiya N, Homma J, et al. (2003) Vaccination of recurrent glioma patients with tumour lysate-pulsed dendritic cells elicits immune responses: results of a clinical phase I/II trial. Br J Cancer 89: Tang J, Flomenberg P, Harshyne L, Kenyon L, Andrews DW (2005) Glioblastoma patients exhibit circulating tumor-specific CD8+ T cells. Clin Cancer Res 11: Carpentier AF, Meng Y (2006) Recent advances in immunotherapy for human glioma. Curr Opin Oncol 18: Page 26 of 39
29 20. Qu Y, Zhao Y (2007) Regulatory CD4(+)CD25(+) T-cells are controlled by multiple pathways at multiple levels. Int Rev Immunol 26: Kim JM, Rasmussen JP, Rudensky AY (2007) Regulatory T cells prevent catastrophic autoimmunity throughout the lifespan of mice. Nat Immunol 8: Wildin RS, Ramsdell F, Peake J, Faravelli F, Casanova JL, et al. (2001) X-linked neonatal diabetes mellitus, enteropathy and endocrinopathy syndrome is the human equivalent of mouse scurfy. Nat Genet 27: El Andaloussi A, Lesniak MS (2007) CD4+ CD25+ FoxP3+ T-cell infiltration and heme oxygenase-1 expression correlate with tumor grade in human gliomas. J Neurooncol 83: El Andaloussi A, Han Y, Lesniak MS (2006) Prolongation of survival following depletion of CD4+CD25+ regulatory T cells in mice with experimental brain tumors. J Neurosurg 105: Fecci PE, Sweeney AE, Grossi PM, Nair SK, Learn CA, et al. (2006) Systemic anti- CD25 monoclonal antibody administration safely enhances immunity in murine glioma without eliminating regulatory T cells. Clin Cancer Res 12: Ali S, King GD, Curtin JF, Candolfi M, Xiong W, et al. (2005) Combined immunostimulation and conditional cytotoxic gene therapy provide long-term survival in a large glioma model. Cancer Res 65: Curtin JF, King GD, Barcia C, Liu C, Hubert FX, et al. (2006) Fms-like tyrosine kinase 3 ligand recruits plasmacytoid dendritic cells to the brain. J Immunol 176: Page 27 of 39
30 28. Dewey RA, Morrissey G, Cowsill CM, Stone D, Bolognani F, et al. (1999) Chronic brain inflammation and persistent herpes simplex virus 1 thymidine kinase expression in survivors of syngeneic glioma treated by adenovirus-mediated gene therapy: implications for clinical trials. Nat Med 5: Taniguchi T, Minami Y (1993) The IL-2/IL-2 receptor system: a current overview. Cell 73: Lowenthal JW, Zubler RH, Nabholz M, MacDonald HR (1985) Similarities between interleukin-2 receptor number and affinity on activated B and T lymphocytes. Nature 315: Grauer OM, Nierkens S, Bennink E, Toonen LW, Boon L, et al. (2007) CD4+FoxP3+ regulatory T cells gradually accumulate in gliomas during tumor growth and efficiently suppress antiglioma immune responses in vivo. Int J Cancer 121: Sutmuller RP, van Duivenvoorde LM, van Elsas A, Schumacher TN, Wildenberg ME, et al. (2001) Synergism of cytotoxic T lymphocyte-associated antigen 4 blockade and depletion of CD25(+) regulatory T cells in antitumor therapy reveals alternative pathways for suppression of autoreactive cytotoxic T lymphocyte responses. J Exp Med 194: Lowenthal JW, Corthesy P, Tougne C, Lees R, MacDonald HR, et al. (1985) High and low affinity IL 2 receptors: analysis by IL 2 dissociation rate and reactivity with monoclonal anti-receptor antibody PC61. J Immunol 135: Onizuka S, Tawara I, Shimizu J, Sakaguchi S, Fujita T, et al. (1999) Tumor rejection by in vivo administration of anti-cd25 (interleukin-2 receptor alpha) monoclonal antibody. Cancer Res 59: Page 28 of 39
31 35. Sun Z, Zhao L, Wang H, Sun L, Yi H, et al. (2006) Presence of functional mouse regulatory CD4+CD25+T cells in xenogeneic neonatal porcine thymus-grafted athymic mice. Am J Transplant 6: King GD, Muhammad AK, Curtin JF, Barcia C, Puntel M, et al. (2007) Flt3L and TK gene therapy eradicate multifocal glioma in a syngeneic glioblastoma model. Neuro Oncol. 37. Blattman JN, Greenberg PD (2004) Cancer immunotherapy: a treatment for the masses. Science 305: El Andaloussi A, Lesniak MS (2006) An increase in CD4+CD25+FOXP3+ regulatory T cells in tumor-infiltrating lymphocytes of human glioblastoma multiforme. Neuro Oncol 8: Fecci PE, Mitchell DA, Whitesides JF, Xie W, Friedman AH, et al. (2006) Increased regulatory T-cell fraction amidst a diminished CD4 compartment explains cellular immune defects in patients with malignant glioma. Cancer Res 66: Johnson BD, Jing W, Orentas RJ (2007) CD25+ regulatory T cell inhibition enhances vaccine-induced immunity to neuroblastoma. J Immunother (1997) 30: Smyth MJ, Teng MW, Swann J, Kyparissoudis K, Godfrey DI, et al. (2006) CD4+CD25+ T regulatory cells suppress NK cell-mediated immunotherapy of cancer. J Immunol 176: Barao I, Hanash AM, Hallett W, Welniak LA, Sun K, et al. (2006) Suppression of natural killer cell-mediated bone marrow cell rejection by CD4+CD25+ regulatory T cells. Proc Natl Acad Sci U S A 103: Colombo MP, Piconese S (2007) Regulatory-T-cell inhibition versus depletion: the right choice in cancer immunotherapy. Nat Rev Cancer 7: Page 29 of 39
32 44. Ghiringhelli F, Menard C, Martin F, Zitvogel L (2006) The role of regulatory T cells in the control of natural killer cells: relevance during tumor progression. Immunol Rev 214: Yi H, Zhen Y, Jiang L, Zheng J, Zhao Y (2006) The phenotypic characterization of naturally occurring regulatory CD4+CD25+ T cells. Cell Mol Immunol 3: Alegre ML, Shiels H, Thompson CB, Gajewski TF (1998) Expression and function of CTLA-4 in Th1 and Th2 cells. J Immunol 161: Ali S, Curtin JF, Zirger JM, Xiong W, King GD, et al. (2004) Inflammatory and antiglioma effects of an adenovirus expressing human soluble Fms-like tyrosine kinase 3 ligand (hsflt3l): treatment with hsflt3l inhibits intracranial glioma progression. Mol Ther 10: Vermes I, Haanen C, Steffens-Nakken H, Reutelingsperger C (1995) A novel assay for apoptosis. Flow cytometric detection of phosphatidylserine expression on early apoptotic cells using fluorescein labelled Annexin V. J Immunol Methods 184: Inaba K, Inaba M, Romani N, Aya H, Deguchi M, et al. (1992) Generation of large numbers of dendritic cells from mouse bone marrow cultures supplemented with granulocyte/macrophage colony-stimulating factor. J Exp Med 176: Page 30 of 39
33 Figure Legends Figure 1. Intracranial GBM tumors are densely infiltrated with immune cells. (A) GL26 tumor volume 7, 14 and 21 days after implantion into the brain striatum of C57BL/6 mice was determined. Reactive astrocytic staining (GFAP+) was used to define the border of the tumor with non-malignant brain tissue. Representative sections of mouse brains bearing tumors implanted 7, 14 and 21 days previously and stained with GFAP are shown on the left. Tumor growth kinetics were essentially exponential over the time period analyzed with a doubling time of approximately 1.8 days. 5 mice were used to determine tumor volume at each time point. (B) Infiltration of immune cells in intracranial GL26 tumors. Brain sections from tumor bearing mice were stained with antibodies against CD45 (leukocytes) or F4/80 (macrophages/activated microglia). Representative Confocal images show immune cells (green) within the tumor mass and in the tumor borders. DAPI (blue) was used to stain nuclei. Yellow arrows indicate immunoreactive cells. T: tumor. (C) Tumor infiltrating immune cells were isolated from tumors 24 days after tumor implantation and analyzed using flow cytometry. (i) Dot plot of CD11c against I-Ab that was first gated for live CD45+ leukocytes. DC (CD11c+ CD45+ I-Ab+) are shown in the red box. (ii) Macrophages (MΦ) were assessed by gating live leukocytes with CD45, then plotting CD11b against I-Ab. The red box outlines the population of tumor infiltrating macrophages (CD11b+ CD45+ I-Ab+). (iii) T cells were stained with CD3ε-PE, CD4-PerCP and CD8a-FITC. The plot displays CD4 against CD8a when cells were first gated for CD3ε+ live leukocytes. CD4+ T cells and CD8a+ T cells are shown in red boxes. (iv) Tumor infiltrating Tregs were observed by staining with CD3ε-PE, CD4-PerCP and Foxp3-FITC. CD3ε+ live leukocytes were gated and dot Page 31 of 39
34 plots display Foxp3 against CD4 staining. The population of Tregs (CD4+ Foxp3+ CD3ε+) are shown in the red box. (v) NK and NK-T cells were visualized by gating live CD45+ leukocytes, then displaying NK1.1 against CD3ε. The population of tumor infiltrating NK cells (CD3ε- CD45+ NK1.1+) and NK-T cells (CD3ε+ CD45+ NK1.1+) are shown in red boxes. (vi) Tumor infiltrating B cells are visualized by gating for live leukocytes, then plotting CD45 against CD19. The population of B cells (CD19+ CD45+) is shown in a red box. The percentages of each immune cell population infiltrating the tumor with respect to the total number of tumor CD45+ cells is indicated in representative dot plots. (D) Nissl staining was used to visualize tumors in the brain. Tumors are dense in Nissl substance, so stain darker than normal brain tissue. Representative Confocal images show tumor infiltrating CD4+ T cells, CD8+ T cells, CD205+ mdcs, CD19+ B cells, and CD25+ immune cells (seen in green) and DAPI (blue) was used to visualize the nuclei. Yellow arrows indicate immunoreactive cells. (E) Flow cytometric analysis of the percentage of T cells that express CD25 in spleens, dln and tumors in mice bearing intracranial GL26 brain tumors 24 days after tumor implantation. (F) Representative dot plots of CD25 vs CD3ε in immune cells isolated from the spleen, LN and tumor. The percentages of CD25+ cells population with respect to the total number of CD3ε+ cells in the tumor, draining lymph nodes or spleen are indicated in representative dot plots. Figure 2. PC61 does not affect the viability or proliferation of GL26 cells in vitro or in vivo. (A) GL26 cells were incubated for 48 h with 100 μg/ml PC61 or 100 μg/ml rat IgG1 isotype control. Cells were then harvested and stained with Annexin V-FITC and Propidium Iodide to identify apoptotic cells. No significant increase in apoptosis was Page 32 of 39
35 noted when cells were incubated with PC61 or isotype control immunoglobulins compares with untreated controls (p>0.05). A large increase in apoptosis was observed when cells were incubated for 4 h with H2O2 (p<0.001). Error bars represent the standard error from 3 replicates and the assay was repeated 3 times. One Way ANOVA with Tukey s post test was used to calculate significant differences (***p<0.001). (B) Proliferation of GL26 cells was measured by detecting BrdU incorporation into DNA. No significant difference in proliferation was observed (p>0.05) when cells were incubated with PC61 (rat IgG1αCD25) compared with isotype controls (rat IgG1), or untreated cells (***p<0.001 compared to negative (no cells) control, ns = non significant). (C) Athymic nu/nu mice (Balb/c background) were challenged with a single intracranial injection of GL26 cells and treated 15 d later with 1mg either PC61 or isotype control immunoglobulins injected i.p. Survival was monitored and mice were euthanized when moribund. No significant difference in survival was observed using a log rank test (p>0.05) (n=5). Figure 3 Depletion of Tregs 15 days post-tumor implantation induces brain tumor regression. (A) Diagram depicting the different treatments administered to 4 cohorts of tumor bearing mice. GL26 cells were implanted in the brain of all mice on day 0 and were treated by the intratumoral delivery of saline on day 17 with depletion of CD25+ cells using PC61 on day 15 (green) or on day 24 (red). Control groups of tumor bearing mice received rat IgG1 isotype control on day 15 (blue), or no systemic administration of immunoglobulins (Black) as indicated. Mice were used either for survival studies, or euthanized at day 27 post-tumor implantation for analysis of immune cell populations by flow cytometry. (B) Kaplan-Meier curve displaying survival of the 4 groups of mice Page 33 of 39
36 described in (A). Ten mice were used in each group and a log-rank test was used to calculate significance between untreated group and PC61 treated groups. *p<0.05 compared with untreated mice and isotype control treated mice. (C) DTH test was performed on long-term survivor mice 100 d after tumor implantation. Mice had originally been treated with PC61 on day 15 (green lines). Irradiated GL26 cells in PBS in the right rear footpad (filled box) or PBS control in the left rear footpad (open box) of mice. The thickness of the footpad was determined 0 h, 4 h, 24 h and 48 h after injection of irradiated cells or PBS. Two Way ANOVA with Tukey s post test was used to calculate significant differences. (D-F) Tregs (CD3ε+ CD4+ Foxp3+) infiltrating tumors (D), draining lymph nodes (E) or spleens (F) were quantified in mice administered rat IgG1 isotype control (iso) or PC61 on day 15 (15) or day 24 (24) as indicated in the graphs (left). Dot plots (right) display representative data from 5 mice per group. The percentages of T regs with respect to the total number of CD45+ cells in the tumors, draining lymph nodes (dln) or spleen are indicated in representative dot plots. One Way ANOVA with Tukey s post test were used to determine significant differences (***p<0.001). Figure 4. Infiltrating CD4+ T cells and CD8a+ T cells decrease in the tumor and dln after treatment with PC61. C57BL/6 mice were challenged with tumor cells on day 0, and treated on day 17 by intratumoral delivery of saline. Tregs were depleted on either day 15 or day 24 by ip injection of PC61. Immune cells were isolated from the spleen, the cervical LN and the intracranial tumor at day 27 post-tumor implantation to determine the percentage of CD4+ T cells and CD8a+ T cells in each tissue. The percentage of tumor infiltrating immune cells that were CD4+ T cells (CD3ε+ CD4+ Page 34 of 39
37 CD8a-) (A) and CD8a+ T cells (CD3ε+ CD4- CD8a+) (B); the percentage of immune cells in the draining lymph nodes that were CD4+ T cells (CD3ε+ CD4+ CD8a-) (C) and CD8a+ T cells (CD3ε+ CD4- CD8a+) (D); and the percentage of immune cells in the spleen that were CD4+ T cells (CD3ε+ CD4+ CD8a-) (E) and CD8a+ T cells (CD3ε+ CD4- CD8a+) (F) are shown in graphs (left). Representative dot plots for each treatment group are displayed on the right (gated for live leukocytes with FSC vs SSC and CD3ε+ T lymphocytes). The percentages of each immune cell population with respect to the total number of CD45+ cells in the tumors, draining lymph nodes (dln) or spleen are indicated in representative dot plots. One Way ANOVA with Tukey s post test were used to calculate significant differences. (*p<0.05, **p<0.01). Figure 5. Antigen presenting cells do not change in tumor or dln in untreated animals but increase in spleen after depletion of Tregs with PC61. GL26 cells were implanted in the brain striatum of C57BL/6 mice. Rat IgG1 isotype control immunoglobulins (-) were administered on day 15 and PC61 was administered on day 15 or day 24 as indicated. The percentage of tumor infiltrating macrophages (MΦ; CD11b+ CD45+ I-Ab+) (A,C,E) and myeloid Dendritic cells (mdc; CD11c+ CD45+ I-Ab+) (B,D,F) were quantified at day 27 post-tumor implantation using flow cytometry in the tumor (A,B) dln (C,D) and spleen (E,F). The percentages of each immune cell population with respect to the total number of CD45+ cells in the tumors, draining lymph nodes (dln) or spleen are indicated in representative dot plots. 5 and 10 mice were analyzed per group. One Way ANOVA with Tukey s post test was used to determine statistical significance. Page 35 of 39
38 Figure 6. PC61 prevents activation of adaptive anti-tumor immune responses using Ad-Flt3L and Ad-TK. (A) C57BL/6 mice were challenged with tumor cells on day 0, and treated on day 17 by intratumoral delivery of Ad-Flt3L and Ad-TK or saline as indicated. Tregs were depleted on either day 15 (green) or day 24 (red) by ip injection of PC61 or on day 15 with the isotype control (blue). Immune cells were isolated from the spleen, the cervical LN and the tumor. Mice were either used for survival studies or euthanized on day 27 for analysis of immune cell populations by flow cytometry and ELISPOT. (B) Kaplan-Meier curve displaying survival data from 10 mice per group. Statistically significant differences to Ad-Flt3L and Ad-TK treated mice only (black line, no PC61 depletion) were calculated using the log-rank test (*p<0.05, **p<0.01). Administration of PC61 to mice 24 days after tumor implantation (7 days after treatment with Ad-Flt3L and Ad-TK) significantly reduced long term survival. (C) Tumor bearing mice were treated with Ad-Flt3L and Ad-TK alone (black lines) or with Ad-Flt3L and Ad-TK with PC61 depletion on day 15 (green lines). Long term survivors (60 d after tumor implantation) were assessed for a DTH response to irradiated GL26 cells injected into the right footpad (compared to PBS only in the left footpad). Two Way ANOVA with Tukey s post test was used to calculate significant differences between groups (***p<0.001 mice treated with Ad-Flt3L and Ad-TK no depletion, ^^p<0.01 Ad-Flt3L and Ad-TK treated mice depleted with PC61 on day 15). (D) IFNγ ELISPOT showing the total number of IFNγ producing T lymphocytes that were stimulated with DC loaded with GL26 tumor extracts. T lymphocytes were purified from mice 10 d after treatment with either Ad-Flt3L and Ad-TK (+) or saline (-) as indicated. Black bars are T lymphocytes from mice that did not receive CD25 depleting immunoglobulins. Green bars are T Page 36 of 39
39 lymphocytes purified from mice depleted with PC61 2 days before treatment with Ad- Flt3L and Ad-TK (day 15 after tumor implantation) and red bars are T lymphocytes purified from mice depleted with PC61 7 days after treatment with Ad-Flt3l and Ad-TK (day 24 after tumor implantation). (E-G) Tregs (CD3ε+ CD4+ Foxp3+) infiltrating tumors (E), draining lymph nodes (F) or spleens (G) were quantified in mice administered rat IgG1 isotype control (Iso) or PC61 on day 15 (15) or day 24 (24) as indicated in the graphs (left). Administration of PC61 to mice resulted in long term depletion of Tregs in peripheral sites (spleen and lymph nodes) and at the tumor. Dot plots (right) display representative means ± SEM of Foxp3+ Tregs quantified from 5 mice per group. The total number of T regs in the tumors (E) and the percentages of T regs with respect to the total number of CD45+ cells in the draining lymph nodes (dln) or spleen (F and G) are indicated in representative dot plots. Two Way ANOVA with Tukey s post test were used to determine significant differences (***p<0.001). Figure 7. PC61 inhibits T cell clonal expansion in the tumors in response to treatment with Ad-Flt3L and Ad-TK. (A) Administration of PC61 to mice resulted in depletion of CD25+ T lymphocytes in the spleen compared with administration of isotype controls. (B) C57BL/6 mice were challenged with tumor cells on day 0, and treated on day 17 by intratumoral delivery of Ad-Flt3L and Ad-TK. Tregs were depleted on either day 15 or day 24 by ip injection of PC61. Immune cells were isolated from the spleen, the cervical LN, and the tumor at day 27 post-tumor implantation to determine the percentage of CD4+ and CD8a+ T cells in each tissue. (C-E) Total numbers of tumor infiltrating immune cells (CD45+) (C), CD4+ T cells (CD3ε+ CD4+ CD8a-) (D) and CD8a+ T cells (CD3ε+ CD4- CD8a+) (E) and the percentage of CD4+ T cells (F) and CD8a+ T cells (G) Page 37 of 39
40 in the draining lymph nodes of mice were determined. Panels on the right hand side (C- G) display representative dot plots for immune cells purified from tumor bearing mice treated with isotype rat IgG1 (day 15), PC61 (day 15) or PC61 (day 24) as indicated. The total number of CD45+, CD4+ and CD8+ cells in the tumors are shown in representative dot plots (C-E). The percentages of CD4+ and CD8+ T cells with respect to the total number of CD45+ cells in the draining lymph nodes (dln) are shown in representative dot plots (F and G). Two Way ANOVA with Tukey s post test was used to analyze differences between groups (C) and a two tailed t test was used to determine differences between saline and Ad-Flt3l/Ad-TK treated groups (D-G). Figure 8. CD4+ and CD8a+ T cells do not change in the spleen either after PC61 depletion or in response to treatment with Ad-Flt3L and Ad-TK. Immune cells in the spleen were analyzed after tumor bearing C57BL/6 mice were treated with saline (white bars) or Ad-Flt3L and Ad-TK (black bars) and administered rat IgG1 isotype control immunoglobulins (-) on day 15 or PC61 on day 15 or day 24. Macrophages (A) CD4+ T cells (B) and CD8a+ T cells were assessed at day 27 post-tumor implantation using flow cytometry. Dot plots display CD8a against CD4 and are representative of between 5 and 10 mice per group. The percentages of CD4+ and CD8+ T cells with respect to the total number of CD45+ cells in the spleen are indicated in representative dot plots. Two Way ANOVA with Tukey s post test was used to determine statistical significance. Figure 9. Antigen presenting cells increase in Tumor dln and spleen after depletion with PC61 or in response to Ad-Flt3L and Ad-TK. GL26 cells were implanted in the striatum of C57BL/6 mice. Rat IgG1 isotype control immunoglobulins (-) were Page 38 of 39
41 administered on day 15 and PC61 was administered on day 15 or day 24 as indicated. Mice were treated with intratumoral injection of Ad-Flt3L and Ad-TK (black bars) or saline (white bars). The percentage of tumor infiltrating macrophages (MΦ; CD11b+ CD45+ I-Ab+) (A,C,E) and mdc (mdc; CD11c+ CD45+ I-Ab+) (B,D,F) were quantified at day 27 post-tumor implantation using flow cytometry in the tumor (A,B) dln (C,D) and spleen (E,F). 5 and 10 mice were analyzed per group. The total numbers of APCs in the tumors are indicated in representative dot plots (A-B). The percentage of APCs with respect to the total number of CD45+ cells in the draining lymph nodes (dln) or spleen are depicted in representative dot plots (C-F). Two Way ANOVA with Tukey s post-test was used to determine statistical significance. (*p<0.05, **p<0.01, ***p<0.001). Page 39 of 39

42
43
44
45

46
47

48
49

50
Treg Depletion Inhibits Efficacy of Cancer Immunotherapy: Implications for Clinical Trials
 Treg Depletion Inhibits Efficacy of Cancer Immunotherapy: Implications for Clinical Trials James F. Curtin 1,2,3, Marianela Candolfi 1,2,3, Tamer M. Fakhouri 1, Chunyan Liu 1,2,3, Anderson Alden 1, Matthew
Blocking antibodies and peptides. Rat anti-mouse PD-1 (29F.1A12, rat IgG2a, k), PD-
, PD-") Supplementary Methods Blocking antibodies and peptides. Rat anti-mouse PD-1 (29F.1A12, rat IgG2a, k), PD- L1 (10F.9G2, rat IgG2b, k), and PD-L2 (3.2, mouse IgG1) have been described (24). Anti-CTLA-4 (clone
Supplementary Methods Blocking antibodies and peptides. Rat anti-mouse PD-1 (29F.1A12, rat IgG2a, k), PD- L1 (10F.9G2, rat IgG2b, k), and PD-L2 (3.2, mouse IgG1) have been described (24). Anti-CTLA-4 (clone
Cell isolation. Spleen and lymph nodes (axillary, inguinal) were removed from mice
 were removed from mice") Supplementary Methods: Cell isolation. Spleen and lymph nodes (axillary, inguinal) were removed from mice and gently meshed in DMEM containing 10% FBS to prepare for single cell suspensions. CD4 + CD25
Supplementary Methods: Cell isolation. Spleen and lymph nodes (axillary, inguinal) were removed from mice and gently meshed in DMEM containing 10% FBS to prepare for single cell suspensions. CD4 + CD25
Efficient Isolation of Mouse Liver NKT Cells by Perfusion
 Efficient Isolation of Mouse Liver NKT Cells by Perfusion Xianfeng Fang 1,2, Peishuang Du 1, Yang Liu 3 *, Jie Tang 1 * 1 Center for Infection and Immunity, Institute of Biophysics, Chinese Academy of
NK cell flow cytometric assay In vivo DC viability and migration assay
 NK cell flow cytometric assay 6 NK cells were purified, by negative selection with the NK Cell Isolation Kit (Miltenyi iotec), from spleen and lymph nodes of 6 RAG1KO mice, injected the day before with
B6/COLODR/SPL/11C/83/LAP/#2.006 B6/COLODR/SPL/11C/86/LAP/#2.016 CD11C B6/COLODR/SPL/11C/80/LAP/#2.011 CD11C
 CD3-specific antibody-induced immune tolerance and suppression of autoimmune encephalomyelitis involves TGF-β production through phagocytes digesting apoptotic T cells Sylvain Perruche 1,3, Pin Zhang 1,
Supplementary Information:
 Supplementary Information: Follicular regulatory T cells with Bcl6 expression suppress germinal center reactions by Yeonseok Chung, Shinya Tanaka, Fuliang Chu, Roza Nurieva, Gustavo J. Martinez, Seema
SUPPORTING INFORMATIONS
 SUPPORTING INFORMATIONS Mice MT/ret RetCD3ε KO α-cd25 treated MT/ret Age 1 month 3 mnths 6 months 1 month 3 months 6 months 1 month 3 months 6 months 2/87 Survival 87/87 incidence of 17/87 1 ary tumor
Supporting Information
 Supporting Information Desnues et al. 10.1073/pnas.1314121111 SI Materials and Methods Mice. Toll-like receptor (TLR)8 / and TLR9 / mice were generated as described previously (1, 2). TLR9 / mice were
Data Sheet TIGIT / NFAT Reporter - Jurkat Cell Line Catalog #60538
 Data Sheet TIGIT / NFAT Reporter - Jurkat Cell Line Catalog #60538 Background: TIGIT is a co-inhibitory receptor that is highly expressed in Natural Killer (NK) cells, activated CD4+, CD8+ and regulatory
Supplemental Information. T Cells Enhance Autoimmunity by Restraining Regulatory T Cell Responses via an Interleukin-23-Dependent Mechanism
 Immunity, Volume 33 Supplemental Information T Cells Enhance Autoimmunity by Restraining Regulatory T Cell Responses via an Interleukin-23-Dependent Mechanism Franziska Petermann, Veit Rothhammer, Malte
Detailed step-by-step operating procedures for NK cell and CTL degranulation assays
 Supplemental methods Detailed step-by-step operating procedures for NK cell and CTL degranulation assays Materials PBMC isolated from patients, relatives and healthy donors as control K562 cells (ATCC,
TITLE: MODULATION OF T CELL TOLERANCE IN A MURINE MODEL FOR IMMUNOTHERAPY OF PROSTATIC ADENOCARCINOMA
 AD Award Number: DAMD17-01-1-0085 TITLE: MODULATION OF T CELL TOLERANCE IN A MURINE MODEL FOR IMMUNOTHERAPY OF PROSTATIC ADENOCARCINOMA PRINCIPAL INVESTIGATOR: ARTHUR A HURWITZ, Ph.d. CONTRACTING ORGANIZATION:
Instructions for Use. APO-AB Annexin V-Biotin Apoptosis Detection Kit 100 tests
 3URGXFW,QIRUPDWLRQ Sigma TACS Annexin V Apoptosis Detection Kits Instructions for Use APO-AB Annexin V-Biotin Apoptosis Detection Kit 100 tests For Research Use Only. Not for use in diagnostic procedures.
Cover Page. The handle holds various files of this Leiden University dissertation.
 Cover Page The handle http://hdl.handle.net/1887/23854 holds various files of this Leiden University dissertation. Author: Marel, Sander van der Title: Gene and cell therapy based treatment strategies
B220 CD4 CD8. Figure 1. Confocal Image of Sensitized HLN. Representative image of a sensitized HLN
 B220 CD4 CD8 Natarajan et al., unpublished data Figure 1. Confocal Image of Sensitized HLN. Representative image of a sensitized HLN showing B cell follicles and T cell areas. 20 µm thick. Image of magnification
NKTR-255: Accessing The Immunotherapeutic Potential Of IL-15 for NK Cell Therapies
 NKTR-255: Accessing The Immunotherapeutic Potential Of IL-15 for NK Cell Therapies Saul Kivimäe Senior Scientist, Research Biology Nektar Therapeutics NK Cell-Based Cancer Immunotherapy, September 26-27,
Supplementary Figure 1. Characterization of basophils after reconstitution of SCID mice
 Supplementary figure legends Supplementary Figure 1. Characterization of after reconstitution of SCID mice with CD4 + CD62L + T cells. (A-C) SCID mice (n = 6 / group) were reconstituted with 2 x 1 6 CD4
VISTA, a novel immune checkpoint protein ligand that suppresses anti-tumor tumor T cell responses. Li Wang. Dartmouth Medical School
 VISTA, a novel immune checkpoint protein ligand that suppresses anti-tumor tumor T cell responses Li Wang Dartmouth Medical School The B7 Immunoglobulin Super-Family immune regulators APC T cell Co-stimulatory:
Figure S1. Generation of inducible PTEN deficient mice and the BMMCs (A) B6.129 Pten loxp/loxp mice were mated with B6.
 B6.129 Pten loxp/loxp mice were mated with B6.") Figure S1. Generation of inducible PTEN deficient mice and the BMMCs (A) B6.129 Pten loxp/loxp mice were mated with B6.129-Gt(ROSA)26Sor tm1(cre/ert2)tyj /J mice. To induce deletion of the Pten locus,
Figure S1. Generation of inducible PTEN deficient mice and the BMMCs (A) B6.129 Pten loxp/loxp mice were mated with B6.129-Gt(ROSA)26Sor tm1(cre/ert2)tyj /J mice. To induce deletion of the Pten locus,
Supplementary Figures
 Supplementary Figures Supplementary Fig. 1. Surface thiol groups and reduction of activated T cells. (a) Activated CD8 + T-cells have high expression levels of free thiol groups on cell surface proteins.
Immunological alterations in mice irradiated with low doses
 Immunological alterations in mice irradiated with low doses "Frédéric Joliot-Curie" National Research Institute for Radiobiology and Radiohygiene, Budapest, Hungary The structure of the immune system INNATE
Optimizing Intracellular Flow Cytometry:
 Optimizing Intracellular Flow Cytometry: Simultaneous Detection of Cytokines and Transcription Factors Presented by Jurg Rohrer, PhD, BD Biosciences 23-10780-00 Outline Introduction Cytokines Transcription
A549 and A549-fLuc cells were maintained in high glucose Dulbecco modified
 Cell culture and animal model A549 and A549-fLuc cells were maintained in high glucose Dulbecco modified Eagle medium supplemented with 10% fetal bovine serum at 37 C in humidified atmosphere containing
Combining Cytotoxic and Immune-Mediated Gene Therapy to Treat Brain Tumors
 Dublin Institute of Technology ARROW@DIT Articles School of Biological Sciences 2005-01-01 Combining Cytotoxic and Immune-Mediated Gene Therapy to Treat Brain Tumors James Curtin Dublin Institute of Technology,
Supplemental Figure 1. Signature gene expression in in vitro differentiated Th0, Th1, Th2, Th17 and Treg cells. (A) Naïve CD4 + T cells were cultured
 Naïve CD4 + T cells were cultured") Supplemental Figure 1. Signature gene expression in in vitro differentiated Th0, Th1, Th2, Th17 and Treg cells. (A) Naïve CD4 + T cells were cultured under Th0, Th1, Th2, Th17, and Treg conditions. mrna
Supplemental Figure 1. Signature gene expression in in vitro differentiated Th0, Th1, Th2, Th17 and Treg cells. (A) Naïve CD4 + T cells were cultured under Th0, Th1, Th2, Th17, and Treg conditions. mrna
Immunity and Cancer. Doriana Fruci. Lab di Immuno-Oncologia
 Immunity and Cancer Doriana Fruci Lab di Immuno-Oncologia Immune System is a network of cells, tissues and organs that work together to defend the body against attacks of foreign invaders (pathogens, cancer
PBMC from each patient were suspended in AIM V medium (Invitrogen) with 5% human
 with 5% human") Anti-CD19-CAR transduced T-cell preparation PBMC from each patient were suspended in AIM V medium (Invitrogen) with 5% human AB serum (Gemini) and 300 international units/ml IL-2 (Novartis). T cell proliferation
Anti-CD19-CAR transduced T-cell preparation PBMC from each patient were suspended in AIM V medium (Invitrogen) with 5% human AB serum (Gemini) and 300 international units/ml IL-2 (Novartis). T cell proliferation
HMGB1 Mediates Endogenous TLR2 Activation and Brain Tumor Regression
 Dublin Institute of Technology ARROW@DIT Articles School of Biological Sciences 2009-01-01 HMGB1 Mediates Endogenous TLR2 Activation and Brain Tumor Regression James Curtin Dublin Institute of Technology,
SUPPLEMENTARY INFORMATION
 doi:1.138/nature1554 a TNF-α + in CD4 + cells [%] 1 GF SPF 6 b IL-1 + in CD4 + cells [%] 5 4 3 2 1 Supplementary Figure 1. Effect of microbiota on cytokine profiles of T cells in GALT. Frequencies of TNF-α
SUPPLEMENTARY INFORMATION
 Complete but curtailed T-cell response to very-low-affinity antigen Dietmar Zehn, Sarah Y. Lee & Michael J. Bevan Supp. Fig. 1: TCR chain usage among endogenous K b /Ova reactive T cells. C57BL/6 mice
Suppl Video: Tumor cells (green) and monocytes (white) are seeded on a confluent endothelial
 and monocytes (white) are seeded on a confluent endothelial") Supplementary Information Häuselmann et al. Monocyte induction of E-selectin-mediated endothelial activation releases VE-cadherin junctions to promote tumor cell extravasation in the metastasis cascade
Supplementary Information Häuselmann et al. Monocyte induction of E-selectin-mediated endothelial activation releases VE-cadherin junctions to promote tumor cell extravasation in the metastasis cascade
Optimizing Intracellular Flow Cytometry:
 Optimizing Intracellular Flow Cytometry: Simultaneous Detection of Cytokines and Transcription Factors An encore presentation by Jurg Rohrer, PhD, BD Biosciences 10.26.10 Outline Introduction Cytokines
MATERIALS AND METHODS. Neutralizing antibodies specific to mouse Dll1, Dll4, J1 and J2 were prepared as described. 1,2 All
 MATERIALS AND METHODS Antibodies (Abs), flow cytometry analysis and cell lines Neutralizing antibodies specific to mouse Dll1, Dll4, J1 and J2 were prepared as described. 1,2 All other antibodies used
Annexin V-APC/7-AAD Apoptosis Kit
 Annexin V-APC/7-AAD Apoptosis Kit Catalog Number KA3808 100 assays Version: 04 Intended for research use only www.abnova.com Table of Contents Introduction... 3 Background... 3 General Information... 4
Supplementary Figure 1. Deletion of Smad3 prevents B16F10 melanoma invasion and metastasis in a mouse s.c. tumor model.
 A B16F1 s.c. Lung LN Distant lymph nodes Colon B B16F1 s.c. Supplementary Figure 1. Deletion of Smad3 prevents B16F1 melanoma invasion and metastasis in a mouse s.c. tumor model. Highly invasive growth
Antigen Presentation and T Lymphocyte Activation. Abul K. Abbas UCSF. FOCiS
 1 Antigen Presentation and T Lymphocyte Activation Abul K. Abbas UCSF FOCiS 2 Lecture outline Dendritic cells and antigen presentation The role of the MHC T cell activation Costimulation, the B7:CD28 family
Combined Rho-kinase inhibition and immunogenic cell death triggers and propagates immunity against cancer
 Supplementary Information Combined Rho-kinase inhibition and immunogenic cell death triggers and propagates immunity against cancer Gi-Hoon Nam, Eun-Jung Lee, Yoon Kyoung Kim, Yeonsun Hong, Yoonjeong Choi,
T Lymphocyte Activation and Costimulation. FOCiS. Lecture outline
 1 T Lymphocyte Activation and Costimulation Abul K. Abbas, MD UCSF FOCiS 2 Lecture outline T cell activation Costimulation, the B7:CD28 family Inhibitory receptors of T cells Targeting costimulators for
NKTR-255: Accessing IL-15 Therapeutic Potential through Robust and Sustained Engagement of Innate and Adaptive Immunity
 NKTR-255: Accessing IL-15 Therapeutic Potential through Robust and Sustained Engagement of Innate and Adaptive Immunity Peiwen Kuo Scientist, Research Biology Nektar Therapeutics August 31 st, 2018 Emerging
Regulation of anti-tumor immunity through migration of immune cell subsets within the tumor microenvironment Thomas F. Gajewski, M.D., Ph.D.
 Regulation of anti-tumor immunity through migration of immune cell subsets within the tumor microenvironment Thomas F. Gajewski, M.D., Ph.D. Professor, Departments of Pathology and Medicine Program Leader,
FOCiS. Lecture outline. The immunological equilibrium: balancing lymphocyte activation and control. Immunological tolerance and immune regulation -- 1
 1 Immunological tolerance and immune regulation -- 1 Abul K. Abbas UCSF FOCiS 2 Lecture outline Principles of immune regulation Self-tolerance; mechanisms of central and peripheral tolerance Inhibitory
SUPPLEMENTARY FIGURES
 SUPPLEMENTARY FIGURES Supplementary Figure 1: Chemokine receptor expression profiles of CCR6 + and CCR6 - CD4 + IL-17A +/ex and Treg cells. Quantitative PCR analysis of chemokine receptor transcript abundance
Supplemental Materials for. Effects of sphingosine-1-phosphate receptor 1 phosphorylation in response to. FTY720 during neuroinflammation
 Supplemental Materials for Effects of sphingosine-1-phosphate receptor 1 phosphorylation in response to FTY7 during neuroinflammation This file includes: Supplemental Table 1. EAE clinical parameters of
Supplementary figure 1. Systemic delivery of anti-cd47 antibody controls tumor growth in
 T u m o r v o lu m e (m m 3 ) P e rc e n t s u rv iv a l P e rc e n t s u rv iv a l Supplementary data a 1 8 6 4 2 5 1 1 5 2 2 5 3 3 5 4 T im e a fte r tu m o r in o c u la tio n (d ) b c 1 5 1 1 5 * *
Understanding the T cell response to tumors using transnuclear mouse models
 Understanding the T cell response to tumors using transnuclear mouse models Stephanie Dougan Dana-Farber Cancer Institute Boston, MA Presenter Disclosure Information Stephanie Dougan The following relationships
Supplementary Figure S1. Flow cytometric analysis of the expression of Thy1 in NH cells. Flow cytometric analysis of the expression of T1/ST2 and
 Supplementary Figure S1. Flow cytometric analysis of the expression of Thy1 in NH cells. Flow cytometric analysis of the expression of T1/ST2 and Thy1 in NH cells derived from the lungs of naïve mice.
Supporting Online Material for
 www.sciencemag.org/cgi/content/full/1175194/dc1 Supporting Online Material for A Vital Role for Interleukin-21 in the Control of a Chronic Viral Infection John S. Yi, Ming Du, Allan J. Zajac* *To whom
Nature Immunology: doi: /ni Supplementary Figure 1. Examples of staining for each antibody used for the mass cytometry analysis.
 Supplementary Figure 1 Examples of staining for each antibody used for the mass cytometry analysis. To illustrate the functionality of each antibody probe, representative plots illustrating the expected
IMMUNOTHERAPY FOR CANCER A NEW HORIZON. Ekaterini Boleti MD, PhD, FRCP Consultant in Medical Oncology Royal Free London NHS Foundation Trust
 IMMUNOTHERAPY FOR CANCER A NEW HORIZON Ekaterini Boleti MD, PhD, FRCP Consultant in Medical Oncology Royal Free London NHS Foundation Trust ASCO Names Advance of the Year: Cancer Immunotherapy No recent
SUPPLEMENTARY INFORMATION
 Supplemental Figure 1. Furin is efficiently deleted in CD4 + and CD8 + T cells. a, Western blot for furin and actin proteins in CD4cre-fur f/f and fur f/f Th1 cells. Wild-type and furin-deficient CD4 +
Title of file for HTML: Supplementary Information Description: Supplementary Figures and Supplementary Table
 Title of file for HTML: Supplementary Information Description: Supplementary Figures and Supplementary Table Title of file for HTML: Peer Review File Description: Innate Scavenger Receptor-A regulates
SUPPLEMENTARY FIGURE 1
 SUPPLEMENTARY FIGURE 1 A LN Cell count (1 ) 1 3 1 CD+ 1 1 CDL lo CD hi 1 CD+FoxP3+ 1 1 1 7 3 3 3 % of cells 9 7 7 % of cells CD+ 3 1 % of cells CDL lo CD hi 1 1 % of CD+ cells CD+FoxP3+ 3 1 % of CD+ T
T cell maturation. T-cell Maturation. What allows T cell maturation?
 T-cell Maturation What allows T cell maturation? Direct contact with thymic epithelial cells Influence of thymic hormones Growth factors (cytokines, CSF) T cell maturation T cell progenitor DN DP SP 2ry
Supplemental Table I.
 Supplemental Table I Male / Mean ± SEM n Mean ± SEM n Body weight, g 29.2±0.4 17 29.7±0.5 17 Total cholesterol, mg/dl 534.0±30.8 17 561.6±26.1 17 HDL-cholesterol, mg/dl 9.6±0.8 17 10.1±0.7 17 Triglycerides,
Immunology Lecture 4. Clinical Relevance of the Immune System
 Immunology Lecture 4 The Well Patient: How innate and adaptive immune responses maintain health - 13, pg 169-181, 191-195. Immune Deficiency - 15 Autoimmunity - 16 Transplantation - 17, pg 260-270 Tumor
effect on the upregulation of these cell surface markers. The mean peak fluorescence intensity
 SUPPLEMENTARY FIGURE 1 Supplementary Figure 1 ASIC1 disruption or blockade does not effect in vitro and in vivo antigen-presenting cell activation. (a) Flow cytometric analysis of cell surface molecules
Evaluation of directed and random motility in microslides Assessment of leukocyte adhesion in flow chambers
 Evaluation of directed and random motility in microslides Motility experiments in IBIDI microslides, image acquisition and processing were performed as described. PMN, which ended up in an angle < 180
PREPARED FOR: U.S. Army Medical Research and Materiel Command Fort Detrick, Maryland Approved for public release; distribution unlimited
 AD (Leave blank) Award Number: W81XWH-07-1-0345 TITLE: Second-Generation Therapeutic DNA Lymphoma Vaccines PRINCIPAL INVESTIGATOR: Larry W. Kwak, M.D., Ph.D. CONTRACTING ORGANIZATION: University of Texas
Glioblastoma and CNS tumors
 Glioblastoma and CNS tumors PRECEPTORSHIP PROGRAMME IMMUNO-ONCOLOGY Amsterdam, 1 October 2016 Patrick Roth Department of Neurology and Brain Tumor Center University Hospital Zurich Immunology in the CNS
T-cell activation T cells migrate to secondary lymphoid tissues where they interact with antigen, antigen-presenting cells, and other lymphocytes:
 Interactions between innate immunity & adaptive immunity What happens to T cells after they leave the thymus? Naïve T cells exit the thymus and enter the bloodstream. If they remain in the bloodstream,
Supplementary Figures
 Inhibition of Pulmonary Anti Bacterial Defense by IFN γ During Recovery from Influenza Infection By Keer Sun and Dennis W. Metzger Supplementary Figures d a Ly6G Percentage survival f 1 75 5 1 25 1 5 1
Determinants of Immunogenicity and Tolerance. Abul K. Abbas, MD Department of Pathology University of California San Francisco
 Determinants of Immunogenicity and Tolerance Abul K. Abbas, MD Department of Pathology University of California San Francisco EIP Symposium Feb 2016 Why do some people respond to therapeutic proteins?
The encephalitogenicity of TH17 cells is dependent on IL-1- and IL-23- induced production of the cytokine GM-CSF
 CORRECTION NOTICE Nat.Immunol. 12, 568 575 (2011) The encephalitogenicity of TH17 cells is dependent on IL-1- and IL-23- induced production of the cytokine GM-CSF Mohamed El-Behi, Bogoljub Ciric, Hong
L-selectin Is Essential for Delivery of Activated CD8 + T Cells to Virus-Infected Organs for Protective Immunity
 Cell Reports Supplemental Information L-selectin Is Essential for Delivery of Activated CD8 + T Cells to Virus-Infected Organs for Protective Immunity Rebar N. Mohammed, H. Angharad Watson, Miriam Vigar,
T Cell Activation, Costimulation and Regulation
 1 T Cell Activation, Costimulation and Regulation Abul K. Abbas, MD University of California San Francisco 2 Lecture outline T cell antigen recognition and activation Costimulation, the B7:CD28 family
Synergistic combinations of targeted immunotherapy to combat cancer
 Synergistic combinations of targeted immunotherapy to combat cancer Myung Ah Lee, M.D., Ph. D Division of Medical Oncology, Hepato-biliary pancreatic cancer center Seoul St. Mary s hospital, The Catholic
sequences of a styx mutant reveals a T to A transversion in the donor splice site of intron 5
 sfigure 1 Styx mutant mice recapitulate the phenotype of SHIP -/- mice. (A) Analysis of the genomic sequences of a styx mutant reveals a T to A transversion in the donor splice site of intron 5 (GTAAC
McAb and rhil-2 activated bone marrow on the killing and purging of leukemia cells
 Effects of McAb and rhil-2 activated bone marrow on the killing and purging of leukemia cells X.C. Wei, D.D. Yang, X.R. Han, Y.A. Zhao, Y.C. Li, L.J. Zhang and J.J. Wang Institute of hematological research,
Hopkins University, Howard Hughes Medical Institute, USA) (27). Cells were maintained in DMEM
 (27). Cells were maintained in DMEM") Supplementary Materials and Methods Cell Culture HCT116 (TP53 +/+ and TP53 -/- ) cells were provided by Dr. Bert Vogelstein (Johns Hopkins University, Howard Hughes Medical Institute, USA) (27). Cells
Supplementary Materials and Methods Cell Culture HCT116 (TP53 +/+ and TP53 -/- ) cells were provided by Dr. Bert Vogelstein (Johns Hopkins University, Howard Hughes Medical Institute, USA) (27). Cells
Sipper BK Experimental Animal Co. (Shanghai, China) and bred in a specific. pathogen-free environment. The animal study protocol was approved by the
 and bred in a specific. pathogen-free environment. The animal study protocol was approved by the") Supplementary information, Data S1 Materials and Methods Mice, Ad vectors and reagents Female C57BL/6 mice, 8-10 weeks of age, were purchased from Joint Ventures Sipper BK Experimental Animal Co. (Shanghai,
Supplementary information, Data S1 Materials and Methods Mice, Ad vectors and reagents Female C57BL/6 mice, 8-10 weeks of age, were purchased from Joint Ventures Sipper BK Experimental Animal Co. (Shanghai,
Supplementary Figures
 Supplementary Figures Supplementary Figure 1. NKT ligand-loaded tumour antigen-presenting B cell- and monocyte-based vaccine induces NKT, NK and CD8 T cell responses. (A) The cytokine profiles of liver
SUPPLEMENTARY INFORMATION
 doi:10.1038/nature10134 Supplementary Figure 1. Anti-inflammatory activity of sfc. a, Autoantibody immune complexes crosslink activating Fc receptors, promoting activation of macrophages, and WWW.NATURE.COM/NATURE
Rapid antigen-specific T cell enrichment (Rapid ARTE)
") Direct ex vivo characterization of human antigen-specific CD154+CD4+ T cell Rapid antigen-specific T cell enrichment (Rapid ARTE) Introduction Workflow Antigen (ag)-specific T cells play a central role
Direct ex vivo characterization of human antigen-specific CD154+CD4+ T cell Rapid antigen-specific T cell enrichment (Rapid ARTE) Introduction Workflow Antigen (ag)-specific T cells play a central role
Analysis of regulatory T cell subsets in the peripheral blood of immunoglobulin A nephropathy (IgAN) patients
 patients") Analysis of regulatory T cell subsets in the peripheral blood of immunoglobulin A nephropathy (IgAN) patients S. Yang, B. Chen, J. Shi, F. Chen, J. Zhang and Z. Sun Department of Nephrology, Huaihe Hospital
Analysis of regulatory T cell subsets in the peripheral blood of immunoglobulin A nephropathy (IgAN) patients S. Yang, B. Chen, J. Shi, F. Chen, J. Zhang and Z. Sun Department of Nephrology, Huaihe Hospital
Oncolytic Immunotherapy: A Local and Systemic Antitumor Approach
 Oncolytic Immunotherapy: A Local and Systemic Antitumor Approach Oncolytic immunotherapy Oncolytic immunotherapy the use of a genetically modified virus to attack tumors and induce a systemic immune response
Index. neurosurgery.theclinics.com. Note: Page numbers of article titles are in boldface type.
 Index Note: Page numbers of article titles are in boldface type. A A Complimentary Trial of an Immunotherapy Vaccine Against Tumor-specific EGFRvIII (ACTIVATE), 90 91 Active immunotherapy, 5 8, 96. See
Fluorochrome Panel 1 Panel 2 Panel 3 Panel 4 Panel 5 CTLA-4 CTLA-4 CD15 CD3 FITC. Bio) PD-1 (MIH4, BD) ICOS (C398.4A, Biolegend) PD-L1 (MIH1, BD)
 PD-1 (MIH4, BD) ICOS (C398.4A, Biolegend) PD-L1 (MIH1, BD)") Additional file : Table S. Antibodies used for panel stain to identify peripheral immune cell subsets. Panel : PD- signaling; Panel : CD + T cells, CD + T cells, B cells; Panel : Tregs; Panel :, -T, cdc,
Additional file : Table S. Antibodies used for panel stain to identify peripheral immune cell subsets. Panel : PD- signaling; Panel : CD + T cells, CD + T cells, B cells; Panel : Tregs; Panel :, -T, cdc,
Dendritic cells in cancer immunotherapy Aimin Jiang
 Dendritic cells in cancer immunotherapy Aimin Jiang Feb. 11, 2014 Dendritic cells at the interface of innate and adaptive immune responses Dendritic cells: initiators of adaptive immune responses Dendritic
D CD8 T cell number (x10 6 )
") IFNγ Supplemental Figure 1. CD T cell number (x1 6 ) 18 15 1 9 6 3 CD CD T cells CD6L C CD5 CD T cells CD6L D CD8 T cell number (x1 6 ) 1 8 6 E CD CD8 T cells CD6L F Log(1)CFU/g Feces 1 8 6 p
IFNγ Supplemental Figure 1. CD T cell number (x1 6 ) 18 15 1 9 6 3 CD CD T cells CD6L C CD5 CD T cells CD6L D CD8 T cell number (x1 6 ) 1 8 6 E CD CD8 T cells CD6L F Log(1)CFU/g Feces 1 8 6 p
L1 on PyMT tumor cells but Py117 cells are more responsive to IFN-γ. (A) Flow
 Flow") A MHCI B PD-L1 Fold expression 8 6 4 2 Fold expression 3 2 1 No tx 1Gy 2Gy IFN Py117 Py117 Supplementary Figure 1. Radiation and IFN-γ enhance MHCI expression and PD- L1 on PyMT tumor cells but Py117 cells
A MHCI B PD-L1 Fold expression 8 6 4 2 Fold expression 3 2 1 No tx 1Gy 2Gy IFN Py117 Py117 Supplementary Figure 1. Radiation and IFN-γ enhance MHCI expression and PD- L1 on PyMT tumor cells but Py117 cells
VEGFR2-Mediated Vascular Dilation as a Mechanism of VEGF-Induced Anemia and Bone Marrow Cell Mobilization
 Cell Reports, Volume 9 Supplemental Information VEGFR2-Mediated Vascular Dilation as a Mechanism of VEGF-Induced Anemia and Bone Marrow Cell Mobilization Sharon Lim, Yin Zhang, Danfang Zhang, Fang Chen,
Supplementary Figure 1. Efficient DC depletion in CD11c.DOG transgenic mice
 Supplementary Figure 1. Efficient DC depletion in CD11c.DOG transgenic mice (a) CD11c.DOG transgenic mice (tg) were treated with 8 ng/g body weight (b.w.) diphtheria toxin (DT) i.p. on day -1 and every
SUPPLEMENTARY INFORMATION
 doi: 1.138/nature775 4 O.D. (595-655) 3 1 -ζ no antibody isotype ctrl Plated Soluble 1F6 397 7H11 Supplementary Figure 1 Soluble and plated anti- Abs induce -! signalling. B3Z cells stably expressing!
Nature Medicine: doi: /nm.3922
 Title: Glucocorticoid-induced tumor necrosis factor receptor-related protein co-stimulation facilitates tumor regression by inducing IL-9-producing helper T cells Authors: Il-Kyu Kim, Byung-Seok Kim, Choong-Hyun
Supplementary Materials for
 immunology.sciencemag.org/cgi/content/full/2/16/eaan6049/dc1 Supplementary Materials for Enzymatic synthesis of core 2 O-glycans governs the tissue-trafficking potential of memory CD8 + T cells Jossef
Effector mechanisms of cell-mediated immunity: Properties of effector, memory and regulatory T cells
 ICI Basic Immunology course Effector mechanisms of cell-mediated immunity: Properties of effector, memory and regulatory T cells Abul K. Abbas, MD UCSF Stages in the development of T cell responses: induction
W/T Itgam -/- F4/80 CD115. F4/80 hi CD115 + F4/80 + CD115 +
 F4/8 % in the peritoneal lavage 6 4 2 p=.15 n.s p=.76 CD115 F4/8 hi CD115 + F4/8 + CD115 + F4/8 hi CD115 + F4/8 + CD115 + MHCII MHCII Supplementary Figure S1. CD11b deficiency affects the cellular responses
Serafino et al. Thymosin α1 activates complement receptor-mediated phagocytosis in human monocyte-derived macrophages. SUPPLEMENTARY FIGURES
 Supplementary Fig. S1. Evaluation of the purity and maturation of macrophage cultures tested by flow cytometry. The lymphocytic/monocytic cellular fraction was isolated from buffy coats of healthy donors
Research Article A Combination of Systemic and Intracranial Anti-CD25 Immunotherapy Elicits a Long-Time Survival in Murine Model of Glioma
 Oncology Volume 29, Article ID 96337, 8 pages doi:1.1155/29/96337 Research Article A Combination of Systemic and Intracranial Anti-CD25 Immunotherapy Elicits a Long-Time Survival in Murine Model of Glioma
Ex vivo Human Antigen-specific T Cell Proliferation and Degranulation Willemijn Hobo 1, Wieger Norde 1 and Harry Dolstra 2*
 Ex vivo Human Antigen-specific T Cell Proliferation and Degranulation Willemijn Hobo 1, Wieger Norde 1 and Harry Dolstra 2* 1 Department of Laboratory Medicine - Laboratory of Hematology, Radboud University
In vitro human regulatory T cell expansion
 - 1 - Human CD4 + CD25 + regulatory T cell isolation, Workflow in vitro expansion and analysis In vitro human regulatory T cell expansion Introduction Regulatory T (Treg) cells are a subpopulation of T
Autoimmunity. Autoimmunity arises because of defects in central or peripheral tolerance of lymphocytes to selfantigens
 Autoimmunity Autoimmunity arises because of defects in central or peripheral tolerance of lymphocytes to selfantigens Autoimmune disease can be caused to primary defects in B cells, T cells and possibly
Figure S1. PMVs from THP-1 cells expose phosphatidylserine and carry actin. A) Flow
 Flow") SUPPLEMENTARY DATA Supplementary Figure Legends Figure S1. PMVs from THP-1 cells expose phosphatidylserine and carry actin. A) Flow cytometry analysis of PMVs labelled with annexin-v-pe (Guava technologies)
SUPPLEMENTARY DATA Supplementary Figure Legends Figure S1. PMVs from THP-1 cells expose phosphatidylserine and carry actin. A) Flow cytometry analysis of PMVs labelled with annexin-v-pe (Guava technologies)
Hua Tang, Weiping Cao, Sudhir Pai Kasturi, Rajesh Ravindran, Helder I Nakaya, Kousik
 SUPPLEMENTARY FIGURES 1-19 T H 2 response to cysteine-proteases requires dendritic cell-basophil cooperation via ROS mediated signaling Hua Tang, Weiping Cao, Sudhir Pai Kasturi, Rajesh Ravindran, Helder
Islet viability assay and Glucose Stimulated Insulin Secretion assay RT-PCR and Western Blot
 Islet viability assay and Glucose Stimulated Insulin Secretion assay Islet cell viability was determined by colorimetric (3-(4,5-dimethylthiazol-2-yl)-2,5- diphenyltetrazolium bromide assay using CellTiter
Supplementary Figure 1. Normal T lymphocyte populations in Dapk -/- mice. (a) Normal thymic development in Dapk -/- mice. Thymocytes from WT and Dapk
 Normal thymic development in Dapk -/- mice. Thymocytes from WT and Dapk") Supplementary Figure 1. Normal T lymphocyte populations in Dapk -/- mice. (a) Normal thymic development in Dapk -/- mice. Thymocytes from WT and Dapk -/- mice were stained for expression of CD4 and CD8.
Supplementary Figure 1. Normal T lymphocyte populations in Dapk -/- mice. (a) Normal thymic development in Dapk -/- mice. Thymocytes from WT and Dapk -/- mice were stained for expression of CD4 and CD8.
COURSE: Medical Microbiology, PAMB 650/720 - Fall 2008 Lecture 16
 COURSE: Medical Microbiology, PAMB 650/720 - Fall 2008 Lecture 16 Tumor Immunology M. Nagarkatti Teaching Objectives: Introduction to Cancer Immunology Know the antigens expressed by cancer cells Understand
Rationale for Combining Immunotherapy with Chemotherapy or Targeted Therapy
 Society for Immunotherapy of Cancer (SITC) Rationale for Combining Immunotherapy with Chemotherapy or Targeted Therapy Qing Yi, MD, PhD Staff and Chair, Department of Cancer Biology Betsy B. DeWindt Endowed