The Pennsylvania State University. The Graduate School. The Huck Institutes of the Life Sciences INTERACTION OF METASTATIC BREAST CANCER CELLS WITH
|
|
|
- Drusilla West
- 5 years ago
- Views:
Transcription
1 The Pennsylvania State University The Graduate School The Huck Institutes of the Life Sciences INTERACTION OF METASTATIC BREAST CANCER CELLS WITH OSTEOBLASTS A Dissertation in Immunology and Infectious Diseases by Laurie A. Shuman Copyright 2009 Laurie A. Shuman Submitted in Partial Fulfillment of the Requirements for the Degree of Doctor of Philosophy May 2009
2 The dissertation of Laurie A. Shuman was reviewed and approved* by the following: Andrea M. Mastro Professor of Microbiology and Cell Biology Dissertation Advisor Chair of Committee Adam B. Glick Associate Professor of Veterinary Science Rosalyn B. Irby Associate Professor at the Penn State Cancer Institute Robert F. Paulson Associate Professor of Veterinary Science Danny Welch Professor of Pathology Special Member Margherita Cantorna Associate Professor in Molecular Immunology Co-chair Intercollege Graduate Degree Program in Immunology and Infectious Diseases * Signatures are on file in the Graduate School ii
3 ABSTRACT A majority of cancer deaths (90%) are a result of the dissemination of tumor cells from the primary site to a secondary site, not due to the primary tumor itself. Therefore, it is necessary to investigate mechanisms utilized by tumor cells to promote growth in and destruction of the secondary sites. Advances in microarray technology allow for rapid screening and identification of potential genetic targets involved in host response to cancers, however there is a need for high-throughput screening of the identified targets to determine their efficacy. In vitro systems that more accurately represent in vivo microenvironments would be a useful tool to screen potential genetic targets as treatment of diseases. Here we examined the interaction of breast cancer cells with osteoblasts in a specialized culture device (bioreactor). Breast cancer preferentially metastasizes to the bone resulting in the formation of osteolytic lesions. While administration of osteoclast-inhibiting drugs, such as bisphosphonates, slow further lesion formation, existing lesions do not heal. Therefore, osteoblasts appear functionally disabled in the presence of metastatic breast cancer cells. Previous studies in this laboratory have shown that breast cancer cells alter osteoblast adhesion and morphology, increase osteoblast apoptosis, and decrease the expression of osteoblast differentiation genes when exposed to metastatic breast cancer cell conditioned medium for extended periods (5 35 days). In order to examine the interaction of metastatic breast cancer cells with osteoblasts apart from osteoclasts, a specialized bioreactor culture system was utilized. In this culture device, osteoblasts grew and iii
4 differentiated into a multiple-cell-layer, three-dimensional mineralizing tissue. Coculture of metastatic breast cancer cells with osteoblasts in a bioreactor were compared to co-culture in conventional cell culture. The breast cancer cells not only attached and grew on the osteoblast tissue in the bioreactor culture system, but also formed distinct colonies that aligned in the same axis as the osteoblasts, similar to Indian filing seen in authentic pathological tissue. Moreover, in this culture system, the breast cancer cells penetrated the osteoblast tissue, a phenomenon not apparent with conventional cell culture methods. Metastatic breast cancer cells also interfered with the differentiation of osteoblasts as evidenced by a decrease in production of proteins, such as osteocalcin and collagen. In addition, co-culture of the metastatic breast cancer cells with osteoblasts resulted in increased production of the inflammatory cytokine, IL-6, a known activator of osteoclasts. The bioreactor culture system is advantageous over conventional cell culture systems in emulating the bone microenvironment and for studying the interaction of metastatic breast cancer cells with osteoblasts. Additionally, in this report, transcription factor targets within MC3T3-E1 cells treated with MDA-MB-231 human metastatic breast cancer cell conditioned medium were identified. Expression of a particular transcription factor, Early Growth Response 1 (EGR-1), was silenced in MC3T3-E1 cells using shrna targeting murine EGR-1. Osteoblast differentiation and cytokine production was measured in the presence or absence of MDA-MB-231 metastatic breast cancer cell conditioned medium. Osteoblasts having decreased expression of EGR-1 differentiated in culture and when exposed to metastatic breast cancer cell iv
5 conditioned medium showed reduced cytokine production. However, the reduction in osteoblast-derived cytokines did not interfere with the ability of the breast cancer cells to attach or colonize the osteoblast layer. When osteoblasts having decreased EGR-1 expression were cultured in metastatic breast cancer cell conditioned medium for extended periods (19 37 days), differentiation was still inhibited as indicated by decreased alkaline phosphatase staining and RNA expression of type I collagen and osteocalcin. Therefore, these data indicate that decreased EGR-1 expression in MC3T3-E1 cells leads to decreased inflammatory cytokine production by these cells when treated with metastatic breast cancer cell conditioned medium. However, decreased EGR-1 expression in osteoblasts does not reverse the block in osteoblast differentiation caused by the metastatic breast cancer cell conditioned medium. Therefore, these data imply that EGR-1 expression in osteoblasts is directly related to inflammatory cytokine production by, and not differentiation of, osteoblasts stimulated with metastatic breast cancer cell conditioned medium. Combined together, these studies provide useful information for future studies focusing on identification and screening of potential therapeutic targets to treat breast cancer cell metastasis to the bone. The first study validates the use of a bioreactor culture system as an in vitro culture device to better examine the interaction of breast cancer cells with osteoblasts, while the second study identifies a potential therapeutic target in osteoblasts for inflammatory cytokine production induced by breast cancer metastasis. v
6 TABLE OF CONTENTS LIST OF FIGURES...x LIST OF TABLES.. xiv CHAPTER 1. Introduction 1 Introduction to Material Presented in this Thesis 1 Breast Cancer Statistics in the United States..2 Reaching a Secondary Site: the Metastatic Process..3 Choosing a Secondary Site.6 The Bone as a Secondary Site for Breast Cancer Metastasis..7 Breast Cancer Cells Alter Bone Remodeling Chemokines and Growth Factors in the Bone Microenvironment.. 11 Interleukin-6 (IL-6).. 13 Early Growth Response-1 (EGR-1) Transcription Factor and Inflammatory Cytokine Production...15 Transforming Growth Factor β (TGF-β) Development of Therapeutic Strategies for Breast Cancer Metastasis to Bone Advancement of In Vitro Model Systems The Skeleton...26 Osteoblast Differentiation Evolution of In Vitro Model Systems to Study Bone Development.36 Hypotheses References..40 vi
7 CHAPTER 2. Breast Cancer Cells Penetrate Osteoblast Tissue When Grown in a Bioreactor Culture System..47 Abstract Introduction.49 Materials & Methods...54 Cells Cell Tracker Orange...55 Co-Cultures of Osteoblasts and Breast Cancer Cells...55 Microscopy ELISAs and Cytokines Quantum Dots. 57 Bioreactor Culture System...58 RNA Isolation and RT-PCR..59 Cell Proliferation MTT Assay.59 Alkaline Phosphatase Staining.61 Von Kossa Staining 61 Results.63 Breast Cancer Cells Attachment and Colonization Depends Upon the Stage of Osteoblast Differentiation...63 Metastatic breast cancer cells colonize and penetrate osteoblasts when co-cultured in a bioreactor..69 Quantum Dot Technology Enables Distinction of Osteoblast and Breast Cancer Cells in TEM Sections of Co-Cultures TEM analysis of the interaction of breast cancer cells with osteoblasts in the bioreactor and in conventional cell culture.76 vii
8 Discussion..87 References.92 CHAPTER 3. Role of Early Growth Response 1 (EGR-1) Transcription Factor in Osteoblast Response to Metastatic Breast Cancer Cells...96 Abstract 96 Introduction.97 Materials & Methods 102 Cells 102 Breast Cancer Cell Conditioned Medium.105 Alkaline Phosphatase Staining Von Koss Saining.106 Co-culture of Osteoblasts and Breast Cancer Cells Microscopy 107 ELISAs and Cytokines.107 TGF-β Receptor Inhibitor 108 Marligen Transcription Factor Assay 109 Transfection of MC3T3-E1 Osteoblasts shrna EGR RNA Isolation and RT-PCR 113 Cytoskeletal Staining Western Blot..116 Nuclear Extracts viii
9 Results Transcription Factor Activity in Osteoblasts Exposed to Metastatic Breast Cancer Cell Conditioned Medium.118 Decreased Expression of EGR-1 in MC3T3-E1 Cells Does Not Alter Osteoblast Differentiation 136 Osteoblasts Expressing Lower Levels of EGR-1 Have Decreased Production of Inflammatory Cytokines in the Presence of Metastatic Breast Cancer Cell Conditioned Medium.146 Breast Cancer Cells Attach and Colonize Osteoblasts Lacking EGR-1 Expression 148 Chronic Exposure to Metastatic Breast Cancer Cell Conditioned Medium Does Not Alter Morphology or Actin Stress Fibers in Osteoblasts with Decreased EGR-1 Expression Chronic Exposure to Metastatic Breast Cancer Cell Conditioned Medium Decreases Expression of Osteoblast Differentiation Markers..163 Smad3 Knockout primary calvarial osteoblasts exposed to metastatic breast cancer cell conditioned medium increase production of inflammatory cytokines 169 Discussion.179 References 184 CHAPTER 4. Discussion..187 Discussion.187 References 197 ix
10 LIST OF FIGURES Figure 1.1: Steps in metastatic process Figure 1.2: Pictoral representation of chemokines..16 Figure 1.3: Pictoral representation of the vicious cycle of bone degradataion 19 Figure 1.4: Schematic of TGF-β Signaling Figure 1.5: Intramembraneous ossification...29 Figure 1.6: Endocondral ossification Figure 1.7: Diagram of osteoblast differentiation Figure 2.1: Expression of osteoblasts differentiation genes over time.64 Figure 2.2: Co-culture of MC3T3-E1 osteoblasts with metastatic breast cancer cells, MDA-MB-231 GFP, in conventional cell culture...66 Figure 2.3: Alkaline phosphatase and Von Kossa stained MC3T3-E1 cells at various stages of osteoblast differentiation 68 Figure 2.4: Maturation of MC3T3-E1 and co-culture with MDA-MB-231 GFP cells in the bioreactor..71 Figure 2.5: Schematic structure of Quantum Dots..74 Figure 2.6: MC3T3-E1, MDA-MB-231, and MDA-MB-435 cells labeled with 10nM Qdot Figure 2.7: MDA-MB-231 GFP cells labeled with various concentrations of Qdot Figure 2.8: MDA-MB-231 GFP cells labeled with Qdot 655 prior to co-culture with MC3T3-E1 cells..80 Figure 2.9: Fluorescent images of MDA-MB-231 GFP cells labeled with Qtracker 655 for 2 hrs, 24 hrs, and 48 hrs..81 Figure 2.10: QTracker 655 does not affect breast cancer cell growth. MDA- MB-231 GFP cells were incubated with 10 nm QTracker x
11 Figure 2.11: TEM images of Qdot-labeled breast cancer cellls co-cultured with osteoblasts for 24 hours..84 Figure 2.12: Transmission electron microscopy (TEM) and confocal analysis of MC3T3-E1 osteoblasts alone or in co-culture with metastatic breast cancer cells...85 Figure 3.1: Schematic of Marligen Transcription Factor Assay Figure 3.2: Percent change in binding of transcription factors in osteoblast exposed to metastatic breast cancer cell conditioned medium compared to vehicle medium controls..121 Figure 3.3: IL-6 secretion by osteoblasts treated with metastatic breast cancer cell conditioned medium, TGF-β, or metastatic breast cancer cell conditioned medium containing a neutralizing antibody to TGF-β.122 Figure 3.4: TGF-β induced IL-6 secretion from MC3T3-E1 osteoblasts 123 Figure 3.5: EGR-1 protein and mrna levels increased in MC3T3-E1 cells treated with metastatic breast cancer cell conditioned medium or TGF-β..124 Figure 3.6: EGR-2 was not induced in MC3T3-E1 cells treated with metastatic breast cancer cell conditioned medium or TGF-β Figure 3.7: Cytokine levels increased in supernatants from MC3T3-E1 cells treated for 4 hours with metastatic breast cancer cell conditioned medium Figure 3.8: Schematic of the pgeneclip neomycin vector (Promega) used by SuperArray Biosciences to generate the four separate plasmids containing shrna sequences targeting EGR1 and one plasmid that has a scrambled shrna sequence.131 Figure 3.9: PstI restriction enzyme digestion of purified shegr1 plasmids Figure 3.10: Transfection optimization of Fugene 6 transfection reagent in MC3T3-E1 cells 133 Figure 3.11: MC3T3-E1 cells transfected with shrna plasmids targeting murine EGR-1 show decreased EGR-1 RNA expression Figure 3.12: RNA expression of EGR-1 in clonal populations of MC3T3-E1 cells used to generate MC3T3-E1-shEGR1 and MC3T3-E1-Neg cell lines 138 Figure 3.13: MC3T3-E1-Neg and MC3T3-E1-shEGR1 cells differentiate in culture.139 xi
12 Figure 3.14: MC3T3-E1-Neg and MC3T3-E1-shEGR1 cells express Type I collagen and osteocalcin.141 Figure 3.15: EGR-1 and EGR-2 protein expression in MC3T3-E1-Neg and MC3T3-E1-shEGR1 cells 142 Figure 3.16: Fold induction of RNA expression of EGR family members in MC3T3- E1-Neg, MC3T3-E1-shEGR1, and MC3T3-E1 cells.144 Figure 3.17: Cytokine levels of MC3T3-E1-shEGR1 cells treated with metastatic breast cancer cell conditioned medium remained lower than MC3T3-E1-Neg cells treated with metastatic breast cancer cell conditioned medium Figure 3.18: Cytokine levels from MC3T3-E1-Neg and MC3T3-E1-shEGR1 cells treated with metastatic breast cancer cell conditioned medium Figure 3.19: Cytokine levels from MC3T3-E1-Neg and MC3T3-E1-shEGR1 cells treated with metastatic breast cancer cell conditioned medium or metastatic breast cancer cell conditioned medium containing a TGF-β receptor I inhibitor Figure 3.20: Cytokine levels from MC3T3-E1-Neg and MC3T3-E1-shEGR1 cells treated with metastatic breast cancer cell conditioned medium containing a TGFβ receptor I inhibitor.156 Figure 3.21: Cytokine levels from MC3T3-E1-Neg and MC3T3-E1-shEGR1 cells treated with TGF-β Figure 3.22: TGF-β receptor I inhibitor downregulates EGR-1 and P-Smad Figure 3.23: Metastatic and metastasis suppressed breast cancer cells attached to osteoblasts lacking EGR-1 expression.164 Figure 3.24: MC3T3-E1-shEGR1 cells cultured with conditioned medium from MDA-MB-231 cells maintained actin stress fiber arrangement.166 Figure 3.25: MC3T3-E1-Neg and MC3T3-E1-shEGR1 did not differentiate when cultured in metastatic breast cancer cell conditioned medium.168 Figure 3.26: Alkaline phosphatase staining of MC3T3-E1-shEGR1 and MC3T3- E1-Neg cells exposed to osteoblast differentiation medium or metastatic breast cancer cell conditioned medium.168 Figure 3.27: Primary calvarial osteoblasts from Smad3 wildtype and Smad3 knockout mice differentiate in culture 172 xii
13 Figure 3.28: Smad3 knockout primary calvarial osteoblasts treated with metastatic breast cancer cell conditioned medium increase production of inflammatory cytokines 173 Figure 3.29: Metastatic breast cancer cells attach and colonize Smad3 knockout primary calvarial osteoblasts..174 Figure 3.30: Western blot analysis of EGR-1 and P-Smad3 in Smad3 wildtype and Smad3 knockout primary calvarial osteoblasts Figure 3.31: MC3T3-E1 cells show an increase in phosphorylated Smad2 when exposed to metastatic breast cancer cell conditioned medium 177 Figure 3.32: Western blot analysis of phosphorylated Smad2 and Smad3 in Smad3 wildtype and Smad3 knockout primary calvarial osteoblasts..178 Figure 3.33: Schematic of TGF-β Signaling 183 xiii
14 LIST OF TABLES Table 2.1: PCR primer sequences and conditions...60 Table 3.1: Insert sequences of each shrna plasmid targeting EGR Table 3.2: PCR primer sequences and conditions.115 Table 3.3: Fifty transcription factors screened in the Marligen Transcription Factor Assay.119 Table 3.4: Human cytokine levels measured in human metastatic breast cancer cell conditioned medium collected from MDA-MB-231 cells.128 Table 3.5: Format of 96-well plate used to measure EGR-1 and GAPDH expression by RT-PCR 135 Table 3.6: Average Ct values obtained by RT-PCR for EGR family members 144 xiv
15 CHAPTER 1 Introduction Introduction to Material Presented in this Thesis The research presented in this thesis investigates two different aspects of metastatic breast cancer cell interaction with osteoblasts. Therefore, the topics discussed in the introduction will cover information necessary to appreciate the importance and relevance of both studies. The findings are organized into two distinct chapters, each having an abstract, short introduction, materials and methods pertaining to the chapter, results, and a brief discussion. Chapter 2 is dedicated to the validation of a particular three-dimensional bioreactor culture system. This bioreactor was utilized for the growth of osteoblasts, and to monitor the direct interaction of metastatic breast cancer cells with osteoblasts. Cocultures conducted in the bioreactor culture system were compared to cocultures conducted using conventional cell culture methods. Chapter 3 focuses on the role of early growth response-1 transcription factor in osteoblast differentiation and the osteoblast response to metastatic breast cancer cells. The following introduction is meant to give the reader an understanding of breast cancer metastasis to bone, the direct effect breast cancer cells have on osteoblasts, the complex nature of the bone environment and osteoblast differentiation, as well as current in vitro model systems used for cancer research. 1
16 Breast Cancer Statistics in the United States The research presented herein focuses on the response of osteoblasts to metastatic breast cancer cells. In order to understand the relevance of this research, the prevalence and impact of the disease is discussed first. Breast cancer ranks second to lung cancer as the cause of cancer deaths in women. In 2008 alone, it was estimated that 1,437,180 new cases of cancer would emerge in the United States [1,2]. Of those, 184, 450, or about 13 %, would be new breast cancer cases, 99% of them appearing in females. Upon diagnosis of breast cancer, the 5-year survival rate for local disease is 98% [1,2]. The 5-year survival rate drops to around 20% once breast cancer has metastasized, or spread, to distant organs [3,4,5]. Additionally, women under the age of 40 tend to have more aggressive tumors that are not as responsive to treatment; as a result, the 5-year survival rate for women diagnosed under the age of 40 is much lower than women diagnosed over the age of 40. In addition to a decrease in the 5-year survival rate for patients with metastatic breast cancer, their quality of life declines as well. Quality of life includes physical, emotional, social, and cognitive functioning, in addition to symptoms associated with the disease itself [6]. Breast cancer frequently metastasizes to bone, resulting in excess degradation of the bone. This causes intense pain, hypercalcemia, and an increased risk for pathologic fractures [3,4,5]. Earlier detection and improved treatments for cancer have helped prolong the lives of cancer patients, resulting in an increase in the 5-year survival for all cancers from 50% in the 1970 s to 66% reported in 2003 [2,3]. However, 2
17 extended survival implies that patients are dealing with various side effects of cancer for longer periods of time. Therefore, it is crucial to understand the mechanisms by which metastatic cancer cells colonize and influence secondary sites in order to not only extend the length of survival for and improve the quality of life of cancer patients, but potentially prevent metastasis. Reaching a Secondary Site: the Metastatic Process The studies presented in the following chapters focus on the interaction of metastatic breast cancer cells with osteoblasts and emulate the post-metastatic aspect of breast cancer progression. However, it is important to understand how cancer cells reach a secondary site to recognize the future implications of these studies. Ninety-percent of the deaths caused from solid tumors are due to metastasis of cancer cells from the primary tumor [7, 9]. The metastatic cascade is initiated when the primary tumor develops neo-vasculature, termed the angiogenic switch. The neo-vasculature allows cancer cells to dislodge from the primary site and intravasate, or gain access to the hematogeneous circulation, which provides transportation to other organs of the body [7, 8, Figure 1.1]. Tumor cells can also gain access to the hematogeneous circulation through lymphangiogenesis. Cancer cells face several challenges during travel through the circulatory system prior to extravasation, or exiting the bloodstream, and colonization of a secondary site. Some of these challenges include detection and destruction by immune cells, as well as, the shear force of bloodflow. It is 3
18 thought that cancer cells exploit platelets to survive the hematogeneous circulation. Nash and colleagues report that it has been observed for over a decade that malignancies induce a hypercoagulable state, and that disruption of the cancer cell platelet interaction leads to a decrease in metastasis to other organs [7, 9, 10]. Exactly when cancer cells extravasate varies amongst tumor types. There are several theories on how tumor cells exit the bloodstream. Al- Mehdi and colleagues propose that tumor cells may grow uncontrollably within the intravascular space until they burst through the endothelial barrier [11]. In 2004, Khanna showed that inhibiting expression of ezrin, the cytoskeletal anchoring protein, in osteosarcoma cells decreased extravasation in the lung [12]. Additionally, cancer cells may secrete factors to aid in extravasation and subsequent metastatic colonization. VEGF can activate Src family kinases in endothelial cells and is able to disrupt endothelial cell junctions, which would facilitate extravasation. Criscuoli, in 2005, reported that Src knockout mice were protected from lung metastasis of VEGF-secreting cancer cells [13]. In order for cancer cells to form clinically detectable metastases, cancer cells must be able to survive in the secondary site, colonize, and recruit blood vessels for nourishment [14]. Several theories exist to explain the preferential metastasis of cancer cells to certain organs; however all of them share an underlying theme: compatability of tumor cells to an organ microenvironment. This concept is often referred to as the seed and soil hypothesis, which originated from the pioneering work done by Stephen Paget and is discussed in more detail in the following section. 4

19 Figure 1.1: Steps in metastasic process. Cells must detach from the primary tumor and invade adjacent tissue in order to enter the lymphatic or circulatory system. The circulating tumor cells arrested in distant organs and extravasate, or enter the surrounding microenvironment. The cell may proliferate and form clinically detectable metastasis or remain dormant. It is unknown what causes a cell to proliferate or remain dormant, however, it is thought to depend on the microenvironment of the secondary site. McGee, S., et al. EMBO reports 7, 11, (2006) Copyright license agreement obtained from Nature Publishing Group 5
20 Choosing a Secondary Site In 1889, after reviewing the autopsies of 735 women with breast cancer, an English surgeon, Stephen Paget, hypothesized that the metastatic process did not occur by chance, but that metastatic tumor cells referred to as seeds possessed intrinsic properties that attracted them to specific microenvironments of distant organs, referred to as soil [15, 16]. Therefore, he proposed that metastases occurred when the seed and soil were compatible due to a growth advantage that was provided at the secondary site for those metastatic cancer cells that had a higher affinity for that particular microenvironment. Others, like James Ewing, challenged Paget s hypothesis by proposing that metastases to secondary sites is a result of mechanical factors due to the anatomic structure of the vascular system [16, 17]. Ewing stated that the first connected organ would sustain a higher burden of metastatic colonization due to an increased number of metastatic cells encountered, and therefore, an increased number of trapped metastatic emboli in the organ [16, 17, 18]. Work done by Coman and coworkers in 1951 showed that direct intravascular injection of Brown-Pearce rabbit tumor cells into rabbits resulted in metastases to some, but not all, visceral organs [19]. In the organs that rarely developed metastasis, the tumor cells were lodged in the arterioles rather than in the capillaries as seen in the organs with a greater incidence of metastases. Then in 1977, work done by Fidler and Kripke showed that B16 melanoma tumor cell clones derived from individual cells of the same parent tumor varied in their ability to form pulmonary nodules following intravenous inoculation [20]. The results of this study showed that while tumor 6
21 cell attachment in the capillaries at distant organ sites occurred, proliferation and growth of the tumor cells happened only in certain secondary sites supporting the idea that the microenvironment of the secondary site is not favorable to all tumor cells, or Paget s seed and soil hypothesis. In summary, there are several more recent theories stemming from the hypotheses of Stephen Paget and James Ewing that are shaping current research efforts. One theory suggests that tumor cells enter all organs at the same rate, but only those organs that have appropriate growth factors result in tumorogenesis. A similar theory proposes that organs secrete chemokines that signal tumor cell migration to and subsequent growth in the organ. An additional hypothesis suggests that expression of adhesion molecules on the cells in the endothelium of blood vessels in certain organs entraps circulating tumor cells [21, 22]. Auberbach once said, Those individuals who study the properties of the host environment should not be ignored. Not only are the observations of the soil useful, they provide essential information without which we will not be able to understand the nature of the metastatic process [16]. The research presented here examines the contribution of the osteoblast, which is part of the bone microenvironment soil, which might be fostering seed growth for breast cancer cells. The Bone as a Secondary Site for Breast Cancer Metastasis Breast cancer preferentially metastasizes to bone. In fact, at the time of autopsy, over 70% of breast cancer patients showed metastasis to the bone [3]. 7
22 Carnett and Howell published work in 1930 showing breast cancer metastasis to the skull, vertebrae, and bones of the leg, hands, feet, and pelvis [23]. Since then much research has been conducted on various aspects of breast cancer metastasis to bone. In 2006, Phadke, et al. showed that metastatic breast cancer cells very early colonized the ends, or epiphysis and metaphysis, of long bones opposed to the diaphysis, or shaft of the bone [24]. The ends of long bone contain trabecular bone intertwined with hematopoietic and fatty marrow, as well as vascular sinusoids [25, 26, 27]. Bone metabolism is a tightly regulated and continuous process requiring the coordination of osteoblasts, osteoclasts, and osteocytes. Osteoblasts arise from the proliferation and differentiation of mesenchymal stem cells and synthesize osteoid, which becomes mineralized bone matrix. After synthesizing new osteoid, osteoblasts either undergo apoptosis or remain embedded in the bone and become osteocytes [28, 29]. On the other hand, osteoclasts are multi-nucleated cells of the monocytemacrophage lineage, which resorb bone. Osteoblasts express receptor-activator of nuclear factor kappa B ligand (RANKL), which binds to its receptor RANK, found on osteoclasts. In the presence of macrophage colony stimulating factor (M-CSF), monocytes fuse to form large, multi-nucleated osteoclasts capable of binding to the bone matrix. They secrete acid and lysosomal enzymes to degrade bone. Activated osteoclasts erode bone at a rate of about 20um a day until a small pit in the bone is formed. This process can take 4 12 days. Upon pit formation, osteoclasts deposit a cement substance void of collagen. The site-specific matrix deposition 8
23 by osteoblasts in the pit formed by osteoclasts is poorly understood; however, in 1969 Harris and Heaney showed patients with high rates of bone resorption also had high rates of bone formation and coined the term coupling to define the maintenance of steady-state skeletal mass [30]. Coupling refers to the release of factors from resorbing bone that leads to the activation and differentiation of osteoblasts. Howard and Baylink presented evidence for a coupling factor present in the medium of resorbing bone that attracts osteoblasts and stimulates their differentiation [31]. The coupling factor was actually found to be a cocktail of signaling molecules including insulin-like growth factor (IGF1 and 2), transforming growth factor beta (TGF-β) and bone morphogenic proteins (BMPs). In 2002, Sheu and colleagues showed that osteoblasts may be able to distinguish resorbed bone by recognizing tartrate resistant acid phosphatase (TRAP) through binding of the glypican 4 receptor expressed by osteoblasts to TRAP in the resorption pit [26]. Additionally, calcium has been shown to stimulate osteoblast (MC3T3-E1 cell line) migration. Therefore, the calcium released during the bone resorption process could attract osteoblast precursors to the pit where they differentiate and deposit bone matrix [32]. Breast Cancer Cells Alter Bone Remodeling Once breast cancer cells enter the bone microenvironment, the tightly regulated process of bone remodeling is disrupted resulting in increased osteolysis. To explain the increase in osteoclast activity seen in breast cancer metastasis to bone, Guise and colleagues proposed the vicious cycle of bone 9
24 degradation [33] (Figure 1.2). According to this paradigm, when breast cancer cells reach the skeleton they release parathyroid hormone related protein (PTHrP). In the presence of PTHrP, osteoblasts increase expression of RANKL, which binds to its receptor, RANK, on pre-osteoclasts signaling them to differentiate and to resorb bone. Factors such as transforming growth factor beta (TGF-β), released from the matrix during osteoclast-mediated degradation, stimulate the breast cancer cells to proliferate, producing yet more PTHrP, thus perpetuating the vicious cycle. Suva described a RANKL independent mechanism for activating osteolysis, involving interleukin-8 (IL-8) secreted by tumor cells [34]. In this model, overexpression of IL-8 by the breast cancer cells occurs before the initiation of the vicious cycle. IL-8 directly stimulates osteoclast activity resulting in a release of factors from the bone matrix, such as TGF-β, which signals the cancer cells to secrete PTHrP thus driving the vicious cycle. Inhibition of osteoclast activity is accomplished by administration of bisphosphonate drugs, thus reducing further bone degradation in breast cancer patients with metastasis to bone. However, the lack of bone deposition to repair existing lesions emphasizes the need to also investigate osteoblast function. Previous work in our laboratory reported that TGF-β found in conditioned medium from MDA-MB-231 metastatic breast cancer cells blocked osteoblast differentiation; however, neutralizing TGF-β in the metastatic breast cancer cell conditioned medium did not reverse the adverse effects seen in the rearrangement of the actin cytoskeleton or the altered morphology [35]. 10
25 Additionally, our laboratory has reported that osteoblasts increased inflammatory cytokine production in the presence of metastatic breast cancer cell conditioned medium [36]. Therefore, these data indicate that osteoblasts do not differentiation properly, which contributes to decreased bone deposition, and increase production of inflammatory cytokines in the microenvironment. TGF-β in the breast cancer conditioned medium is responsible for some, but not all, of the osteoblast response to metastatic breast cancer conditioned medium. It is of interest to investigate the mechanisms used by breast cancer cells and / or osteoblasts to generate an osteoblast inflammatory response to metastatic breast cancer cells. More effective therapeutic drugs can be designed by identifying intracellular signaling targets altered in metastatic breast cancer cells and osteoblasts. The following sections will provide more information on the cytokines measured throughout this study and the transcription factor, early growth response-1, selected for shrna silencing in MC3T3-E1 cells. Chemokines and Growth Factors in the Bone Microenvironment Chemokines are secreted proteins that can influence cell migration, as well as cell differentiation and signaling [40, 89]. There are four subfamilies of chemokines based on the arrangement of the first two of four cysteine residues. If the first two cysteines are adjacent to one another the chemokine is part of the CC subfamily. If the first two cysteines are separated by another amino acid, the chemokine is part of the CXC subfamily; while the CX3C subfamily has three amino acids between the first two cysteines. The C subfamily has two cysteine 11
26 residues [37, 90]. There are over 50 chemokines and 20 chemokine receptors (Figure 1.3). Chemokine receptors are G protein-coupled receptors that contain an N-terminal extracellular domain which binds to the chemokine, followed by seven transmembrane domains linked by alternating intracellular and extracellular loops, and a C-terminal intracellular domain that contains serine / threonine residues which become phosphorylated after ligand binding [37, 90, 91]. Of the greater than 50 chemokines identified to date, five are of importance to this study regarding osteoblast response to metastatic breast cancer cells. Monocyte chemoattractant protein 1 (MCP-1), eotaxin, macrophage inflammatory protein 2 (MIP-2), monokine induced by gamma interferon (MIG), and keritinocyte chemoattractant (KC) were shown to be upregulated in osteoblasts in response to human metastatic breast cancer cells. MCP-1 and eotaxin are members of the CC chemokine subfamily. Murine macrophage inflammatory protein 2 (MIP-2) or human interleukin 8 (IL-8), murine KC or human growth related oncogene α (GROα), and monokine induced by gamma interferon (MIG) are members of the CXC chemokine subfamily. All of these chemokines are expressed by osteoblasts and function to stimulate angiogenesis, osteoclast activity, inflammation, and to recruit monocytes and neutrophils [38, 39, 40]. Increased production of these cytokines within the bone microenvironment promote increased osteolysis, which releases calcium into the microenvironment, creating a microenvironment rich in factors that inhibit tumor cell apoptosis and promote tumor growth [92 and within]. 12
27 Interleukin-6 (IL-6) is another inflammatory cytokine found in culture supernatants. Much research has been done on IL-6 signaling and its role in osteoclastogenesis; therefore a summary is presented the next section. Interleukin-6 (IL-6) IL-6 is a 24-kDa, multi-functional cytokine that signals through a type I cytokine receptor complex composed of the ligand binding IL-6Rα chain (CD126) and the signal transducing gp130 (CD130) protein. There is also a soluble form of the IL-6Rα chain referred to as sil-6rα. IL-6 binds to the 80kDa IL-6Rα, but this receptor has a short intracytoplasmic portion and is unable to transduce signal. In 1989, Taga and colleagues co-immunoprecipitated a 130 kda protein with the 80kDa IL-6 receptor. They named the protein gp130. Gp130 was found to be ubiquitously expressed in all cells, even those cells lacking expression of CD126, implying many cytokines could recruit and use this receptor to transduce signal. Upon binding to CD126, gp130 is recruited and downstream signaling pathways such as the Janus Kinase (JAK) / Signal Transducers and Activators of Transcription (STAT) and Mitogen Activated Protein Kinase (MAPK) are stimulated [41]. IL-6 is a known stimulator of osteoclastogenesis; however, IL-6 is unable to directly stimulate osteoclastogenesis in osteoclast progenitor cells. In 1995, Udagawa and colleagues demonstrated that osteoblasts constitutively expressing IL-6R could induce osteoclast formation when co-cultured with normal spleen cells and treated with human IL-6 alone. No osteoclast formation was 13
28 seen when co-cultures of osteoclast progenitors from transgenic mice overexpressing IL-6R with normal osteoblasts were treated with human IL-6 [42]. Therefore, IL-6 stimulates osteoclastogenesis via osteoblasts. Other laboratories have shown that IL-6 causes a decrease in osteoblast production of the soluble RANK decoy receptor, osteoprotegerin (OPG), while increasing expression of RANKL, which promotes osteoclast formation [43]. IL-6 and PTHrP have been shown to stimulate one another in human osteoblasts. Exogneous PTHrP causes an increase in IL-6 expression in osteoblasts by way of the protein kinase C (PKC) pathway. IL-6 can also stimulate PTHrP expression in osteoblasts through the Ras / MAPK pathway [43, 44]. According to the vicious cycle of bone degradation, breast cancer cells also secrete PTHrP. PTHrP and IL-6 can enhance osteoclastogenesis through osteoblasts. Increased serum levels of IL-6 are correlated with a poor prognosis. IL-6 can activate the JAK / STAT pathway and more than 50% of primary breast tumors and tumor-derived cells lines have persistently activated stat3, a downstream component of the JAK/STAT pathway [45]. Normally, stat activation is transient. However, many primary tumors show constant phosphorylation of stat3. Clinical studies have provided evidence that stage II breast cancer patients with increased levels of phosphorylated stat3 (p-stat3) show incomplete response to neo-adjuvant therapy. This is an indicator of poor prognosis. Additionally, researchers using cell culture and xenograft models have demonstrated that inhibiting p-stat3 in tumor cells leads to an increase in apoptosis and chemosensitivity, and a decrease in angiogenesis [46]. MDA-MB- 14
29 231, MDA-MB-435, and MDA-MB-468 human metastatic breast cancer cell lines all show increased pstat3 activation compared to the immortalized breast epithelial cell line, MCF10A [45, 46]. Early Growth Response -1 (EGR-1) Transcription Factor and Inflammatory Cytokine Production Increased expression of early growth response 1 (EGR-1), also known as Krox24 and zif268, has been correlated with increased expression of inflammatory cytokines. DNA binding domains have been found in the promoter regions of PDGF-A, PDGF-B, TGF-β, MCP-1, M-CSF, TF, and IL-6 cytokines [93, 94]. An increase in EGR-1 activity was seen in osteoblasts treated with metastatic breast cancer cell conditioned medium. Due to a lack of commercially available inhibitors to EGR-1, shrna technology was used to silence EGR-1 expression in MC3T3-E1 osteoblasts in this present study. More information is provided on EGR-1 and the EGR family of transcription factors in this section. EGR-1 belongs to the zinc finger family of transcription factors. Zinc finger proteins use zinc ions as structural components and more than 10 different classes of zinc binding motifs have been identified since The C2H2 motif is the most abundant in eukaryotic transcription factors. EGR-1, -2, -3, and -4 comprise a subfamily of zinc finger transcription factors belonging to the Kruppelrelated genes, containing three consecutive C2H2 zinc finger motifs linked by a conserved sequence, TGEKPF/Y. The four EGR proteins in this family have 15
, the receptors for the CC subclass follow in red (next eleven), and the receptors for the C and CX 3 C subclasses are shown in green (bottom")
30 Figure 1.2: Pictoral representation of chemokines. Chemokines are divided into subclasses based on the positioning of the cysteine residues at the N-terminus. Receptors for the CXC subclass are shown in blue (top six), the receptors for the CC subclass follow in red (next eleven), and the receptors for the C and CX 3 C subclasses are shown in green (bottom two). Receptor-binding assays have helped to identify the receptor-chemokine binding pairs indicated by the solid lines drawn between the receptor and the chemokine name. Modified from Proudfood, Amanda E.I. Nature Reviews Immunology 2, (February 2002). Copyright license agreement obtained from Nature Publishing Group. 16
31 highly related DNA-binding zinc finger domains. The regions of the protein on either side of the DNA-binding domain give specific functionality to each protein. All four EGR proteins bind to the same consensus sequence, GCG G/TGG GCG. A distinct role for each of the EGR proteins has been determined using knockout mice. EGR-1 female knockout mice are infertile due to a loss of leuteinizing hormone B (LH-B). EGR-2 knockout mice show defects in nerve development, whereas, EGR-3 knockout mice do not form muscle spindles. Male EGR-4 knockout mice are infertile due to arrest in spermatogenesis [47]. EGR-2 has been shown to regulate cell proliferation and is linked with proper bone formation. EGR-2 knockout mice show defects in endochondral ossification. EGR-2 knockout mice have reduced bone mineral density, lack trabecular bone formation in the growth plates, show decreased size of long bones, as well as deformities in the mandible. An increase in EGR-1 expression is correlated with increased production of inflammatory cytokines. Harja et al. showed that transcripts and protein for EGR-1 are upregulated in mononuclear phagocytes and smooth muscle cells in hypoxic conditions both in vitro and in vivo [48]. Additionally, EGR-1 has been labeled as a master switch of the host response to ischemic stress [49]. EGR-1 knockout mice do not show enhanced expression of inflammatory cytokines in the lung on ischemia / reperfusion injury [49]. In vivo samples of human emphysematous lung taken during lung reduction surgery show higher levels of EGR-1 transcript than normal lung tissue. Studies have also been conducted on 17
32 patients suffering from myocardial infarction. These studies also show that EGR- 1 levels are upregulated in the myocardium compared to control patients [50]. In summary, these data support that each EGR family member has a specific function even though the DNA binding domains are highly conserved. While research supports a link between increased EGR-1 expression and increased inflammatory cytokine expression, little research has been conducted on the role of EGR-1 in osteoblasts specifically. Additionally, studies have shown that EGR-1 expression is induced by TGF-β and we have previously reported that metastatic breast cancer cell conditioned medium contains TGF-β, supporting a likely role for EGR-1 in osteoblast derived cytokine production in response to metastatic breast cancer cell conditioned medium [35, 95]. Transforming Growth Factor B (TGF-β) TGF-β is a diverse growth factor that elicits a wide variety of responses from cells. Extensive research has been conducted on the TGF-β signaling pathways and its role in disease progression. To better understand proteins and interactions discussed in subsequent chapters, a detailed overview of TGF-β signaling is described below. TGF-β is produced by many cells, including osteoblasts, and stored in the bone matrix. During bone resorption TGF-β is released into the microenvironment. Five isoforms of TGF-β have been reported in the skeleton. Homodimers of TGF-β 1, B2, and B3 as well as heterodimers with the type 2 subunit, TGF-β 1.2 and B2.3 have been identified. TGF-β is 18

33 Figure 1.3: Pictoral representation of the vicious cycle of bone degradation. Once in the secondary site microenvironment, tumor cells secrete factors including PTHrP which can stimulate osteoblast expression of RANKL. RANKL then binds to its receptor, RANK, found on osteoclasts increasing osteoclast activity. As osteolysis occurs, factors from the bone are released, such as TGFβ, that can further stimulate tumor secretion of PTHrP and others, aiding bone breakdown and the survival and propagation of tumor cells. Virk, M.S., and Lieberman, J.R. Tumor Metastasis to Bone, Arthritis & Therapy 2007, 9 (Suppe1), S5. Copyright remains with article s corresponding author according to publisher, therefore permission to use figure in dissertation was obtained from Lieberman, JR. 19
34 mainly found in its inactive form, bound by the latency associated protein (LAP). TGF-β is a member of the TGF-β Superfamily of molecules. Other members of this family include nodal, activins, and bone morphogenic proteins (BMPs). TGFβ is secreted from cells in a latent form and is unable to bind the TGF-β receptor. Latent TGF-β is synthesized as a 390 amino acid propeptide. This propeptide is then cleaved at an arg-arg cleavage site located between amino acids 278 and 279. Homodimers of the 112 amino acids from the carboxy terminus of the propeptide yield the 25kDa mature TGF-β. From the remnant NH2-terminus propeptide, 249 amino acids homodimerize to form the LAP, which remains noncovalently associated to the mature TGF-β protein. TGF-β becomes biologically active when the LAP protein dissociates from the mature TGF-β protein [51, 52]. The mechanisms by which the LAP protein dissocate from TGFβ are unclear, however, latent TGF-β can be activated by transient treatment with acid, base, heat, or chaotrophic agents [52]. Once TGF-β is biologically active, it can bind to TGF-β type II receptor dimers on the cell surface. The binding of ligand to the TGF-β type II receptors causes recruitment of the TGF-β type I receptors resulting in the formation of a heterotetrameric receptor complex. TGF-β type II receptors are serine/threonine kinase receptors which phosphorylate the type I receptors initiating a signal cascade. There are 5 receptor-regulated smads (R-Smad), inlcuding Smad1, -2, -3, -5, and 8. The binding of R-Smads to the activated type I receptor is mediated through a protein called the smad anchor for receptor activation, or SARA. SARA recruits R-Smads to the receptor complex and orients the R-Smad 20
35 such that the serine residue on the C-terminus of the R-Smad faces the catalytic region of the type I receptor allowing for phosphorylation of the serine residue on R-Smad. Phosphorylation of the serine residue on the R-Smad results in a conformational change of the R-Smad enabling it to dissociate from the TGF-β - SARA receptor complex. TGF-β signaling occurs through two different R-Smad mediated pathways. Activin, nodal, and TGF-β signal through Smad 2 and 3, while BMPs and growth and differentiation factors (GDFs) signal through Smad 1, 5, and 8. The conformational change resulting from the phosphorylation of the R-Smads opens up an amino acid region of the protein that has high affinity for Smad4, referred to as a co-smad, which aids in translocation to the nucleus [53]. TGF-β signaling pathways also induce expression of inhibitory Smads (I- Smads), Smad6 and Smad7, causing a ligand-induced negative feedback system. Activin / TGF-β signaling induces expression of Smad7 while BMPs induce the expression of Smad6. The I-Smads are thought to prevent phosphorylation of the R-Smads by competing for binding to the typei receptor. Additionally, I-Smads are thought to interefere with transcription in the nucleus by linking to histone deacetylases (HDACs) preventing transcription [54]. TGF-β can signal through non-smad pathways as well, including the mitogen-activated protein (MAP) kinase pathway and the Rho-like GTPases [51, 55, 56]. Interestingly, three different MAP kinase pathways can be activated by TGF-β independent of Smad signaling [56, 60]. Yu and Itoh reported separately in 2002 and 2003 respectively, that TGF-β was still able to activate the JNK and 21
36 p38 MAP kinase pathways when the L45 loop of the TGF-β type I receptor (TGFBRI) was altered thus inhibiting Smad binding [56, 57]. There is evidence that crosstalk exists between the Smad-dependent and Smad-independent TGF-β signaling pathways. Several investigators show that TGF-β induces Erk activation within 10 minutes in epithelial, breast cancer, and fibroblast cells [51]. However, other investigators show a peak in p38 MAPK and JNK activation hours post TGF-β stimulation [51, 55, 58]. These data support the idea that TGF-β induces a bimodal MAP kinase response; one response is immediate and early where TGF-β directly activates MAP kinase pathways and the other response is Smad-dependent, requiring more time to activate MAP kinase pathways [55, 56, 57]. Tumor cells respond to TGF-β differently depending on disease progression. In early stages of disease, tumor cells still exhibit growth inhibition to TGF-β. However in later stages of disease progression, tumor cells lose sensitivity to the growth inhibition and TGF-β enhances tumor cell motility due to epithelial to mesenchymal transitions, which aid in tumor cell metastasis to secondary sites. Tumor cells have been shown to have mutations in TGFBRI, TGFBRII, and SMAD genes causing a decrease in the sensitivity to TGF-β signaling. In particular, gastrointestinal cancers show mutations in TGFBRII; whereas pancreatic and colon cancers frequently show mutations in the SMAD genes. Breast cancer tumors have shown little to no mutations in TGFBRI, TGFBRII, or SMAD genes. Breast cancer tumors instead show decreased expression of TGFBRII on the surface, which facilitates evasion of TGF-β 22

37 Figure 1.4: Schematic of TGF-β Signaling. Active TGF-β binds to TGF-β receptor II recruiting TGF-β receptor I to form a heterotetrameric complex. The type II receptor phosphorylates the type I receptor causing a signal cascade. TGF-β can signal through R-Smads, which complex with Smad4 (co-smad) to translocate to the nucleus and activate gene transcription. 23
38 induced growth inhibition [59]. Results from studies have also shown that patients with metastatic breast cancer have elevated plasma levels of TGF-β1 compared to healthy donors. More importantly, the probability of survival during a two-year period was drastically lower in patients with metastatic disease and elevated plasma TGF-β1 levels (10%) compared to patients with metastatic disease and lower TGF-β1 plasma levels (53%) [60]. Development of Therapeutic Strategies for Breast Cancer Metastasis to Bone Most malignant tumors show organ-specific patterns for secondary tumor metastases. For example, colon carcinomas usually metastasize to the liver and lung, but almost never to the kidneys, intestine, or muscle [16]. Bone is a common site for metastasis of many cancers including lung, breast, prostate, kidney, thyroid, and multiple myeloma. The skeleton carries out a number of important functions, including storing and releasing minerals such as calcium, magnesium, phosphorus, and sodium, as well as housing bone marrow, which produces and stores blood cells. Therefore when cancer cells enter the bone microenvironment they alter the normal function of bone with many detrimental consequences [61]. While bone metastases can be osteoblastic and osteolytic, breast cancer metastases to bone are mainly lytic. Bisphosphonates are a group of drugs including pamidronate that inhibit osteoclast activity and induce osteoclast apoptosis without inhibiting bone mineralization [62]. While preventing further bone destruction and the release of minerals into the microenvironment are 24
39 important and necessary to treat metastatic breast cancer patients, it is just as important to aid bone deposition. In order to more efficiently accomplish that, better in vitro models must be developed to aid in both the identification and testing of more specific therapeutic targets that can be coupled with bisphosphonate treatment. Advancement of In Vitro Model Systems The development of 3-D in vitro models is expanding in the field of cancer research [63, 64, 65]. 3-D in vitro culture systems enable cells (tumor and nontumor) to grow and organize in a more biologically relevant manner, thus enhancing the researcher s ability to observe and manipulate cancer progression. 3-D model systems that more accurately mimic in vivo phenotypes, such as the 3-D cell perfusion-culture system in microfluidic channels, are designed to advance drug toxicity, metabolism, and stem cell differentiation studies [63]. Tumor cells grown in 3-D culture systems exhibit receptor expression and signaling pathway activities more similar to in vivo tumor specimens than do tumor cells grown in conventional cell culture [64]. For example, 3-D cultures aided the determination of several mechanisms glandular epithelial tumors use to fill the lumen during tumorogenesis, including disregulation of both proliferation and apoptosis or activation of oncoproteins, such as ERBB2, CSF1R, SRC, and IGF1R [64, 65, 66, 67, 68, 69]. These processes could not be studied in conventional cell culture. Most importantly the cell-cell contact between tumor and non-tumor cells can be monitored in a 3-D 25
40 culture system unlike in vivo systems, which require specialized microscopy or sacrifice of the animal to examine cell interactions. It is important to advance and validate in vitro culture systems to help identify novel therapeutic targets in cancer progression while decreasing the expense and sacrifice of as many animals. Although the research presented in this thesis does not directly deal with the skeleton, it does involve osteoblasts. Therefore, background information regarding the formation of the skeleton and the differentiation of osteoblasts is important to understand the function of osteoblasts within bone. Additionally, an in vitro bioreactor culture device is used in one of the studies reported here to examine the interaction of metastatic breast cancer cells with osteoblasts. Bone has been studied in vitro for many years, but in order to appreciate the many considerations taken into account in the design of various culture systems, the following sections are dedicated to the function and formation of the skeleton and osteoblast differentiation, followed by a brief history on the evolution of in vitro culture systems of bone [96]. The skeleton The skeleton provides structural support for the body; and the major component of the skeleton, bone, is formed by one of two ossification processes; intramembraneous or endochondral. At the initiation of skeletal development, undifferentiated mesenchymal cells form condensations taking the shape of the skeletal elements to be formed. These mesenchymal cells then differentiate along the osteoblastic (intramembranous ossification) or chondrocytic 26
41 (endochondral ossification) pathway (Figures 1.5, 1.6). Most of the bones in the skeleton are formed through endochondral ossification; however, the periosteal surfaces of long bone, the flat bones in the skull, and parts of the clavical are formed by intramembraneous ossification where the bone arises from mesenchymal cells condensing at ossification centers and differentiating into osteoblasts [71]. The formation of precartilage condensations is a transient stage in skeletalgenesis, that establishes the size, shape, placement, and number of skeletal elements [28]. Growth plates localize to the ends of the skeletal element during the development of long bones. The region of cartilage is surrounded by perichondrium, which is composed of undifferentiated mesenchymal cells. In the growth plates, chondrocytes undergo several stages of differentiation, one being the transition from proliferation to hypertrophy, which is necessary for mineralization of the cartigilous matrix [28]. Chondrocytes deposit an extracellular matrix composed of Type IIb, IX, and XI collagen before further differentiating to a hypertrophic form resulting in a decreased production of Type II collagen, expression of Type X collagen, calcification of the extracellular matrix, and apoptotic death. Hypertrophy is characterized by a 5 to 10 fold increase in volume, expression of alkaline phosphatase, MMP-13, and type X collagen. Type X collagen is only found in the hypertrophic zone of the growth plate. The calcification of the chondrocyte extracellular matrix is vital for vascular invasion. Osteoblasts and osteoclasts enter the zone of hypertrophy along with blood vessels, enabling the calcified cartigilous scaffold to be degraded by osteoclasts, 27
42 while osteoblasts deposit bone matrix consisting mainly of Type I collagen. Endochondral ossification is not only important at the onset of skeletal development, but is part of postnatal growth and fracture repair of bone. The skeleton is composed of two types of bone: cortical and trabecular. Cortical bone is also called compact bone and makes up 80% of the bone in the body [72]. It is found in the shaft of long bones and vertebral endplates. Trabecular bone, also called cancellous bone, makes up the other 20% of bone and is found in the vertebral bodies, the pelvis, and the ends of long bone [72]. Skeletal metabolism is evenly distributed between cortical and trabecular bone even though there is more cortical bone than trabecular bone in the body. This is due to the fact that trabecular bone has a higher metabolic rate per unit volume than does cortical bone. Certain diseases show a preference for cortical versus trabecular bone. For example, hyperparathyroidism usually causes demineralization at cortical sites; while Cushing s disease preferentially destroys trabecular bone of the axial skeleton [72]. Osteoblast Differentiation Osteoblast differentiation is tightly coupled to osteoclast activation; and, therefore, continually occurs in the skeleton. Bone contains preosteoblasts that migrate to resorption pits and differentiate into mature osteoblasts in order to deposit extracellular matrix. Osteoblast differentiation is divided into three distinct phases; the growth or proliferation phase, early differentiation or 28

43 Figure 1.5: Intramembranous Ossification of Bone. Section through pig embryo s head showing an area of the forming skull. Intramembranous ossificiation of bone, or formation of membranous bone, occurs without the need for a cartilage precursor. Instead, mesenchymal cells differentiate into osteoblasts and and secrete osteoid, which calcifies. Modified from University of Guelph, Department of Zoology, Ontario, Canada, Ackerley, S. 29

44 Figure 1.6: Endochondral Ossification of Bone. Longitudinal section through developing long bone showing the relacement of cartilage by bone. Modified from University of Guelph, Department of Zoology, Ontario, Canada, Ackerley, S. 30
45 extracellular matrix maturation, and late differentiation or matrix mineralization [73]. These phases are characterized by the expression of certain genes (Figure 1.7). In the growth phase, osteoblasts proliferate and secrete Type I collagen. As osteoblasts enter early differentiation, growth subsides and alkaline phosphatase, bone sialoprotein, and osteopontin are expressed. As matrix is mineralized, nodules form and osteoblasts express osteonectin and osteocalcin in addition to osteopontin. Core binding factor 1 (cbfa1), also known as Aml3 and Runx2, is referred to as the master regulator for osteoblast differentiation [74, 75]. Cbfa1 was cloned in 1993, and in 1997 several investigators including Ducy, Komori, Otto, and Mundlos showed that cbfa1 was crucial for osteoblast differentiation. Cbfa1 binds to the osteoblast-specific element 2 (OSE2) [75, 76]. OSE2-like elements are found in the promoter regions of osteocalcin, collage type I alpha, ostepontin, and bone sialoprotein. In order to demonstrate that cbfa1 is a transcriptional activator of osteoblast differentiation, Ducy and colleagues forced expression of cbfa1 by transiently transfecting other cell types, including primary skin fibroblasts, myoblasts, and C3H10T1/2 mesenchymal cells. Forced expression of cbfa1 induced osteoblast-specific gene expression in all of these nonosteoblastic cells [76]. In vivo studies confirmed the necessity of cbfa1 for osteoblast differentiation. Komori and Otto separately deleted cbfa1 from the mouse genome and found that the mice died shortly after birth from lack of endochondral and intramembranous bone formation. While the skeleton of 31
46 cbfa1-deficient mice is of normal size and shape, it remains cartilaginous and lacks osteocalcin and osteopontin expression. Additionally, mice heterozygous for cbfa1 lack proper osteoblast differentiation, but not chondrocyte differentiation. These mice have hypoplastic clavicles and show a delay in the suture of fontanelles [77, 78]. Results from these studies indicate that there is also a dose dependent expression of cbfa1 for osteoblast differentiation. The phenotype of mice heterozygous for cbfa1 is identical to mice that have a mutation called cleidocranial dysplasia (Ccd). Humans are also affected with CCD and show mutations in the human CBFA1 gene [78]. Cbfa1 belongs to the Runt family of transcription factors and contains a 128 amino acid region that binds DNA called the runt domain. C-terminal to the runt domain is the PST domain, which stands for the proline-serine-threonine rich region, and this domain allows cbfa1 to transactivate. Cbfa1 differs from other runt family members in that it has two domains at the N-terminus involved in activating transcription. One of the domains is rich in glutamine and alanine and has therefore been termed the QA region. The other domain is referred to as activation domain 1 (AD1) and is the first 19 amino acids of the N-terminus. In 2001, Zaidi and colleagues mutated C-terminal regions of cbfa1 and found that a 38 amino acid region (aa ) in the C-terminus of cbfa1 is necessary for subnuclear localization and subsequent transactivation of the bone-specific osteocalcin gene [79]. This subnuclear localization domain is called the nuclear matrix targeting signal (NMTS) and is conserved in all three cbfa family members [79]. 32
47 Osteoblast Differention Proliferation Early Late Differentiation Differentiation (matrix mineralization) Type I Collagen Alkaline Phosphatase Bone Sialoprotein Osteocalcin Osteonectin Osteocalcin Osteopontin Figure 1.7: Diagram of osteoblast differentiation. As osteoblasts mature, or differentiate, the cells go through different stages of differentiation (proliferation, early differentiation, and late differentiation). As the osteoblasts progress through the different stages of differentiation, expression of different genes are detected (listed below the stage of differentiation). 33
48 Other transciption factors, such as Msx2 [mammalian homologue to Drosophila muscle segment homeobox gene (msh)] and Dlx5 (mammalian homologue to Drosophila distal-less), have been shown to play a role in bone development as well. Transgenic mice that overexpress Msx2 have enhanced calvarial bone growth just as humans that possess a gain-of-function mutation in MSX2 have Boston-type craniosystosis [80]. Interestingly, mice deficient in Msx2 lack proper ossification of the skull due to a decrease in the proliferation of osteoblast progenitor cells. This phenotype is observed in humans suffering from enlarged parietal foramina, which is a disease caused from a loss-of-function mutation in MSX2 [80]. These studies have shown that the overexpression and deficiency of Msx2 show that Msx2 is important for craniofacial development and that Msx2 is required to maintain osteoblast precursor cells in a proliferative state by inhibiting terminal differentiation. Additionally, Msx2 deficient mice show a decrease in trabecular and cortical thickness of the tibia and femur due to a decrease in the number of osteoblasts. Osteocalcin and cbfa1 expression are also decreased in Msx2 deficient mice, suggesting that Msx2 also plays a role in endochondral bone formation and regulates cbfa1 expression [80]. Dlx5 is another transcription factor thought to be involved in osteoblast differentiation. Dlx5 is upregulated in mineralizing calvarial cultures. Transfection of an osteoblast cell line with Dlx5 resulted in upregulation of osteocalcin and accelerated matrix mineralization. Cbfa1 activity was not altered when osteoblast cell line was transfected with Dlx5 suggesting that Dlx5 does not act upstream of cbfa1 and may use a cbfa1 independent pathway to regulate 34
49 osteoblast differentiation. Dlx5 deficient mice die shortly after birth due to defects in craniofacial development. Cranial bones and teeth in these mice are dysmorphic [81]. Proper osteoblast differentiation is a coordinated event involving multiple transcription factors. A multitude of diseases arise when mutations in transcription factors arise. In addition to direct mutation of genes involved in osteoblast differentiation, osteoblast maturation and function can be impaired by diseases that reach the bone microenvironment. These include osteomyelitis, a bacterial infection of the bone or bone marrow, and cancers such as breast and prostate that can metastasize to the bone causing osteolytic and / or osteoblastic lesions. In 2004, Mercer and colleagues showed that osteoblasts exposed to conditioned medium from metastatic breast cancer cells showed a decrease in expression of osteoblast differentiation genes [35]. Additionally, Chislock and colleagues showed that both hfob and MC3T3-E1 osteoblast cell lines increased secretion of inflammatory cytokines when exposed to metastatic breast cancer conditioned medium for 24 hours [36]. Taken together, these data suggest that metastatic breast cancer cells secrete factors which inhibit osteoblast differentiation while eliciting an osteoblast inflammatory response. It is possible that osteoblasts propagate osteolytic lesion formation by lack of proper bone deposition and concurrent stimulation of osteoclast activity through cytokine production. It is important to note that murine primary calvarial osteoblasts and the murine calvarial osteoblastic cell line, MC3T3-E1, were used 35
50 in these studies and reports have shown that the biochemical activity of calvarial osteoblasts and femoral osteoblasts differ [105]. Evolution of In Vitro Model Systems to Study Bone Development In the 1920 s Strangeways and Fell isolated explants from chick embryos at different stages of development and placed them in a semi-solid medium consisting of clotted plasma and embryo extract. Test tubes, watch glasses and hollowed out glass slides were initially used as culture devices. Eventually, the watch glass cultures were placed inside a petridish that contained a layer of moist cotton, which provided a humidified environment. Using this culture technique, Strangeways and Fell were able to monitor the growth and development of cartilage from the leg buds of chick embryos over a 14-day culture period. These studies lead to publications regarding the calcification of bone in vitro and the importance of alkaline phosphatase in mineralization [82, 83, 84, 85]. In the 1960 s, Rose cultured embryonic chick bone slices in cellophane culture chambers. Cultures were maintained for a three-week period during which time outgrowths of osteoblasts and fibroblasts were observed. These studies provided evidence for an in vitro culture system that allowed for growth and differentiation of osteoblasts and fibroblasts over an extended period. The cellophane chambers were semi-permeable and allowed for the accumulation of cellular factors unlike with the plasma-clot culture systems. Other embryonic tissues, such as muscle and lung also showed more differentiated states in the 36
51 cellophane chamber culture system compared to the plasma-clot culture system [86. 87, 88]. The 1960 s also introduced the culture of isolated bone cells using enzymatic methods of cell isolation. Peck and colleagues isolated rat calvarial osteoblasts using proteases, such as trypsin and collagenase [75]. This approach enabled studies to be conducted on osteoblast cells specifically and aided the understanding of bone formation and osteoblast function. In the 1980 s, fetal rat and mouse calvarial osteoblasts were cloned and mineralized bone nodules were observed in vitro using ascorbic acid and B-glycerophosphate [75]. Culture devices used to grow bone tissue are still being designed and improved upon today. In fact, a field of research known as bone tissue engineering has emerged in recent years. More recent culture systems used to grow bone tissue include scaffolds, spinner flasks, rotating wall vessels, and perfusion reactors [96 104]. Each design has its advantages and drawbacks when compared to other in vitro culture systems and to in vivo observations. Scaffolds are used to aid in cell attachment and growth. Some scaffolds are designed to be biodegradable and others are not [96]. Scaffolds aid in cellular attachment and in 3D structure, but scaffolds can also lead to diminished cell survival and function at the center compared to the surface tissue. Additionally, necrotic centers can form in scaffolds if nutrients are unable to reach the cells [97]. Spinner flasks, rotating wall vessels, and perfusion reactors have been designed to overcome the flow of nutrients over and within a tissue. Spinner 37
52 flasks provide continual mixing of culture medium, however the turbulence generated within spinner flasks can be detrimental to developing tissue [98]. Rotating wall vessels use dynamic laminar flow under conditions of low shear stress to circulate nutrients in the medium [99, 100]. HYPOTHESES Two distinct studies were conducted and are presented here. One study entailed validating the use of a bioreactor culture system to culture osteoblasts alone and in co-culture with metastatic breast cancer cells. In the other study, pathways within osteoblasts that are altered in response to metastatic breast cancer cells leading to the production of osteoblast-derived inflammatory cytokines were investigated. The overall goal was to determine specific transcription factor targets in osteoblasts contributing to cytokine production. Both studies provided information regarding the interaction of metastatic breast cancer cells with osteoblasts. They will be useful to design better in vitro culture systems that will aid in identification of specific therapeutic targets for cancer dissemination, as well as preservation of osteoblast function. Due to continual growth and dialysis properties of this bioreactor culture system, it was hypothesized that the bioreactor culture system will allow for growth of and cytokine production by osteoblasts co-cultured with metastatic breast cancer cells similarly to that seen in vivo. To test this, MC3T3-E1 osteoblasts were cultured alone or in co-culture with MDA-MB-231 GFP metastatic breast cancer cells. Growth and behavior of the two cell types was 38
53 compared to that seen in conventional polystyrene culture methods, as well as to published in vivo studies. It was observed that osteoblasts increased production of inflammatory cytokines in the presence of breast cancer cell conditioned medium. Therefore, it was of interest to determine intracellular signaling factors contributing to the osteoblast inflammatory response. It was hypothesized that osteoblasts would exhibit a specific transcription factor profile when exposed to metastatic breast cancer cell conditioned medium, some of which would be involved in the osteoblast inflammatory response. Consequently, the activity of 50 different transcription factors were screened and EGR-1 was identified as a potential target. It was more specifically hypothesized that increased EGR-1 transcription factor activity in osteoblasts was responsible for the increase in inflammatory cytkokine production by osteoblasts exposed to metastatic breast cancer cell conditioned medium. To examine the role of EGR-1 in the osteoblast inflammatory response to metastatic breast cancer cell conditioned medium, shrna targeting EGR-1 was used to decrease EGR-1 expression in MC3T3-E1 cells prior to exposure to MDA-MB-231 metastatic breast cancer cell conditioned medium and inflammatory cytokine production was measured. All experiments conducted for the second study were done using conventional cell culture methods, not the bioreactor culture system. 39
54 References 1. Guise, TA, Mundy, GR. "Cancer and bone." Endocr Rev. 19: Jemal, A, Siegel, R, Ward, E, Hao, Y, Xu, J, Murray, T, Thun, MJ. "Cancer statistics 2008." CA Cancer J Clin. 58: American Cancer Society. Breast Cancer Facts & Figures Atlanta: American Cancer Society, Inc. 4. Mundy, GR. "Metastasis to bone: causes, consequences and therapeutic opportunities." Nat Rev Cancer. 2: Kim, CJ, Bland, KI, Yeatman, TJ. The Breast Comprehensive Management of Benign and Malignant Disorders. K.I. Bland ed. 3, St. Louis, MO: Saunders vol Lyon, DE, McCain, NL, Walter, J. Cytokine comparisons between women with breast cancer and women with a negative breast biopsy. Nurs Res. 57(1): Sporn, MB. The war on cancer: a review. The Lancet. 347: McGee, SF, Lanigan, F, Gilligan, E, Groner, B. Mammary gland biology and breast cancer. Conference on common molecular mechanisms of mammary gland development and breast cancer progression. EMBO reports. 7(11): Padua, D, Massague, J. Roles of TGF-β in metastasis. Cell Res. 19: Nash, GF, Turner, LF, Scully, MF, Kakkar, AK. Platelets and Cancer. Lancet Oncology. 3: Al-Mehdi, AB, Tozawa, K, Fisher, AB, Shientag,L, Lee, A, Muschel, RJ. Intravascular origin of metastasis from the proliferation of endotheliumattached tumor cells: a new model for metastasis. Nat Med. 6(1): Khanna, C, Wan, X, Bose, S, Cassaday, R, Olomu, O, Mendoza, A, Yeung, C, Gorlick, R, Hewitt, SM, Helman, LJ. The membranecytoskeleton linker ezrin is necessary for osteosarcoma metastasis. Nat Med. 10: Criscuoli, ML, Nguyen, M, Eliceiri, BP. Tumor metastasis but not tumor growth is dependent on Src-mediated vascular permeability. Blood. 105 (4): Couzin, J. Tracing the steps of metastasis, cancer s menacing ballet. Science. 299 (5609): Paget, S. The distribution of secondary growths in cancer of the breast. Lancet. 1: Fidler, IJ. The pathogenesis of cancer metastasis: the seed and soil hypothesis revisited. Nat Rev. Cancer. 3: Ewing, J. Neoplastic diseases: a treatise on tumors W.B. Saunders publishing. 40
55 18. Ribatti, D, Mangialardi, G, Vacca, A. Stephen Paget and the seed and soil theory of metastatic dissemination. Clin Exp Med. 6: Coman, DR, DeLong, RP, McCutcheon, M. Studies on the mechanism of metastasis: the distribution of tumors in various organs in relation to the distribution of arteriolar emboli. Cancer Res. 11: Fidler, IJ, Kripke, ML. Metastasis results from preexisting variant cells within a malignant tumor. Science. 197: Giaccia, AJ, Erler, JT. Chapter 3: The Cellular Micoenvironment and Metastases. In: Abeloff s clinical oncology edition Churchill Livingstone, an imprint of Elsevier. 22. Liotta, LA. Cancer: An attractive force in metastatsis. Nature. 410: Carnett, JB, Howell, JC. Bone metastases in cancer of the breast. New York Surgical Society and the Philadelphia Academy of Surgery Phadke, PA, Mercer, RR, Harms, JF, Yujiang, J, Frost, AR, Jewell, JL, Bussard, KM, Nelson, S, Moore, C, Kappes, JC, Gay, CV, Mastro, AM, Welch, DR. "Kinetics of metastatic breast cancer cell trafficking in bone." Clin Cancer Res. 12: Kanis, JA and McCloskey, EV. Bone turnover and biochemical markers in malignancy. Cancer. 80(8 Suppl): Kanis, JA. The pathophysiology and treatment of paget's disease of bone. Ed. 1. London: Martin Dunitz vol Price, JS. The cell biology of bone growth. European Journal of Clinical Nutrition 48 suppl 1: S Massaro, EJ, Rogers, JM. The skeleton : biochemical, genetic, and molecular interactions in development and homeostasis. Humana Press Bonnick, SL. Bone densiometry in clinical practice application and interpretation. Humana Press: Towata, NJ Mohan, S, Linkhart, T, Farley, J, Baylink, D. Bone-derived factors active on bone cells. Calcif Tissue Int. 36: S139 S Sheu, T, Schwartz, EM, O Keefe, RJ,Rosier, RN, Puzas, JE. Use of a phage display technique to identify potential osteoblast binding sites within osteoclast lacunae. J Bone Miner Res. 17 (5): Sugimoto, T, Kanatani, M, Kano, J, Kaji, H, Tsukamoto, T, Yamaguchi, T, Fukase, M, Chihara, K. Effects of high calcium concentration on the functions and interactions of osteoblastic cells and monocytes and on the formation of osteoclast-like cells. J Bone Miner Res. 8 (12): Guise, TA. Molecular mechanisms of osteolytic bone metastases. Cancer. 88: Bendre, MS, Margulies, AG, Walser, B, Margulies, NS Akel, S Bhattacharrya, Skinner, RA, Ramani, V, Mohammad, KS, Wessner, LL, Martinez, A, Guise, TA. Chirgwin, JM, Gaddy, D, Suva, LJ. Tumor- 41
56 derived interleukin-8 stimulates osteolysis independent of the receptor activator of nuclear factor-kb ligand pathway. Cancer Res. 65(23): Mercer, RR, Miyasaka, C, Mastro, AM. Metastatic breast cancer cells suppress osteoblast adhesion and differentiation. Clin. Exp. Met. 21: Kinder, M, Chrislock, E, Bussard, KM, Shuman, LA, Mastro, AM. Metastatic Breast Cancer Induces An Osteoblast Inflammatory Response. Exp Cell Res. 314: Balkwill, F. Cancer and the chemokine network. Nat Rev Cancer. 4: Fernandez, E, Lolis, E. Structure, function, and inhibition of chemokines. Annu. Rev. Pharmacol. Toxicol. 42: Ali, S, Lazennec, G. Chemokines: novel targets for breast cancer metastasis. Cancer Metastasis Rev. 26: Mellado, M, Rodriquex-Frade, JM, Manes, S, Martinez-A, C. Chemokine signaling and function responses: the role of receptor dimerization and TK pathway activation. Annu. Rev. Immunol. 19: Crump,MP, Gong, J-H, Loetscher, P, Rajarathnam, K, Amara, A, Arenzana-Seisdedos, F, Virelizier, J-L, Baggiolini, M, Sykes, BD, Clark- Lewis, I. " Solution structure and basis for functional activity of stromal cell-derived factor-1; dissociation of CXCR4 activation from binding and inhibition of HIV-1. EMBO. 16 (23): Strieter, RM. Chemokines: Not just leukocyte chemoattractants in the promotion of cancer. Nat Immunol. 2 (4): Kakinuma, T, Hwang, ST. Chemokines, chemokine receptors, and cancer metastasis. J Leukocyte Biol. 79: Roodman, GD. Mechanisms of Bone Metastasis. New Engl J Med. 350 (16): Taga, T. Gp130 and the interleukin-6 family of cytokines. Annu. Rev. Immunol. 15: Udagawa, N, Takahashi, N, Katagiri, T, Tamura, T, Wada, S, Findlay, DM, Martin, TJ, Hirota, H, Taga, T, Kishimoto, T, Suda, T. Interleukin-6 induction of osteoclast differentiation depends on il-6 receptors expressed on osteoblastic cells but not on osteoclast progenitors. J Exp Med. 182: De Miguel, F, Martinez-Fernandez, P, Guillen,C, Valin, A, Rodrigo, A, Martinez, ME, Esbrit, P. Parathyroid hormone-related protein ( ) stimulates interleukin-6 expression in human osteoblastic cells. J Am Soc Nephrol. 10: Liu, XH, Kirschenbaum, A, Yao, S, Levine, AC. Interactive effect of interleukin-6 and prostaglandin E2 on osteoclastogenesis via the OPG/RANKL/RANK System. Ann NY Acad Sci. 1068: Goldberg-Bittman, L, Neumark, E, Sagi-Assif, O, Azenshtein, E, Meshel, T, Witz, IP, Ben-Baruch, A. "The expression of the chemokine receptor CXCR3 and its ligand, CXCL10, in human breast adenocarcinoma cell 42
57 lines." Immunol Lett. 92(1-2): Selander, KS, Li, L, Watson, L, Merrell, M, Dahmen, H, Heinrich, PC, Muller-Newen, G, Harris, KW. "Inhibition of gp130 signaling in breast cancer blocks constituitive activation of Stat3 and inihbits in vivo maligancy." Cancer Res. 64: Sukhatme, VP. Early transcription events in cell growth: the Egr family. J Am Soc Nephrol. 1: Harja, E, Bucciarelli,LG, Lu, Y, Stern, DM, Zou, YS, Schmidt, AM, Yan, SF. Early growth response 1 promotes atheroangogenesis. Circulation Res. 94: Yan, S-F, Fujita, T, Lu,J, Okada, K, Zou, YS, Mackman, N, Pinsky, DJ, Stern, DM. EGR-1, a master switch coordinating upregulation of divergent gene families underlying ischemic stress. Nature Medicine. 6 (12): Yoneda, T, A Sasaki, GR Mundy. "Osteolytic bone metastasis in breast cancer." Breast Cancer Res Treat. 32: Chen, S-J, Ning, H, Ishida, W, Sodin-Semrl, S, Takagawa, S, Mori, T, Varga, J. The Early-Immediate Gene EGR-1 Is Induced by Transforming Growth Factor-β and Mediates Stimulation of Collagen Gene Expression. J. Biol. Chem. 281 (30): Derynck, Rik. The TGF-β Family. Cold Spring Harbor Laboratory Press, Cold Spring Harbor, N.Y Annes, JP, JS Munger, DB Rifkin. Making Sense of latent TGF-β activation. J Cell Science. 116: Miyazono, K. TGF-β signaling by Smad proteins. Cytokine & Growth Factor Reviews. 11: Itoh, S, M Thorikay, M Kowanetz, A Moustakas, F Itoh, CH Heldin, P ten Dijke. Elucidation of Smad Requirement in Transforming Growth Factor- B Type I Receptor-induced Responses. J Biol Chem. 278 (6): Derynck, Rik. The TGF-β Family. Cold Spring Harbor Laboratory Press, Cold Spring Harbor, N.Y P Nicolson, GL. Organ specificity of tumor metastasis: role of preferential adhesion, invasion, and growth of malignant cells at specific secondary sites. Cancer Metast Rev. 7: Yu, L, MC Hebert, YE Zhang. TGF-β receptor-activated p38 MAP kinase mediates Smad-independent TGF-β responses. EMBO. 21: Moustakas, A, CH Heldin. Non-Smad TGF-β signals. J Cell Science. 118: Massague, J. TGF-β in cancer. Cell. 134: Kong, FM, MS Anscher, T Murase, BD Abbott, JD Iglehart, RL Jirtle. Elevated plasma transforming growth factor-b levels in breast cancer patients decrease after surgical removal of the tumor. Annals of Surgery. 222 (2): Moe, SM. Disorders involving calcium, phosphorus, and magnesium. 43
58 Prim Care. 35 (2): vi (1 19). 67. Greenspan, SL, ST Harris, H Bone, PD Miller, ES Orwoll, NB Watts, CJ Rosen. "Bisphosphonates: safety and efficacy in the treatment and prevention of osteoporosis." Am Fam Physician. 61: Toh, Y, C Zhang, YM Khong, Y.M. A novel 3D mammalian cell perfusion-culture system in microfluidic channels. Lab Chip. 7: Schmeichel, KL, MJ Bissell. Modeling tissue-specific signaling and organ function in three dimensions. J Cell Science. 116(12): Debnath, J, J Brugge. Modelling gladular epithelial cancers in threedimensional cultures. Nat Rev Cancer. 5: Reginato, MJ, KR Mills, EBE Becker, DK Lynch, A Bonni, SK Muthuswamy, JS Brugge. BIM regulation of lumen formation in cultured mammary epithelial acini is targeted by oncogenes. Molec Cellular Biol. 25: Muthuswamy, SK, D Li, S Lelievre,, MJ Bissell, JS Brugge,. ERBB2, not ERBB1, reinitiates proliferation and induces luminal repopulation in epithelial acini. Nat Cell Biol. 3: Wrobel, CN, J Debnath, E Lin, S Beausoleil, MF Roussel, JS Brugge. Autocrine CSF- 1R activation promotes SRC-dependent disruption of mammary epithelial architecture. J Cell. Biol. 165: Kacinski, BM, KA Scata, D Carter, LD Yee, E Sapi, BL King, SK Chambers, MA Jones, MH Pirro, ER Stanley, L Rohrschneider. FMS (CSF1 receptor) and CSF-1 transcripts and protein are expressed by human breast carcinomas in vivo and in vitro. Oncogene. 6: Freshney, RI. Culture of animal cell: a manual of basic technique. A.R. Liss, New York, N.Y Bilezikian, JP. Principles of Bone Biology. Academic Press, San Diego, CA. vol , vol Bonnick, SL. Bone densiometry in clinical practice application and interpretation. Humana Press: Towata, NJ Lian, J.B., Stein, G.S. Concepts of osteoblast growth and differentiation: basis for modulation of bone cell development and tissue formation. Crit Rev. Oral Biol. Med. 1992; 3: Lee, KS, SH Hong, SC Bae. Both the smad and p38 MAPK pathways play a crucial role in Runx2 expression following induction by transforming growth factor-b and bone morphogenic protein. Oncogene. 21: Ducy, P. Cbfa1: A molecular switch in osteoblast biology. Dev Dynamics. 219: Ducy, P, R Zhang, V Geoffroy, A Ridall, G Karsenty. Osf2/Cbfa1: A transcriptional activator of osteoblast differentiation. Cell. 89:
59 82. Komori, T, H Yagi, S Nomura, A Yamaguchi, K Sasaki, K Deguchi, Y Shimizu, RT Bronson, YH Gao, M Inada, M Sato, R Okamoto, Y Kitamura, S Yoshiki, T Kishimoto. Targeted disruption of Cbfa1 results in complete lack of bone formation owing to maturational arrest of osteoblasts. Cell. 89: Otto, F, AP Thornell, T Crompton, A Denzel, KC Gilmour, IR Rosewell, GW Stamp, RS Beddington, S Mundlos, BR Olsen, PB Selby, MJ Owen. Cbfa1, a candidate gene for cleidocranial dysplasia syndrome, is essential for osteoblast differentiation and bone development. Cell. 89: Zaidi, SK, A Javed, JY Cho, AJ van Wijnen, JL Stein, JB Lian, GS Stein. A specific targeting signal directs Runx2/Cbfa1 to subnunclear domains and contributes to transactivation of the osteocalcin gene. J Cell Sci. 114: Satokata, I., M Liang, H Oshima, M Bei, I Woo, K Nishizawa, T Maeda, Y Takano, M Uchiyama, S Heaney, H Peters, Z Tang, R Maxson, R Maas. Msx2 deficiency in mice causes pleiotropic defects in bone growth and ectodermal organ formation. Nat Genetics. 24: Holleville, N, S Mateos, M Bontouz, K Bollerot, AH Monsoro-Burg. Dlx5 drives Runx2 expression and osteogenic differentiation in developing cranial suture mesenchyme. Dev. Biol. 304(2): Strangeways, TSP, Fell HB. Experimental studies on the differentiation of embryonic tissues growing in vivo and in vitro.--i. The development of the undifferentiated limb-bud (a) when subcutaneously grafted into the postembryonic chick and (b) when cultivated in vitro. Proceedings of the Royal Society of London. 99(698): Fell, HB, Robinson, R. The growth, development and phosphatase activity of embryonic avian femora and limb-buds cultivated in vitro. The Biochemical Journal. 23(4): Fell, HB, Robinson, R. The development and phoshphatase activity in vivo and in vitro of the mandibular skeletal tissue of the embryonic fowl. The Biochemical Journal. 24(6): Fell, HB, Robinson, R. The development of the calcifying mechanism in avian cartilage and osteoid tissue. The Biochemical Journal. 28(6): Rose, GG, Schindler, TO. The cytodifferentiation of osteoblasts in tissue culture. J Bone Joint Surg Am. 42: Rose, GG, Pomerat, CM, Shindler, TO, Trunnell, JB. A cellophane-strip technique for culturing tissue in multipurpose culture chambers. J. Biophysc. Biochem. Cytol. 4 (6): Rose, GG, Pomerat, M. Phase contrast observations of the endoplasmic reticulum in living tissue cultures. J. Biophys. Chem. Cytol. 8: Blaschke, F, Bruemmer, D, Law, RE. EGR1 is a major vascular pathogenic transcription factor in atherosclerosis and restenosis. Rev. Endo. Metab. Disorders. 5:
60 95. Pawlinski, R, Pedersen, B, Kehrle, B. Aird, WC, Frank, RD, Guha, M, Mackman, N. Regulation of tissue factor and inflammatory mediators by EGR-1 in a mouse endotoxemia model. Blood. 101 (10): Holy C, Shoichet M, Davies J. Engineering three-dimensional bone tissue in vitro using biodegradable scaffolds: investigating initial cell-seeding density and culture period. J Biomed Mater Res 2000;51(3): Matziolis, G, Tuischer, J, Kasper, G, Thompson, M, Bartmeyer, B, Krocker, D, Perka, C, Duda, G. Simultation of cell differentiation in fracture healing: mechanically loaded composite scaffolds in a novel bioreactor system. Tissue Eng. 12 (1): Overstreet M, Sohrabi A, Polotsky A, Hungerford DS, Frondoza CG. Collagen microcarrier spinner culture promotes osteoblast proliferation and synthesis of matrix proteins. In vitro cell dev biol. anim. 39 (5-6): Sikavitsas, V, Bancroft, G, Mikos, A. Formation of three-dimensional cell / polymer constructs for bone tissue engineering in a spinner flask and a rotating wall vessel bioreactor. J. Biomed. Mater. Res. 62 (1): Granet, C, Laroche, N, Vico, L, Alexandre, C, Lafage-Proust, MH. Rotating-wall vessels, promising bioreactors for osteoblastic cell culture: comparison with other 3D conditions. Med. Biol. Eng. Comput. 36(4): Wang, Y, Uemura, T, Dong, J, Kojima, H, Tanaka, J, Tateish, T. Application of perfusion culture system improves in vitro and in vivo osteogenesis of bone marrow-derived osteoblastic cells in porous ceramic materials. Tissue Eng. 9 (6): Bancroft, G, Sikavitsas, V, Mikos, A. Design of a flow perfusion bioreactor system for bone tissue-engineering applications. Tissue Eng. 9 (3): Jansen, FW, Oostra, A, Blitterswijk, C. A perfusion bioreactor system capable of producing clinically relevant volumes of tissue-engineered bone: In vivo bone formation showing proof of concept. Biomaterials. 27 (3): Cartmell, SH, Porter, BD, Garcia, AJ, Guldberg, RE. Effects of medium perfusion rate on cell-seeded three-dimensional bone constructs in vitro. Tissue Eng. 9: Halstead, LR, Scott, MJ, Rifas, L, Avioli, LV. Characterization of osteoblast-like cells from normal adult rat femoral trabecular bone. Calcif. Tissue Int. 50:
61 CHAPTER 2 Breast Cancer Cells Penetrate Osteoblast Tissue When Grown in a Bioreactor Culture System Abstract A majority of cancer deaths (90%) are a result of the dissemination of tumor cells from the primary site to a secondary site, not due to the primary tumor itself. Therefore, it is important to investigate mechanisms utilized by tumor cells to promote growth in and destruction of the secondary sites. Advances in microarray technology allow for rapid screening and identification of potential genetic targets involved in host response to cancers, however there is a need for high-throughput screening of the identified targets to determine their efficacy. In vitro systems that more accurately represent in vivo microenvironments would be a useful tool to screen potential genetic targets as treatment of diseases. Here we examined the interaction of breast cancer cells with osteoblasts in a specialized culture device (bioreactor). Breast cancer preferentially metastasizes to the bone resulting in the formation of osteolytic lesions. While administration of osteoclast-inhibiting drugs, such as bisphosphonates, slow further lesion formation, existing lesions do not heal. Therefore, osteoblasts appear functionally disabled in the presence of metastatic breast cancer cells. Previous studies in this laboratory have shown that breast cancer cells alter osteoblast adhesion and morphology, increase osteoblast 47
62 apoptosis, and decrease the expression of osteoblast differentiation genes when exposed to metastatic breast cancer cell conditioned medium for extended periods (5 35 days). In order to examine the interaction of metastatic breast cancer cells with osteoblasts apart from osteoclasts, a specialized bioreactor culture system was utilized. In this culture device, osteoblasts grew and differentiated into a multiple-cell-layer, three-dimensional mineralizing tissue. Coculture of metastatic breast cancer cells with osteoblasts in a bioreactor were compared to co-culture in conventional cell culture. The breast cancer cells not only attached and grew on the osteoblast tissue in the bioreactor culture system, but also formed distinct colonies that aligned in the same axis as the osteoblasts, similar to Indian filing seen in authentic pathological tissue. Moreover, in this culture system, the breast cancer cells penetrated the osteoblast tissue, a phenomenon not apparent with conventional cell culture methods. Metastatic breast cancer cells also interfered with the differentiation of osteoblasts as evidenced by a decrease in production of proteins, such as osteocalcin and collagen. Additionally, co-culture of the metastatic breast cancer cells with osteoblasts resulted in increased production of the inflammatory cytokine, IL-6, a known activator of osteoclasts. The bioreactor culture system is advantageous over conventional cell culture systems in emulating the bone microenvironment and for studying the interaction of metastatic breast cancer cells with osteoblasts. 48
63 Introduction Biological processes can be studied within a living organism (in vivo) or in a controlled environment outside an organism (in vitro). While in vivo observations of experimental manipulations are ideal as they represent the physiological response of an entire organism, there are disadvantages. In vivo studies are not only expensive to conduct, but contain numerous variables making it difficult to determine a response stimulus relationship. Additionally, the endpoint generally requires sacrificing an organism, which does allow for continual monitoring or manipulation of the experimental system [1, 2, 3]. It is therefore advantageous to develop in vitro culture systems in which cells interact and behave similarly to their in vivo environment. In vitro culture systems allow for greater control over the experimental conditions, constant observation throughout treatment, and do not involve the complex response of an entire organism to a specific treatment [1, 2, 3]. As early as 1907, in vitro culture systems were being used to observe biological processes outside of an organism. Harrison wanted to test his hypothesis that nerve fibers were outgrowths from neurons [4, 5]. To do this, he isolated fragments of nerve tube from larval frog and placed them in a hallowed out glass slide covered by a medium of clotted frog lymph. Harrison observed outgrowths of nerve fibers from the explants, which allowed him to observed a living process outside of an organism and provide evidence to end a scientific controversy of the time [4, 5]. As enzymatic methods for cell separation emerged 49
64 in the 1960 s, a shift occurred from isolation and culture of tissue fragments to isolation and culture of cells [6]. In vitro cell culture techniques have become a fundamental tool for the advancement of the sciences and health care. Even though in vitro cell culture techniques are widely used and provide a wealth of information to researchers, it is important to note that there are differences between in vivo and in vitro cellular environments. Most of the differences regarding in vitro culture environments compared to in vivo environments are due to loss of three-dimensional associations with neighboring cells of the same or different cell type and growth on a two-dimensional substrate. The in vivo microenvironment is complex, where cells receive cues that effect their fate from extracellular matrix components, soluble signals released from other cells, as well as mechanical stimulation [7]. In vitro cell culture removes cell interactions that are characteristic of particular tissue histology and alters the cell metabolism due to lack of nervous and endocrine systems [6, 7]. Cells that are removed from their native in vivo environment and cultured in vitro undergo adaptive responses to the new environment. Collectively, these adaptive responses limit cell viability and function and are termed culture shock [8]. In vitro culture systems have been used for many years, however there is still a need to improve these systems. Recently, more emphasis has been put on developing three-dimensional in vitro culture systems that capture the complexity of in vivo systems and allow use of human cells. For example, epithelial cells including keratinocytes and corneal epithelial cells can be cultured on flat substrates in vitro and mimic differentiated structures of multilayer sheets seen in 50
65 vivo. This culture system allows these cells to be used in toxicology assays to measure the gauge the response of real tissue to drugs and toxins [9, 10, 11]. However, this is not the case for all cells cultured in vitro. Bissell and Brugge showed that breast-epithelial-cells cultured on plastic remain relatively undifferentiated, however culture of these cells in extracellular matrix gels restored mammary-specific gene expression and permitted the cells to proliferate and form acini, which is morphologically and phenotypically similar to in vivo conditions [12]. These results demonstrated that extracellular matrix composition and stiffness contributed to the behavior (or differentiation or fate) of these cells when grown in vitro. The work presented in this chapter compares the behavior of metastatic breast cancer cells co-cultured with osteoblasts in a three-dimensional bioreactor culture system to co-culture in conventional cell culture methods. In recent years, the field of bone tissue engineering has emerged to address the need to repair or even replace bone tissue that has been lost due to disease or injury [13]. Engineered bone tissue is usually generated by a combination of cells, scaffolds, and growth factors. Bioreactor is the term given to devices employed for culturing three-dimensional cell-scaffold constructs in a controlled environment [14, 15, 16]. A variety of bioreactor devices exist including spinner flasks, rotating wall vessels, perfusion reactors, and rotating vessels [17, 18, 19, 20, 21, 22, 23]. The bioreactor culture device used in this study was designed as a scaffold-free, compartmentalized culture system based on the principle of continuous growth and dialysis [24]. A dialysis membrane was used to separate 51
66 the growth chamber from the feeding chamber, which allowed for retention of cell-secreted biochemical factors in the growth chamber, while low molecular weight waste products could diffuse across both chambers. A gas permeable serlan film was used to enclose the bioreactor device. Cells attached to a 25 cm 2 surface area of film in the growth compartment of the bioreactor. This design enabled medium to remain on the cells for approximately one month and to be enriched with secreted factors by the cultured cells, a process not permitted using conventional cell culture methods. Another advantage to this bioreactor culture device compared to scaffold devices is the ease of routine examination of the cultured cells within the bioreactor. In situ confocal microscopy and phasecontrast microscopy were frequently used to monitor the growth of osteoblast cells in the bioreactor, as well as the interaction of the metastatic breast cancer cells cultured with the osteoblasts. There was no need to separate a scaffold from cells during the imaging or after the completion of the experiments. The 3-D culture system used in this study allowed osteoblasts to be cultured for extended periods and to generate multiple-cell layer, 3-D mineralizing osteoblastic tissue [24]. This study focuses on the colonization of osteoblast tissue by metastatic breast cancer cells and compares conventional cell culture with a 3-D culture system. Interestingly, in both conventional cell cultures and 3-D cultures, the metastatic breast cancer cells colonized a larger tissue area in less differentiated osteoblasts than in more mature osteoblasts. Here we report that when co-cultured with osteoblasts grown in the 3-D system, the breast cancer cells demonstrated behavior similar to that described in vivo. 52
67 When introduced to the osteoid tissue, the metastatic breast cancer cells not only colonized, but also penetrated the tissue. Moreover, the osteoblasts changed from a cuboidal to a spindle shape, and the breast cancer cells aligned in an Indian Filing pattern [25, 26]. 53
68 Materials & Methods Cells MC3T3-E1, a murine pre-osteoblast line that can differentiate and mineralize in culture [27], was a gift from Dr. Norman Karin, Pacific Northwest National Laboratory. The cells were maintained in osteoblast growth medium consisting of alpha Minimum Essential Medium (αmem) (Mediatech, Herdon, VA), 10% neonatal FBS (Cansera, Roxdale, Ontario), and penicillin 100 U/mL/streptomycin 100 µg/ml (Sigma, St. Louis, MO). MC3T3-E1 cells were passagesd two to three times per week using 0.002% pronase solution. The osteoblasts were not used after passage 20. For all experiments, MC3T3-E1 cells were plated at 1 x 10 4 cells / cm 2 in osteoblast growth medium. Approximately twenty-four hours later, osteoblast growth medium was removed and replaced with osteoblast differentiation medium, which consists of growth medium plus 50 µg/ml ascorbic acid (Sigma, St. Louis, MO) and 10 mm β- glycerophosphate (Sigma, St. Louis). Osteoblast differentiation medium was replaced every three days for the duration of the experiment as indicated. MDA- MB-231 GFP cells, a human metastatic breast cancer cell line engineered to express green fluorescent protein (GFP) [6,17], were a gift from Dr. Danny Welch, University of Alabama-Birmingham, and were maintained in DMEM, 5% FBS, penicillin 100 U/ml/streptomycin 100 μg/ml, and non-essential amino acids. Cells were cultured at 37 C, 5% CO 2, in a humidified incubator. They tested negative for mycoplasma by PCR analysis (TaKaRa Bio, Inc., Shiga, Japan). 54
69 Cell Tracker Orange Staining Cell Tracker Orange CMRA (Invitrogen Corporation, Carlsbad, CA) was diluted in DMSO to a final stock concentration of 10mM and stored at -20 C in a dessicator. Cell Tracker Orange stock was diluted to indicated concentrations in αmem and warmed to 37 C using a waterbath. Media was removed from cultures and cells were rinsed once with PBS. Warmed Cell Tracker Orange solution was added to the cells and incubated at 37 C for 1 hour. Cells were then washed one time with growth or differentiation medium (whichever media they were in at the start of the experiment) for 30 minutes at 37 C. Media were replaced after the 30- minute wash, and cells were cultured as usual for the duration of the experiment. Images were taken using a confocal microscope (FV 300). Co-Culture of Osteoblasts and Breast Cancer Cells At the indicated days (4, 14, or 24 days after plating), GFP-expressing metastatic breast cancer cells were added to the osteoblast cultures at a ratio of 1 breast cancer cell to every 10 osteoblasts. Co-cultures were imaged, supernatants collect, cells collected, and cell morphology staining done at 1, 3, and 7 days after plating of the breast cancer cells. 55
70 Microscopy Light / Fluorescent Microscopy At the end of the co-culture, light and fluorescence microscope images of the cells in the 35-mm polystyrene dishes were obtained using a Leitz Diavert microscope and a NIKON CoolPix 8400 digital camera. Three random fields were imaged from each culture dish. Images were saved as JPEGs, and the ImageJ program (NIH) was used to determine the percent area of breast cancer cell colonization based on the fluorescent images. Confocal microscopy For live cell imaging, osteoblasts were stained with 10µM Cell Tracker Orange (Invitrogen Corporation, Carlsbad, CA) prior to the addition of MDA- MB-231 GFP breast cancer cells. Images were collected by sequential scans using the Olympus FV300 laser scanning confocal microscope. The Z-sections were 3D-reconstructed using AutoQuant v9.3 software. The cell layers were determined visually by tracking and counting the sub-volumes of cells in the 3Dreconstructed Z-section images. At the end of the co-culture period, the tissue was fixed in 2.5% glutaraldehyde in cacodylate buffer and stained for actin filaments with 33nM AlexaFluor 568- phalloidin (Molecular Probes, Invitrogen Corporation, Carlsbad, CA) to enable further morphological analysis by confocal imaging. 56
71 Transmission Electron Microscopy Cultures were washed once with PBS, fixed overnight with 2.5% glutaraldehyde in cacodylate buffer at 4 C, followed by a secondary fixation with 1% osmium tetroxide in cacodylate buffer for 1h at room temperature prior to en bloc staining with 2% aqueous uranyl acetate for 1h. Dehydration was performed using a graded series of ethanol concentrations, followed by impregnation and embedding in Spurr s resin. Ultra-thin sections were cut with a diamond knife (Diatome Ultra 45) on a microtome (Ultracut UCT, Leica), placed on uncoated copper grids, and stained with 0.2% aqueous uranyl acetate and 0.2% lead citrate. The cross sections were examined using TEM (JEM 1200 EXIL, JEOL), and images were collected using an attached high- resolution camera (Tietz F224, Gaunting). ELISAs and Cytokines (individual and multiplex) Culture media were collected and assayed for murine IL-6, RANKL, leptin, and osteocalcin using a Linco Plex Mouse Panel 2B multiplex cytokine kit according to the manufacturer s protocol. Quantum Dots Quantum dots are electron dense fluorophores that can be detected by transmission electron microscopy and allow for fluorescent imaging over extended periods of time. In particular, quantum dot 565 and 655 (QTracker 565 and QTracker 655, Molecular Probes) were used for 57
72 experiments. Qdot 565 are 10nm in size and fluoresce at 565nm (green), while Qdot 655 are 20 nm in size and fluoresce at 655nm (red). MC3T3-E1, MDA-MB- 231, MDA-MB-231 GFP, and MDA-MB-435 cells were incubated with the indicated concentrations of the identified Qdot and monitored over time using confocal microscopy. Qdot solution is added to the culture media and allowed to incubate for 1 hour up to 18 hours. Culture media is removed and the cells are washed twice, 30-minutes each, with normal growth or differentiation media. Bioreactor Culture System A specialized, compartmentalized bioreactor was used to culture osteoblasts [84]. The bioreactor design is based on the principle of simultaneous growth and dialysis, which allows for a stable peri-cellular environment. Osteoblasts were plated in growth medium at 10 4 cells/cm 2 in the 25 cm 2 chamber. After 4-7 days when the cultures appeared to be confluent, the growth medium was changed to differentiation medium. The osteoblasts were allowed to grow in the bioreactor for 15, 30, or 60 days prior to the addition of MDA-MB- 231 GFP cells. The breast cancer cells (BC) were added to the osteoblast (OB) cultures at ratios of 1:10, 1:100, or 1:1000 based on previous determinations of the number of osteoblasts present at each time. After 7 days of co-culture, the bioreactors were dismantled and the substratum with adherent tissue was divided for the various assays. The media from both the upper chamber and lower chamber were collected. Secreted OCN, IL-6, RANKL, and leptin were determined using a multiplex ELISA (LincoPlex ). 58
73 RNA Isolation and RT-PCR MC3T3-E1 were cultured in standard tissue culture plates or in the bioreactor for various times. RNA was isolated using RNeasy Kit (Qiagen). Oncolumn DNase digestion was performed using the Qiagen RNase-Free DNase Set. RNA purity was determined by the A260 / A280 ratio; all samples had a ratio > 1.8. First strand cdna synthesis was performed using 1 µg RNA in the RETROscript kit (Ambion, Austin, TX). The sequences of the PCR primer pairs used for amplification are listed in Table 1. PCR was carried out on the Ericomp DetaCylcer 1 System. PCR reactions were run on a 2% agarose gel, stained with ethidium bromide and imaged under UV illumination. Cell Proliferation MTT Assay MC3T3-E1 or MDA-MB-231 GFP cells were cultured as previously described. Four hours after plating, 10 nm QTracker 655 was added to the metastatic breast cancer cells and they were allowed to incubate for 4 hours before the medium was replaced. Cells were plated and incubated with 10 nm QTracker 655 every other day in order to conduct one MTT assay on GFPexpressing metastatic breast cancer cells containing quantum dots for 1, 3, and 5 days in culture. The MTT stock [3-4,5-Dimethylthiazol-2-YI)-2,5- Diphenyltetrazolium bromide, Sigma, St. Louis, MO, M-2128] solution was diluted to 5 mg/ml in PBS and filtered through 0.2µm filter. The stock solution was added 1:10 to the cell culture volume already on the cells and the cells were incubated at 37 C for 4 hours. Medium was then removed and cells were 59

74 Table 2.1: PCR primer sequences and conditions. Listed above are the forward and reverse primer sequences, as well as, annealing temperatures, cycle numbers, and band sizes for each gene measured by PCR. 60
75 washed once with PBS. Solubilization solution (10% Triton-X100, 0.1N HCl in anhydrous isopropanol) was added to the cells. Cells containing the solubilization solution were gently swirled, the solution removed from the cells and placed into a clean plate or tube. Absorbance was read at 590nm. Alkaline Phosphatase Staining Cells were cultured for the indicated number of days prior to staining for alkaline phosphatase activity. Media were removed and cells were rinsed once with PBS. Cells were then fixed using 10% formaldehyde (in PBS) and rinsed three times with PBS. Alkaline phosphatase stain [0.0013g Napthol AS-BI Phosphate (Sigma), g Fast Blue RR Salt (Sigma), and equal amounts of 0.2M Tris, ph 8.5 and pre-warmed water] was prepared fresh and filtered using Whatman paper before being added to the cells (1mL of alkaline phosphatase stain for 35-mm polystyrene dish or one well of a 6-well plate, or 0.5mL for one well of a 24-well plate). The cells were incubated at 37 C for 30 minutes and rinsed several times with water. Cells were allowed to dry overnight and imaged using a BX51 microscope. Von Kossa Staining MC3T3-E1 cells were cultured as previously described for the indicated number of days. Cells were fixed in 10% formaldehyde (in PBS) for 10 minutes at room temperature and rinsed three times with dh 2 0. Silver nitrate (5% in dh 2 0) for 30 minutes at room temperature in the dark. Cells were washed three 61
76 times with dh 2 0. dh 2 0 was added to cover the cells and they were exposed to light for three hours before the water was removed. The cells were allowed to airdry overnight before imaging on the BX51 light microscope. 62
77 Results Breast Cancer Cells Attachment and Colonization Depends Upon the Stage of Osteoblast Differentiation Osteoblasts (MC3T3-E1) grown using conventional cell culture methods or the 3-D bioreactor system expressed major differentiation genes, including osteocalcin, osteonectin, osteopontin, and type I collagen, by approximately 20 days in culture (Figure 2.1). To determine if the stage of osteoblast differentiation influenced breast cancer growth, MC3T3-E1 osteoblasts were grown to early, middle, and late stages of differentiation (4, 14, and 24 days respectively) in polystyrene cell culture dishes prior to co-culture with MDA-MB- 231 GFP metastatic breast cancer cells. The co-cultures were carried out for 7 days. Under all stages of osteoblast differentiation, the breast cancer cells attached, grew, and formed colonies (Figure 2.2). Osteoblasts were considered to be in the early stages of differentiation (D4) because they did not yet express osteopontin, osteonectin and osteocalcin (Figure 2.1). However, these early differentiation osteoblasts expressed Type I collagen, a main component of the extracellular matrix that gives bone its strength and elasticity (Figure 2.1). MDA-MB-231 GFP breast cancer cells were added to day 4 cultures of MC3T3-E1 osteoblasts at three different ratios of breast cancer cells to osteoblasts (BC:OB), (1:10, 1:100, or 1:1000). At all three ratios the cancer cells 63
78 2-D Culture 3-D Culture Genes Osteocalcin Type I Collagen Osteonectin Osteopontin MMP - 13 B - Actin (Days) (Days) Figure 2.1: Expression of osteoblast differentiation genes over time. MC3T3-E1 cells were cultured in a bioreactor or in standard cell culture dishes as described in the materials and methods section. At indicated times (22, 30, 60 days for the bioreactor samples and 5, 7, 11, and 21 days for cell culture samples), the cells were harvested for RNA isolation (RNeasy kit, Qiagen). RT-PCR was carried out using the primers listed in Table 2.1. Shown are representative amplicons bands. Shuman, L., et al. Submitted (2009). Laurie Shuman: 2-D culture, Venkatesh Krishnan: 3-D culture. 64
79 attached to the osteoblasts within one hour (data not shown), proliferated, and formed colonies on top of the osteoblasts within 7 days of co-culture (Figure 2.2A-left column). After seven days in co-culture, approximately 31% of the area was covered by breast cancer cells from the initial 1:10 inoculation, 14% from the 1:100 inoculation, and 7% from the 1:1000 inoculation (Figure 2.2A). By 11 days in culture, the osteoblasts expressed more differentiation proteins, such as osteonectin and osteopontin (see Figure 2.1). They also were positive for alkaline phosphatase, while Von Kossa staining showed the production of phosphate necessary for calcification (Figure 2.3). When 14 dayold osteoblasts were challenged with metastatic breast cancer cells, the breast cancer cells attached and colonized the osteoblast cultures. However, the percent area of the 14 day-old osteoblasts covered by the breast cancer cells at the 1:10 ratio was 8.1%, less than that seen with the 4 day-old osteoblasts (31.0%) (Figure 2.2A-middle column). The area colonized was also less in the cultures with breast cancer cells at 1:100 and 1:1000. After 24 days in differentiation medium, the osteoblasts produced abundant extracellular matrix, showed increased alkaline phosphatase activity, and enhanced mineralization. Interestingly, when the 24 day-old osteoblasts were co-cultured with breast cancer cells for 7 days, the cancer cells only formed small colonies (Figure 2.2 A-right column). Only 5% of the osteoblast culture was covered by cancer cells in the 1:10 condition, and only 0.8% at the 1:1000 ratio (Figure 2.2 A). 65

80 66
81 Figure 2.2: Co-culture of MC3T3-E1 osteoblasts with metastatic breast cancer cells, MDA-MB- 231 GFP, in conventional cell culture. At various stages of osteoblast growth / differentiation (day 4, 14, or 24), breast cancer cells (BC) were added to osteoblasts (OB), at one of three ratios of BC to OB (1:10, 1:100, and 1:1000). Co-culture was carried out for 7 days. (A) The effect of osteoblast differentiation state and breast cancer to osteoblast ratios on the colonization of the cultures by the cancer cells after 7 days. Shown are the fluorescence microscopic images of co-cultures. Values indicate percentage of culture area occupied by the breast cancer cells as calculated by the Image J analysis program (NIH). Three fields were viewed and analyzed at each point. Shown is a representative image with the corresponding percent culture area that was occupied by breast cancer cells. Three plates of each condition were cultured at least three separate times. (B) Colonization of differentiated (day 24) osteoblasts by breast cancer cells at various days of co-culture up to 14-days. Breast cancer cells were added at a ratio of 1 BC:10 OB to 24-day cultures of MC3T3-E1 osteoblasts. Co-cultures were imaged after 1, 3, 7, and 14 days. Percent colonization was calculated as described in A. Magnification bars indicate 100 µm on all images. 67


82 ALKALINE PHOSPHATASE STAINING VON KOSSA STAINING Figure 2. 3: Alkaline phosphatase and Von Kossa stained MC3T3-E1 cells at various stages of osteoblast differentiation. MC3T3-E1 cells were plated in osteoblast differentiation medium and cultured for 5, 11, 15, 25, or 30 days prior to staining for alkaline phosphatase (A) or Von Kossa (B) as described in the materials and methods section. 68
83 To investigate if the metastatic breast cancer cells would eventually colonize the more mature, 24 day-old osteoblasts over a longer co-culture period, breast cancer cells were added to 24 day-old osteoblasts at a ratio of 1:10 and followed up to 14 days in co-culture (Figure 2.2B). By 14 days of co-culture the breast cancer cells colonized 33% of the area of the 24 day-old osteoblast culture equivalent to that seen in the 7 day co-cultures of 4 day-old osteoblasts (31%). Therefore, although the metastatic breast cancer cells showed delayed colonization in the presence of more mature osteoblasts, they eventually grew. In summary, at all three stages of osteoblast differentiation tested, the breast cancer cells colonized a greater area of the osteoblast culture when added at the 1:10 ratio versus the 1:1000 ratio (Figure 2.2A). However, the degree of colonization was greatest in the 4 day-old osteoblast cultures. Eventually, the cancer cells grown on the more mature osteoblasts reached the same level of colonization as seen on the less differentiated osteoblasts. Metastatic breast cancer cells colonize and penetrate osteoblasts when cocultured in a bioreactor MC3T3-E1 cells grew mostly as a mono- or occasionally as bi-layers in standard plastic culture plates (Figure 2.12 A, H). Cells grown longer than about 30 days began to detach from the plate. However, MC3T3-E1 cultured in the bioreactor grew for many months [24, 28]. During this time they formed several layers of cells in a partially mineralized matrix. MC3T3-E1 osteoblasts grown in the bioreactor for 15, 30, or 60 days expressed genes indicative of osteoblast 69
84 differentiation including OCN, osteonectin (OSN), and Type I collagen (Figure 2.1). To visualize osteoblast morphology by confocal microscopy, the osteoblasts were fixed and stained with phalloidin, which binds to actin filaments. We found that during 60 days in culture in the bioreactor, the osteoblasts underwent a phenotypic change from a monolayer of elongated cells to multilayers of tissue containing cuboidal osteoblasts (Figure 2.4A). As seen by transmission electron microscopy (Figure 2. 12F), osteoblasts grown for 15 days produced abundant collagen, a trait of maturing osteoblasts. The extracellular matrix was apparent in the older cultures as well. Osteoblasts grown for 15, 30, or 60 days in the bioreactor produced 28, 40, and 44 µg/ml of soluble collagen (Sircol), respectively, indicating an increase in collagen production over time (Shuman, L., et al. Submitted., Venkatesh Krishnan performed assay) When osteoblasts grown in the 3-D culture system for 15, 30, or 60 days were challenged with MDA-MB-231 GFP metastatic breast cancer cells at ratios of 1:10 or 1:100 (BC:OB), the cancer cells and the osteoblasts exhibited both similarities to, and differences from, those observed in co-cultures carried out by standard methods. MC3T3-E1 were stained with Cell Tracker Orange prior to the addition of the GFP-expressing metastatic breast cancer cells in order to distinguish osteoblasts (red) from breast cancer cells (green) using confocal fluorescence microscopy. Z-section images were taken in 1 µm increments and compiled to generate 3-D reconstructions (Figure 2.4B). Breast cancer cells added to 15 day-old osteoblasts at a ratio of 1:10 formed many contiguous 70


85 B 71
86 Figure 2.4: Maturation of MC3T3-E1 and co-culture with MDA-MB-231 GFP cells in the bioreactor. (A) MC3T3-E1 were cultured in the bioreactor for up to 2 months as described in the materials and methods section. Shown are confocal images of osteoblasts fixed and stained with Phalloidin Alexa Fluor 568. The cells underwent a phenotypic change from a pre-osteoblast monolayer of spindleshaped cells to cuboidal osteoblasts in a multilayered tissue. Scale bar represents 50µm. (B) MC3T3-E1 (OB) were cultured in the bioreactor for 15, 30, or 60 days and stained with Cell Tracker Orange before addition of MDA-MB- 231 GFP (BC) at ratios of BC:OB, 1:10 or 1:100. After 7 days in co-culture, the cells were fixed and images were collected using a confocal microscope. Shown are 3-D reconstructed Z- stacks of the co-cultured tissue. Scale bar represents 100 µm. (B, bottom left) 3-D reconstruction of confocal images of 60 day-old osteoblasts co-cultured with GFP- expressing breast cancer cells for 5 days. Osteoblasts were stained with Cell Tracker Orange (red) while the breast cancer cells fluoresce green. Magnification bars represent 100 µm. (B, bottom right) Confocal image of the same culture described in B, bottom left, but after 7 days of co-culture. Magnification bars represent 100 µm. 72
87 colonies (Figure 2.4B, left column, top). However, as osteoblasts matured from 15 days to 60 days in culture, breast cancer cells formed fewer interconnected colonies. When osteoblasts were challenged with fewer cancer cells, mimicking micrometastases (Figure 2.4B, right column), the breast cancer cells formed large, distinct colonies dispersed within the osteoblast tissue. The more mature the osteoblast tissue, the smaller and fewer the breast cancer colonies. This diminished degree of breast cancer colonization was observed at both the 1:10 ratio and the 1:100 ratio. In addition, the osteoblasts directly surrounding the breast cancer colonies appeared less cuboidal (Figure 2.4A) and more alongated and spindle-shaped (Figure 2.4B). When comparing 14 day- old osteoblasts cocultured in conventional cell culture (Figure 2.2A, middle) to 15 day-old osteoblasts co-cultured in the 3-D system (Figure 2.4, top), it was apparent that the 3-D, osteoid tissue was a more hospitable environment for breast cancer colonization. Breast cancer cells were able to form more numerous, larger colonies in the 3-D co-culture system than in conventional cell culture. Quantum Dot Technology Enables Distinction of Osteoblast and Breast Cancer Cells in TEM Sections of Co-Cultures In order to characterize more detailed cell-cell interactions, the osteoblastcancer cell co-cultures were examined with transmission electron microscopy (TEM). However, it was difficult to unambiguously distinguish the breast cancer cells from the osteoblasts. To circumvent this problem, MDA-MB-231 GFP cells were labeled with Quantum Dots (Ddots) (Figure 2.5). These Qdots are 73


88 Figure 2.5: Schematic structure of quantum dots (left, taken from and TEM image of Qtracker 655 Qdots (right). 74
89 fluorophores (10-20nm in size) that are photostable and brighter than many other fluorophores, and allow for imaging over time. In addition they are electron dense, containing cadmium mixed with selenium or tellurium cores, and thus, were seen with an electron microscope. First, MC3T3-E1 cells, MDA-MB-231, and MDA-MB-435 cells were incubated with 10µM Qdot 565. Twenty-four hours following initial incubation, quantum dots were easily visualized within all cell types (Figure 2.7). The Qdots were distributed to dividing cells, therefore the less cell divisions the culture goes through, the better the fluorescent intensity is maintained. Up to eleven days after initial incubation with Qdot 565, the green fluorescent packets of quantum dots were still easily seen within all cell type (Figure 2.6). In order to monitor the interaction of metastatic breast cancer cells with osteoblasts, MDA-MB-231 GFP cells were used in co-culture experiments. Since the Qdot 565 also fluoresces at that wavelength, Qdot 655 was used. Qdot 655 was tested in MDA-MB-231 GFP cells at three concentrations, 2.5, 5, and 10 µm (Figure 2.7). Quantum dots were seen at all concentrations, however only at the 10 µm concentrations were the Qdots still visible after 7 days in co-culture conditions (Figure 2.8). Quantum dot uptake by MDA-MB-231 GFP cells was monitored using confocal microscopy. MDA-MB-231 GFP cells were incubated with with 10 µm Qdots and imaged at various times ranging from 2 to 48 hours (Figure 2.9). The Qdots localized to the periphery of the breast cancer cells at the plasma membrane within 2 hours of incubation, but after 24 hours the qdots were 75
90 detected in intracellular compartments, or perinuclear vacuoles, where they remained (Figure 2.9). The Qdot labeled MDA- MB-231 GFP cells had no deleterious effect on cell viability as determined by MTT assay (Figure 2.10). Due to the electron dense property of the Quantum Dots, the Qdots were directly visible by transmission electron microscope. The labeled breast cancer cells could be easily distinguished from co-cultured osteoblasts because the cancer cells contained a large numbers of Qdots (Figure 2.11). They were mostly detected in the endosomes and lysosomes located in the central portion of the cells. At the point of osteoblasts-cancer cell interaction, the osteoblasts had a thickened membrane and protrusions containing microtubules (Figure 2.11). The collagen immediately surrounding the cancer cells was aligned differently from that further away and the area adjacent to the leading edge of the cancer cell was devoid of collagen (Figure 2.12). TEM analysis of the interaction of breast cancer cells with osteoblasts in the bioreactor and in conventional cell culture Osteoblasts grown in a bioreactor formed multi-layers of bone-like tissue [24 and Figure 2.12E]. The human metastatic breast cancer cells were able to penetrate the 15, 30, or 60 day-old osteoblast tissue [28 and Figure 2.12G]. This behavior was not observed in standard cell culture dishes (Figure 2.12 D). TEM analysis (Figure 2.12A) and confocal Z-section images of Cell Tracker Orange - stained osteoblasts (Figure 2.12H) verified that osteoblasts grown in standard cell culture dishes grow to one or at most two, cell layers [24]. 76

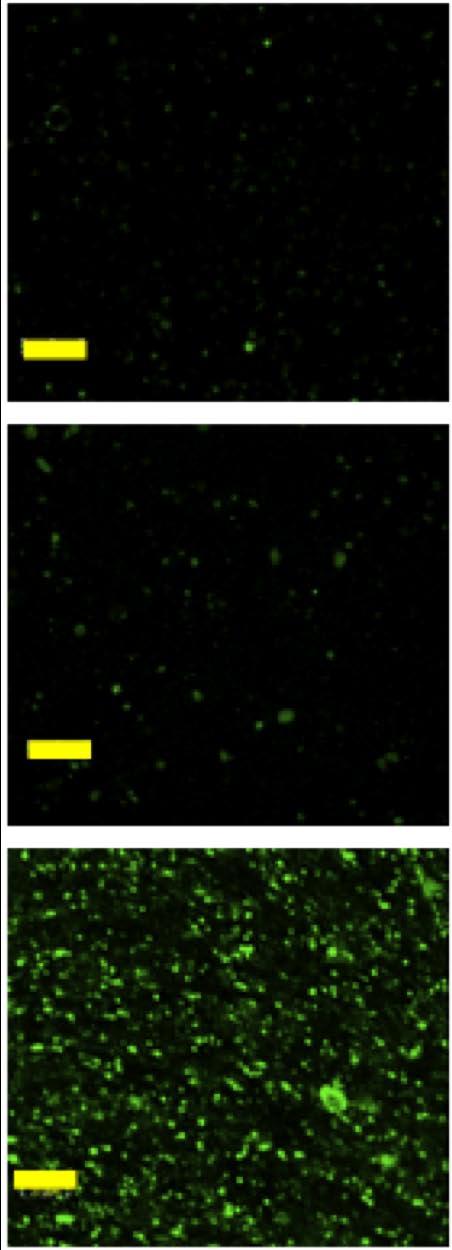
91 A B C D E F 77
92 Figure 2.6: MC3T3-E1, MDA-MB-231, and MDA-MB-435 cells labeled with 10nM Qdot 565. MC3T3-E1 (A, B), MDA-MB-231 (C, D), and MDA-MB-435 (E, F) cells were plated at 10 3 cells / cm 2 and allowed to attach. 10nM Qdot 565 was incubated with the cells for 1 hour. Images were taken after 24 hours (A, C, E left column) and 6 days (B, D, F right column) using confocal microscopy 10X magnification. Magnification bars represent 50 μm. 78
, 5nM (C), or 10nM (D) of Qdot 655 (red) for 1 hour. Twenty-four hours later images were obtained using confocal microscopy (20X magnification).")
93 A B C D Figure 2.7: MDA-MB-231 GFP cells labeled with various concentrations of Qdot 655. MDA-MB-231 GFP cells were unlabeled (A) or incubated with 2.5nM (B), 5nM (C), or 10nM (D) of Qdot 655 (red) for 1 hour. Twenty-four hours later images were obtained using confocal microscopy (20X magnification). Magnification bars represent 100 μm. 79
, 5nM (B), or 10nM (C) of Qdot 655 (red) for 1 hour prior to coculture with MC3T3-E1 cells.")
94 A Figure 2.8: MDA-MB-231 GFP cells B labeled with Qdot 655 prior to coculture with MC3T3-E1 cells. MDA- MB-231 GFP cells were incubated with 2.5nM (A), 5nM (B), or 10nM (C) of Qdot 655 (red) for 1 hour prior to coculture with MC3T3-E1 cells. Six days later images were obtained using confocal microscopy (20X magnification +3X zoom). Magnification bars represent 50 μm. C 80


95 Figure 2.9: Fluorescent images of MDA-MB-231 GFP cells labeled with Qtracker 655 for 2 hrs, 24 hrs, and 48 hrs. Magnification bars represent 50 μm. 81
96 Figure 2.10: QTracker 655 does not affect breast cancer cell growth. MDA- MB-231 GFP cells were incubated with 10 nm QTracker 655. Cell proliferation was determined using an MTT assay at 1, 3, and 5 days. 82
97 The interaction of the breast cancer cells with the osteoblasts was observed by TEM after 1 day, 3 days, and 6 days of co-culture in standard cell culture dishes (Figure 2.12 B, C, and D respectively). Cancer cells initially spread on top of the osteoblast culture (Figure 2.12 B, BC). After 3 days the breast cancer cells eventually formed large rounded colonies on the upper surface of the osteoblast culture (Figure 2.12 C). The breast cancer cells were never observed to move through the osteoblast layer(s). Co-cultures of osteoblasts with metastatic breast cancer cells in the 3-D culture system indicated that breast cancer cells penetrated the osteoblast layers (Figure 2.4 G), and attach to the substratum (indicated by arrow heads). In addition, when breast cancer cells were cocultured with osteoblasts in the bioreactor, the cancer cells aligned themselves along the same axis as the osteoblasts in organized rows (Figure 2.4, bottom). This behavior appeared to be similar to Indian Filing observed in pathological tissue [25, 26], and was not seen in co-cultures grown in plastic cell culture plates. Osteoblasts co-cultured with metastatic breast cancer cells in 2-D and 3-D systems exhibited collagen breakdown, as well as, decreased collagen deposition. TEM images of 15 day-old osteoblasts showed pronounced collagen fibers (Figure 2.12 A, arrows). In as little as 24 hours in co-culture, the collagen structure appeared speckled in TEM images rather than fibrous, indicative of collagen degradation (Figure 2.12 B and C). After 7 days in 3-D co-culture, much of the abundant collagen produced by osteoblasts was no longer detected (Figure 2.12 D). 83
.")
. Magnification bars (top) = 5 µm")
98 A B C D Figure 2.11: TEM images of Qdot-labeled breast cancer cellls (BC) co-cultured with osteoblasts (OB) for 24 hours. Breast cancer cells were identified by the Qdots found in the intracellular compartments (arrows). Breast cancer cells interacted with osteoblasts through processes of thickening membrane (C). Occassionally, cilia-like structures were seen to bridge the cancer and bone cells (D). Magnification bars (top) = 5 µm and (bottom) = 0.5 µm. TEM imaging done by Dr. Greg Ning, Penn State University, Electron Microscopy Laboratory, University Park, PA. 84

99 85
100 Figure 2.12: Transmission electron microscopy (TEM) and confocal analysis of MC3T3-E1 osteoblasts alone or in co-culture with metastatic breast cancer cells, MDA-MB-231 GFP, in conventional polystyrene cell culture plates (A-D) or in the bioreactor (E-G). Osteoblasts were grown for 15 days in tissue culture plates prior to the addition of metastatic breast cancer cells at a ratio of 1 BC : 3 OB. Co-cultures were carried out for 1 day, 3 days, or 6 days before being processed and sectioned for TEM analysis. Shown are TEM images of osteoblasts alone (A), in co-culture with breast cancer cells for 1 day (B), 3 days (C ), or 6 days (D). Magnification bars indicate 1 µm. Arrows indicate collagen fibers. Shown in (E) is a TEM image of 22-day old osteoblasts cultured in a 3-D bioreactor. (F) TEM image of 15 day-old osteoblasts showing abundant collagen fibers between the cell layers. (G) TEM image of 60 day- old osteoblasts co-cultured with MDA-MB- 231 GFP breast cancer cells for 10 days. Arrows indicate substratum of the bioreactor. Scale bar indicates 5 µm in E, F, and G. (H) Confocal image of 15 day-old osteoblasts stained with Cell Tracker Orange. Shown below is the xz plane cross-section of the osteoblast culture and to the right is the yz plane cross-section of the osteoblast culture used to determine the depth of the osteoblast culture. Magnification bar represents 50 µm. 86
101 Discussion While there were similarities in the response of osteoblasts to breast cancer cells in both conventional cell culture and the bioreactor culture systems, there were also major differences. In both systems there was increased production of the proinflammatory cytokine, IL-6, and decreased secretion of osteocalcin. Secreted RANKL and leptin were not detected in culture supernatants (<9.8 pg/ml). It is not surprising to find undectable levels of secreted RANKL in MC3T3-E1 culture supernants. Others have also reported undetectable or low levels of secreted RANKL in culture media from MC3T3-E1 [30]. Suva and colleagues described a RANKL independent mechanism for activating osteolysis, through IL-8 secreted by tumor cells [30]. We have previously reported that human fetal osteoblasts (hfob 1.19) and murine osteoblasts (MC3T3-E1) also increase production of IL-8 or macrophage inflammatory protein (MIP-2), the murine orthologue to human IL-8, respectively, in the presence of metastatic breast cancer cells or breast cancer cell conditioned medium, suggesting breast cancer cells cause osteoblasts to secrete factors that can promote osteolysis [31]. Here we report that metastatic breast cancer cells attached, proliferated, and formed distinct colonies on top of the osteoblast monolayer when introduced into the osteoblast microenvironment in conventional cell culture dishes. The breast cancer cells were able to colonize a larger area of the less differentiated (4-day old) osteoblasts than the more differentiated (24-day old) osteoblasts. In contrast, osteoblasts cultured in this particular bioreactor system allowed 87
102 osteoblasts to differentiate and produce a multi-layered osteoid-like tissue, mimicking the metaphyseal end of bone, the location of rapid bone turnover [32]. The metastatic breast cancer cells colonized in a unique Indian Filing pattern similar to that of invasive carcinomas and penetrated the osteoblast tissue [25, 26]. While the exact mechanism remains unknown, it has been shown that osteosarcomas, as well as breast cancer cells, often metastasize to the metaphysis of long bones [33, 34, 35]. Monitoring the interaction of cancer cells with the metaphyseal region of bone in 3-D systems would undoubtedly provide useful identification and screening strategies for therapeutic targets. We noted that the collagen synthesis as detected by production of soluble collagen, was affected in co-cultures. The amount of soluble collagen produced by osteoblasts, measured by the Sircol assay, decreased after seven days in coculture with metastatic breast cancer cells from 28 μg/ml to 3μg/mL in 15 dayold cultures, from 40μg/mL to 7 μg/ml in 30 day-old cultures, and from 44 μg/ml to 20 μg/ml in 60 day-old cultures. Collagen is degraded by a family of proteases, matrix metalloproteinases (MMPs) [36, 37]. There are membrane-type metalloproteinases (MTMMPs) and secreted MMPs, which are classified into groups, such as collagenases, gelatinases, and stromelysins, based on substrate specificity. MMPs capable of degrading collagen include MMP-1,2,8,9,13,14. Others have reported an increased expression of MMP-13 in MC3T3-E1 cells correlating to their increased stage of differentiation, which we also found (Figure 2.1) [37, 38]. It has also been shown that more invasive breast cancer cells, such as MDA-MB-231, express high levels of these active MMPs [36, 39, 40]. MDA- 88
103 MB-231 breast cancer cells are highly invasive and metastatic, and exhibit both protease-dependent and protease-independent mechanisms of migration [25, 40]. When migrating through 3-D matrices, tube-like tracks are visible from local protease-mediated degradation of the extracellular matrix [7]. However, treatment with pharmalogical inhibitors to MMPs, serine proteases, and cathepsins does not inhibit cell migration, indicating a protease-independent mechanism for tumor cell migration [7]. This protease-independent migration is referred to as an amoeboid form of migration, whereby tumor cells squeeze through spaces in the extracellular matrix [25, 7]. We saw a decrease in collagen production in the presence of breast cancer cells and the extension of long processes from the breast cancer cells into the osteoblast tissue indicating MMP dependent and MMP independent migration. Conventional cell culture requires frequent medium changes, which disturbs cells and removes cytokines, growth factors, and proteases secreted into the microenvironment. This bioreactor culture system is based on continuous growth and dialysis and therefore requires infrequent medium changes of the reservoir chamber, which does not perturb the peri-cellular environment. This allows various growth factors and cytokines produced by the cells to accumulate in the growth chamber. This accumulation of factors in the microenvironment is an important feature of the 3-D culture system enabling the cells to respond in a more in vivo-like fashion. Griffith and Swartz summarize the importance a 3-D environment has on the cues cells send to and receive from each other due to mechanical inputs and the binding of cell adhesion molecules [7]. 89
104 The development of 3-D in vitro models is expanding our understanding of cancer research [41, 42, 43]. 3-D in vitro culture systems enable cells (tumor and non-tumor) to grow and organize in a more biologically relevant manner, thus enhancing our ability to observe and manipulate cancer progression. 3-D model systems that more accurately mimic in vivo phenotypes, such as the 3-D cell perfusion-culture system in microfluidic channels, are being designed to advance drug toxicity, metabolism, and stem cell differentiation studies [41]. Tumor cells grown in 3-D culture systems exhibit receptor expression and signaling pathway activities more similar to in vivo tumor specimens than do tumor cells grown in conventional cell culture [42]. For example, 3-D cultures aided the determination of several mechanisms glandular epithelial tumors use to fill the lumen during tumorogenesis, including disregulation of both proliferation and apoptosis or activation of oncoproteins, such as ERBB2, CSF1R, SRC, and IGF1R [42, 43, 44, 45, 46, 47]. These processes could not be studied in conventional cell culture. Most importantly the cell-cell contact between tumor and non-tumor cells can be monitored in a 3-D culture system unlike in vivo systems, which require specialized microscopy or sacrifice of the animal to examine cell interactions. In conclusion, the 3-D in vitro bioreactor culture system used in this study was superior to conventional cell culture for observing the interaction of metastatic breast cancer cells with osteoblast tissue. Cells cultured in this system were able to be monitored over time and exhibited unique in vivo-like characteristics that have not been observed in vitro using conventional cell culture methods. The bioreactor not only permitted cancer cell growth and 90
105 colonization, but also enabled the breast cancer cells to align in a distinct filing fashion and penetrate the osteoblast tissue. 91
106 References 1. Ghajar, CM, Suresh, V, Peyton, SR, Raub, CB, Meyskens Jr, FL, George, SC, Putnam, AJ. A novel three-dimensional model to quantify metastatic melanoma invasion. Mol Cancer Ther. 6 (2): Steeg, PS. Tumor metastasis: mechanistic insights and clinical challenges. Nat Med. 12: MacDonald, IC, Groom, AC, Chambers, AF. Cancer spread and micrometastasis development: quantitative approaches for in vivo models. Bioessays. 24: Harrison, RG. The outgrowth of the nerve fiber as a mode of protoplasmic movement. J Exp Zool. 142 (1): reprint 2005 (article from 1910) Keshishian, H. Ross Harrison s the outgrowth of the nerve fiber as a mode of protoplasmic movement. J Exp Zool. 301A: Freshney, RI. Culture of animal cells: a manual of basic technique. New York, NY; Alan R. Liss, Inc Griffith, LG, Swartz, MA. Capturing complex 3D tissue physiology in vitro. Nat Rev Mol Cell Biol. 7 (3): Sherr, CJ, DePinho, RA. Cellular Senescence: mitotic clock or culture shock? Cell. 102: Suuronen, EJ, Sheardown, H, Newman, KD, McLaughlin, CR, Griffith, M. Building in vitro models of organs. Int. Rev. Cytol. 244: Watt, FM. Selective migration if terminally differentiating cell from the basal layer of cultured human epidermis. J. Cell Biol. 98: LouKari, K. Status and prospects of in vitro tests in risk assessment. Altern. Lab. Anim. 32: Debnath, J, Muthuswamy, SK, Brugge, JS. Morphogenesis and oncogenesis of MCF-10A mammary epithelial acini grown in threedimensional basement membrane cultures. Methods. 30: Abousleiman RI, Sikavitsas VI. Bioreactors for tissues of the musculoskeletal ystem. Adv Exp Med Biol 2006;585: Kale S, Biermann S, Edwards C, Tarnowski C, Morris M, Long M. Three-dimensional cellular development is essential for ex vivo formation of human bone. Nat Biotechnol 2000;18(9): Holy, C, Shoichet, M, Davies, J. Engineering three-dimensional bone tissue in vitro using biodegradable scaffolds: investigating initial cellseeding density and culture period. J Biomed Mater Res 51 (3): Bancroft, G, Sikavitsas, V, Mikos, A. Design of a flow perfusion bioreactor system for bone tissue-engineering applications. Tissue Eng. 9 (3):
107 17. Sikavitsas, V, Bancroft, G, Mikos, A. Formation of three-dimensional cell/polymer constructs for bone tissue engineering in a spinner flask and a rotating wall vessel bioreactor. J Biomed Mater Res 62(1): Wang, Y, Uemura, T, Dong, J, Kojima, H, Tanaka, J, Tateish, T. Application of perfusion culture system improves in vitro and in vivo osteogenesis of bone marrow-derived osteoblastic cells in porous ceramic materials. Tissue Eng. 9 (6): Botchwey E, Pollack S, Levine E, Laurencin C. Bone tissue engineering in a rotating bioreactor using a microcarrier matrix system. J Biomed Mater Res. 55 (2): Overstreet M, Sohrabi A, Polotsky A, Hungerford DS, Frondoza CG. Collagen microcarrier spinner culture promotes osteoblast proliferation and synthesis of matrix proteins. In vitro cell dev biol. anim. 39 (5-6): Granet, C, Laroche, N, Vico, L, Alexandre, C, Lafage-Proust, MH. Rotating-wall vessels, promising bioreactors for osteoblastic cell culture: comparison with other 3D conditions. Med. Biol. Eng. Comput. 36(4): Sikavitsas VI, Bancroft GN, Holtorf HL, Jansen JA, Mikos AG. Mineralized matrix deposition by marrow stromal osteoblasts in 3D perfusion culture increases with increasing fluid shear forces. PNAS 100 (25): Terai H. In vitro engineering of bone using a rotational oxygenpermeable bioreactor system. Materials science and engineering 20 (1-2): Dhurjati, R., Liu, X., Gay, C.V., Mastro, A.M., and Vogler, E.A. Extended-term culture of bone cells in a compartmentalized bioreactor. Tissue Eng. 12 (11): Friedl, P. and Wolf, K. Tumour-cell invasion and migration: diversity and escape mechanisms. Nature Rev. Cancer. 3: Adelson, RT, DeFatta, RJ, Miles, BA, Hoblitt, SL, Ducic, Y. Metastatic breast cancer of the oral cavity. American Journal of Otolaryngology- Head and Neck Medicine and Surgery 26: Sudo, H, Kodama, HA, Amagai, Y, Yamamoto, S, Kasai, S. In vitro differentiation and calcification in a new clonal osteogenic cell line derived from newborn mouse calvaria. J Cell Biol. 96(1): Dhurjati, R, Krishnan, V, Shuman, LA, Mastro, AM, Vogler, EA. Metastatic breast cancer cell colonization degrades three-dimensional osteoblastic tissue in-vitro. Clin. Exp. Met. 25 (7): Coetzee, M, Haah, M, Kruger, MC. srankl in MC3T3-E1 effects of arachidonic acid, docosahexaenoic acid, prostaglandin E2 and parathyroid hormone on osteoprotegerin and RANKL secretion by MC3T3-E1 osteoblast-like cells. Journal of Nutritional Biochemistry 18:
108 30. Bendre, MS, Margulies, AG, Walser, B, Margulies, NS, Akel, S Bhattacharrya, S, Skinner, RA, Ramani, V, Mohammad, KS, Wessner, LL, Martinez, A, Guise, TA, Chirgwin, JM, Gaddy, D Suva, LJ. Tumorderived interleukin-8 stimulates osteolysis independent of the receptor activator of nuclear factor-kb ligand pathway. Cancer Res. 65(23): Kinder, M, Chrislock, E, Bussard, KM, Shuman, LA, Mastro, AM. Metastatic Breast Cancer Induces An Osteoblast Inflammatory Response. Exp Cell Res. 314: Price, JS. The cell biology of bone growth. European Journal of Clinical Nutrition 48 suppl 1: S Kanis, JA and McCloskey, EV. Bone turnover and biochemical markers in malignancy. Cancer. 80(8 Suppl): Jemal, A, Siegel, R, Ward, E, Hao, Y, Xu, J, Murray, T, Thun, MJ. "Cancer statistics 2008." CA Cancer J Clin. 58: Padua, D, Massague, J. Roles of TGF-β in metastasis. Cell Res. 19: Tester, A., Ruangpanit, N., Anderson, R.L., and Thompson, E.W. MMP-9 secretion and MMP- 2 activation distinguish invasive and metastatic sublines of a mouse mammary carcinoma system showing epithelial-mesenchymal transition traits. Clin Exp Met. 18: Mizutani, A., Sugiyama, I., Kuno, E., Matsunaga, S., and Tsukagoshi, N. Espression of matrix metalloproteinases during ascorbate-induced differentiation of osteoblastic MC3T3-E1 cells. J Bone Min Res. 16 (11): Zaragoza, C., Lopez-Rivera, E., Garcia-Rama, C. Cbfa-1 mediates nitric oxide regulation of MMP-13 in osteoblasts. J Cell Science 119: David, D.B., Reznick, A.Z., Livne, E. Exposure to pro-inflammatory cytokines upregulates MMP-9 synthesis by mesenchymal stell cellsderived osteoprogenitors. Histochemistry and Cell Biology. 2008; published online February 15, Yu, M., Sato, H., Seiki, M., Spiegel, S., and Thompson, E.W. Elevated cyclic AMP suppresses ConA-induced MT1-MMP expression in MDA- MB-231 human breast cancer cells. Clin Exp Met. 16: Toh, Y., Zhang, C., Khong, Y.M. A novel 3D mammalian cell perfusion-culture system in microfluidic channels. Lab Chip 7: Schmeichel, K.L., and Bissell, M.J. Modeling tissue-specific signaling and organ function in three dimensions. J Cell Science 116 (12): Debnath, J., and Brugge, J. Modelling gladular epithelial cancers in three-dimensional cultures. Nat Rev Cancer. 5: Reginato, M.J., Mills, K.R., Becker, E.B.E. BIM regulation of lumen formation in cultured mammary epithelial acini is targeted by 94
109 oncogenes. Molec Cell. Bio. 25: Muthuswamy, S.K., Li, D., Lelievre, S., Bissell, M.J., Brugge, J.S. ERBB2, not ERBB1, reinitiates proliferation and induces luminal repopulation in epithelial acini. Nature Cell Biology 3: Wrobel, C.N., Debnath, J., Lin, E., Beausoleil, S., Roussel, M.F., Brugge, J.S. Autocrine CSF-1R activation promotes SRC-dependent disruption of mammary epithelial architecture. J Cell. Bio. 165: Kacinski, B.M., Scata, K.A., Carter, D. FMS (CSF1 receptor) and CSF- 1 transcripts and protein are expressed by human breast carcinomas in vivo and in vitro. Oncogene 6:
110 CHAPTER 3 RESULTS Role of Early Growth Response 1 (EGR-1) Transcription Factor in Osteoblast Response to Metastatic Breast Cancer Cells Abstract Breast cancer frequently metastasizes to the skeleton resulting in increased bone degradation. Bone lesions are not repaired even with administration of bisphosphonates, drugs which function to inhibit osteoclast activity, implying that osteoblasts are functionally disabled. The interaction of metastatic breast cancer cells with osteoblasts, apart from osteoclasts, was examined in vitro. Osteoblasts treated with metastatic breast cancer cell conditioned medium show increased apoptosis and production of inflammatory cytokines, while differentiation is inhibited. In this report, transcription factor targets within MC3T3-E1 cells treated with MDA-MB-231 human metastatic breast cancer cell conditioned medium were identified. Expression of a particular transcription factor, Early Growth Response 1 (EGR-1), was silenced in MC3T3-E1 cells using shrna targeting murine EGR-1. Osteoblast differentiation and cytokine production was measured in the presence or absence of MDA-MB-231 metastatic breast cancer cell conditioned medium. Osteoblasts with decreased expression of EGR-1 differentiated in culture and when exposed to metastatic breast cancer cell conditioned medium showed reduced cytokine production. However, the reduction in osteoblast-derived cytokines did not interfere with the ability of the breast cancer cells to attach or colonize the osteoblast layer. 96
111 Introduction As many as 70% of breast cancer patients who develop metastatic disease show metastasis to the bone [1]. Once metastasis to the bone occurs, the 5-year survival rate declines significantly from 90% to 20% [2,3]. Additionally, when breast cancer cells enter the bone microenvironment, the balance that normally exists between osteoblastic mineral accretion and osteoclastic resorption is disrupted, and bone loss exceeds deposition. Excess osteolysis negatively impacts quality of life due to intense pain, hypercalcemia, and an increased risk for pathologic fractures [3,4,5]. Based on in vitro and in vivo studies, Guise and colleagues propose the vicious cycle of bone degradation [6,7]. According to this paradigm, when breast cancer cells reach the skeleton they release parathyroid hormone related protein (PTHrP). In the presence of PTHrP, osteoblasts increase expression of receptor activator of nuclear factor kappa B ligand (RANKL), which binds to its receptor, RANK, on preosteoclasts signaling them to differentiation and to resorb bone. Factors such as transforming growth factor beta (TGF-β), released from the matrix during osteoclast-mediated degradation, stimulate the breast cancer cells to proliferate, producing yet more PTHrP; thus, perpetuating the vicious cycle. Current therapeutic strategies include administration of bisphosphonates (e.g. clodronate). Bisphosphonates are synthetic compounds preferentially taken up by the skeleton that can delay the formation and dissolution of calcium phosphate in vitro, as well as bone mineralization and resorption in vivo [8,9]. Bisphosphonates have been administered to patients with various bone diseases, including Paget s disease, 97
112 osteoporosis, and cancers of the lung, prostate, or breast [8,9,37]. Administration of bisphosphonates inhibits osteoclast activity, however existing lesions do not heal [10]. This implies that osteoblast function is negatively affected. Previous studies in our laboratory show that metastatic breast cancer cells or their conditioned medium inhibit osteoblast differentiation, increase osteoblast apoptosis, and increase production of inflammatory cytokines by osteoblasts [7, 11, 12]. Many pathways can converge on the activation or repression of certain transcription factors. Therefore, in order to elucidate a mechanism leading to increased osteoblast inflammatory cytokine production, transcription factor activity in MC3T3-E1 osteoblasts treated with MDA-MB-231 metastatic breast cancer cell conditioned medium was investigated. Fifty different transcription factor activities were simultaneously screened using a Marligen Transcription Factor Assay. This assay uses the Luminex xmap technology to simultaneously quantitate multiple targets within the same sample (Figure 3.1). At the time this experiment was conducted, Marligen Biosciences, Inc. was the only company offering a transcription factor screening service that enabled quantitative analysis of multiple targets within the same sample using Luminex technology. Currently, other companies including Invitrogen and Panomics offer Luminex platform transcription factor services, but neither company offers up to 50 transcription factor targets [13]. Results from the Marligen Transcription Factor Assay showed an increase in both Nuclear Factor kappa B (NFkB) and Early Growth Response (EGR) transcription 98
113 factor activities, and a decrease in Nuclear Factor Gamma (NFY1) transcription factor activity in MC3T3-E1 osteoblasts treated with MDA-MB-231 metastatic breast cancer cell conditioned medium for 4 hours. EGR-1, -2, -3, and -4 comprise a subfamily of zinc finger transcription factors belonging to the Kruppel-related genes, containing three consecutive C2H2 zinc finger motifs linked by a conserved sequence, TGEKPF/Y [14]. The four EGR proteins in this family have highly related DNA-binding zinc finger domains. The regions of the protein on either side of the DNA-binding domain give specific functionality to each protein. All four EGR proteins bind to the same consensus sequence, GCG G/TGG GCG [15]. A distinct role for each of the EGR proteins has been determined using knockout mice. EGR-1 knockout mice display lack of fertility of the females due to a loss of leuteinizing hormone B (LH-B); whereas, EGR-2 knockout mice show defects in nerve development. EGR-3 knockout mice do not form muscle spindles, and male EGR-4 knockout mice are infertile due to arrest in spermatogenesis [16]. An increase in EGR-1 expression is correlated with increased production of inflammatory cytokines. Harja et al. showed that transcripts and protein for EGR-1 are upregulated in mononuclear phagocytes and smooth muscle cells in hypoxic conditions both in vitro and in vivo [17]. Additionally, EGR-1 has been labeled as a master switch of the host response to ischemic stress [17]. EGR-1 knockout mice do not show enhanced expression of inflammatory cytokines in the lung upon ischemia / reperfusion injury [18]. In vivo samples of human emphysematous lung taken during lung reduction surgery show higher levels of EGR-1 transcript than normal lung tissue. Studies have also been conducted on patients suffering from myocardial infarction; and these studies 99
114 show that EGR-1 levels are upregulated in the myocardium compared to control patients [19]. Other researchers in our laboratory are measuring NFkB activity in osteoblasts treated with metastatic breast cancer cell conditioned medium. Therefore, the role of EGR-1 in osteoblast response to metastatic breast cancer cell conditioned medium was investigated here. In order to determine the contribution of EGR-1 to the osteoblast inflammatory response to metastatic breast cancer cells, EGR-1 expression was silenced in MC3T3- E1 cells. There are no commercially available inhibitors to EGR-1; therefore, shrna targeting EGR-1 was used to generate a stable MC3T3-E1 cell line having decreased EGR-1 expression. Decreased expression of EGR-1 in osteoblasts did not alter osteoblast differentiation as measured by alkaline phosphatase, osteocalcin, and type I collagen expression. Calcium deposition was also detected by Von Kossa staining. Decreased EGR-1 expression in osteoblasts resulted in lower amounts of inflammatory cytokine production by osteoblasts in response to metastatic breast cancer cell conditioned medium for up to 24 hours. However, decreased EGR-1 expression in osteoblasts did not prevent attachment of metastatic breast cancer cells to osteoblasts. Additionally, decreased EGR-1 expression in osteoblasts did not prevent the block in osteoblast differentiation caused by chronic exposure to metastatic breast cancer cell conditioned medium. These data show that osteoblast EGR-1 plays a specific role in the osteoblast inflammatory response. EGR-1 is not responsible for all the adverse affects seen in osteoblasts when exposed to metastatic breast cancer cells or their conditioned medium, including the block in differentiation that results from chronic exposure and the 100
115 attachment of breast cancer cells to osteoblasts. It is possible that decreased EGR-1 expression in osteoblasts would aid in maintaining a balanced microenvironment by lowering inflammatory cytokine levels, as well as maintain the integrity of the microenvironment by preventing the rearrangement of actin fibers to retain osteoblast morphology. 101
116 Materials & Methods Cells Osteoblasts MC3T3-E1, a murine pre-osteoblast line that can differentiate and mineralize in culture [20], was a gift from Dr. Norman Karin, Pacific Northwest National Laboratory. The cells were maintained in osteoblast growth medium consisting of alpha Minimum Essential Medium (αmem) (Mediatech, Herdon, VA), 10% neonatal FBS (Cansera, Roxdale, Ontario), and penicillin 100 U/mL/streptomycin 100 µg/ml (Sigma, St. Louis, MO). MC3T3-E1 cells were passaged two to three times per week using 0.002% pronase solution. The osteoblasts were not used after passage 20. For all experiments, MC3T3-E1 cells were plated at 1 x 10 4 cells / cm 2 in osteoblast growth medium. Approximately twenty-four hours later, osteoblast growth medium was removed and replaced with osteoblast differentiation medium, which consists of growth medium plus 50 µg/ml ascorbic acid (Sigma, St. Louis, MO) and 10 mm β-glycerophosphate (Sigma, St. Louis). Osteoblast differentiation medium was replaced every three days for the duration of the experiment as indicated. Cells were cultured at 37 C, 5% CO 2, in a humidified incubator. They tested negative for mycoplasma by PCR analysis (TaKaRa Bio, Inc., Shiga, Japan). Primary osteoblasts were isolated from neonatal mouse calvariae and cultured as described [21]. Briefly, 2 to 5 calvariae were dissected from 2 day-old Smad3 wildtype (W T) and Smad3 knockout (KO) mouse pups and rinsed with PBS. The calvariae were incubated with 4mL of digestion solution [0.64 mg/ml Collagenase type IA (Sigma) and 102
117 0.05% trypsin in PBS] at 37 C for 20 minutes. The calvariae in the digestion solution were vigorously shaken prior to incubation and again after 10 minutues of incubation. At the completion of the 20-minute incubation, the digestion solution was collected, 700 µl FBS added, and centrifuged at 300xg for 4 minutes to collect the cells. The cell pellet was resuspended in calvariae growth medium [Delbeco s Modified Essential Medium (DMEM) (Mediatech, Manassas, VA), 10% FBS, penicillin 100 U/mL/streptomycin 100 μg/ml, and 100 μg/ml ascorbic acid] and plated in a 6-well plate, 2 ml cell suspension per well. This 6-well plate was identified as pool 1. Another 4 ml of digestion solution was added to the calvariae pieces; they were vigorously shaken and placed at 37 C for another 20-minute incubation. This process beginning with the addition of calvariae digestion solution and concluding with plating the cell suspension in a 6-well plate was carried out a total of 4 times to obtain pools 1 to 4. The following day after plating, media were replaced with fresh calvariae growth medium, and cells were monitored until ~85% confluency was reached. The cells were trypsinized [0.25% trypsin/2.21 mm EDTA in Hanks' Balanced Salt Solution (CellGro, Mediatech, Herndon, VA)] and pools 1 and 2 were combined while pools 3 and 4 were combined. Cells were plated at a density of 1 to cells/cm 2 in calvariae growth medium. The next day the culture media was removed and calvariae differentiation medium (calvariae growth medium plus 40 ng/ml dexamethasone) was added to the cells. The calvariae differentiation medium was changed twice a week until the desired osteoblast age was reached. Combined pools 3 and 4 are more osteoblast-like than combined pools 1 and 2. Both pools were analyzed as indicated; however, only combined pools 3 and 4 were used in experiments when comparing MC3T3-E1 and 103
118 primary osteoblast response. Cells were cultured at 37 C, 5% CO 2, in a humidified chambered. Osteoblast age is indicated in figure legends. Breast Cancer Cell Lines A variety of breast cancer cells lines were used in this study. All breast cancer cell lines were a gift from Dr. Danny Welch, University of Alabama, Birmingham. The MDA-MB-231 human metastatic breast cancer cell line was derived from a pleural effusion of an adenocarcinoma, while the MDA-MB-435 human metastatic breast cancer cell line was derived from a pleural effusion of an infiltrating ductal carcinoma [22, 23]. There has been speculation regarding the tumor origin of the MDA-MB-435 cell line. A microarray analysis conducted by Ross and colleagues grouped the gene expression profile of the MDA-MB-435 cell line with melanoma cell lines rather than breast cancer cell lines. However, Sellappan and colleagues showed that MDA-MB-435 cells have properties of breast calls, i.e. they express epithelial markers and secreted milk lipids. The MDA-MB-231-BRSM1 and MDA-MB-435-BRMS1 cell lines stably express the breast cancer metastasis suppressor 1 (BRMS1) gene rendering them nonmetastatic, but still tumorogenic [24, 25]. High expression of BRMS1 in breast cancer and melanoma cancer cells results in decreased metastasis; however, primary tumor growth remains unchanged [24, 25]. BRMS1 is a nuclear protein and has been shown to downregulate NFkB activation in breast and melanoma tumor cells. For some studies, the MDA-MB-231 GFP, MDA-MB-435 GFP, MDA-MB-231-BRMS1 GFP, and MDA- MB-435-BRMS1 GFP cell lines were used in order to visualize and quantitate breast 104
119 cancer cell growth. These cell line variants were engineered to stably express green fluorescent protein (GFP) by lentiviral infection [24]. The breast cancer cell lines tested negative for mycoplasma by PCR (TaKaRa Bio, Inc., Shiga, Japan) and were maintained in breast cancer growth medium (DMEM, 5% FBS, and penicillin 100 U/ml/streptomycin 100 μg/ml) at 37 C, 5% CO 2, in a humidified incubator. Breast Cancer Cell Conditioned Media MDA-MB-231 metastatic breast cancer cells were grown to ~90% confluence before the medium was removed, cells washed with PBS, and αmem was added (20mLs to a T-150, 10mLs to a T-75). The cells were incubated for 24 hours at 37 C. After the 24-hour incubation, the αmem was collected, centrifuged at 300xg for 10 minutes to remove cell debris, aliquotted, and stored at -20 C until use. The frozen aliquots are termed breast cancer cell conditioned medium (CM). Alkaline Phosphatase Staining MC3T3-E1 ells were cultured for the indicated number of days prior to staining for alkaline phosphatase activity. Media were removed and cells were rinsed once with PBS. Cells were then fixed using 10% formaldehyde (in PBS) and rinsed three times with PBS. Alkaline phosphatase stain [0.0013g Napthol AS-BI Phosphate (Sigma), g Fast Blue RR Salt (Sigma), and equal amounts of 0.2M Tris, ph 8.5 and prewarmed water] was prepared fresh and filtered using Whatman paper before being 105
120 added to the cells (1mL of alkaline phosphatase stain for 35-mm polystyrene dish or one well of a 6-well plate, or 0.5mL for one well of a 24-well plate). The cells were incubated at 37 C for 30 minutes and rinsed several times with water. Cells were allowed to dry overnight and imaged using an Olympus BX51 microscope. Von Kossa Staining MC3T3-E1 cells were cultured as previously described for the indicated number of days. Cells were fixed in 10% formaldehyde (in PBS) for 10 minutes at room temperature and rinsed three times with dh 2 0. Silver nitrate solution (5% in dh 2 0) was added for 30 minutes at room temperature in the dark. Cells were washed three times with dh 2 0. dh 2 0 was added to cover the cells and they were exposed to light for at least three hours before the water was removed. The cells were allowed to airdry overnight before imaging on an Olympus BX51 microscope. Co-Culture of Osteoblasts and Breast Cancer Cells At the indicated days (4, 14, or 24 days after plating), GFP-expressing metastatic breast cancer cells were added to the osteoblast cultures at a ratio of 1 breast cancer cell to every 10 osteoblasts. Co-cultures were imaged, supernatants collect, and cells collected 1, 3, and 7 days after plating of the breast cancer cells. 106
121 Microscopy Light / Fluorescent Microscopy At the end of the co-culture, light and fluorescence microscope images of the cells in the 35-mm polystyrene dishes were obtained using a Leitz Diavert microscope and a NIKON CoolPix 8400 digital camera. Three random fields were imaged from each culture dish. Images were saved as JPEGs, and the ImageJ program (NIH) was used to determine the percent area of breast cancer cell colonization based on the fluorescent images. ELISAs and Cytokines (individual and multiplex) Murine IL-6 and murine MCP-1 were quantitated using a sandwich ELISA. Flatbottom 96-well plates (Nunc-Immuno plates with MaxiSorp surface, Nalge Nunc International, Rochester, NY or Greiner, Greiner Bio-One, Germany) were coated with IL-6 or MCP-1 (0.4µg/mL) antibody (R&D Systems) and incubated at 4 C overnight in a humidified container. Plates were washed three times with PBS-0.05% Tween20 and blocked with 1%BSA in PBS for 2 hours at room temperature in a humidified container. Plates were again washed three times with PBS-0.05% Tween20 prior to the addition of 100µL of each sample or standard. Assays were carried out in duplicate. Plates were incubated at 4 C overnight in a humidified container. Plates were washed three times with PBS-0.05% Tween20 prior to addition of IL-6 (0.025µg/mL) or MCP-1 (0.1µg/mL) detection antibody (R&D Systems). Plates were incubated for 2 hours at room 107
122 temperature in a humidified chamber and then washed three times with PBS-0.05% Tween20. NeutrAvidin horseradish peroixidase conjugate [Pierce #31001 (ThermoFisher), Rockland, IL] was added at 1μg/mL for 30 minutes at room temperature and plates were washed three times with PBS-0.05% Tween20 prior to incubation with ABTS peroxidase substrate for 60 minutes at room temperature in the dark. Plates were read at 405nm. Linco Plex Mouse Panel 2B multiplex cytokine kit was run to simultaneously measure murine IL-6, RANKL, leptin, and osteocalcin in supernatants according to the manufacturer s protocol. BioRad Bio-Plex multiplex assays were also used to simultaneously measure MIG, VEGF, MIP2, IL-6, KC, Eotaxin, and MCP-1 in supernatants according to the manufacturer s protocol. Neutralizing antibody to TGF-β was used at a concentration of 10μg/mL, which is enough to neutralize up to 25ng/mL TGF-β according to manufacturer s protocol (R&D Systems). TGF-β receptor inhibitor TGF-β1 receptor inhibitor (Tocris Biosciences, Ellisville, MO LY364947) was added to osteoblasts 30 minutes prior to and simultaneously with the indicated treatment. Trypan Blue staining confirmed no increase in cell death in osteoblasts exposed to the TGF-β1 receptor inhibitor. A dose response experiment was conducted and a working concentration of 10µM was chosen. 108
123 Marligen Transcription Factor Assay MC3T3-E1 cells were cultured as previously described and grown for 15 days in differentiation medium. Cells were then exposed to the indicated treatments for 4 hours prior to the collection of supernatants and nuclear extracts. Nuclear extracts were sent to Marligen Biosciences Inc. to conduct a 50-plex Marligen Transcription Factor Assay. The transcription factor assay simultaneously screened for the activity of 50 different transcription factors in each nuclear extract using the Luminex platform technology. Briefly, nuclear extract purity was determined by a colormetric assay for cytoplasmic lactate dehydrogenase (Sigma, 490nm). Nuclear extracts (5μg) were incubated with probes containing the consensus sequence for each of the 50 transcription factors. If the particular transcription factor is present, the probe will bind. Upon addition of the Luminex beads, which are specifically colored with different ratios of two dyes and contain small complementary sequences to the consensus sequence probes, the activity of each transcription factor was quantitated using flow cytometry and excitation by two lasers (green and red). Each assay had an internal control consisting of control treated and PMA and ionomycin stimulated HL60 nuclear extracts. The HL60 nuclear extracts show the same transcription factor profile every time the assay is run to ensure the assay worked properly. 109
124 Transfection of MC3T3-E1 Osteoblasts MC3T3-E1 cells were plated and cultured as previously described. When osteoblasts were approximately 60% confluent (2 3 days after plating), four different EGR-1 constructs and one negative construct were separately transfected into the cells using Fugene 6 transfection reagent (Table 3.1). Transfection conditions were first optimized using MC3T3-E1 cells, Fugene 6 transfection reagent, and a renilla luciferase plasmid. It was determined that using a ratio of 6:1 (6µL Fugene 6 : 1µg DNA) had the greatest transfection efficiency. MC3T3-E1 cells were transfected using Fugene 6 according to the manufacturers protocol. Briefly, necessary amount of Fugene 6 was pipetted into αmem without touching any walls of the tube. Solution was vortexed and incubated at room temperature for 5 minutes. Desired amount of plasmid DNA was added into the Fugene 6 solution to maintain 6:1 ratio. The transfection reagent:dna complex was incubated for 15 minutes at room temperature before adding the tranfection reagent:dna complex solution to the cells in a drop-wise manner. Plates were gently swirled and incubated at 37 C, 5% CO 2 for hours. Each plasmid contained a neomycin resistant gene. Media were changed on the transfected cells to osteoblast differentiation medium plus 700µg/mL G418 in order to select for the cells containing the necessary plasmid. 110

125 Figure 3.1: Schematic of the Marligen Transcription Factor Assay. Biotinylated probes containing specific consensus sequences to each transcription factor are combined with nuclear extracts. If the transcription factor is present it will bind its probe. The bound probes are washed to remove anything that has not bound and Luminex beads are added. The Luminex beads are individually color-coded and contain a complementary single-stranded sequence specific to each transcription factor probe. Phycoerytherin is added to the reaction and fluorescent intensity of each color-coded probe is measured using the BioPlex laser and software. 111
126 shrna EGR-1 MC3T3-E1 cells were transfected with one of five plasmids provided by SuperArray in the SuperArray SureSilencing shrna plasmid for mouse EGR-1 kit (KM02938N, SuperArray Biosciences Inc., Frederick, MD). Four of the plasmids contained different short hairpin sequences targeting EGR-1 that are under the control of the U1 promoter and neomycin resistance gene. The fifth plasmid was a negative control plasmid that contains a scrambled shrna sequence. E. coli cells were transformed with each plasmid and single colonies were picked for plasmid purification. PstI digests were performed to verify the purified plasmids contained the shrna insert. Each plasmid was transfected into MC3T3-E1 cells using Fugene 6 transfection reagent. Transfections were allowed to continue overnight before cells were replated and G418 was added to the media. Real time-pcr was used to measure expression of EGR-1 on TGF-β stimulated cells. Clonal populations were generated from those cells having the lowest EGR-1 expression. Three clones were pooled together to generate the MC3T3-E1-shEGR1 cell line used in experiments and two negative control clonal populations were pooled together to generate the MC3T3-E1-Neg cell line used as a control. Statistical Analysis Advice was sought from the Penn State University s Statistical Consulting Center. The SAS statistical analysis software 9.1 (Cary, NC) of the mixed effect model was used to determine significant differences (p<0.05) between samples. 112
127 RNA Isolation and Real time-pcr MC3T3-E1 were cultured in standard tissue culture plates for various times. RNA was isolated using RNeasy Kit (Qiagen). On-column DNase digestion was performed using the Qiagen RNase-Free DNase Set. RNA purity was determined by the A260 / A280 ratio; all samples had a ratio > 1.8. First strand cdna synthesis was performed using 0.5 µg RNA in the RETROscript kit (Ambion, Austin, TX). The sequences of the PCR primer pairs used for amplification are listed in Table 1. PCR was carried out on the Ericomp DetaCylcer 1 System. PCR reactions were run on a 2% agarose gel, stained with ethidium bromide and imaged under UV illumination. For real-time PCR, RNA was isolated as described above and purity was determined using A280, A260, and A230 values. First strand cdna synthesis for real time-pcr was generated using SuperArray RT 2 First Strand Kit (C03) and 1 μg RNA. Genomic DNA was removed by addition of genomic DNA elimination buffer and cdna was generated using buffers and primers provided by SuperArray. Samples were incubated at 42 C for 15 minutes followed by a 5-minute incubation at 95 C. cdna was immediately used for real time- PCR or stored at -20 C. Real time-pcr reactions were carried out on an ABI 7300 instrument. An initial 10 minute heating at 95 C activates the HotStart DNA polymerase, followed by 40 cycles of 95 and 60 C held for 15 seconds and 1 minute respectively. A first derivative dissociation curve was generated immediately following completion of the real time-pcr program. The Ct method was used to analyze the real time-pcr data [39]. 113
128 CLONE ID INSERT SEQUENCE 1 TGACATTTGTGGGAGGAAGTT 2 CTACTCCCAACACTGACATTT 3 GCGATGGTGGAGACGAGTTAT 4 TTGCCTCCCATCACCTATACT NC GGAATCTCATTCGATGCATAC Table 3.1: Insert sequences of each shrna plasmid targeting EGR1 and the negative (scrambled) control insert sequence. 114
129 Gene Primers (F=Forward; R=Reverse) Annealing Temperature Cycles Amplicon Size (bp) Osteocalcin Type I Collagen β-actin F: 5'-CAA GTC CCA CAC AGC AGC TT-3' R: 5'-AAA GCC GAG CTG CCA GAG TT-3' F: 5'-TCT CCA CTC TTC TAG TTC CT-3' R: 5'-TTG GGT CAT TTC CAC ATG-3' F: 5'-CGT GGG CCG CCC TAG GCA-3' R: 5'-TTG GCC TTA GGG TTC AGG-3' Table 3.2: PCR primer sequences and conditions. Listed above are the forward and reverse primer sequences, as well as, annealing temperatures, cycle numbers, and band sizes for each gene measured by PCR. 115
130 Cytoskeletal Staining MC3T3-E1 cells were plated in Lab-Tek 8-chambered slides [NUNC (Fisher Scientific), Pittsburgh, PA] at a density of 5 x 10 3 cells / cm 2. After 4 hours, media were removed and osteoblast differentiation medium or 50% metastatic breast cancer cell conditioned medium was added to the cells. Cultures were carried out for 4 days. The medium was changed every two days. Cells were fixed in 10% formaldehyde in PBS for 10 minutes at room temperature. Cells were rinsed three times with PBS and permeabalized using 0.1% Triton-X100 in PBS for 3 minutes. Cells were rinsed three times with PBS and incubated with 1% BSA in PBS to prevent non-specific binding. To stain for F-actin, AlexaFluor 568 phalloidin and SYBR were diluted in the same tube at 1:50 and 1:5000, respectively, in 1%BSA in PBS and added to the cells for 20 minutes at room temperature in the dark. Cells were rinsed three times with PBS; the chambers were removed from the slide; and a 20x50 mm glass coverslip was mounted to the cells using Fluoromount-G (Southern Biotechnology Associates, Birmingham, AL). Western Blot MC3T3-E1 nuclear lysates (40 µg) were separated by SDS-PAGE under reducing conditions and transferred to nitrocellulose membranes (Whatman, Sanford, ME). Membranes were blocked using 5%BSA in TBS-0.1%Tween for 1 hour at room temperature. Membranes were then incubated with anti-egr1 (1:1000) or anti-panactin (1:1000) (Santa Cruz and Cell Signaling respecitvely) overnight at 4 C with shaking. Next, membranes were incubated with peroxidase-labeled donkey anti-goat IgG 116
131 (1:20,000) for 1 hour at room temperature. Membranes were visualized with ECL (GE Healthcare, Amersham, Fairfield, CT) and exposed to CL-XPosure film (ThermoFisher Scientific, Rockford, IL). Nuclear Extracts Media was removed from cells and the cells were washed once with PBS. Cells were collected and centrifuged at 900xg for 5 minutes. Protease and Phosphatase Inhibitor cocktails (Sigma) were added to the Cytoplasmic Extract (CE) buffer containing detergent immediately prior to use at a ratio of 1:1000, or 1 μl of each cocktail to every 1 ml buffer. Cells were resuspended in 100 µl CE buffer and incubated on ice for 10 minutes. Cells were centrifuged at 300xg for 4 minutes. If cytoplasmic extract was needed, it was removed and placed into a separate eppendorf tube at this step. The nuclei were washed 3 to 5 times with 100 µl CE buffer without any detergent and centrifuging for 4 minutes at 300xg between each wash. After the last wash, 50 µl of nuclear extraction buffer (NE) was added to the nuclear pellet, followed by addition of 2 µl of 5M NaCl, and an additional 50 µl of NE buffer. The pellet was vortexed to resuspend and nuclear extracts were incubated on ice for 60 minutes, with vortexing every 15 minutes. Cytoplasmic and nuclear extracts were spun at 900xg for 10 minutes and supernatants were placed into a clean eppendorf tube. Protein concentrations were determined by BCA assay (Pierce, Rockford, IL) and extracts were frozen at -80 C. 117
132 Results Transcription Factor Activity in Osteoblasts Exposed to Metastatic Breast Cancer Cell Conditioned Medium In order to identify potential transcription factors involved in the osteoblast inflammatory response to metastatic breast cancer cell conditioned medium, a Marligen Transcription Factor Assay was conducted to simultaneously measure the activities of multiple transcription factors. This particular assay utilizes the Luminex xmap platform technology to quantitate 50 different transcription factors within the same sample. Biotinylated transcription factor probes that contain the specific consensus sequence of each transcription factor along with a single stranded complementary sequence that will bind to individually color-coded beads are used. If the transcription factor is present within the nuclear extract it will bind its probe. Two dyes are used in different ratios to color-code beads that contain unique complementary sequences found on each probe. Streptavidin-Phycoerythrin is then added to detect fluorescent intensity while the beads are used to identify each transcription factor, which allows for quantitation of multiple transcription factor activities (Figure 3.1). Of the 50 transcription factors screened (Table 3.3), NFkB and early growth respone-1 was increased in response to treatment with metastatic breast cancer cell conditioned medium or 2.5 ng/ml TGF-β for 4 hours, while nuclear factor gamma-1 (NFY1) activity was decreased (Figure 3.2). EGR-1 and NFkB activities were restored to levels seen in osteoblasts treated with vehicle medium when TGF-β in the CM was 118

133 Table 3.3: Fifty transcription factors screened by the Marligen Transcription Factor Assay. 119
134 neutralized [Figure CM+αTGF-β (4) compared to CM (2)]. NFY1 activity also increased when TGF-β was neutralized in the metastatic breast cancer cell conditioned medium, rather than repressed as seen with conditioned medium treatment (Figure 3.3). Western blot analysis of nuclear extracts and real time-pcr confirmed a 2 fold increase in EGR-1 after treatment with 50% human metastatic breast cancer cell conditioned medium and a 5 fold increase when stimulated with 2.5ng/mL TGF-β (Figure 3.5). EGR-2 expression in MC3T3-E1 nuclear extracts was also measured by western blot analysis, and did not change when treated with metastatic breast cancer cell conditioned medium or TGF-β (Figure 3.6). Supernatants were collected from the same MC3T3-E1 cultures used to obtain the nuclear extracts used for the Marligen Transcription Factor Assay and a BioRad Bio-Plex 5-plex murine cytokine assay was conducted to measure IL-6, MCP-1, VEGF, MIP-2, and MIG secreted from the osteoblasts exposed to 50% metastatic breast cancer conditioned medium or 2.5 ng/ml TGF-β for 4 hours (Figure 3.7). All cytokines measured were found to be significantly increased after treatment with metastatic breast cancer cell conditioned medium or TGF-β (p<0.05). For all experiments, murine osteoblasts, MC3T3-E1 or primary calvarial, were treated with human metastatic breast cancer cell conditioned medium. This was done in order to measure cytokine production by the osteoblasts using murine antibodies. While the human metastatic breast cancer cell conditioned medium was never run with the murine BioRad Bio-Plex cytokine assay, the human metastatic breast cancer cell conditioned medium was tested with a human BioRad Bio-Plex cytokine assay and with IL-6 and MCP-1 sandwich ELISAs (Table 3.4). The manufacturer, BioRad, 120
135 NFkB EGR-1 NFY1 Figure 3.2: Percent change in binding of transcription factors in osteoblasts exposed to metastatic breast cancer cell conditioned medium compared to vehicle medium controls. Shown are 11 of the 50 transcription factors screened by the Marligen Transcription Factor Assay. Experiment was done twice in duplicate. Each dot represents one of the four MC3T3-E1 samples and the corresponding change in activity compared to vehicle medium controls. Circled are EGR, NFkB, and NFY1 transcription factors (from left to right). 121
136 Figure 3.3: IL-6 secretion by osteoblasts treated with metastatic breast cancer cell conditioned medium, TGF-β, or metastatic breast cancer cell conditioned medium containing a neutralizing antibody to TGF-β. MC3T3-E1 cells were treated with vehicle medium (control, 1), metastatic breast cancer cell conditioned medium (2), 2.5 ng/ml TGF-β (3), or metastatic breast cancer cell conditioned medium containing 10 μg/ml neutralizing antibody to TGF-β (4) for 4 hours. Supernatants were collected for cytokine analysis by ELISA and nuclear extracts were isolated and a Marligen Transcription Factor Assay conducted. Shown is the IL-6 cytokine level corresponding to each treatment. Below the treatments are the results from the transcription factor assay. In bold are those transcription factors upregulated by the corresponding treatment compared to vehicle medium treatment and italics indicates transcription factors repressed by the corresponding treatment compared to vehicle medium treatment. 122
137 Figure 3.4: TGF-β induced IL-6 secretion from MC3T3-E1 osteoblasts. MC3T3-E1 cells were grown for 15 days in differentiation medium prior to treatment with 0.5 ng/ml TGF-β or 0.5ng/mL TGF-β in combination with increasing concentrations of TGF-β neutralizing antibody (1, 2.5, 5, and 10 μg/ml). Twenty-four hours later supernatants were collected and IL-6 ELISA performed. The experiment was repeated three separate times and each supernatant was run in duplicate. Shown is the average of all readings +/- standard deviation. 123

138 A B Fold Induction Relative Intensity VM CM TGF-β Treatments C Fold Induction 2 (-ΔΔCt) VM CM TGF-β Treatments 124
139 Figure 3.5: EGR-1 protein and mrna levels increased in MC3T3-E1 cells treated with metastatic breast cancer cell conditioned medium or TGF-β. MC3T3-E1 cells were cultured for 15 days in osteoblast differentiation medium prior to treatment with 50% metastatic breast cancer cell conditioned medium from MDA-MB-231 cells or 2.5 ng/ml TGF-β for 4 hours. Nuclear extracts and RNA were isolated and western blot (A, B) and real time-pcr (C ) analyses were done. Shown are EGR-1 and pan-actin western blots (A). The fold change increase indicated between the bands and shown graphically in (B) is the relative intensity calculated by band densiometry (ImageJ program) and normalized to the corresponding pan-actin relative intensity. EGR-1 expression was also measured by real time-pcr. The ΔΔCt method was used to calculate EGR-1 fold induction and is shown graphically (C ). N=2 for graphs (B) and (C ) +/- the standard deviation. 125

 is the relative intensity calculated by band densiometry (ImageJ program) and")
140 A B Figure 3.6: EGR-2 was not induced in MC3T3-E1 cells treated with metastatic breast cancer cell conditioned medium or TGF-β. MC3T3-E1 cells were cultured for 15 days in osteoblast differentiation medium prior to treatment with 50% metastatic breast cancer cell conditioned medium from MDA-MB-231 cells or 2.5 ng/ml TGF-β for 4 hours. Nuclear extracts were isolated for western blot analysis. Shown are EGR-1 and panactin western blots (A). The fold change increase indicated between the bands and shown graphically in (B) is the relative intensity calculated by band densiometry (ImageJ program) and normalized to the corresponding pan-actin relative intensity. 126
141 * * * * * * * * * * Figure 3.7: Cytokine levels increased in supernatants from MC3T3-E1 cells treated for 4 hours with metastatic breast cancer cell conditioned medium. MC3T3-E1 cells were grown for 15 days in osteoblast differentiation medium. Medium was replaced with 50% MDA-MB-231 conditoned medium (CM, black bars) or 2.5ng/mL TGF-β (TGF-B, gray bars). Four hours later supernatants were collected and cytokines measured by a 5- plex BioRad BioPlex assay. Three experiments were done in duplicate for six biological replicates. * indicates statistical significance p<0.05 determined by SAS analysis of a mixed effect model comparing CM or TGF-β cytokine values to VM values. 127

142 Table 3.4: Human cytokine levels measured in human metastatic breast cancer cell conditioned medium collected from MDA-MB-231 cells. Values represent the amount of each cytokine measured using a human BioRad Bio-Plex cytokine assay in pg/ml in 100% metastatic breast cancer cell conditioned medium. For all experiments, equal volumes of metastatic breast cancer cell conditioned medium and 2X concentrated osteoblast differentiation medium are added together to reach a final 1X osteoblast differentiation medium concentration and 50% metastatic breast cancer conditioned medium treatment. 128
143 carried out a cross-reactivity test per our request on the cytokines measured in this study and found VEGF to be 100% cross-reactive between human and mouse. All others were 0 to 5% cross-reactive. Therefore, cytokine values displayed represent the value obtained with the corresponding assay. No adjustment was necessary for stimulation with human metastatic breast cancer cell conditioned medium. Additionally, MC3T3-E1 cells were stimulated with 0.5 ng/ml TGF-β or 0.5 ng/ml TGF-β and increasing amounts of TGF-β neutralizing antibody for 24 hours. IL-6 cytokine production was measured by ELISA (Figure 3.4). TGF-β alone stimulated IL-6 production, whereas addition of the TGF-β neutralizing antibody decreased the IL-6 resonse to TGF-β in a dose dependent manner. Due to the link between increased EGR-1 expression and increased inflammatory cytokine production seen in other cell types, the role of EGR-1 in the osteoblast inflammatory response to metastatic breast cancer cell conditioned medium was investigated by decreasing EGR-1 gene expression in MC3T3-E1 cells using SuperArray SureSilencing shrna plasmid for mouse EGR-1 (cat. # KM02938N). This particular kit contains four separate vectors that express different short hairpin RNA sequences (Clone ID 1, 2, 3, or 4) under control of the U1 promoter and neomycin resistance gene (Table 3.1 and Figure 3.8) in addition to a negative control plasmid containing a scrambled shrna sequence (NC). E.coli cells were transformed with the supplied plasmids and plated in LB agar plates containing ampicillin. Single colonies were picked for plasmid purification. PstI restriction enzyme digestions were performed to verify that the purified plasmids contained the shrna insert. Upon PstI restriction 129
144 enzyme digestion, 3827 and 991 bp bands were visible indicating the plasmids contained the shrna insert (Figure 3.9). Prior to transfecting the MC3T3-E1 cells with the shrna plasmids containing a neomycin resistant gene, transfection conditions and neomycin concentrations were optimized for MC3T3-E1 cells. Fugene 6 transfection reagent was used. MC3T3-E1 cells were plated and grown until approximately 80% confluent. Three different ratios of Fugene 6 : DNA were tested in duplicate (3:1, 3:2, and 6:1). Fugene 6 was added directly to serum free media prior to addition of the necessary amount of DNA. The Renilla Luciferase plasmid (prltk, Promega) was used to optimize the Fugene 6 transfections. The Fugene 6 : DNA complex was then added to MC3T3-E1 cells and allowed to incubate overnight at 37 C. Cell lysates were collected in 1X Passive Lysis Buffer (Promega) and the dual-luciferase reporter assay was conducted according to the manufacturer s protocol described in the materials and methods section. There was a significant increase in the renilla luciferase activity seen using the 6:1 Fugene 6 : μg of DNA ratio (Figure 3.10). For transfection experiments using the shrna plasmids, the 6:1 ratio was used to achieve optimal transfection efficiency in MC3T3-E1 cells. The minimum neomycin concentration needed to kill untransfected cells was determined in order to select for MC3T3-E1 cells containing the shrna plasmids. MC3T3-E1 cells were plated at 5x10 3 cells / cm 2 in osteoblast differentiation medium and allowed to attach overnight. The next day, medium was removed and replaced with osteoblast differentiation medium containing various concentrations of neomycin (G418) ranging from 0 µg/ml up to 1000 µg/ml. Medium containing G418 was replaced two to 130
145 Figure 3.8: Schematic of the pgeneclip neomycin vector (Promega) used by SuperArray Biosciences to generate the four separate plasmids containing shrna sequences targeting EGR1 and one plasmid that has a scrambled shrna sequence. Image taken from SuperArray Bioscience Corporation, SureSilencing shrna Plasmids User Manual, Part#1019A, Appendix A. 131
146 PstI digested uncut Clone 1 shegr1 Clone 2 shegr1 Clone 3 shegr1 Clone 4 shegr1 Negative Scrambled Clone 1 shegr1 Clone 2 shegr1 Clone 3 shegr1 Clone 4 shegr1 Negative Scrambled 1-kb marker ~3827 kb ~991 kb LANES Figure 3.9: PstI restriction enzyme digestion of purified shegr1 plasmids. Four plasmids, each containing a different shrna sequence targeting EGR1, and one plasmid with a scrambled shrna sequence, were purified using a midi-prep kit (Marligen). PstI restriction enzyme digest was carried out on 2μg DNA at 37 C for 2 hours using 1X NEBuffer 3 with BSA (New England BioLabs, Ipswich, MA). Reactions were run on a 1.5% agarose gel. Lanes 1 5: Purified plasmids cut with PstI, Lanes 6 10: uncut purified plasmids, Lane 12: 1kb ladder 132
147 Relative Light Units (RLU) :1 3:2 6:1 Fugene6 : DNA Ratio Figure 3.10: Transfection optimization of Fugene 6 transfection reagent in MC3T3-E1 cells. MC3T3-E1 cells were grown until ~75% confluence. Different ratios of Fugene 6 transfection reagent : µg DNA of plrtk (Renilla luciferase reporter plasmid, Promega) were added to the MC3T3-E1 cells and allowed to incubate overnight. Cells lysates were collected (1X Passive Lysis Buffer,Promega) and a dual luciferase assay was conducted. Shown are the average relative light units (RLU) for each ratio of reagent : DNA. Two separate plates were used for each ratio and run in duplicate. 133
148 three times per week. Cells were monitored daily, but allowed to grow for 10 days in each G418 concentration. The effective concentration of G418, or the minimum concentration of G418 needed to kill all untransfected cells, was found to be 700 µg/ml. This G418 concentration is consistent with another published report for an effective G418 concentration needed to kill off untransfected MC3T3-E1 cells [26]. Stably transfected MC3T3-E1 cells were generated by using Fugene 6 to transfect each EGR-1 shrna plasmid into the cells. The MC3T3-E1 cell population containing the necessary plasmids was selected for using G418 at a concentration of 700 µg/ml. Each plasmid (4 EGR-1 shrna, 1 negative control) was transfected in triplicate and RNA interference was validated using SYBR Green / ROX real-time PCR with primers designed by SuperArray to measure EGR-1 and GAPDH expression. All samples were stimulated with 1.5 ng/ml TGF-β for two to four hours in order to induce expression of EGR-1 to distinguish those cells truly having knockdown expression of EGR-1. Each PCR reaction was run in triplicate as well (according to Table 3.5). RNA for each transfection was isolated using RNeasy kit (Qiagen). First strand cdna template synthesis was performed on each sample using SuperArray Real-Time PCR Master Mix and corresponding SuperArray primer sets for mouse EGR-1 and mouse GAPDH. Based on the results from real time-pcr, 3 shrna transfections and 2 negative control transfections were selected to generate clonal cell populations (Figure 3.11). Ninety-six well plates were seeded at approximately 1 cell per well or 1 cell per every other well. Those wells containing single cell colonies were selected to expand in 134
 and one construct with a scrambled shrna sequence (negative contol NC) were transfected into MC3T3-E1 cells.")
149 Table 3.5: Format of the 96-well plate used to measure EGR-1 and GAPDH expression by real time-pcr. Four constructs containing shrna sequences specific for EGR1 (Construct 1, 2, 3, 4) and one construct with a scrambled shrna sequence (negative contol NC) were transfected into MC3T3-E1 cells. G418 was used for selection of transfected cells. Real time-pcr was conducted on TGF-β stimulated cells to measure EGR-1 and GAPDH expression. Shown above is the 96-well plate set-up to measure EGR-1 and GAPDH expression. Each transfection was done in triplicate and every RNA isolated was measured by real time-pcr in triplicate. Table taken from SuperArray Bioscience Corporation, SureSilencing shrna Plasmids User Manual, Part#1019A. 135
150 culture and were screened for the expression of EGR-1 after TGF-β stimulation. The three clones expressing the lowest levels of EGR-1 by real time-pcr were pooled for all experiments (MC3T3-E1-shEGR1) and the two negative control clones having similar EGR-1 expression to untransfected MC3T3-E1 cells (MC3T3-E1-Neg) were pooled together and used as a control for all experiments (Figure 3.12). Decreased Expression of EGR-1 in MC3T3-E1 Cells Does Not Alter Osteoblast Differentiation MC3T3-E1-shEGR1 and MC3T3-E1-Neg cells were plated at 10 4 cells / cm 2 and grown for up to 45 days in osteoblast differentiation medium. Alkaline phosphatase staining was done after 10, 17, 30, and 45 days in culture as described in the materials and methods section (Figure 3.11). Faint alkaline phosphatase staining was seen after 10 days in culture. By 45 days, many cells were stained positive for alkaline phosphatase activity. MC3T3-E1-shEGR1 and MC3T3-E1-Neg cells were able to mineralize matrix as detected by Von Kossa staining after 30 days in culture (Figure 3.13). Additionally, MC3T3-E1-Neg and MC3T3-E1-shEGR1 cells expressed Type I collagen and osteocalcin after 10 and 17 days in culture as seen by PCR analysis (Figure 3.14) 136
151 A B Figure 3.11: MC3T3-E1 cells transfected with shrna plasmids targeting murine EGR-1 show decreased EGR-1 RNA expression. MC3T3-E1 cells were transfected with one of five neomycin resistant plasmids (4 plasmids containing different EGR-1 sequences and 1 plasmid having a negative scrambled sequence). Transfections were done in triplicate. Cells were grown in the presence of 700 μg/ml G418 to select for transfected cells and remained subconfluent. Prior to RNA isolation, cells were stimulated with 1.5ng/mL TGF-β for 2 to 4 hours to induce EGR-1 expression. Real-time PCR was done. Shown are the average Ct values obtained by realt-time PCR for the 5 populations used to generate clonal populations (A). Ct values are also shown for untransfected MC3T3-E1 cells treated with and without TGF-β (A). The percent EGR-1 expression as compared to TGF-β induced EGR-1 expression in untransfected MC3T3- E1 cells (MC3T3-E1 + TGF-β) is shown graphically (B). 137

152 A B Figure 3.12: RNA expression of EGR-1 in clonal populations of MC3T3-E1 cells used to generate MC3T3-E1-shEGR1 and MC3T3-E1-Neg cell lines. Each transfected cell population shown in Figure 3.11 was plated at approximately 1 cell per well and at 1 cell per every other well in a 96-well plate. Thirty clonal populations were screened for EGR-1 expression after TGF-β stimulation using real-time PCR. Shown are the average Ct values obtained for the 5 clonal populations (A), as well as, the percent EGR-1 expression as compared to untransfected MC3T3-E1 cells stimulated with TGFβ (B) determined by the ΔΔCt method. Real-time PCR expression of EGR-1 in unstimulated MC3T3-E1 cells is also shown in A (MC3T3-E1 VM) and B (MC3T3-E1). 138


153 A B C 139
154 Figure 3.13: MC3T3-E1-Neg and MC3T3-E1-shEGR1 cells differentiate in culture. MC3T3-E1-Neg (A) and MC3T3-E1-shEGR1 (B) cells were grown in osteoblast differentiation medium for up to 45 days. After various days in culture (10, 17, 30, and 45), cells were stained with alkaline phosphatase. Calcium deposition was measured in MC3T3-E1-Neg (C, left) and MC3T3-E1-shEGR1 (C, right) after 30 days in culture by Von Kossa staining. All images were taken at 20X magnification. 140

155 Figure 3.14: MC3T3-E1-Neg and MC3T3-E1-shEGR1 cells express Type I collagen and osteocalcin. MC3T3-E1-Neg and MC3T3-E1-shEGR1 cells were grown in osteoblast differentiation medium for 10 and 17 days. RNA was isolated (RNeasy, Qiagen) and Type I collagen and osteocalcin expression measured by PCR analysis. RNA was isolated from two separate culture dishes for each timepoint. 141


156 A EGR-1 EGR-2 Actin EGR1 EGR2 Actin MC3T3-E1-Neg MC3T3-E1-Neg VM TGF-β VM CM TGF-β MC3T3-E1-shEGR1 VM TGF-β VM CM TGF-β B C 142
157 Figure 3.15: EGR-1 and EGR-2 protein expression in MC3T3-E1-Neg and MC3T3-E1- shegr1 cells. MC3T3-E1-Neg and MC3T3-E1-EGR1 cells were grown for 15 days in differentiation medium prior to treatment with vehicle medium (VM), metastatic breast cancer cell conditioned medium (CM), 1.5ng/mL TGF-β (TGF-β), or metastatic breast cancer cell conditioned medium with 10μM TGF-β receptor I inhibitor (CM + inhib) for 4 hours. Nuclear extracts were isolated and 40μg of protein was loaded per well. Relative intensity of each band was measured using ImageJ software. Shown below the western blots is the relative intensity of each band (B: EGR-1, C: EGR-2) divided by the relative intensity of the corresponding pan-actin band. Fold inductions are relative to VM treatment. 143
, metastatic breast cancer cell conditioned medium (CM),")
158 Table 3.6: Average Ct values obtained from real-time PCR for EGR family members. MC3T3-E1-Neg, MC3T3-E1-shEGR1, and MC3T3-E1 cells were grown for 15 days in differentiation medium prior to treatment with vehicle medium (VM), metastatic breast cancer cell conditioned medium (CM), 1.5ng/mL TGF-β (TGF-β), or metastatic breast cancer cell conditioned medium with 10μM TGF-β receptor I inhibitor (CM + inhib) for 4 hours. RNA was isolated and real-time PCR was performed on each sample in triplicate. Shown are the average Ct values and the fold change from VM treatment as calculated by the ΔΔCt method. 144
, metastatic breast cancer cell conditioned medium (CM),")
159 A B C D Figure 3.16: Fold induction of RNA expression of EGR family members in MC3T3-E1-Neg, MC3T3-E1-shEGR1, and MC3T3-E1 cells. MC3T3-E1-Neg, MC3T3-E1-shEGR1, and MC3T3-E1 cells were grown for 15 days in differentiation medium prior to treatment with vehicle medium (VM), metastatic breast cancer cell conditioned medium (CM), 1.5ng/mL TGF-β (TGF-β), or metastatic breast cancer cell conditioned medium with 10μM TGF-β receptor I inhibitor (CM + inhib) for 4 hours. RNA was isolated and real-time PCR was performed on each sample in triplicate. Shown is the fold induction of each treatment to the corresponding VM treatment. Panel A represents EGR-1 expression, panel B represents EGR-2 expression, panel C represents EGR-3 expression, and panel D represents EGR-4 expression. 145
160 Osteoblasts Expressing Lower Levels of EGR-1 Have Decreased Production of Inflammatory Cytokines in the Presence of Metastatic Breast Cancer Cell Conditioned Medium MC3T3-E1-shEGR1 and MC3T3-E1-Neg cells were grown for 15 days in osteoblast differentiation medium prior to incubation with 50% metastatic breast cancer cell conditioned medium for various times ranging from 30 minutes to 24 hours. In as little as 30 minutes, MCP-1 levels were increased in response to the breast cancer cell conditioned medium in both MC3T3-E1-shEGR1 and MC3T3-E1-Neg cells (Figure 3.17, B). The amount of MCP-1 produced in response to the breast cancer cell conditioned medium continued to increase up to 24 hours in both cell lines. The amounts of MCP-1 produced by the MC3T3-E1-shEGR1 cells were lower at all time points tested than the MCP-1 amounts produced by the MC3T3-E1-Neg cells. While the TGF-β receptor I inhibitor prevented production of MCP-1 by the MC3T3-E1-Neg cells, the inhibitor was less effective at preventing the increase in MCP-1 production over time (Figures 3.19 and 3.20, B - compare 2h, 4h, and 24h to 0.5h and 1h). IL-6 levels were not detected in the supernatants until 60 minutes of exposure to breast cancer cell conditioned medium (Figure 3.17, A). MC3T3-E1-shEGR1 cells initially showed an increase in production of IL-6 compared to MC3T3-E1-Neg cells after 1hour and 2 hours of stimulation with breast cancer cell conditioned medium, but after longer exposure to the breast cancer conditioned medium (4h, 24h) the MC3T3-E1- shegr1 showed decreased production of IL-6 (Figures 3.17 and 3.18, A). TGF-β induced an increase in IL-6 production by both cell lines; however, cytokine production by the MC3T3-E1-shEGR1 cells was significantly lower than that of the MC3T3-E1-Neg 146
161 cells at 24hr (Figure 3.21, p<0.05). Interestingly, the TGF-β receptor I inhibitor was able to reduce the amount of IL-6 produced by both cell types up to 24 hrs after exposure to breast cancer cell conditioned medium (Figures 3.19 and 3.20, A). These data indicate that MC3T3-E1-shEGR1 cells may be able to maintain lower cytokine levels even in the presence of metastatic breast cancer cell conditioned medium or TBF-B. Even though increases were still seen in the production of these cytokines over vehicle medium treatments in MC3T3-E1-shEGR1 cells, the levels did not rise as high as that seen in the MC3T3-E1-Neg cells. An organism may initiate different immunological responses to stress depending on the level of cytokines present [86,87]. By decreasing expression of EGR1 in osteoblasts, the osteoblasts also decreased the amount of inflammatory cytokines present in the microenvironment. Real-time PCR analysis was also conducted on MC3T3-E1-Neg and MC3T3-E1- shegr-1 cells to measure expression of EGR-1, 2, 3, and 4. MC3T3-E1-Neg, MC3T3- E1-shEGR1, and MC3T3-E1 cells were grown for 15 days in differentiation medium prior to treatment with vehicle medium (VM), metastatic breast cancer cell conditioned medium (CM), 1.5ng/mL TGF-β (TGF-β), or metastatic breast cancer cell conditioned medium with 10μM TGF-β receptor I inhibitor (CM + inhib) for 4 hours. RNA was isolated and real-time PCR analysis conducted on one sample from each treatment in triplicate. Table 3.6 lists the average Ct values obtained from real-time PCR analysis. Graphical representation of the fold induction compared to each cell type VM treatment is shown in Figure Metastatic breast cancer cell conditioned medium increased EGR-1 expression in MC3T3-E1-Neg and MC3T3-E1 cells, but MC3T3-E1-shEGR1 cells did not show an increase in EGR-1 expression (Figure 3.16, A). TGF-β stimulation 147
162 increased expression of EGR-3 and 4 in all cell types (Figure 3.16, C and D). Only EGR-1 expression was altered in the MC3T3-E1-shEGR1 cells compared to the MC3T3-E1-Neg and MC3T3-E1 cells indicating specificity for the shegr-1 plasmids. The MC3T3-E1 cells did show more of an increase in EGR-3 and 4 after TGF-β stimulation compared to the MC3T3-E1-Neg and MC3T3-E1-shEGR1 cell types (Figure 3.16). A TGF-β receptor I inhibitor was used to inhibit the TGF-β pathway rather than a neutralizing antibody to TGF-β as previously used. Phosphorylated Smad3 (P-Smad3) and EGR-1 was measured by western blot analysis in nuclear extracts from MC3T3-E1 cells treated with vehicle medium (VM), metastatic breast cancer cell conditioned medium (CM), 1.5 ng/ml TGF-β (TGF-β), or metastatic breast cancer cell conditioned medium with a TGF-β receptor I inhibitor (CM + TGF-β inhib). The TGF-β receptor I inhibitor decreased EGR-1 and P-Smad3 levels in the nucleus that were increased with TGF-β stimulation (Figure 3.22). Breast Cancer Cells Attach and Colonize Osteoblasts Lacking EGR-1 Expression While cytokine production was lower in MC3T3-E1-shEGR1 cells, metastatic breast cancer cells were able to attach and colonize the osteoblasts as seen by co-culture analysis. MC3T3-E1, MC3T3-E1-Neg, and MC3T3-E1-shEGR1 cells were plated in osteoblast differentiation medium and cultured for 14 days prior to the addition of MDA- MB-231 GFP, MDA-MB-435 GFP, or the BRMS1 variants of each metastatic breast cancer cell line. Both MDA-MB-231 and MDA-MB-435 breast cancer cells are invasive, 148
163 estrogren receptor negative (ER-) breast cancer cell lines. Data from our laboratory supports that MDA-MB-435 breast cancer cells secrete high levels of IL-8, but not TGFβ, while MDA-MB-231 breast cancer cells secrete high levels of TGF- β and several other growth factors and cytokines. The same number of each breast cancer cell variant was added to the osteoblasts and this was approximately 1 cancer cell to every 10 osteoblasts (1:10 ratio). Co-cultures were carried out for 7 days. At the termination of the experiment, fluorescent images were taken and supernatants saved. All breast cancer cells tested (MDA-MB-231 GFP, MDA-MB-231 GFP -BRMS1, MDA-MB-435 GFP, and MDA-MB-435 GFP -BRMS1) attached and colonize all three osteoblast cell lines (Figure 3.23). As noted before, the BRMS1 cancer cells grew differently on the osteoblast than the MDA-MB-231 GFP or MDA-MB-435 GFP cells. They appeared to be spread across the osteoblast layer, not forming as dense of a cancer cell colony. In addition, more circular floating GFP cancer cells are observed in co-cultures conducted with the BRMS1 cancer cells. These data showed that the reduction in cytokine levels did not interfere with the ability of breast cancer cells to attach to or colonize the osteoblast layer. This finding did not rule out, however, that the decreased cytokine production by osteoblasts may alter the behavior of other cell types such as endothelial cells or osteoclasts within the in vivo microenvironment. 149
164 A * * + + * * * * B * * + * * + + * 150
165 Figure 3.17: Cytokine levels of MC3T3-E1-shEGR1 cells treated with metastatic breast cancer cell conditioned medium remained lower than MC3T3-E1-Neg cells treated with metastatic breast cancer cell conditioned medium. MC3T3-E1-Neg and MC3T3-E1- shegr1 cells were cultured for 15 days prior to treatment with vehicle medium or MDA- MB-231 conditioned medium. Supernatants were collected after 0.5, 1, 2, 4, or 24 hours. IL-6 (A) and MCP-1 (B) concentrations were determined by ELISA. * indicates p<0.05 significance compared to each VM cytokine level at the corresponding time and + indicated p<0.05 significance of CM cytokine levels between MC3T3-E1-Neg and MC3T3-E1-shEGR1 cells at the indicated time determined by SAS analysis of a mixed effect model. Experiment was repeated three separate times. Shown is a representative ELISA where all samples were run on the same ELISA plate. 151
166 A * * B * * * 152
167 Figure 3.18: Cytokine levels from MC3T3-E1-Neg and MC3T3-E1-shEGR1 cells treated with metastatic breast cancer cell conditioned medium. MC3T3-E1-Neg and MC3T3- E1-shEGR1 cells were cultured for 15 days prior to treatment with MDA-MB-231 conditioned medium. Supernatants were collected after 0.5, 1, 2, 4, or 24 hours. IL-6 (A) and MCP-1 (B) concentration was determined by ELISA. * indicates p<0.05 significance of CM cytokine levels between MC3T3-E1-Neg and MC3T3-E1-shEGR1 cells at the indicated time determined by SAS analysis of a mixed effect model. Experiment was repeated three separate times. Shown is a representative ELISA where all samples were run on the same ELISA plate. 153
168 A * * B * * * 154
169 Figure 3.19: Cytokine levels from MC3T3-E1-Neg and MC3T3-E1-shEGR1 cells treated with metastatic breast cancer cell conditioned medium or metastatic breast cancer cell conditioned medium containing a TGF-β receptor I inhibitor. MC3T3-E1-Neg and MC3T3-E1-shEGR1 cells were cultured for 15 days prior to treatment with MDA-MB- 231 conditioned medium (CM) or MDA-MB-231 conditioned medium with 10μM TGF-β receptor I inhibitor (CM + inhib). Supernatants were collected after 0.5, 1, 2, 4, or 24 hours. IL-6 (A) and MCP-1 (B) concentration was determined by ELISA. * indicates p<0.05 significance between MC3T3-E1-Neg and MC3T3-E1-shEGR1 cells at the indicated time when treated with CM + inhib compared to CM treatment determined by SAS analysis of a mixed effect model. Experiment was repeated three separate times. Shown is a representative ELISA where all samples were run on the same ELISA plate. 155
170 A * * * B * * 156
171 Figure 3.20: Cytokine levels from MC3T3-E1-Neg and MC3T3-E1-shEGR1 cells treated with metastatic breast cancer cell conditioned medium containing a TGF-β receptor I inhibitor. MC3T3-E1-Neg and MC3T3-E1-shEGR1 cells were cultured for 15 days prior to treatment with MDA-MB-231 conditioned medium with 10μM TGF-β receptor I inhibitor (CM + inhib). Supernatants were collected after 0.5, 1, 2, 4, or 24 hours. IL-6 (A) and MCP-1 (B) concentration was determined by ELISA. * indicates p<0.05 significance between MC3T3-E1-Neg and MC3T3-E1-shEGR1 cells at the indicated time when treated with CM + inhib determined by SAS analysis of a mixed effect model. Experiment was repeated three separate times. Shown is a representative ELISA where all samples were run on the same ELISA plate. 157
172 A * β β + * * * B * + * 158
173 Figure 3.21: Cytokine levels from MC3T3-E1-Neg and MC3T3-E1-shEGR1 cells treated with TGF-β. MC3T3-E1-Neg and MC3T3-E1-shEGR1 cells were cultured for 15 days prior to treatment with 1.5 ng/ml TGF-β. Supernatants were collected after 0.5, 1, 2, 4, or 24 hours. IL-6 (A) and MCP-1 (B) concentration was determined by ELISA. * indicates p<0.05 significance between VM and TGF-β cytokine levels at the indicated time. + indicates p<0.05 significance between MC3T3-E1-Neg and MC3T3-E1-shEGR1 cells at the indicated time when treated with TGF-β determined by SAS analysis of a mixed effect model. Experiment was repeated three separate times. Shown is a representative ELISA where all samples were run on the same ELISA plate. 159
174 Chronic Exposure to Metastatic Breast Cancer Cell Conditioned Medium Does Not Alter Morphology or Actin Stress Fibers in Osteoblasts with Decreased EGR- 1 Expression How do osteoblasts lacking EGR1 expression respond to prolonged exposure of metastatic breast cancer cell conditioned medium? To test MC3T3-E1-shEGR1 cells response to chronic exposure to breast cancer cell conditioned medium, MC3T3-E1- Neg and MC3T3-E1-shEGR1 cells were plated in osteoblast differentiation medium and allowed to adhere to the culture dishes. Medium was then removed and replaced with osteoblast differentiation medium containing 50% metastatic breast cancer cell conditioned medium. Medium was replaced every other day and cultures were carried out for 4 days before actin stress fibers were stained with phalloidin (Figure 3.24). The actin stress fibers remained evenly spread across the MC3T3-E1-shEGR1 cells exposed to the metastatic breast cancer cell conditioned medium (Figure 3.24). MC3T3-E1-Neg cells that had been in the presence of the metastatic breast cancer cell conditioned medium for 4 days, appeared thin and elongated with empty spaces in the cell layer containing punctate spots of actin staining. Wright-Giemsa stained cells revealed similar findings. The MC3T3-E1-shEGR1 cells exposed to metastaic breast cancer cell conditioned medium maintained their expanded shape as when cultured with osteoblast differentiation medium more so than the MC3T3-E1-Neg cells, which appeared long and thin and reorganized into lines. 160

175 A B C 161
176 Figure 3. 22: TGF-β receptor I inhibitor downregulates EGR-1 and P-Smad3. MC3T3- E1 cells were grown for 15 days in differentiation medium prior to treatment for 4 hours with vehicle medium (VM), metastatic breast cancer cell conditioned medium (CM), 1.5ng/mL TGF-β (TGF-β), or metastatic breast cancer cell conditioned medium containing 10μM TGF-β receptor I inhibitor (CM + inhib). Nuclear extracts were isolated and 40μg protein loaded per well for western blot analysis (A). Shown are EGR-1, phosphorylated Smad3 (P-Smad3), pan-actin, and total Smad2/3 western blots. Graphical representation of fold induction of EGR-1 (B) and P-Smad3 (C ) compared to VM treatment was determined by relative intensity of the bands calculated using the ImageJ software. 162
177 Chronic Exposure to Metastatic Breast Cancer Cell Conditioned Medium Decreases Expression of Osteoblast Differentiation Markers MC3T3-E1-shEGR1 cells chronically exposed to metastatic breast cancer cell conditioned medium maintained their actin arrangement and morphology. However differentiation was compromised as seen by a decrease in alkalkine phosphatase staining and expression of Type I collagen and osteocalcin. MC3T3-E1-Neg and MC3T3-E1-shRNA cells were plated in osteoblast differentiation medium and allowed to attach to the culture dish. Medium was then replaced with osteoblast differentiation medium and 50% metastatic breast cancer cell conditioned medium. Media were changed twice a week and cultures were carried out for up to 17 days. RNA was isolated from cells after 17 days of treatment with conditioned medium. Alkaline phosphatase staining was carried out on cells exposed to conditioned medium for the indicated number of days (19 to 37). Both the MC3T3-E1-Neg and MC3T3-E1-shRNA cells exposed to the metastatic breast cancer cell conditioned medium showed decrease alkaline phosphatase staining (Figure 3.26) and no longer expressed Type I collagen or osteocalcin (Figure 3.25). These data indicated that while morphological changes or actin rearrangement did not occur in the MC3T3-E1-shEGR1 cells, the MC3T3-E1-shEGR1 cells were not capable of differentiating in the presence of the metastatic breast cancer cell conditioned medium. Therefore, decreased EGR-1 expression in osteoblasts does not prevent the block in osteoblast differentiation caused by metastatic breast cancer cells. 163

178 A MC3T3-E1 MC3T3-E1-Neg MC3T3-E1-shEGR1 MDA-MB-231 GFP B MDA-MB-231 GFP -BRMS1 C MDA-MB-435 GFP D MDA-MB-435 GFP -BRMS1 164
179 Figure 3.23: Metastatic and metastasis suppressed breast cancer cells attached to osteoblasts lacking EGR-1 expression. MC3T3-E1, MC3T3-E1-Neg, or MC3T3-E1- shegr1 cells were cultured for 15 days in osteoblast differentiation medium prior to the addition of MDA-MB-231 GFP (A), MDA-MB-231 GFP -BRMS1 (B), MDA-MB-435 GFP (C), or MDA-MB-435 GFP -BRMS1 (D) at a ratio of 1 breast cancer cell to 10 osteoblasts. Cocultures were carried out for 7 days. Shown are the fluorescent microscope images of co-cultures. Three plates of each condition were cultured two separate times. Magnification bars indicate 100 μm. 165
 or 50% conditioned medium from MDA-MB-231 cells (B,D).")
180 Figure 3.24: MC3T3-E1-shEGR1 cells cultured with conditioned medium from MDA- MB-231 cells maintained actin stress fiber arrangement. MC3T3-E1-shEGR1 or MC3T3-E1-Neg cells were cultured for 4 days in the presence of osteoblast differentiation medium (A, C) or 50% conditioned medium from MDA-MB-231 cells (B,D). Nuclei were stained with SYBR Green (upper left panel of all images-1); F-actin was stained using Phalloidin (upper right panel of all images - 2); overlay of Phalloidin and SYBR Green staining (bottom of images-3). Cells were visualized by confocal microscopy at 20X magnification. Magnification bars represent 50µm. The experiment was repeated 2 times in duplicate. 166

181 Figure 3.25: MC3T3-E1-Neg and MC3T3- E1-shEGR1 did not differentiate when cultured in metastatic breast cancer cell conditioned medium. MC3T3-E1-Neg and MC3T3-E1-shEGR1 were cultured in 50% metastatic breast cancer cell conditioned medium for up to 45 days. RNA was isolated after 17 days in culture and PCR analysis conducted on Type I collagen, osteocalcin, and actin. Type I collagen and osteocalcin was faintly detected in the MC3T3-E1-Neg cells, however expression is reduced from culture in differentiation medium alone as seen in Figure
 and MC3T3-E1-Neg (N) cells were plated in osteoblast differentiation medium and allowed to attach.")
182 Figure 3.26: Alkaline phosphatase staining of MC3T3-E1-shEGR1 and MC3T3-E1-Neg cells exposed to osteoblast differentiation medium or metastatic breast cancer cell conditioned medium. MC3T3-E1-shEGR1 (S) and MC3T3-E1-Neg (N) cells were plated in osteoblast differentiation medium and allowed to attach. Medium was removed and osteoblast differentiation medium (VM) or metastatic breast cancer cell conditioned medium (CM) was added. Medium was changed every 2 to 3 days and alkaline phosphatase staining was done after 19, 27, 32, 34, and 37 days. Shown is a digital image taken of the stained plates. MC3T3-E1 cells (M) were plated and cultured in VM or CM for 19 days as a control. 168
183 Smad3 Knockout primary calvarial osteoblasts exposed to metastatic breast cancer cell conditioned medium increase production of inflammatory cytokines The TGF-β receptor I inhibitor was able to decrease inflammatory cytokine production by osteoblasts when treated with metastatic breast cancer cell conditioned medium, implying TGF-β signaling contributes to inflammatory cytokine production by the osteoblats. Smad3 is involved in Smad-dependent TGF-β signaling, therefore primary calvarial osteoblasts were isolated from Smad3 knockout mice and treated with metastatic breast cancer cell conditioned medium to determine if osteoblasts lacking ability to signal through Smad3 of the TGF-β pathway would elicit an inflammatory response to metastatic breast cancer cell conditioned medium. MC3T3-E1 cells show an increase in phosphorylated levels of Smad2 (P-Smad2), but not P-Smad3, when treated with metastatic breast cancer cell conditioned medium (Figure 3.31), however Smad2 knockout mice are embryonic lethal [38]. Primary calvarial osteoblasts from Smad3 knockout mice were obtained and P-Smad2 and P- Smad3 measured by wesern blot analysis (Figure 3.32). The Smad3 knockout primary osteoblasts do not express P-Smad3 even when stimulated with metastatic breast cancer conditioned medium or TGF-β. In addition, the Smad3 knockout primary osteoblasts have decreased P-Smad2 levels in the presence of metastatic breast cancer cell conditioned medium. As a result, Smad3 knockout primary osteoblasts, having impaired Smad-dependent TGF-β signaling, were isolated to investigate their inflammatory cytokine response to metastatic breast cancer cell conditioned medium. 169
184 Prior to treatment with metastatic breast cancer cell conditioned medium, Smad3 knockout primary osteoblasts were isolated by a series of collagenase digestions, termed pools, and each pool was analyzed for the presence of alkaline phosphatase and calcium deposition by alkaline phosphatase and Von Kossa staining respectively (Figure 3.27). Pools 3 and 4 were more osteoblast-like, showing more cells staining positive for alkaline phosphatase, than pools 1 and 2 (Fgure 3.27, A) as literature indicates [21]. Therefore, pools 3 and 4 were combined (pools 3+4) and used in experiments. Pools 3+4 stained positive for alkaline phosphatase and Von Kossa (Figure 3.27). Pools 3+4 were grown for 14 days prior to treatment with metastatic breast cancer cell conditioned medium for 24 hours. Cytokines were analyzed using a BioRad Bio-Plex cytokine assay and all cytokines tested (IL-6, Eotaxin, MIG, MIP-2, MCP-1, and KC) were significantly upregulated by both Smad3 wildtype and Smad3 knockout primary osteoblasts treated with metastatic breast cancer cell conditioned medium (Figure 3.28). The increase in cytokine production by Smad3 knockout osteoblasts was not statistically different from the increase in cytokine production by the Smad3 wildtype osteoblasts. These data imply that Smad-dependent TGF-β signaling is not required for the osteoblast inflammatory response to metastatic breast cancer cell conditioned medium. It is important to note that Smad3 knockout osteoblasts do show an increase in EGR-1 expression when exposed to metastatic breast cancer cell conditioned medium or TGF-β, indicating EGR-1 activation is not dependent on P-Smad3 levels (Figure 3.30). 170
185 Metastatic breast cancer cell attachment and colonization of Smad3 knockout primary osteoblasts was also investigated. Even though cytokine production by the Smad3 knockout primary osteoblasts was equivalent to Smad3 wildtype osteoblasts, it is possible that Smad3 is involved in regulation of receptor expression or other cellular functions that could influence the ability of breast cancer cells to attach or grow. Smad3 knockout primary osteoblasts were isolated and grown for 14 days prior to the addition of MDA-MB-231 GFP or MDA-MB-435 GFP metastatic breast cancer cells at a ratio of 1 breast cancer cell to every 10 osteoblasts. Both MDA-MB-231 GFP and MDA-MB-435 GFP cells did attach and colonize on Smad3 knockout primary cells over the 7 day co-culture period (Figure 3.29). Taken together, these data show that Smad-dependent TGF-β signaling does not play a role in the osteoblast inflammatory response to metastatic breast cancer cell conditioned medium. It is possible that other pathways compensate for the loss of Smad3 within the osteoblasts. Additionally, there are Smad-independent TGF-β signaling mechanisms that would result in transcription of inflammatory cytokines. 171

186 A B Figure 3. 27: Primary calvarial osteoblasts from Smad3 wildtype and Smad3 knockout mice differentiate in culture. Primary calvarial osteoblasts from Smad3 WT and Smad3 KO pups were isolated by a series of collagenase digestions, termed pools. Pools 1, 2, 3 and 4 were grown separately and pools 3 and 4 were combined for experiments. Cells were grown for 30 days in calvariae differentiation medium prior to alkaline phosphatase staining (A). Von Kossa staining (B) was done after 60 days in culture on combined pools 3 and 4. All images were taken at 20X magnification. 172
187 * * * * * * * * * * * * Figure 3. 28: Smad3 knockout primary calvarial osteoblasts treated with metastatic breast cancer cell conditioned medium increase production of inflammatory cytokines. Primary calvarial osteoblasts from Smad3 WT and Smad3 KO pups were isolated by a series of collagenase digestions, termed pools. Pools 3 and 4 were combined and cultured for 14 days prior to treatment with vehicle medium (VM) or metastatic breast cancer cell conditioned medium (CM) for 24 hours. The experiment was repeated 3 times. Shown is a representative image taken from one BioRad Bio-Plex result. * indicated p<0.05 significance compared to VM treatment of each cell type determined by SAS analysis of a mixed effect model. 173

188 A B Figure 3.29: Metastatic breast cancer cells attach and colonize Smad3 knockout primary calvarial osteoblasts. Primary calvarial osteoblasts from Smad3 KO pups were isolated by a series of collagenase digestions termed pools. Pools 3 and 4 were combined and cultured for 14 days prior to addition of MDA-MB-231 GFP (A) or MDA-MB- 435 GFP (B) cells at a ratio of 1 breast cancer cell to every 10 osteoblasts. Co-cultures were carried out for 7 days. Images were taken on a confocal microscope at 10X magnification. The experiment was repeated twice. Magnification bar represents 200μm. 174


189 A Smad 3 KO Nuclear Extracts CM+ TGF-β CM VM inhib Smad 3 WT Nuclear Extracts CM+ TGF-B CM VM inhib EGR1 P-Smad3 Actin B C 175
CYTOKINE RECEPTORS AND SIGNAL TRANSDUCTION
 CYTOKINE RECEPTORS AND SIGNAL TRANSDUCTION What is Cytokine? Secreted popypeptide (protein) involved in cell-to-cell signaling. Acts in paracrine or autocrine fashion through specific cellular receptors.
silent epidemic,. (WHO),
,") Tel: 02-740-8686; E-mail: hhbkim@snu.ac.kr silent epidemic,. (WHO),. 5 3, 1. 50 70. 50%, 25%, 20% (12~35%). 2.8% 0.7% 4. ( ). bone remodeling (osteoblast), (osteoclast),.. 3~4.. 70% (osteocyte) (bone lining
Tel: 02-740-8686; E-mail: hhbkim@snu.ac.kr silent epidemic,. (WHO),. 5 3, 1. 50 70. 50%, 25%, 20% (12~35%). 2.8% 0.7% 4. ( ). bone remodeling (osteoblast), (osteoclast),.. 3~4.. 70% (osteocyte) (bone lining
Rama Nada. - Mousa Al-Abbadi. 1 P a g e
 - 1 - Rama Nada - - Mousa Al-Abbadi 1 P a g e Bones, Joints and Soft tissue tumors Before we start: the first 8 minutes was recalling to Dr.Mousa s duties, go over them in the slides. Wherever you see
Cell Biology Lecture 9 Notes Basic Principles of cell signaling and GPCR system
 Cell Biology Lecture 9 Notes Basic Principles of cell signaling and GPCR system Basic Elements of cell signaling: Signal or signaling molecule (ligand, first messenger) o Small molecules (epinephrine,
Generation of post-germinal centre myeloma plasma B cell.
 Generation of post-germinal centre myeloma. DNA DAMAGE CXCR4 Homing to Lytic lesion activation CD38 CD138 CD56 Phenotypic markers Naive Secondary lymphoid organ Multiple myeloma is a malignancy of s caused
G-Protein Signaling. Introduction to intracellular signaling. Dr. SARRAY Sameh, Ph.D
 G-Protein Signaling Introduction to intracellular signaling Dr. SARRAY Sameh, Ph.D Cell signaling Cells communicate via extracellular signaling molecules (Hormones, growth factors and neurotransmitters
The bone microenvironment in metastasis; what is special about bone?
 Cancer Metastasis Rev (2008) 27:41 55 DOI 10.1007/s10555-007-9109-4 The bone microenvironment in metastasis; what is special about bone? Karen M. Bussard & Carol V. Gay & Andrea M. Mastro Published online:
Enzyme-coupled Receptors. Cell-surface receptors 1. Ion-channel-coupled receptors 2. G-protein-coupled receptors 3. Enzyme-coupled receptors
 Enzyme-coupled Receptors Cell-surface receptors 1. Ion-channel-coupled receptors 2. G-protein-coupled receptors 3. Enzyme-coupled receptors Cell-surface receptors allow a flow of ions across the plasma
Deposition of Bone by the Osteoblasts. Bone is continually being deposited by osteoblasts, and it is continually being resorbed where osteoclasts are
 Bone remodeling Deposition of Bone by the Osteoblasts. Bone is continually being deposited by osteoblasts, and it is continually being resorbed where osteoclasts are active. This mechanism is always is
Genetics and Cancer Ch 20
 Genetics and Cancer Ch 20 Cancer is genetic Hereditary cancers Predisposition genes Ex. some forms of colon cancer Sporadic cancers ~90% of cancers Descendants of cancerous cells all cancerous (clonal)
The Pennsylvania State University. The Graduate School. Department of Veterinary and Biomedical Sciences THE ROLE OF OSTEOBLAST-DERIVED INFLAMMATORY
 The Pennsylvania State University The Graduate School Department of Veterinary and Biomedical Sciences THE ROLE OF OSTEOBLAST-DERIVED INFLAMMATORY CYTOKINES IN BONE METASTATIC BREAST CANCER A Dissertation
Principles of Genetics and Molecular Biology
 Cell signaling Dr. Diala Abu-Hassan, DDS, PhD School of Medicine Dr.abuhassand@gmail.com Principles of Genetics and Molecular Biology www.cs.montana.edu Modes of cell signaling Direct interaction of a
Growth Factors. BIT 230 Walsh Chapter 7
 Growth Factors BIT 230 Walsh Chapter 7 3 Definitions Autocrine: a mode of hormone action in which a hormone affects the function of the cell type that produced it. Paracrine: Relating to the release of
Cytokines modulate the functional activities of individual cells and tissues both under normal and pathologic conditions Interleukins,
 Cytokines http://highered.mcgraw-hill.com/sites/0072507470/student_view0/chapter22/animation the_immune_response.html Cytokines modulate the functional activities of individual cells and tissues both under
THE PENNSYLVANIA STATE UNIVERSITY SCHREYER HONORS COLLEGE DEPARTMENT OF BIOCHEMISTRY AND MOLECULAR BIOLOGY
 THE PENNSYLVANIA STATE UNIVERSITY SCHREYER HONORS COLLEGE DEPARTMENT OF BIOCHEMISTRY AND MOLECULAR BIOLOGY IMPACT OF OSTEOBLAST-DERIVED BONE REMODELING CYTOKINES ON METASTATIC BREAST CANCER CELL DORMANCY
Chapter 13: Cytokines
 Chapter 13: Cytokines Definition: secreted, low-molecular-weight proteins that regulate the nature, intensity and duration of the immune response by exerting a variety of effects on lymphocytes and/or
Chapter 15: Signal transduction
 Chapter 15: Signal transduction Know the terminology: Enzyme-linked receptor, G-protein linked receptor, nuclear hormone receptor, G-protein, adaptor protein, scaffolding protein, SH2 domain, MAPK, Ras,
Tissue repair. (3&4 of 4)
") Tissue repair (3&4 of 4) What will we discuss today: Regeneration in tissue repair Scar formation Cutaneous wound healing Pathologic aspects of repair Regeneration in tissue repair Labile tissues rapid
Tissue repair (3&4 of 4) What will we discuss today: Regeneration in tissue repair Scar formation Cutaneous wound healing Pathologic aspects of repair Regeneration in tissue repair Labile tissues rapid
Chapter 11 CYTOKINES
 Chapter 11 CYTOKINES group of low molecular weight regulatory proteins secreted by leukocytes as well as a variety of other cells in the body (8~30kD) regulate the intensity and duration of the immune
Space radiation and osteoclastogenesis:the effects of radiation and microgravity on bone resorption:
 Space radiation and osteoclastogenesis:the effects of radiation and microgravity on bone resorption: Alamelu Sundaresan1, Sukesh Aghara2, Terrell Gibson1and Indi Siripirasan2 1: Texas Southern University-3100
Seeds and soil theory by Stephen Paget at the end of the XIX century.
 Seeds and soil theory by Stephen Paget at the end of the XIX century. In The Distribution Of Secondary Growths In Cancer Of The Breast Paget presents and analyzes 735 fatal cases of breast cancer, complete
Disorders of Cell Growth & Neoplasia
 General Pathology VPM 152 Disorders of Cell Growth & Neoplasia Lecture 3 Rate of growth, local invasion, and metastasis. Molecular basis of cancer (normal cell-cycle and cellular proliferation). Enrique
RAS Genes. The ras superfamily of genes encodes small GTP binding proteins that are responsible for the regulation of many cellular processes.
 ۱ RAS Genes The ras superfamily of genes encodes small GTP binding proteins that are responsible for the regulation of many cellular processes. Oncogenic ras genes in human cells include H ras, N ras,
Cell Signaling part 2
 15 Cell Signaling part 2 Functions of Cell Surface Receptors Other cell surface receptors are directly linked to intracellular enzymes. The largest family of these is the receptor protein tyrosine kinases,
Regulation of the IGF axis by TGF-b during periosteal chondrogenesis: implications for articular cartilage repair
 Regulation of the IGF axis by TGF-b during periosteal chondrogenesis: implications for articular cartilage repair Chapter 04 Boek 1_Gie.indb 55 21-05-2007 12:27:33 Chapter 04 Abstract Goal: TGF-b and IGF-I
THE PENNSYLVANIA STATE UNIVERSITY SCHREYER HONORS COLLEGE. DEPARTMENTS OF BIOLOGY and BIOCHEMISTRY AND MOLECULAR BIOLOGY
 THE PENNSYLVANIA STATE UNIVERSITY SCHREYER HONORS COLLEGE DEPARTMENTS OF BIOLOGY and BIOCHEMISTRY AND MOLECULAR BIOLOGY DEADLY KISS: KISSPEPTIN 10 INTERACTION WITH OSTEOBLASTS AND BREAST CANCER METASTATIC
BONE TISSUE. Dr. Heba Kalbouneh Associate Professor of Anatomy and Histology
 BONE TISSUE Dr. Heba Kalbouneh Associate Professor of Anatomy and Histology BONE FUNCTION Support Protection (protect internal organs) Movement (provide leverage system for skeletal muscles, tendons, ligaments
T-cell activation T cells migrate to secondary lymphoid tissues where they interact with antigen, antigen-presenting cells, and other lymphocytes:
 Interactions between innate immunity & adaptive immunity What happens to T cells after they leave the thymus? Naïve T cells exit the thymus and enter the bloodstream. If they remain in the bloodstream,
1.The metastatic cascade. 2.Pathologic features of metastasis. 3.Therapeutic ramifications
 Metastasis 1.The metastatic cascade 2.Pathologic features of metastasis 3.Therapeutic ramifications Sir James Paget (1814-1899) British Surgeon/ Pathologist Paget s disease of bone Paget s disease of the
Biol403 MAP kinase signalling
 Biol403 MAP kinase signalling The mitogen activated protein kinase (MAPK) pathway is a signalling cascade activated by a diverse range of effectors. The cascade regulates many cellular activities including
TITLE: Crosstalk Between Cancer Cells and Bones Via the Hedgehog Pathway Determines Bone Metastasis of Breast Cancer
 AD Award Number: W81XWH-07-1-0400 TITLE: Crosstalk Between Cancer Cells and Bones Via the Hedgehog Pathway Determines Bone Metastasis of Breast Cancer PRINCIPAL INVESTIGATOR: Dr. Lalita Shevde-Samantrese
Chapter 6: Skeletal System: Bones and Bone Tissue
 Chapter 6: Skeletal System: Bones and Bone Tissue I. Functions A. List and describe the five major functions of the skeletal system: 1. 2. 3.. 4. 5.. II. Cartilage A. What do chondroblasts do? B. When
Neoplasia 18 lecture 8. Dr Heyam Awad MD, FRCPath
 Neoplasia 18 lecture 8 Dr Heyam Awad MD, FRCPath ILOS 1. understand the angiogenic switch in tumors and factors that stimulate and inhibit angiogenesis. 2. list the steps important for tumor metastasis
SIBLINGs, cancer's multifunctional weapons
 SIBLINGs, cancer's multifunctional weapons 6/18/08 Akeila Bellahcène and Vincent Castronovo of the Metastasis Research laboratory of the University of Liège are among the first researchers to have discovered
Cell Cell Communication
 IBS 8102 Cell, Molecular, and Developmental Biology Cell Cell Communication January 29, 2008 Communicate What? Why do cells communicate? To govern or modify each other for the benefit of the organism differentiate
Effects of Second Messengers
 Effects of Second Messengers Inositol trisphosphate Diacylglycerol Opens Calcium Channels Binding to IP 3 -gated Channel Cooperative binding Activates Protein Kinase C is required Phosphorylation of many
Subject Index. Bcl-2, apoptosis regulation Bone marrow, polymorphonuclear neutrophil release 24, 26
 Subject Index A1, apoptosis regulation 217, 218 Adaptive immunity, polymorphonuclear neutrophil role 31 33 Angiogenesis cancer 178 endometrium remodeling 172 HIV Tat induction mechanism 176 inflammatory
Propagation of the Signal
 OpenStax-CNX module: m44452 1 Propagation of the Signal OpenStax College This work is produced by OpenStax-CNX and licensed under the Creative Commons Attribution License 3.0 By the end of this section,
1. The metastatic cascade. 3. Pathologic features of metastasis. 4. Therapeutic ramifications. Which malignant cells will metastasize?
 1. The metastatic cascade 3. Pathologic features of metastasis 4. Therapeutic ramifications Sir James Paget (1814-1899) British Surgeon/ Pathologist Paget s disease of Paget s disease of the nipple (intraductal
KEY CONCEPT QUESTIONS IN SIGNAL TRANSDUCTION
 Signal Transduction - Part 2 Key Concepts - Receptor tyrosine kinases control cell metabolism and proliferation Growth factor signaling through Ras Mutated cell signaling genes in cancer cells are called
Role of Inflammatory and Progenitor Cells in Pulmonary Vascular Remodeling: Potential Role for Targeted Therapies. Traditional Hypothesis Stress
 3/1/212 Role of Inflammatory and Progenitor Cells in Pulmonary Vascular Remodeling: Potential Role for Targeted Therapies K.R. Stenmark University of Colorado Denver, CO 845 Prominent Fibroproliferative
Basis of Immunology and
 Basis of Immunology and Immunophysiopathology of Infectious Diseases Jointly organized by Institut Pasteur in Ho Chi Minh City and Institut Pasteur with kind support from ANRS & Université Pierre et Marie
Molecular Cell Biology - Problem Drill 19: Cell Signaling Pathways and Gene Expression
 Molecular Cell Biology - Problem Drill 19: Cell Signaling Pathways and Gene Expression Question No. 1 of 10 1. Which statement about cell signaling is correct? Question #1 (A) Cell signaling involves receiving
BIOH111. o Cell Module o Tissue Module o Integumentary system o Skeletal system o Muscle system o Nervous system o Endocrine system
 BIOH111 o Cell Module o Tissue Module o Integumentary system o Skeletal system o Muscle system o Nervous system o Endocrine system Endeavour College of Natural Health endeavour.edu.au 1 TEXTBOOK AND REQUIRED/RECOMMENDED
The Angiopoietin Axis in Cancer
 Ang2 Ang1 The Angiopoietin Axis in Cancer Tie2 An Overview: The Angiopoietin Axis Plays an Essential Role in the Regulation of Tumor Angiogenesis Growth of a tumor beyond a limiting size is dependent upon
The recruitment of leukocytes and plasma proteins from the blood to sites of infection and tissue injury is called inflammation
 The migration of a particular type of leukocyte into a restricted type of tissue, or a tissue with an ongoing infection or injury, is often called leukocyte homing, and the general process of leukocyte
LQB383 Testbank. Week 8 Cell Communication and Signaling Mechanisms
 LQB383 Testbank Week 8 Cell Communication and Signaling Mechanisms Terms to learn match the terms to the definitions --------------------------------------------------------------------------------------------------------------------------
Cell Cell Communication
 IBS 8102 Cell, Molecular, and Developmental Biology Cell Cell Communication January 29, 2008 Communicate What? Why do cells communicate? To govern or modify each other for the benefit of the organism differentiate
The Skeletal System:Bone Tissue
 The Skeletal System:Bone Tissue Dynamic and ever-changing throughout life Skeleton composed of many different tissues cartilage, bone tissue, epithelium, nerve, blood forming tissue, adipose, and dense
Biology. Dr. Khalida Ibrahim
 Biology Dr. Khalida Ibrahim BONE TISSUE Bone tissue is a specialized form of connective tissue and is the main element of the skeletal tissues. It is composed of cells and an extracellular matrix in which
Cancer and Oncogenes Bioscience in the 21 st Century. Linda Lowe-Krentz
 Cancer and Oncogenes Bioscience in the 21 st Century Linda Lowe-Krentz December 1, 2010 Just a Few Numbers Becoming Cancer Genetic Defects Drugs Our friends and family 25 More mutations as 20 you get older
Functions of the Skeletal System. Chapter 6: Osseous Tissue and Bone Structure. Classification of Bones. Bone Shapes
 Chapter 6: Osseous Tissue and Bone Structure Functions of the Skeletal System 1. Support 2. Storage of minerals (calcium) 3. Storage of lipids (yellow marrow) 4. Blood cell production (red marrow) 5. Protection
Regulation of the skeletal mass through the life span
 Regulation of the skeletal mass through the life span Functions of the skeletal system Mechanical protection skull Movement leverage for muscles Mineral metabolism calcium store Erythropoiesis red blood
CHAPTER 6 LECTURE OUTLINE
 CHAPTER 6 LECTURE OUTLINE I. INTRODUCTION A. Bone is made up of several different tissues working together: bone, cartilage, dense connective tissue, epithelium, various blood forming tissues, adipose
Signaling. Dr. Sujata Persad Katz Group Centre for Pharmacy & Health research
 Signaling Dr. Sujata Persad 3-020 Katz Group Centre for Pharmacy & Health research E-mail:sujata.persad@ualberta.ca 1 Growth Factor Receptors and Other Signaling Pathways What we will cover today: How
PBS Class #2 Introduction to the Immune System part II Suggested reading: Abbas, pgs , 27-30
 PBS 803 - Class #2 Introduction to the Immune System part II Suggested reading: Abbas, pgs. 15-25, 27-30 Learning Objectives Compare and contrast the maturation of B and T lymphocytes Compare and contrast
Supplementary Materials for
 www.sciencesignaling.org/cgi/content/full/8/364/ra18/dc1 Supplementary Materials for The tyrosine phosphatase (Pez) inhibits metastasis by altering protein trafficking Leila Belle, Naveid Ali, Ana Lonic,
Supplementary Figure 1.
 Supplementary Figure 1. Increased expression of cell cycle pathway genes in insulin + Glut2 low cells of STZ-induced diabetic islets. A) random blood glucose measuers of STZ and vehicle treated MIP-GFP
OSSEOUS TISSUE & BONE STRUCTURE PART I: OVERVIEW & COMPONENTS
 OSSEOUS TISSUE & BONE STRUCTURE PART I: OVERVIEW & COMPONENTS The Skeletal System Skeletal system includes: bones of the skeleton, cartilages, ligaments, and connective tissues What are the functions of
MCB*4010 Midterm Exam / Winter 2008
 MCB*4010 Midterm Exam / Winter 2008 Name: ID: Instructions: Answer all 4 questions. The number of marks for each question indicates how many points you need to provide. Write your answers in point form,
Cytokines, adhesion molecules and apoptosis markers. A comprehensive product line for human and veterinary ELISAs
 Cytokines, adhesion molecules and apoptosis markers A comprehensive product line for human and veterinary ELISAs IBL International s cytokine product line... is extremely comprehensive. The assays are
Stem cells and Cancer. John Glod. December 2, 2009
 Stem cells and Cancer John Glod Lehigh University Lehigh University December 2, 2009 The Tumor Microenvironment Littlepage et al Cancer Cell 2005 Cancer Stem Cells A small group of cells within the larger
Control of Cell Proliferation by Peptide Growth Factors. Autocrine Growth Factor Production Causes Malignant Transformation?
 Control of Cell Proliferation by Peptide Growth Factors Autocrine Growth Factor Production Causes Malignant Transformation? Transforming Activities From Condition Media from a Tumor Cell Line Condition
What are the parts of the skeletal system? Chapter 6- Part I Bones and Skeletal Tissues. Growth of Cartilage. Bones come in many shapes
 Chapter 6- Part I Bones and Skeletal Tissues Components of the skeletal system Classification of Bone (bone shapes) Functions of bone Bone structure Microscopic structure of bone and bone cells What are
Bone and Cancer. Peter Croucher
 Bone and Cancer Peter Croucher Academic Unit of Bone Biology, Section of Musculoskeletal Science, University of Sheffield Medical School, Sheffield, UK Learning Objectives To Develop Understanding of:
Interleukin-6; pathogenesis and treatment of autoimmune inflammatory diseases
 54 Review Article Interleukin-6; pathogenesis and treatment of autoimmune inflammatory diseases Toshio Tanaka 1, 2), Masashi Narazaki 3), Kazuya Masuda 4) and Tadamitsu Kishimoto 4, ) 1) Department of
Tissue renewal and Repair. Nisamanee Charoenchon, PhD Department of Pathobiology, Faculty of Science
 Tissue renewal and Repair Nisamanee Charoenchon, PhD Email: nisamanee.cha@mahidol.ac.th Department of Pathobiology, Faculty of Science Topic Objectives 1. Describe processes of tissue repair, regeneration
Problem Set 8 Key 1 of 8
 7.06 2003 Problem Set 8 Key 1 of 8 7.06 2003 Problem Set 8 Key 1. As a bright MD/PhD, you are interested in questions about the control of cell number in the body. Recently, you've seen three patients
IL-24 AND ITS ROLE IN WOUND HEALING
 IL-24 AND ITS ROLE IN WOUND HEALING Nancy J. Poindexter, Ryan Williams, Garth Powis, Sunil Chada, and Elizabeth A. Grimm & Introgen Therapeutics, Inc., Houston, TX IL-24/MDA 24/MDA-77 is a Tumor Suppressor
Fig Articular cartilage. Epiphysis. Red bone marrow Epiphyseal line. Marrow cavity. Yellow bone marrow. Periosteum. Nutrient foramen Diaphysis
 Fig. 7.1 Articular cartilage Epiphysis Red bone marrow Epiphyseal line Marrow cavity Yellow bone marrow Nutrient foramen Diaphysis Site of endosteum Compact bone Spongy bone Epiphyseal line Epiphysis Articular
Uncovering the mechanisms of wound healing and fibrosis
 Any Questions??? Ask now or contact support support@sabiosciences.com 1-888-503-3187 International customers: SABio@Qiagen.com Uncovering the mechanisms of wound healing and fibrosis Webinar related questions:
INTERACTION DRUG BODY
 INTERACTION DRUG BODY What the drug does to the body What the body does to the drug Receptors - intracellular receptors - membrane receptors - Channel receptors - G protein-coupled receptors - Tyrosine-kinase
Introduction: 年 Fas signal-mediated apoptosis. PI3K/Akt
 Fas-ligand (CD95-L; Fas-L) Fas (CD95) Fas (apoptosis) 年 了 不 度 Fas Fas-L 力 不 Fas/Fas-L T IL-10Fas/Fas-L 不 年 Fas signal-mediated apoptosis 度降 不 不 力 U-118, HeLa, A549, Huh-7 MCF-7, HepG2. PI3K/Akt FasPI3K/Akt
In vitro scratch assay: method for analysis of cell migration in vitro labeled fluorodeoxyglucose (FDG)
") In vitro scratch assay: method for analysis of cell migration in vitro labeled fluorodeoxyglucose (FDG) 1 Dr Saeb Aliwaini 13/11/2015 Migration in vivo Primary tumors are responsible for only about 10%
In vitro scratch assay: method for analysis of cell migration in vitro labeled fluorodeoxyglucose (FDG) 1 Dr Saeb Aliwaini 13/11/2015 Migration in vivo Primary tumors are responsible for only about 10%
BIOL212 Biochemistry of Disease. Metabolic Disorders - Obesity
 BIOL212 Biochemistry of Disease Metabolic Disorders - Obesity Obesity Approx. 23% of adults are obese in the U.K. The number of obese children has tripled in 20 years. 10% of six year olds are obese, rising
Question 1. Kupffer cells, microglial cells and osteoclasts are all examples of what type of immune system cell?
 Abbas Chapter 2: Sarah Spriet February 8, 2015 Question 1. Kupffer cells, microglial cells and osteoclasts are all examples of what type of immune system cell? a. Dendritic cells b. Macrophages c. Monocytes
Peggers Super Summaries Basic Sciences Bone
 Bone Overview & Turnover BONES Function o Support o Protection o Assisting movement o Storage of minerals o Production of red blood cells from marrow Types o Cancellous o Compact with Haversian systems
2013 W. H. Freeman and Company. 12 Signal Transduction
 2013 W. H. Freeman and Company 12 Signal Transduction CHAPTER 12 Signal Transduction Key topics: General features of signal transduction Structure and function of G protein coupled receptors Structure
IRA-International Journal of Applied Sciences ISSN Vol. 03 Issue 02 (May, 2016) Paper DOI:
 Paper DOI:") IRA-International Journal of Applied Sciences ISSN 2455-4499 Vol. 03 Issue 02 (May, 2016) Paper DOI: https://dx.doi.org/10.21013/jas.v3.n2.p8 Pathophysiology of Giant Cell Formation in Giant Cell Tumor
IRA-International Journal of Applied Sciences ISSN 2455-4499 Vol. 03 Issue 02 (May, 2016) Paper DOI: https://dx.doi.org/10.21013/jas.v3.n2.p8 Pathophysiology of Giant Cell Formation in Giant Cell Tumor
Cytokine Arrays Reveal Black Ops Tactics of Tumor-induced Immunosuppression
 Cytokine Arrays Reveal Black Ops Tactics of Tumor-induced Immunosuppression Jarad J Wilson, Ph.D. Technical Support & Marketing Specialist Ruo-Pan Huang, MD, Ph.D. Founder and CEO What are Antibody Arrays?
Skeletal System. The skeletal System... Components
 Skeletal System The skeletal System... What are the general components of the skeletal system? What does the skeletal system do for you & how does it achieve these functions? Components The skeletal system
stem cell products Basement Membrane Matrix Products Rat Mesenchymal Stem Cell Growth and Differentiation Products
 stem cell products Basement Membrane Matrix Products Rat Mesenchymal Stem Cell Growth and Differentiation Products Stem Cell Qualified Extracellular Matrix Proteins Stem cell research requires the finest
HOMEWORK RUBRICS MECHANOTRANSDUCTION UNIT: HOMEWORK #1 (20 pts towards your grade)
") HOMEWORK RUBRICS MECHANOTRANSDUCTION UNIT: HOMEWORK #1 (20 pts towards your grade) 1. Mesenchymal stem cells (MSC) cultured on extracellular matrices with different stiffness exhibit diverse lineage commitment
HOMEWORK RUBRICS MECHANOTRANSDUCTION UNIT: HOMEWORK #1 (20 pts towards your grade) 1. Mesenchymal stem cells (MSC) cultured on extracellular matrices with different stiffness exhibit diverse lineage commitment
Receptor mediated Signal Transduction
 Receptor mediated Signal Transduction G-protein-linked receptors adenylyl cyclase camp PKA Organization of receptor protein-tyrosine kinases From G.M. Cooper, The Cell. A molecular approach, 2004, third
Intracellular signalling pathways activated by leptin by Gema FRUHBECK. Presentation by Amnesiacs Anonymous
 Intracellular signalling pathways activated by leptin by Gema FRUHBECK Presentation by Amnesiacs Anonymous Introduction to Leptin By Ahrial Young Why is Leptin important? Pleiotropic = it controls the
Signaling Vascular Morphogenesis and Maintenance
 Signaling Vascular Morphogenesis and Maintenance Douglas Hanahan Science 277: 48-50, in Perspectives (1997) Blood vessels are constructed by two processes: vasculogenesis, whereby a primitive vascular
Who manipulates who in dysregulated mineralised tissue resorption? Dr Gurå Therese Bergkvist MRCVS
 Who manipulates who in dysregulated mineralised tissue resorption? Dr Gurå Therese Bergkvist MRCVS Senior Lecturer in Veterinary Anatomy & Clinical Research Associate of The Roslin Institute Clinical diseases
Cellular Signaling Pathways. Signaling Overview
 Cellular Signaling Pathways Signaling Overview Signaling steps Synthesis and release of signaling molecules (ligands) by the signaling cell. Transport of the signal to the target cell Detection of the
Animal Tissue Culture SQG 3242 Biology of Cultured Cells. Dr. Siti Pauliena Mohd Bohari
 Animal Tissue Culture SQG 3242 Biology of Cultured Cells Dr. Siti Pauliena Mohd Bohari The Culture Environment Changes of Cell s microenvironment needed that favor the spreading, migration, and proliferation
1. Activated receptor tyrosine kinases (RTKs) phosphorylates themselves
 phosphorylates themselves") Enzyme-coupled receptors Transmembrane proteins Ligand-binding domain on the outer surface Cytoplasmic domain acts as an enzyme itself or forms a complex with enzyme 1. Activated receptor tyrosine kinases
Enzyme-coupled receptors Transmembrane proteins Ligand-binding domain on the outer surface Cytoplasmic domain acts as an enzyme itself or forms a complex with enzyme 1. Activated receptor tyrosine kinases
Supplementary Figure 1. The mir-182 binding site of SMAD7 3 UTR and the. mutated sequence.
 Supplementary Figure 1. The mir-182 binding site of SMAD7 3 UTR and the mutated sequence. 1 Supplementary Figure 2. Expression of mir-182 and SMAD7 in various cell lines. (A) Basal levels of mir-182 expression
FGL2 A new biomarker for cancer in a simple blood test
 FGL2 A new biomarker for cancer in a simple blood test WHO IS FGL2 Human gene (chromosome 7) is 7 kb long, 2 exons, monomer protein 70 KD, tetramer in solution. Fibrinogen-like protein 2 (Fgl2), a member
TITLE: Breast Tumor-Generated Type 1 Collagen Breakdown Fragments Act as Matrikines to Drive Osteolysis
 AD Award Number: W81XWH-08-1-0639 TITLE: Breast Tumor-Generated Type 1 Collagen Breakdown Fragments Act as Matrikines to Drive Osteolysis PRINCIPAL INVESTIGATOR: Ching Hua William Wu PhD. CONTRACTING ORGANIZATION:
Protein kinases are enzymes that add a phosphate group to proteins according to the. ATP + protein OH > Protein OPO 3 + ADP
 Protein kinase Protein kinases are enzymes that add a phosphate group to proteins according to the following equation: 2 ATP + protein OH > Protein OPO 3 + ADP ATP represents adenosine trisphosphate, ADP
Supplementary Figure 1. Normal T lymphocyte populations in Dapk -/- mice. (a) Normal thymic development in Dapk -/- mice. Thymocytes from WT and Dapk
 Normal thymic development in Dapk -/- mice. Thymocytes from WT and Dapk") Supplementary Figure 1. Normal T lymphocyte populations in Dapk -/- mice. (a) Normal thymic development in Dapk -/- mice. Thymocytes from WT and Dapk -/- mice were stained for expression of CD4 and CD8.
Supplementary Figure 1. Normal T lymphocyte populations in Dapk -/- mice. (a) Normal thymic development in Dapk -/- mice. Thymocytes from WT and Dapk -/- mice were stained for expression of CD4 and CD8.
SKELETAL SYSTEM I NOTE: LAB ASSIGNMENTS for this topic will run over 3 Weeks. A SEPARATE WORKSHEET WILL BE PROVIDED.
 BIO 211; Anatomy and Physiology I REFERENCE: CHAPTER 07 1 Dr. Lawrence Altman Naugatuck Valley Community College LECTURE TOPICS OUTLINE SKELETAL SYSTEM I NOTE: LAB ASSIGNMENTS for this topic will run over
The T cell receptor for MHC-associated peptide antigens
 1 The T cell receptor for MHC-associated peptide antigens T lymphocytes have a dual specificity: they recognize polymporphic residues of self MHC molecules, and they also recognize residues of peptide
Lecture 7: Signaling Through Lymphocyte Receptors
 Lecture 7: Signaling Through Lymphocyte Receptors Questions to Consider After recognition of its cognate MHC:peptide, how does the T cell receptor activate immune response genes? What are the structural