ASSESSMENT OF PHANTOM DOSIMETRY AND IMAGE QUALITY OF ACCUITOMO 170 AND MINICAT CONE-BEAM COMPUTED TOMOGRAPHY. Robert Todd Erickson
|
|
|
- Erica Sparks
- 6 years ago
- Views:
Transcription
1 ASSESSMENT OF PHANTOM DOSIMETRY AND IMAGE QUALITY OF ACCUITOMO 170 AND MINICAT CONE-BEAM COMPUTED TOMOGRAPHY Robert Todd Erickson A thesis submitted to the faculty at the University of North Carolina at Chapel Hill in partial fulfillment of the requirements for the degree of Master of Science in the School of Dentistry. Chapel Hill 2014 Approved by: John B. Ludlow Andre Mol Marija Ivanovic
2 2014 Robert Todd Erickson ALL RIGHTS RESERVED ii
3 ABSTRACT Robert Todd Erickson: Assessment of Phantom Dosimetry and Image Quality of Accuitomo 170 and MiniCAT Cone-Beam Computed Tomography (Under the direction of John B. Ludlow) Introduction: Escalating use of cone-beam computed tomography contributes to a burgeoning public health issue regarding the amount of ionizing radiation associated with diagnostic imaging delivered to the population, especially children. Methods: Effective doses were calculated and compared from optically stimulated dosimeter measurements and a previously validated protocol using anthropomorphic adult and child phantoms scanned with the Accuitomo 170 (J. Morita, Japan) and MiniCAT (Xoran Technologies, Ann Arbor, MI) CBCT machines. Results: Average child phantom doses (440 and 117 µsv) were 60% and 56% greater than the adult doses from the Accuitomo 170 and MiniCAT units respectively. Thyroid dose, particularly to the child, had a significant contribution to the overall dose. Conclusion: Effective dose for the two units increased as FOV increased. The child dose, especially the thyroid, increased when compared to the adult phantom. Child protocols and the smallest FOV helps reduce the child s effective dose. iii
4 To my magnificent, beautiful, and loving wife, Anne, who has endured so much being supportive of me and our incredible son Luke, who is a young man with qualities of intellect, discipline, ethics, and caring that are so impressive and far beyond his years. I am truly a very fortunate and blessed husband and father. iv
5 TABLE OF CONTENTS LIST OF TABLES... vii LIST OF FIGURES... viii CHAPTER 1. LITERATURE REVIEW... 1 Cone-beam Computed Tomography Imaging... 1 Newer Imaging Modalities... 3 Factors Effecting Image Quality and Patient Dose... 5 Scan Volume... 6 Detectors... 7 Grayscale... 9 Reconstruction... 9 Three-Dimensional Volume Rendering Accuracy Imaging Protocol Image Optimization Spatial Resolution Image Artifacts of CBCT Introduced Artifacts Strengths and Limitations of CBCT Relatively Low Patient Radiation Dose Interactive Analysis Limitations v
6 Reconstruction Algorithms Poor Soft Tissue Contrast CBCT in Dentistry Irradiation of Children References CHAPTER 2. ASSESSMENT OF PHANTOM DOSIMETRY AND IMAGE QUALITY OF ACCUITOMO 170 AND MINICAT CONE-BEAM COMPUTED TOMOGRAPHY Introduction Exposure to Radiation Measuring Dose Image Quality Materials and Methods Effective Dose Statistics Results Discussion Conclusion References APPENDIX. FIGURES AND TABLES...70 vi
7 LIST OF TABLES Table 1. ICRP Tissue-Weighting Factors (W T ) (ICRP 1977; ICRP 1990; ICRP 2007) Table 2. Estimated Percentage of Tissue irradiated and OSLs Used to Calculate Mean Absorbed Dose to a Tissue or Organ of an Adult or 10-Year-Old Child ATOM Phantom Table 3. MiniCAT: Effective Dose Adult and Child ATOM Phantom Table 4. MiniCAT: Effective Dose with Percentage Increase from Adult to Child Table 5. MiniCAT: Thyroid Effective Dose Adult and Child ATOM Phantom 95 Table 6. MiniCAT Thyroid Effective Dose Table 7. Accuitomo 170 Adult and Child Effective Dose Table 8. Accuitomo 170 Adult and Child Thyroid Effective Dose Table 9.Accuitomo 170 Percent Thyroid Contribution to Effective Dose Table 10. Equivalent Dose Measurements on the Adult Phantom for MiniCAT Table 11. Equivalent Dose Measurements on the Child Phantom for MiniCAT Table 12. Equivalent dose Measurements on an Adult Phantom for the Accuitomo Table 13. Equivalent Dose Measurements on a Child Phantom for the Accuitomo Table 14. Quart Data for the Accuitomo Table 15. Accuitomo 170: Parameters of Time (s) and Frames Per Scan vii
8 LIST OF FIGURES Figure 1. CT procedures per year in the United States Figure 2. Source of per dapita contribution of of radiation exposure in the United States Figure 3. A. Optically Stimulated Luminescent (OSL) dosimeters B. Microstar Reader Figure 4. MiniCAT CBCT and viewing station (Xoran Technologies, Ann Arbor, MI) Figure 5. MiniCAT fields of view (Courtesy of Xoran Technology Sales and Marketing Brochure) Figure 6. Protocols per manufacturer Figure 7. Accuitomo 170, J. Morita Corporation Figure 8. Accuitomo 170: Nine fields of view Figure 9. Accuitomo 170 acquisition parameters Figure 10. Adult ATOM Phantom slices with machined slots for OSL dosimeters Figure 11. Locations of Optically Stimulated Luminescent (OSL) dosimeters in Adult ATOM Max model 711 Phantom Figure 12A. Child ATOM Phantom with OSL dosimeter locations Figure 12B. Child ATOM Slices with machined OSL dosimeter locations Figure 13. Field of view examples acquired from Xoran MiniCAT volumes Figure 14. Examples of representative FOVs from the Accuitomo 170; adult and child Figure 15. QUART DVT_AP CBCT image quality system Figure 16. Graphic representation of effective dose using the MiniCAT and ATOM Phantom Figure 17. Effective doses for thyroid gland in adult and child ATOM Phantom Figure 18. MiniCAT % increase in thyroid effective dose between adult and child Phantom viii
9 Figure 19. Accuitomo 170 effective dose for adult and child ATOM Phantom Figure 20. Accuitomo 170 effective dose for thyroid using the adult and child ATOM Phantom Figure 21. Accuitomo 170: Percent thyroid contribution to effective dose for adult and child ATOM Phantom Figure 22. Comparison of thyroid level in child and adult ix
10 CHAPTER 1. LITERATURE REVIEW Cone-beam Computed Tomography Imaging The field of radiology had its genesis in late 1895, when Wilhelm Roentgen fortuitously discovered x-rays while working in his physics lab in Germany. Roentgen quickly recognized the value of his discovery to medicine and within a very short time produced and published the first medical x-ray image in early The discovery of x-rays was followed by significant scientific vigor and further research and additional properties were learned. Some facts revealed that x-rays had an insidious characteristic that could cause extensive tissue damage and even death. The famous American inventor Thomas Edison was investigating various properties of x-rays with an assistant and long-time friend, who subsequently suffered severe radiation burns that lead to tremendous suffering and his death a few years later. This occurred because x-rays are located in the high-energy spectrum of electromagnetic radiation. X-rays can penetrate as well as interact with tissues in their path. Absorption and scattering of this high-energy radiation is what reaches an x-ray receptor and ultimately results in an image. A Boston dentist made a significant discovery regarding the spectrum of energy in an x-ray beam when he used x-rays to image teeth. He learned that by restricting the x-ray beam with a sheet of lead with a hole in the center and inserting a leather or aluminum filter into the hole he improved the diagnostic quality of the radiographs. This property of x-rays heralded the quest to understand and manipulate the complex relationship between dose and image quality. 1 1
11 Over the past nearly 120 years, the field of radiology has made huge strides with technological advancements that have subsequently resulted in remarkable contributions to the diagnosis and treatment of disease in all fields of health care. Different types of medical images can be made by varying the types of energies and the acquisition technology employed. In its simplest form radiography is accomplished with an x-ray source on one side of the patient and a typically flat x-ray detector on the other side. A short-duration pulse of x- rays is emitted by the x-ray tube, and a large percentage of x-rays in the beam interact with the patient and are preferentially attenuated due to the varying tissue densities. Some x-rays reach a detector and, depending on the technology being used, will produce an image of varying likeness and resolution to the region being scanned. 2 One of the most significant landmark developments in image acquisition was the invention of a revolutionary imaging technique in 1972 by Godfrey Hounsfield, a British engineer/physicist, that used image reconstruction mathematics developed by Alan Cormack in the 1950s and 1960s to produce cross-sectional images of the head. 3 This modality has become known as computed tomography (CT). Although initially slow with rudimentary image quality, CT has undergone several generations of technological advancements over the past four decades. The improvements have reduced scan time, increased x-ray tube power, and advanced reconstruction algorithms, which have led to significant enhancements in CT image quality and ease of use. 2. Due to the escalations in image quality and reduction in acquisition time, CT has experienced gigantic growth since its inception. The advent of helical CT scanners in 1989 and then multi-slice CT in 1998 has led to a pronounced boom in usage. Reducing scan time increases the number of clinical applications for CT imaging and also means that one scanner can image more patients per day. Most reports indicate the 2
12 number of CT scans performed annually in the United States is between 70 million and 80 million. Between 1997 and 2007, there has been an exponential growth rate for CT scanning that shows no sign of abatement in the near future. 2 Newer Imaging Modalities CT scanners function with the x-ray source emitting a fan-shaped beam of radiation that encircles the patient 360 as the patient is moved through a gantry. For a specified region of interest (ROI), modified axial or helical slices of a predetermined width using collimation are captured by an array of detectors. The raw data captured in each projection by the detector is stored in a computer. With CT imaging systems, the x-rays form a stored electronic image that is displayed as a matrix of intensities. Image reconstruction occurs via a complex process called filtered back projection and Feldkamp reconstruction. The CT imaging system will often use an array processor and completes several hundred thousand calculations simultaneously. Three-dimensional multiplanar reconstruction (MPR) images can be viewed in axial, coronal, or sagittal planes or in a custom plane depending on the diagnostic task desired. 1 The type of CT imaging used for this project is a relatively recent technology most commonly referred to as cone-beam computed tomography (CBCT). The equipment has many comparisons to conventional CT, but it is the differences that have made this modality gain tremendous popularity, particularly for maxillofacial imaging. CBCT was initially developed for angiography in More contemporary medical applications have included radiotherapy guidance, 4 mammography, 5 and cardiology. 6 CBCT is the imaging modality used in this research study. Therefore, an overview of the technology being tested and scrutinized will be provided. The information will aid in 3
13 obtaining an understanding of the influence of technical parameters on image quality and patient radiation exposure. It is vital to understand that there are similarities between CBCT and Multi-Slice Computed Tomography (MSCT), which is used ubiquitously in hospitals and medical centers throughout the developed world. However, the unique characteristics of the CBCT have both lead to its escalating use in maxillofacial imaging, as well as inherently limited the depth and spectrum of its usage. Imaging data for CBCT is acquired by using an x-ray source and a detector mounted on a rotating gantry that moves synchronously around the region of interest. The radiation emitted from the x-ray tube passes through circular collimation, which produces a threedimensional divergent pyramidal beam or cone beam. This beam revolves 180 to 360 around the patient, passing through the middle of the area of interest onto a two-dimensional digital array, which serves as an area detector. The exposure incorporates the entire region of interest; therefore, the full volume of tissue is captured with one rotation of the gantry. During this rotation, between 150 and 600 (depending on the unit) sequential planar projection images of the selected field-of-view (FOV) are acquired. The individual images are similar to 2D lateral and posterior- anterior (PA) cephalometric images that have been sequentially offset from each other during the rotation of the gantry. This process differs from Multi-Detector CT (MDCT), which uses a fan-shaped beam in a spiral progression through a region of interest acquiring individual image slices that are then stacked to provide a 3D representation. The single projection or set of basis images produced as the result of photons being attenuated by the tissue in the ROI reach the receptor and constitute the raw data. During the rotational arc of , the several hundred exposures formulate a volume that has 4
14 enough data to be calculated and reconstructed to form a visual image. Complex software programs with sophisticated algorithms incorporating filtered back projection have been created to provide primary reconstruction images in three orthogonal planes (axial, sagittal, and coronal). Custom sections can also be constructed using numerous software programs available for viewing the images. Factors Effecting Image Quality and Patient Dose There are many factors that complement or compromise the final quality of a radiographic image and the dose of ionizing radiation received by the patient. The end product is a result of the interplay between a long list of variables that comprise the imaging protocol. In any form of imaging examination, keeping the patient immobile is essential to provide data with little or no motion artifacts. CBCT machines are different than MDCT machines. They are of smaller dimension than MDCT units, which place the patient secured in a supine position on a specialized exam table that moves through the gantry, and the design allows the patient to stand or be comfortably seated. A variety of head restraints, chin rests, and bite indices become critical to stabilize the patient, particularly children and the disabled, injured, or elderly to minimize movement. The manner in which the x-rays are delivered to the patient can have a significant impact on the exposure a patient receives. Delivering the least amount of radiation dose to the patient is a fundamental tenet of responsible imaging practices. The ALARA (As Low As Reasonably Achievable) principle has been promoted for many years in the field of radiology. It essentially dictates that acquisition of the image be performed with appropriate selection of exposure factors and an imaging protocol that minimizes the dose to the patient while maintaining adequate image quality. The importance of abiding by the ALARA 5
15 principle has trickled into the mindset of the manufacturers. CBCT machines are being built with x-ray generation that is pulsed to coincide with detector activation and sampling rather than generating a continuous beam. This alone will permit up to 50% reduction in exposure time to the patient, which reduces the radiation dose. More CBCT machines are being manufactured with this capability, in part, because of the industry response to the initiative to rein in exposure and harmful effects to patients. Other factors that affect patient dose are tube current (ma), tube voltage (kvp), and time (s). These settings are often fixed on CBCT units, but newer technology is also incorporating scout views and exposure control feedback mechanisms to help limit exposure. More will be said about this later in the paper. Scan Volume Field of view (FOV) and number of basis images need to be taken into account in the effort to reduce the dose to the patient, particularly children or adolescents, who are much more susceptible to the stochastic effects of radiation over a lifetime. 3 Scan volume or (FOV) plays pivotal role in determining the amount of radiation delivered. Initially, the CBCT machines had only one or a few choices available to capture the region of interest, many times incorporating much more volume of tissue than actually necessary. The more contemporary machines are being designed with more latitude for both selection of FOV (small, medium, large, or specific sizes such as 5 x 5 cm, 8 x 8 cm, 6 x 12 cm, 10 x 10 cm, etc.) and for tube amperage (ma) (i.e., High Definition, Standard, Fast Scan). These parameters allow refinement and individualization to fulfill the needs of the practitioner and ensure the safety of the patient. 6
16 There are additional components of CBCT that make it unique. Appropriate use of these functions will assist with compliance of the ALARA principle. These are the selection of the number of images acquired per second by the detector (frame rate), the arc rotation ( ), and the rotation speed of the synchronously moving x-ray source and detector. These factors will determine the number of basis images that will play a role in patient exposure. Some of the newer CBCT units are configured so a pre-set number of basis images are obtained based on the type of image requested. There are positive and negative ramifications to adjustment of these variables. Higher frame rates increase the signal-to-noise ratio, which produces images with less noise and fewer artifacts. Of course, this comes at a cost to the patient with more exposure to ionizing radiation. Also, the time necessary for reconstruction is longer. Decreasing the scan times by increasing the frame rate is more desirable because it reduces the likelihood of patient movement and the subsequent decrease of image quality. Detectors There are two basic groups of image detectors used by CBCT machines the older image intensifier tube/charge-coupled device (II/CCD) and or the newer, more widespread but expensive flat panel detector (FPD). FPD s are either direct or indirect detectors. The direct route uses a photoconductor material, selenium, which is a more efficient absorber of x-rays. The electrons released are sent directly to a thin-film transistor and an electrical signal is generated. An indirect detector uses the scintillating material cesium iodide, which converts x-ray energy into light. The light energy is converted into electrical energy proportional to the x-ray exposure and sent to the thin-film transistor in the detector. FPD s 7
17 are very expensive as they get larger. To keep the cost of the CBCT more manageable, the FPD will be limited in size. With CT imaging systems, the x-rays form a stored electronic image that is displayed as a matrix of intensities. The matrices can be different sizes. Most are 512 x 512, which represents 262,144 cells of information. Some are 1024 x 1024, which is an incredible 1,048,576 individual cells. Therefore, the detector can have the same physical dimensions but contain four times the number specific data points that will comprise the image. Generally, the image produced from more pixels leads to better resolution. Each cell of information is a 2D pixel (picture element). When multiplied by the thickness dimension it becomes a 3D voxel (volume element). A unique characteristic of CBCT is that the voxels are isotropic (each 2D square is the same dimension), unlike the MDCT, which has anisotropic (unequal sides) voxels. The voxel size is determined by multiplying the pixel size by the thickness of the CT slice. The precise CT number of any given pixel is related to the x-ray attenuation coefficient of the tissue contained in the voxel. For CBCT, each pixel is assigned a brightness number that represents a specific location in the matrix. MDCT pixels also each contain exclusive information. This data is referred to as the CT number or Hounsfield unit (HU) (-1000 to +3000). The HU is a discrete value allowing image quality to be easier to characterize and quantitate. The particular value will be identical in all MDCT images. There has been an attempt to correlate CBCT brightness values with Hounsfield units; however, it is controversial has not been shown to be accurate. 7 In regards to the relationship between pixel size and exposure, detectors with smaller pixels capture fewer x-ray photons per voxel, which results in a noisier image. To overcome 8
18 this effect and gain higher resolution, greater doses of radiation are necessary. Again, this demonstrates the compromise between image quality and patient exposure. Grayscale Grayscale is the ability of the CBCT image to display subtle contrast differences in attenuation of the x-ray beam by the detector. This parameter is defined as the bit depth of the system, which determines the number of shades of gray that can be displayed. Contemporary CBCT machines use detectors capable of presenting 12 bits or more. For example, a 12-bit detector is capable of displaying 2 12, or 4096, shades of gray and a 16-bit can exhibit 65,536 shades of gray. Interestingly, initial observations proposed that the human eye could distinguish only 30 to 50 shades of gray. 8,9 It is now established that the human eye can discriminate between 700 and 900 simultaneous shades of gray for the available luminance range of current medical displays and in optimal conditions. 10 Reconstruction Once information from the basis projection frames has been received by the detector and sent to the computer, the next process is to create a volumetric data set. This procedure is referred to as primary reconstruction. As previously stated, a single rotation around the patient ( ) is all that occurs with CBCT and is relatively quick (12 20 sec). What happens next with this data is quite complex and could not occur until the 1990 s, when inexpensive, more powerful computers were available to process the massive amount of acquired image data. For example, approximately 100 to more than 600 individual basis images, each with more than 1 million pixels and 12 to 16 bits of data assigned, need to be processed. This presents a colossal task that has to be performed in a matter of seconds and can only be performed by a computer. 9
19 Reconstruction times vary depending on the acquisition parameters (voxel size, FOV, and number of projections), the speed of the hardware, and the sophistication of the software. A series of computationally complex software algorithms process the data and create a volumetric data set composed of individual cuboidal voxels by a process termed reconstruction. Subsequently, secondary reconstruction allows sectioning of the volumetric data into orthogonal images (axial, sagittal, and coronal) to finally be visualized on a screen and evaluated by the clinician. 3 Three-Dimensional Volume Rendering Because CBCT systems have been developed for the maxillofacial region, there has been an interest in 3D reconstruction. Many devices are capable of large FOV imaging of the skull. 11 Dose measurements in micro-sieverts (µsv) and time measured in seconds (s) or milliseconds (ms) have been suggested to be of the same order of magnitude as other dental radiographic modalities. 12 Volume rendering refers to techniques in computer graphics that are used to project a 3D discretely sampled data set to display a 2D projection. There are two approaches: Direct Volume Rendering (DVR) and Indirect Volume Rendering (IVR). IVR is the oldest and requires huge amounts of pre-processing on the dataset. A pre-selection of the intensity of the grayscale to be displayed throughout the entire dataset is required. This requires special software and powerful computers that perform complex calculations. Sensitivity to noise with introduction of errors can be a problem. Ultimately, IVR provides a volumetric surface rendering with depth, allowing the image to display objects of interest such as the soft tissue surface, bone, and teeth. This is often referred to as segmentation. DVR is the most popular and simple method of 3D reconstruction. Maximum intensity projection (MIP) is the most common procedure, which produces a pseudo- 3D 10
20 image. 13 MIP consists of projecting the voxel with the highest attenuation value along a straight line on every view traced from the expected position of the operator throughout the volume onto a 3D image. 14 Such an algorithm is rather simple; for each x, y coordinate only the pixel with the highest CT number along the z-axis is represented. In a bi-dimensional image all dense structures in a given volume are observed. For example, it is possible to find all the hyper-dense structures in a volume independent of their position. This method tends to display bone, a contrast-filled structure, preferentially. Lower attenuation structures are not well visualized. 15 Contrast has not been used in maxillofacial imaging for dental purposes other than to visualize gland parenchyma in sialography with CBCT. Additional applications may become available in the future. Surface rendering using special algorithms has initiated a new application related to data processing that is being used in dentistry, particularly in orthodontics and oral and maxillofacial surgery applications. In surface rendering, the voxels located on the edge of a structure are identified, usually by intensity thresholding, and sometimes enhanced with morphologic filtering, and these voxels are displayed. The remaining voxels in the image are usually invisible. The thresholding assignment of the voxels that will be visible is both critical and sometimes difficult to reproducibly define. If the thresholding process is too aggressive, actual protruding structures can be lost from view because of partial-volume effects. If the thresholding process is too lax, non-tissue materials (fluids) can be rendered as if they were tissue, causing inaccuracies in the image. 15 The presence of exo-mass effects occur when there is a mass outside the FOV. This effect lowers the measured CT number rapidly at the scan edge furthest from the exo-mass and raises it on the adjacent edge. Since 11
21 there are no CT numbers in CBCT, this process can affect the gray value display of bone in different areas of the volume. 45 Accuracy The institution of maxillofacial CBCT machines provides practitioners with the ability to easily generate 3D volumetric renderings using relatively inexpensive third-party computer-based software. This becomes a wonderful picture on the computer screen, but can the data actually provide useful information that will aid in treatment of patients? One of the primary questions to answer is: Are the 3D reconstruction images dimensionally accurate with the original subject, the patient? A great number of researchers set out to determine the answer and numerous papers were published. The overall consensus indicated that CBCT measurements could be used for quantitative analysis. The CBCT measurements compared with the anatomic truth were highly reliable. 16,17,18,19 Researchers wrote that many linear measurements between cephalometric landmarks on 3D volumetric surface renderings using Dolphin 3D software generated from CBCT datasets may be statistically significantly different from anatomic dimensions, most can be considered to be sufficiently clinically accurate for craniofacial analysis. 20 Although there were errors in the linear measurements, they were often not significant. For well-defined points, measurement accuracy was expressed by average errors less than 1.2% for twodimensional measurement techniques and less than 0.6% for three-dimensional measurement techniques. Average errors from 0.2 mm to 2.1 mm are in line with errors reported for both conventional and cone beam CT
22 Imaging Protocol An imaging protocol is a customary set of technical exposure parameters for CBCT imaging that depend on the particular purpose of the examination. It is developed to provide images of premium quality with the least amount of radiation exposure to the patient. Ordinarily, the CBCT manufacturer will have fixed, pre-set protocols that are automatic based on the imaging field, number of basis images, and voxel resolution. 3 Exposure settings of tube voltage (kvp) and tube current (ma) will affect the quality and quantity of the x-ray beam. The manufacturer most often will have these parameters fixed as well. In the event that there are operator-adjustable exposure settings, it is mandatory that the operator have command of the working knowledge of how the image quality and eventual patient dosage will be impacted by these settings. Because this is often not likely, it is best that the units have default settings that lead to better compliance with the ALARA principle. Image Optimization Most software programs for CBCT provide the user with resources to adjust contrast, brightness, and edge sharpening. To aid the system to present the best image to the clinician and assist with an accurate diagnosis, there are controls available to adjust brightness (level) and contrast (window) parameters to selectively favor bony tissue. This is analogous to the window and leveling functions in conventional CT to facilitate viewing a bone window or a soft tissue window. Unlike conventional CT, there is pronounced variability between different CBCT units depending on how the machine was manufactured and the proprietary software pre-set parameters employed. Medical imaging benefits more from increased contrast and sharpness. The key is enhancing the image without spoiling it. When images are 13
23 processed for visual interpretation, viewers are the ultimate judge of how well a specific method work. 22 Application of sharpening, filtering, and edge algorithms is encouraged. Edge enhancement is the accentuation of the interface between different tissues. This controls the extent to which the contrast in the edge detected is enhanced. Subtle detail is not improved but imperfections from noise, for example, are diminished. Some image data are lost as part of this process. Edge enhancement is only capable of improving the perceived sharpness of an image. 23 Spatial Resolution The image quality on a medical image is related to how well it reproduces and represents anatomical or functional information to the interpreting practitioner, allowing an accurate diagnosis. Radiological images acquired using ionizing radiation can usually be enhanced by increasing the radiation dose. The dose to the patient then becomes a potential health safety issue. Therefore, diagnostic radiographic images require a number of important compromises in which image quality is not completely maximized but is reasonably optimized to successfully execute the diagnostic assignment ordered. Spatial resolution designates the level of detail that can be seen by the human eye in an image. Basically, the limiting spatial resolution relates to how small of an object can be seen on an individual imaging system. Measurements of spatial resolution are generally performed at high doses of x-rays, so there is low noise and issues of quantum mottle are excluded as a reason for poor resolution. The preponderance of imaging systems in radiology are now digital. The size of the pixel is a limiting factor in an image and establishes a boundary on what can theoretically be resolved in a particular image. It is typically not possible to resolve an entity that is smaller than the individual pixel size. Furthermore, 14
24 although images with smaller pixels have the potential to convey increased spatial resolution, there are many additional dynamics that affect spatial resolution. In many cases, it is actually not the pixel size that limits spatial resolution. 2 Additional factors including the number of basis images, reconstruction algorithm, focal spot size, the fraction of the pixel s area capable of collecting light (fill factor), detector motion blur, internal patient scatter, and beam geometry affect the spatial resolution of an image. The focal spot size and the geometric configuration of the x-ray source determine the amount of blur or lack of sharpness in the image. A smaller focal spot leads to less image blur and better spatial resolution. X-ray tubes that produce smaller focal spots are considerably more expensive and will therefore be limited to allow the CBCT machine to remain cost effective. 3 Image Artifacts of CBCT An imaging system that perfectly presents the structures within the region of interest without distortion has not been developed yet. To one degree or another, there are artifacts in all of the images produced by our radiographic equipment. In general, an artifact is a distortion or error in an image that is unrelated to the subject being studied. 24 A CT image artifact is defined as any discrepancy between the reconstructed CT numbers in the image and the true attenuation coefficients of the object. 25 This definition is comprehensive and implies that anything that causes an incorrect measurement of transmission readings by the detectors will result in an image artifact. Because CT numbers represent gray shades in the image, incorrect measurements will produce incorrect CT numbers that do not represent the attenuation coefficients of the object. 26 Artifacts can degrade image quality, affect the perceptibility of detail, or even lead to misdiagnosis. This can cause serious problems for the patient, radiologist, and surgeon/provider in the event of an improper diagnosis. 15
25 CBCT images inherently have more artifacts than MDCT images for a number of reasons. CBCT machines use a lower energy spectrum, have the cone-beam shape geometry, produce aliasing artifacts caused by the cone-beam divergence and scatter, and commonly contain a higher noise level. Artifacts can be arranged into categories of inherent artifacts: procedure-related artifacts, introduced artifacts, and patient motion artifacts. Inherent artifacts are a result of limitations in the physical processes involved in the acquisition of CBCT data. There are also three types of cone-beam related artifacts under this category: scatter, partial volume averaging, and cone-beam effect. Scatter is a fundamental phenomenon associated with the interaction between x-ray photons and matter. Scatter radiation is comprised of photons that have been diffracted from their original straight-line trajectory by interactions with tissue/material. These photons can interact, which results in a change in direction multiple times prior to reaching the detector. Or they may exit the patient and never reach the detector. They provide useless information and degrade the image quality. Scatter is reduced in MDCT by post-patient collimation placed in front of the detector and special algorithms. This cannot be done in CBCT because of the unique pyramidal-shaped beam and the use of area detectors. Scatter increases with increased field size. Scatter-induced artifacts in CBCT are only slightly diminished using processing algorithms. The images, therefore, are characterized by a lower signal-to-noise ratio than MDCT and have poor soft tissue contrast. Partial-volume averaging is a feature of both MDCT and CBCT. This occurs when the voxel size of the detector contains two or more tissue types of the subject being imaged. Each tissue may have a slightly different linear attenuation coefficient. The calculation 16
26 performed by the computer will then be an average of the CT numbers of the tissue covered in the voxel. If the CT numbers are close together (i.e., +43 gray matter, +40 blood, and +46 white matter), then the CT number reported for that voxel will be an average that is reasonably close to the actual tissue. This is known as partial-volume averaging. 26 If the voxel contains tissues that are significantly different (i.e., + 35 muscle, -75 fat, +850 bone) then the mathematical calculation to determine the single CT number that will represent the voxel will be significantly different from the actual tissue. This leads to partial-volume artifacts, which are very inaccurate and appear as bands or streaks in the image. 27 Selection of the smallest voxel size will help reduce the presence of these effects. In MDCT, selection of thinner slices will also diminish these effects. Cone-beam effect occurs particularly in the peripheral portions of the scan volume. Because of the divergence of the x-ray beam as it rotates around the patient, structures at the bottom of the image field are exposed only when the x-ray source is on the opposite side of the patient. 3 The use of a large cone angle can lead to significant artifacts. Some MDCT units use a small cone-shaped beam as opposed to strictly a fan beam and will also obtain artifacts. The result is image distortion, streaking artifacts, and greater noise from what amounts to under-sampling. This effect is minimized by incorporation of various forms of cone-beam reconstruction by the manufactures. Procedure-related artifacts are another type of artifact that can follow as a result of the acquisition process. Under-sampling of the object being imaged can occur when too few basis images are obtained for image reconstruction or when rotation trajectory arcs are insufficient. The reduced data sample leads to mis-registration, sharp edges, and noisier images as a result of aliasing, which appear as fine striations in the image. A Moire artifact 17
27 occurs when too great an interval between basis projections (under-sampling) or an incomplete scanning trajectory results in improper recording of data by the reconstruction software. On the CBCT image, particularly on the periphery, fine alternating hyper-dense and hypo-dense stripes appear to be radiating from the edge of the volumetric data. This can be reduced by increasing the number of basis images. However, the dose to the patient becomes greater so a compromise much be reached. Scanner-related artifacts appear as circular or ring streaks resulting from deficiencies in scanner detection or poor calibration. Both of these problems result in a consistently repetitive reading at each angular position of the detector, resulting in a circular artifact. Misalignment of the x-ray source to the detector creates a double contour artifact, similar to that created by patient motion. Repeated use of CBCT equipment over time may result in slight configuration changes, and components may need to be periodically realigned. 3 Noise-induced artifacts are an important issue when selecting the exposure techniques. Noise is influenced partially by the number of photons that strike the detector. More photons mean less noise and a stronger detector signal, whereas fewer photons result in more noise and a lower detector signal. One can be over-judicious with trying to deliver the least amount of radiation possible and actually cause photon starvation. Photon starvation can ensue with poor patient positioning in the FOV, causing the object to be improperly scanned. Also, unsuitable selection of exposure factors (kvp, ma, time), scan speed, and inadequate tube power can lead to photon starvation, which often leads to severe streak artifacts. 18
28 Introduced Artifacts When an x-ray beam passes through an object being imaged, the lower energy photons are preferentially absorbed by the material and the higher energy rays pass through the substance to the detector. This phenomenon is referred to as beam hardening. Standard filtered-back projection reconstruction algorithms do not fully address the polyenergetic nature of the x-ray spectrum used in CT. X-rays that pass through a large amount of dense tissue, such as the petrous portion of the temporal bone, teeth, etc., have a high degree of attenuation and cause the x-ray beam to become hardened. A hard x-ray beam refers to a beam whose average spectrum of energies is higher than the original beam when it left the source prior to interacting with the patient. The presence of dense (higher z) structures such as bone in the x-ray path cause the lower energy portion of the beam to be preferentially attenuated compared to the higher energy photons. The beam undergoes an upward shift in average x-ray energy as it passes through more dense material like bone. 2 To reduce some of the beam hardening effects in CT, the beam can be pre-hardened by adding a filter comprised of thicknesses of aluminum, for example. However, beam hardening can still occur, especially when dense structures such as metal exist in the field. The x-ray beam that corresponds to the path that intersects the metal becomes exceptionally hardened and appears as a streak in the image. The dark, angular artifacts that result appear as webbing due to the CT scan geometry. Metallic restorations in teeth, dental implants, metal surgical clips, titanium reconstruction plates, and bullet fragments will all cause streak artifacts to a certain degree. In clinical practice, methods to lessen streak artifacts would be to reduce the field size, modify patient position, and separate the dental arches to avoid scanning regions susceptible to beam hardening. It is also important to have the patient 19
29 remove any jewelry prior to scanning to eliminate overlay of the object over the desired anatomy of interest and also to reduce peripheral beam hardening effects and scatter superimposed on the region of interest. 3 Strengths and Limitations of CBCT Many of the qualities of CBCT that have been mentioned make CBCT a very suitable imaging system over conventional CT for routine usage in the dental office. There are also limitations to its use. CBCT offers significantly reduced physical dimensions compared to conventional CT and a cost that is approximately one-fifth the price. 3 CBCT offers fast acquisition with utilization of advanced solid-state detectors and fast frame rates, increased computer processing speed, and many units integrating reduced arc trajectory. The majority of CBCT scanning can be performed in 30 seconds or less. 3 All CBCT machines presently use megapixel solid-state equipment for x-ray detection, which provide sub-millimeter voxel resolution in all orthogonal planes. There are a few CBCT units capable of high resolution imaging ( mm voxel resolution), which is necessary to distinguish fine detail in structures such as root canal morphology or root fractures in dentistry. 3 Relatively Low Patient Radiation Dose As was previously discussed, the ultimate radiation dose delivered to the patient is of utmost importance. Published reports indicate that the effective dose (ICRP 2007) for various CBCT machines ranges from 25 to 1025 µsv, depending on the manufacturer, model, FOV, and imaging protocol employed. These readings are approximately equal to 1 to 42 digital dental panoramic radiographs (~24 µsv) or 3 to 123 days equivalent per capita natural background radiation (~300 µsv in the United States). 28 Patient radiation dose can be reduced 20
30 by beam collimation, number of basis images, exposure factors, and protective shielding. CBCT imaging affords a breadth of patient dose reduction compared with head MDCT imaging, which can be in the range of 430 to 1160 µsv. 3 Interactive Analysis CBCT use is not only very easy for a clinical office environment, it is also very user friendly to view and analyze the images. Data reconstruction and viewing is performed via a personal computer. Furthermore, some manufactures provide in-depth software that allows for specific tasks and cursor driven measurements for determining accurate positioning and precise dimensions for dental implant placement, bone grafting, orthodontic work-up and mid-treatment analysis, endodontic procedures, and oral surgical requirements. The locations and sites can be annotated and labeled for future reference and discussion with patients and other practitioners. Limitations With any radiographic imaging system there are limitations. None of the devices are perfect. The cone-beam projection acquisition geometry leads to a large volume of tissue being irradiated with each basis image. A large portion of the photons undergo Compton interactions and produce scattering. The scattered radiation occurs in all directions and can exit the patient or reach the pixels in the area detector from a pathway unrelated to the direction the photon was originally traveling. Many of the photons have enough energy to permit them to be scattered many times by multiple atoms. Ultimately, this results in information generated in the pixel that is useless because it does not correlate with a corresponding linear attenuation coefficient value that is representative of the tissue. The CT 21
31 number or value has been adulterated by this process and is useless information, referred to as noise. 29 There are three major sources that contribute to noise in an image. The first source is the quantum noise determined by the x-ray flux or the number of detected x-ray photons. It is influenced by the scanning techniques (i.e., x-ray tube voltage, tube current, slice thickness, and scan speed), the scanner efficiency (e.g., detector quantum efficiency), and the patient (e.g., patient size, amount of bone and soft tissue in the scanning plane). The scanning technique dictates the number of photons that reach the patient, and the scanner efficiency determines the percentage of the x-ray photons exiting the patient converted to useful signals. 26 Also, because of the enlarged divergence of the x-ray beam over the area detector, there is a pronounced heel effect. The x-rays that constitute the useful beam emitted toward the anode side must traverse a greater thickness of target material than the x-rays emitted toward the cathode direction. The intensity of x-rays that are emitted through the heel of the target is reduced because they have a longer path through the target and therefore increased absorption. The difference in radiation intensity across the width of the useful beam of an x-ray field vary as much as 45%. 1 The second source that influences the noise performance is the inherent physical limitations of the system. These include the electronic noise in the detector photodiode, the electronic noise in the data acquisition system, scatter radiation, and other factors beyond the scope of this paper. Electronic noise is due to the inherent degradations of the detector system related to the x-ray absorption efficiency of the detector
32 Reconstruction Algorithms The third noise-influencing factor is the reconstruction parameters. Image reconstruction in CT is a mathematical process that generates images from x-ray projection data acquired at many different angles around the patient. Image reconstruction has a fundamental impact on image quality and therefore on radiation dose. For a given radiation dose, it is desirable to reconstruct images with the lowest possible noise without sacrificing image accuracy and spatial resolution. Reconstructions that improve image quality can be translated into a reduction of radiation dose because images of acceptable quality can be reconstructed at a lower dose. 30 Two major categories of methods of image reconstruction exist, analytical and iterative reconstruction. Methods based on filtered-back projection (FBP) are one type of analytical reconstruction that is currently widely used on clinical CT scanners because of their computational efficiency and numerical stability. 31 Iteration is defined as a computational process in which a series of operations is repeated until a condition is met. 31 Iterative reconstruction offers the ability to minimize radiation exposure while preserving and, in some cases, improving image quality. When CT was developed by Godfrey Hounsfield in the 1970 s, the original reconstruction algorithm he employed was iterative reconstruction (IR), where the software builds and then revises with hundreds of reiterations to enhance image quality. Computer speeds in the 1970 s were so slow, it took about 45 minutes to reconstruct one slice using the IR method. The computer would work all night to have a rudimentary-quality image ready for viewing the following day. A less intense computer power algorithm called filtered-back projection (FBP) was 23
33 adopted that could process slices in 30 seconds. This software and the incremental improvements made to it have been the backbone of CT imaging for more than 30 years. 32 You can get a fast answer to the problem of how to take all those inputs into the detector and create an image from them. The problem with filtered back projection is that it tends to have relatively high noise and relatively high dose, said Jeffrey B. Mendel, MD, staff radiologist, radiation safety officer, Parkland Medical Center, Derry, NH, and assistant professor of radiology, Tufts University School of Medicine. Mendel is an expert on CT reconstruction software. He said FBP either offers high spatial resolution or high contrast resolution, but it cannot do both at the same time. However, IR does offer this ability and can do so at a lower dose. 46 As computing power and speeds rose exponentially in the 1990s and 2000s, IR saw a revival, especially in its ability to enhance image quality for lower-dose scans. Lowering CT dose became a major issue in recent years after mass media reports of patients receiving radiation burns from newer CT scanners. Here s the bottom line: radiation is scary and it is certainly very scary to the general public, Mendel said. The big driver to adopt iterative reconstruction is that we can reduce dose. 46 With IR, the data is processed in a continuous loop where calculations are performed to create the different images. Projection data is then processed and compared to assumed ideal models over and over to improve the image voxel-by-voxel. Iterative reconstruction solves the equation for each voxel in the image, Mendel said. It s a slow, complex calculation, but it offers both low noise and dose, and the ability to do both high spatial and contrast resolution together
34 The technique also creates its own set of image artifacts. Images can appear plastic because of the absence of noise, edges are artificially sharper, and the tissue appears to be smudged or smoothed. IR can also cause blotchy pattern artifacts inside the borders of organs. To reduce the time required to reconstruct IR images and to reduce these artifacts, all current IR software programs use a blend of FBP and IR techniques. The downside of IR software is that each vendor offers their own version. They can be slightly different and have their own strengths and limitations. The software is also extraordinarily expensive and would add a significant cost to the imaging machine. 32 Users of clinical CT scanners usually have very limited control over the inner workings of the reconstruction method and are confined principally to adjusting various parameters specific to different clinical applications. The reconstruction kernel, also referred to as the filter or algorithm by some CT vendors, is one of the most important parameters that affect the image quality. Generally speaking, there is a trade-off between spatial resolution and noise for each algorithm. A smooth algorithm generates images with lower noise but with reduced spatial resolution. A sharp algorithm generates images with higher spatial resolution but increases the image noise. 30 Poor Soft Tissue Contrast The characteristic of CBCT that has most limited its use is the poor soft tissue contrast. This is due to the intrinsic properties of the acquisition parameters. As previously discussed, the pyramidal or cone-beam shape of the x-ray beam results in the development of a significant amount of noise, which dramatically decreases the contrast resolution of the image. Contrast resolution is the ability of an image to reveal subtle differences in image density. Variations in image intensity are a result of differential attenuation of x-rays by 25
35 tissues that differ in density, atomic number, or thickness. Two principle factors limit the contrast resolution of CBCT. First, although scattered photons contribute to increased noise of the image, it is also a substantial factor in reducing the contrast of the cone-beam system. Scattered x-ray photons reduce subject contrast by adding background signals that are not representative of the anatomy, reducing image quality. CBCT units have noticeably less soft tissue contrast than MDCT units. Second, there are numerous inherent FPD-based artifacts that affect linearity or response to x radiation. Saturation (nonlinear pixel effects above a certain exposure), dark current (charge that accumulates over time with or without exposure), and bad pixels (pixels that do not react to exposure) contribute to nonlinearity. In addition, the sensitivity of different regions of the panel to radiation (pixel-to-pixel gain variation) may not be uniform over the entire region. 29 CBCT in Dentistry Since CBCT devices were introduced commercially in the United States in 2001, dentists have come to use the technology in increasing numbers. Yet, although CBCT technologies have advanced rapidly over time, concerns have been expressed about whether the information acquired with CBCT imaging warrants the additional exposure risk, as well as about the level of training, education, and experience required to interpret the CBCT data set. 33 To provide guidance on CBCT imaging, national and international groups have prepared basic principles, position statements, and professional guidelines for CBCT use. These include the American Academy of Oral and Maxillofacial Radiology s Academy of Oral and Maxillofacial Radiology executive opinion statement on performing and interpreting diagnostic cone beam computed tomography, 2008; the European Academy of 26
36 Dental and Maxillofacial Radiology s Basic principles for use of dental cone beam computed tomography: consensus guidelines of the European Academy of Dental and Maxillofacial Radiology, 2009; the Academy of Osseointegration s 2010 Guidelines of the Academy of Osseointegration for the provision of dental implants and the associated patient care, 2010; The SEDENTEXCT Project s Radiation Protection: Cone Beam CT for Dental and Maxillofacial Radiology: Evidence Based Guidelines 2011; the Joint Position Statement of the American Association of Endodontists and the American Academy of Oral and Maxillofacial Radiology s Use of cone-beam computed tomography in endodontics, 2012the American Dental Association Council on Scientific Affairs advisory statement, The use of cone-beam computed tomography in dentistry, 2012; and the Joint Position Statement by the American Association of Orthodontists and the American Academy of Oral and Maxillofacial Radiologists, Clinical Recommendations for the Appropriate use of Cone Beam Computed Tomography (CBCT) in Orthodontics, In the field of Dentistry CBCT has been researched in the application of the following: Three-dimensional measurements and dental implant planning, assessment of craniofacial structures for patients undergoing orthognathic surgery, three-dimensional imaging in cleft lip and palate patients, diagnostic evaluation of osseous abnormalities of the mandibular condyle, detection and operative planning for mandibular osteomyelitis, assessment of bone quality, surface and volume rendering of facial structures, assessment of morphological temporomandibular joint changes, determination of osseous lesion size and volume, analysis of the internal structure of tumors, preoperative radiographic imaging before lower third molar removal, assessment for the reconstruction of the mandibular condyle, detection of caries (in vitro study), assessment of external resorption, detection of apical periodontitis, detection of foreign bodies in the head and neck region, imaging of trauma, and endodontics. It should be noted that restorations adjacent to caries lesions will compromise the CBCT detection thereof. For the detection of caries intraoral techniques still remain the choice due to their cost benefit, accuracy and lower radiation dose. Today, by using the digital data of CBCT solid 3D bio-models of human anatomy are fabricated and image guided surgery has become a reality. Due to advantages such as low radiation doses, convenience, simplicity, saving of time during procedures as well as lower 27
37 initial and long-term costs of CBCT over conventional CT it is believed by the authors that the demand for CBCT will increase in the field of maxillofacial imaging. 34 The authors of the above referenced statement did not specifically mention CBCT in orthodontics. However, the field of orthodontics has seen tremendous growth in the use of CBCT for obtaining pre-treatment records, establishment of treatment plans, and midtreatment evaluation. 35 In addition, CBCT is used in orthodontics for determination of appropriate sites for mini-screws, palatal bone thickness, cephalometry, assessment of tooth position or inclination, assessment of rapid palatal expansion, determination of skeletal age based on cervical vertebrae morphology, and 3D evaluation of upper airway anatomy in adolescents. 36 The use of CBCT in dentistry, and particularly orthodontics, is not without controversy, mainly because the majority of the patient population undergoing orthodontic treatment is in the pediatric to adolescent age group. It is well known that children have a significantly elevated risk of untoward side effects, namely a lifetime risk of cancer, when exposed to radiation. 37 There are two types of effects on tissue caused by radiation. If cellular damage occurs as a result of radiation and it is not adequately repaired, it may prevent the cell from surviving or reproducing or it may result in a viable cell that has been modified (suffered a change or mutation). The two scenarios have profoundly different outcomes for the patient. Deterministic effects occur when there is significant damage to the cell or tissue resulting in loss of function. Above a certain dose, the threshold dose, the probability of manifestation increases swiftly to 100%. The severity and occurrence increase with dose (e.g., cataract, tissue fibrosis). The probability of such harm is zero at small radiation doses observed in medical imaging. 28
38 The consequence is very different if the irradiated cell remains viable but has been altered. Carcinogenesis and heritable effects fall into this category. When somatic cells are exposed to radiation, the probability of cancer rises with dose, most likely with no threshold, as in the deterministic response. However, the severity of the cancer is not dose related. This category is referred to as stochastic effects. If the radiation occurs to a germ cell, mutations could result that could have harmful effects in future generations. It is also believed that there is probably no threshold and the severity of heritable effects is not dose-related, just hat the probability increases with dose. 38 The belief that stochastic effects have no dose threshold is based on the molecular mechanisms involved. There is reason to believe that even a single x- ray photon could result in a base change, leading to a mutation that could cause cancer or a heritable defect. This concept is also referred to as the Linear No-Threshold (LNT) risk assessment model that any amount of radiation exposure may lead to cancer in a population. Based on the LNT model, risk from low-dose radiation increases linearly with increasing doses of radiation. It is thought that extrapolating the linear graph into the very-low-dose range is also accurate. For this reason, it is considered sensible and conservative to assume that no dose is too small to be effective, although this can never be proved. 38 Cancer induction is the most important somatic effect of low-dose ionizing radiation. There is a long history of a link between radiation exposure and an elevated incidence of cancer. Many reports have been made but the most recent and significant example of human experience with radiation-induced cancer includes the Japanese survivors of the atomic bomb attacks. This is the most important single group studied because of their large number, the care with which they have been followed, and the fact that people of all ages and both sexes received a wide range of doses
39 Irradiation of Children The hazards associated with medical radiation in children are basically the same as in adults, cancer and heritable effects. However, the risks associated with a given absorbed dose of radiation are higher because of an increased sensitivity in younger people. This was evident in the survivors of the of the Japanese atomic bomb attack (Life Span Study, LSS, Radiation Effects Research Foundation, RERF). There is a noticeable alteration in sensitivity to radiation-induced malignancies with increasing age, with young children being more radiosensitive than older adults by a factor of Concern for possible heritable effects induced by radiation is similarly greater in children because they have their entire reproductive life ahead of them. 38 With radiation-induced cancer, there is a latent period between irradiation and the appearance of the malignancy. There is also a difference in the type of cancer that develops. Leukemia has the shortest latent period. Excess cases began to appear in the survivors of the Japanese atomic bomb attack and reached a peak in 5-7 years and extended to about 15 years. Solid tumors, on the other hand, show a longer latency and extend from 10 to about 60 years out from the time of irradiation. 38 The Position Statement by the American Academy of Oral and Maxillofacial Radiologists, 2012, outlined a series of general recommendations and specific criteria for the use of CBCT based on specific clinical scenarios and most appropriate scan field of view. Dose minimization and professional use strategies are provided. The use of CBCT must be justified based on individual clinical presentation and is not appropriate for routine diagnostic use nor as a substitute for non-ionizing radiation techniques to record the dentition or maxillofacial complex. 40 The issue of dose was also addressed in the Position Statement. The recent results of a retrospective cohort study by Pearce, et al. 2012, provided more direct evidence of a link 30
40 between exposure to radiation from computed tomography (CT) and cancer risk in children. 40 They found that children and young adults who received radiation doses from the equivalent of 2 or 3 CT scans of the head have almost triple the risk of developing leukemia or brain cancer later in life. Medical CT scans may have an effective dose of up to 2000 µsv, 41 However, substantial reductions to less than 1,000 µsv have been reported for low dose protocol CT examinations. 12, 42 Most CBCT examinations are reported to impart a fraction of medical CT effective dose, however, doses vary considerably between CBCT units. 40 The actual risk of cancer induction for low dose radiographic procedures currently considered to be below about 100,000 μsv, including as maxillofacial CBCT, is difficult to assess. Radiation epidemiologists and radiobiologists internationally are in consensus that for stochastic risks such as carcinogenesis, from a radiation safety perspective, the risk should be considered to be linearly related to dose, all the way down to the lowest doses. 43 In this paper, the AAOMR Task Force Committee reviewed information on the potential health effects of exposure to diagnostic ionizing radiation. There is neither convincing evidence for carcinogenesis at the level of dental exposures nor the absence of such damage. This situation is unlikely to change in the foreseeable future. In the absence of evidence of a threshold dose, it is prudent to assume that such a risk exists. This implies that there is no safe limit, or safety zone, for ionizing radiation exposure in diagnostic imaging. Every exposure cumulatively increases the risk of cancer induction. Consequently, to be cautious, the Committee s recommendations are focused on minimizing or eliminating unnecessary radiation exposure in diagnostic imaging
41 The release of the Position Statement by the AOAOMR was followed quickly by responses that were not in agreement with the recommendations in the document. Mah, et al. responded with an article in Orthodontic News that was highly critical and stated, The AAO/AAOMR draft document is lacking in many respects related to objectivity, balance, failure to apply the available evidence, and flawed recommendations. As is, it may be impossible for AAO members to follow the guidelines and may put them, their practices, and the AAO in difficult, if not impossible, situations. 44 The use of CBCT in dentistry shows no sign of decelerating. More and more uses will be found. Manufacturers of CBCT machines will continue to respond to the increasing demand by offering units that will satisfy the needs of practitioners and their patients. Computers, detectors, monitors, and software algorithms will all continue undergo technological advancements. It is an important public health issue that ALARA will continue to be respected and the dose received by patients reduced while the benefits of the technology realized. 32
42 References 1. Bushong SC, Radiologic Science for Technologists: Physics, Biology, and Protection, 9 th ed, ch. 28, p. 7, Bushberg JT, Seibert JA, Leidholdt Jr EM, Boone JM, The Essential Physics of Medical Imaging, 3 rd ed, ch. 1, White SC, Pharoah MJ, Oral Radiology: Principles and Interpretation, 7 th edition, Cho PS, Johnson RH, Griffin TW. Cone-beam CT for radiotherapy applications. Phys Med Biol 1995;40: Ning R, Chen B. Cone beam volume CT mammographic imaging: feasibility study. In: Antonuk LE, Yaffe MJ, editors. Medical imaging 2001: physics of medical imaging proceedings of SPIE. vol San Diego (CA): CA SPIE; p Iola AA, Metz CT, Schaap M, Klein S, Grass M, Niessen WJ, Cardiac motioncorrected iterative cone-beam CT reconstruction using a semi-automatic minimum cost path-based coronary centerline extraction. Comput Med Imaging Graph Apr; 36(3): Ping HS, Kandaiya S. The influence of the patient size and geometry on cone beamcomputed tomography Hounsfield unit. J Med Phys 2012;37: Berg E. Forensic image processing. Digital imaging: An introduction to image enhancement Available from: [Last accessed on 2007 Sep 1] 9. Fukui Y. Human eyes as an image sensor. Available from: [Last accessed on 2007 Apr 15]. 10. Kimpe T, Tuytschaever T. Increasing the number of gray shades in medical display systems: How much is enough? J Digit Imaging. Dec 2007;20(4): Sukovic P. CBCT in Craniofacial Imaging. Orthod Craniofac Res. 2003;6 (suppl 1): Ludlow JB, Davies-Ludlow LE, Brooks SL, Howerton WB Dosimetry of 3 cbct devices for oral and maxillofacial radiology: CB Mercuray, Newtom 3G and i-cat, Dentomaxillofac Radiol, 2006;35: Scarfe WC, Farman AG, Cone Beam Computed Tomography, Oral Radiology,
43 14. Perandini S, Faccioloi N, Zaccarella A, The diagnostic contribution of CT volumetric rendering techniques in routine practice. Indian J Radiol Imaging. 2010;20 (2): Cody D, AAPM/RSNA Physics Tutorial for Residents:Topics in CT, RSNA Radiographics, 2002, 22:5 16. Koybayashi K et al, Accuracy in measurement of distance using CBCT, Inter J of Oral and Maxillofac Impl, vol 19, 2 March 2004 pp Kumar V, Ludlow JB, Mol A, Cevidanes L, Comparison of conventional and cone beam CT synthesized cephalogramsdentomaxillofac Radiol, 36 (2007), pp Loubele M, Assche N, Carpentier K, Maes F,Jacobs R, Steenberghe DV, Suetens P, Comparative localized linear accuracy of small-field cone-beam CT and multislice CT for alveolar bone measurements,oral Surg Oral Med Oral Pathol Oral Radiol Endod, 105 (2008), pp Moshiri M, Scarfe SC, Hilgers ML, Scheetz JP, Silveira AM, Farman AG, Accuracy of linear measurements from imaging plate and lateral cephalometric images derived from cone-beam computed tomography,am J Orthod Dentofacial Orthop, 132 (2007), pp Periago D, Scarfe W, Moshiri M, Sheetz, Linear Accuracy and Reliability of cone Beam CT Derived 3-Dimensional Images Constructed Using an Orthodontic Volumetric Rendering Program, Angle Orthodontist, vol. 78, No 3, 2008, pp Ludlow JB, Laster WS, See M, Bailey LJ, Hershey HG, Accuracy of measurements of mandibular anatomy in cone beam computed tomography images,oral Surg Oral Med Oral Pathol Oral Radiol Endod, 103 (2007), pp Saleh H, Improving Diagnostic Viewing of Medical Images using Enhancement algorithms, Journal of Computer Science, 7 (12): , Yin, L, Scalable edge enhancement with automatic optimization for digital radiographic images, Pattern Recognition, Vol. 37, (7) July 2004, pp Morgan CL, Basic Principles of Computed Tomograpohy, 1983, Univ Park Press 25. Hsieh J, Image Artifacts, causes and correction, Medical CT current technology and applications, College Park,Maryland, 1995 American Association of Physics in Medicine. 26. Seeram E, Computed Tomography, Physical Principles, Clinical Applications, and Quality Control, 3rd Ed, Heuscher DJ, Vembar M: Reduced Partial Volume Artifacts using Spiral CT, Med Phy 26: ,
44 28. Ludlow JB, Davies-Ludlow LE, Brooks SL, et al,: Dosimetry of 3 CBCT devices for oral and maxillofacial radiology: CB Mercuray, Newtom 3G, and i-cat, Dentomaxillofac Radiol 35: 392, White, Stuart C., Michael Pharoah. Oral Radiology: Principles and Interpretation, 7th Edition. Mosby, VitalBook file 30. Yu L, Leng S, Image Reconstruction Techniques, Image Wisely, American College of Radiology, Nov The Merriam-Webster Dictionary, Fornell D, Iterative Reconstruction 101: Understanding how new reconstruction algorithms improve image quality and help lower dose, Imaging Technology News, June Horner K, Islam M, Flygare L, Tsiklakis K, Whaites EJ. Basic principles for use of dental cone beam computed tomography: consensus guidelines of the European Academy of Dental and Maxillofacial Radiology. Dentomaxillofac Radiol 2009;38(4): Noffke CEE, SADJ, vol 64 no 6 p , July Kapila S, Conley RS, Harrell WE Jr. The current status of cone beam computed tomography in orthodontics. Dentomaxillofac Radiol2011;40: De Vos W, Casselman J, Swennen GRJ, cone-beam computerized tomography (CBCT) imaging of the oral and maxillofacial region: A systematic review of the literature, Int J Oral Maxillofac. Surg. 38: , Brenner D, Elliston C, Hall E, Berdon W. Estimated risks of radiation-induced fatal cancer from pediatric CT. AJR Am J Roentgenol 2001;176: Hall E, Giaccia A, Radiobiology for the Radiologist, 7th ed, ch 10, Biologic Effects of Ionizing Radiation (BEIR) VII, U.S. National Academy of Sciences, Clinical Recommendations for the Appropriate use of Cone Beam Computed Tomography (CBCT) in Orthodontics, Joint Position Statement by the American Association of Orthodontics and the American Academy of Oral and Maxillofacial Radiology, Smith-Bindman, et al, Radiation dose associated with common computed tomography examinations and the associated lifetime risk of cancer, Arch Intern Med. 2009; 169:
45 42. Ludlow JB, Davies-Ludlow LE, White SC. Patient risk related to common dental radiographic examinations: the impact of 2007 International Commission on Radiological Protection recommendations regarding dose calculation. J Am Dent Assoc. 2008a;139: Valentin, 2007; Preston, et al., 2003; United Nations Scientific Committee on the Effects of Atomic Radiation, 2008; National Research Council of the National Academies, Mah J, Hatcher D, and Langlais R. Mah Responds to AAO/AAOMR CBCT Recommendations. Orthodontic News, orthodonticproductsonline.com, August 28,
46 CHAPTER 2. ASSESSMENT OF PHANTOM DOSIMETRY AND IMAGE QUALITY OF ACCUITOMO 170 AND MINICAT CONE-BEAM COMPUTED TOMOGRAPHY Introduction Imaging with x-rays has been an integral adjunct to the history and physical examination to assist the clinician with determining an accurate diagnosis. For over a century, technological innovation has propelled radiographic imaging to the forefront of progressions in health care. Computed tomography (CT) technology advanced to a point in the 1990 s that allowed very detailed, high-quality images of internal anatomy to be acquired in a matter of seconds. Use of CT skyrocketed and it became routine for doctors to order a CT scan as part of their patient evaluation practice. When the total number of CT imaging scans obtained during the period from 1993 to 2006 are tabulated, an exponential rise in the number of examinations far exceeds the growth in the U.S. population over the same period. 1 In 1990 and 2000, approximately 13 million and 46 million CT scans were performed, respectively. 2 Most reports put the number of CT scans performed annually in the United States to be between 70 million and 80 million. 2 (Figure 1) A study in the journal Radiology revealed that the number of CT scans performed on pediatric patients in the emergency department (ED) had increased fivefold over a 13-year period ending in This pattern essentially duplicates what has happened with CT scans for adult patients in the ED. The main driver is, frankly, that CT is an amazing technology, said Marilyn Goske, MD, a pediatric radiologist at Cincinnati Children s Hospital Medical Center. Thirty years ago, we couldn t see inside the brain. Now, we can do a child s body in 37
47 half a second. We have technology that gives us exquisite imaging and we don t need to sedate the child. We can have a definitive answer. That level of accuracy has improved the quality of pediatric care, making procedures such as exploratory surgery for tumors and staging laparotomies for lymphoma no longer necessary. 4 Donald Frush, MD, a pediatric radiologist at Duke University Health System, echoes this point. Twenty years ago, he noted, the accepted false-negative rate for laparotomies for appendicitis was 30%; with the availability of CT, the false-negative rate has dropped to the 5 7% range. 4 In general, the benefits of radiation for diagnostic purposes far outweigh the risks regarding the health of patients. 5 However, there has been a growing concern that perhaps too much imaging is occurring and it may be detrimental to public health. The most severe longterm side effect of exposure to x-rays are stochastic effects, or cancer. Even low levels of radiation received from imaging diagnostic procedures, such as CT, do have the potential to cause stochastic effects, which basically refers to the development of various malignancies due to genetic mutations. 6,7,8 Stochastic effects are considered to have no radiation threshold, meaning that even a very small dose has the potential to cause cancer. A review paper published at the end of 2007 in the New England Journal of Medicine (NEJM), estimated that from 1.5% to 2% of all cancers in the United States may be attributable to the radiation from computed tomography (CT) studies. 30 This study, as well as others, 10, 11 have generated a slightly raucous public health concern that has even reached high-profile media regarding the use of CT scans in medicine and now the use of cone-beam computed tomography (CBCT) in dentistry. A well-publicized article in The New York Times in 2010 discussed the use of CBCT scans in adolescents and the potential risks of radiation induced carcinogenesis. 12 CBCT 38
48 examinations have been reported to deliver a fraction of the dose of a head CT exam, which is approximately 2 msv (2000 µsv). 13 However, CBCT scanners have been notorious for producing large variations in dosage based on the manufacturer, field of view (FOV), exposure factors, and other options present on the machine. This variability of exposure can be as much as ten-fold. 14,15 The range of differences is especially important when considering the pediatric patient population because cellular growth and organ development is associated with an increased radiosensitivity. When coupled with a probability of a longer lifespan in which stochastic effects may occur, children may be two or more times as sensitive to radiation-induced carcinogenesis as mature adults. 16 Exposure to Radiation On earth we are exposed to two major sources of radiation: background and medical. The background radiation is basically fixed and beyond our control, with a consistent annual dose being delivered. The single highest controllable source of radiation exposure in the U.S. population is from medical imaging, with the majority associated with diagnostic procedures. In 2006, the medical use of radiation, not including radiation therapy, produced an average annual effective dose to the population of the United States of roughly 3 msv. This equates to about 97% of the total from artificial radiation sources and nearly half of the average annual effective dose from all sources, including background radiation (NCRP, 2009). (Figure 2) When CT scanning was in its infancy in 1980, the estimated average annual effective dose equivalent from medical radiation was 0.3 msv (NCRP, 1987). The two largest factors that increased the average effective dose from 1980 until 2006 are the increased use of computed tomography (CT) and nuclear medicine, with CT exposure accounting for greater than 2/3 s of the total. These two combined deliver approximately 39
49 75% of the collective medical effective dose. The average U.S. per capita dose in 1980 was 0.53 msv and rose to 3.0 msv in 2006, an increase of 566% (NCRP, 1987; NCRP, 2009) 1. At this point the total average annual effective dose per person in the U.S. population is 6.2 msv background, 3.1 msv/yr, and medical, 3.0 msv/yr. (The.1 msv discrepancy is attributed to consumer products and other, (NCRP, 2006).) 17 It is easy to extrapolate that if exposure to ionizing radiation continues at this rate of growth, the overall public health will be negatively impacted. Measuring Dose The most pertinent manner to measure dose in humans is related to the ability of ionizing radiation to induce formation of malignancy in the tissue of the exposed individual. Equivalent dose is used in radiological protection to represent the stochastic (probability of cancer induction and genetic effects) but not deterministic effects (severity of acute tissue effects) of ionizing radiation. The equivalent dose is calculated by multiplying the absorbed dose by a radiation weighting factor appropriate to the type and energy of radiation. Equivalent dose, H T, is used for assessing stochastic health risk due to external radiation fields that penetrate uniformly through the whole body, or for assessing the individual equivalent dose to organs. However, it needs further corrections when the field is applied only to part(s) of the body or non-uniformly to measure the overall risk. In that case, a further quantity called effective dose must be used to take into account the varying sensitivity of different organs and tissues to radiation. The radiation dose quantity effective dose is the tissue-weighted sum of the equivalent doses in all specified tissues and organs of the body and represents the stochastic health risk, which is the probability of cancer induction and genetic effects of ionizing radiation delivered to those body parts. 6 It takes into account the 40
50 type of radiation and the nature of each organ or tissue being irradiated. Effective dose is the central quantity for dose limitation in radiological protection in the international system of radiological protection devised by the International Commission on Radiological Protection (ICRP) The calculation of effective dose is required for partial or non-uniform irradiation of the human body because equivalent dose does not consider the tissue irradiated, only the radiation type. However, various body tissues react to ionizing radiation differently. The ICRP has assigned sensitivity factors to specified tissues and organs so that the effect of partial irradiation can be calculated if the irradiated regions are known. 6 A radiation field irradiating only a portion of the body will carry lower risk than if the same field irradiated the whole body. To take this into account, the effective doses to the component parts of the body that have been irradiated are calculated and summed. This becomes the effective dose for the whole body, dose quantity E. It is a protection dose quantity that can be calculated but cannot be measured in practice. Therefore, different probabilities exist for the occurrence of stochastic radiation effects in various organs and tissues. There are multiple means to measure the dose delivered to a patient: computed tomography dose index by volume (CTDI vol ), dose area product (DAP), entrance surface dose (ESD), air kerma area product and Monte Carlo simulations. 2 The method chosen by the International Commission on Radiation Protection (ICRP) is effective dose, which is the most widely accepted. As stated previously, E is a weighted average of organ doses and can be expressed mathematically as follows: E = Σ W T x H T, where E is the summation of the products of the tissue weighting factor (W T ) that represents the relative contribution of that organ or tissue to the overall risk and the radiation weighted dose (H T ). 28 The effective dose 41
51 is expressed in Sieverts (Sv, msv, or µsv). The dissimilar sensitivity to stochastic radiation damage was considered in the ICRP Publication 60 by the tissue-weighting factor in calculations of the effective dose. Tissue weighting factors (W T ) were established by the ICRP as part of a radiation protection system to assign a particular organ or tissue (T) the proportion of detriment from stochastic effects (ICRP Publication 60, 1990, and updated Publication 103, 2007.) 18 Using extrapolations of cancer morbidity and mortality data associated with well-documented exposures to large populations such as the survivors of the atomic bomb explosions, radiation detriment, including the weighted probabilities of fatal and non-fatal cancer, can be calculated from effective dose. 1 Importantly, effective dose is an indicator for stochastic risk but because of the uncertainties in the low-dose range, underlying approximations, simplifications, sex and age averaging, it applies to a population, not to a specific individual. Therefore, effective dose should not be used as the patient s dose for the purpose of assigning risk. 17 For a number of reasons the ICRP has produced recommendations three times in the past 35 years 1977, 1990, and 2007 (Table 1). Tissue-weighting factors were first updated 13 years after basic recommendations were made in 1977 Publication 26. In the 1977 recommendations, the ICRP introduced the distinction between stochastic effects and non-stochastic effects of radiation exposure. Although it gave no risk figures for nonstochastic effects, it gave quantitative estimates of the stochastic risk of radiation exposure for the first time. The Commission derived cancer risk factors for red bone marrow, bone, bone surfaces, lung, thyroid, breast, and all other tissues. It was recognized that the risk estimates would vary between workers in the field and the general population
52 In the 1990 ICRP recommendations, there was a review of non-stochastic, now renamed deterministic, effects in organs and tissues and estimates were given for the thresholds of these effects. There was also a rigorous review of the stochastic effects in exposed individuals. There was a longer list than in 1977 of organs and tissues for which risks were quantified, some 13 organs plus gonads. The Commission increased the probability coefficients for stochastic effects leading to a fatal cancer risk from 10-2 Sv -1 in 1977 to Sv -1. The estimates represented a significant increase over those from 1977 and caused some major changes to protection philosophy. The principal reason was due to the multiplicative model replacing the previous additive model (radiation risks assumed to be induced independent of the naturally occurring cancers) used in By the late 1980 s, there were more solid tumors recorded in the Japanese Atomic Bomb survivor s, indicating there is a longer latent period for solid tumors compared to leukemia. The increased numbers lead to the conclusion that the radiation-induced tumors were consistent with the multiplicative model, whereby the tumors induced by radiation arise as a percentage increase of those naturally arising. This led to an increased estimate of the tumors that would develop in the future because natural cancer rates generally increase with higher ages. 37 In 2007, the International Commission on Radiological Protection (ICRP) updated the method for calculating effective dose on the basis of the latest available scientific information on the biology and physics of radiation exposure. 28 The new method involves revised estimates of the radiosensitivity of tissues and their corresponding tissue-weighting factors, including those in the maxillofacial region. The 2007 ICRP tissue and tissueweighting factors reflect new data updated through 1998 from the Life Span Study of 43
53 Japanese atomic bomb survivors. This data provided information regarding cancer incidence and not just cancer mortality, which is a more accurate description of the cancer burden from exposure to radiation because some cancers now have a relatively higher survival rate. 38 Of particular relevance to dentistry, salivary glands, oral mucosa, and extrathoracic airway tissues were included in the weighting system and brain tissue weighting was increased. An increasing evidence of cancer risk in salivary glands and brain, linked to dental radiography, 39 caused these tissues to be given increased weight in The revision of the tissue-weighting factors, despite reducing the weighting of the thyroid gland from 0.05 to 0.04, has resulted in an increase in the calculated effective dose to the tissues in the maxillofacial region and concomitantly increased the risk of the detrimental outcome of the stochastic effect of cancer. 38 Ludlow et al. demonstrated in a 2008 article in JADA that the application of the 2007 ICRP guidelines to common dental imaging examinations resulted in a % higher risk of detrimental effects to the patient than from the 1990 ICRP guidelines. 38 Image Quality The aim in radiology is to obtain images that are adequate for the clinical purpose with the minimum radiation dose to the patient. Superior image quality is certainly available with the CBCT machine, but it comes at a high cost to the patient in the form of significant doses that are nearly equivalent to MDCT. 15 If optimum performance is to be achieved, assessments of image quality must be made to balance against patient dose. The subjective nature of image interpretation makes an objective approach to such assessment difficult. There are two components of subjective image quality that relate with objective quality measures: contrast and spatial resolution. Image contrast can be objectively measured using 44
54 contrast-to-noise ratio (CNR) and spatial resolution is tabulated by computing a modulation transfer function (MTF). As the technology and use of CBCT continues to evolve, there is a shift away from the one size fits all mentality of imaging. The newer units are being designed in a manner that answers to both the needs of the practitioner and the principles of ALARA. Many contemporary, innovative CBCT units have a plethora of options for FOV, projection images, exposure factors, and modes that enable the savvy practitioner to precisely obtain the diagnostic image required without undue exposure to the patient. For example, if the patient needs only one or two implants adjacent to each other in the arch, then a very small FOV with high resolution can be chosen to capture only the anatomy of interest, thereby avoiding irradiating an outsized volume of tissue with a large FOV. Conversely, when evaluating the general position of tooth roots midway through orthodontic treatment, a large FOV may be chosen with a concomitant reduction in the technical factors to decrease the ultimate dose received by the patient because a high resolution is not required to obtain the desired information. The purpose of this research study was to determine equivalent doses and calculate effective doses based on various combinations of FOV size, location, and exposure protocols using adult and child ATOM and (optically stimulated luminescent dosimeters (OSL s) with the MiniCAT (Xoran Technologies, Ann Arbor, MI) and Accuitomo 170 (J. Morita Corporation, Osaka, Japan) CBCT units. The second objective was to measure contrast-tonoise ratio and modulation transfer function as quantitative measurements of image quality for various exposure options offered by the Accuitomo 170 machine. 45
55 Materials and Methods Optically stimulated luminescent (OSL) dosimeters (Nanodot; Landauer, Glenwood, IL) were used in this project to measure absorbed dose. OSL s were demonstrated by Ludlow et al. 26 to be an accurate and easier-to- process alternative than the previous thermoluminescent dosimeters (TLD), customarily used in prior dosimetry studies. OSL dosimeters are plastic disks, each encased in a light-tight plastic holder measuring approximately 2 x 10 x 10 mm (Figure 3A). The case prevents loss of energy through stimulation by ambient light. Each disk is infused with aluminum oxide doped with carbon (Al 2 O 3 :C). The trace amounts of carbon in the aluminum oxide crystal lattice create imperfections that act as traps (F centers) for electrons and positively charged areas called holes. After exposure to ionizing radiation, free electrons and holes are generated and trapped at the F centers in proportion to the amount of energy in the exposure. 26 Release of trapped electrons and light emission are stimulated by laser light instead of heat, as in TLD s. OSL dosimeters have a broad dose response range and are capable of detecting doses as low as 10 µsv. The Al 2 O 3 has a higher effective atomic number than soft tissue. Consequently, an OSL dosimeter has filters over the sheet of OSL material that are used to estimate dose to soft tissue. OSL s have certain advantages over TLD s in that they can be reread several times and an image of the filter pattern can be produced to differentiate between static (i.e., instantaneous) and dynamic (i.e., normal) exposure. 17 Dosimeters used in this study were calibrated before use and read with a portable reader (MicroStar; Landauer, IL) (Figure 3B). After calibration, photon counts from dosimeters can be recorded with an accuracy of about + or -2%. 26 Photon counts are converted to doses using an energy-specific conversion factor. In this case, doses reported by 46
56 the reader were adjusted for energy response. Doses reported by the MicroStar reader were adjusted for dosimeters over a range of 80 to 120 kvp using an adjustable kilovolt peak source. 26 For this study, the OSL sensitivity, at 90 kvp, was the estimated energy response using a third-order polynomial calibration curve derived from side-by-side comparisons of recorded doses from an ion chamber and OSL at.94 (mean, 60 kv). OSL sensitivity at 120 kvp was estimated at 0.78 (mean, 80 kv). Two different models of CBCT machines were used for this investigation. The MiniCAT (Xoran Technologies, Ann Arbor, MI) (Figure 4) and the Accuitomo 170 unit (J. Morita Corporation, Osaka, Japan). The MiniCAT unit is more simplistic from the standpoint of offering fewer options, such as FOV, selection of mode, and adjustable exposure factors. It offers two fields of view (16 x 13 cm sinus and a 16 x 6.5 cm temporal bone) (Figure 5) and operates at a tube voltage of 120 kvp and 125 kvp, respectively, for the sinus and temporal (T-bone) scans. The tube current remained at 7 ma for all the scans. The pulse length is 11.5 ms for the three sinus scan options and a pre-set 14 ms for the T-bone. Additionally, the MiniCAT permits three options for projection image selection (600, 300, and 150) with exposures of mas/20 s, mas/10s and mas/10s for the sinus scans. The T- bone scan has only one set of parameters, which includes 600 projection images, mas, and a scan time of 20 s. The scan parameters pre-set by the manufacturer for the adult and child phantom using the MiniCAT are listed in Figure 7. The Accuitomo 170 is a more contemporary unit with multiple options and the ability to tailor the scan to meet more specific criteria (Figure 8). The machine offers nine fields of view (FOV), which ranged from 40 x 40 mm to 170 x 120 mm. The unit operates at 60 to 90 kv, 1 to 10 ma, with a pulsed exposure and four voxel sizes (80, 125, 160, and 250 µm), and 47
57 offers four modes with associated time in seconds (Standard: 17.5/9.0 sec., Hi-Fidelity: 30.8/15.8 sec., Hi-Resolution: 30.8/15.8 sec., Hi-Speed: 10.5/5.4 sec.) and two rotation options (360 /180 ). The scan parameters for the Accuitomo 170 used for the adult and pediatric phantoms are given in Figure 9. Adult dosimetry was acquired using a tissue-equivalent phantom simulating the anatomy of an average adult male (ATOM Max model 711 HN; CIRS, Norfolk, VA) as was used in the research conducted by Ludlow et al., The phantom material includes detailed 3D anthropomorphic anatomy including brain, bone, larynx, trachea, sinus, nasal cavities, and teeth. The bones contain both cortical and trabecular separations. The phantom was modified by machining slots to accept Nanodot OSL dosimeters at sites corresponding to the internal tissues of interest (Figure 10). A skin surface dosimeter in the back of the neck was positioned at the vertical center of the designated slice level and taped in position. Lens of eye dosimeters were centered over and inset in the anatomic location for the lens and taped in position. Internal dosimeters were positioned vertically with the upper edge of the dosimeter slot flush with the surface of the selected slice level and held in position by friction of the dosimeter case and the phantom material at the sampled anatomic location. Adult dosimeter anatomic locations and phantom levels are shown in Figure 11. During scanning, the phantom was oriented with its section planes approximately parallel to the scan rotation plane (horizontal). A phantom position was chosen that simulated the positioning of a patient on the chin rest. With the exception of the 16 x 6.5-cm T-bone FOVs in the MiniCAT and the smaller FOV s in the Accuitomo that did not capture the chin or maxillary incisal teeth, centered FOVs were positioned to capture approximately 5 mm of soft tissue below the lower cortical border of the chin and approximately 5 mm below the maxillary central incisor edge 48
58 and the tip of the nose to offer consistency in the location and anatomy in the chosen FOV. The anteroposterior position of the phantom was established to capture approximately 5 mm of soft tissue anterior to the facial surface of the maxillary incisor crowns. Child dosimetry was acquired using a tissue-equivalent phantom simulating the anatomy of a 10-year-old child (ATOM model 706 HN; CIRS). Tissues simulated in this phantom were average soft tissue, average bone tissue, spinal cord, spinal discs, brain, and sinus. Simulated bone tissue matches age-related density. The child ATOM phantom, dosimeter anatomic locations, and child phantom levels are shown in Figure 12 A, B. With the exception of the 16 x 6.5-cm T-bone FOV, centered maxillofacial FOVs were positioned to capture approximately 5mm of soft tissue below the lower cortical border of the chin. The anteroposterior position of the phantom was established to capture approximately 5mm of soft tissue anterior to the facial surface of the maxillary incisor crown. For the 16 x 13-cm sinus views, the lower border of the FOV was positioned approximately 5 mm below the maxillary central incisor edge. For the 16 x 13-cm maxillofacial views, the tip of the nose and the lower soft tissue border of the chin were included in the FOV. Example volumes produced by the ATOM child phantom for the Xoran MiniCAT are shown in Figure 13. Representative volumes for the appropriate FOV s for the adult and child ATOM phantoms using the Accuitomo 170 unit are shown in Figure 14. One to ten exposures were used for each dosimeter run to provide a more reliable measure of radiation captured in the dosimeters. Smaller FOVs required more exposure repetitions because more dosimeters are outside the field of direct exposure and absorb only small quantities of scatter radiation. For every scan, a scout view was also acquired. Doses 49
59 recorded by the OSL dosimetry reader were divided by the number of scans to determine the exposure per examination for each dosimeter. Doses recorded by OSL dosimeters at different positions in a tissue or an organ were averaged to express the average tissue-absorbed dose in micro-grays. The products of these values and the percentage of a tissue or an organ irradiated in a radiographic examination were used to calculate the equivalent dose in micro-sieverts (µsv). For bone, the equivalent dose to the whole-body bone surface was calculated using the summation of the individual equivalent doses to the calvarium, mandible, and cervical spine. 26 The determination of these equivalent doses was based on the distribution of bone throughout the body: the mandible contains 1.3%, the calvaria 11.8%, and the cervical spine 3.4%. 8 Distribution of adult bone marrow was calculated using an average of data from Christy 9 for 25- and 40-year-olds. The mandible contains 0.8%, the calvaria 7.7%, and the cervical spine 3.8% of the adult marrow distribution. The 10-year-old child s marrow distribution was calculated as 1.1% for the mandible, 11.6% for the cranium, and 2.7% for the cervical spine, for a total of 15.4% of the total body marrow with the technique of Underhill et al. 8 (Table 2). Three locations in the calvarium were averaged to determine the calvarial dose. For bone, a correction factor based on experimentally determined mass energy attenuation coefficients for bone and muscle irradiated with mono-energetic photons was applied. An effective beam energy estimated to be 2/3rds of the peak beam energy of the x- ray unit was used to determine the bone-to-muscle attenuation ratios. 26 A linear fit (R 2 = 0.996) of ratios from 40 to 80 kv from published data produced the following equation: bone-to muscle attenuation ratio equals x kvp x 2/ Values calculated 50
60 from this equation provided bone-to-muscle attenuation ratios of 3.21 at 60 kv (90 kv[p]) and 1.97 at 80 kv (120 kv[p]). 26 The proportion of skin surface area in the head and neck region directly exposed during maxillofacial CBCT imaging is estimated at 5% of the total body to calculate the radiation-weighted dose to the skin following the procedure per Ludlow et al. 27 Likewise, muscle and lymphatic node exposures are estimated to represent 5% of the total body complement for these tissues. The proportion of the esophageal tract that is exposed was set at 10%. Other tissues of interest were calculated at 100%. 26 See Table 2 for the list of tissue percentages irradiated in the adult and child phantoms and the location of each dosimeter in the phantom. Effective Dose X-ray imaging involves only partial-body exposure. As stated previously, when only part of the body is exposed, the risk of a stochastic radiation response is not proportional to the tissue dose but rather to the effective dose (E). E is a weighted average of organ doses and can be expressed mathematically as follows: E = Σ W T x H T, where E is the summation of the products of the tissue weighting factor (W T ) (Table 1), which represents the relative contribution of that organ or tissue to the overall risk, and the radiation weighted dose (H T ). 28 To put this into perspective, Huda (2006) emphasizes that the total amount of radiation that a patient receives in any radiographic examination is best quantified by the effective dose, which is related to the risk of carcinogenesis, and with the induction of genetic effects. 29 The whole-body risk is determined by the summation of the radiation-weighted doses to all tissues or organs exposed. International Commission on Radiological Protection (ICRP) weighting factors in Table 1 were used to calculate the effective doses. 28 Tissue weighting 51
61 factors used in ICRP calculation of effective dose include 14 independently weighted tissues and 14 remainder tissues. 28 Because the uterus and the cervix are present only in females and the prostate only in males, the number used in the weighted averaging of the remainder tissues was Statistics Analysis of variance (ANOVA) of effective dose results was used to evaluate the data for significant differences caused by the adult versus the child ATOM phantom, FOV, location, and unit mode. When significant differences were found, the Tukey HSD test was used to determine which factors were significantly different from other factors. An alpha value of 0.05 was selected for all tests. The image quality indicators, modulation-transfer-function (MTF) and contrast-tonoise-ratio (CNR), were also evaluated as part of the research project. Spatial resolution is the ability of an imaging system to resolve and render on the image a small high-contrast object. Spatial frequency is expressed in line pair per millimeter (lp/mm). 32 Anatomy can be described as having spatial frequency. For example, large soft tissues such as the liver, kidney, and brain have a low spatial frequency and are easy to image. Bone trabeculae, breast microcalcifications, and contrast-filled vessels are high-frequency objects and are more difficult to image. An imaging system with higher spatial frequency has better spatial resolution. Spatial resolution in all of the digital imaging modalities is limited by the size of the pixel. No digital imaging system can image an object smaller than one pixel. 32 MTF has been applied to the description of the ability of an imaging system to render objects of different sizes onto an image. Objects with high spatial frequency are more difficult to image than then those with low spatial frequency. This is similar to saying that small objects are 52
62 more difficult to image than large objects. Regardless of the size of the object, the object is considered to be high contrast for the purpose of MTF evaluation. MTF can be viewed as the ratio of image to object as a function of spatial frequency. An ideal imaging system is one that produces an image that appears exactly as the object. Such a system would have an MTF equal to one and the ideal imaging system does not exist. It is said that the human eye can only differentiate about 10% of MTF. 32 When an imaging system is evaluated through the MTF method, the 10% MTF often is identified as the system spatial resolution 32 Using a QUART DVT AP phantom and QUART DVT TEC software (QUART, Zorneding, Germany) (Figure 14). Volumes were acquired with the different technical factors evaluated in the dosimeter portion of this study. The phantom consisted of 16-cmdiameter cylindrical slabs of acrylic plastic with polyvinyl chloride and air elements configured to permit measurements on axial images selected from the volume. Measurements included polymethylmethacrylate voxel, polymethylmethacrylate noise, homogeneity, contrast, contrast-to-noise ratio, modulation transfer function 10%, modulation transfer function 50%, and Nyquist frequency. The measurements were calculated in a user-guided, semiautomatic manner from two DICOM slices selected from the volume. Each volume was measured 3 times, and averages and standard deviations of each parameter were calculated. 26 Results Due to the substantial differences with regards to selecting options for field-of-view, exposure factors, and protocol between the MiniCAT and Accuitomo 170 machines, the data from the two units was evaluated separately. Beginning with the MiniCAT unit, Tables 3 and 4 highlight the effective dose calculations, protocol parameters, and the percentage increase for the ATOM adult and child phantoms. The 16 x 13 cm sinus and maxillofacial scans 53
63 differed only by selecting 150, 300, or 600 frames and the location of the chosen FOV. The MiniCAT machine also has a field-of view option specifically to evaluate the temporal bone (16 x 6.5 cm with pre-set exposure factors). The exposure factors of kvp, mas, and pulse remained unchanged when the number of frames were selected. Table 4 shows the protocols were identical and the increased doses ranged from 44-89%, with the child phantom effective doses, on average, 60% greater than adult phantom doses. Figure 16 is a graphic representation of the data in Table 3. Additionally, the effective doses were also calculated specifically for the thyroid gland in both the adult and child phantoms. The effective doses varied between 5.8 and 45.3 µsv for the adult and between 11.0 and µsv for the child, Table 5 and Figure 16, respectively. The increase in the thyroid effective doses for the child ranged between 61 and 120% (mean 92%) and are shown in Table 6 and Figure 18. When the child sized exposure parameters were used (3 ma) the effective dose was approximately equal to the adult effective dose. The Accuitomo 170 is a more complex machine with nine FOVs and multiple options to select for exposure factors and protocol. Table 7 demonstrates the calculated effective dose for both the adult and child phantom beginning with the smallest FOV and ending with the largest FOV (6 x 6 cm to 17 x 12 cm). For smaller FOV groups, data was acquired by modifying the protocol and location of the particular FOV. As depicted in the graph in Figure 19 these modifications can have a considerable impact on the value of the effective dose calculated for the scan. FOV is shown to have the principal influence on the eventual effective dose. However, the specific location of the FOV, as well as the imaging mode (360 vs. 180 scan, basis projections, time, and pixel size) will make contributions to the ultimate effective dose received by the phantom. Table 8 and Figure 20 demonstrate the effective dose 54
64 to the thyroid gland in both the adult and child phantom. Again, there is a definite relationship of an increasing dose associated with increasing the FOV, which in turn is modified by the changes to the imaging mode. Table 9 and Figure 21 show the dose to the thyroid gland generates a sizeable portion to the percentage increase of the final effective dose received by the child phantom based on the FOV and the modifiers previously mentioned. ANOVA of the combined adult and child phantom (Group) data from the MiniCAT unit demonstrated no significant differences in effective dose between the adult and child controlling for Location (P = and ), and a marginal difference controlling for Basis Images (P= and ). Also, no significant difference in effective dose was shown using ANOVA with the combined thyroid data selecting for Location (P = and ) and Basis Images (P = and ). However, the ANOVA analysis of the data from the Accuitomo 170 demonstrated significant differences between the effective dose delivered to the adult and child (Group) and FOV (P=.0028 and ), Position (P = and < ), and Mode (P =.0019 and ). Also, there was on average, a significant difference noted with the effective dose received by the thyroid tissue in the adult and child phantom depending on the FOV (P < and P = ), Position (P < and P < ), and Mode (P < and P = ). With the significant differences identified by ANOVA in the Accuitomo 170 data, the Tukey HSD test revealed only one factor that was different from other factors. The Tukey HSD test demonstrated that when the eight different FOVs were compared to determine their influence on effective dose, only the 140 x 100 mm and 60 x 60 mm proved to show a 55
65 significant difference. The comparison of the remaining different FOVs did not provide p values less than Tables 10, 11, 12, and13 provide the equivalent doses to tissues and organs used in the calculation of effective dose for the MiniCAT and Accuitomo 170 units, respectively. Absorbed doses in the thyroid and brain were significantly greater in the child phantom than in the adult phantoms. The doses from both the MiniCAT and Accuitomo 170 were approximately two to three times higher in the child compared to the adult for the identical FOV and exposure protocol. Table 14 contains the average parameter values and standard deviations from the analysis of the QUART phantom images. Analysis with the QUART phantom for the Accuitomo 170 demonstrated that as the FOV increased from 60 x 60 mm to 80 x 80 mm and the exposure protocol was kept the same, the CNR average decreased approximately 20% (CNR and 8.06 respectively). As the FOV enlarged to 100 x 100 mm and 140 x 100 mm, the CNR average increased from to 12.43, which is approximately a 10-20% increase from the beginning 60 x 60 mm FOV. Then finally, from 140 x 100 mm to 170 x 120 mm FOV, the CNR average remained unchanged at The average Modulation Transfer Function (MTF) 10% for the range of FOVs from 60 x 60 mm to 170 x 120 mm showed no significant change in value (P > 0.05). This phenomenon of no significant difference was also demonstrated for the MTF 50% as the FOVs enlarged (P > 0.05). The average Nyquist frequency of the FOVs showed a trend to steadily decrease which was statistically significant with a P value of < The voxel size doubled from 125 µm to 250 µm as the FOV underwent multiple increases from 60 x 60 mm to 170 x 120 mm. The size doubling occurred at the FOV that 56
66 transitioned from the 80 x 80 mm to the 100 x 100 mm size. As expected, the CNR gradually improved but was statistically significant using the Least Squares Fit only for mas when compared with voxel size and FOV width. The average MTF demonstrated no meaningful change with an increase in FOV from 60 x 60 mm to 170 x 120 mm. Discussion The Xoran MiniCAT is a compact, upright volume computed tomography system designed for high-resolution, bone window imaging of the sinuses, temporal bones, and skull base. MiniCAT provides immediate access to images at the patient s point-of-care resulting in a faster diagnosis and treatment. 33 The MiniCAT was first released to the commercial market in As was customary at the time, the unit has only standard imaging protocols available with very few options offered to customize the scan to the individual patient and particular needs of the prescribing doctor. Alternatively, the Accuitomo 170 CBCT unit is a more versatile imaging machine, which is also upright and compact. It has four imaging modes, nine field-of-view sizes, five resolution levels (125, 160, 200, or 250 µm), and zoom reconstruction to 80 µm voxel size. These features allow high-resolution imaging for just a few teeth, the sinuses, the temporomandibular joint TMJ, and to the entire head and neck area. Like other CBCT units, the Accuitomo 170 provides prompt access to the images and reconstruction software that permits curved MPR representations and 3D reconstruction. This machine has many more features, which is more typical of current production units designed for use in a wide variety of applications. In this study, ATOM phantoms and OSL dosimeters were employed based on their accuracy and procedural ease as validated in a recent publication by Ludlow et al. 26 The use 57
67 of these standardized phantoms with consistent tissue equivalency and OSL dosimeters that can be read multiple times in minutes without loss of data, then expunged and reused, will allow the results of similar testing using other CBCT units to be reliably compared. Furthermore, the results of any study using ATOM phantoms and OSLs can be readily duplicated to verify the findings if desired. Last, because the report by Ludlow et al 26 indicated that the comparisons of thermoluminescent dosimeters (TLDs) and OSLs yielded differences of less than 2% in the calculation of effective dose, the results can also be equitably compared with data obtained with TLDs. Use of CBCT is greatly expanding in popularity, with many more practitioners purchasing units each year. Use of these units will inevitably generate more images on an annual basis. Additionally, potential applications of these units are escalating beyond use as a diagnostic aid into a tool to fabricate surgical guides, mill restorations, and manufacture custom orthodontic appliances. 12 The increased use has generated criticism regarding the potential impact on the patient population and in particular the pediatric subset of patients. Our results postulate that the overall average effective dose for the child phantom from the MiniCAT machine is 60% greater than the adult dose and 92% greater to the thyroid gland specifically. The Accuitomo 170 data reveals the average effective dose for the child phantom is 25% higher than the adult phantom and 116% greater to the thyroid gland of the child phantom when default programming is used. When child settings are used the effective dose to the child is nearly equal to the adult phantom. Clearly, there can be a notable and striking average increase in effective dose to the child phantom, but when you add in the fact that the radiosensitivity of the tissues in the pediatric patient is 2-5 times higher than the adult, 16 the risk of stochastic effects is further amplified. Use of a reduced ma setting can 58
68 reduce child doses by 40% (5 ma to 3 ma). Because this is not the default setting for the unit, it is critically important for the prescribing practitioner and radiologic technician, or dental assistant in the dental setting, to know this information and apply the principles of ALARA when obtaining CBCT radiographic images on a pediatric patient. The application of this knowledge in a clinical setting entails selecting the smallest FOV necessary to capture the desired anatomy, using the child exposure settings if available on the unit, manually adjusting the exposure factors to account for the child versus the adult patient, decreasing the number of basis images obtained or allowing for a diminished resolution, selecting a 2D imaging technique, eliminating the radiographic exam altogether in favor of taking photographs, or obtaining the needed information in previous radiographs if available. It is imperative to understand why there are differences in the effective dose delivered to the adult and child phantoms. When the equivalent dose data for each organ position in the adult and child phantoms is analyzed, the increase in effective dose to the child is predominantly due to the dosimeters representing the thyroid gland site (Figure 22). The values calculated for thyroid dose in the adult ATOM phantom are based on readings from two dosimeters positioned at level 10. This location marks the site where the majority of the glandular tissue of both lobes and the thyroid isthmus is anatomically situated. The dosimeter positions in the child ATOM phantom are slightly different and are based on two dosimeters in level 9 averaged with one dosimeter positioned slightly higher in level 8. This alteration in position of the dosimeters in the two ATOM phantoms accounts for the minor but significant difference in propinquity of the thyroid gland to the inferior border of the mandible. The thyroid gland is closer to the lower border of the mandible in the child and, therefore, receives more direct exposure and scatter radiation when the base of the FOV is positioned 59
69 beneath the chin. Thyroid tissue was given a weighting factor value of.04 by the 2007 ICRP regulations and subsequently is responsible for sizable input when calculating effective dose to the head and neck during CBCT examinations. Unlike on ATOM phantoms, which are stiff and inflexible, actual patients in most cases can lift or rotate their chin superiorly, thereby creating a larger gap between the lower border of the mandible and the thyroid gland, which enables less of a direct exposure to the gland during imaging. This technique, which uses the rigid chin cup, is of limited value if the imaging will also be used for cephalometric analysis for orthodontic treatment or orthognathic surgery, due to the deformation of the soft tissue of the chin and cervico-mental region of the neck. The data from the phantoms also provides insight into how the effective dose is reduced when a smaller FOV is positioned in the region of the posterior maxilla. This is a particularly evident trend in the Accuitomo 170 data when comparing the effective dose between the maxillary posterior and the mandibular posterior for the 60 x 60 mm, 100 x 50 mm, 140 x 50 mm, and 170 x 50 mm FOVs. Again, the distance away from the thyroid gland is the primary causation of this phenomenon (Figures 7, 8, and 9). In addition to the data regarding FOV dimension and the location of the FOV in the head and neck region, it is important to study the Tables 3 9 and identify the increase or reduction in effective dose delivered to the phantom based on the modifications in the exposure parameters of milli-amperage (ma), time (s), and the number of basis projections when the different modes are selected. The Accuitomo 170 unit, in particular, has the ability to choose between four different modes High Speed, Standard, High Resolution, and High Fidelity. However, the MiniCAT only allows for some modification by offering a selection 60
70 of 150, 300, or 600 basis projections for the scan. The data for both machines illustrates an inclination toward an increase in effective dose when the modes above Standard (i.e., High Resolution and High Fidelity) are used with the Accuitomo 170 and above 150 basis images (i.e., 300 or 600 basis images) for the MiniCAT. This is due to the kvp being held constant for both machines (MiniCAT 120kVp, and 90 kvp for the Accuitomo) and only the time being increased. The increase in time (s) results in increased exposure which increases the dose to the patient. The MiniCAT data in Tables 3 6 indicates there was a direct linear relationship with the number of frames chosen for the scan and the dose to the phantom. These results are to be expected because a doubling of mas (e.g , 24.15, and 48.3) occurs concomitantly with a doubling of effective dose. Over the previous few years there has been an important and growing emphasis on lowering the dose of ionizing radiation used for diagnostic examinations. The Image Gently campaign was developed in 2007 and the focus of the alliance was to raise awareness of the opportunities to lower radiation dose in the imaging of children. The alliance website was launched in January 2014 and is an excellent resource for patients and practitioners, replete with guidelines for prescribing dental radiographs and links to position papers, an advisory statement from the American Dental Association (ADA), and the FDA recommendations. The main principles of justification and optimization are recommended for the protection of patients undergoing radiographic examinations. However, generous reductions in dose have to be balanced by maintaining adequate diagnostic image quality. There is an inevitable compromise between image quality and dose. There are very few, if any, published guidelines that correlate exposure parameters that will guarantee a very low 61
71 dose with a universally accepted superior diagnostic image. This is partly due to the subjective nature of the radiologist s preference for image appearance. More research is needed to develop national standards for image quality acquisition. Germany is the first country to develop national standards for image quality testing of dental CBCT units. 26 The QUART DVT test phantom was developed in Germany and is the first commercially available phantom that complies with those standards. The QUART DVT is a universal test phantom for quality assurance and quality control (QA/QC) for dental CBCT equipment. It has an automatic software evaluation program that evaluates Contrast, Noise, Homogeneity, MTF, Nyquist Frequency, and Contrast-to-Noise Ratio and complies with the European Commission on Radiological Protection No The QUART phantom was used in this study to evaluate the objective elements of image quality contrast-to-noise-ratio (CNR) and modulation transfer function (MTF) of the Accuitomo 170 (Table 14). The data obtained allowed for several patterns to be deduced. When the voxel size and FOV remain constant, an increase in CNR tends to occur with an increase in exposure (mas). This process happens when there is a shift in basis images from 250 to 500 or an alteration in time (s) when transitioning between High Speed, Standard, High Resolution, and High Fidelity modes. Adjustments in CNR have been shown to be associated with perception of image quality change by observers. 42 When CNR increases, the overall quality of the image is more visually appealing. Reductions in voxel size or increases in FOV would be expected to decrease CNR if other technical parameters are constant. This trend was not statistically significantly with the Accuitomo 170. As the FOV becomes larger, there is often an automatic increase in voxel size (125, 160, 250 µm) that compensates for the reduction in CNR that would be expected to follow. 62
72 Analysis of the MTF 10% and MTF 50% data did not identify any statistically significant deviations that could be associated with variations to voxel size. However, the Nyquist frequency did reflect a small, gradual, steady reduction as the voxel size and FOV increased. At this point, only basic, fundamental tendencies are identified using the QUART phantom with the Accuitomo 170. Further research will be required to correlate quantitative measures and individual preferences for image quality with diagnostic efficacy. It is beyond the scope of this paper to present a thorough review of the literature regarding thyroid cancer trends in the United States. However, commonly exposed to radiation by CBCT radiography for dental imaging. A February 2014 article published in JAMA Otolaryngology, Head and Neck 43 notes that since 1975 the incidence of thyroid cancer has nearly tripled, from 4.9 to 14.3 per 100,000 individuals. The absolute increase was almost four times greater in women than men. No information regarding etiology was mentioned in the article. The increased incidence has been labeled an epidemic of diagnosis rather than disease. The mortality rate has remained stable because much of the diagnosed thyroid cancer is the papillary type, which has a very low incidence of mortality. This is an example of improved diagnostic technology, including radiographic imaging, leading to the ability of distinguishing more disease. Not all lesions, especially in older adults, may require treatment. Other studies have noted a correlation between exposure to dental x-rays and increased risk of thyroid cancer. Study design weaknesses, small sample sizes, and long periods between exposure and cancer detection make it difficult to link exposure to causation
73 Yuri Nikiforov reported on a cohort of children exposed to radiation from the Chernobyl nuclear power plant accident children and adolescents with thyroid cancer demonstrated an increased risk of thyroid cancer that was dose-dependent. 34 The youngest children are the most sensitive to radiation-induced carcinogenesis, and the minimal latent period for thyroid cancer development after exposure was 4 years. The risk of radiationinduced thyroid cancer development is also age-dependent and greatest at age 1, with a 237- fold increase. However, there is still a significant six-fold increase in children aged The malignant tumors that have resulted are commonly well differentiated histologically, progress slowly, and can be managed successfully with surgical excision or treated with radioactive iodine in the case of metastasis. It is estimated that approximately 5% of the radiation induced thyroid cancers result in mortality. 35 Conclusion A wide range of imaging options are available to the user of CBCT. A thorough understanding of the technical parameters that are available in the particular machine that is used is important for a balance of diagnostic quality and patient dose. Because of their increased sensitivity to radiation, particular attention should be given to adjusting exposures for children. When at all possible, the smallest field-of-view capturing only the required anatomic structures, the lowest exposure settings, consistent with the diagnostic task will help comply with the One size does not fit all so when we image, let s image gently! mantra from the Image Gently campaign. More selection criteria are becoming available as the ADA and dental specialty organizations are partnering with the American Academy of Oral and Maxillofacial Radiology to recommend imaging guidelines. Further research with 64
74 QUART phantom type instruments will allow the development of improved universal parameters for optimization of contrast-to-noise ratio and modulation-transfer-function. The articles cited in this study regarding the thyroid gland shed some light on the issues of thyroid cancer that still need further investigation. Nevertheless, there is agreement that thyroid cancer can be caused by low-dose radiation, children have an increased radiosensivity and are a vulnerable subset, and close surveillance is necessary because of the known short duration time in which malignant lesions can develop. Being a responsible steward of radiology and respecting the power of ionizing radiation will benefit both the patient and practitioner alike. 65
75 References 1. Ionizing Radiation Exposure of the Population of the United States: Recommendations of the National Council on Radiation Protection and Measurements. 2009; Bushberg JT, Seibert JA, Leidholdt Jr EM, Boone JM, The Essential Physics of Medical Imaging, 3 rd ed, ch. 10, p312, Larson DB, Johnson LW, Schnell BM, Goske MJ, Salisbury SR, Forman HP. Rising use of CT in child visits to the emergency department in the United States, Radiology Apr Hayes JC, Use and Radiation Exposure in Children. Medscape Radiology, June 17, Amis ES, Butler PF, Applegate KE. American College of Radiology White Paper on Radiation Dose in Medicine. J Am Coll Radiol. 2007; 4: Valentin J, The 2007 recommendations of the International Commission on Radiological Protection: ICRP Publication 103. Ann ICRP. 2007; 37: Huppmann MV, Johnson WB, Javitt MC. Radiation risks from exposure to chest computed tomography. Seminars in Ultrasound, CT and MRI. 2010; 31(1): pp Underhill TE, Chilvarquer I, Kimura K, Langlais RP, McDavid WD, Preece JW, et al. Radiobiologic risk estimation from dental radiology. Part I. Absorbed doses to critical organs. Oral Surg Oral Med Oral Pathol 1988;66: Cristy M. Active bone marrow distribution as a function of age in humans. Phys Med Biol 1981;26: Donnelly LF, Emery KH, Brody AS, et al. Minimizing radiation dose for pediatric body applications of single detector helical CT: strategies at a large children s hospital. Am J Roentgenol. 2001; 176: Berrington de Gonzalez A, Darby S. Risk of cancer from diagnostic x-rays: estimates for the UK and 14 other countries. Lancet. 2004; 363(9406): Bogdanich W, McGinty JC. Radiation worries rise with 3-D dental images. The New York Times, November 23, Available at: Accessed April 23, Smith-Bindman R, Lipson J, Marcus R, Kim KP, Mahesh M, Gould R, Berrington de Gonzalez A, Miglioretti DL. Radiation dose associated with common computed tomography examinations and the associated lifetime attributable risk of cancer. Arch Intern Med 2009;169:
76 14. Ludlow JB, Davies-Ludlow LE, Brooks SL, Howerton WB. Dosimetry of 3 CBCT devices for oral and maxillofacial radiology: CB Mercuray, NewTom 3G and i-cat. Dentomaxillofac Radiol 2006;35: Ludlow JB, Ivanovic M, Hill C. Comparative dosimetry of dental CBCT devices and 64 slice CT for oral and maxillofacial radiology. Oral Surg Oral Med Oral Pathol Endod. 2008; 106: Brenner D, Elliston C, Hall E, Berdon W. Estimated risks of radiation-induced fatal cancer from pediatric CT. AJR Am J Roentgenol 2001;176: Bushberg JT, Seibert JA, Leidholdt Jr EM, Boone JM, The Essential Physics of Medical Imaging, 3rd ed, ch. 21, p839, International Commission on Radiological Protection, Recommendations of the ICRP. Annals of the ICRP 37 (2-4), Publication 103, World Health Organization, International Agency for Research on Cancer. Overall evaluations of carcinogenicity to humans, list of all agents evaluated to date. Available at Accessed May 10, US Department of Health and Human Services, Public Health Service, National Toxicology Program. Report on Carcinogens. 11th ed. 7FEC50709CB4C932. Accessed May 10, Benavides E, Rios HF, Ganz SD, et al. Use of cone beam computed tomography in implant dentistry: the International Congress of Oral Implantologists Consensus Report. Implant Dent. 2012; 21: Tyndall DA, Price JB, Tetradis S, et al. Position paper of the American Academy of Oral and Maxillofacial Radiology on selection criteria for the use of radiology in dental implantology with emphasis on cone beam computed tomography. Oral Surg Oral Med Oral Pathol Oral Radiol Endod. 2012; 113: Kim SH, Kang JM, Choi B, Nelson G. Clinical application of a stereolithographic surgical guide for simple positioning of orthodontic mini-implants. World J Orthod. 2008;9: Lin EY. SureSmile applies CBCT to custom orthodontic thearapy. 2008; Kapila S, Conley RS, Harrell WE Jr. The current status of cone beam computed tomography in orthodontics. Dentomaxillofac Radiol 2011;40: Ludlow JB, Walker C. Assessment of phantom dosimetry and image quality of i-cat FLX cone-beam computed tomography. Am J Orthod Dentofacial Orthop 2013;144:
77 27. Ludlow JB, Davies-Ludlow LE, Brooks SL. Dosimetry of two extraoral direct digital imaging devices: NewTom cone beam CT and Orthophos Plus DS panoramic unit. Dentomaxillofac Radiol 2003;32: Valentin J. The 2007 recommendations of the International Commission on Radiological Protection. Publication 93. Ann ICRP 2007;37: Huda W: Medical radiation dosimetry. In Radiological Society of North America Categorical course in diagnostic radiology physics: from invisible to visible the science and practice of x-ray imaging and radiation dose optimization, pp 29-39, Chicago 2006, Radiologic Society of North America. 30. Brenner DJ, Hall EJ. Computed tomography--an increasing source of radiation exposure. N Engl J Med 2007;357: White SC, Pharoah MJ, Oral Radiology: Principles and Interpretation, 6 th ed, p Bushong SC, Radiologic Science for Technologists: Physics, Biology, and Protection, 9 th ed, ch. 28, Xoran Customer Brochure, Xoran Technologies, Inc Nikiforov Y. Radiation Induced Thyroid Cancer: What We Have Learned From Chernobyl, Endocrine Pathology, vol. 17, no. 4, , Ron E, Lubin JH, Shore RE, Thyroid cancer after exposure to external radiation: a pooled analysis of seven studies. Radiat Res. 1995;141: Clarke, R.H.; and J. Valentin (2009). The History of ICRP and the Evolution of its Policies. Annals of the ICRP. ICRP Publication (1): pp Radiological Protection ISBN , Evolution of ICRP Recommendations 1977, 1990 and 2007, Changes in Underlying Science and Protection Policy and their Impact on European and UK Domestic Regulation, Nuclear Energy Agency, Ludlow JB, Davies-Ludlow L, White SC, Patient Risk Related to Common Dental Radiographic Examinations: The Impact of 2007 International Commission on Radiographic Protection Recommendations Regarding Dose Calculation, JADA 2008; 139(9): Preston-Martin S, White SC. Brain and salivary gland tumors related to prior dental radiography: implications for current practice. JADA 1990;120(2): Thilander-Klang A, Helmrot E, Methods of Determining the Effective dose in Dental Radiology, Radiation Protection Dosimetry (2010). Vol. 139, No. 1 3, pp
78 41. Watanabe H, Honda E, Tetsumura A, Kurabayashi T. A comparative study for spatial resolution and subjective image characteristics of a multi-slice CT and a cone-beam CT for dental use. Eur J Radiol 2011;77: Lin Y, Wang X, Sehnert WJ, Foos DH, Barski L, Samei E. Quantification of radiographic image quality based on patient anatomical contrast-to-noise ratio: a preliminary study with chest images. Proc. SPIE 7627, Medical Imaging 2010: Image Perception, Observer Performance, and Technology Assessment, 76271F (March 3, 2010). 43. Davies L, Welch G, Current thyroid Cancer Trends in the United States, JAMA Otolaryngol Head Neck Surg, Published online February 20, Memon A, Godward S. Dental x-rays and the risk of thyroid cancer: A case control study, Acta Oncologica, 2010; 49: Physical aspects of irradiation. NBS handbook 85. Washington, DC: US Government Printing Office;

79 APPENDIX. FIGURES AND TABLES Figure 1. CT procedures per year in the United States Figure 2. Source of per capita contribution of of radiation exposure in the United States 70
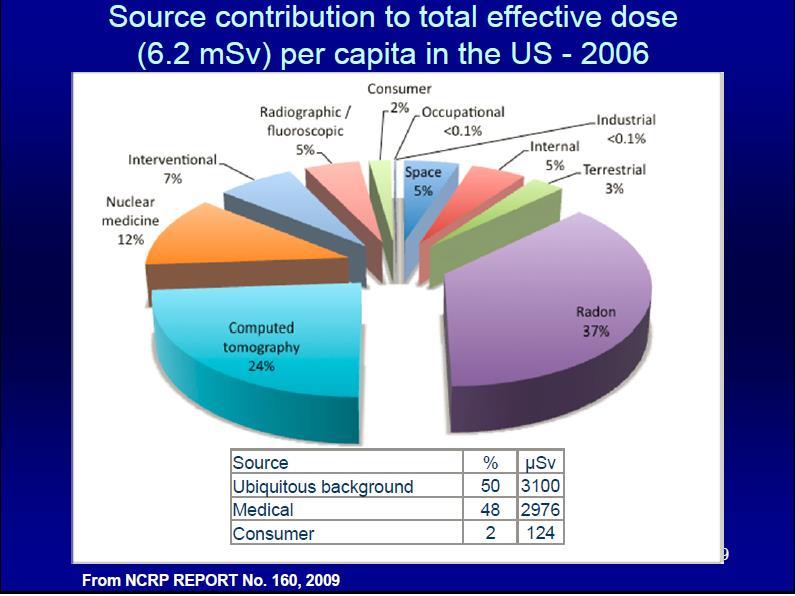
80 71
 dosimeters. B.")

81 Figure 3. A. Optically Stimulated Luminescent (OSL) dosimeters. B. Microstar Reader Figure 4. MiniCAT CBCT and viewing station (Xoran Technologies, Ann Arbor, MI) Courtesy of Xoran Technology Sales and Marketing Brochure 72

 Sinus and Maxillofacial 16 x")
82 Figure 5. MiniCAT fields of view (Courtesy of Xoran Technology Sales and Marketing Brochure) Sinus and Maxillofacial 16 x 13 cm Temporal Bone 16 x 6.5 cm 73


83 Figure 6. Protocols per manufacturer Courtesy of Xoran Technology Sales and Marketing Brochure Figure 7. Accuitomo 170, J. Morita Corporation Courtesy of J. Morita Corporation Sales and Marketing Brochure 74

84 Figure 8. Accuitomo 170: Nine fields of view Courtesy of J. Morita Corporation Product Brochure 75

85 Figure 9. Accuitomo 170 acquisition parameters Courtesy of J. Morita Corporation Product Brochure 76

86 Figure 10. Adult ATOM Phantom slices with machined slots for OSL dosimeters 77
 2 Mid brain (2) 3 Calvarium left (3) 4 Mid brain (3) 5 Calvarium posterior (4) 6 Pituitary (4) 7 Right lens of eye (4-5) 8 Left lens of eye")
87 Figure 11. Locations of Optically Stimulated Luminescent (OSL) dosimeters in Adult ATOM Max model 711 Phantom. OSL ID Level of OSLD location 1 Calvarium anterior (2) 2 Mid brain (2) 3 Calvarium left (3) 4 Mid brain (3) 5 Calvarium posterior (4) 6 Pituitary (4) 7 Right lens of eye (4-5) 8 Left lens of eye (4-5) 9 Right ethmoid (5 10 Left maxillary sinus (6) 11 Oropharyngeal airway (7) 12 Right parotid (7) 13 Left parotid (7) 14 Right ramus (7) 15 Left ramus (7) 16 Left back of neck (8) Phantom Levels 17 Right submandibular gland (8) 18 Left submandibular gland (8) 19 Center sublingual gland (8) 20 Center C spine (8) 21 Lateral neck - left (9) 22 Thyroid left (10) 23 Thyroid - right (10) 24 Esophagus (10) 78
 1 Calvarium anterior (2) 2 Calvarium left (2) 3 Calvarium posterior (2) 4 Mid brain (2) 5 Mid brain (3) 6 Pituitary (4) 7 Right orbit (4) 8 Right lens")
88 Figure 12A. Child ATOM Phantom with OSL dosimeter locations OSL ID No. Child Phantom Location (level of OSLD location) 1 Calvarium anterior (2) 2 Calvarium left (2) 3 Calvarium posterior (2) 4 Mid brain (2) 5 Mid brain (3) 6 Pituitary (4) 7 Right orbit (4) 8 Right lens of eye (4-5) 9 Left lens of eye (4-5) 10 Right maxillary sinus (5) 11 Left nasal airway (5) 12 Right parotid (6) 13 Left parotid (6) 14 Left back of neck (6) 15 Right ramus (7) 16 Left ramus (7) 17 Right submandibular gland (7) 18 Left submandibular gland (7) 19 Center sublingual gland (7) 20 Center C spine (8) 21 Thyroid superior left (8) 22 Thyroid left (9) 23 Thyroid - right (9) 24 Esophagus (9) Phantom Levels 79

89 Figure 12B. Child ATOM Slices with machined OSL dosimeter locations 80

90 Figure 13. Field of view examples acquired from Xoran MiniCAT volumes Child 16 x 13 cm Maxillofacial (MF) 300 Child 16 x 13 cm MF

91 Child 16 x 13 cm Sinus 300 Child 16 x 13 cm Sinus

92 Child 16 x 6.5 cm T-bone Figure 14. Examples of representative FOVs from the Accuitomo 170; adult and child Adult 10 x 10 cm 83


93 Adult 14 x 10 cm Adult 17 x 12 cm 84


94 Child 10 x 10 cm Child 14 x 10 cm 85


95 Child 17 x 12 cm Figure 15. QUART DVT_AP CBCT image quality system: A, phantom; B, sample axial images of polyvinyl chloride and air elements (top) and acrylic plastic layer (bottom); C, analysis software window for calculation of the Nyquist frequency; D, analysis software window for calculating homogeneity. 86
96 EFFECTIVE DOSE (µsv) EFFECTIVE DOSE (µsv) Figure 16. Graphic representation of effective dose using the MiniCAT and ATOM Phantom MiniCAT - Effective Dose using ATOM Phantom Sinus Sinus Sinus Maxillofacial Maxillofacial Maxillofacial Temporal 16 x x x x x x x 6.5 FOV / LOCATION / FRAMES Adult (µsv) Child (µsv) Figure 17. Effective doses for thyroid gland in adult and child ATOM Phantom MiniCAT - Thyroid Effective Dose using ATOM Phantom Sinus Sinus Maxillofacial Maxillofacial Temporal 16 x x x x x 6.5 FOV / LOCATION / FRAMES Adult (µsv) Child (µsv) 87
97 PERCENT INCREASE Figure 18. MiniCAT % increase in thyroid effective dose between adult and child Phantom 140 Percent Increase of Thyroid Effective Dose From Adult to Child using ATOM Phantom Sinus Sinus Maxillofacial Maxillofacial Temporal 16x13 16x13 16x13 16x6.5 16x13 FOV / LOCATION / FRAMES 88
98 88 Figure 19. Accuitomo 170 effective dose for adult and child ATOM Phantom
99 High Resolution 360 High Resolution 360 High Resolution 180 Standard 360 High Resolution 360 High Fidelity 360 High Fidelity 360 High Fidelity 360 High Fidelity 360 High Fidelity 360 High Fidelity 360 High Fidelity 360 High Fidelity 360 High Fidelity 360 High Fidelity 360 Standard 180 High Fidelity 180 Standard 360 High Fidelity 360 Effective Dose (µsv) Figure 20. Accuitomo 170 effective dose for thyroid using the adult and child ATOM Phantom Accuitomo 170 Adult and Child Thyroid Dose max posterior max mand anterior mand posterior mand posterior mand posterior posterior mand max arch arch full arch mand max arch mand arch max arch arch full arch full arch full arch full arch full arch full arch 60 x H 60 mm 60 x H 60 mm 60 x H 60 mm 60 x H 60 mm 60 x H 60 mm 60 x 100 x100 x 80 x 140 x140 x170 x170 x100 x140 x170 x170 x170 x170 x H 60 H 50 H 50 H 80 H 50 H 50 H 50 H 50 mm mm mm mm mm mm mm mm FOV / Protocol H 100 mm H 100 mm H 120 mm H 120 mm H 120 mm H 120 mm Thyroid dose Adult 90
100 90 High Resolution 360 High Resolution 360 High Resolution 180 Standard 360 High Resolution 360 High Fidelity 360 High Fidelity 360 High Fidelity 360 High Fidelity 360 High Fidelity 360 High Fidelity 360 High Fidelity 360 High Fidelity 360 High Fidelity 360 High Fidelity 360 Standard 180 High Fidelity 180 Standard 360 High Fidelity 360 Effective Dose (µsv) Figure 21. Accuitomo 170: Percent thyroid contribution to effective dose for adult and child ATOM Phantom Accuitomo 170 Adult and Child Percent Thyroid Contribution max. post. 60 x H 60 mm max. ant. 60 x H 60 mm mand. post. 60 x H 60 mm mand. post. 60 x H 60 mm mand. post. 60 x H 60 mm mand. post. 60 x H 60 mm mand. arch. max. arch 100 x H 100 x H 50 mm 50 mm full arch 80 x H 80 mm mand. arch 140 x H 50 mm max. arch 140 x H 50 mm FOV / Protocol mand. arch 170 x H 50 mm max. arch 170 x H 50 mm % thyroid Contribution adult % thyroid contribution child full arch 100 x H 100 mm full arch 140 x H 100 mm full arch 170 x H 120 mm full arch 170 x H 120 mm full arch 170 x H 120 mm full arch 170 x H 120 mm

101 Figure 22. Comparison of thyroid level in child and adult. The red line denotes the lower edge of the volume. 92
CT Scanning Protocol For V2R Guided Surgery Solutions
 CT Scanning Protocol For V2R Guided Surgery Solutions 2 V2R CT Scanning Protocol \\ Contents Contents General requirements... 3 V2R Dual Scan Protocol... 5 V2R Single Scan Protocol... 8 Overview... 10
RADIATION PROTECTION IN DIAGNOSTIC AND INTERVENTIONAL RADIOLOGY. L19: Optimization of Protection in Mammography
 IAEA Training Material on Radiation Protection in Diagnostic and Interventional Radiology RADIATION PROTECTION IN DIAGNOSTIC AND INTERVENTIONAL RADIOLOGY L19: Optimization of Protection in Mammography
CS 9300 Family. The power of flexibility
 CS 9300 Family The power of flexibility The new CS 9300 digital imaging system from Carestream Dental take the guesswork out of examinations The all-in-one CS 9300 is the most versatile multimodality imaging
THE TUFFEST STUFF CT REGISTRY REVIEW Live Lecture Seminar SATURDAY CURRICULUM
 1. The CT Imaging Chain-10 major components & their functions a. The x-ray tube b. Generator c. Filter d. Pre-patient collimator e. Pre-detector collimator f. Detector system g. Analog to digital converter
True Low Dose. Exact time to display image on screen may vary upon computer and network configuration.
 RAYSCAN ALPHA PLUS True Low Dose Cone Beam CT Industry Leading Resolution High resolution images provide all the clinical information needed while keeping radiation exposure low. Endodontics - Smallest
The Role of. 54 MARCH 2016 // dentaltown.com. radiology feature. by Deepak Gupta, MDS
 The Role of Imaging by Deepak Gupta, MDS Dr. Deepak Gupta completed his post graduation in oral medicine and maxillofacial radiology in 2011. He is currently an Associate Professor/ Reader in the Department
X-Ray & CT Physics / Clinical CT
 Computed Tomography-Basic Principles and Good Practice X-Ray & CT Physics / Clinical CT INSTRUCTORS: Dane Franklin, MBA, RT (R) (CT) Office hours will be Tuesdays from 5pm to 6pm CLASSROOM: TIME: REQUIRED
Head to new heights with your imaging SCANORA 3D
 SCANORA 3D Head to new heights with your imaging Benefits at a glance The solution for dentomaxillofacial and ENT imaging Easy Patient seated for added stability during exposure. Clear, self-explinatory
THE WAIT IS OVER CS D. 3D imaging is now available for everyone
 THE WAIT IS OVER CS 8100 3D 3D imaging is now available for everyone COMPLEXITY IS NO LONGER THE STANDARD NOW THERE ARE MANY REASONS TO MOVE TO 2D/3D IMAGING Now it s possible to experience nothing but
CT Imaging at the Point-of-Care
 ENGLISH True Dedication The new Planmed Verity Extremity CT Scanner revolutionizes extremity CT imaging. The compact unit brings 3D imaging at emergency departments, orthopedic clinics or trauma centers
Dental Cone Beam CT. What is Dental Cone Beam CT?
 Scan for mobile link. Dental Cone Beam CT Dental cone beam computed tomography (CT) is a special type of x-ray equipment used when regular dental or facial x-rays are not sufficient. Your doctor may use
CT SCAN PROTOCOL. Shoulder
 CT SCAN PROTOCOL Shoulder Purpose and Summary CT images made with this protocol are used to provide the orthopedic surgeon with a detailed 3D anatomical reconstruction of the patient s scapula and proximal
The Optimum Choice for Implantologist
 The Optimum Choice for Implantologist What is essential for your practice? What s the best way to choose a 3D X-ray machine for implant treatment planning? 02 Doctor says.. There are diagnostic limitations
Scientific Affairs. Scientific Affairs
 The use of cone-beam computed tomography in dentistry : An advisory statement from the American Dental Association Council on Scientific Affairs The American Dental Association Council on Scientific Affairs
PERSPECTIVES OF THE TOOTH RESTORATION TECHNOLOGY BASED ON THE COMPUTED TOMOGRAPHY DATA
 PERSPECTIVES OF THE TOOTH RESTORATION TECHNOLOGY BASED ON THE COMPUTED TOMOGRAPHY DATA Maxim Putrik *, Vladimir Ivanov, Igor Antsygin Federal State Autonomous Educational Institution of Higher Education
The Quality Leader in 3D Cone Beam CT
 The Quality Leader in 3D Cone Beam CT The Complete 2-in-1 or 3-in-1 Multi-modality Solution PreXion, with over 15 years of innovation in the medical and dental fields, introduces the PreXion3D Eclipse.
Agenda: Dental Cone Beam Imaging
 Cone Beam Imaging Agenda: Dental Cone Beam Imaging *Definition and Functionality *Usage and diagnostics benefits *Comparative radiation information *Federal regulatory responsibilities: manufacturing *State
Radiologic Imaging Magnetic Resonance Imaging (MRI)
") Radiologic Imaging X-ray has always been the golden rule in diagnosing and treating podiatric patients. Unfortunately, for some patients the diagnosis is not as evident. That is when we need to utilize
Radiologic Imaging X-ray has always been the golden rule in diagnosing and treating podiatric patients. Unfortunately, for some patients the diagnosis is not as evident. That is when we need to utilize
A Snapshot on Nuclear Cardiac Imaging
 Editorial A Snapshot on Nuclear Cardiac Imaging Khalil, M. Department of Physics, Faculty of Science, Helwan University. There is no doubt that nuclear medicine scanning devices are essential tool in the
Managing Cone Beam CT Dose in Paediatric Dental Imaging
 Ask EuroSafe Imaging Tips & Tricks Paediatric Imaging Working Group Managing Cone Beam CT Dose in Paediatric Dental Imaging Raija Seuri (HUS Medical Imaging Center, FI) Cristina Almeida (Centro Hospitalar
ENGLISH. Cefla s.c. - Via Selice Provinciale 23/a, Imola - Italy Tel
 09-2017 NVGEGB161S00 According to the regulations in force, some products and/or features may have different availability and characteristics in areas outside of the European Union. Please contact your
Cone Beam 3D Imaging
 Cone Beam 3D Imaging NewTom Sets the Standard in 3D Maxillofacial Imaging Cone Beam 3D Imaging The Global Market Leader The Inventors n of Cone Beam 3D In 1996, QR srl developed the first generation of
Dental Radiography Core Subject. Digital Radiography
 Dental Radiography Core Subject Digital Radiography Aims: To develop an understanding of the history of digital radiography, the different types of digital x-rays and the advantages and disadvantages of
CT Imaging of skeleton in small animals. Massimo Marenzana
 CT Imaging of skeleton in small animals Massimo Marenzana Introduction Osteoporosis is a disease in which bones become fragile and more likely to break. It can be defined as a systemic skeletal disease
English. Perfect Vision
 English Perfect Vision Everything becomes clearer and simpler with a big F.O.V. The complete dentomaxillofacial volume ready for your diagnosis One scan provides you with an incredible amount of information
Proceeding of the SEVC Southern European Veterinary Conference
 www.ivis.org Proceeding of the SEVC Southern European Veterinary Conference Oct. 17-19, 2008 Barcelona, Spain http://www.sevc.info Reprinted in the IVIS website with the permission of the SEVC www.ivis.org
Principles of Ultrasound. Cara C. Prideaux, M.D. University of Utah PM&R Sports Medicine Fellow March 14, 2012
 Principles of Ultrasound Cara C. Prideaux, M.D. University of Utah PM&R Sports Medicine Fellow March 14, 2012 None Disclosures Outline Introduction Benefits and Limitations of US Ultrasound (US) Physics
Dental Line. 3D digital panoramic system. radiology ahead
 Dental Line 3D digital panoramic system radiology ahead new generation 3D digital panoramic unit 3D imaging s value available for anyone Following the incredible success of the innovative digital panoramic
CASE REPORT. CBCT-Assisted Treatment of the Failing Long Span Bridge with Staged and Immediate Load Implant Restoration
 Computer Aided Implantology Academy Newsletter - Newsletter 20 - July 2009 CASE REPORT CBCT-Assisted Treatment of the Failing Long Span Bridge with Staged and Immediate Load Implant Restoration Case Report
Breast Tomosynthesis. What is breast tomosynthesis?
 Scan for mobile link. Breast Tomosynthesis Breast tomosynthesis is an advanced form of mammography, a specific type of breast imaging that uses low-dose x-rays to detect cancer early when it is most treatable.
COMMON COURSE OUTLINE: Course discipline/number/title: DS 1300: Dental Radiology
 COMMON COURSE OUTLINE: Course discipline/number/title: DS 1300: Dental Radiology A. CATALOG DESCRIPTION 1. Credits: 3 2. Hours/Week: 2 hour lecture, 2 hour lab 3. Prerequisites (Course discipline/number):
Digital Imaging from a new perspective
 TREATMENT CENTRES HANDPIECES HYGIENE SYSTEMS X-RAY SYSTEMS CEREC TREATMENT CENTRES HANDPIECES HYGIENE SYSTEMS X-RAY SYSTEMS CEREC SIRONA CREATING AND MAINTAINING VALUE. You are right to expect a great
RADIATION DOSES FOR X-ray DIAGNOSIS TEETH IN DENTAL MEDICINE
 RADIATION DOSES FOR X-ray DIAGNOSIS TEETH IN DENTAL MEDICINE Lyubomir Direkov South Western University Neofit Rilski Blagoevgrad / Bulgaria Abstract: X-rays are the first ionizing radiation, which are
DIAGNOSTIC IMAGING. OPTIMIZED.
 ABOUT LED DENTAL SEE THE DIFFERENCE Using our years of business insight and clinical experience as a foundation, LED Dental takes the uncertainty out of your imaging purchase decision. We offer our clients
Verification of micro-beam irradiation
 Journal of Physics: Conference Series OPEN ACCESS Verification of micro-beam irradiation To cite this article: Qiongge Li et al 2015 J. Phys.: Conf. Ser. 573 012047 View the article online for updates
STRUCTURED EDUCATION REQUIREMENTS EFFECTIVE: JANUARY 1, 2016
 Computed Tomography The purpose of structured education is to provide the opportunity for individuals to develop mastery of discipline-specific knowledge that, when coupled with selected clinical experiences,
VGi - R EN ENGLISH. QR srl - Via Silvestrini, Verona Italy Tel
 VGi - R15.1 - EN ENGLISH QR srl - Via Silvestrini, 20-37135 Verona Italy Tel. +39 045 8202727-045 583500 info@newtom.it www.newtom.it FIRST IN CONE BEAM, ACCURATE IN RESULTS. 360 degree imaging, reduced
SUMMARY AND EXTRACTS FROM THE 2010 GUIDANCE ON THE SAFE USE OF DENTAL CONE BEAM CT (COMPUTED TOMOGRAPHY) EQUIPMENT
 EQUIPMENT") SUMMARY AND EXTRACTS FROM THE 2010 GUIDANCE ON THE SAFE USE OF DENTAL CONE BEAM CT (COMPUTED TOMOGRAPHY) EQUIPMENT The use of dental CBCT equipment must comply with all the regulations (IRR99 and IR(ME)R2000)
SUMMARY AND EXTRACTS FROM THE 2010 GUIDANCE ON THE SAFE USE OF DENTAL CONE BEAM CT (COMPUTED TOMOGRAPHY) EQUIPMENT The use of dental CBCT equipment must comply with all the regulations (IRR99 and IR(ME)R2000)
The Computed Tomography Examination
 CONTENT SPECIFICATIONS The Computed Tomography Examination The purpose of The American Registry of Radiologic Technologists (ARRT ) Computed Tomography Examination is to assess the knowledge and cognitive
CURRENTLY FDA APPROVED ARE FULL FIELD DIGITAL MAMMOGRAPHY SYSTEMS AND FILM SCREEN STILL BEING USED AT SOME INSTITUTIONS
 ABBY DUROJAYE,M.D CURRENTLY FDA APPROVED ARE FULL FIELD DIGITAL MAMMOGRAPHY SYSTEMS AND FILM SCREEN STILL BEING USED AT SOME INSTITUTIONS BOTH HAVE BEEN SHOWN TO BE EFFECTIVE TOOLS EARLY DETECTION OF BREAST
Cardiac CT - Coronary Calcium Basics Workshop II (Basic)
") Cardiac CT - Coronary Calcium Basics Workshop II (Basic) J. Jeffrey Carr, MD, MSCE Dept. of Radiology & Public Health Sciences Wake Forest University School of Medicine Winston-Salem, NC USA No significant
Cardiac CT - Coronary Calcium Basics Workshop II (Basic) J. Jeffrey Carr, MD, MSCE Dept. of Radiology & Public Health Sciences Wake Forest University School of Medicine Winston-Salem, NC USA No significant
Typical PET Image. Elevated uptake of FDG (related to metabolism) Lung cancer example: But where exactly is it located?
 Lung cancer example: But where exactly is it located?") Typical PET Image Elevated uptake of FDG (related to metabolism) Lung cancer example: But where exactly is it located? PET/CT Oncology Imaging Anatometabolic fusion images are useful in the management
Typical PET Image Elevated uptake of FDG (related to metabolism) Lung cancer example: But where exactly is it located? PET/CT Oncology Imaging Anatometabolic fusion images are useful in the management
Implementation of the 2012 ACR CT QC Manual in a Community Hospital Setting BRUCE E. HASSELQUIST, PH.D., DABR, DABSNM ASPIRUS WAUSAU HOSPITAL
 Implementation of the 2012 ACR CT QC Manual in a Community Hospital Setting BRUCE E. HASSELQUIST, PH.D., DABR, DABSNM ASPIRUS WAUSAU HOSPITAL Conflict of Interest Disclaimer Employee of Aspirus Wausau
Translating Protocols Across Patient Size: Babies to Bariatric
 Translating Protocols Across Patient Size: Babies to Bariatric Cynthia H. McCollough, PhD, FACR, FAAPM Professor of Radiologic Physics Director, CT Clinical Innovation Center Department of Radiology Mayo
I AM DEMANDING Type CMOS Flat Panel CMOS CMOS ø 40 x 40 mm, ø 60 x 60 mm, ø 80 x 80 mm, ø 110 x 80 mm
 TECHNICAL SPECIFICATIONS 1168 1501 1978 1237 1551-2351 Ø 1090 PANORAMIC CBCT CEPHALOMETRIC X-RAY SOURCE Tube type High frequency DC generator 2.8 mmal / 85 kv 7.0 mmal / 90 kv 2.8 mmal / 85 kv Operation
Profound understanding of anatomy
 ENGLISH Profound understanding of anatomy Planmeca ProMax 3D, the intelligent and multipurpose X-ray unit, is designed to obtain complete information on patient anatomy in the minutest detail. The unit
IGRT1 technologies. Paweł Kukołowicz Warsaw, Poland
 IGRT1 technologies Paweł Kukołowicz Warsaw, Poland Minimal prerequisite for good, efficient radiotherapy ICTP 2015 Paweł Kukołowicz 2/29 Minimal prerequisite for good, efficient radiotherapy Well trained
3D Cone beam CT & Digital Radiography Dedicated to Otorhinolaryngology
 3D Cone beam CT & Digital Radiography Dedicated to Otorhinolaryngology Multi-functional imaging solution3 RAYSCAN m is an unique 2-in-1 imaging solution, combining Cone Beam CT and Digital Radiography,
Mammography. Background and Perspective. Mammography Evolution. Background and Perspective. T.R. Nelson, Ph.D. x41433
 - 2015 Background and Perspective 2005 (in US) Women Men Mammography Invasive Breast Cancer Diagnosed 211,240 1,690 Noninvasive Breast Cancer Diagnosed 58,940 Deaths from Breast Cancer 40,410 460 T.R.
Vascular. Experiences Using an Angiography System with a Inch FPD - CT-Like Imaging of the Neck and Abdomen - 1.
 Vascular Experiences Using an Angiography System with a 17 17 Inch FPD - CT-Like Imaging of the Neck and Abdomen - Department of Radiology, University Hospital, Kyoto Prefectural University of Medicine
45 Hr PET Registry Review Course
 45 HR PET/CT REGISTRY REVIEW COURSE Course Control Document Timothy K. Marshel, MBA, R.T. (R), (N)(CT)(MR)(NCT)(PET)(CNMT) The PET/CT Training Institute, Inc. SNMMI-TS 028600-028632 45hr CEH s Voice Credits
User Guide for Dental and Maxillofacial Cone Beam Computed Tomography (CBCT)
") User Guide for Dental and Maxillofacial Cone Beam Computed Tomography (CBCT) Poster No.: C-0756 Congress: ECR 2014 Type: Educational Exhibit Authors: J. Ukkonen, J. Asp; Helsinki/FI Keywords: Education
User Guide for Dental and Maxillofacial Cone Beam Computed Tomography (CBCT) Poster No.: C-0756 Congress: ECR 2014 Type: Educational Exhibit Authors: J. Ukkonen, J. Asp; Helsinki/FI Keywords: Education
Low Dose Excellent Image Quality Rapid Reconstruction
 Low Dose Excellent Image Quality Rapid Reconstruction Efficient 3 in 1 Dental X-ray System CBCT > Precise 3-D Anatomical structures - Accurate diagnosis for doctors - Safe implant for patients > Significant
Profound understanding of anatomy
 ENGLISH Profound understanding of anatomy The unique Planmeca ProMax 3D product family offers equipment for all maxillofacial imaging. All volume sizes from the smallest special cases to whole head images
THE USE OF KEYSTONE EASYGUIDE CT SCANNING SOFTWARE FOR DIAGNOSIS, DIRECTION AND DEPTH DETERMINATION
 CT DIAGNOSTICS IN 3D IMPLANT TREATMENT PLANNING THE USE OF KEYSTONE EASYGUIDE CT SCANNING SOFTWARE FOR DIAGNOSIS, DIRECTION AND DEPTH DETERMINATION Timothy Kosinski, DDS, MAGD Assistant Clinical Professor
PINPOINTING RADIATION THERAPY WITH THE PRECISION OF MR.
 GE Healthcare PINPOINTING RADIATION THERAPY WITH THE PRECISION OF MR. MR Radiation Oncology Suite MAXIMIZE YOUR PRECISION. HELP MINIMIZE PATIENT COMPLICATIONS. Our goal in MR radiation oncology is to
1 Fundamentals. Basic Definitions and Physics Principles. Fundamentals
 1 To become versed in the language of ultrasonography, it is necessary to review some of the basic principles of physics. The wave physics principles of ordinary (i.e., audible) sound apply to ultrasound
Assessment of Bone Density Measurements Using Cone Beam Computed Tomography and Multislice Computed Tomography (Experimental Study)
") Assessment of Bone Density Measurements Using Cone Beam Computed Tomography and Multislice Computed Tomography (Experimental Study) Thesis Submitted to the Faculty of Oral and Dental Medicine, Cairo University,
Assessment of Bone Density Measurements Using Cone Beam Computed Tomography and Multislice Computed Tomography (Experimental Study) Thesis Submitted to the Faculty of Oral and Dental Medicine, Cairo University,
NPTEL NPTEL ONLINE COURSE. NPTEL Online Certification Course (NOC) NPTEL. Theory and Practice of Non Destructive Testing
 NPTEL. Theory and Practice of Non Destructive Testing") NPTEL NPTEL ONLINE COURSE NPTEL Online Certification Course (NOC) NPTEL Theory and Practice of Non Destructive Testing Dr. Ranjit Bauri Dept. of Metallurgical & Materials Engineering IIT Madras, Chennai
NPTEL NPTEL ONLINE COURSE NPTEL Online Certification Course (NOC) NPTEL Theory and Practice of Non Destructive Testing Dr. Ranjit Bauri Dept. of Metallurgical & Materials Engineering IIT Madras, Chennai
Lava. Chairside Oral Scanner C.O.S. The Future in Motion
 Lava Chairside Oral Scanner C.O.S. The Future in Motion A Brilliant Impression of the Future. What if you could instantaneously view impressions in awe-inspiring detail and turn an unpleasant procedure
Collapsed Cone Convolution 2D illustration
 Collapsed Cone Convolution 2D illustration 8 cones Energy desposition decreases very quickly with distance Energy is absorber in blue pixels only. IGRT1 technologies Paweł Kukołowicz Warsaw, Poland IGRT
Extraoral Imaging. Chapter 42. Copyright 2018, Elsevier Inc. All Rights Reserved. 1
 Extraoral Imaging Chapter 42 Copyright 2018, Elsevier Inc. All Rights Reserved. 1 Learning Objectives Lesson 42.1: Panoramic Imaging 1. Pronounce, define, and spell the key terms. 2. Discuss panoramic
B. CT protocols for the spine
 B. CT protocols for the spine Poster No.: A-003 Congress: ECR 2010 Type: Invited Speaker Topic: Neuro Authors: B. Tins; Oswestry/UK Keywords: CT, spine, diagnostic imaging protocol DOI: 10.1594/ecr2010/A-003
Test Bank CHAPTER 1. Multiple Choice. 1. Who was awarded the first Nobel Prize for physics in 1901, for his experimental work with. radiation?
 Test Bank CHAPTER 1 Multiple Choice 1. Who was awarded the first Nobel Prize for physics in 1901, for his experimental work with radiation? a. W. J. Morton b. O. Walkhoff c. W. D. Coolidge d. W. C. Roentgen
Preparing for Medical Physics Components of the ABR Core Examination
 Preparing for Medical Physics Components of the ABR Core Examination The ABR core examination for radiologists contains material on medical physics. This content is based on the medical physics that is
Uozu city/jp, Minatoku, Tokyo/JP Bones, Extremities, CT, Surgery, Physics, Artifacts, Image verification /ecr2014/C-0462
 Metal Artifact Reduction Algorithm enablesreduce metal artifacts and improvement of diagnosis in the postoperative Pedicle screws implant for Spinal Fusion: A Phantom Study Poster No.: C-0462 Congress:
X X X. GXS-700 Direct USB Digital Intraoral Sensors. Buy a Sensor Combo and a Digital Pan Unit, Receive $600 Off! GO.BENCO benco.
 8 0 0. G O. B E N C O b e n c o. c o m GS-700 Direct USB Digital Intraoral Sensors Designed to make migrating from film, or upgrading an existing digital system, easier than ever High quality image capture
fast accurate safe See the full picture: add a 3rd dimension to your patient evaluation to diagnose more effectively. BENEFITS OF NEWTOM 3G 6" 9" 12"
 See the full picture: add a 3rd dimension to your patient evaluation to diagnose more effectively. Examination Effective Dose Equivalent (ICRP tissue weights 2005) Panoramic Dose (ICRP tissue weights 2005)
Radiation Exposure and Image Quality in X-Ray Diagnostic Radiology
 Horst Aichinger Joachim Dierker Sigrid Joite-Barfuß Manfred Säbel Radiation Exposure and Image Quality in X-Ray Diagnostic Radiology Physical Principles and Clinical Applications Second Edition Springer
5G XL - R EN ENGLISH
 5G XL - R15.0 - EN ENGLISH Sede legale ed amministrativa - Headquarters QR srl - Via Selice Provinciale, 23/a - 40026 Imola - Bo (Italy) Stabilimento - Plant Via Fermi, 40-37136 Verona (Italy) Tel. +39
Human tooth root canal geometry assessment through micro-ct images
 Human tooth root canal geometry assessment through micro-ct images A. Garay 1, J.H. Legarreta 1, I. Macía 1, R. C. Aza 2 1 Vicomtech-ik4, Mikeletegi Pasealekua, 57 Teknologi Parkea 20009 Donostia, Spain
Table of Contents. Introduction 3. Background 4
 Training manual Table of Contents Introduction 3 Background 4 What are X-rays? 4 How are X-rays Generated? 5 Primary and Scatter Radiation 6 Interactions with Matter 6 Biological Effects of Radiation 7
Xelis Dental - What New in
 Xelis Dental - What New in 1.0.6.1 Clinical Needs Why Xelis-Dental? Panorama Cephalography Intra-oral Digital Camera Traditional imaging systems - 2-Dimension view Incorrect anatomical information - Distortion
3D Panoramic Cephalometric. Innovation, in reach. KODAK 9000 Extraoral Imaging System
 3D Panoramic Cephalometric Innovation, in reach 9000 KODAK 9000 Extraoral Imaging System Cephalometric Innovation made simple Innovation made simple We believe in innovation. We always have. In fact, our
Profound understanding of anatomy
 ENGLISH Profound understanding of anatomy The unique Planmeca ProMax 3D product family offers equipment for all maxillofacial imaging. All volumes sizes from the smallest special cases to whole head images
Magnetic Resonance Angiography
 Magnetic Resonance Angiography 1 Magnetic Resonance Angiography exploits flow enhancement of GR sequences saturation of venous flow allows arterial visualization saturation of arterial flow allows venous
R/F. Experience of Using Slot Radiography Experimental Use for Lower Extremity Venography. 1. Introduction
 R/F Experience of Using Slot Radiography Experimental Use for Lower Extremity Venography Department of Radiology, Fussa Hospital Mr. Shigeji Ichikawa Shigeji Ichikawa 1. Introduction Our hospital is a
Opportunities and Innovations in Digital Mammography John M. Sandrik, Ph.D. GE Healthcare Milwaukee, WI
 Opportunities and Innovations in Digital Mammography John M. Sandrik, Ph.D. GE Healthcare Milwaukee, WI john.sandrik@med.ge.com with many thanks to Vince Polkus, Advanced Applications Product Mgr. 1 Content
PAN CEPH 3D CONE BEAM
 PAN CEPH 3D CONE BEAM 2D - 3D panoramic units PANORAMIC CEPHALOMETRIC 3D CONE BEAM IMAGING I-MAX TOUCH Tactile & naturally intuitive panoramic imaging Discover the simplicity and efficiency this unit can
Measurement of organ dose in abdomen-pelvis CT exam as a function of ma, KV and scanner type by Monte Carlo method
 Iran. J. Radiat. Res., 2004; 1(4): 187-194 Measurement of organ dose in abdomen-pelvis CT exam as a function of ma, KV and scanner type by Monte Carlo method M.R. Ay 1, M. Shahriari 2, S. Sarkar 3, P.
Managing the imaging dose during Image-guided Radiotherapy. Martin J Murphy PhD Department of Radiation Oncology Virginia Commonwealth University
 Managing the imaging dose during Image-guided Radiotherapy Martin J Murphy PhD Department of Radiation Oncology Virginia Commonwealth University Radiographic image guidance has emerged as the new paradigm
Essential guidelines for using cone beam computed tomography (CBCT) in implant dentistry. Part 1: Technical considerations
 in implant dentistry. Part 1: Technical considerations") C L I N I C A L Essential guidelines for using cone beam computed tomography (CBCT) in implant dentistry. Part 1: Technical considerations Johan Hartshorne 1 Summary The development of inexpensive x-ray
C L I N I C A L Essential guidelines for using cone beam computed tomography (CBCT) in implant dentistry. Part 1: Technical considerations Johan Hartshorne 1 Summary The development of inexpensive x-ray
Cone-Beam CT for MSK Extremities
 8/6/0 Diagnostic Image Quality Evaluation of an Extremity Cone-Beam CT Scanner: Pre-Clinical and First Clinical Results Abdullah Muhit Wojciech Zbijewski, J Webster Stayman John Yorkston, Nathan Packard,
Why is CT Dose of Interest?
 Why is CT Dose of Interest? CT usage has increased rapidly in the past decade Compared to other medical imaging CT produces a larger radiation dose. There is direct epidemiological evidence for a an increase
D3D CBCT. See more Do More
 D3D CBCT See more Do More BIOLASE DaVinci Imaging D3D For capturing superior 3D image acquisitions with the lowest minimal dose for patient safety The BIOLASE DaVinci Imaging D3D has one of the lowest
3Shape X1 Scanning redefined
 3Shape X1 Scanning redefined Why choose the X1 Give your patients a great experience No head fixation and sleek design create a comfortable scanning experience for your patient High image quality low dose
3D Accuitomo XYZ Slice View Tomograph. Super High-Resolution Images of Region of Interest
 3D Accuitomo XYZ Slice View Tomograph. Super High-Resolution Images of Region of Interest Thinking ahead. Focused on life. 2 Cone Beam X-Ray CT Imaging X-Ray Tube Imaging Intensifier Imaging Volume Voxel
Toshiba Aquillion 64 CT Scanner. Phantom Center Periphery Center Periphery Center Periphery
 Comparison of radiation dose and imaging performance for the standard Varian x-ray tube and the Richardson Healthcare ALTA750 replacement tube for the Toshiba Aquillion CT scanners. by Robert L. Dixon,
3Shape X1 Scanning redefined
 3Shape X1 Scanning redefined Why choose the X1 Give your patients a great experience No head fixation and sleek design create a comfortable scanning experience for your patient High image quality low dose
Ultrasound. Computed tomography. Case studies. Utility of IQon Spectral CT in. cardiac imaging
 Ultrasound Computed tomography Case studies Utility of IQon Spectral CT in cardiac imaging Cardiac imaging is a challenging procedure where it is necessary to image a motion-free heart. This requires a
Nuclear Associates
 Nuclear Associates 37-013 GARD Users Manual March 2005 Manual No. 37-013-1 Rev. 2 2004, 2005 Fluke Corporation, All rights reserved. Printed in U.S.A. All product names are trademarks of their respective
Dosimetry of recently introduced CBCT Units for Oral and Maxillofacial Radiology
 Dosimetry of recently introduced CBCT Units for Oral and Maxillofacial Radiology John B Ludlow, Laura E Davies-Ludlow, André Mol University of North Carolina, Chapel Hill, NC Background CBCT is seeing
Practical CT and MRI Anthony J. Fischetti, DVM, MS, DACVR Department Head of Diagnostic Imaging The Animal Medical Center, New York OBJECTIVE:
 Practical CT and MRI Anthony J. Fischetti, DVM, MS, DACVR Department Head of Diagnostic Imaging The Animal Medical Center, New York OBJECTIVE: This lecture describes the most common indications for referred
ANALYSIS AND DETECTION OF BRAIN TUMOUR USING IMAGE PROCESSING TECHNIQUES
 ANALYSIS AND DETECTION OF BRAIN TUMOUR USING IMAGE PROCESSING TECHNIQUES P.V.Rohini 1, Dr.M.Pushparani 2 1 M.Phil Scholar, Department of Computer Science, Mother Teresa women s university, (India) 2 Professor
ENGLISH. Distributed by: QR srl - Via Silvestrini, Verona Italy Tel
 GiANO - R15.1 - EN ENGLISH Distributed by: QR srl - Via Silvestrini, 20-37135 Verona Italy Tel. +39 045 8202727-045 583500 info@newtom.it www.newtom.it Manufacturer: CEFLA S.C. - CEFLA DENTAL GROUP Via
DENTAL RADIOLOGY Identify basic facts and terms of radiology, to include fundamentals. with 70% accuracy.
 DENTAL RADIOLOGY Identify basic facts and terms of radiology, to include fundamentals of chemistry relating to radiology, with 70% accuracy. Radiation Physics Radiation Health and Safety Components of
EARLY STAGE DIAGNOSIS OF LUNG CANCER USING CT-SCAN IMAGES BASED ON CELLULAR LEARNING AUTOMATE
 EARLY STAGE DIAGNOSIS OF LUNG CANCER USING CT-SCAN IMAGES BASED ON CELLULAR LEARNING AUTOMATE SAKTHI NEELA.P.K Department of M.E (Medical electronics) Sengunthar College of engineering Namakkal, Tamilnadu,
Original Research THE USE OF REFORMATTED CONE BEAM CT IMAGES IN ASSESSING MID-FACE TRAUMA, WITH A FOCUS ON THE ORBITAL FLOOR FRACTURES
 DOI: 10.15386/cjmed-601 Original Research THE USE OF REFORMATTED CONE BEAM CT IMAGES IN ASSESSING MID-FACE TRAUMA, WITH A FOCUS ON THE ORBITAL FLOOR FRACTURES RALUCA ROMAN 1, MIHAELA HEDEȘIU 1, FLOAREA
Interpretation Basics of Cone Beam Computed Tomography COPYRIGHTED MATERIAL
 Interpretation Basics of Cone Beam Computed Tomography COPYIGHTED MATEIA 1 Introduction to Cone Beam Computed Tomography Shawneen M. Gonzalez Introduction This chapter will cover basics of cone beam computed
Chapters from Clinical Oncology
 Chapters from Clinical Oncology Lecture notes University of Szeged Faculty of Medicine Department of Oncotherapy 2012. 1 RADIOTHERAPY Technical aspects Dr. Elemér Szil Introduction There are three possibilities