Citation for published version: Myatt, E-J 2013, 'Differentiation of Pancreatic and Hepatic Cell Types', Ph.D., University of Bath.
|
|
|
- Ilene Oliver
- 5 years ago
- Views:
Transcription
1 Citation for published version: Myatt, E-J 2013, 'Differentiation of Pancreatic and Hepatic Cell Types', Ph.D., University of Bath. Publication date: 2013 Document Version Publisher's PDF, also known as Version of record Link to publication The Author University of Bath General rights Copyright and moral rights for the publications made accessible in the public portal are retained by the authors and/or other copyright owners and it is a condition of accessing publications that users recognise and abide by the legal requirements associated with these rights. Take down policy If you believe that this document breaches copyright please contact us providing details, and we will remove access to the work immediately and investigate your claim. Download date: 10. Jan. 2019
2 Differentiation of Pancreatic and Hepatic Cell Types Emily-jane Myatt A thesis submitted for the degree of Doctor of Philosophy University of Bath Department of Biology and Biochemistry January 2013 COPYRIGHT Attention is drawn to the fact that copyright of this thesis rests with the author. A copy of this thesis has been supplied on condition that anyone who consults it is understood to recognise that its copyright rests with the author and that they must not copy it or use material from it except as permitted by law or with the consent of the author. This thesis may be made available for consultation within the University Library and may be photocopied or lent to other libraries for the purposes of consultation. 1
3 Table of Contents Acknowledgements... 5 Abstract... 6 List of Abbreviations... 8 Chapter 1. Introduction The Adult Liver A. Functions, Physiology and Cell Types B. Liver Pathologies and Treatments C. Transdifferentiated Hepatocytes for the Treatment of Liver Failure The Adult Pancreas A. Functions, Physiology and Cell Types B. Pancreas Pathologies and Treatments C. Transdifferentiated β-cells for the Treatment of Type I Diabetes Embryonic Development of the Liver and Pancreas A. Gut Tube Formation B. Embryonic Liver Development B.1. Liver Specification B.2. Liver Bud Formation B.3. Bile Duct Morphogenesis B.4. Hepatoblast Cell Fate Decisions C. Embryonic Pancreas Development C.1. Pancreas Specification C.2. Dorsal and Ventral Bud Formation C.3. Early Pancreatic Progenitors C.4. Appearance of Early Endocrine Cell Types C.5. Bud Outgrowth C.6. Secondary Transition- Branching Morphogenesis C.7. Differentiation of Endocrine Cell Types C.8. Islet Cell Differentiation C.9. Exocrine Differentiation Thesis Aims...39 Chapter 2. Materials and Methods Materials A. Cell Lines, Tissue Culture Reagents and Media Composition B. Isolation and Culture of Embryonic Hepatic and Pancreatic Buds C. Immunostaining Antibodies and Reagents D. RT-PCR Reagents and Primers E Western Blotting Buffers F. Adenoviral Vectors G. Extracellular Factors and Other Compounds Methods A. Culture of Cell Lines, Maintenance, Storage and Revival B. Embryonic Liver and Pancreas Dissection and Ex vivo Culture C. Adenovirus Preparation, Titration and Infection of Cell Lines D. Immunostaining of Cells and Buds
4 2.2.E. RT-PCR F. Western Blotting for Pdx1 and Insulin G. Glucose and Amino Acid Stimulated Insulin Secretion Assay and ELISA H. Measurements and Statistics...58 Chapter 3. Transdifferentiation of BECs to Hepatocytes and Pancreatic Lineages Introduction A. Cholangiocytes B. Transdifferentiation of Cholangiocytes to Hepatocytes C. Transdifferentiation of Cholangiocytes to Pancreatic Lineages D. The BEC Line as a Model of Normal Cholangiocytes E. Chapter Aims Results A. Characterisation of the BEC Line B. Optimisation of BEC Culture Conditions for Infection With Adenoviral Vectors C. Transdifferentiation of BECs to a Hepatic Phenotype D. Transdifferentiation to a Pancreatic Phenotype Discussion A. Characterisation of the BEC Line B. Optimisation of BEC Culture and Infection with Adenoviral Vectors C. Transdifferentiation to a Hepatocyte-like Phenotype D Transdifferentiation to a Pancreatic Phenotype E Future Work Chapter 4. Signalling Pathways in Liver and Pancreas Development Introduction A. Signalling Pathways Involved in Endodermal Organ Development A.1 Notch Signalling A.2. TGFβ and HGF Signalling A.3. Wnt/β-catenin Signalling A.4. Phosphatidylinositol Signalling B. Embryonic Ex vivo Liver and Pancreas Cultures as Models of Development 4.1.B.1. Ex vivo Liver Buds B.2. Ex vivo Pancreatic Buds C. Chapter Aims Results A. Treatment of Ex Vivo Liver Buds with the Gamma-Secretase Inhibitor DAPT B. Liver Buds Treated with Jagged to Activate Notch Signalling C. Liver Buds Treated with HGF to Interfere with Activin/TGFβ Signalling D. Liver Buds Treated with GSKi to Activate Wnt Signalling E. Pancreatic Buds Treated with the Gamma-Secretase Inhibitor DAPT F. Pancreatic Buds Treated with Jagged to Activate Notch Signalling G. Pancreatic Buds Treated with HGF H. Pancreatic Buds Treated with PIKfyve Inhibitor Discussion
5 4.3.A. Notch and TGFβ Signalling in Embryonic Liver B. Wnt Signalling in Embryonic Liver C. Notch Signalling in Embryonic Pancreas D. HGF Treatment of Pancreatic Buds E. PIKfyve Treatment of Pancreatic Buds F. Future Work Chapter 5. Notch Signalling in Pancreatic Development Introduction A. Notch Signalling in the Pancreas B. Ductal Cells of the Pancreas C. Acinar Cells of the Pancreas D. The Islets of Langerhans E. Insulin Production in Pancreatic β-cells F. Glucose Stimulated Insulin Secretion G. Chapter Aims Results A. Ex vivo Pancreatic Buds display Branching Morphogenesis and Both Endocrine and Exocrine Cell Differentiation B. DAPT Treatment Disrupts Normal Branching Morphogenesis C. DAPT Treatment Disrupts Endocrine and Exocrine Cell Differentiation D. DAPT Treatment Increases the Size of Islet-like Structures E. DAPT Treatment Does Not Enhance Proliferation of Pancreatic Progenitors or Increase Proliferation of Insulin Expressing Cells F. DAPT Treatment Increases β-cell Responsiveness to Glucose and Amino Acid Challenge Discussion A. Disruption of Branching Morphogenesis in DAPT Treated Buds B. Disruption of Endocrine and Exocrine Cell Fates in DAPT Treated Buds C. Functionality and Maturity of β-cells in DPAT Treated Buds D. Future Work Chapter 6. Final Discussion and Future Prospects References
6 Acknowledgements I would first like to thank my supervisor Prof. David Tosh for his advice, guidance and patience during the completion of this work. Thank-you for never letting me give up. I would also like to thank all the members of the Tosh lab, past and present, who have helped me, moaned with me and laughed with me (and sometimes at me!). In particular I would like to thank Zoe, Daniel, Kathy, Shifaan, Anastasia, Kuang-Ming, Ben, Michael, Mimi, Caroline and finally Gaby, whom we shall never forget. I have been lucky to have you all as colleagues and even luckier to call you my friends. I would like to gratefully acknowledge the MRC for funding this project. Finally I would like to thank my wonderful family, who have been there for me through it all, especially my Mum and my two beautiful boys Tim and Arthur. I would never have achieved this without you. 5
7 Abstract The endoderm gives rise to many different cell types including those that will form the liver and pancreas. How cells differentiate during embryonic development is an important focus for the field of regenerative medicine. Understanding the normal development of liver and pancreatic cell types may allow us to develop strategies for the production of hepatocytes and pancreatic beta-cells for therapeutic purposes. One potential method of producing cells for therapeutic purposes is via transdifferentiation, or, the conversion of one cell type to another. In this thesis we aimed to establish a protocol for the transdifferentiation of liver ductal cells (termed cholangiocytes) to either hepatocyte or pancreatic lineages. We also aimed to investigate the signalling pathways important for normal differentiation of embryonic liver and pancreas. In order to address the potential of a cholangiocyte cell line (biliary epithelial cells or BECs) to transdifferentiate to other cell types, BECs were infected with a combination of candidate transcription factors known as master switch genes that have previously been demonstrated to induce transdifferentiation to hepatic or pancreatic lineages. We demonstrated that overexpression of the hepatic transcription factors C/EBPα, C/EBPβ and HNF4 resulted in the up-regulation of the hepatocyte genes Albumin and Gs and de novo expression of Afp. In complementary experiments we also demonstrated that overexpression of the pancreatic transcription factors Pdx1, Ngn3, NeuroD and Pax4 resulted in de novo expression of insulin II in BECs. While these results were encouraging further work is necessary to enhance the maturation status of the nascent cells. We also addressed the role of the Notch signalling pathway in the differentiation of embryonic hepatic and pancreatic cells using ex vivo organ culture models of liver and pancreas development. We treated pancreata with N-[N-(3,5-Difluorophenacetyl-Lalanyl)]-S- phenylglycine t-butyl Ester (DAPT) a gamma-secretase inhibitor. Treatment with DAPT inhibits the Notch signalling pathway. Following treatment with DAPT we observed reduced branching morphogenesis, loss of the acinar cell phenotype 6
8 (amylase expression) and an enhancement in endocrine differentiation (insulin and glucagon expression). We propose that in the absence of Notch signalling the proendocrine gene Ngn3 is no longer repressed by the Notch target Hes1, allowing endocrine differentiation to take place. Finally we observed that β-cells in pancreata treated with DAPT are functionally more mature in terms of responsiveness to glucose stimulation. Overall these results have important implications for the development of potential therapies in the treatment of liver failure and diabetes. 7
9 List of Abbreviations AFP Alpha-fetoprotein B13- AR42J-B13 cells (pancreatic cell line) BME-Basal Medium Eagle s BMP Bone Morphogenic Proteins C/EPB CCAAT/Enhancer-Binding Protein Ck7 Cytokeritin 7 Ck19 Cytokeritin 19 CPS- carbamoylphosphate synthetase I Cx 43 Connexin 43 DAPI- 4,6-diamindino-2-phenylindole DAPT- N-[N-(3,5-Difluorophenacetyl-L-alanyl)]-S- phenylglycine t-butyl Ester DBA- Dolichos Biflorus Agglitinin Dex Dexamethasone DMEM- Dulbecco s Modified Eagle s Medium DMSO- Dimethyl sulphoxide E-Cad Epithelial Cadherin EDTA Ethylenediaminetetraacetic acid FBS Foetal Bovine Serum FGF- Fibroblast Growth Factor FITC- Fluorescein isothiocyanate GGT Gamma-Glutamyl Transpeptidase GK- glucokinase GS - Glutamine synthetase Hes1 Hairy enhancer of Split 1 HGF- Hepatocyte Growth Factor HNF Hepatocyte Nuclear Factor ips- induced Pluripotent Stem KGF- Keratinocyte Growth Factor KSFM Keritinocyte Serum Free Media L-Glut L-Glutamine NaB- Sodium butyrate Ngn3 Neurogenin 3 OSM- Oncostatin M Pax4 Paired Box Gene 4 PBS- Phosphate buffer saline Pdx1- Pancreatic duodenal Homeobox gene 1 PEPCK - phosphoenolpyruvate carboxykinase PFA- Paraformaldehyde pips- protein induced Plutipotent Stem PP-Pancreatic polypeptide SMA- Smooth muscle actin Sox9 Sex determining region Y- Box 9 SS-Somatostatin STZ Streptozocin 8
10 TRITC- Tetramethylrhodamine isocyanate 9
11 Chapter 1. Introduction 1.1. The Adult Liver 1.1.A. Functions, Physiology and Cell Types The adult liver is the largest internal organ in the human body and is responsible for carrying out over 500 functions. These functions are diverse and range from metabolic functions (including gluconeogenesis, glycogenolysis and lipogenesis) to functions involved in detoxification, metabolite storage, immunity and ureagenesis. The liver also functions as both an endocrine and exocrine organ. The endocrine function of the liver is the production of serum albumin as well as other proteins, including lipoproteins. The exocrine function of the liver is the production of bile acids for the breakdown of lipids, however bile acids also have an endocrine function, and are able to regulate triglyceride, cholesterol and glucose homeostasis [1]. These examples typify the complex and interacting functions that the liver performs. Approximately 80% of liver mass is composed of a single cell type- the hepatocyte. Hepatocytes display remarkable functional heterogeneity which is related to their location within the functional unit of the liver, the acinus or lobule, (for a review see [2]). The hepatic lobule is composed of hepatocytes that surround the central vein and radiate out towards the portal triad (composed of a branch of the hepatic artery, portal vein and bile duct) in an approximately hexagonal shape (Fig 1.1). Those hepatocytes located closest to the central vein are termed perivenous (PV) hepatocytes. Hepatocytes located close to the portal triad are termed periportal (PP) hepatocytes. PP hepatocytes have higher activities of enzymes involved in oxidative metabolism whereas PV hepatocytes exhibit a preference for xenobiotic metabolism [3-4]. The process of ammonia removal has been found to be highly zonated in the liver. Ammonia removal is facilitated by two processes, the urea cycle and the enzyme glutamine synthetase (GS). PP hepatocytes are responsible for ammonia removal via 10

12 the urea cycle and the cells have been shown to express carbamoylphosphate synthetase I (CPS), the rate-limiting enzyme in the urea cycle. Conversely, PV hepatocytes remove urea by the action of the enzyme glutamine synthetase [4]. Glucose metabolism is also zonated in the liver. PP hepatocytes undertake gluconeogenesis and therefore express the enzyme phosphoenolpyruvate carboxykinase (PEPCK), while PV hepatocytes perform glycolysis and express the enzyme glucokinase (GK) [2]. Figure 1.1. Structure of the Hepatic Lobule. Hepatocytes located close to the portal triad (composed of a branch of the hepatic artery (HA), portal vein (PV) and bile duct (BD)), express carbamoylphosphate synthetase I (blue) and hepatocytes located close to the central vein express glutamine synthetase (red). A periportal to perivenous gradient of expression of metabolic enzymes leads to functional heterogeneity called zonation. Source: Burke and Tosh 2006 [4]. Other cells that comprise the adult liver include hepatic stellate cells, sinusoidal endothelial cells, Kupffer cells and cells of the intrahepatic biliary system (termed cholangiocytes). Hepatic stellate cells are normally quiescent cells that are activated upon liver injury and are involved in fibrosis and cirrhosis [5]. Sinusoidal endothelial 11
13 cells are endothelial cells unique to the liver that filter substances that are exchanged between the sinusoidal lumen and hepatocytes [6]. Kupffer cells are macrophages that reside in the lumen of liver sinusoids and respond to infection [7]. Cholangiocytes are cells that line the intrahepatic duct and are responsible for collection, modification and transport of bile from the hepatocytes to the common hepatic duct [8]. 1.1.B. Liver Pathologies and Treatments Liver disease is the name given to a wide range of pathologies that ultimately give rise to liver fibrosis and eventually cirrhosis, which can lead to liver failure. Causes of liver disease or damage include infection with hepatitis A, B and C, Wilsons disease (accumulation of copper in the body), excessive alcohol consumption, drug use (the most common form of chemical liver damage results from overdose of Acetaminophen-paracetamol), some metabolic diseases (e.g. alpha1-antitrypsin deficiency) and autoimmune destruction of hepatocytes [9]. Fibrosis is the accumulation of extracellular matrix that occurs when fibroblasts and hepatic precursors are activated, by liver injury, and adopt a myofibroblast phenotype. These fibroblasts are thought to include hepatic stellate cells and portal fibroblasts as well as potentially, fibroblasts present in the Glisson s capsule and vascular smooth muscle cells [10]. Cirrhosis is described as the far end of the fibrosis spectrum but it is also characterised by the formation of parenchymal nodules and disorganisation of the lobular architecture [11]. Although the liver has the capacity to regenerate, long-term damage is often irreversible and frequently the only option for patients is transplantation. Liver transplantation is often undesirable due to factors such as lack of donors, risks associated with organ rejection and the long-term implications of the use of immunosuppressant drugs. Advances have been made in the use of extracorporeal liver support devices (bioartifical livers) [12], however for practical reasons, such devices are more useful as a short-term bridge to transplantation, rather than a longterm treatment of damaged liver. 12
14 1.1.C. Transdifferentiated Hepatocytes for Treatment of Liver Failure A range of tissue engineering solutions have been proposed as potential treatments for liver disease including stem cell treatments (For review see [13]). The gold standard for tissue replacement is to use a patient s own cells to reduce the risk of rejection and to solve issues surrounding the ethical use of embryonic stem cells (which can be differentiated towards hepatocyte-like cells). One method by which a patient s own cells could be used is by transdifferentiation of a non-hepatic cell type to a hepatic phenotype. Transdifferentiation is defined as the conversion of one differentiated cell type to another [14-15] and proposes that terminally differentiated cells are not developmentally fixed but are capable of reversal either to a stem cell-like progenitor intermediate or, can directly transdifferentiate to another mature cell type. Induced pluripotent stem cells (ips cells) form part of the evidence that mature cells are capable of reversal to embryonic-like states. ips cells are produced by viral introduction of four genes Oct4, Sox2, c-myc and Klf4 [16], this was first achieved in mouse cells and later, ips cells were produced from human cells, without the use of c- Myc, reducing the risk of tumorigenicity [17]. Most recently so called, protein induced pluripotent stem cells (pips cells) have been produced, using a poly-arginine protein transduction domains to deliver recombinant proteins of the four reprogramming factors directly to the cells [18-19]. Reprogramming cells in this way eliminates the requirement for genetic modification of donor cells, making them safer for transplantation. However the main limitation is the identification of robust protocols for the differentiation of ips cells to mature, fully-functioning cell types. There is evidence to suggest that, at least some mature cell types can be converted directly to hepatocyte-like cells without the need for reprogramming to embryonic intermediates (direct transdifferentiation). Specifically, pancreatic cells are a potential source of donor cells for transdifferentiation to hepatocytes. It is thought that hepatocytes and pancreatic cells are able to undergo transdifferentiation as they have a close developmental relationship, both having arisen from adjacent regions of the 13
15 developing foregut endoderm (discussed in more detail in section 1.3). It has been proposed that transdifferentiation can be more easily induced between developmentally related tissues as there will be fewer differentially expressed genes than more distantly related tissues [20]. In vivo, ectopic hepatocytes have been found in the pancreas of rats fed on a copper-deficient diet [21] and in the islets of Langerhans of transgenic mice, expressing keratinocyte growth factor (KGF) under the control of the insulin promoter [22]. In vitro the pancreatic cell line AR42J-B13 (B13) has been shown to transdifferentiate to a hepatocyte-like phenotype on treatment with the synthetic glucocorticoid Dexamethasone (Dex [23]). The ability to remove a patient s own cells, transdifferentiate them in culture, expand the transdifferentiated population and transplant these cells back into a patient, could represent a treatment for liver failure that removes the need for a donor and provides histocompatible cells that do not pose a risk of rejection The Adult Pancreas 1.2.A. Functions, Physiology and Cell Types The adult pancreas is a glandular tissue with both exocrine and endocrine functions. The exocrine portion of the pancreas is responsible for the production of digestive enzymes for the breakdown of proteins, lipids and nucleic acids, it is composed of a highly branched ductal epithelium that terminates in clusters of acinar cells called acini (Fig 1.2 B). The endocrine pancreas is responsible for secretion of hormones that regulate blood glucose levels. There are five different cell types that compose the endocrine pancreas each secretes a specific hormone that regulates a different aspect of glucose homeostasis. All five cell types are located within structures called the islets of Langerhans (Fig 1.2C [24]). Islets are distributed through the exocrine tissue of the pancreas. Pancreatic α-cells produce the hormone glucagon, which raises blood glucose levels, β-cells produce insulin which lowers blood glucose. The levels of glucagon and insulin release are controlled by the hormones somatostatin and pancreatic polypeptide (PP), which are produced by δ- and PP-cells respectively. The β- cell is usually the most numerous inside the islet and these tend to be found in the centre of the islet with α-, δ- and PP-cells surrounding them. More recently a fifth cell 14
![type has been identified within the islet called the ε-cell that produces a hormone called ghrelin that is known to regulate insulin levels [25] and more recently has been implicated in increasing](/docs-images/93/112316052/images/16-0.jpg "β-cell proliferation and inhibiting apoptosis [26]. A. B. C. Figure 1.2. Structure of the Adult Pancreas, Ductal System and Islet Organisation. A. Gross structure of the adult pancreas with elongated glandular structure and connection with the common bile duct and duodenum.")
16 type has been identified within the islet called the ε-cell that produces a hormone called ghrelin that is known to regulate insulin levels [25] and more recently has been implicated in increasing β-cell proliferation and inhibiting apoptosis [26]. A. B. C. Figure 1.2. Structure of the Adult Pancreas, Ductal System and Islet Organisation. A. Gross structure of the adult pancreas with elongated glandular structure and connection with the common bile duct and duodenum. B. The exocrine pancreas that is composed of a branching ductal system that terminates in bulbus acini composed of acinar cells. C. The endocrine cells of the pancreas arranged into islets of Langerhans. Islets are composed of glucagon-producing α-cells, insulin-producing β-cells, Pancreatic polypeptide-producing PP-cells, Somatostatin producing δ-cells and ε-cells that produce Ghrelin (not shown in this diagram). Source: Bardeesy and DePinho, 2002 [24]. 1.2.B. Pancreas Pathologies and Treatments The main pathology of the pancreas is Diabetes Mellitus. Diabetes is characterised by the inability to regulate blood glucose homeostasis and four different types of the disease exist, Type I, Type II, gestational diabetes and MODY (maturity diabetes of the young). Type II, gestational and MODY diabetes are often the result of insulin resistance at target cells (adipose tissue, muscle and liver), although it is increasingly thought that a reduction in overall insulin production, as the result of β-cell death, is 15
17 important in the pathophysiology of type II diabetes [27-28]. Type I diabetes is an autoimmune disease, in which patients who are genetically predisposed, produce autoantibodies (often islet cell cytoplasmic autoantibodies-icas) that target β-cells for destruction leading to insufficient insulin production and blood glucose dysregulation [29]. Although accurate blood glucose monitoring equipment and insulin administration have come a long way in recent years, some patients still suffer from insufficient glycaemic control. Long-term blood glucose dysregulation can lead to complications in a patient s macrovascular system, causing vascular calcification and atherosclerosis, but also the microvascular system, causing retinopathy which can lead to blindness and nephropathy which can lead to kidney failure [30]. Currently, most patients with type I diabetes are treated with recombinant human insulin injection. Significant progress has been made in producing insulin analogues that are absorbed more quickly and efficiently, this in combination with development of continuous glucose monitoring devices has improved blood glucose regulation outcomes for diabetic patients [31]. Despite these improvements, insulin administration only represents a treatment and not a cure for type I diabetes. A potential cure for diabetic patients is islet cell transplantation, made more feasible by the use of the Edmonton protocol [32]. Many patients who have received islet transplantation have shown improvements in glucose regulation, however very few remain insulin independent, especially in the long term [33]. The limitations of islet transplantation surround the requirement for immunosuppressants, to prevent rejection [33] and the potential for patients to be re-exposed to autoantigens that cause the disease [34]. Other potential cures for type I diabetes are gene therapy or cell replacement therapies aimed at restoring insulin production. Gene therapy treatments involve the introduction of the insulin gene, into another cell type (other than the β-cell). This would be achieved in vivo, most commonly through viral infection of a patient s own cells and would therefore not require a donor or immunosuppressant regimes [35]. Given the complex way in which β-cells sense, produce and release insulin in response to changes in blood glucose levels, a cell type that simply produces insulin would not be sufficient to cure the disease, therefore cell replacement therapies may offer a more holistic option. Research into stem cell based 16
18 therapies for diabetes is ongoing (for review see [36]). However ethical and safety issues surround their use. As is the case for treatment of liver disease, there is evidence that transdifferentiated somatic cells may be a suitable cell source of β-cells for treatment of type I diabetes. 1.2.C. Transdifferentiated β-cells for the Treatment of Type I Diabetes The close developmental relationship between hepatic and pancreatic cells types indicates that liver cells may be a potential source of cells capable of transdifferentiation to β-cells. In fact bile-duct-derived β-cells have been observed in the extrahepatic bile ducts of mice, along with other endocrine pancreatic cell types, reinforcing the relationship between hepatic cells and β-cells [37]. Research on liver to pancreas transdifferentiation has focused on over-expression of the pancreatic transcription factor, pancreatic duodenal homeobox gene 1 (Pdx1), which is essential for pancreatic development and mature β-cell function (discussed in detail later in section 1.3.C). It has been demonstrated that Pdx1 is essential for pancreatic development as Pdx1 knockout mice are apanceratic [38]. In vivo, transgenic Xenopus embryos expressing the Pdx1 homologue Xlhbox8, in hepatocytes (under the control of the transthyretin (TTR) promoter), resulted in the formation of whole ectopic pancreas in the liver [39]. Injection of Pdx1 has also been used to prevent hyperglycaemia in mice treated with streptozocin (STZ), a model of diabetes [40]. Although the results of Pdx1 injection were only able to restore normoglycaemia for short periods (between 7-40 days) it is further evidence of the importance of Pdx1 in insulin production [41]. The crucial role of Pdx1 in β-cell development and function has lead to its description as a master switch gene for pancreas development [42], however other genes are potential targets for diabetes treatments including Neurogenic differentiation (Neuro D), Neurogenin 3 (Ngn3) and MafA [43-44]. A combination of Pdx1, Ngn3 and MafA have been shown to produce β- like cells from pancreatic exocrine cells, in vivo [45]. In vitro the human cell line HepG2 has been infected with the same Xlhbox8 construct as in Xenopus embryos, resulting in the formation of both pancreatic endocrine and exocrine cells [39]. Cultured hepatocytes have also been induced to transdifferentiate to insulin producing cells and 17
19 when transplanted into STZ treated mice can reduce blood glucose levels [46]. In terms of clinical applications cultured cells may be preferable to in vivo treatments as they reduce the risk of vector toxicity and cells can be screened prior to implantation to improve quality and safety. Aside from the use of genetic modification to produce β-like cells, extracellular factors that are linked to β-cell differentiation have been proposed as potential methods of inducing and/or enhancing transdifferentiation. Laminin 1 is known to be important for the differentiation of foetal pancreatic cells to β-cell fates [47]. Betacellulin can promote β-cell differentiation in embryonic pancreas [48] and has been shown to induce islet formation in the liver (in combination with Neuro D) [49]. Activin A in combination with betacellulin has been shown to induce rat pancreatic duct cells to assume a β-cell-like phenotype and these cells have been used to rescue blood glucose regulation in STZ treated mice [50]. These extracellular factors may indicate that vector free transdifferentiation may be possible, which would pose fewer risks to patients, but also these factors may be used to improve the β-cell phenotype of cells transdifferentiated by genetic modification Embryonic Development of Liver and Pancreas 1.3.A. Gut Tube Formation Gastrulation is a process of cell movements that results in the appearance of the three primary germ layers, the ectoderm, mesoderm and endoderm. Cells of the ectoderm eventually differentiate to give rise to epidermal and neural cells [51]. Mesoderm cells become muscle cells including cardiac, skeletal and smooth muscle as well as blood cells and cells of the urinogenital system. Endodermal progenitors will eventually give rise to cells that will form the organs of the respiratory tract (including the lungs), and the gastrointestinal tract (including the stomach, intestine and colon) as well as associated organs (including liver and pancreas) [52]. Endodermal cells also give rise to cells of glands such as the thyroid and thymus [52]. 18
![Definitive endoderm is specified by a gradient of Nodal signalling, indeed high levels of Nodal signalling give rise to endoderm formation, lower levels favours mesoderm formation [53].](/docs-images/93/112316052/images/20-0.jpg "Transcription factors, downstream of Nodal signalling that are important in endoderm development include Mxl1, Sox17, Foxa2 and Tcf2 [53]. After gastrulation (approximately E7.")
20 Definitive endoderm is specified by a gradient of Nodal signalling, indeed high levels of Nodal signalling give rise to endoderm formation, lower levels favours mesoderm formation [53]. Transcription factors, downstream of Nodal signalling that are important in endoderm development include Mxl1, Sox17, Foxa2 and Tcf2 [53]. After gastrulation (approximately E7.5 in mouse embryos) the endoderm is present as a cuplike structure, consisting of around 500 cells in a single layer, covering the mesoderm (Fig 1.3). Although immature the endoderm already shows some anterior-posterior patterning. The transcription factors Hhex, Sox2 and Foxa2 are expressed anteriorally in the embryo and Cdx1, 2 and 4 posteriorally, these transcription factors are essential for establishment of A-P positioning in the early gut tube. Hhex, Sox2 and Foxa2 are required for foregut development and Cdx genes are required for hindgut development [52]. By embryonic day 8.5 the cup-like endoderm is transformed into a primitive gut tube with four distinct regions (Fig 1.3). Region I is the ventral foregut that will develop into liver and ventral pancreas. Region II is dorsal foregut endoderm which will give rise to stomach, dorsal pancreas and duodenum, while region III, midgut endoderm, will contribute to the intestine. Region IV is hindgut endoderm, which will give rise to the large intestine and colon [54]. Figure 1.3. Early Gut Tube Formation A. At E7.5 the endoderm is a one cell think cup-like structure that covers the mesoderm and ectoderm. Even this early in development the endoderm displays some anterior-posterior identity. B. By E8.5 the endoderm has transformed into an open tube structure with four distinct regions. The AIP (anterior intestinal portal) and CIP (caudal intestinal portal) extend towards the centre of the embryo to close the gut tube. Modified from Wells and Melton, 1999 [54]. 19
 have extended towards the centre of the embryo and closed to form the primitive gut tube, this is complete by E9. By E9.")
21 The process of primitive gut formation is complete when the region at the anterior end of the endoderm, called the anterior intestinal portal (AIP) and the region at the posterior end of the endoderm, called the caudal intestinal portal (CIP) have extended towards the centre of the embryo and closed to form the primitive gut tube, this is complete by E9. By E9.5 the process of organ budding begins, during this process epithelium of the endoderm invades the surrounding mesenchyme to form buds that will eventually, differentiate into the different cells lineages required for organ specification. It is thought that an overlapping network of cross-acting transcription factors are required to specify particular lineages from the four regions of the primitive gut tube (Fig 1.4) [52]. For the purposes of this thesis we shall focus on the development of the liver and pancreas. Figure 1.4. Specification of the Early Gut Tube and Anterior-Posterior Transcription Factor Expression. Schematic of E10.5 gut tube showing regions specified for different organ development. Liver region (orange) pancreatic region (green). Below is a representation of the overlapping domains of transcription factor expression that is important for specification of the different domains. Not all factors are expressed at the same time and not all are expressed as development continues. Source: Zorn and Wells, 2009 [52]. 20

22 1.3.B. Embryonic Liver Development 1.3.B.1. Liver Specification As the gut tube begins to close, two populations of endodermal progenitor cells become primed for hepatic differentiation through the action of Foxa [55] and Gata4 [56] transcription factors. It is thought that these progenitors arise from three different regions of the developing foregut endoderm [57], which converge to reside alongside the developing heart tissue [58]. Developing heart tissues of the propericardium and septum transversum produce signals of the Fibroblast Growth Factor (FGF) family (Fig 1.5). FGF1 and 2 are essential for mouse liver development and treatment with exogenous FGF1 and 2 has been shown to be sufficient to replace cardiac mesoderm in in vitro models [59]. Figure 1.5. A Schematic of Signalling Pathways Convergent on the Developing Liver. Schematic of the signals expressed in tissues surrounding the developing endoderm (purple). FGF signals from the cardiac mesenchyme (CM,red) and BMP signals from the septum transversum (ST, blue) are important for establishing liver specification. WNT signalling may also be required for liver specification, either directly or through activation of BMPs. Source: Burke et al, 2006 [58]. 21
23 The septum transversum also produces bone morphogenic proteins (BMPs) that act in parallel with FGFs to control hepatic specification, specifically BMP4 is necessary for the induction of liver genes and repression of the pancreatic fate [60]. It is thought that BMP4 acts by up-regulation of Gata4 [60] which is responsible for priming endoderm cells to assume hepatic fates. More recently a role for Wnt signalling in hepatic development has been identified; however evidence for the action of Wnts is contradictory. In early development Wnts are thought to repress Hhex expression in the posterior endoderm (Hhex is the earliest marker of liver development and is an essential regulator of hepatic differentiation). Furthermore expression of the frizzled-related protein 5 gene, that encodes a secreted Wnt antagonist [61] in the foregut endoderm, indicates inhibition of Wnt signalling may be required for hepatic specification. In contrast the zebrafish mutant Prometheus (prt) shows abnormal liver specification and reduced liver development [62]. The prt gene encodes a novel Wnt2b homologue called Wnt2bb that is expressed in the lateral plate mesoderm, adjacent to the developing liver region in zebrafish [62]. It has been proposed that a combination of Wnt2bb and Wnt2b signalling is needed for liver specification in zebrafish, with loss of function leading to liver agenesis and excess expression leading to ectopic liver production at the expense of pancreatic tissue [63]. This is the first evidence for a positive role for canonical Wnt signalling in liver specification; however prt mutants that lack evidence of early liver specification, often recover liver development and survive into adulthood [62]. This may indicate a compensatory mechanism for Wnt signalling in liver specification. The Wnt2bb orthologue Wnt13 is expressed in mice under the heart (Fig1.5), making its expression pattern similar to that of Wnt2bb in zebrafish [64] perhaps indicating a role for Wnts in mammalian liver specification. 1.3.B.2. Liver Bud Formation By E8.5 in mouse embryos the combination of FGFs, BMPs and potentially Wnt signalling from the septum transversum, results in the appearance of hepatic progenitors called hepatoblasts. Hepatoblasts are bipotential precursors that will give rise to both hepatocytes and cholangiocytes of the intrahepatic ductal system. 22
24 Hepatoblast specification is thought to be induced by FGF, BMP and Wnt activation of Foxa1,2,3 transcription factors and HNF1β [65-66]. Hepatoblasts are characterised by the expression of Hhex [67], albumin (Alb), alpha fetoprotein and (Afp) and Transthyretin [68]. The change in morphology from endodermal progenitor to hepatoblast results in the formation of a bulging columnar epithelium, which impinges on the surrounding septum transversum mesenchyme. At E9.5 the basement membrane surrounding the developing liver is degraded, the hepatoblasts delaminate and invade the surrounding septum transversum. Hepatocytes migrate by forming a pseudostratified epithelium and undergo interkinetic nuclear migration [69]. Migration is controlled by Hhex expression, which allows formation of the pseudostratified epithelium [69] but also requires the action of matrix metalloproteinases [70] and the transcription factors Prox1 [71], Gata6 [72], Hnf6 and Onecut2 [73]. After invasion into the septum transversum mesenchyme the hepatic tissue grows in volume under the combined action of HGF [74], TGFβ [75] and FGF8 [59] signals, and thereafter hepatoblast differentiation to hepatocytes and cholangiocytes begins. 1.3.B.3. Bile Duct Morphogenesis Before discussing cell fate decisions in hepatoblasts it is important to discuss the formation of tissue architecture, which coincides with cellular differentiation. During the mid-gestational stages of development, differentiating hepatocytes are arranged into cords and become associated into sinusoids. The transcription factor HNF4α is necessary for hepatic morphogenesis and establishment and maintenance of sinusoidal architecture [76]. Also important is the development of the sinusoidal capillary network and development of the intrahepatic and extrahepatic biliary trees (for review see[77]), however for the purposes of this thesis only intrahepatic biliary development will be discussed in detail. Bile duct morphogenesis is first observed by the formation of the ductal plate, a monolayer of biliary progenitor cells that surrounds the PP mesenchyme at E in mouse embryos [78](Fig. 1.6A). Ductal plate formation is activated by Jag1 23
25 expression in endothelial cells; this activates Notch signalling which triggers the onset of biliary differentiation in PP hepatoblasts [79]. Cells of the ductal plate express biliary markers including Ck19, Sox9 and Hnf1β and also express the Notch ligand Jag1 [79]. The ductal plate then undergoes a process of remodelling, between E , which results in the formation of branching ductal structures. At specific locations within the ductal plate Jag1 expression in existing ductal plate cells activates the Notch signalling pathway which causes the formation of a second layer of hepatoblasts surrounding the ductal plate [79]. This second layer of hepatoblasts does not immediately differentiate to a duct progenitor phenotype, but becomes separated from the Sox9-positive ductal plate by a luminal space; this produces an asymmetric duct structure [78] (Fig 1.6 B-C). Between E17.5 and postnatal day two of mouse development, the hepatoblasts of the asymmetric duct differentiate to a ductal phenotype [78]. Proliferation of the surrounding mesenchyme, development of periluminal glandular structures and apoptosis of redundant ductal plate cells [80] leads to a mature duct system by post natal day 15 (Fig 1.6D). Notch signalling is thought to promote tubulogenesis via regulation of Hes1 expression, which is not required for duct cell differentiation but is essential for duct morphogenesis [81]. TGFβ signalling is also important for duct morphogenesis in the liver and is thought to act via activation of Sox9 expression, however Sox9 deficient embryos only show a delay in biliary morphogenesis and eventually give rise to functional ducts [78]. Other transcription factors involved in biliary cell differentiation are also involved in morphogenesis including Hnf1β [82]. However changes in duct structure caused by down-regulation of these genes may be the result of failure to differentiated duct cells rather than failures in morphogenesis. 24

26 Figure 1.6. A Model of Hepatic Duct formation by Asymmetric Tubulogenesis. A. Appearance of the single layer ductal plate. B. Formation of a second layer of hepatoblasts over the ductal plate. C. Emergence of luminal space between ductal plate and hepatoblasts, forming a temporary asymmetric duct. D. Differentiation of hepatoblasts to ductal fate resulting in mature duct formation. Source: Antoniou et al, 2009 [78]. 1.3.B.4. Hepatoblast Cell Fate Decisions As described above both hepatocytes and bile duct cells (or cholangiocytes) are derived from a bipotential population of hepatoblasts. The developmental fate of hepatoblasts is dictated by their location within the developing liver. Hepatoblasts located close to the portal vein will differentiate to cholangiocytes (initially forming the ductal plate) and hepatoblasts located within the parenchyma will become hepatocytes. The signal thought to specify hepatocyte or cholangiocyte fate is an Activin/TGFβ signalling gradient that is established between the portal vein and the parenchyma (Fig 1.7). Activin/TGFβ signalling is high around the portal vein and this allows for differentiation to a cholangiocyte phenotype, conversely Activin/TGFβ signalling is low within the parenchyma where hepatocytes develop [83]. The precise mechanism of establishment of the Activin/TGFβ signalling gradient is unclear, however recent evidence suggests that the Onecut transcription factors HNF6 and OC2 may inhibit Activin/TGFβ signalling in the parenchyma, allowing hepatocyte differentiation [84]. Inhibition of Activin/TGFβ signalling within the parenchyma is potentially insufficient to independently establish the required gradient and the interaction of other signalling pathways including HGF, EGF and Wnt signalling have been proposed (Fig 1.7). Notch signalling is also involved in cholangiocyte development, although this is thought to act downstream of Activin/TGFβ signalling [83]. 25

27 Figure 1.7. Cell Fate Decisions in Hepatoblasts. HNF6 and OC-2 are expressed at low levels in hepatoblasts and hepatocytes but at high levels in duct cells. HNF6/OC-2 activates a cascade of factors that results in establishment of an activin/tgfβ gradient that, when high promotes biliary differentiation over hepatocyte differentiation. The downstream factors activated by Activin/TGFβ are not shown. Source: Clotman and Lamaigre, 2006 [83]. Notch is thought to act by alteration of liver enriched transcription factors, specifically causing the up-regulation of Hnf1β, which is required for cholangiocyte differentiation, and down-regulation of Hnf1α, Hnf4 and C/EBPα, which are required for hepatocyte differentiation [85]. Hepaotcyte differentiation is controlled and maintained by a complex network of cross-regulatory cascades of transcription factors [86] from six different families of liver enriched transcription factors (Table 1.1). These transcription factors are responsible for activation of liver genes such as Albumin, alpha1 antitrypsin (α1-at), alpha fetoprotein (AFP), phosphoenolpyruvate carboxykinase (PEPCK), transthyretin (TTR) and tyrosine aminotransferase (TAT). Liver enriched transcription factors are also responsible for transactivation of other transcription factors that form the hepatocyte network as well as direct activation of hepatic genes [87]. 26
28 Table 1.1. Transcription factors important for differentiation and maintenance of gene expression in hepatocytes. Compiled from Schrem et al, 2004 [88] and Costa et al, 2003 [89]. Transcription Factor Family Forkhead Box (Fox) family Onecut (OC) family Basic Region leucine zipper (bzip) family Pou-Homeodomain family Nuclear hormone receptor family Proline and acidic amino acid-rich basic leucine zipper (PAR bzip) family Transcription factors important for regulation of gene expression in hepatocytes Hnf3α, Hnf3β Hnf6 C/ebpα, C/ebpβ Hnf1α Hnf4α D-site binding protein 1.3.C. Embryonic Pancreas Development Development of the pancreas in mouse can be broadly divided into two phases, primary and secondary transition [90]. Primary transition occurs between E and involves specification of pancreas from the endoderm, bud formation, pancreatic progenitor appearance and appearance of the first wave of endocrine cells. A period of bud outgrowth and dorsal and ventral bud fusion occurs between E prior to the onset of secondary transition. Secondary transition begins at E13.5 and is complete by E15.5 and is characterised by further growth and branching morphogenesis as well as the appearance of fully differentiated α-,β-,δ-, PP-,ε- and acinar cells. Between E15.5 and 18.5 further growth and formation of islet structures occurs and maturation of the islets continues into early postnatal life. 1.3.C.1. Pancreas Specification In contrast to liver organogenesis the pancreas arises from two distinct regions of the developing foregut endoderm. These regions give rise to two embryonic buds; the dorsal and ventral pancreatic buds. As development progresses these two buds fuse to give rise to the mature pancreas. 27
29 Specification of the pancreatic buds from early endoderm is dependent, first on anterior-posterior patterning of the early gut tube endoderm. Signals from the lateral plate mesoderm, such as activin, BMP and retinoic acid, pattern the developing endoderm in a posterior-dominant fashion. Stimulation of these signalling pathways during development leads to formation of early pancreatic progenitors in more anterior regions of the gut tube than those that normally specify pancreas [91]. Retinoic acid is required for specification of the dorsal pancreatic endoderm, and ventral pancreas can still develop in the absence of retinoic acid signalling [92]. Although these signals do not directly induce differentiation to pancreatic lineages, they act with transcription factors expressed within the epithelium to produce cells that are primed for pancreatic differentiation. Genes expressed within the prepancreatic endoderm include Hhex, Hnf6, Hnf1β and Foxa2 [93]. However these are expressed in other regions of the developing endoderm. The earliest specific marker of pancreatic specification is Pdx1, which is first observed in the ventral pancreatic domain at E8.5 then in the dorsal domain at E8.75 [94]. 1.3.C.2. Dorsal and Ventral Bud Formation The dorsal and ventral pancreatic buds are initiated by exposure to different stimuli that are dependent on the proximity of the buds to different tissues within the developing embryo. At E8.5 the dorsal pre-pancreatic endoderm lies adjacent to the notochord, which is required to produce signals for dorsal pancreatic bud formation [95]. Notochord signalling to the dorsal pancreatic region is thought to function through activin/tgfβ signals that act by repressing Sonic Hedgehog (Shh) in the prepancreatic endoderm [96]. Sonic Hedgehog repression is required for pancreatic bud formation and Apelqvist et al have demonstrated that expression of Shh under the Pdx1 promoter in embryos leads to intestinal differentiation in pre-pancreatic endoderm [97]. FGF2 has also been implicated as a notochord derived signal for Shh repression in the dorsal pancreas [98]. At around E8.75-E9 the notochord is displaced from the endoderm by dorsolateral splanchnic mesenchyme which becomes the dorsal aorta. Signals from the dorsal aorta are required for further dorsal pancreatic bud formation [99]. 28

30 The ventral pancreatic bud is initially in contact with the lateral plate mesoderm (LMP) that provides instructive signals for ventral pancreatic bud formation. Lateral plate mesoderm induction of ventral pancreas can be mimicked by BMP and activin signalling [100], indicating that these are the signals that control ventral budding. Later the ventral bud is exposed to the septum transversum mesenchyme where FGF and BMP signals specify liver development (See 1.3.B) and restrict the pancreatic fate to the ventral bud [100]. 1.3.C.3. Early Pancreatic Progenitors Formation of the pancreatic buds between E8.5-E10.5 results in the appearance of pancreatic progenitors that are specified to become pancreas. These progenitors are identified by co-expression of Hlxb9, Pdx1, the homeodomain transcription factors Nkx2.2 and Nkx6.1 and pancreas-specific transcription factor 1α (Ptf1α) [93]. These transcription factors are important for both formation of the pancreatic buds and later for differentiation to pancreatic cell types. Figure 1.8. Correlations Between Early Morphogenetic Events and Pancreatic Gene Expression in the Dorsal Pancreatic Bud. The earliest pancreatic gene expression is observed in the prepancreatic endoderm around E8.25 (Hlxb9, red), followed by Pdx1 expression at E8.5 (green) which is the earliest specific marker of pancreatic development. Later at E9.25 Ptf1α is co-expressed in the pancreatic bud (blue) however by E11.5 its expression is restricted to the tips of developing branches which will become exocrine acinar cells. Modified from Jorgensen et al, 2007 [93]. 29
31 Hlxb9 is expressed as early as E8.25 in the pre-pancreatic endoderm (Fig 1.8). In the absence of Hlxb9 the dorsal bud fails to form, ventral pancreas specification is still initiated but β-cell differentiation is perturbed [101]. Hlxb9 is expressed in pancreatic progenitors of both the dorsal and ventral pancreatic buds by E9.5 but becomes restricted to β-cells in later development. Pdx1 is not required for specification of the pre-pancreatic endoderm, as Pdx1 knockout embryos show normal bud formation [102]. Pdx1 is necessary for differentiation to early pancreatic progenitors and post-bud stages of development [103] as a result Pdx1 knockout mice are apancreatic [38]. Pdx1 is expressed as early as E8.5 prior to gut tube closure but after E14.5 is restricted to selected cells of the central pancreatic epithelium that will become β-cells. The homeodomain transcription factors Nkx2.2 and Nkx6.1 have no known function in bud formation and double mutant embryos have no early phenotype, but at later stages β-cells fail to develop [104]. Nkx2.2 is expressed around E8.75 and Nkx6.1 later at around E9.5. During development, Nkx2.2 is restricted to α-, β-, and PP-cells and Nkx6.1 is restricted to β-cells only. Ptf1α is essential for the acquisition of the pancreatic progenitor phenotype and later acquisition of pancreatic fates [105]. Ptf1α is thought to induce dorsal pancreas development after induction in pancreatic endoderm by adjacent endothelial cells [106]. During differentiation Ptf1α is restricted to the growing tips of the branching epithelium that will give rise to acinar cells. The pancreatic precursor population is also dependent on the transcription factor Sox9 for proliferation, survival and maintenance of the progenitor cell type. Sox9 is only expressed in a subset of pancreatic progenitors and is thought to act via a Notchdependent mechanism [107]. 1.3.C.4. Appearance of Early Endocrine Cell Types The appearance of expression of endocrine peptide hormones has been reported as early as E9.5 with the appearance of both insulin and glucagon detected by immunoreactivity [108]. Cells at this stage appear to co-express insulin and glucagon 30
32 and it has been proposed that this co-expression is transient and extinguished as development proceeds, leading to a restriction in expression to produce differentiated islet cell types [108]. Later at E10.5 cells expressing different combinations of insulin, glucagon and somatostatin have been observed by single cell RT-PCR of dorsal pancreatic bud cells [109]. The fate of early endocrine cells is still debated and recent cell lineage tracing of mature α- and β-cells has demonstrated that they are derived from cells that have never previously transcribed insulin or glucagon [110]. This indicates that early, primary transition cells that express endocrine genes may not contribute to the adult islet. 1.3.C.5. Bud Outgrowth Prior to the onset of secondary transition, progenitor cells of the dorsal and ventral pancreatic buds expand rapidly between E At this stage the pancreatic epithelium is closely associated with the mesenchyme and mesenchymal-epithelial signalling is essential for proliferation of pancreatic progenitors [111]. Factors thought to mediate the mesenchyme stimulation of epithelial outgrowth include Fgf10. Fgf10 knockout mice have hypoplastic pancreata due to reduced growth of epithelial progenitors [112]. Wnt signals have also been shown to be required for epithelial outgrowth as overexpression of a dominant-negative form of the Frizzled receptor Frz3 in pancreatic progenitors results in perturbed growth of the epithelium [113]. Growth of the epithelium at this stage is very important as adult pancreas size is thought to be limited by the size of the progenitor pool established at this stage and is not dependent on the later effects of growth-factor-regulated proliferation or apoptosis [114]. During this phase the gut tube rotates to causing the dorsal and ventral pancreas to fuse to become one organ around E12.5 (Fig 1.9[115]). Although the mechanism of bud fusion is not well understood the embryonic buds are thought to fuse at the junction between the main pancreatic duct and the accessory duct and at a second more distal site [116]. 31
33 Figure 1.9. Gut Tube Rotation and Fusion of Pancreatic Buds. At E12.5 the gut tube rotates bringing the ventral bud in line with the dorsal bud. The dorsal and ventral buds fuse at two points to become a single organ. Note the ventral bud is posterior and inferior to the dorsal bud and forms the head and uncinate process of the mature organ. Source: Savides et al, 1996 [115]. 1.3.C.6. Secondary Transition - Branching Morphogenesis The earliest onset of branching morphogenesis is observed at E12.5 and is thought to occur by asymmetric division of multipotent progenitors, this causes new cells to push away from the centre of the pancreatic epithelium to produce branches [117]. These multipotent progenitors express carboxypeptidase 1 (Cpa1) and are thought to give rise to endocrine, exocrine and duct cells [117]. By E13.5 the branches appear as protrusions form the epithelium with bulbus tips (Fig1.10). Initiation and regulation of branching morphogenesis is poorly understood however recently, Eph-related receptor tyrosine kinase signalling (EPH) has been shown to be required for branching to take place [118]. 32
. Stalk cells are specified to become either duct cells or endocrine precursors.")
34 Proliferating pancreatic progenitors within the tips of the growing branches leave behind progeny that lose their potential to differentiate to exocrine fates and form the stalks of developing branches (Fig 1.10). Stalk cells are specified to become either duct cells or endocrine precursors. Later in development endocrine precursors will migrate out of the stalks, leaving trunks composed only of duct cells [117]. Bona fide secondary transition is said to occur around E14 when tip progenitors differentiated to become exocrine cells [119]. Branching morphogenesis continues past secondary transition and into early post natal life, although the mechanism remains unclear [117]. Figure Distribution and Differentiation of Pancreatic Progenitors during Branching Morphogenesis Multipotent pancreatic progenitors multiply and form tips of developing branches (yellow). As tip cells proliferate they leave behind endocrine/duct specific progeny (red) that form the developing stalk. Endocrine progenitors emerge in the stalk (green) these will eventually delaminate leaving a stalk composed of duct cells (orange). During secondary transition tip cells differentiate to become acinar cells. Source: Guney and Gannon, 2009 [119]. 1.3.C.7. Differentiation of Endocrine cell types All endocrine cells are derived from Neurogenin3 (Ngn3)-positive precursors and Ngn3 is both necessary and sufficient to drive endocrine differentiation [ ]. A few Ngn3-positive cells are observed in the pancreatic progenitor pool at E8.5 and Ngn3 expression peaks around E , after which it decreases until postnatal life when it is not expressed in pancreatic tissues [122]. Neurogenein3 is usually expressed in endocrine precursors that are derived from Pdx1-positive progenitors [122], however 33
![some are found outside the Pdx1 domain suggesting a possible endocrine differentiation pathway that is independent of Pdx1 expression [93].](/docs-images/93/112316052/images/35-0.jpg "Mice deficient for Ngn3 fail to produce mature endocrine cells or endocrine precursors [122].")
35 some are found outside the Pdx1 domain suggesting a possible endocrine differentiation pathway that is independent of Pdx1 expression [93]. Mice deficient for Ngn3 fail to produce mature endocrine cells or endocrine precursors [122]. Neurogenin3 overexpression in embryonic pancreas results in excessive differentiation of endocrine precursors [122] and can be used to direct endocrine differentiation of embryonic stem cells in vitro [123]. Expression of Ngn3 is regulated by Notch signalling (reviewed in detail in Chapter 4 section 4.1.1A ) via activation of the Notch target Hairy Enhancer of Split 1 (Hes1), which is a transcriptional repressor of Ngn3 [124]. Inhibition of Notch signalling allows transcription of Ngn3 and endocrine differentiation [120]. Neurogenin3 expression is also controlled by positive regulation, most noticeably by Hnf6 which binds to and stimulated the Ngn3 promoter [125]. Hnf6 deficient mice have a marked reduction in endocrine differentiation and almost no Ngn3 expression [125]. Other transcription factors with binding sites in the Ngn3 promoter include Hnf1α and Hnf3β [124]. Neurogenin 3 is also sufficient to direct endocrine precursor delamination from the epithelium into the mesenchyme where they begin to cluster into islets of Langerhans (Fig 1.11[126]). Neurogenin 3 acts by activation of Snail2 which post-transcriptionally represses E-cadherin. E-cadherin repression in combination with breakdown of the basal lamina is sufficient to allow endocrine precursors to migrate into the mesenchyme [127]. Figure Schematic of Differentiation and Delamination of Endocrine Precursors from the Developing Branches of the Pancreatic Duct Ngn3-positive endocrine precursors present in the trunk of developing branches, repress E-cadherin expression and basal lamina breaks down. Progenitors migrate into the surrounding mesenchyme where they differentiate into endocrine cells and coalesce into islets. Source: Mastracci and Sussel, 2012 [126]. 34
36 Finally Ngn3 induces differentiation to endocrine lineages by initiating a core program of transcription factors that are expressed in all endocrine precursors and are required for development to all endocrine cell types [128]. This core program includes Isl1, neurogenic differentiation factor 1 (NeuroD) and insulinoma-associated 1 (Insm1)[128]. The LIM homeodomain transcription factor Isl1 is required for development of the dorsal pancreatic mesenchyme as well as differentiation to endocrine fates. Isl1 knockouts have a total loss of differentiated islet cells [129]. Isl1 is expressed in all mature endocrine cells but only at low levels in β-cells [121]. NeuroD knockout mice display reduction in all endocrine cells, but particularly in β-cells and endocrine cells fail to aggregate into mature islets [130]. In mature islets, NeuroD is important for insulin gene transcription, however knockouts do show some insulin production, indicating a compensatory mechanism [131]. The Zinc-finger factor Insulinoma-associated 1,IA-1 (Insm1) gene has also been indicated in endocrine cell differentiation as Insm1 deficient mice show reduction in α-,β-, and δ-cell types [132]. Insm1 binding sites are present in the insulin promoter that negatively regulate insulin transcription, however Insm1 function is restricted to development and is not expressed in mature endocrine cells [133]. Once this core program of endocrine transcription factors has been activated Ngn3- positive cells, exit the cell cycle, down-regulate Ngn3 expression and begin differentiation to specific endocrine cell types within the developing islet. 1.3.C.8. Islet Cell Differentiation After Ngn3-dependent specification on endocrine precursors and their delamination from the pancreatic epithelium, endocrine precursors begin to differentiate towards the five different cell types of the islet; α-,β-,δ-, PP-, and ε-cells. Figure 1.12 gives an overview of the transcription factors that are required for differentiation to the five islet cell types [134]. There are several important cell fate junctions in islet cell differentiation; firstly differentiation of endocrine progenitors to ε-cell fate. The exact mechanism of ε-cell specification from endocrine progenitors is unclear, however mature ε-cells express both Nkx2.2 and Isl1 but not Nkx6.1 or Pax6 [135]. It has been proposed that the 35
37 reduction in Pax6 may direct ε-cell differentiation. Pax6 mutants show an increase in ε- cells that is not the result of increased proliferation [136]. The next important cell fate decision in the islet is the differentiation of α/pp progenitors vs. β/δ progenitors, this is thought to be dependent on Arx/Pax4 interactions. Pax4 is expressed early in pancreatic development (E9.5) but by birth is restricted to β-cells [121]. Pax4 null mice show a total absence of β- and δ-cells and a reciprocal increase in α-cells [137]. In contrast Arx mutants show an absence of α-cells and an increase in β- and δ-cells [138]. Both Arx and Pax4 are transcriptional repressors that interact to control each other s expression [139]. These data suggest that endocrine progenitors that express both Pax4 and Arx may be stimulated by an unknown factor to induce preferential expression of either Pax4 or Arx. If Pax4 expression predominates β/δ precursors form, continued expression of Pax4 results in β-cell differentiation, however loss of Pax4 results in δ-cell fate [139]. If Arx expression predominates α/pp precursors are produced, this mechanism is supported by the observation that Arx expression is sufficient to induce α- and PP-cell phenotypes in mature β-cells [140]. Sustained Arx expression in α/pp progenitors results in acquisition of α-cell fate, however the mechanism of PP-cell differentiation is not understood. 36
, δ-cell progenitors (yellow), α-cell progenitors (blue), ε- and PP-cell progenitors (white).")
38 Figure Schematic of Transcription Factor Expression during Differentiation of Endocrine Cells Proposed transcription factors important in cell fate specification of endocrine precursors. β- cell progenitors (pink), δ-cell progenitors (yellow), α-cell progenitors (blue), ε- and PP-cell progenitors (white). The mechanism of differentiation of ε- and PP cells is not well understood and is not represented here. Source: Collombat et al, 2006 [134]. 1.3.C.9. Exocrine Differentiation As previously mentioned exocrine differentiation occurs during secondary transition when tip cells of developing branches become acinar cells. Two transcription factors are important for acinar cell differentiation; Ptf1α and Mist1. Ptf1α mutants show complete absence of exocrine tissue [141] and Mist1 knockouts have extensive 37
![disorganisation of exocrine tissue and dysregulation of acinar cell function, stability and identity [142].](/docs-images/93/112316052/images/39-0.jpg "The factors controlling acinar cell differentiation are not well understood but Notch signalling has been implicated in preventing endocrine fate by expression of Hes1 which represses Ngn3 (Figure 1.")
39 disorganisation of exocrine tissue and dysregulation of acinar cell function, stability and identity [142]. The factors controlling acinar cell differentiation are not well understood but Notch signalling has been implicated in preventing endocrine fate by expression of Hes1 which represses Ngn3 (Figure 1.13). Notch is also thought to inhibit Ptf1α function until E14.5 when notch silencing allows Ptf1α-directed acinar differentiation [143]. Figure Schematic of the Repression of Endocrine and Exocrine Cell Fates by Notch Signalling. At E10.5 active Notch signalling results in activation of the Notch target Hes1, Hes1 represses the pro-endocrine gene Ngn3 maintaining pancreatic progenitors (A). Escape from active Notch at E results in de-repression of Ngn3 by Hes1 and differentiation of exocrine precursors (B). Progenitors that remain exposed to active Notch by E13.5 become endocrine precursors and Ptf1α remains inactive due to active Notch (C). Escape from Notch at E14.5 results in activation of Ptf1α and differentiation to acinar cell fates (D). Little is known about the factors required for exocrine duct cell differentiation however candidate transcription factors include Hnf6 and Sox9. Hnf6 is expressed in duct cells through development and Hnf6 null mice demonstrate abnormal duct 38
40 morphogenesis and develop cysts similar to those found in pancreatic cystic disease [144]. Adult duct cells express Sox9 and during development it is thought to function upstream of Ngn3 to regulate multipotent progenitors [145]. Recently Sox9 in combination with Hnf6 has been shown to induce ductal genes in metaplastic acinar cells [146], indicating a potential role for Sox9 in directing ductal differentiation Thesis Aims The overall aim of this thesis was to (1) determine the potential to induce the transdifferentiation of cholangiocytes to hepatic and pancreatic lineages (2) identify signalling pathways that are important in pancreas and liver development and that can be used to promote transdifferentiation of endodermally derived cells. The aim of the research described in Chapter 3 was to establish a model of normal cholangiocytes that can be efficiently infected with adenoviral vectors and use this to overexpress key hepatic and pancreatic transcription factors. To achieve this, a cholangiocyte cell line called BECs was used and optimised for adenoviral infection. Overexpression of transcription factors was used to test whether direct transdifferentiation of cholangiocytes to hepatocyte or pancreatic β-cell lineages could be achieved. The research in this chapter also aimed to investigate the effects of extracellular factors such as dexamethasone, insulin/transferrin/selenium, oncostatin M, sodium butyrate and nicotinamide on the transdifferentiation of cholangiocytes to hepatocyte-like cells. The aim of Chapter 4 was to investigate the role of different signalling pathways in liver and pancreas development. Using an ex vivo embryonic bud culture system, the role of Notch, TGFβ, WNT and phosphatidylinositol signalling, on hepatic and pancreatic differentiation were investigated. Activation and/or inhibition of different signalling pathways were used to provide insight into organ development. Following on from Chapter 4, the aim of Chapter 5 was to further investigate in more detail the effects of inhibiting Notch signalling in pancreas development in terms of (1) branching moprhogenesis (2) Endocrine vs. Exocrine cell fate decisions and (3) β-cell maturation and function. 39
41 Chapter 2. Materials and Methods 2.1. Materials 2.1.A. Cell Lines, Tissue Culture Reagents and Media Composition Biliary Epithelial Cells (BECs) were obtained as a gift from Dr Yoshiyuki Ueno [147], Tohoku University, Japan. The Murine Insulinoma Cell line (MIN6) and the Human Embryonic Kidney cell line 293 (HEK293) were both obtained from the European Collection of Cell Cultures, Porter Down, UK. Phosphate buffered saline (PBS; Autogen Bioclear) was used to wash cell lines prior to passaging using Trypsin-Ethylenediaminetetraacetic acid (EDTA) (Gibco). Gamma irradiated Foetal bovine serum (FBS; Gibco) was routinely used for tissue culture purposes; except for virus production when Heat inactivated FBS (Sigma) was used. Stock solutions of penicillin/streptomycin, L-glutamine (Sigma) and gentamycin (Gibco) were stored at -20 C prior to use. Dexamethasone (Dex) was prepared in 100% ethanol and stored at -20 C. DMSO (Sigma) for cryopreservation was diluted to 5% (v/v) in FBS and stored at -20 C. 40
42 Table 2.1. Composition of Media used in the Culture of Cell Lines Media Composition BEC culture media Dulbecco s modified Eagles Medium (DMEM; Sigma) with 10% (v/v) FBS, 2mM L-glutamine, 100U/ml penicillin and 100µg/ml streptomycin. MIN6 culture media HEK293 culture media High glucose (25mM) DMEM (Sigma) with 10% (v/v) FBS, 2mM L-glutamine, 100U/ml penicillin and 100µg/ml streptomycin. DMEM (Gibco) with 10% (v/v) heat inactivated FBS, 100U/ml penicillin and 100µg/ml streptomycin. Hepatocyte media (KS) differentiation Keratinocyte serum free media (KSFM; Gibco) with 10% (v/v) FBS, 2mM L-glutamine, 100U/ml penicillin, 100µg/ml streptomycin, 100µg/ml amphotericin B, 50µg/ml gentamycin, 50µg/ml bovine pituitary gland extract (bpge) and 5ng/ml human recombinant EGF (hregf). Hepatocyte media (KdS) differentiation KS media supplemented with 10nM Dexamethasone Hepatocyte Dedifferentiation media (DS) Dulbeccos modified Eagles Medium (DMEM; Sigma) with 10% (v/v) FBS, 2mM L-glutamine, 100U/ml penicillin, 100µg/ml streptomycin, 100µg/ml amphotericin B, 50µg/ml gentamycin, 50µg/ml bovine pituitary gland extract (bpge) and 5ng/ml human recombinant EGF (hregf). RPMI media RPMI 1640 Media (Sigma) with 10% (v/v) FBS, 2mM L- glutamine, 100U/ml penicillin and 100µg/ml streptomycin. 2.1.B. Isolation and Ex vivo Culture of Embryonic Hepatic and Pancreatic buds PBS, FBS and stock solutions of L-glutamine, penicillin / streptomycin and gentamycin were prepared and stored as for cell culture. Stocks of bovine plasma fibronectin (Sigma) were reconstituted in 8M Urea and made to a final concentration of 50mg/ml 41
43 in MilliQ water and stored at -20 C. Subbed coverslips were prepared with a fresh coating of 50µg/ml bovine plasma fibronectin (made up in 1.8ml sterile MilliQ water and 0.2ml 8M Urea prior to use. To sub; coverslips were first washed with hot soapy water, rinsed in MilliQ water, rinsed in 95% ethanol with 0.1% acetic acid and allowed to air dry. In a fume hood the dried coverslips were placed in 2% 3- triethoxysilylpropylamin (APTS; Sigma) in acetone for 10 mins, rinsed twice in acetone for 10 secs and finally rinsed in MilliQ water, before drying and 37 C. Subbed coverslips were wrapped in foil and baked at 180 C for 3 hours and left to cool overnight. Table 2.2. Composition of Media used for Isolation and Culture of Ex vivo Buds Media Composition Dissection media Culture media Minimum essential media Eagles (MEME; Sigma) containing Hanks salts with 10% (v/v) FBS, 2mM L-glutamine. Basal medium Eagles (BME; Sigma) containing Earles salts with 10% (v/v) FBS, 2mM L- glutamine, 100U/ml penicillin, 100µg/ml streptomycin and 50µg/ml gentamycin. 2.1.C. Immunostaining of Monolayer Cultures and Buds Cells were fixed in either 1:1 acetone: methanol or 4% (w/v) Paraformaldehyde (PFA; Fisher scientific). Buds were fixed with either ice cold 1:1 acetone: methanol for 5 mins or MEMFA for 30 mins (3.8% Formaldehyde, 0.15M MOPS, 2mM EGTA, 1mM MgSO 4 (Sigma)). Cells fixed with PFA and buds fixed with MEMFA were permeabilised with 0.1% (v/v) TritonX-100 (Sigma) in PBS. All cells and buds were blocked with 2% (w/v) blocking buffer (Roche) in Maleic acid buffer (100mM Maleic acid, 150mM NaCl ph 7.5). 42
44 Table 2.3. Primary Antibodies used for Immunostaining Antibody Species Supplier Dilution factor Product Code Albumin Rabbit DAKO 1:100 F0117 Alpha fetoprotein (AFP) Rabbit Sigma 1:200 A8452 Amylase Rabbit Sigma 1:200 A8273 CCAAT-Enhancer binding protein α (C/EBPα) CCAAT-Enhancer binding protein β (C/EBPβ) Rabbit Santa Cruz 1:100 SC-61 Mouse Santa Cruz 1:150 SC-7962 Connexin 43 (Cx 43) Mouse Santa Cruz 1:100 SC Cytokeratin 7 (Ck 7) Mouse AbCam 1:50 Ab82253 Cytokeratin 19 (Ck 19) Rabbit AbCam 1:50 Ab52625 Cytokeratin- wide spectrum (Pan- Ck) Rabbit DAKO 1:200 Z0622 Dolichos Biflorus Agglutinin (DBA) Lectin Vector 1:100 FL-1031 Epithelial Cadherin (E-Cad) Mouse DB biosciences 1: Glucagon Mouse Sigma 1:100 G2654 Hepatocyte nuclear Factor 4 (HNF4) Rabbit Santa Cruz 1:100 SC-8987 Insulin Guinea Pig Sigma 1:100 I8510 Pancreatic and duodenal homeobox gene 1 (Pdx1) Rabbit Gift from Jonathan Slack 1:50 N/A Peanut Agglutinin (PNA) Lectin Vector 1:100 FL-1071 Phosphohistone H3 (PH3) Rabbit Upstate 1: Somatostatin (SS) Rabbit DAKO 1:100 A0566 Transferrin Rabbit DAKO 1:200 A
45 Table 2.4. Flurophore Conjugated Secondary Antibodies for Immunostaining Antibody Species Conjugated flurophore Supplier Anti-Guinea Pig IgG Rabbit TRITC Sigma Anti-Mouse IgG Horse FITC Vector Labs TRITC AMCA Anti-Rabbit Goat FITC Vector Labs TRITC Samples not stained with the AMCA flurophore were counterstained with the nuclear marker 4',6-diamidino-2-phenylindole (DAPI; Sigma) diluted to 1:1000 in PBS. 2.1.D. RT-PCR Reagents and Primers RNA was isolated using Tri-reagent (Sigma) and pellets were treated with RNAse-free DNAse (Ambion). Reverse transcription was performed using SuperScriptII reverse transcriptase (Invitrogen) and PCR used 2x ReddyMix PCR Master mix (Abgene). PCR products were run on a 2% Agarose gel (Sigma). 44
46 Table 2.5. Sequence and Melting Temperature of Primers used for RT-PCR all primers were designed to target murine genes but also amplified human transcript where indicated. Primer Sequence (Forward/ Reverse) Tm ( C) Β-actin AAG AGC TAT GAG CTG CCT GA / 56 TAC GGA TGT CAA CGT CAC AC Alpha fetoprotein (AFP) GGA GGC TAT GCA TCA CCA GT / 56 CCG AGA AAT CTG CAG TGA CA Albumin GCA GAG GCT GAC AAG GAA AG / 58 TTC TGC AAA GTC AGC ATT GG Amylase GGG AGG ACT GCT ATT GTC CA/ 56 CAT TGT TGC ACC TTG TCA CC Carbamoyl Phosphate Synthetase (CPS) TGA GTG GGT CTG CCA TGA AC / TGG ACA TTG AAT GGC CCA GA 56 CCAAT-Enhancer binding protein α ACA AGC TGA GCG ACG AGT AC/ 60 (C/EBPα) ACA GCT GCT CCA CCT TCT TC CCAAT-Enhancer binding protein β CTA ACC CAT GCG AGA ACG AT/ 56 (C/EBPβ) GCT TGC ACA GAC ACT CGA AG Cytokeratin 7 (Ck 7) GCA GGA TGT GGT GGA AGA TT/ 56 CGT GAA GGG TCT TGA GGA AG Cytokeratin 19 (Ck 19) ACC CTC CCG AGA TTA CAA CC/ 56 AGA GTC AGC TCA TCC AGC AC Epithelial Cadherin (E-cad) TCG TTC TCC ACT CTC ACA/ 58 GCTGGACCGAGA GAG TTA Gamma Glutamyl Transpeptidase (GGT) GCT CAT GAA TGC CCA CAG TA/ 56 CCA GCT CAT AAC CAC GGA TT Glucagon GCA CAT TCA CCA GCG ACT AC/ 56 CTG GTG GCA AGA TTG TCC AG Glucokinase TAC ACC TGT TCG CAG CTC A/ TGG TGA ATG TGC CCT GTG A Glutamine Synthetase (GS) TTT ATC TTG CAT CGG GTG TG / 56 TTG ATG TTG GAG GTT TCG TG Hairy Enhancer of split 1 (Hes 1) GCT GGA GAA GGC AGA CAT TC/ 58 TGA TCT GGG TCA TGC AGT TG Hepatocyte Nuclear Factor 1 α ( HNF ACG TCC GCA AGC AGC GAG/ 58 1α) TAC ACT CTT CCA CCA AGG TC Hepatocyte Nuclear Factor 1 β (HNF 1β) CTT TAA TGG GAG GCT TCC TGA GAT G/ 56 GTT GAA ATT CCA AGA GTG ACT TGC TC Hepatocyte Nuclear Factor 4 (HNF 4) CTC TTC TGA TTA TAA GCT GAG GAT G/ 56 CCA CAG GAA GGT GCA GAT TGA TCT G Hepatocyte Nuclear Factor 6 (HNF 6) GCA ATG GAA GTA ATT CAG GGC AG/ 56 CAT GAA GAA GTT GCT GAC AGT GC Insulin I TAG TGA CCA GCT ATA ATC AGA G/ 56 ACG CCA AGG TCT GAA GGT CC Insulin II CCC TGC TGG CCC TGC TCT T/ 56 AGG TCT GAA GGT CAC CTG CT Neuro D (mouse and human) GGA TCC ACA TGA CCA AAT CAT ACA G/ 58 GGA TCC TCT AAT CGT GAA AGA TGG CA Neurogenin 3 (Ngn 3) (mouse and GTC GGG AGA ACT AGG ATG/ 58 45
47 human) GGA GCA GTC CCT AGG TAT G Pancreatic and duodenal homeobox TGT AGG CAG TAC GGG TCC TC/ gene 1 (Pdx 1) (mouse and human) CCA CCC CAG TTT ACA AGC TC Pancreatic Polypeptide (PP) TAC TGC TGC CTC TCC CTG TT/ CCA GGA AGT CCA CCT GTG TT Pax 4 (mouse and human) ACC CTG TGA CAT TTC ACG GAG/ GTA CTC GAT TGA TAG AGG AC Phosphoenolpyruvate Carboxykinase CAC AGA CCA GCG AAT AAC AA/ (PEPCK) AGC AAA GAT ACC AGC AGC CA Smooth Muscle Actin (SMA) CTG ACA GAG GCA CCA CTG AA / CAT CTC CAG AGT CCA GCA CA Somatostatin (SS) CCG TCA GTT TCT GCA GAA GT/ CAG GGG CAA GTT GAG CAT CG SYR-box 9 (Sox9) GGG GCT TGT CTC CTT CAG AG/ TGG TAA TGA GTC ATA CAC AGT AC E. Western Blotting Buffers for Pdx1 and Insulin Table 2.6. Buffers used for Pdx1 and Insulin Western Blots Pdx1 Western Insulin western Lysis buffer 50mM Tris-HCl (ph 8), 150mM NaCl, 1% (v/v) Triton-X 100, 1mM EDTA and 1:100 Protease inhibitor cocktail (sigma) 0.18M HCl in 35% (v/v) ethanol and 1:100 protease inhibitor cocktail for mammalian tissues (sigma) Sample loading buffer 4% SDS (w/v), 20% glycerol (v/v), 0.004% Bromophenol Blue, 0.125M Tris-HCl (ph 6.8) and 5% (v/v) Betamecaptoethanol 200mMTris-HCl (ph6.8), 40% (v/v) glycerol, 1% (w/v) SDS, 0.01% (w/v) coomassie brilliant blue R250 SDS-PAGE running buffer 25mM Tris-HCl, 192mM glycine and 0.1% (w/v) SDS 0.1M Tris-HCl, 0.1M tricene, 0.1%(w/v) SDS Transfer buffer 25mM Tris-HCl, 192mM glycine and 20%(v/v) Methanol 46
48 2.1.F. Adenoviral Vectors Table 2.7 Adenoviral Vector Constructs and their Source Adenoviral construct Source Ad-RSV- GFP Ad-C/EBP α Ad-CMV-LAP (C/EBPβ) Ad- CMV- HNF4 Ad-CMV- NeuroD-eGFP Emma Regardsoe, University of Oxford, UK. Vector Biolabs, Philadelphia, USA. Hiroshi Sakaue, Kobe University, Japan. Ramiro Jover, University of Valencia, Spain Harry Heimberg, Vrije Universiteit, Belgium. Ad-CMV- HA- Ngn3-eGFP Ad-CMV-Pax4 Ad-CMV-Pdx1-eGFP 2.1.G. Extracellular Factors and Other Compounds Table 2.8. Extracellular Factors and Compounds used to Culture Cells and Buds Compound [Stock] [Working] Supplier Dexamethasone (Dex) 1mM 1µM Sigma Insulin/Transferrin/Selenium (ITS) 100X 1X Na C 4 H 5 O 2 (Na Butyrate) 100mM 0.5mM Nicotinamide (Nic) 2M 20mM Oncostatin M (OSM) 10µg/ml 10ng/ml N-[N-(3,5-Difluorophenacetyl-Lalanyl)]-S- phenylglycine t-butyl Ester (DAPT) 25mM 50µM Calbiochem 47
49 Jagged 1 100µg/ml 100ng/ml R and D Systems Hepatocyte Growth Factor (HGF) 100µg/ml 100ng/ml Glycogen Synthase Kinase (GSK) Inhibitor 5mM 1µM Gift Dr Paul Whitley PIKfyve inhibitor YM µM 400nM 2.2 Methods 2.2.A Culture of Cell Lines; Maintenance, Storage and Revival BECs were typically maintained in Dulbecco s Modified Eagle s Medium (DMEM) supplemented with 10% Foetal Bovine Serum (FBS), 2mM L-Glutamine (L-Glut), 100U/ml Penicillin and 100µg/ml Streptomycin. BECs were cultured in 75cm 2 NUNC tissue culture flasks at 37 C and 95% air / 5% CO 2. Cells were passaged when 80-90% confluent. Min 6 cells were maintained in High glucose (25mM) DMEM with 10% FBS, 2mM L-glutamine, 100U/ml penicillin and 100µg/ml streptomycin. Min 6 cells were cultured and passaged in the same way as the BEC cells. Media was changed on all cells every other day. To passage the cells, flasks were briefly washed with pre-warmed PBS prior to addition of 3ml Trypsin/EDTA (GIBCO), this was incubated at 37 C for 3-5 minutes until cells could be removed by gentle tapping. Trypsin was neutralised by addition of 7ml of prewarmed culture media and cells were centrifuged at 180 g for 4 minutes. After centrifugation, the supernatant was discarded and the pellet re-suspended in 10 ml of complete media. BECs were subcultured 1:10 and Min 6 cells 1:3. For immunostaining cells were subcultured onto glass coverslips in 35mm dishes. Cells for cryopreservation were trypsinised and centrifuged as described above and the pellet re-suspended in 1ml FBS with 5% DMSO. Cells were stored at -20 C for one hour, and then placed at -80 C overnight in an isopropanol bath, prior to long term storage in liquid nitrogen. 48

 to a final concentration of 50µg/ml in MilliQ water,")
50 Cells were revived by rapidly thawing in a 37 C water bath; the cells in freezing media were diluted into 10ml of pre-warmed culture media and incubated at 37 C overnight. Once cells had attached the media was changed the next day to remove any remaining DMSO and then subsequently every other day. 2.2.B. Embryonic Liver and Pancreas Dissection and Ex vivo Culture All tissue buds were grown on pre-subbed, fibronectin-coated, glass coverslips. Subbed coverslips were freshly coated with bovine plasma fibronectin prior to each isolation by diluting stock fibronectin ([50mg/ml] in urea) to a final concentration of 50µg/ml in MilliQ water, 30µl of diluted fibronectin was spotted onto the centre of each coverslip and allowed to dry at room temperature. Embryos were harvested from pregnant, female CD1 mice at 11.5 days postcoitum, the appearance of the vaginal plug was considered as 0.5 days post-coitum (dpc). Mice were killed by cervical dislocation and the uterus, containing the embryos was removed by cutting the base of the uterus and the end of the uterine horn, where it meets the ovary. Individual embryos were contained within bulges of extra embryonic tissue (decidua), these were cut from the uterus (Fig 2.1A[148]) and embryo gently pressed out (Fig 2.1B) and transferred to dissection media (see table 2.2). A B Figure 2.1. Photographs of Dissection of E11.5 Mouse Embryo An individual embryo surrounded by extra embryonic decidus membrane (A) and an individual embryo removed from deciduas membrane (B). Images modified from Burke et al, 2010 [148]. Embryonic liver buds were dissected using a dissecting microscope and tungsten needle to cut open the embryo, exposing the internal organs (Fig 2.2 A and B). The liver lobes were then removed to fresh media prior to plating out. Embryonic pancreas 49
51 was dissected by stripping the heart and liver from the remaining organs to expose the stomach. Pressing down on the stomach exposed a clear line separating the stomach form the dorsal pancreatic bud, this was carefully removed ensuring not to contaminate the pancreatic tissue with closely associated intestine (Fig 2.2 C). The isolated pancreatic buds were removed to fresh dissection media prior to plating out. Liver lobes were further dissected into small pieces, suitable for culture. A plastic cloning ring with an internal diameter of approximately 3mm was placed onto the fibronectin-coated coverslip inside a 35mm dish and filled with culture media (see Table 2.2). A 200 l Gilson pipette with a large bore tip was used to transfer each liver piece or whole pancreatic bud into the cloning ring. Care was taken to orientate the tissue so that the cut side was facing down onto the fibronectin, to aid attachment. The culture dish was then removed to an incubator at 37 C and 5% CO 2 overnight. After 12 hours the buds were checked for attachment to the fibronectin, the media was changed (extracellular factors added if required) and buds were maintained for up to 14 days by changing media every other day with the extracellular factors as indicated. 50
 showing the developing liver.")

 heat inactivated FBS, 100U/ml penicillin and 100µg/ml streptomycin at 37 C in 95% air/5% CO 2.")
52 A B C Figure 2.2. Photograph of Dissection of Internal Organs of E11.5 Mouse Embryo The internal organs after removal of the epidermis and backbone of the embryo (A and B) showing the developing liver. The internal organs after removal of the heart and liver exposing the stomach and dorsal pancreatic bud, circled in white (C). H=Heart, l=liver, i= Intestine, lb= Lung buds, o= oesophagus, s= Stomach. Images modified from Burke et al, 2010 [148]. 2.2.C. Adenovirus Preparation, Titration and Infection of Cell L ines HEK293 cells were used for adenovirus amplification. HEK cells were cultured in DMEM with 10% (v/v) heat inactivated FBS, 100U/ml penicillin and 100µg/ml streptomycin at 37 C in 95% air/5% CO 2. Four T175 flasks were seeded with HEK293 cells and allowed to reach 70% confluence. Each flask was then infected with either 10µl, 1µl, 0.1µl or 0.01µl of the desired virus and returned to the incubator. The pre-stock was collected from the flask that demonstrated approximately 50% cytopathic effects (CPE) of the 51
53 virus after 2-3 days (ie. 50% of cells were detached after 2-3 days). The pre-stock was collected by tapping the remaining cells from the bottom of the flask, collecting cells and media and centrifuging at 1000 rpm for 4 mins. The pellet was then resuspended in 1 ml of fresh media and subjected to four freeze/thaw cycles on dry ice/ethanol and 37 C water bath, to lyse the cells. The pre-stock was then stored at -80 C until required for further amplification. To test the pre-stock three 70% confluent, T175 flasks were inoculated with 125µl, 12.5µl, or 2µl of the pre-stock. The appropriate volume was taken as the flask that showed 50% CPE between 2-3 days of incubation. To further amplify the virus the appropriate volume of pre-stock was used to inoculate 12 x 70% confluent T175 flasks and incubated for 2-3 days to allow infection to proceed. The virus was collected by tapping the remaining cells from the flasks, pooling the cells and media from all 12 flasks, and centrifuging at 2000rpm for 10 mins. The supernatant was discarded and the pellet resuspended in 5ml of 100mM Tris-HCl (ph 8.0). The pellet was then subjected to four rapid freeze/thaw cycles prior to centrifugation at 2000rpm for 5 mins. The virus was then purified by collecting the supernatant in approximately 0.6x volumes of 100mM Tris-HCl supersaturated with CsCl (ph 8.0) and mixed gently. The virus was then transferred to an ultracentrifuge tube (Beckman), sealed and centrifuged at 65000rpm for four hours at 22 C. After centrifugation a white band of virus was produced, this was extracted using a 25G needle and returned to a new centrifuge tube. The volume was made up using balance solution (1:0.6, 100mM Tris- HCl: 100mM Tris-HCl saturated with CsCl) and the fresh tube further centrifuged at 65000rpm at 22 C, overnight. To remove the CsCl and to concentrate the virus, the band was extracted from the centrifuge tube and injected into a gamma irradiated Slide-A-Lyzer dialysis cassette (0.5-3ml; Pierce). This was suspended in 1L of dialysis buffer (10mM Tris-HCl ph 7.4, 1mM MgCl 2, 135mM NaCl) at 4 C, with constant stirring for 4h. After 4h the dialysis buffer was replaced and left to dialyse overnight. The concentrated virus was then extracted from the cassette, passed through a 0.22µM filter and aliquoted prior to storage at -80 C. 52
54 The concentration of the virus (infectious units/ml; IFU/ml) was estimated using the Adeno-X rapid titre kit (BD Biosciences) according to the manufacturer s instructions. Cells were stained using mouse anti-hexon primary antibody (1:1000) for 1h and rat anti-mouse, HRP conjugated secondary (1:5000; BD Biosciences) for 1h. DAB substrate kit for peroxidise (Vector) was used to visualise the staining and the concentration estimated by counting the positive cells in each field of view under 20X magnification (the optimum dilution counted contained 10% or fewer, positive cells), an average of 6 fields of view were counted. The titre was calculated using the following equation: Routine infection of BECs involved infection of 30-40% confluent cells at a multiplicity of infection (MOI) of 500 IFU/cell. The volume of virus was calculated according to the concentration of each virus used and added to the standard BEC culture media with 10µg/ml dextran (Sigma) to aid infection efficiency. The virus was incubated with the cells overnight at 37 C, the following day the media was changed to 1% FBS media to allow slower culture of cells and expression of the transgene for at least 5 days. Media was changed every 2 days until cells were collected for analysis. 2.2.D. Immunostaining of Cells and Cultured Buds Cell lines for immunostaining were grown on glass coverslips in 35mm dishes. Prior to fixation, the dishes were washed with PBS then fixed with either ice cold Acetone:Methanol for 5 mins or 4% PFA for 20 mins at room temperature. The cells were then washed twice with PBS to remove fixative and stored in PBS at 4 C. Cells fixed in PFA required permeabilising in 0.1% triton-x for 30 mins prior to beginning the rest of the immunostaining protocol. Buds for immunostaining were fixed in Acetone:Methanol or MEMFA (See 2.1.3) for 30 mins at room temperature, if MEMFA fixed buds were permebalised in 1% triton-x100 for 30 mins as for cells. 53
55 The antibodies that required antigen retrieval were treated with 1x antigen retrieval buffer (Lab Vision), either citrate or EDTA antigen retrieval depending on the specific antibody used, the buffer was added for 1 hour at 37 C then removed by washing three times with PBS. Cells and buds were blocked with 2% blocking buffer (Roche) for 30 mins at room temperature prior to addition of the primary antibody made up in 2% blocking buffer to the required dilution (See table 2.3), primary antibodies were incubated overnight at 4 C. Excess primary antibody was removed by washing with PBS three times for 15 mins then the secondary antibody was applied at the required dilution in 2% blocking buffer and incubated at room temperature for 2-3 hours in the dark. The excess secondary antibody was then removed by applying three 15 min washes with PBS. Nuclear counter-staining was conducted using 4,6-diamidino-2-phenylindole (DAPI; Sigma) at 1:1000 in PBS for 20 mins at room temperature and was removed with three washes with PBS prior to mounting the coverslips on glass slides using aqueous mounting media (GelMount, Sigma). 2.2.E. RT-PCR RNA from BECs was harvested from 2x 35mm dishes in 1ml Tri-reagent (Sigma) and removed from the dish with a cell scraper. RNA from buds required the pooling of 10 buds into 1ml of Tri-reagent. RNA was isolated according to the manufactures instructions. Briefly, 200μl of chloroform was added to the Tri-reagent and mixed for 2-3 minutes the samples were centrifuged at x g for 15 mins at 4 C. The colourless top phase of the separation was removed to a new tube and 500μl of isopropanol was added for 10 minutes prior to centrifugation of the sample at x g for 10 minutes. The supernatant was removed and pellet washed with 1ml 75% ethanol prior to centrifugation at 7500x g for 5 minutes. The pellet was briefly air dried and re-dissolved in RNase-free water. The concentration of all RNA was measured using the 260nm and 280nm absorbance ratio. The samples were DNase treated using RNase-free DNase (Ambion) according to the manufacturer s instructions. The nm ratio was re-checked after DNase 54
56 treatment and samples tested for genomic DNA contamination by running a β-actin control PCR prior to RT. Reverse transcription was carried out using SuperScriptII reverse transcriptase (Invitrogen), 1μg of DNase treated RNA was mixed with 1μl 10mM dntp and 1μl Oligo (dt) 12-18, this was made up to a total volume of 10μl with water and incubated at 65 C for 5 mins. The samples were placed on ice for one min and 4μl of 5x RT buffer added along with 2μl 0.1M DTT, 1μl of RNase Out and 1μl SS II RTase (Invitrogen), this was incubated at 42 C for 52 mins prior to inactivation of the enzymes at 70 C for 15 mins. PCR was carried out using 2μg of cdna, 1μl of forward and reverse primers of interest and 14μl of ReddyMix (Abgene) PCR master mix. The PCR cycle was selected according to the specific annealing temperature of the primers used (see table 2.5). The PCR products were then run on a 2% agrose gel containing 2% ethidium bromide and were visualised using the alpha imaging system gel reader 3400 (Alpha Innotech). 2.2.F. Western Blotting for Pdx1 and Insulin Western blotting of protein extracted from BEC cells was performed in order to detect Pdx1 and insulin. For Pdx1 detection in BECs, protein was collected from 70-80% confluent T75 tissue culture flasks by trypsinising at 37 C for 3-5 mins until cells could be removed by gentle tapping and centrifuged for 4 mins at 180 g.. The resulting pellet was washed twice with PBS and finally re-suspended in 100μl of Pdx1 lysis buffer (50mM Tris-HCl (ph 8), 150mM NaCl, 1% (v/v) Triton-X 100, 1mM EDTA and 1:100 Protease inhibitor cocktail). After addition of the lysis buffer the samples were mixed gently at 4 C for 15 mins and centrifuged at x g for 20 minutes, the supernatant was removed to a new tube and stored at -80 C until required. The concentration of protein in each sample was quantified using the BioRad protein quantification assay and absorbance at 595 nm and compared to known standards according to the manufacturer s instructions. A total of 25μg of protein was used for Pdx1 western blotting and made up to a total volume of 10μl in lysis buffer, to this 10μl of Pdx1 sample loading buffer (4% SDS (w/v), 55
57 20% glycerol (v/v), 0.004% Bromophenol Blue, 0.125M Tris-HCl (ph 6.8) and 5% (v/v) Beta-mecaptoethanol) was added, the sample was then heated to 100 C for five mins. Once prepared samples were loaded into a 10% Tris-HCl gel (Criterion), and the SDS- PAGE run at 120v for 90 mins in Pdx1 running buffer (25mM Tris-HCl, 192mM glycine and 0.1% (w/v) SDS). On completion of the SDS-PAGE the gel was removed and equilibrated in transfer buffer. Immun-Blot PVDF (polyvinylidene fluoride) membrane (BioRad) was presoaked in Methanol for 10 minutes then equilibrated along with the gel in transfer buffer (25mM Tris-HCl, 192mM glycine and 20%(v/v) Methanol ). The transfer was run at 100v for 40 minutes in a Trans-Blot electrophoretic transfer cell (BioRad). The membrane was blocked with 4% non-fat milk solids (Marvel) in PBS-T (PBS with 0.1% v/v Tween-20; Sigma) for 1 hour and then primary rabbit anti-pdx1 antibody (rabbit polyclonal anti- PDX antibody was made by Professor Jonathan Slack against an 18-amino-acid C-terminal peptide conjugated to keyhole limpet haemocyanin) added overnight at 1:100. The excess primary antibody was removed with three washes of PBS-T prior to the addition of the HRP-conjugated secondary antibody at 1:5000 for 1 hour. The excess secondary antibody was washed three times with PBS-T and visualized using ECL plus western blotting analysis system (Amersham), according to the manufacturer s instructions. Protein for western blotting was extracted from 20 pooled buds by scraping and homogenising in Insulin lysis buffer (0.18M HCl in 35% (v/v) ethanol and 1:100 protease inhibitor cocktail). A total volume of 100µl of lysis buffer was used to collect all 20 buds which were sequentially homogenised through 25 and 30G needles. The lysis buffer and protein was then rotated overnight at 4 C prior to centrifugation at 13000rpm for 10 mins and neutralisation of the HCl with equimolar amounts of NaOH. Protein content was measured using BioRad protein quantification assay as for cells. A total of 5µg protein was mixed with equal volumes of 2x insulin sample loading buffer (200mMTris-HCl (ph6.8), 40% (v/v) glycerol, 1% (w/v) SDS, 0.01% (w/v) coomassie brilliant blue R250) and heated to 100 C for 5 mins. Once prepared, samples 56
58 were loaded onto a pre-cast Criterion 16.5% Tris-Tricene gel (BioRad) in insulin running buffer with ultra-low range molecular marker ( KDa; Sigma) and subjected to SDS-PAGE at 50v for 10 mins, followed by 120v for 90 mins in insulin running buffer (0.1M Tris-HCl, 0.1M tricene, 0.1%(w/v) SDS). On completion of the SDS-PAGE the gel and PVDF membrane were equilibrated in transfer buffer as for Pdx1 western and the transfer conducted 25v for 10 mins on a Trans-Blot SD semi-dry electrophoretic transfer cell (BioRad). The membrane was blocked with 4% non-fat milk solids (Marvel) in PBS-T (PBS with 0.1% v/v Tween-20; Sigma) for 1 hour and incubated with rabbit polyclonal anti-insulin antibody (Sigma) at 1:100 overnight at 4 C on a rocker. The primary antibody was removed with stringent PBD-T washes and incubated with the secondary anti-rabbit, HRP conjugated antibody (Vector) at 1:1000 at room temperature. The secondary antibody was washed three times with PBS-T and visualized using ECL plus western blotting analysis system (Amersham), according to the manufacturer s instructions. 2.2.G. Glucose and Amino Acid Stimulated Insulin Secretion A ssay and ELISA The function of pancreatic beta-cells was tested by challenging with either glucose or amino acids. Twenty buds were required and pooled for each glucose or amino acid challenge assay. Buds were first washed with PBS then incubated with phenol red-free DMEM (Sigma) with either 5.5mM glucose (control glucose) or 25mM glucose (high glucose), for 1 h at 37 C. For the amino acid challenge assay, buds were incubated in phenol red-free DMEM with either 0.1mM non-essential amino acids (NEAAs; Gibco) for control or 0.2mM NEAAs for high amino acid treated buds, also for 1h at 37 C. After incubation for 1h media was collected and concentrated using a centricon YM-3 centrifugal device with a normal molecular weight cut-off limit of 3KDa (Millipore) and centrifuged at 4000x g for 40 mins at 4 C in a swinging bucket centrifuge. Approximately 200µl of concentrated media was retrieved and mixed 1:100 with protease inhibitor cocktail (containing 104mM 4-(2-aminoethyl)benzenesulfonyl 57
59 fluoride (AEBSF), 1.5mM pepstatina, 1.4mM E-64, 4mM bestatin, 2mM leupeptin, and 80µM aprotinin Sigma) prior to short term storage at -80 C. Protein was also isolated from the buds by acid/ethanol extraction as for insulin western blots. Total protein in the media was measured using Roti -Nanoquant (Carl Roth GmbH) protein quantification system according to the manufacturer s instructions and total protein in the pellets was quantified using BioRad protein quantification assay as for insulin westerns. The ELISA was performed using an ultrasensitive mouse insulin ELISA kit (Mercodia), using the test procedure for the 5µl sample volume as per the manufacturer s instructions. Briefly 25µl of calibrator 0 was added to all wells of a 96 well plate, 5µl of either calibrator 3-7 or 5µl our samples were added to sample wells in triplicate. 50µl of enzyme conjugate solution was added to each of the wells and incubated on a plate shaker at rpm for two hours at room temperature. After incubation each well was washed six times with wash buffer and samples were incubated with 200µl of 3,3,5,5 -Tetramethylbenzidine substrate (TMB) for 30 mins at room temperature. 50µl of stop solution was added to each well after incubation and absorbance measured at 450nm using an automated plate reader. 2.2.H. Measurements and Statistics Fluorescent images were collected using a Leica DMRB compound microscope. All experiments were conducted at least three times. Numerical data is recorded as the mean of three experiments ±SE and analysed for statistical significance using a student s t-test. 58
60 Chapter.3. Transdifferentiation of BECs to Hepatocyte and Pancreatic Lineages 3.1. Introduction 3.1.A. Cholangiocytes Cholangiocytes are intrahepatic bile duct cells that form the ducts of the liver; they are responsible for the collection, modification and transportation of bile from hepatocytes into the common hepatic duct [8]. Cholangiocytes develop from the ductal plate at approximately eight weeks of gestation in humans from a bipotential precursor population of hepatoblasts which also give rise to hepatocytes [149]. The differentiation of cholangiocytes from periportal hepatoblasts is distinguished by strong expression of cytokeratin 7 (CK7) and binding sites for the lectin dolichos biflorus agglutinin (DBA) in the basal lamina, followed by expression of cytokeratin 19 (CK19) and binding sites for the lectin peanut agglutinin (PNA) as development progresses [150]. In adult life the cholangiocytes of the intrahepatic duct are thought to be heterogeneous both in terms of morphology and functional activity. Morphologically, cholangiocytes increase in size as they extend from the canals of Hering to the hepatic duct and can be broadly divided into small cholangiocytes (<15μm diameter) and large cholangiocytes (>15μm) in rat bile ducts. In humans, small ducts include the cholangiocytes of the bile ductules (<15μm), which are sometimes referred to as cholangioles, interlobular bile ducts ( μm) and septal bile ducts ( μm), while large ducts include the cholangiocytes of the area ducts ( μm), segmental ducts ( μm) and hepatic duct (>800μm) [151]. It has long been thought that the main function of cholangiocytes is the modification of bile by secretion and re-absorption of water and electrolytes. However, recent work has shown significant heterogeneity in the function of small and large cholangiocytes. Microarray analysis of gene expression in large and small cholangiocytes has revealed that small cholangiocytes more strongly express proteins related to cell proliferation, such as Histone H3 and express fewer proteins related to differentiation such as 59
61 Aquaporin 8 [147]. These observations have lead to the hypothesis that small cholangiocytes are more immature and undifferentiated compared to the larger ducts [147]. The hypothesis that small cholangiocytes are more undifferentiated than large cholangiocytes is also supported by the observation that small bile ducts proliferate in response to Carbon tetrachloride (CCl 4 ) damage and begin to express proteins related to differentiation, while large cholangiocytes apoptose [152], implying that small cholangiocytes may act to replace the lost large cholangiocytes. The exact function of the small cholangiocytes is unclear as they do not express the secretin receptor (SR) or somatostatin receptor (SSTR 2 ) which allows the large cholangiocytes to participate in hormone regulated bile secretion (Fig 3.1) [151]. Furthermore the water content of the bile is modified by selective secretion and re-absorption via aquaporins (AQPs). Large cholangiocytes are known to express at least 6 different AQPs (AQP0, AQP1, AQP4, AQP5, AQP8 and AQP9), while small cholangiocytes express, at least AQP8 at significantly lower levels [147]. HCO 3 - Cl - /HCO 3 - exchanger Cl - CFTR H 2 0 Aquaporins Cl - camp camp SSTR 2 SR Somatostatin Secretin Figure.3.1. Mechanism of bile modification by large cholangiocytes Binding of secretin to the secretin receptor (SR) causes an increase in intracellular camp, activation of the cystic fibrosis transmembrane regulator (CTFR), Cl - efflux and subsequent Cl - /HCO 3 - exchanger activity which ultimately leads to bicarbonate secretion. In contrast binding of somatostatin to the somatostain receptor (SSTR 2 ) causes a reduction in intracellular camp which reduces bicarbonate secretion. Water is transported in and out of the cell by aquaporins. 60
62 3.1.B. Transdifferentiation of Cholangiocytes to Hepatocytes Hepatocytes can be generated from developmentally-related cell types such as pancreatic cells. Conversion of pancreatic cells to hepatocyte-like cells can occur both in vivo and in vitro. For example, feeding rats a copper-deficient diet for 8-10 weeks (in combination with a copper chelator) induces the appearance of hepatocytes in the pancreas [21]. The hepatocytes-like cells did not express any of the normal pancreatic markers (such as insulin or amylase) but expressed liver markers including albumin, carbamoylphosphate synthetase-i and glutamine synthetase [153]. Further in vivo studies have demonstrated that ectopic expression of KGF (Keratinocyte Growth Factor) under the control of the insulin promoter induces formation of hepatocyte-like cells in the islets of Langerhans [22]. In vitro transdifferentiation of pancreatic cells to hepatocytes has also been achieved via treatment of the rat pancreatic cell line AR42J-B13 (B13) cells with the synthetic glucocorticoid dexamethasone (Dex) [23]. Addition of Oncostatin M to the Dex enhances the hepatic phenotype [14, ]. The mechanism controlling the transdifferentiation of B13 cells to hepatocytes, is thought to involve activation of the transcription factor CCAAT/Enhancer binding protein beta (C/EBPβ) [23]. While the transdifferentiation of pancreatic cells to hepatocytes is well documented, the conversion of hepatocytes to cholangiocytes (and vice versa) is also possible. In vitro examples of bile duct to hepatocyte and hepatocyte to bile duct transdifferentiaton already exists in the literature. Rats subjected to bile duct ligation show periportal hepatocytes that undergo gradual transdifferentiation to biliary epithelial cells [156]. These form a ring of intermediate cells that express both biliary and hepatic markers similar to that observed in the ductal plate during embryonic development [156]. Similar results have been obtained using organoid cultures of hepatocytes maintained in the presence of HGF and EGF [157]. Bile duct to hepatocyte transdifferentiation has been observed in mice treated with carbon tetrachloride. Livers damaged by CCl 4 show duct cell and hepatocyte proliferation to regenerate the liver. However if the capacity of hepatocytes to proliferate is impaired, biliary cells are 61
63 thought to proliferate and differentiate to replace the lost hepatocytes [158], potentially through an intermediate cell type referred to as an oval cell. 3.1.C. Transdifferentiation of Cholangiocytes to Pancreatic Lineages As liver cells, cholangiocytes share a common developmental origin with pancreatic β- cells as they develop from adjacent regions of the foregut endoderm, thus satisfying the hypothesis that developmentally-related tissues may be capable of transdifferentiation. The observation that pancreatic digestive enzymes α-amylase, trypsinogen and lipase are expressed in foetal hepatocytes and cholangiocytes is further evidence of the developmental relationship between liver and pancreas [149]. Hepatocytes loose expression of these pancreatic digestive enzymes in adult life however in some large cholangiocytes, pancreatic enzyme expression not only becomes stronger but also changes from diffusely cytosolic to granular, but expression of pancreatic genes is not observed in the small cholangiocytes [149]. Some β-cells are found to occur naturally in the extrahepatic bile ducts of mice, these cells are not thought to be the result of metaplastic events, but rather develop embryologically and persist, with slow multiplication into adult life [37]. There is also evidence of heterotopic pancreas (pancreatic cells that occur outside of the pancreas) in both normal and diseased human cholangiocytes at a frequency of 4.1%, the heterotopic pancreas consists of acinar cells, centriacinar cells and pancreatic duct-like cells, however no β-cells or islet-like structures were observed [159]. Transdifferentiation of mature cholangiocytes to β-cells has been observed in the extrahepatic biliary epithelium of Hes1 knockout mice, which has been found to contain pancreatic endocrine and exocrine cells. Hes 1 (Hairy Enhancer of Split 1) usually represses the proendocrine gene Ngn3 and, in the absence of Hes 1, pancreatic genes are expressed and islet-like structures are observed in the biliary epithelium [152]. Transdifferentiation of hepatocytes to β-cells has been demonstrated by several labs [40-41, 43-44, 49], and as both cholangiocytes and hepatocytes develop from the same bipotential precursor population it is proposed that cholangiocytes may be converted to β-cells using similar mechanisms. Hepatocyte transdifferentiation to β- 62
64 cells has been achieved by expression of the pancreatic transcription factor Pdx1 both in vitro, using the HepG2 cell line[160] and in vivo, using Pdx1 expression and/or expression of other pancreatic transcription factors including NeuroD, Ngn3, MafA and BetaA2 [40-41, 43-44, 49]. 3.1.D. The BEC Line as a Model of Normal Cholangiocytes Primary isolated cholangiocytes can be isolated from either rats or mice following collagenase perfusion of the liver. However cholangiocytes represent only 5% of liver cells and thus isolation by this method leads to very low cell yields. Primary cholangiocytes also suffer from diminishing viability after isolation as well as dedifferentiation in culture [161]. For these reasons a model of normal mouse cholangiocytes was obtained from Dr Ueno, Tohoku University School of Medicine, Japan. The cell line is referred to as Biliary Epithelial cells BECs. The cell line was produced by isolating mouse cholangiocytes followed by transformation with the SV40 large T antigen, and subsequent cloning to establish cell lines [147]. Stable BEC lines were found to express markers of normal cholangiocytes including Cytokeratin 19 (CK19) expression [147]. BECs also demonstrated, at least some functional characteristics of primary cholangiocytes in terms of secretin-induced camp elevation [147]. 3.1.E. Chapter Aims This chapter aims to: 1. Characterise the expression of hepatic and pancreatic genes in the BEC line, by immunostaining and RT-PCR, to confirm that the line is a robust model for normal cholangiocytes and identify potential for transdifferentiation. 2. Establish an optimised protocol for efficient transgene expression in BECs, using adenoviral infection. 3. Overexpress hepatocyte-specific, candidate master-switch genes, including C/ebpα, C/ebpβ and Hnfα in BECs to induce transdifferentiation to hepatocyte-like cells. 63
65 4. Treat BECs with extracellular factors that have been shown to induce hepatic gene expression to induce transdifferentiation. 5. Overexpress pancreatic, candidate master-switch genes, including Pdx1, Ngn3, NeuroD and Pax4 to induce up-regulation of pancreatic genes including Amylase, Glucogon and Insulin. 64
66 3.2. Results 3.2.A. Characterisation of the BEC Line 3.2.A.1. The BEC Line Expresses Markers Typical of Normal Cholangiocytes Cholangiocytes express cytokeratins 7 and 19 as well as Epithelial-specific cadherin (Ecad)[162]. In order to investigate the phenotype of the BEC line we initially determined the expression pattern of cytokeratin 7, 19 and E-cad. The BEC cell line was positive for all three cholangiocyte markers. Many of the BECs expressed the epithelial marker E- Cad (Fig 3.2 C). In contrast, the staining for the cytokeratins was more heterogenous (Fig 3.2 A-B). The BECs strongly expressed CK7 and 19 and although these cytokeratins are not exclusively cholangiocyte markers (they are also thought to be expressed in oval cells of preneoplastic or injured livers [163]), but they are not expressed in hepatocytes. Surface markers known to be expressed by cholangiocytes include connexion 43 (Cx43) and the lectins Dolichos Biflorus Agglutinin (DBA) and Peanut Agglutinin (PNA)[162]. Connexin 43, PNA and DBA are all expressed in the BEC population (Fig.3.2 D-F). We used semi-quantitative RT-PCR to determine the expression of cholangiocyte markers in BECs, primary mouse hepatocytes and in a mouse insulinoma cell line, MIN6. At the gene level, CK7, CK 19 and E-cad were expressed in the BEC line (Fig.3.3). In addition, RT-PCR was used to determine the expression of other cholangiocyte markers including Gamma-Glutamyl Transpeptidase (GGT), the transcription factors Hepatocyte Nuclear Factor 1β (Hnf1β) and SYR (sex determining region Y)-box 9 (Sox 9). GGT is an enzyme expressed throughout the liver, bile ducts and kidney and is responsible for metabolism of glutathione; the BECs showed expression of GGT although the hepatocyte control did not. Hnf1β is known to be expressed in both hepatocytes and cholangiocytes and is present in the BECs (Fig.3.3). Sox9 is a transcription factor characteristic of ducts in both the liver and pancreas and, as expected, is present in the BECs. Surprisingly, we also observed expression of Sox9 in primary mouse hepatocytes (Fig 3.3). This was unexpected and presumably reflects the dedifferentiation of mouse hepatocytes to a progenitor-like state (similar observations 65
67 have been made in primary rat hepatocyte populations K. O Neill and D. Tosh personal communication). 3.2.A.2. The BEC Line Expresses Some Markers Typical of Mature Hepatocytes In order to convert BECs to hepatocyte or pancreatic-like beta-cells we wished to determine the expression of transcription factors in the cell line and then ectopically express the missing transcription factor(s) based on our understanding of normal developmental biology. The liver enriched transcription factors CCAAT/Enhancer Binding Protein α and β (C/ebpα and C/ebpβ) and Hepatocyte Nuclear Factor 4 α (Hnf4α) are transcription factors involved both in liver development and in the normal functions of mature hepatocytes. Primary cholangiocytes are known to only express C/ebpα, C/ebpβ and Hnf4α at very low levels [85]. The BECs showed weak staining for C/ebpα similarly in most cells (Fig.3.4 C and D), however they strongly express C/ebpβ and Hnf4α (Fig.3.4 E-H). Despite the presence of hepatocyte transcription factors the BECs did not express the functional hepatocyte proteins albumin or transferrin (Fig. 3.4 B and J), suggesting that either the level of expression may be important or that additional liver-enriched transcription factors are required to promote hepatic transdifferentiation. The immunostaining data for the transcription factors was confirmed by semiquantitative RT- PCR. C/ebpα, β and Hnf4α were expressed in the BECs (Fig.3.5). These transcription factors are normally restricted to hepatocytes in the adult liver. Other liver enriched transcription factors were also studied by RT-PCR including Hnf1α, Hnf1β and Hnf6 (Fig.3.5). The BEC line expressed Hnf1α which is uncharacteristic of normal cholangiocytes; however the expression was weak in comparison to that observed in primary isolated mouse hepatocytes. Hnf1β and Hnf6 were robustly expressed in the BECs. 66


68 67

69 68


70 69

71 70
72 3.2.A.3. Some BECs Express the Pancreatic Transcription Factor Pdx1 but Not Other Typical Pancreatic Markers We determined the expression of the key pancreatic transcription factor Pdx1 in BECs and in control Min6 cells. In the Min6 cell line the Pdx1 was exclusively localised to the nuclei of cells. Surprisingly BECs also expressed Pdx1. The level of expression was weaker compared to that in Min6 cells when images were collected under the same condition (Fig.3.6). Two distinct patterns of Pdx1 expression were observed in the BECs. Pdx1 was either weakly expressed in the nucleus (Fig 3.6 C and D) or in the perinuclear region (Fig 3.6 E and F) of BECs. The nuclear localisation of Pdx1 is important to regulate target gene transcription effectively. Due to the atypical subcellular staining pattern of Pdx1 in BECs (Fig. 3.6) the expression of Pdx1 protein was confirmed by western blotting (Fig 3.7 A and B). We extracted protein from BECs and Min6 cells and probed for Pdx1. Two bands were present on the western blot for Pdx1 at around 160 and 46 kda, the 46kDa band represents that active form of Pdx1. The expression of Pdx1 was lower in BECs compared to Min6 cells. However the blot confirmed the Pdx1 protein was present in the BECs. RT-PCR results showed that the pro-endocrine transcription factor Ngn3 or indeed the transcription factors downstream of Ngn3, NeuroD or Pax4 were not expressed in BECs (but NeuroD and Pax4 were both expressed in Min6 cells)(fig.3.7 C). The Ngn3 antagonist Hairy Enhancer of Split 1 (Hes1) was expressed in BECs (as well as hepatocytes) (Fig.3.7 C), but not in Min6 cells. Insulin I and II were not expressed in BECs but both were present in Min6 cells (Fig. 3.7 C). Surprisingly, we also observed expression of Insulin II in primary mouse hepatocytes (Fig. 3.7 C). 71


73 72

74 73
75 3.2.B. Optimisation of BEC Culture Conditions for Infection with Adenoviral Vectors We normally seeded BECs at a density of 4x10 5 cells/ml. At this density the BECs grow very rapidly, and even when seeded at lower density (we experimented with seeding densities as low as 4x10 3 cells/ml) the cultures become overconfluent and die within 3-4 days. Furthermore if cells were seeded at low density, then infected with adenovirus and allowed to grow, only a small proportion of the resulting population will have been exposed to the virus and express the transgene. It is therefore desirable to maintain the cells for at least five days to achieve robust transgene expression following adenoviral infection. The growth conditions of the BECs were therefore changed to achieve viable five day cultures prior to optimisation of adenoviral infection protocol. 3.2.B.1. Culture of BECs under Different Media Conditions Alters Cell Viability but not the Growth or Phenotype In order to optimise the growth conditions for adenoviral infection we tested a number of different media. We selected the media based on our previous experience of cell culture in the lab. The BECs were cultured in either control DMEM, RPMI 1640, DS (DMEM supplemented with 50µg/ml bovine pituitary extract and 5ng/ml EGF), KS (Keratinocyte serum free media supplemented with 50µg/ml bovine pituitary extract and 5ng/ml EGF), or KDS (KS media supplemented with 10nM Dexamethasone). The BECs were cultured for three days and assessed in terms of culture confluence, growth pattern (cells observed in clumps or single cells), the presence of dead cells in the media and cell morphology. On day three the BECs were fixed and immunostained for the cholangiocyte marker CK7 to determine whether the marker expression was maintained under the different culture conditions examined. BECs cultured in control DMEM rapidly became almost confluent by day three, they formed clusters of cells and as these clusters became overconfluent and cells began to appear in the media. DMEM cultured BECs had flattened epithelial-like morphology by day three (Fig.3.8 A). As previously, CK7 was expressed widely, although not all cells expressed CK7 to the same level, suggesting some heterogeneity within the cell 74
76 population (Fig.3.8 B), CK7 expression was most robust in cells in the middle of clusters where cell-cell contact was maintained. BECs were cultured in RPMI media supplemented with 10% FBS and 2mM L-glut, RPMI is a basal media known to support a wide range of cell types, including human lymphoid cells [164] and myeloma cell lines [165]. BECs cultured in RPMI were also almost confluent by day three as in DMEM controls (Fig.3.8 C). RPMI cultured BECs also grew in clusters of cells although counterstaining of nuclei with DAPI demonstrated that the cells appeared less dense within the clusters (Fig.3.8 D). The morphology of cells grown in RPMI media was similar to controls (Fig.3.8 C). CK7 expression appeared to be weaker (Fig.3.8 D). BECs were cultured in DS media composed of DMEM supplemented with 10% FBS, 2mM L-glut, 50µg/ml bovine pituitary extract and 5ng/ml EGF. DS media is known to promote dedifferentiation of cultured hepatocytes and cause up-regulation of ductal genes (K. O Neill and D. Tosh personal communication). BECs cultured in DS media did not form clusters as in controls, but rather grew as individual cells that eventually grew to form epithelial sheets (Fig.3.8 E). DS cultured BECs were not confluent by day three (Fig.3.8 E). The morphology of DS cultured BECs was comparable to controls, but CK7 expression may be weaker within sheets of cells (Fig.3.8 F). BECs were cultured in KS media, composed of KSFM supplemented with L-glut, bovine pituitary extract and EGF. KS media has previously been used by our lab to maintain the hepatic phenotype of cultured hepatocytes for long culture periods and prevent dedifferentiation [166]. The morphology (Fig.3.8 G) and CK7 expression (Fig.3.8 H) in BECs were unaffected by culture in KS media compared to DMEM culture. BECs were also cultured in KDS media which is composed of KS media supplemented with 10nM dexamethasone, this is thought to maintain and improve hepatic gene expression of hepatocytes cultured for up to 2-3 weeks. BECs cultured in KDS showed no change in phenotype (Fig.3.8 I) or CK7 expression (Fig.3.8 J). 75


77 76
78 3.2.B.2. Altering Supplement Concentrations in Growth Media Allows Control of Growth As an alternative approach to using different media to reduce the growth of the BECs we also tried reducing the concentrations of culture supplements. BECs were cultured in varying concentrations of L-glut: 2mM (control), 1.2mM and 0.4mM. Lowering the L-glut concentration to 1.2mM allowed four days growth (Fig.3.9 D-G). Further reducing the L-glut concentration to 0.4mM allowed for five days of culture (Fig.3.9 H-L). BECs were also cultured in 10% FBS (control), 1% FBS and 0.1% FBS. Lowering FBS concentration to 1% allowed the cells to grow for 5 days (Fig.3.10 D-H). Further reduction of the FBS concentration to 0.1% allowed for extended culture (Fig.3.10 I-M). Lowering the FBS concentration to 1% seemed to be the most efficacious method of reducing BEC growth. We therefore decided to use an FBS concentration of 10% for adenoviral infection and after 12 hours of infection the media was changed to DMEM containing 1% FBS and 2mM L-glut for the remaining five days of culture. 3.2.B.3.BECs can be Infected with Adenoviral Vectors BECs were infected at a multiplicity of infection (MOI) of 100 and 500 infectious units per ml (ifu/ml). Although GFP expression was observed, the number of cells expressing the transgene was low (around 2-5% of cells) (data not shown). As expression was low the infection protocol was altered to include 10µg/ml DEAE-dextran. Dextran has been shown to improve viral infection rates [167]. BECs were unaffected by dextran treatment and showed no negative effects of infection with high titre virus up to an MOI of 100 ifu/ml (Fig B). Infection with GFP at an MOI of 100 gave approximately 10% infection within three days (the point at which GFP expression peaks, although all cells were cultured for five days). Infection at MOI 500 gave 30-50% infection (Fig.3.11 C) within three days and as there were no obvious side-effects of using such high titres we used an MOI of 500 ifu/ml plus 10µg/ml dextran for the remainder of the adenoviral infections. No GFP or autofluorescence was observed 77
79 when BECs were infected with the Ad-Null virus (Fig.3.11 A), an empty vector containing no transgene but used as a virus control. 78

80 79


81 80


82 81
83 3.2.C. Transdifferentiation to a Hepatic Phenotype 3.2.C.1. Overexpression of C/ebpα and β Causes Increased Expression of Hepatic Markers Albumin and GS The hepatic transcription factors C/ebpα and β have previously been shown to become expressed in the pancreatic AR42J-B13 cell line when treated with Dex. Expression of C/ebpβ in the transdifferentiated cells correlated with induction of the hepatocyte phenotype suggesting that the C/ebp may represent a potential master-switch gene for hepatocyte development. We therefore wished to test whether ectopic expression of C/ebpα and β were able to induce a hepatocyte phenotype in the BECs. BECs were infected with C/ebpα and β, both alone and in combination, for five days. RNA was extracted from treated cells and RT-PCR analysis performed as a high throughput analysis of relative gene expression. Neither C/ebpα nor β alone or in combination was able to elicit an increase in the early hepatocyte markers alphafetoprotein (AFP) or the transcription factor Hnf4 (Fig. 3.12). Infection also failed to induce expression of important hepatic enzymes expressed including (i) carbamoylphosphate synthetase (CPS), a urea cycle enzyme important in ammonia detoxification, (ii) glucokinase, the first enzyme in the glycolytic pathway and (iii) PEPCK, an enzyme involved in gluconeogenesis. Infection with C/ebpα and β in combination increased expression of the hepatocyte marker albumin (Fig. 3.12). Although Albumin was not detected in the control BEC cell line at low cycle numbers by PCR (Fig 3.12 and 13) or by immunoflourescence (Fig 3.4), increasing the cycles used in the PCR allowed for detection of a low level of Albumin transcript in control BECs (Fig 3.14). The presence of low levels of Albumin transcript in control BECs indicates albumin up-regulation rather than de-novo expression. Dual infection also increased the expression of the ammonia detoxification enzyme glutamine synthetase (GS), an enzyme restricted to the perivenous zone of the mature liver sinusoid. GS transcript was also detected at low levels in control BECs, when the cycle number used for PCR was increased (Fig 3.13). 82
84 These data suggest that infection with C/ebpα and β in combination can increase expression of some hepatic genes that are expressed at low levels in the BECs. 3.2.C.2. Overexpression of Hnf4 Causes an Up-Regulation of the Hepatic Markers AFP, C/ebpα and Albumin Expression Hnf4 is a transcription factor involved in liver development and (along with the C/ebps) in the normal functioning of mature hepatocytes. Both primary cholangiocytes and BECs express low levels of Hnf4. For this reason Hnf4 expression was increased in BECs by adenoviral infection for five days prior to collection of RNA for analysis. Ectopic Hnf4 expression alone caused an increase in C/ebpα but not C/ebpβ expression (Fig. 3.13). Albumin was once again increased, however this time independently of C/ebpβ expression as in previous experiments expression of both C/ebps were required (Fig. 3.13). Glucokinase and PEPCK expression was not observed in BECs following infection with Hnf4 (Fig.3.13). AFP expression was observed, after infection with Hnf4 (Fig.3.13). AFP is typically found in foetal hepatocytes, however expression is also observed along with albumin in atypical mature hepatocytes, this perhaps indicates an immature hepatocyte-like induction caused by Hnf4 overexpression. 3.2.C.3. Combining C/ebpα, β and Hnf4 Overexpression in BECs does not Further Enhance the Hepatic Phenotype Having established that infection with either C/ebps or with Hnf4 can increase some hepatic gene expression, we attempted to improve the hepatic phenotype of the resulting cells by combining ectopic C/ebp and and Hnf4 expression. No adverse effects on the cells were observed due to triple infection for five days, and in this time no phenotypic change in the BECs was observed. Expression of AFP, albumin and GS was again observed (Fig.3.14), however levels were comparable to previous experiments (Figs 3.12 and 3.13). No change in other hepatic genes was observed indicating the cells are probably immature. 3.2.C.4. Treatment with Extracellular Factors Cannot Induce Transdifferentiation to a Hepatic Phenotype in BECs 83
85 Studies have previously shown that application of extracellular factors can either induce hepatic transdifferentiation or improve the phenotype of transdifferentiated cells ([23, ]. For this reason a number of commonly used liver-specific factors were used to treat the BECs for six days. These factors include: Dexamethasone (1µM), Insulin/Transferrin/Selenium (ITS; 1X), Oncostatin M (10ng/ml), Nicotinomide (Nic; 20mM) and Sodium butyrate (0.5mM). In the case of Dex, ITS, OSM and Nic, expression of C/ebpα, C/ebpβ, and Hnf4 was unchanged and there was no further induction of typical hepatocyte markers was observed (Fig. 3.15). In the case of NaB, the expression of C/ebpα, C/ebpβ and Hnf4 was reduced and a small increase in GS was observed (Fig 3.15). 84

86 85

87 86

88 87

89 88
90 3.2.D. Transdifferentiation to a Pancreatic Phenotype 3.2.D.1 Overexpression of Pancreatic Transcription Factors Weakly Induces Insulin II Expression in BECs The developmental relationship between cholangiocytes and pancreatic cells is not as close as that between cholangiocytes and hepatocytes. However the development of pancreatic cells and liver cells from adjacent regions of the foregut endoderm may indicate that only a few transcription factors may control their differences. For this reason the BECs were infected with a combination of transcription factors which have been shown to induce insulin expression in hepatocytes [171]. Viruses containing the transcription factors Pdx1, Ngn3, NeuroD and Pax4 were used to infect the BECs, both alone and in combination using the standard infection protocol for BECs. Although Pdx1 is already expressed in the BEC line (Figs. 3.6 and 3.3.7) it was found at very low levels and not in the correct subcellular location, therefore overexpression using viral vectors may be beneficial in terms of inducing a pancreatic phenotype. Expression of any of the four pancreatic transcription factors alone was not sufficient to increase the expression of any pancreatic marker genes. Combined infection with all four transcription factors (Pdx1, Ngn3, NeuroD and Pax4) resulted in low level upregulation of insulin II (Fig 3.16) but not insulin I, which is a potential indicator of an immature β-cell-like phenotype. 89

91 90
92 3. 3 Discussion The goal of this chapter was to induce transdifferentiation of BECs to hepatocyte-like or pancreatic lineages by overexpression of proposed master switch genes. We first demonstrated that BECs expressed a range of markers typical of normal cholangiocytes including CK7, Ck19, E-cad, GGT, Hnf1β, Sox9 and the lectins DBA and PNA. Surprisingly we also observed expression of some transcription factors typically found in mature hepatocytes including C/ebpα, β and Hnf4α but not expression of other hepatic proteins such as albumin and transferrin. We also observed atypical staining of the pancreatic transcription factor Pdx1. We did not observe expression of any other pancreatic transcription factors such as Hes1, NeuroD, or Pax4 nor did we observe insulin expression. We demonstrated that culturing BECs in reduced FBS (1%) allowed for infection with adenoviral vectors and the cells could be maintained for five days allowing optimal adenoviral infection. Overexpression of the transcription factors C/ebpα and β in combination caused increased expression of the hepatic markers albumin and GS. Upregulation of albumin and GS was also observed in BECs on overexpression of Hnf4α and Hnf4α overexpression also increased C/ebpα expression. Co-expression of C/ebpα, β and Hnf4α did not improve the hepatic phenotype of BECs. Overexpression of a combination of four pancreatic transcription factors, Pdx1, Ngn3, NeuroD and Pax4 in BECs caused initiation of insulin II expression but no other pancreatic genes were affected. 3.3.A. Characterisation of the BEC Line In order to test the utility of the BEC line for use in studies on the transdifferentiation of cholangiocyte-like cells to hepatocytes or pancreatic beta-cells, we determined the expression of cholangiocyte markers by a combination of PCR and immunohistochemistry. We confirmed the expression of the markers CK7, CK19, E-cad, and Cx43 by both PCR and immunostaining. Although these individual markers are not specific for cholangiocytes their combined presence in the BECs indicates that the cell line retains the ductal epithelial phenotype of normal cholangiocytes (Fig. 3.2). While 91
93 we observed expression of these markers there was some heterogeneity of expression in the immunostaining results. Cholangiocytes show innate heterogeneity within the biliary system, both in terms of phenotype and function [151] and this is probably the reason for the heterogeneity observed here. As well as CK7, CK19, E-cad, and Cx43, we also determined the expression of GGT in BECs. GGT is an enzyme expressed in ductal cells as well as hepatoblasts and foetal hepatocytes but not in mature hepatocyte [161]. We found GGT was expressed in the BECs (Fig 3.3). In addition to CK7, CK19, E-cad, and Cx43, cholangiocytes also express a number of key transcription factors. These transcription factors include Sox9, Hnf6 and Hnf1β (Fig 3.3). The expression of Hnf6 and Hnf1β in the BECs is further evidence of their typical cholangiocyte phenotype as Hnf6 is responsible for regulation of biliary tree development via Hnf1β. Hnf6 -/- mice lack expression of HNF1β in hepatoblasts or cholangiocytes indicating that HNF6 regulates HNF1β expression. Furthermore HNF6 -/- mice show no development of the ductal plate, their cholangiocytes differentiate from hepatoblasts much earlier than in normal mice and many more hepatoblasts differentiate to cholangiocytes than wild-type mice. This indicates that HNF6 not only restricts cholangiocyte development but also regulates the positioning of the developing duct [172]. Sox9 was shown to be a marker for adult liver progenitors during regeneration following different liver injury regimens including carbon tetrachloride administration [173]. Sox9 has many important functions in embryonic development including the differentiation of Sertoli cells during testis development and chondrogenesis [ ]. Grompe and colleagues have also demonstrated using lineage tracing techniques that the cells proliferating during progenitor-driven regeneration are the offspring of Sox9-expressing precursors [175]. These results together provide evidence of a critical role for Sox9 in progenitor cell activation in adult livers and given the presence of Sox9 in the PECs suggests that at least some, of the BECs may represent early progenitorlike cells. 92
94 Although hepatocytes and cholangiocytes arise from the same precursor population the mature cells differ significantly in terms of phenotype. Markers not usually expressed in cholangiocytes were observed during the course of the characterisation of the BECs; specifically Hnf4α, C/ebpα and C/ebpβ which are usually expressed strongly in hepatocytes but are barely detectable in cholangiocytes [172]. Expression of the transcription factors Hnf4α and Hnf1α is also indicative of a hepatocyte phenotype. Despite the unusual expression of hepatic markers in the BEC line they do not express typical markers of mature hepatocytes including albumin and transferrin. Although the cholangiocyte markers used (Fig 3.2 and 3.3) are typical of large cholangiocytes the appearance of some hepatic markers may indicate that the BEC population is more immature and therefore more like a small cholangiocyte population [152]. Expression of the key pancreatic transcription factor Pdx1 has not previously been observed in intrahepatic cholangiocytes but is observed in the extrahepatic biliary system during embryonic development [37]. Pdx1 expression is essential for pancreatic development [38, 176]. The expression of Pdx1 quickly becomes restricted to β-cells [177]. The immunostaining pattern of Pdx1 in the BECs appears to be perinuclear and weakly nuclear rather than being strictly restricted to the nucleus as might be expected (Fig.3.6). Perinuclear localisation may explain the absence of insulin expression in the BECs even in the presence of Pdx1 as it is only able to activate target genes when expressed in the nucleus. There is expanding evidence that Pdx1 may translocate from the perinuclear region to the nucleus in high glucose conditions and in the presence of GLP1 i.e. conditions under-which insulin production is required [ ]. Furthermore Pdx1 translocation out of the nucleus has been observed in the case of oxidative stress [177] and in the presence of the transcription factor FoxO1 [180]. However Pdx1 autoregulates its own expression, therefore lack of Pdx1 in the nucleus would be expected to lead to a decrease in Pdx1 transcription. The RT-PCR data suggests that the level of Pdx1 transcript remains high it is possible that the presence of Pdx1 transcript could be controlled by the low level of nuclear Pdx1 observed in the immunostaining and by western blotting. 93
95 The expression pattern of the BECs is similar to that found in normal cholangiocytes despite the appearance of some unexpected hepatic and pancreatic genes. The presence of these genes may indicate that the BECs represent a precursor population or be more representative of small cholangiocytes which are known to be less well differentiated than large cholangiocytes. The BECs are however a plentiful, easy to culture model of normal cholangiocytes in which to test many different combinations of genes and extracellular factors that may induce transdifferentiation towards hepatocytes or pancreatic β-cells. Primary cholangiocytes are notoriously difficult to isolate and culture successfully [161], and the BECs have been used by other groups as a model, of normal cholangiocytes [147, 181] to study gene expression and bile modification. The BECs can be used as a model on which to test factors to induce transdifferentiation prior to testing the optimal combination of factors in primary cells. 3.3.B. Optimisation of BEC Culture and Infection with Adenoviral Vectors In order to achieve expression of transgenes without the need for further subculturing, the rate of cell growth had to be reduced. In order to achieve this we cultured the BECs in different types of media including RPMI, DS, KS and KDS and looked at the cell density at day five. Unfortunately none of the media tested were sufficient to maintain the cells to make them suitable for infection (Fig.8). It has previously been shown that culture of primary hepatocytes in KDS media prevented de-differentiation in culture and maintained expression of liver-enriched transcription factors [182], whereas cells cultured in KS media rapidly lost their hepatic phenotype. Culture of BECs in KS or KDS media showed more dead cells in the media, however culture under these conditions resulted in no change in expression of cholangiocyte genes. In addition, there was a change towards typical hepatocyte morphology suggesting that additional factors may be required to direct the differentiation of cholangiocytes to hepatocyte-like cells (Fig. 3.8). Culture of BECs in normal DMEM but with a lower concentration of L-glut (1.2mM or 0.4mM) allowed cells to be maintained for up to five days. However, many cells failed to survive under these conditions (Fig.3.9). It is possible that the lower L-glut 94
96 concentration induces a stress response resulting in the loss in viability and phenotypic changes. It is known that stress-induced signalling pathways result in changes in cellular morphology and apoptosis, supplementation of media with 4mM L-glut was shown to decrease expression of stress related and apoptotic genes and improve cell survival [183]. Reduction of FBS concentration in the cell culture media allowed the required culture for five days. The optimal concentration of FBS in the media was found to be 1% and this was used subsequently for culture of BECs post-infection with adenoviral vectors. The optimal conditions for infecting the BECs were estimated by infecting them at different MOIs in the presence of 10ng/ml DEAE-Dextran (Fig. 3.11). Optimal conditions for infection of the BECs were found to be at an MOI of 500 for 12 hours of infection in 10% FBS media containing 10ng/ml DEAE-dextran, prior to changing media to 1% FBS for 5 days, these conditions led to an estimated efficiency of %. 3.3.C. Transdifferentiation to a Hepatocyte-like Phenotype 3.3.C.1. Overexpression of C/ebp α and β The CCAAT-enhancer binding proteins (C/EBP) are basic region/leucine zipper (bzip) transcription factors expressed during differentiation of adipose tissue and liver. C/ebpα suppression is thought to be a prerequisite of biliary cell differentiation in the hepatoblast population during development [184]. Another member of the C/ebp family, C/ebpβ, is required for the Dex-induced transdifferentiation of pancreatic B13 cells to a hepatocyte-like phenotype [23]. Based on this study, Westmacott et al demonstrated that both C/ebpα and C/ebpβ are present in the developing liver but not the pancreas [185]. Together, these observations suggest a role for the C/ebp family of transcription factors in hepatocyte development. C/EBPβ can be transcribed into one mrna, which can then be translated into three isoforms designated C/EBPβ, liver inhibitory protein (LIP) and liver activator protein (LAP) [186]. The 21-kDa LIP lacks the transactivation domain and acts as a dominant-negative form of C/EBPβ by heterodimerizing with full-length C/EBPβ [187]. Based on this information C/ebpα and 95
97 C/ebpβ (LAP the actvivated form of C/ebpβ) were over-expressed in the BEC line, both alone and in combination (Fig. 3.12). Although neither C/ebpα or β alone were sufficient to up-regulate any of the hepatic genes studied, co-expression of C/ebpα and C/ebpβ resulted in the up-regulation of albumin and glutamine synthetase (GS). The increase in albumin expression following ectopic on expression of C/ebps may be the result of direct activation of the albumin gene by C/ebpα, as it is known to bind to and activate the promoter of the albumin gene [ ]. Surprisingly, albumin gene activation was not achieved in the BEC line by over-expression of C/ebpα alone, which may indicate that albumin gene expression may be regulated by a combination of transcription factors, as is the case with hepatoblast to hepatocyte differentiation during embryonic development [190]. Ectopic expression of C/ebpβ alone was also not sufficient to up-regulate any of the hepatocyte genes studied. These observations may be consistent with data that demonstrates that different liver enriched transcription factors control the differentiation of hepatocytes during postnatal development [191] indicating that multiple transcription factors are required to form fully differentiated hepatocytes. It is well established that hepatic functions are heterogeneously distributed across the liver lobule or acinus [4]. The organisation of the functional unit of the liver (referred to as the hepatic acinus or lobule) is accompanied by functional heterogeneity at the cellular level. The unit is broadly divided into three zones: the periportal zone, which surrounds the afferent vessel and portal triad and receives blood rich in oxygen and nutrients, the intermediate zone, which surrounds the periportal zone and finally the outer, perivenous zone cells. Periportal and perivenous hepatocytes can be distinguished according to differences in function which run as gradients from one zone to the other. The functional gradients arise because the activities of key ratelimiting enzymes for some pathways e.g. hepatic fatty acid -oxidation are higher in the periportal zone whereas the activities of other enzymes e.g. the cytochrome P450 detoxification pathway enzymes are higher in the perivenous zone [192]. As a result most of the major hepatic functions exhibit differences in activity within the periportal and perivenous zones. Perhaps the most striking example of zonation is observed in the enzymes and pathways of ammonia detoxification. The liver contains two systems 96
98 for the removal of ammonia: the urea cycle and the enzyme glutamine synthetase (GS). The urea cycle enzymes (including carbamoylphosphate synthetase) are expressed in the periportal, intermediate and first few layers of the perivenous zone [193]. In contrast, GS is expressed in a complementary pattern in the last few layers of perivenous hepatocytes [194]. The up-regulation of the perivenous marker GS by C/ebpα and β over-expression was unexpected as there was no observed change in the expression of the periportal markers CPS or PEPCK (Fig. 3.12). There was also no alteration in HNF4 expression after infection with C/ebpα and β. There is evidence that C/ebp mrna is predominantly expressed in the perivenous region of the adult liver [195]. However, in situ hybridisation experiments have found the zonation of C/ebps to be so weak that it is unlikely that they are directly responsible for governing zonation [195]. Dexamethasone-treated rats showed an increase in glucokinase mrna in perivenous regions [196]. The expression of glucokinase was similar to the up-regulation of C/ebp mrna expression [196], indicating that C/ebps may be responsible for regulating glucokinase expression. Although GS expression was up-regulated by Dex treatment the pattern of C/ebp mrna and GS mrna expression was not overlapping enough to infer a direct relationship [196]. 3.3.C.2. Overexpression of HNF4 Hnf4 expression is known to be essential for both morphological and functional differentiation of hepatocytes, establishment of hepatic epithelium and maintaining normal liver architecture in postnatal life [76]. Over-expression of Hnf4 in BECs leads to an increase in C/ebpα, albumin and AFP expression (Fig. 3.13). Up-regulation of C/ebpα RNA by HNF4 was surprising as there is no evidence that HNF4 directly activates expression of C/ebps. Rats that have undergone partial hepatectomy followed by suppression of regenerative capacity of hepatocytes by AAF administration, are able to activate oval cell compartments to regenerate hepatocytes [190]. In this case Hnf4 expression is up-regulated early in oval cell activation and differentiation and is followed by activation of C/ebps [190]. However there is no 97
99 evidence that oval cell activation is as a direct result of Hnf4 and not other transcription factors [190]. The observation that albumin is up-regulated on Hnf4 over-expression may be the result of direct binding C/ebp to the upseream enhancer of GS, which is known to cause suppression of GS expression in periportal regions as [ ]. However it may also be evidence of HNF4 enhancement of the early periportal phenotype [197], although again no enhancement of PEPCK or CPS expression is observed following Hnf4 over-expression (Fig. 3.13). Furthermore Hnf4 has been shown to suppress expression of perivenous proteins [197] but this is not the case in BECs infected with HNF4 as there was no reduction in GS. Increases in AFP expression on Hnf4 over-expression may also be the result of indirect C/ebpα activation as the AFP gene has C/ebpα binding motifs in the upstream regulatory elements [184] and C/ebp binding has been shown to activate the AFP proximal enhancer [198]. However no increase in AFP was observed on expression of C/ebpα alone or in combination with C/ebpβ (Fig. 3.12). This may be explained by a synergistic relationship between Hnf4 and C/ebps which has been previously described resulting in the induction of hepatic genes. HepG2 cells do not express CYPs (Cytochromes P450), which are involved in drug metabolism in human hepatocytes, can be induced to express CYP2B6 and other phase I and II detoxification genes when infected with C/ebpα and Hnf4 in combination [199]. Combining C/ebpα, β and Hnf4 over-expression in the BECs did increase AFP, albumin and GS expression, however the level of expression was not significantly higher than that observed on expression of C/ebpα and β or Hnf4 infection alone, thus does not provide evidence for a synergistic relationship between C/EBPs and HNF4 in terms of inducing ductal to hepatocyte transdifferentiation. Although up-regulation of some hepatocyte genes (AFP, Albumin and GS) was observed following infection of BECs with the hepatic transcription factors C/ebpα, β and Hnf4 induction of a more mature hepatic phenotype was not possible. It is likely that this is due to the complex cross-regulatory cascades of transcription factors that are necessary to induce and maintain the normal hepatic phenotype [86]. It is also 98
100 possible that if we had maintained cells for longer periods of time in culture following adenoviral infection more pronounced differences may have been observed. Despite the close developmental relationship between biliary duct cells and hepatocytes this work demonstrates that a relatively complex network of interacting transcription factors may be required to control the conversion of one cell type to another. Only three hepatic transcription factors were used to induce direct transdifferentiation between duct cells and hepatocytes, however the literature describes many other transcription factors that may play important roles in hepatic differentiation such as, HNF1β, FoxA2 and DBP [190]. These three factors are all up-regulated in bile ducts on severe liver injury and oval cell activation [190], and are therefore additional factors that could be investigated as master regulators of bile duct to hepatocyte transdifferentiation. 3.3.D. Transdifferentiation to a Pancreatic Phenotype As previously discussed the transcription factors Pdx1, Ngn3, NeuroD and Pax4 have been used to induce transdifferentiation of HepG2 cells to pancreatic lineages in vitro [158] and hepatocyte to pancreas transdifferentiation in vivo [40-41, 43-44, 49]. For these reasons the four transcription factors were over-expressed, alone and in combination, in the BEC line. Over-expression of all four transcription factors increased the level of Insulin II mrna but did not alter the expression of other pancreatic genes including Insulin I, amylase or glucagon. Previous work demonstrated that mouse embryonic stem cells can be induced to differentiate into insulin producing cells [200]. Interestingly, induction of insulin II is achieved more readily than induction of Insulin I [200]. This work demonstrates that over-expression of pancreatic transcription factors is not sufficient to induce a ductal to β-cell transdifferentiation. Ectopic expression of transcription factors may not be the only method of inducing transdifferentiation in this case. Activation or inhibition of molecular signalling pathways may produce more efficacious results than over-expression of transcription factors alone. Notch signalling pathways are known to be important in β-cell development [201] as are the 99
101 phosphatidylinositol controlled signalling pathways [202]. These pathways may therefore be potential targets for induction of transdifferentiation between bile duct and β-cells. 3.3.E. Future Work In terms of the work remaining for this project, it is clear that the optimal combination of transcription factors to direct cholangiocyte transdifferentiation to hepatocyte or pancreatic lineages remains to be found. Although the combinations of transcription factors used here were previously successful in inducing transdifferentiation of other cell types to hepatocyte or pancreatic lineages, they may not be the correct combination to direct cholangiocyte differentiation to a mature phenotype. In addition, the length of exposure to the transcription factors may also be a limiting factor so extended studies could be performed to test this possibility. In terms of transdifferentiation to hepatocyte-like cells, other transcription factors that should be tested include, FoxA2 and Hnf1α. In terms of cholangiocyte to pancreatic cell transdifferentiation transcription factors including MafA, Nkx2.2 and Nkx6.1 should be further investigated. These transcription factors are all important for embryonic development of either hepatic or pancreatic cells so may be able to direct transdifferentiation of cholangiocytes to these lineages. The possibility that a transcription factor exists in BECs that represses the hepatocyte or pancreatic phenotypes should also be considered. It may therefore be necessary to repress the expression of this factor as well as introducing additional cell type-specific transcription factors. Approaches to repressing the expression of a transcription factor include introducing a dominant-negative form (e.g. with the engrailed repressor) or by sirna. Once the optimum combination of transcription factors have been found it would be desirable to induce transdifferentiation in primary cells and also in vivo, to establish the functionality of transdifferentiated cells. 100
102 Chapter.4. Signalling Pathways in Liver and Pancreas Development 4.1. Introduction 4.1.A. Signalling Pathways Involved in Endodermal Organ Development 4.1.A.1. Notch Signalling The Notch signalling pathway is a critical factor during the differentiation and development of many cell types including those of the central nervous system and cardiovascular system, influencing factors such as differentiation, proliferation and apoptotic programmes. Notch signalling provides a cell interaction mechanism that allows for cell-cell communication between adjacent cells thereby allowing them to respond to developmental cues, via activation of gene expression and thus differentiation towards particular cell types (for more detailed reviews see; [ ]. Canonical Notch signalling involves DSL (Delta-Serrate, Lag-2) ligands binding to the extracellular domains of Notch receptors on the cell surface of adjacent cells. Ligand/ receptor binding induces cleavage of the Notch intracellular domain (NICD) by gamma secretases, and translocation of NICD into the nucleus (Fig 4.1). Once inside the nucleus, NICD binds to CSL (CBF1, Suppressor of Hairless, Lag-1)-type transcriptional co-factors, allowing activation of transcription of target genes (reviewed in [205]). Notch target genes including HES (Hairy enhancer of Split) and HERP (HES-related repressor protein)-family members, act as transcriptional repressors controlling cell fate decisions across multiple tissue types [206]. 101
 is cleaved by the action of gamma secretases. NICD translocates to the nucleus where it activates transcription of target genes.")
103 Figure 4.1 Canonical Notch Signalling Notch signalling is activated by Delta-Serrate-type ligands which bind to the notch receptors on the surface of adjacent cells. Upon activation the intracellular domain of the notch receptor (NICD) is cleaved by the action of gamma secretases. NICD translocates to the nucleus where it activates transcription of target genes. Notch signalling is known to be important for development of endodermal organs due to the clinical manifestations of the disease Alagille syndrome (AGS), which is the result of mutations in the Notch ligand JAG1 [ ] or NOTCH2 receptor [209]. Alagille syndrome is characterised by both intrahepatic bile duct paucity [210] and pancreatic insufficiency [208] as well as heart and skeletal abnormalities including pulmonary valve stenosis and characteristic butterfly-shaped vertebrae [210]. In the liver Notch signalling is known to be important in controlling hepatoblast to cholangiocyte differentiation by altering expression of liver-enriched transcription factors, specifically down-regulation of the typical hepatocyte transcription factors HNF1α, HNF4 and C/EBPα, and up-regulation of the cholangiocyte transcription factor HNF1β[85]. A role for Notch signalling in liver regeneration has also been implicated as rats that have undergone partial hepatectomy show activation of Notch signalling in regenerating liver. These data indicate that notch is important for proliferation of hepatocytes, although the mechanism by which notch acts is unclear [211]. In the pancreas Notch gene expression is observed throughout development, firstly in the pancreatic epithelium, then in embryonic ducts and finally in pancreatic 102
104 mesenchyme and endothelial cells [212]. During development ectopic activation of Notch signalling has been found to increase ductal development in zebrafish [213], and more recently mice over-expressing Notch signalling components showed increased ductal structures at the cost of both α- and β-endocrine cell types [214]. In order to specifically investigate the role of Notch signalling in liver and pancreas development, we inhibited Notch signalling using the gamma secretase inhibitor DAPT (N-[N-(3,5-Difluorophenacetyl)-L-atnyl]-S-phenylglycine t-butyl ester) and activated the pathway using the Notch ligand Jagged1 protein. It is worth mentioning that DAPT may have off-target effects so in this context we will refer to DAPT treatment as an inhibitor of gamma secretase rather than an inhibitor of Notch signalling per se. 4.1.A.2. TGFβ and HGF Signalling TGFβ signalling is responsible for control of processes such as cell proliferation, differentiation and apoptosis and is therefore responsible for controlling cell fate and tissue morphology. Canonical TGFβ signalling requires binding of a TGFβ superfamily ligand to a TGFβ type II receptor on the cell membrane. TGFβ superfamily ligands include BMPs, Activins, Nodal and TGFβs. Binding of ligands to type II receptors forms a hetero-tetrameric complex of type I and type II receptors and ligand. Activated receptor complexes phosphorylate R-SMADs which then form complexes with co- SMADs, translocate to the nucleus and activate target genes or relieve the action of transcriptional repressors ([ ]). The effects of TGFβ signalling have been observed in liver regeneration, where levels of TGFβ protein in hepatocytes have been shown to increase after 70% hepatectomy [217]. It has recently been proposed that a gradient of activin/tgfβ signalling may be responsible for hepatocyte vs ductal differentiation during liver development, in which high TGFβ signalling gives rise to cells of biliary fate and low TGFβ activity induces hepatocyte differentiation [84]. HGF signalling is proposed as a mechanism for producing and maintaining the TGFβ gradient that controls hepatocyte vs biliary development [83]. 103
105 In the pancreas, HGF is thought to function independently of TGFβ signalling to induce differentiation of pancreatic ductal cells to insulin-producing -cells, when treated with a combination of HGF and betacellulin, although the exact mechanism of HGF action is unclear [218]. To investigate the effects of TGFβ and HGF signalling pathways on liver and pancreas development TGFβ and HGF proteins were incubated with embryonic liver and pancreatic bud cultures. 4.1.A.3. Wnt/β-Catenin Signalling Canonical Wnt/β-Cat signalling involves binding of Wnt ligands to Frizzled and LRP receptors which form a complex that recruits and phosphorylates Dishevelled. Activated Dishevelled leads to inhibition of formation of a second complex of proteins which includes Axin, GSK-3β and APC, this complex typically functions to phosphorylate and ubiquitinate β-catenin (β-cat), targeting it for destruction. Activated Dishevelled inhibition of the complex that leads to proteolysis of β-cat allows a stable pool of β-cat to accumulate within the cytoplasm, this then translocates to the nucleus, where it mediates transcription of Wnt target genes via interaction with LEF/Tcf1 ([219]). Wnt/β-cat signalling is known to be important in hepatic development and has been implicated in liver regeneration, differentiation and carcinogenesis, Wnt independent stabilisation of β-cat has also been implicated in hepatic specification and morphogenesis [220]. Wnt/β-cat signalling is thought to be the molecular mechanism governing establishment and maintenance of metabolic zonation in the mature hepatic lobule [154], where activated Wnt genes are thought to interact with the liver enriched transcription factor HNF4 to repress expression of periportal genes [221]. To investigate the effects of Wnt/β-cat signalling on liver development and differentiation cultured liver buds were incubated with a Glycogen synthase kinase 3 inhibitor (GSKi). Addition of the GSKi inhibits GSK-3β, prevents the formation of the complex that targets β-cat for proteolysis, simulating Wnt activation independently of Wnt ligand binding. 104
106 4.1.A.4. Phosphatidylinositol Signalling Phosphatidylinositol signalling is controlled by the action of Phosphatidylinositol kinases (PIKs). PIKs are intracellular signal transducer enzymes that phosphorylate Phosphatidylinositols producing 1, 2 or 3 phosphorylated inositol lipids or phosphoinositides (PtdIns). These PtdIns are responsible for lipid signalling, cell signalling and membrane trafficking [222] and are therefore important in processes including cell growth, proliferation, differentiation, cellular function and survival [223]. In the pancreas activation of PI3 Kinase has been found to regulate Pdx1 expression in ductal cells inducing a switch from ductal cells to insulin-producing cells, this switch in phenotype is thought to involve activation of HGF signalling [224]. In adult β-cells PI3 Kinase signalling pathways have been found to protect β-cells from the effects of oxidative stress by regulating apoptotic programmes [225]. More recently PtdIns, PtdIns(3,4,5)P 3, PtdIns(3,4)P 2 and PtdIns(3,5)P 2 have been implicated in adult β-cell function and survival and are thought to be regulated via an autocrine insulin feedback loop, i.e. insulin exocitosis increases PtdIns, which in turn increase insulin expression and exocitosis [202]. At least PtdIns(3,5)P2 is thought to be phosphorylated by the action of PIKfyve, a PIK with a specificity for the 5 position and a five finger domain [226], indicating that this PIK may be important in β-cell function and survival. To investigate the effects of Phosphatidylinositol signalling in pancreas development and β-cell function, dorsal pancreatic buds maintained in culture were treated with HGF and PIKfyve inhibitors. 4.1.B. Embryonic Ex vivo Liver and Pancreas Cultures as Models of Development 4.1.B.1. Ex vivo Liver Buds The ex vivo liver cultures were obtained from E11.5d mouse embryos and cultured as described in Chapter 2. Cultures represent a mixed population of epithelial cells surrounded by an outgrowth of mesenchymal cells. Culture of the epithelium with associated mesenchyme aids the growth, differentiation and survival of epithelial cells. 105
107 The cell population within the epithelium is thought to include hepatoblast-like cells and hepatocytes of varying maturity in terms of marker expression and functionality, as would be observed in a normal embryonic liver. The epithelial component also includes duct cells or cholangiocytes, also at varying levels of maturity and mixed functionality as observed in normal embryonic liver and mature liver ducts. The ex vivo buds can be maintained in Basal media for up to two weeks and although buds from different isolations do show some heterogeneity in terms of phenotype, experiments are repeated sufficiently to account for slight variations between cultures. This model has previously been used to study the growth and differentiation of hepatic cell types [227]. 4.1.B.2. Ex vivo Pancreatic Buds Ex vivo pancreatic buds were dissected from the dorsal bud of the developing pancreas of E11.5d mouse embryos. The bud is composed of a ball of epithelium surrounded by a layer of mesenchyme, co-culture of the mesenchyme with the epithelium is essential for normal epithelial growth, survival and differentiation. Within 7 days of culture, pancreatic buds demonstrate branching morphogenesis of duct-like cells and formation of acini-like structures. Endocrine gene expression is also observed by 7 days culture indicating the presence of α-, β-, δ- and PP-cells which are often clustered in islet-like structures, at least in part recapitulating normal pancreatic architecture. Pancreatic buds can be maintained in basal media for up to two weeks and some heterogeneity is observed between isolations which can be overcome by stringent repetition and pooling of experimental data. This model system has been used previously in our lab to demonstrate the effects of betacellulin on β-cell development in embryonic pancreas [48] and on the transdifferentiation of pancreatic cells to hepatocyte-like cells [23]. The advantage of our ex vivo system over typical cell line culture is the ability to recapitulate normal development in terms of cell diversity and, at least in part, morphology and tissue architecture. This model allows for high throughput testing of multiple signalling pathways via application of exogenous factors and inhibitors 106
108 directly to the medium without the need to generate and maintain costly and time consuming animal models, required for in vivo experiments. 4.1.C. Chapter Aims This chapter aims to investigate the effects of different signalling pathways on the differentiation of hepatic and pancreatic cell types. In particular we aim to investigate the effects of Notch signalling, Activin/TGFβ signalling and Wnt signalling in hepatic development. We also aim to investigate the effects of Notch, HGF and phosphatidylinositol signalling on pancreatic development. The effects of these signalling pathways on hepatic and pancreatic development will be investigated using an ex vivo model of embryonic development. 107
109 4. 2. Results 4.2.A. Treatment of ex vivo liver buds with the Gamma-Secretase Inhibitor DAPT 4.2.A.1. DAPT Treatment Reduces Differentiation of Hepatoblasts to Ductal Cells Control liver buds are composed of hepatoblasts; a bipotential precursor population that gives rise to both hepatocytes and cholangiocytes or ductal cells. By day 6 of culture, cells expressing the ductal markers CK7 and Pan CK were observed throughout the original explant and surrounding the migrating epithelium (Fig. 4.2C). Culture with 50µM of the gamma-secretase inhibitor DAPT altered expression of the ductal markers (Fig. 4.2 F). Further analysis by RT-PCR confirmed that CK7 expression was reduced by DAPT treatment (Fig. 4.3) and no increase in the expression of the ductal transcription factor Sox9 was observed (Fig. 4.3) indicating no increased differentiation of hepatoblasts to a ductal phenotype. An enhancement in GGT expression (Fig. 4.3) is not sufficient to indicate ductal differentiation. Although GGT is known to be expressed in mature ducts, it is also expressed in hepatoblasts [150]. The change in GGT compared to untreated controls could therefore indicate an alteration in the hepatoblast population of the buds in response to the lack of normal ductal differentiation. 4.2.A.2. DAPT Treatment May Allow Differentiation of Hepatoblasts to an Early Hepatocyte-like Phenotype As previously observed the hepatoblast population of DAPT-treated ex vivo liver buds may be increased (Fig.4.2). A change in the hepatoblast cell population in the DAPTtreated buds, is further supported by the cells expressing AFP (Fig. 4.3 and 4.4 A-D). AFP is however also a marker for differentiating hepatocytes, and may represent a population of immature hepatocytes. Furthermore DAPT treatment induced a change in the liver enriched transcription factor HNF4 (Fig. 4.3 and 4.4 E-H) which is essential for hepatoblast to hepatocyte differentiation. 108
110 The absence of mature, functional hepatocyte markers is not sufficient to exclude the hepatoblast to hepatocyte hypothesis but may indicate an intermediate hepatoblast population that has undergone part of a stepwise process of hepatocyte differentiation. 109

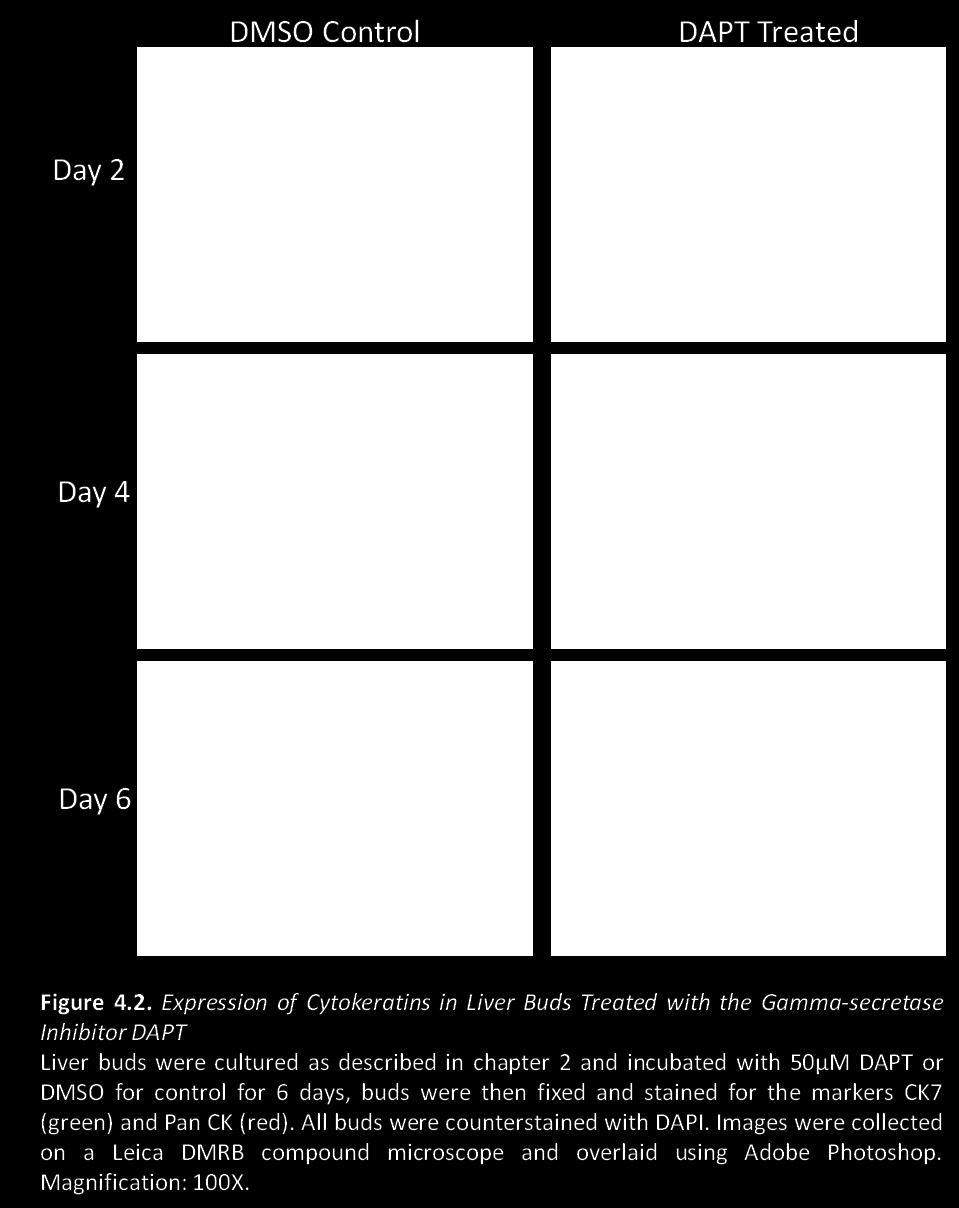
111 110

112 111

113 112
114 4.2.B. Ex vivo Liver Buds Treated with Jagged to Activate Notch Signalling 4.2.B.1. Jagged Treatment is not Sufficient to Induce Hepatoblast to Hepatocyte Differentiation DAPT treatment to inhibit gamma secretase has been shown to reduce hepatoblast to ductal differentiation (Figs ). Treatment of liver buds with the Notch activator Jagged, however resulted in no change in either CK7 or Pan CK expression within the ex vivo bud (Fig. 4.5 A,B and 4.6). Furthermore no change in the mature ductal marker GGT was observed (Fig.4.6) nor was there any alteration in the ductal transcription factor Sox9 (Fig. 4.6). The similar expression levels of GGT also indicate that no significant change in the hepatoblast portion of the bud is observed as a result of Jagged treatment. AFP expression did not appear to change in the cultures (Fig.4.5 C-D and Fig 4.6). 4.2.B.2. Jagged Treatment Prevents Differentiation of Hepatoblasts to a Mature Hepatocyte-like Phenotype Treatment with Jagged did not alter AFP expression in the bud (Fig. 4.5 C-D and Fig. 4.6). Re-examining the AFP staining shows that the AFP-expressing cells present after Jagged treatment appear to be clustered within the original explants rather than distributed throughout the growing epithelium, as in controls (Fig. 4.5 C-D). This may indicate that the remaining AFP-positive cells are hepatoblasts rather than the early hepatocyte-like cells previously described (4.2B). The absence of these intermediate hepatocyte-like cells is confirmed by the similar levels of HNF4 at the gene expression level (Fig. 4.6), but may also indicate a lack of mature hepatocytes in the Jagged treated buds. To confirm the change in mature hepatocytes in the Jagged treated buds the expression of the functional hepatocyte marker Transferrin was determined by immunostaining. The Transferrin expression was less intense in the Jagged treatment (Fig. 4.5 E-F). 113


115 114


116 115
117 4.2.C. Ex vivo Liver Buds Treated with HGF to Interfere with Activin/TGFβ Signalling 4.2.C.1. HGF Treatment is not Sufficient to Induce Differentiation of Hepatoblasts to Hepatocyte or Ductal Phenotypes Hepatocyte growth factor (HGF) has been reported to interact with Activin/TGFβ signalling to induce differentiation of hepatoblasts to hepatocyte or ductal phenotypes [83]. However treatment of ex vivo buds with HGF was not sufficient to alter expression of AFP, Cytokerains 7 or 19, GGT, Sox9 or HNF4 (Fig. 4.7). 4.2.D. Ex vivo Liver Buds Treated with GSKi to Activate Wnt Signalling 4.2.D.1. GSKi Treatment has no Effect on the Ductal Component of Liver Buds Liver buds treated with (Fig. 4.8 C and H) or without (Fig. 4.8 E and J) a GSK inhibitor exhibited a similar morphology. Although previously described as composed of hepatoblasts, ductal and hepatocytelike cells the composition of the hepatocyte compartment of the adult liver is more complex. Adult hepatocytes show remarkable heterogeneity, in terms of function, called liver zonation, which is thought to be controlled by Wnt/β-catenin signalling [58]. Treatment of the liver buds with GSKi to activate Wnt signalling had no effect on the ductal component of the buds as shown by CK7, CK19 and Sox9 RT-PCR (Fig. 4.9). 4.2.D.2. GSKi Treatment Induces a Perivenous Phenotype in Maturing Hepatocytes of the Liver Bud Glutamine synthetase expression was upregulated in GSKi treated liver buds compared to controls (GS; Fig. 4.9). GS is typically associated with perivenous hepatocytes, this observation is concurrent with the down-regulation of albumin (Fig. 4.9) which is more commonly associated with periportal hepatocytes [58]. AFP expression also appears weaker following GSKi treatment and may represent a change in the hepatoblast 116
118 component of the liver buds. The expression of the liver enriched transcription factor HNF4 was also lower following GSKi treatment suggesting further possible changes in the hepatocyte component of the liver buds after treatment. 117

119 118

120 119


121 120
122 4.2.E. Ex vivo Pancreatic Buds Treated with DAPT to Inhibit Gamma Secretase 4.2.E.1. Treatment with DAPT is Sufficient to Induce Alterations in Branching Morphogenesis and Islet Structure. Inhibition of Gamma secretase signalling by treatment of pancreatic buds with DAPT severely affected branching morphogenesis. Branching structures are discontinuous and significantly reduced, which can be observed even with only DAPI nuclear staining (Fig 4.10). Due to the many changes observed on Gamma secretase inhibition this work is expanded in chapter F. Ex vivo Pancreatic Buds Treated with Jagged to Activate Notch Signalling 4.2.F.1. Treatment with Jagged is not Sufficient to Induce Endocrine Over Exocrine Differentiation of Ex vivo Pancreatic Buds Inhibition of Gamma secretase by culturing pancreatic buds with DAPT is sufficient to promote exocrine differentiation of pancreatic cells at the cost of endocrine cells in the developing bud (due to the extent of changes observed this is expanded in chapter 5). Treatment of pancreatic buds with the Notch activator Jagged is not sufficient to change the expression of the endocrine markers insulin I, II or glucagon or the exocrine marker amylase (Fig. 4.11). Immunofluorescent staining demonstrates that normal branching morphogenesis occurs in the presence of Jagged (Fig. 4.11). Further evidence for normal branching morphogenesis and ductal cell number is provided by the ductal cell markers CK7 and CK19, which do not change on treatment of the buds with Jagged (Fig.4.12). 121


123 122

124 123


125 124
126 4.2.G. Ex vivo Pancreatic Buds treated with HGF 4.2.G.1. HGF Treatment is Not Sufficient to Induce Ductal to β-cell Differentiation in Ex vivo Pancreatic Buds It has been proposed that treatment with HGF can induce ductal cells of the pancreas to transdifferentiate towards a β-cell phenotype. Pancreatic buds treated for 6 days with HGF show no changes in branching morphogenesis of the ducts (Fig A, B) and no change in expression of the ductal cell markers CK7 and CK19 (Fig C). Expression of the β-cell markers insulin I and II were unaltered by HGF treatment (Fig C). 125


127 126
128 4.2.H. Ex vivo Pancreatic Buds Treated with PIKfyve Inhibitor 4.2.H.1. Treatment of Pancreatic Buds with a PIKfyve Inhibitor Suppresses Branching Morphogenesis PIKfyve is a phosphoinositide kinase that activates 3-phosphorylated inisitol lipids. Treatment of the pancreatic buds with the PIKfyve inhibitor YM at 400nM reduced branching morphogenesis of the bud. Immunostaining for E-Cad does not seem to demonstrate a change in epithelial cells (Fig B,D), but does demonstrate the disruption in branching morphogenesis. Acini-like structures appear to form in clusters close to the central ducts in PIKfyve inhibitor treated buds (Fig. 4.15D) rather than at the terminus of extended branches, as observed in controls (Fig. 4.15B). 4.2.H.2. Treatment of Pancreatic Buds with a PIKfyve Inhibitor Suppresses β-cell Differentiation and Formation of Islet-like Structures Immunostaining for pancreatic markers demonstrates that not only is ductal branching altered by PIKfive inhibition but also endocrine and exocrine differentiation. The expression pattern of amylase immunostaining was altered and was found distributed throughout the bud, rather than in acini-like structures as in controls (Fig A, B). The pattern of insulin-positive staining in β-like cells may be lower compared to controls (Fig C, D). Although insulin-positive cells remain clustered together in PIKfyve inhibited buds these clusters were not associated with glucagon-positive cells, indicating a disruption in formation of islet-like structures (Fig G, H). 127


129 128


130 129


131 130
132 4. 3. Discussion The aim of this chapter was to investigate signalling pathways important in hepatic and pancreatic development, using our ex vivo model of embryonic liver and pancreas development. We first demonstrated the effects of inhibiting gamma-secretase using DAPT. We observed a change in differentiation of hepatoblast cells to ductal lineages and an apparent enhancement in differentiation of hepatoblasts to early hepatocyte-like phenotypes. We were not able to observe an opposing phenotype on Jagged treatment of liver buds. Treatment of ex vivo liver buds with a GSK inhibitor had no effect on ductal differentiation but did appear to push differentiation of maturing hepatocytes to a perivenous-like phenotype based on the expression of Glutamine synthetase. We next investigated the effects of different signalling pathways on pancreatic development. We observed that inhibition of gamma secretase using DAPT, induced many changes in the pancreatic bud, including changes in branching morphogenesis and endocrine vs. exocrine differentiation. As there were so many changes induced by DAPT treatment this was examined in more detail in chapter 5. No clear phenotype could be induced by Jagged treatment of pancreatic buds. Finally we investigated the treatment of pancreatic buds with the PIKfyve inhibitor YM and observed a suppression in branching morphogenesis and differentiation of β-cells and a failure to form normal islet-like structures in treated buds. 4.3.A. Notch and TGFβ Signalling in Embryonic Liver Buds We first examined the potential role of Notch signalling on embryonic liver development using the gamma-secretase inhibitor DAPT in an established ex vivo model of liver development [148]. Multiple Notch ligands, receptors and Hes-family effectors are expressed in embryonic liver [ ] and some functional redundancy is thought to occur between Notch receptors. Inhibition of Notch signalling using a gamma-secretase inhibitor, may not lead to complete pathway inactivation, if not all gamma-secretase enzymes are inhibited. In addition, some caution must be taken in 131
133 interpreting the results as the DAPT may also have off-target effects. Further work is necessary to confirm that the DAPT is acting specifically through gamma-secretase (e.g. using a reporter-based assay for gamma secretase or inhibition of NICD translocation). We have demonstrated that treatment of embryonic liver cultures with DAPT alters differentiation of hepatoblasts to ductal cells as we observed a relative decrease in the staining intensity of the ductal markers CK7 and PanCK (Fig 4.2). The human pathology Alagille s syndrome is the result of mutations in the notch ligand JAG1 [ ] or NOTCH2 receptor [209] and is characterised by bile duct paucity [210]. This implies an essential role for Notch signalling in bile duct differentiation in the liver. Lozier et al demonstrated the importance of Notch signalling in bile duct morphogenesis, by use of a Jag1/Notch2 double heterozygous mouse model that displays bile duct paucity. They propose that deficits in bile duct cells that occur on notch pathway inactivation are the result of failures in bile duct morphogenesis and not cell fate specification [230]. It is unlikely that the effects of gamma secretase inhibition observed in our system are the result of errors in ductal tubulogenesis as it does not occur in our system. Despite the absence of ductal tubulogenesis in our ex vivo model, under control conditions, duct cell differentiation still takes place and markers such as CK7, GGT and Sox9 are observed. Therefore our data imply that Notch signalling may be required for duct cell differentiation. Zhong et al have demonstrated that Notch activation in postnatal hepatocytes can induce a biliary fate, which supports our observation that Notch pathway activation is required for biliary cells differentiation as well as tubulogenesis [79]. Surprisingly, we did not observe any change in the duct cell differentiation induced by exogenous Jagged1 treatment (Fig.4.5 and 4.6). It has been observed that Notch2 (but not Notch1) is responsible for mediating bile duct cell differentiation [231]. However, mutations in Jag1 or Notch2 are responsible for Alagille syndrome and errors in bile duct morphogenesis [ ]. These data may indicate that Notch pathway activation is responsible for both bile duct cell differentiation and tubulogenesis but different receptors may be responsible for the mechanism of Notch activation. 132
134 We also observed that treatment with the gamma-secretase inhibitor DAPT resulted in the appearance of an enhanced expression of early hepatocyte-like cells by expression of AFP and Hnf4 but no increase in mature hepatocyte markers. This early differentiation to hepatocyte lineages is consistent with a model that proposes a reduction in cholangiocyte differentiation causes an increase in hepatocyte differentiation. Tanimizu et al demonstrated that Notch signalling controls hepatoblast differentiation by altering expression of liver enriched transcription factors. They observed that activation of Notch signalling, by overexpression of the Notch intracellular domain (NICD) resulted in down-regulation of Hnf4 and inhibition of Notch resulted in hepatic differentiation in vitro [85]. These data are consistent with our observed enhancement in Hnf4 expression on DAPT treatment, but we did not observe an overall increase in hepatocyte differentiation. Our data indicates the presence of a population of hepatoblasts that have begun part of a stepwise commitment to hepatocyte lineage, as they express Hnf4 but do not express late markers of hepatocyte differentiation. It is possible that although active Notch signalling inhibits hepatic differentiation, Notch inhibition alone may not be sufficient to drive differentiation to mature hepatic phenotypes. Clotman et al have demonstrated the requirement for a gradient of activin/tgfβ signalling for hepatocyte vs. cholangiocyte differentiation. In this model low activin/tgfβ signalling is required for hepatocyte development and Notch is thought to act downstream to promote biliary differentiation [83](see Fig 1.7). This implies that inhibition of both Notch and activin/tgfβ signalling might be required to observe an increase in hepatic differentiation. To determine the effects of perturbed activin/tgfβ signalling on liver development, buds were initially incubated with an anti-tgfβ antibody. Even at very low concentrations the liver buds failed to grow in the presence of the antibody. HGF was used to modify activin/tgfβ signalling in the liver buds but showed no effect on cellular differentiation or gene expression. This may indicate that HGF alone is insufficient to modify activin/tgfβ signalling in our system. 4.3.B. Wnt Signalling in Embryonic Liver Buds 133
135 Another signalling pathway that has recently been implicated in liver development is the Wnt/ -catenin pathway. We sought to investigate the effects of Wnt signalling on liver development by treatment of liver buds with a GSK3i. GSK3β normally phosphorylates β-catenin causing it to be broken down in the cell. Therefore, inhibiting GSK3β allows -catenin to accumulate before translocating to the nucleus where it activates target genes. Initially we observed that the buds treated with the novel GSKi lagged behind the controls between day one and three in culture. This observation may be a side effect of treatment with the inhibitor but it is also in line with evidence that suggests that stabilised β-catenin leads to hypoplastic livers with failed hepatocyte differentiation [232]. Despite these early observations hepatocyte differentiation was largely restored to normal by day 6 of treatment. We also observed that buds treated with GSKi had cells that were morphologically epithelial-like compared to cells cultured under control conditions, this has also been shown to be the case in mouse knockouts for β-catenin [233]. Cells that maintained β-catenin expression were found to have 25% higher cell volume than those that did not express β-catenin [233]. We observed no effect on the biliary cell differentiation within the GSKi treated buds, this is contrary to evidence that suggests that Wnt signalling disrupts ductal cell differentiation. Other groups have demonstrated that deletion of β-catenin causes a reduction in biliary differentiation [234] and conversely stabilisation of β-catenin results in enhanced biliary cell differentiation [232]. One possible explanation for the discrepancies between these data and our own is the temporal effects of Wnt signalling. Tan et al observed the effects of β-catenin deletion by E12, our ex vivo cultures are taken form E11.5 mice embryos and the GSKi is not added for another 24 hours to allow the buds to attach. The window for the early effects of Wnt signalling on bile duct cell differentiation may have closed by this point and therefore normal bile duct development can occur. One way to test this hypothesis would be to isolate embryonic liver from earlier stages of gestation (E9.5 or 10.5) and test the inhibitor. The GSK inhibitor was found to play a role in directing differentiation of hepatoblasts to periportal or perivenous phenotypes. Addition of GSKi enhanced expression of the perivenous enzyme glutamine synthetase (GS) (Fig. 4.9). The role of Wnt signalling in 134
136 the establishment of hepatocyte zonation is well documented [154], our system shows an inhibition of AFP, a hepatoblast marker suggesting differentiation to a more mature hepatic phenotype. We also observed an inhibition of HNF4 expression. HNF4 has been shown to suppress the expression of GS in periportal hepatocytes as HNF4 deficiency results in GS expression in periportal regions [197]. The effect of Wnt signalling on HNF4 expression has been demonstrated by Colletti et al who have shown that LEF1, a factor down-stream of Wnt, interacts directly with HNF4. Indeed activation of perivenous genes by addition of a GSK3β inhibitor correlates with LEF1 binding to the HNF4 consensus sequence [221]. 4.3.C. Notch Signalling in Embryonic Pancreas Buds We also investigated the signalling pathways involved in branching morphogenesis and cellular differentiation of embryonic pancreas, in order to establish potential methods for induction of transdifferentiation of cholangiocytes to pancreatic lineages. We demonstrated that treatment of embryonic pancreas with the gamma-secretase inhibitor DAPT was sufficient to cause changes in branching morphogenesis and also appeared to alter the differentiation of endocrine and exocrine cell types. Due to the extreme changes observed on Notch inhibition of embryonic buds, further analysis was required and this can be seen in Chapter 5. As well as testing the utility of inhibiting Notch signalling in the embryonic pancreas we also wished to test the effect of activating Notch signalling to see if a reciprocal phenotype was observed. Pancreatic buds were treated with exogenous Jagged1, a ligand for Notch signalling. Contrary to our expectations we did not observe any significant changes in branching morphogenesis or differentiation of endocrine vs. exocrine cell types. Previous studies have found that activated Notch prevents differentiation of early pancreatic progenitors to both endocrine and exocrine cell fates [201] and Notch signalling is known to regulate stem cell compartments in other tissues [235]. Again the fact that we do not observe a similar effect is probably due to the temporal effects of Notch signalling, in our model progenitors have already committed to an endocrine or exocrine lineage. We did however expect to observe a reciprocal phenotype to our Notch inhibited buds i.e. an increase in exocrine cells and 135
137 a decrease in endocrine differentiation, which was not observed. This may be due to our ineffective activation of Notch signalling by addition of Jagged1. Su et al demonstrated that activation of Notch2, 3 and 4 required expression of the ligands Jagged 1 and 2 as well as delta1 and that all three receptors needed to be expressed for pancreatic regeneration after chronic pancreatitis [236]. Notch activation may not be the only pathway that requires activation to observe our expected phenotype. Differentiation to endocrine lineages may also require activation of other pathways including Hedgehog, TGFβ and/or FGF pathways [201, 237]. 4.3.D. HGF Treatment of Pancreatic Buds We wanted to determine if HGF treatment could be used to enhance differentiation of insulin-producing cells in our ex vivo pancreas cultures. Previous experiments have revealed that the rat pancreatic ductal cell line ARIP can be converted to insulinproducing cells using exogenous HGF treatment [238]. We did not observe any change in insulin expression upon treatment with HGF or any changes in ductal branching or gene expression. It is possible that the concentration of HGF was not sufficient to cause changes in our cultures, which are far more complex than monolayer cell cultures. We did however use 100ng/ml, twice the concentration used to induce insulin-producing cells in ARPI cells. HGF has been shown to stimulate insulin production in duct cells by activation of PI3K signalling [239], therefore we desired to directly modify PI3K pathways in the absence of HGF. 4.3.E. PIKfyve Treatment of Pancreatic Buds To investigate the effects of PI3K signalling on insulin production in our ex vivo pancreatic buds we treated them with a PIKfyve inhibitor called YM [240]. PIKfyve is a phosphoinositide kinase with a specificity for the five position and a five finger domain. Inhibition of PIKfyve signalling resulted in a suppression of branching morphogenesis and expression of E-cadherin. We also observed a loss in expression of amylase and insulin. We believe the inhibition in branching morphogenesis may be the direct result of PI3K signalling inhibition. Indeed Uzan et al have demonstrated that KGF-mediated 136
138 activation of PI3K signalling is required for pancreatic duct cell differentiation and proliferation [241]. It is also possible that the suppression in branching morphogenesis may be the result of failure to form an epithelial sheet as a result of PIKfyve inhibition. Dukes et al, have demonstrated that inhibition of PIKfyve in MDCK cells results in blockage of claudin 1 and 2 (two tight junction proteins) recycling and a delay in the formation of a epithelial seal [242]. More work is required to establish the mechanism of inhibition of branching morphogenesis caused by inhibition of PIKfyve, including establishing the role of tight junction formation. The observed decrease in amylase and insulin expression may indicate endocrine differentiation is favoured over exocrine differentiation as observed in HGF treated rat ductal cells [243]. One caveat to this hypothesis is the function of PIKfyve in adult β- cell function. PIKfyve is important for both adult β-cell survival and insulin secretion [224]. Our observations are based on insulin expression and not secretion, however it is possible that inhibition of PIKfyve has a direct effect on β-cell survival, further experiments would be required to determine the exact mechanism of PIKfyve inhibition on insulin expression. 4.3.F. Future Work While the results of the present Chapter are interesting further research is necessary to generate more robust evidence for involvement of the different pathways in embryonic development and to provide more quantitative data. One obvious point to start is investigating whether there are any off-target effects of the inhibitors used. In order to test the utility of DAPT as a specific inhibitor of Notch signalling we would need to demonstrate that addition of the compound prevented the induction of the Notch downstream target genes Hey1 and Hey2. We could also increase the robustness of the results by testing other gamma-secretase inhibitors such as BMS Quantitative changes between different treatments could be measured either by area measurements of the immunofluorescence staining or alternatively in changes in gene expression could be measured by quantitative PCR. The advantage of our system over transgenic knockout models is that we can activate or inhibit signalling pathways at different stages of development, knockout animals 137
139 often die at early developmental stages due to the essential nature of signalling pathways in development. For this reason it would be interesting to investigate other signalling pathways in our model. Signalling pathways important for liver regeneration and liver disease and cancer could also be investigated such as the VEGF and MAPK pathways. The effects of inhibition of gamma-secretase in pancreatic development is explored in more detail in this thesis in Chapter 5, but other work that could be continued from this chapter is the effect of PIKfyve inhibition on pancreas development. The effect of PIKfyve inhibition on junction proteins could be investigated in more detail to establish a link with branching morphogenesis in development. It would also be interesting to use our model to investigate the mechanism of PIKfyve action in insulin expression and secretion. 138
140 Chapter 5. Notch Signalling in Pancreatic Development 5.1. Introduction In chapter 4 we noticed significant changes in pancreatic buds treated with the gamma-secretase inhibitor DAPT. We observed changes in branching morphogenesis and the differentiation of endocrine and exocrine cell types. In the present chapter the phenotype of DAPT-treated buds is examined in more detail in terms of branching morphogenesis, endocrine and exocrine differentiation and the functionality of β-cells within the bud. 5.1.A. Notch Signalling in the Pancreas Notch signalling is activated by ligand binding to transmembrane Notch receptors located on the surface of cells. The action of gamma secretases is then recruited to the membrane to cleave the intracellular domain of the Notch receptor (NICD). After cleavage, the NICD translocates to the nucleus where it effects transcription of Notch target genes that can both activate and inhibit transcription of other genes (for detail see chapter 4.1.A). All four Notch receptors are expressed in the pancreas during development. Notch 1 is expressed the earliest in the pancreatic epithelium (E9.5) and is followed later by Notch 2 expression, which is restricted to embryonic duct cells during branching morphogenesis [212]. Notch 3 and 4 are expressed in the pancreatic mesenchyme through development [212]. In the present study we used the gamma-secretase inhibitor DAPT, which may therefore effectively prevent signalling from all four Notch receptors. 5.1.B. Ductal Cells of the Pancreas Ductal cells of the pancreas are responsible for the delivery of enzymes produced by acinar cell to the duodenum, and also secrete bicarbonate and mucins [244]. Ductal cells are arranged into highly branched structures that terminate in acini, their 139
141 differentiation is strongly linked to both correct branching morphogenesis and differentiation of endocrine and acinar cell types [38, 245]. Although little is understood about the factors that control differentiation at later developmental stages, ductal cells are derived from Pdx1-positive pancreatic progenitors that also produce endocrine and acinar cells [110]. Ductal cells express Pdx1 between E9.5 and E11.5 in mouse embryos, and cells that continue to express Pdx1 past E11.5 become endocrine cells [246]. Notch is thought to function in duct cell development by repression of endocrine and acinar cell fates [201]. Embryonic ducts form through a process called branching morphogenesis at around E12.5. During branching morphogenesis pancreatic progenitors divide asymmetrically and produce branches that push away from the central epithelium of the developing bud [117] (for a more detailed description see Chapter 1.3.C). Ductal cells have frequently been described as pancreatic progenitors due to their ability to differentiate into endocrine cells in vivo following pancreatic injury [ ]. Differentiation of pancreatic duct cell lines to β-cells in vitro has also been extensively characterised [20, ]. 5.1.C. Acinar Cells of the Pancreas Acinar cells are arranged into clusters called acini that are found at the terminus of branching ducts. Acinar cells produce digestive enzymes, such as amylase, that are secreted into the duodenum through the pancreatic ducts (for review see [24]). Acinar cell differentiation occurs from Pdx1-positive pancreatic progenitors at around E14.5 and requires expression of the transcription factors Ptf1α and Mist1 [ ] (see Chapter 1.3.C for detail). Notch is thought to inhibit acinar cell differentiation by inhibition of Ptf1α function [143]. Acinar cells have also been shown to display some plasticity in adult life and may transdifferentiate in vitro into β-cell lineages [253]. 140

 and position of the islet in relation to surrounding acini and capillary network. A.")
142 5.1.D. The Islet of Langerhans The rodent islet of Langerhans is composed of approximately cells of all five islet cell lineages α-, β-, δ-, PP-, and ε-cells (Fig 5.1A and Table 5.1). The islet is surrounded by acini and embedded in a dense capillary network that allows detection of blood glucose levels and secretion of hormones directly into the blood stream. The endothelial cells of the islet capillary network are also responsible for enhancing insulin expression and β-cell proliferation in times of increased insulin demand. Figure 5.1. Schematic of the composition of the adult islet (A) and position of the islet in relation to surrounding acini and capillary network. A. Islets are composed of α-, β-, δ-, PP-, and ε-cells with β-cells making up the majority of the islet and being located within the islet core. α- and ε-cells are found around the periphery of the islet and scant δ- and PP-cells are distributed through the core. B. Islets are found surrounded by acini structures composed of acinar cells and are embedded within a capilliary network that allows for blood glucose sensing and secretion of hormones. Combined and modified from J.P. Cartailer, 2005, The Beta cell consortium and Bardeesy et al, 2002 [24]. 141
143 Table 5.1. Summary of the five different cell types that comprise the islet of Langerhans, their hormone secretions, function and location within the islet. Islet Cell Type Hormone Produced Function Cellular Location α-cell β-cell δ-cell PP-cell Glucagon Insulin Somatostatin Pancreatic Polypeptide Increases blood glucose levels by induction of gluconeogenesis and glycogenolysis Decreases blood glucose levels by activating glycogenesis and inhibits glucagon release Inhibits release of insulin and glucagon and suppresses production of exocrine secretions Regulates endocrine and exocrine secretions Around the periphery of the islet Forms the central core of the islet Distributed sparsely through the islet Distributed sparsely through the islet ε-cell Ghrelin Regulates insulin and increases β-cell proliferation and inhibits apoptosis Very scent distribution less than 1% of islet cells around the periphery By far the most numerous cell type in the islet is the β-cell which comprises 70-80% of islet cell mass [24]. β-cells produce the hormone insulin (Table 5.1) and secrete it into the bloodstream primarily in response to increases in blood glucose, but also in response to other nutrients and hormones. It is therefore important that β-cells produced for therapeutic treatments must be able to produce insulin and respond to changes in blood chemistry. 5.1.E. Insulin Production in Pancreatic β-cells In adult cells insulin expression is strictly limited to β-cells of the pancreatic islet. Unlike humans mice have two insulin genes Ins1 and Ins2, Ins2 is structurally and functionally most similar to the human insulin gene [254]. Insulin gene expression in adult β-cells is regulated by glucose levels in the blood. Glucose causes binding of Pdx1 to the insulin promoter, the mechanism by which this takes place is unclear however one possibility that has been proposed is that glucose modifies an inactive form of Pdx1 causing its translocation from the cytoplasm to the nucleus [178]. Other 142
![transcription factors that are important for insulin gene expression include MafA and NeuroD whose expression and binding to the insulin promoter are also regulated by glucose [72, 255]. Figure 5.](/docs-images/93/112316052/images/144-0.jpg "2 Structure and processing of the protein preproinsulin to mature insulin for secretion.")
144 transcription factors that are important for insulin gene expression include MafA and NeuroD whose expression and binding to the insulin promoter are also regulated by glucose [72, 255]. Figure 5.2 Structure and processing of the protein preproinsulin to mature insulin for secretion. Preproinsulin is targeted to the endoplasmic reticulum by an N-terminal sequence that is quickly cleaved after entry into the ER, to form Proinsulin. Proinsulin forms three sulphide bonds that give the correct structure for mature insulin and moves into the Golgi region. Proinsulin is converted to insulin by cleavage of C-peptide. Source: The Beta Cell Consortium, Insulin gene expression is controlled by glucose-induced transcription factor binding to the insulin promoter as well as epigenetic control. Insulin gene transcription has been shown to require demethylation of CpG sites in the insulin promoter, to allow 143
145 transcription factor binding [256] and also hyperacetylation of histone H4 at the promoter site, this is also mediated by glucose [ ]. Once transcription is initiated, insulin mrna is translated into an inactive protein called perproinsulin. Preproinsulin is composed of insulin A and B chains linked by C- peptide and an N-terminal signal sequence that allows the movement of preproinsulin through the membrane of the endoplasmic reticulum (ER) (Fig 5.2). Interestingly glucose is also thought to regulate insulin expression by stabilisation of preproinsulin mrna at this stage [259]. Production of insulin initially, as inactive preproinsulin is an efficient method of ensuring correct folding and structure. After movement of preproinsulin into the ER the signal sequence is cleaved and three disulphide bonds from between insulin A and B chains (Fig 5.3), this forms an intermediate called proinsulin. Proinsulin moves to the Golgi region where C-peptide is cleaved by the combined action of prohormone convertases PC2 and PC1/3 and carboxypeptidase-e (CPE) resulting in the formation of functional insulin (for review see [260]. Insulin is stored in granules for release, but because cleavage of C-peptide occurs after proinsulin has entered the Golgi network, vesicles contain both insulin and C-peptide results in approximately equimolar release into the blood. 5.1.F. Glucose Stimulated Insulin Secretion Insulin secretagogues include metabolised nutrients and drugs but the main initiator of insulin secretion from β-cells is glucose. These secretagogues initiate insulin secretion through opening of calcium channels that cause insulin granules to fuse with the cell membrane, releasing insulin into the blood. A number of insulin potentiators also regulate insulin release, such as glucagon-like peptide 1 (GLP1) [ ], acetylcholine [ ] and amino acids [ ]. Insulin potentiators are thought to be unable to initiate insulin release independently of secretagogue action [267]. In an unstimulated β-cell a resting potential of -70mV is maintained by the presence of voltage-gated calcium ion channels, which are closed in unstimulated cells, and ATPsensitive potassium channels, which remain open [267]. When glucose levels increase, glucose is taken into the β-cell by the glucose transporter GLUT2 and is converted to glucose-6-phosphate by the action of the enzyme glucokinase [268]. The increase in 144

146 metabolism results in production of ATP which causes closure of ATP-sensitive potassium channels. Closure of potassium channels results in depolarisation of the membrane and opening of voltage-gated calcium channels. Influx of calcium ions causes insulin granule fusion with the cell membrane and release of insulin into the blood (Fig 5.3). Insulin granule docking with the cell membrane is dependent on SNARE proteins that tether the granule to the membrane and the calcium channel itself. After granule docking the two membranes fuse via the action of a calcium-sensor which is thought to be of the synaptotagmin family [269]. Figure 5.3 Schematic of glucose-stimulated insulin secretion in pancreatic β-cells. Glucose transport and metabolism results in and increase in intracellular calcium concentration. Increased Calcium concentration leads to insulin granule fusion with the β-cell membrane and insulin release. Blue arrows represent intergration of insulin signalling with glucose stimulated insulin secretion. SERCA-Sarcoplasmic endoplasmic reticulum calcium, IRS- Insulin receptor substrates, PI3Kinase- Phosphatidyl inositol 3-kinase. Source: Kulkarni, 2004 [270]. 145
147 Glucose-stimulated insulin secretion is also modified by interactions with insulin/igf2 signalling pathways (Fig 5.3)[270]. β-cells lacking IGF2 receptors demonstrate impaired glucose tolerance and a decrease in glucose-dependent insulin release [271]. The secretion of insulin in response to glucose is often referred to as biphasic, as initial exposure to sustained high glucose results in a marked increase in insulin release (phase one) followed by a decrease in secretion, the second phase is characterised by lower intensity, sustained insulin release (for review see [272]). The mechanism of biphasic insulin secretion is unclear; however two models exist to explain the phenomena, the storage-limited model and the signal-limited model. The storagelimited model indicates that the first phase of insulin secretion is the result of exocytosis of a readily releasable pool of insulin granules and the second phase requires the release of a pool of granules that must dock with the membrane prior to exocytosis, resulting in a time lag [273]. The signal-limited model proposes the presence of either a single stimulatory signal that is also biphasic or the interaction of two different signals that stimulate the two phases independently [274]. The mechanism of insulin secretion is important in both autoimmune and nonautoimmune diabetes as GLUT2 receptors are down-regulated leading to a reduction in responsiveness to insulin. In autoimmune diabetes some immunoglobulins directly inhibit functional GLUT2 transporters [275]. The mechanism of insulin secretion is also a therapeutic target for treatment of diabetes, sulphonylureas are a group of drugs that close potassium ion channels and induce insulin release by mimicking the effects of glucose stimulation and are often used to treat type II diabetes [269]. In our ex vivo model developing β-cells do not normally demonstrated glucosestimulated insulin secretion, neither do they increase insulin production in response to insulin potentiators such as amino acids. It is thought that the β-cells within the buds are too immature to respond to glucose. 146
148 5.1.G. Chapter Aims This Chapter aims to (1) examine in detail the effects of gamma-secretase inhibition on ex vivo pancreatic buds. The differentiation of exocrine and endocrine cells and effects on branching morphogenesis will be examined. (2) Investigate the maturity of the DAPT-treated ex vivo pancreatic buds in terms of their ability to respond to glucose and amino acids by production and secretion of insulin. 147
149 5.2. Results 5.2.A. Ex vivo Pancreatic Buds Display Branching Morphogenesis and Both Endocrine and Exocrine Cell Differentiation 5.2.A.1. Normal Branching Morphogenesis On isolation of the dorsal pancreatic bud the central ball of epithelial cells and surrounding mesenchyme is placed, cut side down, onto fibronectin coated coverslips. By day two after isolation the epithelium and mesenchyme of the pancreatic bud attach to the fibronectin and the epithelium is observed as a central ball of cells surrounded by a more flattened mesenchyme (Fig 5.4A). At day three both the epithelial and mesenchymal cells have flattened to the fibronectin and the onset of branching morphogenesis is observed as a series of finger-like protrusions (Fig 5.4B). Branching morphogenesis continues between day four and six in culture, the original finger-like protrusions undergo further branching to form a highly branched structure approximately 3-4 times as large as the original bud (Fig 5.4C-E). Branches clearly terminate in acini-like clusters by day five in culture (Fig 5.4D) and ductal structures are clear by day six, although some small sections of ductal lumen may be observed prior to day six (Fig 5.4E). Ductal branching was confirmed by the distribution of Pan cytokeratin positive cells within the bud by day six (Fig 5.5E). These branched ducts clearly form luminal structures and were distinct from surrounding mesenchymal cells (Fig 5.5E). The branched structures of the ducts formed acini-like structures along their length and particularly at the termini of extended branches. 5.2.A.1. Normal Endocrine and Exocrine Cell Differentiation The presence of acini-like structures along the length and at the terminus of ducts was confirmed by the presence of amylase-positive clusters within these structures (Fig 5.5B). At day six in culture endocrine cells were observed in clusters associated with the ducts. These clusters appeared to be islet-like, in terms of cellular composition; containing both glucagon-positive and insulin-positive cells (Fig 5.5A and C). δ-like cells expressing somatostatin were also present in ex vivo buds by day six, however they 148
150 appeared to be more associated with the ducts rather than residing in the islet-like structures (Fig 5.5D). Although pancreatic polypeptide is clearly expressed within the bud by days six, by RT-PCR (Fig 5.5F) the level of expression and number of PP-positive cells was not sufficient for detection by immunofluorescence. 149


151 150


152 151
153 5.2.B. DAPT Treatment Disrupts Normal Branching Morphogenesis Treatment of the ex vivo pancreatic buds with DMSO (control) does not affect normal branching morphogenesis and by day six the DMSO-treated buds were consistent with untreated controls in terms of and branching structures (Fig 5.6 A,C,E). Treatment of the ex vivo buds with the gamma-secretase inhibitor DAPT did not appear to prevent normal attachment of epithelium or outgrowth of mesenchyme by day two (Fig 5.6B), however by day four of treatment DAPT-treated buds failed to show normal branching, although small acini-like structures were observed within the epithelium (Fig 5.6D). The proliferating epithelial cells did not branch into the surrounding epithelium and failed to form branched structures (Fig 5.6F). Immunofluorescent staining for the ductal markers CK7, PanCK and E-cad showed that duct-like epithelial cells developed within the DAPT-treated buds (Fig 5.7 B,D,F,H). Clusters of ductal cells still appeared after DAPT-treatment but are not phenotypically characteristic of acini, as observed in controls, furthermore these clusters were not connected by continuous duct-like structures and branched lumens are not observed. 152


154 153

155 154
156 5.2.C. DAPT Treatment Disrupts Endocrine and Exocrine Cell Differentiation We have previously demonstrated that both endocrine and exocrine differentiation and islet formation is continuous with ductal branching in the ex vivo pancreas model (Fig 5.5), and that ductal branching fails to occur in buds treated with DAPT (Fig 5.6 and Fig5.7). Further staining for the exocrine marker amylase (Fig 5.8 A, B) demonstrated an inhibition of amylase expression, indicating that the discontinuous duct structures formed after DAPT treatment did not develop into true acini-like clusters. Endocrine markers glucagon (Fig 5.8C,D) and insulin (Fig 5.8 E,F) appeared enhanced upon DAPT treatment, based on the morphology of cell clusters. Clusters composed of both glucagon and insulin-expressing cells were observed in larger islet-like structures in comparison with control buds. Glucagon and insulin were never co-expressed within individual cells, indicating differentiation to distinct α- and β-cell types (Fig 5.8 B, D,F). Whole bud RT-PCR results confirmed that overall expression of the exocrine marker amylase may be reduced and this was concurrent with an enhancement in the endocrine markers glucagon and Insulin I and II (Fig 5.9). There was no change in the expression of the endocrine markers Pancreatic polypeptide (PP), expressed in PP cells, or somatostatin (SS), expressed in δ cells (Fig 5.9). Treatment with DAPT inhibits gamma-secretases required for normal Notch signalling, this reduction in Notch signalling on DAPT treatment is confirmed by down-regulation of the known Notch target Hes1 (Fig 5.9). The reduction in Hes1 expression was followed by de-repression of the pro-endocrine gene Ngn3, which may be up-regulated in DAPT-treated buds (Fig 5.9 summary Fig 5.10). 155


157 156


158 157


159 158
160 5.2.D. DAPT Treatment Promotes Islet-like Structures in Ex vivo Pancreatic Buds To confirm the gain of the endocrine phenotype at the cost of exocrine differentiation, DAPT treatment was continued to 14 days. Amylase-positive cells were once again reduced both in terms of the intensity of amylase expression (Fig 5.11 A, B). The level of expression of glucagon and insulin was enhanced by 14 days of DAPT treatment (Fig 5.11 C,D and E,F). The size of glucagon and insulin-expressing islet-like structures produced after 14 days of DAPT treatment were approximately 2-5 times as large as observed in control buds. The morphology of the islet-like clusters also allowed observation of their cellular structure; DAPT treated islets were composed of a core of insulin-expressing cells, surrounded by a mantle of glucagon-expressing cells (Fig 5.11 H). DAPT treatment for 14 days showed amylase-positive cells forming clusters that appeared around the periphery of the islet. In control buds amylase-positive cells were grouped into acini-like structures with islet-like clusters distributed among the developing ducts (Fig 5.11B) this distribution was not observed in the DAPT treated buds due to lack of duct formation. 159

161 160
162 5.2.E. DAPT Treatment Does Not Enhance Proliferation of Pancreatic Progenitors or Increase Proliferation of Insulin-expressing Cells The enhancement in cells expressing insulin within enlarged islet-like clusters observed after DAPT treatment was also characterised by the cells expressing the pancreatic transcription factor Pdx1 (Fig 5.12 B,D). Pdx1 was expressed in both pancreatic progenitors and mature β-cells, raising the question; does DAPT treatment enhance the differentiation of pancreatic progenitors to β-cells? Co-staining for insulin and Pdx1 expression demonstrated that Pdx1 expressing cells almost always co-expressed insulin (Fig 5.13D), which may indicate differentiation towards a mature β-cell differentiation. The promotion of glucagon and insulin-positive cells in DAPT treated buds could also be the result of increased cell division of cells that have already committed to an endocrine cell fate. This was shown not to be the case due to co-staining of DAPT treated buds with the endocrine markers glucagon and insulin and the cell division marker phosphohistone H3 (PH3). Interestingly, PH3 expression was more pronounced in control buds compared to DAPT treated buds (Fig 5.14 E,F). Co-staining for PH3 and endocrine markers showed little or no co-localisation of PH3 with either glucagon or insulin (Fig 5.14 G, H). 161

163 162

164 163


165 164
166 5.2.F. DAPT Treatment Increases β-cell Responsiveness to Amino Acid and Glucose Challenge Co-staining for Pdx1 and insulin in DAPT treated buds suggested mature β-cell differentiation. To establish the maturity of developing β-cells within DAPT treated buds, buds were challenged with either glucose or amino acids and insulin release into the media was measured by ELISA. Twenty buds were pooled for each experiment, cultured for 14 days in either DAPT (hereafter called treated buds -T) or DMSO (hereafter called control buds-c). After 14 days, the glucose challenged buds were treated for one hour with either 5.5mM glucose (hereafter called low glucose L Glu) or 25mM glucose (hereafter called high glucose- HGlu). Amino acid challenged buds were treated for one hour with either 0.1mM amino acids (Hereafter called low amino acids- L AA) or 10 mm amino acids (hereafter called high amino acids H AA). Media was collected and concentrated as described in the Materials and Methods and the ELISA was performed according to the manufacturer s instructions. Protein was quantified and the results corrected to total protein resulting in calculation of pmols insulin/g total protein and results were analysed using a student s t-test. Protein was also extracted from the pancreatic buds as described in the methods and an ELISA performed this data was used to calculate the percentage of intracellular insulin released into the media on stimulation with either glucose or amino acids (% insulin release/h). 5.2.F.1. Glucose Stimulated Insulin Released into Media Control pancreatic buds secreted insulin into the media at relatively low levels (21.42pmol insulin/g total protein) however stimulation of control buds with high glucose for one hour did significantly increase insulin secretion into the media (Fig 5.15). Treated pancreatic buds with low glucose treatment show increased insulin secretion into the media, almost 2.4 times that of unstimulated control buds, (p=0.024). This is consistent with our previous observations that β-cell mass and insulin production was significantly increased by treatment with the gamma-secretase inhibitor (Fig 5.11). 165
167 Treated pancreatic buds stimulated with high glucose also significantly increase insulin secretion into the media compared to control high glucose buds p=0.0058, however not significantly more than treated buds with low glucose p>0.05 (Fig 5.15). 5.2.F.2. Amino Acid Stimulated Insulin Released into Media Control pancreatic buds secreted insulin into the media at relatively low levels, consistent with control buds in glucose challenge experiments (Fig 5.15 and 5.16). Stimulation of control buds with amino acids did not significantly increase insulin in the media (Fig 5.16). Treated buds with low amino acids showed a large increase in insulin in the media, this increase was higher than treated buds in our glucose experiments and was most likely due to variation between buds used in individual experiments. The increase in insulin in the media in treated buds that have low amino acid treatment was significantly greater than control buds with low amino acid treatment p= Treated buds stimulated with high amino acids showed a large increase in insulin in the media, more than 22 times that of control buds treated with high amino acids (Fig 5.16). Insulin released by treated buds stimulated with insulin was significantly greater than both high amino acid controls (p=0.0005) and treated buds with low amino acids (p=0.0012). 5.2.F.3. Percentage of Intracellular Insulin Released into the Media on Stimulation with Glucose or Amino acids. The caveat to the above data is that it does not take into account the amount of insulin produced within the cells of the bud. To account for potential differences, the insulin within the cells of the bud was collected and quantified by ELISA, the proportion of intracellular insulin secreted into the media was calculated as a percentage (Fig 5.17). Glucose stimulated buds secreted a greater proportion of their intracellular insulin into the media and the percentage secreted was significantly more than untreated buds stimulated with high glucose (p=0.0048) and treated buds with low glucose treatment (p=0.0018) (Fig 5.17). 166
168 Amino acid stimulated buds also showed an increase in the percentage of intracellular insulin released into the media however the increase from treated buds with low amino acids was not significant (p>0.05) (Fig 5.17). Overall the DAPT treated buds stimulated with high amino acids produce more than 10 times more intracellular insulin than glucose stimulated buds, this huge increase in intracellular insulin accounted for the increase in insulin in the media. DAPT treated buds treated with high glucose also increased intracellular insulin production but a larger proportion of the insulin produced was secreted into the media (Fig5.17). 167


169 168

170 169


171 170
Hepatogenesis I Liver development
 Hepatogenesis I Liver development HB 308 George Yeoh Room 2.59 MCS Building yeoh@cyllene.uwa.edu.au Topics Early liver development Tissue interaction - role of morphogens and cytokines Liver enriched transcription
Development of the Liver and Pancreas
 Development of the Liver and Pancreas Professor Alfred Cuschieri Department of Anatomy University of Malta Three glandular buds arise from the distal end of the foregut during the fourth week Day 22 -The
Digestive system L 4. Lecturer Dr. Firdous M. Jaafar Department of Anatomy/Histology section
 Digestive system L 4 Lecturer Dr. Firdous M. Jaafar Department of Anatomy/Histology section objectives 1-Describe the structure of liver. 2-Define liver lobule, and identify its zones. 3-Define portal
MICROSCOPIC STRUCTURE OF LIVER, GALLBLADDER, GALL DUCTS, AND PANCREAS OVERVIEW OF DEVELOPMENT OF THE ALIMENTARY CANAL
 Lecture 2 ESS_3rd semester MICROSCOPIC STRUCTURE OF LIVER, GALLBLADDER, GALL DUCTS, AND PANCREAS OVERVIEW OF DEVELOPMENT OF THE ALIMENTARY CANAL MICROSCOPIC STRUCTURE OF LIVER - is the largest gland of
Week 3 The Pancreas: Pancreatic ph buffering:
 Week 3 The Pancreas: A gland with both endocrine (secretion of substances into the bloodstream) & exocrine (secretion of substances to the outside of the body or another surface within the body) functions
Anatomy of the liver and pancreas
 Anatomy of the liver and pancreas Prof. Abdulameer Al-Nuaimi E-mail: a.al-nuaimi@sheffield.ac.uk abdulameerh@yahoo.com Liver Aorta Pulm. Trunk Rt. At, Duct. Art. Lt. Ven. Rt. Ven. Internal Posterior
Chapter 18 Liver and Gallbladder
 Chapter 18 Liver and Gallbladder 解剖學科徐淑媛 本堂重點 1. Liver : functions & histology 2. Gallbladder Physiology Liver Produce circulating plasma proteins Vitamin Iron Degradation Metabolism Bile manufacture (exocrine)
DIGESTIVE SYSTEM II ACCESSORY DIGESTIVE ORGANS
 DIGESTIVE SYSTEM II ACCESSORY DIGESTIVE ORGANS Dr. Larry Johnson Texas A& M University Objectives Distinguish between the parotid and submandibular salivary glands. Understand and identify the structural
Cell Therapy for Diabetes: Generating Functional Islets from Human Exocrine Tissue
 Cell Therapy for Diabetes: Generating Functional Islets from Human Exocrine Tissue Kevin Docherty University of Aberdeen ELRIG Drug Discovery 2016 ACC Liverpool 14 th October 2016 Autoimmune destruction
Fareed Khdair, MD Assistant Professor Chief, Section of Pediatric Gastroenterology, Hepatology, and Nutrition University of Jordan School of Medicine
 Fareed Khdair, MD Assistant Professor Chief, Section of Pediatric Gastroenterology, Hepatology, and Nutrition University of Jordan School of Medicine Outline Lecture one : Gut formation Foregut: esophagus,
THE ROLE OF CONNECTIVE TISSUE GROWTH FACTOR IN ISLET. Michelle Guney. Dissertation. Submitted to the Faculty of the
 THE ROLE OF CONNECTIVE TISSUE GROWTH FACTOR IN ISLET MORPHOGENESIS AND β CELL PROLIFERATION By Michelle Guney Dissertation Submitted to the Faculty of the Graduate School of Vanderbilt University In partial
CHAPTER 6 SUMMARIZING DISCUSSION
 CHAPTER 6 SUMMARIZING DISCUSSION More than 20 years ago the founding member of the Wnt gene family, Wnt-1/Int1, was discovered as a proto-oncogene activated in mammary gland tumors by the mouse mammary
Paneth Cells. Road Map to the Finish. No Review this Friday. Today 11/29 Finish digestion/accessory organs. Wednesday 12/1 Immune System I
 Road Map to the Finish No Review this Friday Today 11/29 Finish digestion/accessory organs Wednesday 12/1 Immune System I Paneth Cells - base of intestinal glands -! large -! intense acidophilic granules
Development of the Pancreas and Response to Disease
 Chapter 1 Development of the Pancreas and Response to Disease The pancreas develops from the primitive gut, which is derived from endoderm. An interdependent series of signals is necessary to form the
The Foregut. At first the esophagus is short. but with descent of the heart and lungs it lengthens rapidly
 GI embryology 2 The Foregut At first the esophagus is short but with descent of the heart and lungs it lengthens rapidly The muscular coat, which is formed by surrounding splanchnic mesenchyme, is striated
UNIVERSITÀ DEGLI STUDI DI NAPOLI FEDERICO II Dipartimento di Medicina Veterinaria e Produzioni Animali
 UNIVERSITÀ DEGLI STUDI DI NAPOLI FEDERICO II Dipartimento di Medicina Veterinaria e Produzioni Animali Dottorato di ricerca in Organismi modello nella ricerca biomedica e veterinaria XXV Ciclo IDENTIFICATION
Digestive System Module 6: Accessory Organs in Digestion: The Liver, Pancreas, and Gallbladder
 Connexions module: m49293 1 Digestive System Module 6: Accessory Organs in Digestion: The Liver, Pancreas, and Gallbladder Donna Browne Based on Accessory Organs in Digestion: The Liver, Pancreas, and
In Vitro Differentiation and Expansion of Human Pluripotent Stem Cell-Derived Pancreatic Progenitors
 Reprint from The Review of DIABETIC STUDIES Vol 11 No 1 2014 Special Edition Stem Cells and Pancreas Regeneration The Review of DIABETIC STUDIES REVIEW In Vitro Differentiation and Expansion of Human Pluripotent
MODULATION OF β-cell INTRINSIC AND EXTRINSIC CHARACTERISTICS BY CTGF TO PROMOTE β-cell MASS REGENERATION. Kimberly G. Riley.
 MODULATION OF β-cell INTRINSIC AND EXTRINSIC CHARACTERISTICS BY CTGF TO PROMOTE β-cell MASS REGENERATION By Kimberly G. Riley Dissertation Submitted to the Faculty of the Graduate School of Vanderbilt
What systems are involved in homeostatic regulation (give an example)?
?") 1 UNIVERSITY OF PNG SCHOOL OF MEDICINE AND HEALTH SCIENCES DIVISION OF BASIC MEDICAL SCIENCES DISCIPLINE OF BIOCHEMISTRY AND MOLECULAR BIOLOGY GLUCOSE HOMEOSTASIS (Diabetes Mellitus Part 1): An Overview
1 UNIVERSITY OF PNG SCHOOL OF MEDICINE AND HEALTH SCIENCES DIVISION OF BASIC MEDICAL SCIENCES DISCIPLINE OF BIOCHEMISTRY AND MOLECULAR BIOLOGY GLUCOSE HOMEOSTASIS (Diabetes Mellitus Part 1): An Overview
PRACTICAL ROADMAP. GLANDS AFFECTING LIFESTYLE WJ van der Spuy & T Tshabalala
 PRACTICAL ROADMAP GLANDS AFFECTING LIFESTYLE WJ van der Spuy & T Tshabalala GLANDS AFFECTING LIFESTYLE Submandibular gland (salivary gland) Liver Pancreas Hypophysis (pituitary gland) Thyroid Suprarenal
The role of decellularized matrix in directing differentiation of pancreatic progenitor cells in pancreatic endocrine cell fate
 The role of decellularized matrix in directing differentiation of pancreatic progenitor cells in pancreatic endocrine cell fate SUBMITTED TO THE FACULTY OF THE GRADUATE SCHOOL OF THE UNIVERSITY OF MINNESOTA
Tissue-Specific Transcription Factors in Progression of Epithelial Tumors
 ISSN 0006-2979, Biochemistry (Moscow), 2008, Vol. 73, No. 5, pp. 573-591. Pleiades Publishing, Ltd., 2008. Original Russian Text N. L. Lazarevich, D. I. Fleishman, 2008, published in Biokhimiya, 2008,
Pancreas Fox Chapter 18 part 2 (also Chapter 19.3 & 19.4)
") Vert Phys PCB3743 Pancreas Fox Chapter 18 part 2 (also Chapter 19.3 & 19.4) T. Houpt, Ph.D. Anatomy of Digestive System Peristalsis Stomach and Acid Secretion Liver and Bile Secretion Pancreas and pancreatic
Vert Phys PCB3743 Pancreas Fox Chapter 18 part 2 (also Chapter 19.3 & 19.4) T. Houpt, Ph.D. Anatomy of Digestive System Peristalsis Stomach and Acid Secretion Liver and Bile Secretion Pancreas and pancreatic
Anatomy & Physiology Revealed Instructions. 1. From the Module dropdown menu, chose the 12. Digestive system.
 #10 - Objectives: Examine the histology of selected body organs using Anatomy & Physiology Revealed software and microscope slides. Be able to identify each organ and the specific structures indicated
Urogenital Development
 2-5-03 Urogenital Development Greg Dressler Assoc. Professor Dept. of Pathology x46490 Dressler@umich.edu The Origin of the Kidney In the vertebrate embryo, the first stage of kidney development occurs
The Evolution and Development of the Gut. Dr Mike Wride School of Natural Sciences Zoology Department
 The Evolution and Development of the Gut Dr Mike Wride School of Natural Sciences Zoology Department email: wridem@tcd.ie The gut? Gut Function and Regulation (Dr. Alan Tuffery) Absorption of nutrients
1. To describe the gross structure of the pituitary gland and be able to identify the pars nervosa, pars intermedia and pars distalis.
 ENDOCRINE Objectives 1. To describe the gross structure of the pituitary gland and be able to identify the pars nervosa, pars intermedia and pars distalis. 2. Identify and describe the histological features
5 Dr. Heba Kalbouneh
 5 Dr. Heba Kalbouneh Glandular epithelium Gland: Is a collection of epithelial cells the secrets a certain product, like: proteins, lipids and carbohydrates. Secretion : A certain material that is produced
18. PANCREATIC FUNCTION AND METABOLISM. Pancreatic secretions ISLETS OF LANGERHANS. Insulin
 18. PANCREATIC FUNCTION AND METABOLISM ISLETS OF LANGERHANS Some pancreatic functions have already been discussed in the digestion section. In this one, the emphasis will be placed on the endocrine function
- Tamara Wahbeh. - Fareed Khdair. 0 P a g e
 -1 - Tamara Wahbeh - - Fareed Khdair 0 P a g e GI Embryology Note: I included everything in the records and slides; anything in the slide not included in this sheet was not mentioned by the doctor during
Dr. Heba Kalbouneh. Dr. Heba Kalbouneh. Dr. Heba Kalbouneh
 Dr. Heba Kalbouneh Dr. Heba Kalbouneh Dr. Heba Kalbouneh Basement membrane: What is the basement membrane? - It is a layer of ECM separating the epithelial cells from the underlying connective tissue Basement
Neurodevelopment II Structure Formation. Reading: BCP Chapter 23
 Neurodevelopment II Structure Formation Reading: BCP Chapter 23 Phases of Development Ovum + Sperm = Zygote Cell division (multiplication) Neurogenesis Induction of the neural plate Neural proliferation
Epithelia will be discussed according to the following scheme: Type Number of layers Shape Line drawing. Squamous Cuboidal Columnar
 Epithelia Epithelia will be discussed according to the following scheme: Type Number of layers Shape Line drawing Simple Squamous Cuboidal Columnar Covering and Lining epithelium Pseudostratified Stratified
Histology = the study of tissues. Tissue = a complex of cells that have a common function
 { EPITHELIAL TISSUE Histology = the study of tissues Tissue = a complex of cells that have a common function The Four Primary Tissue Types: Epithelium (epithelial tissue) covers body surfaces, lines body
3D differentiation enhances the efficiency of differentiation of human induced pluripotent stem cells to insulin producing cells
 University of Iowa Iowa Research Online Theses and Dissertations Fall 2014 3D differentiation enhances the efficiency of differentiation of human induced pluripotent stem cells to insulin producing cells
Slide 154: Pancreas, H&E
 Slide 154: Pancreas, H&E the pancreas, located adjacent to the duodenum, is a mixed exocrine and endocrine gland; it is usually readily identifiable by the presence of the interspersed endocrine pancreatic
Genes controlling pancreas ontogeny. CLAIRE BONAL and PEDRO L. HERRERA*
 Int. J. Dev. Biol. 52: 823-835 (2008) doi: 10.1387/ijdb.072444cb THE INTERNATIONAL JOURNAL OF DEVELOPMENTAL BIOLOGY www.intjdevbiol.com Genes controlling pancreas ontogeny CLAIRE BONAL and PEDRO L. HERRERA*
UNIVERSITY OF PNG SCHOOL OF MEDICINE AND HEALTH SCIENCES DIVISION OF BASIC MEDICAL SCIENCES DISCIPLINE OF BIOCHEMISTRY AND MOLECULAR BIOLOGY
 1 UNIVERSITY OF PNG SCHOOL OF MEDICINE AND HEALTH SCIENCES DIVISION OF BASIC MEDICAL SCIENCES DISCIPLINE OF BIOCHEMISTRY AND MOLECULAR BIOLOGY GLUCOSE HOMEOSTASIS An Overview WHAT IS HOMEOSTASIS? Homeostasis
The Endocrine Pancreas (Chapter 10) *
 *") OpenStax-CNX module: m62118 1 The Endocrine Pancreas (Chapter 10) * Ildar Yakhin Based on The Endocrine Pancreas by OpenStax This work is produced by OpenStax-CNX and licensed under the Creative Commons
OpenStax-CNX module: m62118 1 The Endocrine Pancreas (Chapter 10) * Ildar Yakhin Based on The Endocrine Pancreas by OpenStax This work is produced by OpenStax-CNX and licensed under the Creative Commons
Cell Type Nervous System I. Developmental Readout. Foundations. Stem cells. Organ formation. Human issues.
 7.72 10.11.06 Cell Type Nervous System I Human issues Organ formation Stem cells Developmental Readout Axes Cell type Axon guidance 3D structure Analysis Model + + organisms Foundations Principles 1 What
Hepatotoxicity Test by Stem Cell derived Hepatocyte
 Tuesday, April 24, 2012 Workshop: Genetic Toxicology: Opportunities to Integrate New Approaches Hepatotoxicity Test by Stem Cell derived Hepatocyte Seiichi Ishida National Institute of Health Sciences
Inner ear development Nervous system development
 Upcoming Sessions April 22: Nervous System Development Lecture April 24: Reviews of Axonal Pathfinding in Sensory Systems April 29: Inner Ear Development Lecture May 1: May 6: May 8: Auditory System Pathfinding
Axis Formation and Mesoderm Induction
 Developmental Biology Biology 4361 Axis Formation and Mesoderm Induction October 27, 2005 Amphibian anteroposterior specification polarized eggs animal/vegetal pigment yolk v. clear cytoplasm mitochondrial
SUPPLEMENTARY INFORMATION
 SUPPLEMENTARY INFORMATION doi:1.138/nature11463 %Sox17(+) 9 8 7 6 5 4 3 2 1 %Sox17(+) #Sox17(+) d2 d4 d6 d8 d1 d12 d14 d18 25 2 15 1 5 Number of Sox17(+) cells X 1 Supplementary Figure 1: Expression of
Control of Glucose Metabolism
 Glucose Metabolism Control of Glucose Metabolism The pancreas is both an exocrine and endocrine gland. It secretes digestive enzymes into the duodenum (exocrine) and 3 specific hormones into the bloodstream
Topics and aims. Introduction. Metabolism and Excretion
 Topics and aims Introduction This section contains instructions that are applicable to all material, irrespective of your specific course. Please take note and make sure to comply. Failure to comply could
a) They are the most common cause of pediatric kidney failure. b) They are always symptomatic. c) They can be asymmetric.
 They are the most common cause of pediatric kidney failure. b) They are always symptomatic. c) They can be asymmetric.") Practice questions: 1. The paraxial mesoderm gives rise to somites. The structure of the somite a) is a loose mesenchymal sheet that will migrate toward the notochord. b) is an epithelial rosette with
Practice questions: 1. The paraxial mesoderm gives rise to somites. The structure of the somite a) is a loose mesenchymal sheet that will migrate toward the notochord. b) is an epithelial rosette with
Development of Respiratory System. Dr. Sanaa Alshaarawy& Dr. Saeed Vohra
 Development of Respiratory System Dr. Sanaa Alshaarawy& Dr. Saeed Vohra OBJECTIVES At the end of the lecture the students should be able to: Identify the development of the laryngeotracheal (respiratory)
Journal Club WS 2012/13 Stefanie Nickl
 Journal Club WS 2012/13 Stefanie Nickl Background Mesenchymal Stem Cells First isolation from bone marrow 30 ys ago Isolation from: spleen, heart, skeletal muscle, synovium, amniotic fluid, dental pulp,
Organogenesis Part 2. V. Lateral Plate Mesoderm VI. Endoderm VII. Development of the Tetrapod Limb VIII. Sex Determination. V. Lateral Plate Mesoderm
 Organogenesis Part 2 V. Lateral Plate Mesoderm VI. Endoderm VII. Development of the Tetrapod Limb VIII. Sex Determination V. Lateral Plate Mesoderm chordamesoderm paraxial mesoderm intermediate mesoderm
SUPPLEMENTARY DATA. Supplementary Table 2. Antibodies used for Immunofluoresence. Supplementary Table 3. Real-time PCR primer sequences.
 Supplementary Table 2. Antibodies used for Immunofluoresence. Antibody Dilution Source Goat anti-pdx1 1:100 R&D Systems Rabbit anti-hnf6 1:100 Santa Cruz Biotechnology Mouse anti-nkx6.1 1:200 Developmental
ENERGY FROM INGESTED NUTREINTS MAY BE USED IMMEDIATELY OR STORED
 QUIZ/TEST REVIEW NOTES SECTION 1 SHORT TERM METABOLISM [METABOLISM] Learning Objectives: Identify primary energy stores of the body Differentiate the metabolic processes of the fed and fasted states Explain
substance excreted protein-deficient diet protein-rich diet. urea uric acid ammonium ions creatinine
 1. Define the term excretion....... [Total 2 marks] 2. The table below shows the mass of different substances excreted by a volunteer during two 24 hour periods. During the first 24 hour period, the volunteer
Hormonal regulation of. Physiology Department Medical School, University of Sumatera Utara
 Hormonal regulation of nutrient metabolism Physiology Department Medical School, University of Sumatera Utara Homeostasis & Controls Successful compensation Homeostasis reestablished Failure to compensate
Regenerative Medicine for Cardiomyocytes
 Regenerative Medicine Regenerative Medicine for JMAJ 47(7): 328 332, 2004 Keiichi FUKUDA Assistant Professor, Institute for Advanced Cardiac Therapeutics, Keio University School of Medicine Abstract: Heart
Insulin and the brain. Mary ET Boyle, Ph. D. Department of Cognitive Science UCSD
 Insulin and the brain Mary ET Boyle, Ph. D. Department of Cognitive Science UCSD 1921 Banting & Macleod Nobel Prize 1923 White, M. F. (2003) Science Berg, J. M., Tymoczko, J. L. and Stryer, L. (2007) Biochemistry
Prolonged FGF signaling is necessary for lung and liver induction in Xenopus
 Shifley et al. BMC Developmental Biology 2012, 12:27 RESEARCH ARTICLE Open Access Prolonged FGF signaling is necessary for lung and liver induction in Xenopus Emily T Shifley 1, Alan P Kenny 2, Scott A
Analysis on the mechanism of reduced nephron number and the pathological progression of chronic renal failure in Astrin deficient rats
 Analysis on the mechanism of reduced nephron number and the pathological progression of chronic renal failure in Astrin deficient rats Summary of Doctoral Thesis Hidenori Yasuda Graduate School of Veterinary
Chapter 14: The Digestive System
 Chapter 14: The Digestive System Digestive system consists of Muscular tube (digestive tract) alimentary canal Accessory organs teeth, tongue, glandular organs 6 essential activities 1. 2. 3. 4. 5. 6.
When you see this diagram, remember that you are looking at the embryo from above, through the amniotic cavity, where the epiblast appears as an oval
 When you see this diagram, remember that you are looking at the embryo from above, through the amniotic cavity, where the epiblast appears as an oval disc 2 Why the embryo needs the vascular system? When
2/2/2011. Primitive Gut Tube Proctodeum and Stomodeum Stomach Duodenum Pancreas Liver and Biliary Apparatus Spleen Midgut
 DEVELOPMENT OF THE DIGESTIVE SYSTEM Development of Endodermal Organs Primitive Gut Tube Proctodeum and Stomodeum Stomach Duodenum Pancreas Liver and Biliary Apparatus Spleen Midgut Wednesday, February
Complete the table below to compare the processes of excretion and secretion.
 1. Excretion and secretion are two processes that take place in the body of a mammal. Complete the table below to compare the processes of excretion and secretion. excretion secretion one difference one
Chapter 1 Introduction to Physiology and Homeostasis
 Chapter 1 Introduction to Physiology and Homeostasis MULTIPLE CHOICE 1. Select the incorrect association. a. anatomy/function b. human body/multicellular. c. carbon dioxide/cell waste product. d. physiology/body
Epithelial Tissues. Types of Epithelial Tissues: Lining of Kidney
 Epithelial Tissues Covers the entire body surface and most of the body s inner cavities Outer epidermis (skin) protects from injury and drying out Inner epidermal tissue (on internal surfaces) often serves
Ms Amanda Clements ANATOMY AND PHYSIOLOGY OF THE LIVER. Pre-Conference Nurse s Course. Plymouth Hospital NHS Foundation Trust 12/12/2014
 Pre-Conference Nurse s Course in partnership with Ms Amanda Clements Plymouth Hospital NHS Foundation Trust ANATOMY AND PHYSIOLOGY OF THE LIVER Amanda Clements Nurse Consultant Hepatology 1 Anatomy Largest
Construction of Nephron by Fusion of Adult Glomeruli to Ureteric Buds with Type V Collagen. Yusuke Murasawa, Pi-chao Wang
 Construction of Nephron by Fusion of Adult Glomeruli to Ureteric Buds with Type V Collagen Yusuke Murasawa, Pi-chao Wang Abstract Although tissue engineering of artificial organs such as skin or cartilage
RECAPITULATING PANCREATIC DEVELOPMENT IN INDUCING IN-VITRO HUMAN EMBRYONIC STEM CELL DIFFERENTIATION. Maria Jaramillo
 RECAPITULATING PANCREATIC DEVELOPMENT IN INDUCING IN-VITRO HUMAN EMBRYONIC STEM CELL DIFFERENTIATION TITLE by Maria Jaramillo B.S Biomedical Engineering, Florida International University, 2006 Submitted
The embryonic endoderm initially is widely connected with the yolk sac. As a consequence of cephalocaudal and lateral folding, a portion of the
 DIGESTIVE SYSTEM The embryonic endoderm initially is widely connected with the yolk sac. As a consequence of cephalocaudal and lateral folding, a portion of the endoderm-lined yolk sac cavity is incorporated
Healing & Repair. Tissue Regeneration
 Healing & Repair Dr. Srikumar Chakravarthi Repair & Healing: Are they same? Repair :Regeneration of injured cells by cells of same type, as with regeneration of skin/oral mucosa (requires basement membrane)
Pancreas-specific deletion of mouse Gata4 and Gata6 causes pancreatic agenesis
 Research article Related Commentary, page 3469 Pancreas-specific deletion of mouse Gata4 and Gata6 causes pancreatic agenesis Shouhong Xuan, 1 Matthew J. Borok, 1 Kimberly J. Decker, 2 Michele A. Battle,
3/20/2007 Page Mechanisms of Drug Action. The Liver and Metabolism September 30, 2005
 3/20/2007 Page 1 20.201 Mechanisms of Drug Action The Liver and Metabolism September 30, 2005 Distribution of Chemicals to Liver 3/20/2007 Page 2 Chemicals entering blood are distributed in the general
The Digestive System. What is the advantage of a one-way gut? If you swallow something, is it really inside you?
 The Digestive System What is the advantage of a one-way gut?! If you swallow something, is it really inside you? Functions and Processes of the Digestive System: Move nutrients, water, electrolytes from
Endocrine Pancreas Development and Regeneration: Noncanonical Ideas From Neural Stem Cell Biology
 314 Diabetes Volume 65, February 2016 Jimmy Masjkur, 1 Steven W. Poser, 1 Polyxeni Nikolakopoulou, 1 George Chrousos, 2 Ronald D. McKay, 3 Stefan R. Bornstein, 1 Peter M. Jones, 4 and Andreas Androutsellis-Theotokis
Formation of Urine: Formation of Urine
 The Urinary outflow tract: monitors and regulates extra-cellular fluids excretes harmful substances in urine, including nitrogenous wastes (urea) returns useful substances to bloodstream maintain balance
Hormonal Regulations Of Glucose Metabolism & DM
 Hormonal Regulations Of Glucose Metabolism & DM What Hormones Regulate Metabolism? What Hormones Regulate Metabolism? Insulin Glucagon Thyroid hormones Cortisol Epinephrine Most regulation occurs in order
Regionalization of the nervous system. Paul Garrity 7.68J/9.013J February 25, 2004
 Regionalization of the nervous system Paul Garrity 7.68J/9.013J February 25, 2004 Patterning along: Rostral/Caudal (AP) axis Dorsal/Ventral (DV) axis Start with DV axial patterning in Spinal Cord Dorsal/Ventral
University of Groningen. Development of MAPC derived induced endodermal progenitors Sambathkumar, Rangarajan
 University of Groningen Development of MAPC derived induced endodermal progenitors Sambathkumar, Rangarajan IMPORTANT NOTE: You are advised to consult the publisher's version (publisher's PDF) if you wish
Glandular Epithelium. Dr. Hersh Abdul Ham-Karim BVM&S, PG Dip, MSc and PhD
 Glandular Epithelium Dr. Hersh Abdul Ham-Karim BVM&S, PG Dip, MSc and PhD Glandular Epithelium Groups of surface cells differentiate, proliferate, and penetrate underlying connective tissue. Their main
Development of pancreas and Small Intestine. ANATOMY DEPARTMENT DR.SANAA AL-AlSHAARAWY DR.ESSAM Eldin Salama
 Development of pancreas and Small Intestine ANATOMY DEPARTMENT DR.SANAA AL-AlSHAARAWY DR.ESSAM Eldin Salama OBJECTIVES At the end of the lecture, the students should be able to : Describe the development
CHAPTER VII CONCLUDING REMARKS AND FUTURE DIRECTION. Androgen deprivation therapy is the most used treatment of de novo or recurrent
 CHAPTER VII CONCLUDING REMARKS AND FUTURE DIRECTION Stathmin in Prostate Cancer Development and Progression Androgen deprivation therapy is the most used treatment of de novo or recurrent metastatic PCa.
MPB333:Molecular Endocrinology of Obesity and Diabetes
 MPB333:Molecular Endocrinology of Obesity and Diabetes The Use of Stem Cells as a Cure for Type 1 Diabetes January 15, 2010 Trish Labosky 9415C MRBIV trish.labosky@vanderbilt.edu In theory. 2. ~Easy and
DIGESTIVE. CHAPTER 17 Lecture: Part 1 Part 2 BIO 212: ANATOMY & PHYSIOLOGY II
 BIO 212: ANATOMY & PHYSIOLOGY II CHAPTER 17 Lecture: DIGESTIVE Part 1 Part 2 Dr. Lawrence G. Altman www.lawrencegaltman.com Some illustrations are courtesy of McGraw-Hill. SMALL INTESTINE DUODENUM > JEJUNUM
History of Investigation
 Acini - Pancreatic juice (1º) (2º) Secretions- neuronal and hormonal mechanisms 1) Secretin - bicarbonate rich 2) Cholecystokinin - enzyme rich Islets of Langerhans (contain 4 cell types) Alpha cells (α)-
The Endocrine Pancreas *
 OpenStax-CNX module: m47773 1 The Endocrine Pancreas * Steven Telleen Based on The Endocrine Pancreas by OpenStax This work is produced by OpenStax-CNX and licensed under the Creative Commons Attribution
Chapter 12 The Digestive Glands
 Chapter 12 The Digestive Glands Lyu Zhengmei Department of Histology and Embryology, Anhui Medical University Components of digestive glands large salivary glands, pancreas, liver, gallbladder. These organs
Pancreas Organogenesis: From Bud to Plexus to Gland
 a DEVELOPMENTAL DYNAMICS 240:530 565, 2011 SPECIAL ISSUE REVIEWS A PEER REVIEWED FORUM Pancreas Organogenesis: From Bud to Plexus to Gland Fong Cheng Pan and Chris Wright* Pancreas oganogenesis comprises
Regenerative medicine of the gastrointestinal tract
 Regenerative medicine of the gastrointestinal tract Assoc. Prof. Prasit Suwannalert, Ph.D. (Email: prasit.suw@mahidol.ac.th) Department of Pathobiology Faculty of Science, Mahidol University (SCBM301-
Lymphoid Organs. Dr. Sami Zaqout. Dr. Sami Zaqout IUG Faculty of Medicine
 Lymphoid Organs Dr. Sami Zaqout Cells of the Immune System Lymphocytes Plasma cells Mast cells Neutrophils Eosinophils Cells of the mononuclear phagocyte system Distribution of cells of the immune system
Cells & Tissues. Chapter 3
 Cells & Tissues Chapter 3 Cell Theory Cell is structural and functional unit of life Activity of an organism is dependent upon its cells Principle of Complementarity functions of cells are dependent upon
Endocrine System. Organs and Tissues: Pituitary Adrenals Pancreas Thyroid Parathyroids
 Endocrine System Organs and Tissues: Pituitary Adrenals Pancreas Thyroid Parathyroids Bruce A. Fenderson, Ph.D. Pathology, Anatomy & Cell Biology Sidney Kimmel Medical College Bruce.Fenderson@Jefferson.edu
Fig. S1. Upregulation of K18 and K14 mrna levels during ectoderm specification of hescs. Quantitative real-time PCR analysis of mrna levels of OCT4
 Fig. S1. Upregulation of K18 and K14 mrna levels during ectoderm specification of hescs. Quantitative real-time PCR analysis of mrna levels of OCT4 (n=3 independent differentiation experiments for each
10/27/2016. Processing in the Large Intestine. The colon of the large intestine is connected to the small intestine
 The hepatic portal vein carries nutrient-rich blood from the capillaries of the villi to the liver, then to the heart The liver regulates nutrient distribution, interconverts many organic molecules, and
Polarity and Segmentation. Chapter Two
 Polarity and Segmentation Chapter Two Polarization Entire body plan is polarized One end is different than the other Head vs. Tail Anterior vs. Posterior Front vs. Back Ventral vs. Dorsal Majority of neural
Animal Tissue Culture SQG 3242 Biology of Cultured Cells. Dr. Siti Pauliena Mohd Bohari
 Animal Tissue Culture SQG 3242 Biology of Cultured Cells Dr. Siti Pauliena Mohd Bohari The Culture Environment Changes of Cell s microenvironment needed that favor the spreading, migration, and proliferation
Computational Systems Biology: Biology X
 Bud Mishra Room 1002, 715 Broadway, Courant Institute, NYU, New York, USA L#5:(October-18-2010) Cancer and Signals Outline 1 2 Outline 1 2 Cancer is a disease of malfunctioning cells. Cell Lineage: Adult
The Groningen hypothermic liver perfusion system for improved preservation in organ transplantation Plaats, Arjan van der
 University of Groningen The Groningen hypothermic liver perfusion system for improved preservation in organ transplantation Plaats, Arjan van der IMPORTANT NOTE: You are advised to consult the publisher's
Organs Associated with the Digestive Tract. Dr. Emad I H Shaqoura M.D, M.Sc. Anatomy Faculty of Medicine, IUG March, 2016
 Organs Associated with the Digestive Tract Dr. Emad I H Shaqoura M.D, M.Sc. Anatomy Faculty of Medicine, IUG March, 2016 2 Salivary Glands Salivary Glands Major 90% of saliva Minor 10% of saliva Parotid
EB Education Revision Guide. How to work with Homeostasis: Part 2 Blood Glucose Regulation
 EB Education Revision Guide How to work with Homeostasis: Part 2 Blood Glucose Regulation Blood Glucose Regulation a) Why your body regulates glucose levels What you need to know about Homeostasis: Part
Neuroepithelial Cells and Neural Differentiation
 Neuroepithelial Cells and Neural Differentiation Neurulation The cells of the neural tube are NEUROEPITHELIAL CELLS Neural crest cells migrate out of neural tube Neuroepithelial cells are embryonic stem