A few new tools for better detection and understanding of STEMIs in the field.
|
|
|
- Patience Norris
- 6 years ago
- Views:
Transcription

1 A few new tools for better detection and understanding of STEMIs in the field.
2 Let s talk, prep and placement. Try to shoot for quality, consistency and no artifact! (looking sometimes for 1 or 2 mm changes) Prep skin!!!!!!!!! Pick good spots for limb leads. Rub in all electrodes. Know and use the anatomic locators for chest leads. Don t let your electrodes dry out.
 to Positive (+) The line from origin to our detector (+) we")
3 Getting your electrical eyes We are only seeing electrical activity in the heart. The electricity moves from Neg (-) to Positive (+) The line from origin to our detector (+) we call a vector.
4 Get the Vector, Victor Direction of electrical movement. Moving toward a Positive electrode makes an upright deflection. Moving away from a positive electrode, makes a downward deflection.
5 UNDERSTANDING THE POINT OF VIEW Coming at you.


6 Force Going away from you


7 Force passing By Not directly toward or away
8 Proper powers of description are still important. (because your transmission equipment always works flawlessly doesn t it?)
9 Q First downward deflection after the P Q waves Physiologic Q waves <.04 sec (40ms) Pathologic Q >.04 sec (40 ms)
10 The result of infarction Myocardial tissue has died, it does not regenerate. As it turns to mush and rots away, it is replaced by scar tissue. Scar tissue does not pump and it does not conduct electricity. It is a patch, that is all.
11 Thrombus Infarcted Area Electrically Silent Ischemia Depolarization
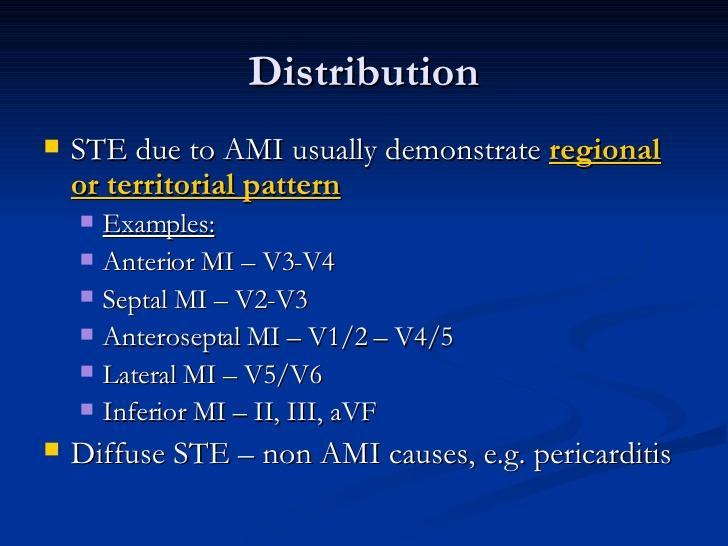
12 Since we are mentioning infarcts Some make Q waves and some don t. Some make ST segment elevation and some don t. What s the difference? Transmural (full thickness) Make ST elevation and usually make Q waves eventually. Describe the Subendocardial AMI. Often marked only by ST segment depression or T wave inversion.
13 QRS, Wave definitions Q wave
14 QS Complex
15 R Wave
16 S Wave
17 Various Ventricular waves
18 ST Segment Compare to TP segment ST TP
19 J-Point
20 ST Segment changes T wave inversion ST depression Hyperacute T waves ST Segment elevation


21 Evolution of AMI Hyperacute T Wave Big is bad

22 Evolution of AMI Acute
23 ST segment Criteria Changes must be in at least 2 contiguous leads. Must be at least 1 mm.

24 AND NOW THE IMPORTANT STUFF!! Recognition of acute injury patterns: ST segment elevation Measuring degree of elevation - begins at the J point (junction of the end of the QRS complex with the ST segment) and ends at the beginning of the T wave Count the boxes of elevation from the isoelectric line - #mm of elevation


25 Practice Find J-points and ST segments

26 ST elevation

27 Find the elevation
28 3 parts to the class Part one Strengthening component recognition and basics. Part 2 A. Concave vs. convex ST segments. Other things that may cause ST elevation. B. Using reciprocal leads to aid suspicion for STEMI and hidden STEMI. C. Sgarbossa criteria. Seeing STEMIs through BBBs and paced rhythms. Part 3. A few tidbits and using axis.
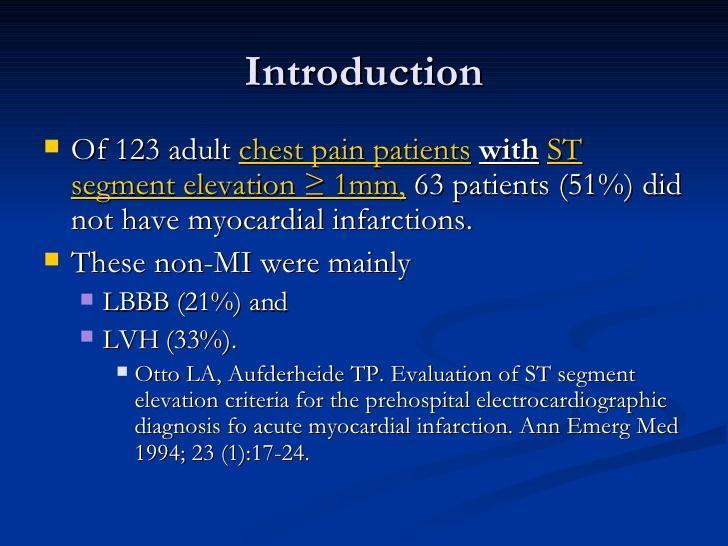
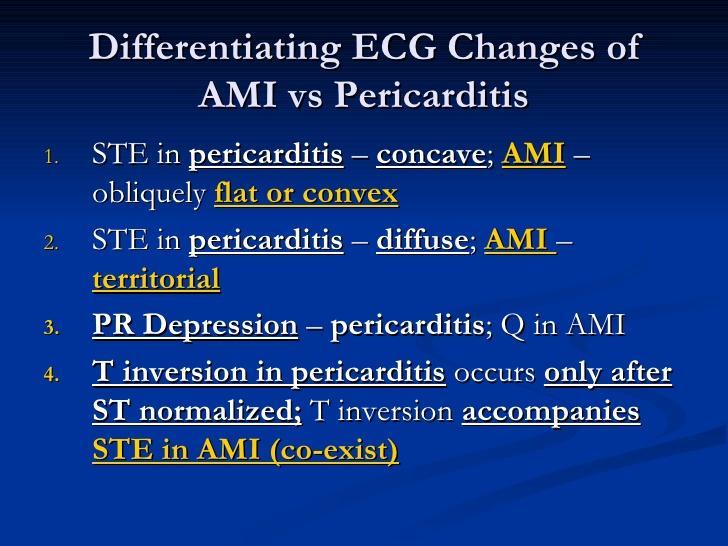
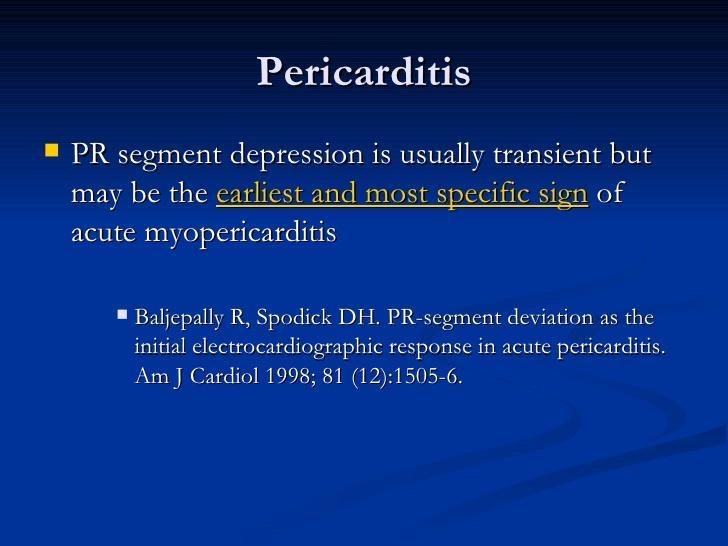
29 Things that cause ST elevation STEMIs of course. Must be at least 1 mm of elevation in 2 contiguious leads. Are there other things that could cause ST elevation? 2 things that we have all seen immediately come to mind. Pericarditis-Elevation in multiple leads usually. Pain that gets better if the Pt leans forward.
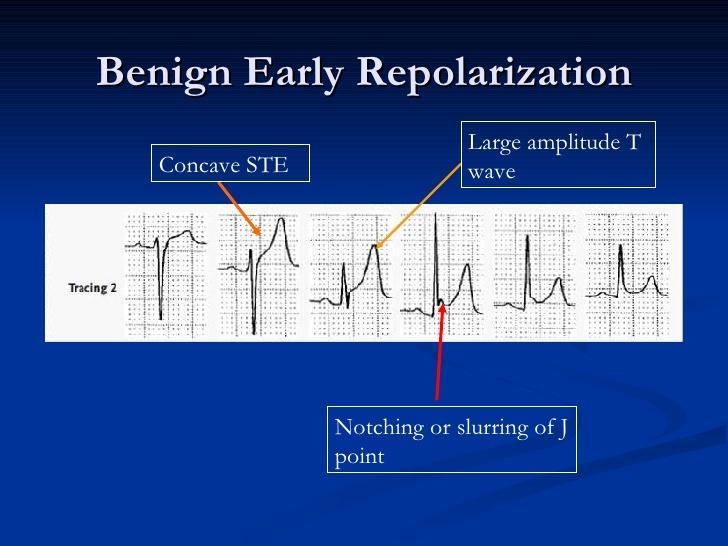
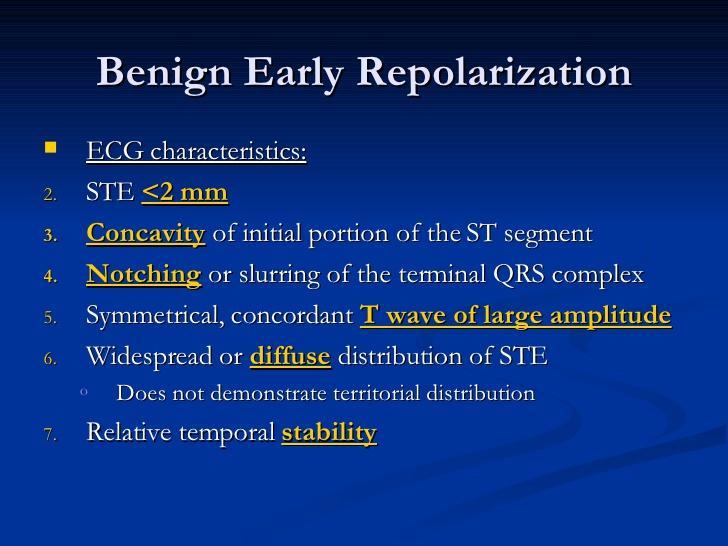
30 Non-STEMI ST elevation Continued Early repolarization. Usually seen in tall slender athletic males. More often in blacks than whites.
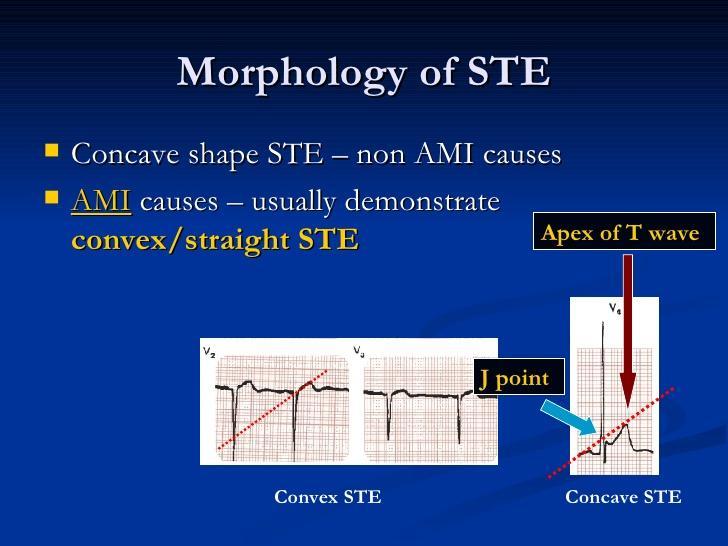
31 Looking at the ST segment, a few clues. The J point (Define) healthy J points usually show a clearly defined S to T wave transition. Sharp turns. Sick J points usually are slurred. This is a reason we count out 80 ms before we measure elevation. Identify the segment as concave vs. convex. Convex usually injury concave may be other cause. Straight line in elevation after J point also more likely to be STEMI.
32 J POINT Measure the J Point beginning two small boxes from the end of the QRS complex; then count the number of boxes either above or below the isoelectric line this is the number of millimeters of ST elevation (acute injury) or ST depression (ischemia) Baseline Quantity or depth of ST-segment depression J-point.08 seconds
33
34
35

36
37
38
39
40
41
42
43
44 Reciprocal changes As we have learned in the past, an additional confirmation for ST elevation can be ST depression in another lead that borders the injury zone. Not all leads have a reciprocal mate. Anterior for instance, does not have a direct reciprocal in the standard 12 lead. (it does with a 15 lead though) Some recriprocal changes can be as subtle as flattening of an ST segment in the recriprocal lead.
45 Reciprocal changes continued.. One simple way many of us have used this is to be suspicious of a posterior AMI if you see ST depression in V1-2 which may be elevation on the other side of the heart, V8-9. The inferior AMI, represents over 50% of all AMIs and it fortunately has recriprocal depression in the High lateral leads I and AVL showing depression and T wave inversion there.
46
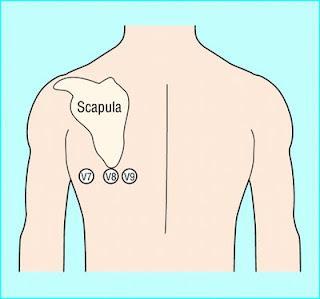
47 Why it s hard to detect posterior and RV AMIs with the standard 12 lead. where are the electrodes that watch these sites?

48 Where is the elevation and where is the recriprocal depression?

49 Same question

50 Is there recriprocal confirmation here?

51 Using a recriprocal principle, what might you be suspicious ids happening here? What could you do to rule it in or out?
52
53 What areas of the heart does the RCA generally feed?
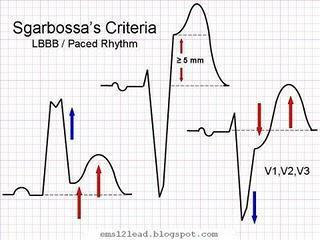
54 Sgarbossa criteria.reading through the bundle branches Sgarbossa Criteria: LBBB and AMI Sgarbossa EB et al, for GUSTO-1 investigators. ECG diagnosis of evolving AMI in the presence of LBBB. New Engl J Med 1996; 334: In a Left Bundle Branch Block (LBBB), the major, terminal portion of the QRS complex will normally be appropriately discordant with the ST segment. Example: If the QRS is negative, the ST segment will be normally elevated. Sgarbossa criteria: For detecting an AMI in the setting of a LBBB Derived from the GUSTO-1 trial Be aware that Sgarbossa are not perfect in screening for AMI. Use as another data point in risk-stratiying these complex patients with LBBB. Sgarbossa criteria hold true for LBBB pattern seen in pacemaker patients
55 What it tells us. In LBBB, a concordant complex to ST elevation relationship that is greater than or equal to 1 mm will represent true elevation and is predictive of STEMI over 9 out of 10 times. >95% ST depression that is discordant in V1-3 is either true depression or posterior elevation. Just as if you saw it without the BBB. ST elevation that is discordant but greater or equal to 5 mm is predictive of AMI. Past 10mm, usually associated with LVH and is not reiable.
56 Definitions Concordant- to be in agreement In this case, the major direction of the ventricular depolarization wave points in the same direction as the T wave. In Sgarbossa world, this is a bad thing when a BBB is present and elevation is greater than 1 mm.
57 Discordant To have non-agreement or discord. In Sgarbossa world, this means that the T wave points in the opposite direction of the vetricular compex. In most cases, this is read as a negative result.
58
59 Of course, there are exceptions. Excessive discordance, where the ST elevation is at or exceeds 5mm. If this appears in lead groups, it is read as injury.
60
61 In a nutshell Discordant usually good. Concordant usually bad.
62
63
64
65
66
67
68
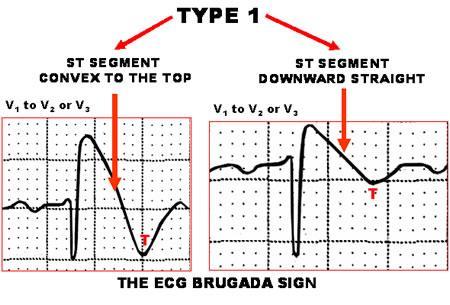
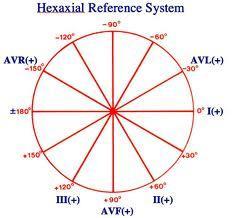
69 Brugada Syndrome A cause of sudden cardiac death from polymorphic VT or VF in an otherwise normal heart. First published in 1992, it is believed to be responsible for 50% 0f the sudden deaths in structurally normal hearts. It shows up on the 12 lead. It has a genetic component. Drugs don t help. When found an ICD is placed.
70
71
72

73 LAD Stenosis

74 A practical understanding that we can apply
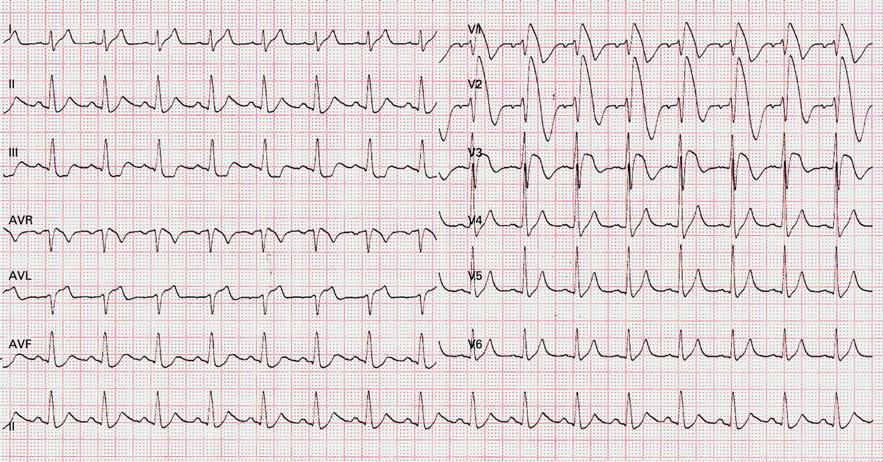
75 Determining the QRS vector The vector is a summation of the generalized direction of the electrical line and direction of travel as the ventricles depolarize. The process uses 6 leads I,II,III,AVR, AVL, AVF. A the same complex is examined in each of these leads and a value either positive or negative is calculated by counting the mm above and below the isoelectric line and subtracting the negative mm from the positive. The lead with the largest number determines the vector plotted on the hexaxial reference diagram.
76 Fortunately, we aren t going to do it that way!
77 Recall that the axis can be considered in terms of four quadrants, with lead I oriented at 0, and avf oriented at +90. An ECG with the QRS axis oriented to the quadrant between 0 and 90 is said to be normal. An ECG with the QRS axis oriented to the quadrant between -1 and -90 is said to have left axis deviation. An ECG with the QRS oriented to the quadrant between +91 and 180 is said to have right axis deviation. An ECG with the QRS oriented to the quadrant between -91 and -180 is said to have an indeterminate axis because one cannot tell if it represents right or left axis deviation.
78 We need to know basically If the axis is normal. If there is RT or Left axis deviation. If there is extreme Rt axis deviation. If there is limb lead reversal.
79 Useful stuff If I and AVF are positive, The axis is normal. If The ECG is upside down in lead I including the P waves, the limb leads are reversed. This is further confirmed by upright complexes in AVR. Unless there is ERAD (ventricular rhythm or VT ), or lead reversal, AVR is always negative. You can use the calculated QRS axis in every `12 lead printout and compare it to a hexaxial diagram. You can master the 4 quadrant method and do it yourself. Or use a 4 quadrant cheat sheet.
80 Causes of Left axis deviation Left anterior hemiblock Pathologic left axis. Big Q waves from a Inferior wall infarct.
81 Right axis deviation Pulmonary disease. R. t ventricular hypertrophy. Left posterior hemiblock. Rt. Bundle branch (fooler) RBBB makes the axis appear rightward.
82 Extreme Right Axis deviation also called indeterminent axis. V Tach Ventricular rhythm Limb lead reversal
83
84
85 Please draw a circle on a piece of paper. Divide the circle into 4 equal quadrants. Recalling where AVF is, label it s location. Recalling where Lead I is label its location. Label the 4 quadrants Normal, RAD, LAD, ERAD. Draw a new circle, and we will construct a hexaxial diagram together. Set it aside for reference. Then we are going to use these tools on the next series of ECGs.
86 Draw and label the circle diagram with I and AVF

87 Color in the diagram

88 Color it in we are going to get help from lead II in this one
89
90
91
92
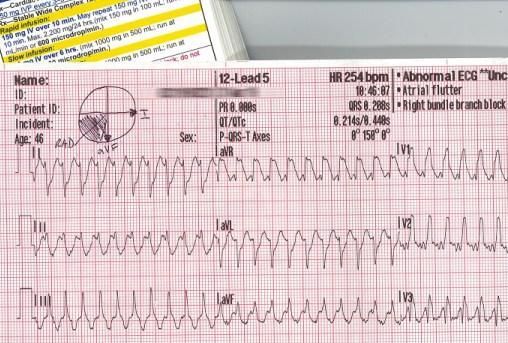
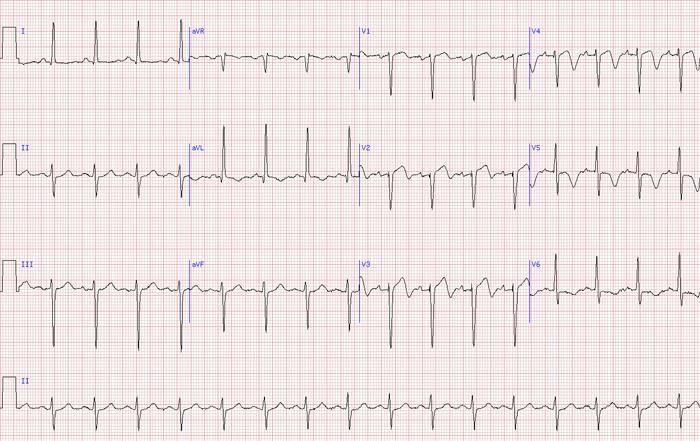
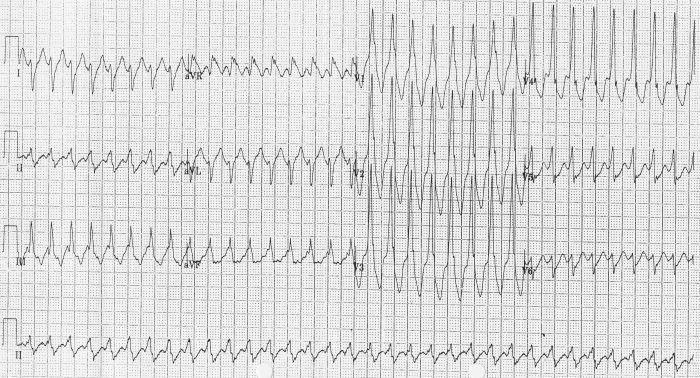
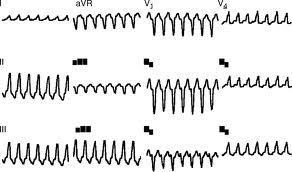
93 Ventricular tachycardias These don t always follow all of these rules. There are multiple sources of VT Like Rt. Ventricular outflow tract VT Or, left fascicular VT Lets use what we now know about leads and see what we can do with these following rhythms. Of Course, if the Pt is decompensating, cardiovert it!

94 What does AVR say? What about V6, vector toward or away?
95
96
97
98
99

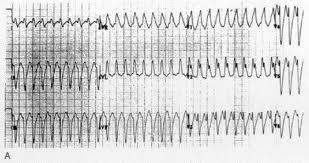
100 VT from a RT Ventricular dysplasia
101 Sources EMS 12 lead. Critical care transport manual K.S. Chow School of medical sciences, Universiti Sains Malaysia Journal of Emergency Medicine. Goldberger, Clinical electrophysiology
All About STEMIs. Presented By: Brittney Urvand, RN, BSN, CCCC. Essentia Health Fargo Cardiovascular Program Manager.
 All About STEMIs Presented By: Brittney Urvand, RN, BSN, CCCC Essentia Health Fargo Cardiovascular Program Manager Updated 10/2/2018 None Disclosures Objectives Identify signs and symptoms of a heart attack
Family Medicine for English language students of Medical University of Lodz ECG. Jakub Dorożyński
 Family Medicine for English language students of Medical University of Lodz ECG Jakub Dorożyński Parts of an ECG The standard ECG has 12 leads: six of them are considered limb leads because they are placed
12-Lead ECG Interpretation. Kathy Kuznar, RN, ANP
 12-Lead ECG Interpretation Kathy Kuznar, RN, ANP The 12-Lead ECG Objectives Identify the normal morphology and features of the 12- lead ECG. Perform systematic analysis of the 12-lead ECG. Recognize abnormalities
Electrocardiography for Healthcare Professionals. Chapter 14 Basic 12-Lead ECG Interpretation
 Electrocardiography for Healthcare Professionals Chapter 14 Basic 12-Lead ECG Interpretation 2012 The Companies, Inc. All rights reserved. Learning Outcomes 14.1 Discuss the anatomic views seen on a 12-lead
12 Lead ECG. Presented by Rebecca Sevigny BSN, RN Professional Practice & Development Dept.
 12 Lead ECG Presented by Rebecca Sevigny BSN, RN Professional Practice & Development Dept. Two Main Coronary Arteries RCA LCA which branches into Left Anterior Descending Circumflex Artery Two Main Coronary
Foundations EKG I - Unit 1 Summary
 Foundations EKG I - Unit 1 Summary The accurate diagnosis of ST elevation myocardial infarction (STEMI) is one of the most time critical duties in the practice of EM. Diagnosis is not always easy so guidelines
12 Lead EKG. The Basics
 12 Lead EKG The Basics Objectives Demonstrate proper 12 EKG lead placement Determine electrical axis Identify ST and T wave changes as they relate to myocardial ischemia Describe possible complications
REtrive. REpeat. RElearn Design by. Test-Enhanced Learning based ECG practice E-book
 Test-Enhanced Learning Test-Enhanced Learning Test-Enhanced Learning Test-Enhanced Learning based ECG practice E-book REtrive REpeat RElearn Design by S I T T I N U N T H A N G J U I P E E R I Y A W A
Axis. B.G. Petty, Basic Electrocardiography, DOI / _2, Springer Science+Business Media New York 2016
 Axis 2 The electrical axis of any electrocardiogram (EKG) waveform is the average direction of electrical activity. It is not a vector, because by definition a vector has both direction and amplitude,
Myocardial Infarction. Reading Assignment (p66-78 in Outline )
") Myocardial Infarction Reading Assignment (p66-78 in Outline ) Objectives 1. Why do ST segments go up or down in ischemia? 2. STEMI locations and culprit vessels 3. Why 15-lead ECGs? 4. What s up with avr?
Myocardial Infarction Reading Assignment (p66-78 in Outline ) Objectives 1. Why do ST segments go up or down in ischemia? 2. STEMI locations and culprit vessels 3. Why 15-lead ECGs? 4. What s up with avr?
The Fundamentals of 12 Lead EKG. ECG Recording. J Point. Reviewing the Cardiac Conductive System. Dr. E. Joe Sasin, MD Rusty Powers, NRP
 The Fundamentals of 12 Lead EKG Dr. E. Joe Sasin, MD Rusty Powers, NRP SA Node Intranodal Pathways AV Junction AV Fibers Bundle of His Septum Bundle Branches Purkinje System Reviewing the Cardiac Conductive
12 LEAD EKG BASICS. By: Steven Jones, NREMT P CLEMC
 12 LEAD EKG BASICS By: Steven Jones, NREMT P CLEMC ECG Review Waves and Intervals P wave: the sequential activation (depolarization) of the right and left atria QRS complex: right and left ventricular
Pennsylvania Academy of Family Physicians Foundation & UPMC 43rd Refresher Course in Family Medicine CME Conference March 10-13, 2016
 Pennsylvania Academy of Family Physicians Foundation & UPMC 43rd Refresher Course in Family Medicine CME Conference March 10-13, 2016 Disclosures: EKG Workshop Louis Mancano, MD Speaker has no disclosures
ECG Basics Sonia Samtani 7/2017 UCI Resident Lecture Series
 ECG Basics Sonia Samtani 7/2017 UCI Resident Lecture Series Agenda I. Introduction II.The Conduction System III.ECG Basics IV.Cardiac Emergencies V.Summary The Conduction System Lead Placement avf Precordial
12 Lead ECG Skills: Building Confidence for Clinical Practice. Presented By: Cynthia Webner, BSN, RN, CCRN-CMC. Karen Marzlin, BSN, RN,CCRN-CMC
 12 Lead ECG Skills: Building Confidence for Clinical Practice NTI 2009 Preconference Session 803 Presented By: Karen Marzlin, BSN, RN,CCRN-CMC 1 12 Lead ECG Fundamentals: The Starting Place for Linking
ECG CONVENTIONS AND INTERVALS
 1 ECG Waveforms and Intervals ECG waveforms labeled alphabetically P wave== represents atrial depolarization QRS complex=ventricular depolarization ST-T-U complex (ST segment, T wave, and U wave)== V repolarization.
Relax and Learn At the Farm 2012
 Relax and Learn At the Farm 2012 Session 2: 12 Lead ECG Fundamentals 101 Cynthia Webner DNP, RN, CCNS, CCRN-CMC, CHFN Though for Today Mastery is not something that strikes in an instant, like a thunderbolt,
Preface: Wang s Viewpoints
 AHA/ACCF/HRS Recommendations for the Standardization and Interpretation of the Electrocardiogram: Part IV, Ischemia and Infarction Presented by: WANG, TZONG LUEN, MD, PhD, JM, FACC, FESC, FCAPSC Professor,
12 Lead ECG Interpretation: Color Coding for MI s
 12 Lead ECG Interpretation: Color Coding for MI s Anna E. Story, RN, MS Director, Continuing Professional Education Critical Care Nurse Online Instructional Designer 2004 Anna Story 1 Objectives review
Section V. Objectives
 Section V Landscape of an MI Objectives At the conclusion of this presentation the participant will be able to Outline a systematic approach to 12 lead ECG interpretation Demonstrate the process for determining
Marcin Dada, MD December 03, 2013
 STEMI Imposters Marcin Dada, MD December 03, 2013 Marcin Dada, MD Associate Director, Chest Pain Center Hartford Hospital, Hartford, CT Member, AHA Mission Lifeline Steering Committee Outline of Topics
Acute Coronary Syndromes Unstable Angina Non ST segment Elevation MI (NSTEMI) ST segment Elevation MI (STEMI)
 ST segment Elevation MI (STEMI)") Leanna R. Miller, RN, MN, CCRN-CSC, PCCN-CMC, CEN, CNRN, CMSRN, NP Education Specialist LRM Consulting Nashville, TN Objectives Evaluate common abnormalities that mimic myocardial infarction. Identify
Leanna R. Miller, RN, MN, CCRN-CSC, PCCN-CMC, CEN, CNRN, CMSRN, NP Education Specialist LRM Consulting Nashville, TN Objectives Evaluate common abnormalities that mimic myocardial infarction. Identify
also aid the clinician in recognizing both the obvious and subtle abnormalities that may help guide therapy.
 Karen Lieberman, MS, CRNP f the many diagnostic tools used to screen for and evaluate cardiac abnormalities, the 12-lead electrocardiogram (ECG) is among the most basic. This inexpensive and noninvasive
By the end of this lecture, you will be able to: Understand the 12 lead ECG in relation to the coronary circulation and myocardium Perform an ECG
 By the end of this lecture, you will be able to: Understand the 12 lead ECG in relation to the coronary circulation and myocardium Perform an ECG recording Identify the ECG changes that occur in the presence
Please check your answers with correct statements in answer pages after the ECG cases.
 ECG Cases ECG Case 1 Springer International Publishing AG, part of Springer Nature 2018 S. Okutucu, A. Oto, Interpreting ECGs in Clinical Practice, In Clinical Practice, https://doi.org/10.1007/978-3-319-90557-0
Disclosures. STEMI:To Call or Not to Call. Disclosures 9/18/2017. Alternate Title: Hey Doc, If you re not doing anything Saturday Night
 STEMI:To Call or Not to Call Disclosures No financial disclosures September, 2017 Frederick James Trip Meine III MD, FACC, FSCAI Cape Fear Heart Associates, Wilmington, NC Disclosures Alternate Title:
Acute Coronary Syndromes. Disclosures
 Acute Coronary Syndromes Disclosures I work for Virginia Garcia Memorial Health Center, Beaverton, OR. Jon Tardiff, BS, PA-C OHSU Clinical Assistant Professor And I am a medical editor for Jones & Bartlett
3/4/2018. March Martina Frost, PA C Desert Cardiology. Electricity moving towards/away from electrode create downward/upward directions of waves
 March 2018 Martina Frost, PA C Desert Cardiology Electricity moving towards/away from electrode create downward/upward directions of waves Frontal view Limb leads: I, II, III, avl, avf, (avr) Horizontal
Introduction to Electrocardiography
 Introduction to Electrocardiography Class Objectives: Introduction to ECG monitoring Discuss principles of interpretation Identify the components and measurements of the ECG ECG analysis ECG Monitoring
12 Lead Electrocardiogram (ECG) PFN: SOMACL17. Terminal Learning Objective. References
 PFN: SOMACL17. Terminal Learning Objective. References") 12 Lead Electrocardiogram (ECG) PFN: SOMACL17 Slide 1 Terminal Learning Objective Action: Communicate knowledge of 12 Lead Electrocardiogram (ECG) Condition: Given a lecture in a classroom environment
12 Lead Electrocardiogram (ECG) PFN: SOMACL17 Slide 1 Terminal Learning Objective Action: Communicate knowledge of 12 Lead Electrocardiogram (ECG) Condition: Given a lecture in a classroom environment
10 ECGs No Practitioner Can Afford to Miss. Objectives
 10 ECGs No Practitioner Can Afford to Miss Mary L. Dohrmann, MD Professor of Clinical Medicine Division of Cardiovascular Medicine University of Missouri School of Medicine No disclosures Objectives 1.
Bundle Branch & Fascicular Blocks. Reading Assignment (p53-58 in Outline )
") Bundle Branch & Fascicular Blocks Reading Assignment (p53-58 in Outline ) Objectives 1. QRS analysis of Right and Left BBB 2. Uncomplicated vs complicated BBB 3. Diagnosis of RBBB with LAFB and LPFB 4.
Bundle Branch & Fascicular Blocks Reading Assignment (p53-58 in Outline ) Objectives 1. QRS analysis of Right and Left BBB 2. Uncomplicated vs complicated BBB 3. Diagnosis of RBBB with LAFB and LPFB 4.
12 LEAD EKG & CXR INTERPRETATION.
 12 LEAD EKG & CXR INTERPRETATION www.cherylherrmann.com cherrmann@frontier.com Audio Product Recording discount for participants $60 Nonparticipants = $190 o Get CEs and manual https://catalog.vyne.com
This presentation will deal with the basics of ECG description as well as the physiological basics of
 Snímka 1 Electrocardiography basics This presentation will deal with the basics of ECG description as well as the physiological basics of Snímka 2 Lecture overview 1. Cardiac conduction system functional
2017 EKG Workshop Advanced. Family Medicine Review Course Lou Mancano, MD, FAAFP Reading Health System Family and Community Medicine Reading, PA
 2017 EKG Workshop Advanced Family Medicine Review Course Lou Mancano, MD, FAAFP Reading Health System Family and Community Medicine Reading, PA Part II - Objective Describe a useful approach to interpreting
Masqueraders of STEMI
 Masqueraders of STEMI Steven M. Costa, M.D. Assistant Professor Department of Medicine Division of Cardiology Scott & White Memorial Hospital and Clinic Texas A&M University Health Science Center Disclosures
12 Lead ECG Interpretation
 12 Lead ECG Interpretation Julie Zimmerman, MSN, RN, CNS, CCRN Significant increase in mortality for every 15 minutes of delay! N Engl J Med 2007;357:1631-1638 Who should get a 12-lead ECG? Also include
ECG ABNORMALITIES D R. T AM A R A AL Q U D AH
 ECG ABNORMALITIES D R. T AM A R A AL Q U D AH When we interpret an ECG we compare it instantaneously with the normal ECG and normal variants stored in our memory; these memories are stored visually in
ECG (MCQs) In the fundamental rules of the ECG all the following are right EXCEP:
 In the fundamental rules of the ECG all the following are right EXCEP:") ECG (MCQs) 2010 1- In the fundamental rules of the ECG all the following are right EXCEP: a- It is a biphasic record of myocardial action potential fluctuations. b- Deflection record occurs only during
ECG (MCQs) 2010 1- In the fundamental rules of the ECG all the following are right EXCEP: a- It is a biphasic record of myocardial action potential fluctuations. b- Deflection record occurs only during
ECG pre-reading manual. Created for the North West Regional EMET training program
 ECG pre-reading manual Created for the North West Regional EMET training program Author:- Dr Juan Carlos Ascencio-Lane juan.ascencio-lane@ths.tas.gov.au 1 Disclaimer This handbook has been created for
Basic electrocardiography reading. R3 lee wei-chieh
 Basic electrocardiography reading R3 lee wei-chieh The Normal Conduction System Lead Placement avf Limb Leads Precordial Leads Interpretation Rate Rhythm Interval Axis Chamber abnormality QRST change What
DR QAZI IMTIAZ RASOOL OBJECTIVES
 PRACTICAL ELECTROCARDIOGRAPHY DR QAZI IMTIAZ RASOOL OBJECTIVES Recording of electrical events in heart Established electrode pattern results in specific tracing pattern Health of heart i. e. Anatomical
Ekg pra pr c a tice D.HAMMOUDI.MD
 Ekg practice D.HAMMOUDI.MD Anatomy Revisited RCA (Right Coronary Artery) Right ventricle Inferior wall of LV Posterior wall of LV (75%) SA Node (60%) AV Node (>80%) LCA (Left Coronary Artery) Septal wall
Chapter 2 Practical Approach
 Chapter 2 Practical Approach There are beginners in electrocardiogram (ECG) analysis who are fascinated by a special pattern (e.g., a bundle-branch block or a striking Q wave) and thereby overlook other
ECG Workshop. Nezar Amir
 ECG Workshop Nezar Amir Myocardial Ischemia ECG Infarct ECG in STEMI is dynamic & evolving Common causes of ST shift Infarct Localisation Left main artery occlusion: o diffuse ST-depression with ST elevation
Diagnosis of Myocardial Infarction/Ischemia with Bundle Branch Blocks
 Diagnosis of Myocardial Infarction/Ischemia with Bundle Branch Blocks Mark I. Langdorf, MD, MHPE, FACEP, FAAEM, RDMS Professor and Chair Associate Residency Director Department of Emergency Medicine University
Appendix D Output Code and Interpretation of Analysis
 Appendix D Output Code and Interpretation of Analysis 8 Arrhythmia Code No. Description 8002 Marked rhythm irregularity 8110 Sinus rhythm 8102 Sinus arrhythmia 8108 Marked sinus arrhythmia 8120 Sinus tachycardia
ECG INTERPRETATION MANUAL
 Lancashire & South Cumbria Cardiac Network ECG INTERPRETATION MANUAL THE NORMAL ECG Lancashire And South Cumbria Cardiac Physiologist Training Manual THE NORMAL ECG E.C.G CHECKLIST 1) Name, Paper Speed,
MICS OF MYOCARDIAL ISCHEMIA AND INFARCTION REVISED FOR LAS VEGAS
 ECG MIMICS OF MYOCARDIAL ISCHEMIA AND INFARCTION 102.06.05 Tzong-Luen Wang MD, PhD, JM, FESC, FACC Professor. Medical School, Fu-Jen Catholic University Chief, Emergency Department, Shin-Kong Wu Ho-Su
Understanding basics of EKG
 Understanding basics of EKG By Alula A.(R III) www.le.ac.uk Topic for discussion Understanding of cellular electrophysiology Basics Rate Rhythm Axis Intervals P wave QRS ST/T wave Abnormal EKGs Understanding
INTERPRETAZIONE ECG NEL PAZIENTE CON SOSPETTO STEMI
 INTERPRETAZIONE ECG NEL PAZIENTE CON SOSPETTO STEMI Giacomo Veronese Scuola di Specializzazione Medicina d Emergenza e Urgenza Università Milano-Bicocca Siete d accordo se vi propongo per una relazione..
12 Lead Interpretation
 12 Lead Interpretation Objectives Ischemia, injury and infarction ECG complex review J point ST segment STEMI recognition Ischemia to Infarct Infarction is an evolving process As the infarct evolves ECG
Introduction to ECG Gary Martin, M.D.
 Brief review of basic concepts Introduction to ECG Gary Martin, M.D. The electrical activity of the heart is caused by a sequence of rapid ionic movements across cell membranes resulting first in depolarization
Lect.6 Electrical axis and cardiac vector Cardiac vector: net result Vector that occurs during depolarization of the ventricles Figure:
 Lect.6 Electrical axis and cardiac vector Objectives: 1. State the relationship between the direction of cardiac vector with the direction (-ve, +ve) and amplitude of an ECG waves. 2. Draw diagram indicting
Part One Objectives. Don t Worry About It. All done for you Paper Speed 25 mm/sec Calibration 1 mv charge over 20 ms = 10 mm tall Lincoln Hat
 12-lead and ACS Review North Lyon Refresher Part One Objectives 12 lead ECG Basics Anatomy and Physiology STEMI Diagnosis Types of MI ACS Review STEMI System and Interventional Cardiology Review The Value
12 Lead ECGs: Ischemia, Injury & Infarction. Kevin Handke NRP, FP-C, CCP, CMTE STEMI Coordinator Flight Paramedic
 12 Lead ECGs: Ischemia, Injury & Infarction Kevin Handke NRP, FP-C, CCP, CMTE STEMI Coordinator Flight Paramedic None Disclosures Objectives Upon completion of this program the learner will be able to
If the P wave > 0.12 sec( 3 mm) usually in any lead. Notched P wave usually in lead I,aVl may be lead II Negative terminal portion of P wave in V1, 1
 usually in any lead. Notched P wave usually in lead I,aVl may be lead II Negative terminal portion of P wave in V1, 1") If the P wave > 0.12 sec( 3 mm) usually in any lead. Notched P wave usually in lead I,aVl may be lead II Negative terminal portion of P wave in V1, 1 mm depth and 3 mm width( most specific) Since Mitral
If the P wave > 0.12 sec( 3 mm) usually in any lead. Notched P wave usually in lead I,aVl may be lead II Negative terminal portion of P wave in V1, 1 mm depth and 3 mm width( most specific) Since Mitral
ECG SIGNS OF HYPERTROPHY OF HEART ATRIUMS AND VENTRICLES
 Ministry of Health of Ukraine Kharkiv National Medical University ECG SIGNS OF HYPERTROPHY OF HEART ATRIUMS AND VENTRICLES Methodical instructions for students Рекомендовано Ученым советом ХНМУ Протокол
CORONARY ARTERIES HEART
 CARDIAC/ECG MODULE THE HEART CORONARY ARTERIES FIBRILLATING HEART CORONARY ARTERIES HEART PRACTICE RHYTHMS PRACTICE RHYTHMS ELECTRICAL CONDUCTION SA Node (60 100) Primary pacemaker AV Node (40 60) ***Creates
1 st Degree Block Prolonged P-R interval caused by first degree heart block (lead II)
") AV Heart Blocks 1 st degree A condition of a rhythm, not a true rhythm Need to always state underlying rhythm 2 nd degree Type I - Wenckebach Type II Classic dangerous to the patient Can be variable (periodic)
AV Heart Blocks 1 st degree A condition of a rhythm, not a true rhythm Need to always state underlying rhythm 2 nd degree Type I - Wenckebach Type II Classic dangerous to the patient Can be variable (periodic)
Study methodology for screening candidates to athletes risk
 1. Periodical Evaluations: each 2 years. Study methodology for screening candidates to athletes risk 2. Personal history: Personal history of murmur in childhood; dizziness, syncope, palpitations, intolerance
Goals: Widen Your Understanding of the Wide QRS!
 Goals: Widen Your Understanding of the Wide QRS! 1. Describe an approach to diagnosis of LBBB 2. Describe the predictive value of New LBBB 3. Describe the ST segment changes that are diagnostic of AMI
ECGs: Everything a finalist needs to know. Dr Amy Coulden As part of the Simply Finals series
 ECGs: Everything a finalist needs to know Dr Amy Coulden As part of the Simply Finals series Aims and objectives To be able to interpret basic ECG abnormalities To be able to recognise commonly tested
Left posterior hemiblock (LPH)/
/") ECG OF THE MONTH Left Postero-inferior Depolarization Delay Keywords Electrocardiography Intraventricular conduction delay, Inferoposterior hemiblock, Left posterior fascicular block, Left posterior hemiblock
ECG OF THE MONTH Left Postero-inferior Depolarization Delay Keywords Electrocardiography Intraventricular conduction delay, Inferoposterior hemiblock, Left posterior fascicular block, Left posterior hemiblock
Conduction Problems / Arrhythmias. Conduction
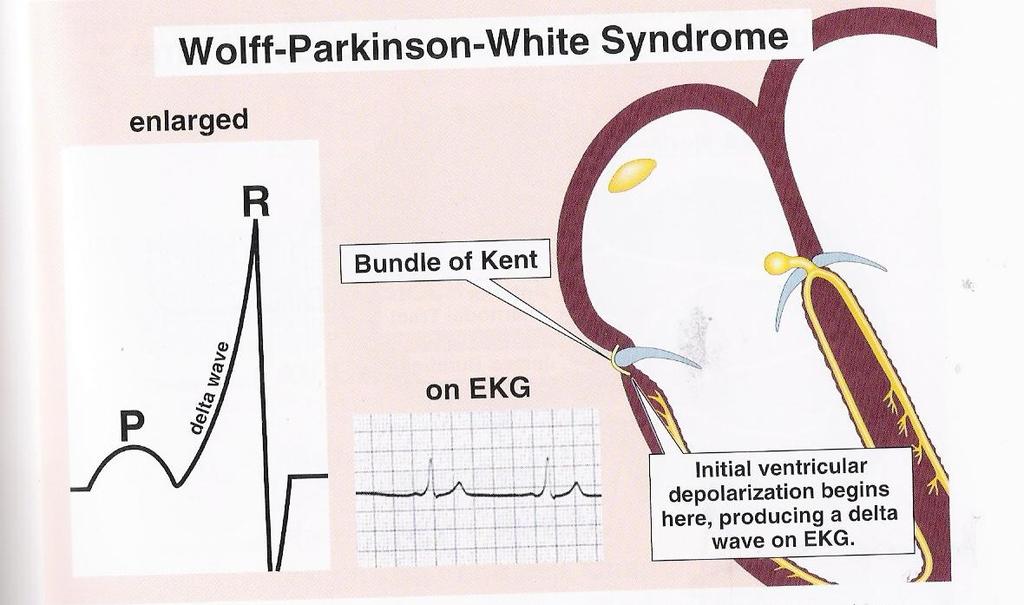
 Conduction Problems / Arrhythmias Conduction Wolf-Parkinson White Syndrome (WPW) and Lown-Ganong-Levine (LGL): Atrial impulses bypass the AV node through an accessory pathway or bypass tract (bundle of
STAT 12 Lead ECG Workshop: Basics & ACS
 STAT 12 Lead ECG Workshop: Basics & ACS Part 2: Acute Coronary Syndrome WAYNE W RUPPERT, CVT, CCCC, NREMT-P Cardiovascular Coordinator Bayfront Health Seven Rivers Crystal River, Florida Interventional
Electrical System Overview Electrocardiograms Action Potentials 12-Lead Positioning Values To Memorize Calculating Rates
 Electrocardiograms Electrical System Overview James Lamberg 2/ 74 Action Potentials 12-Lead Positioning 3/ 74 4/ 74 Values To Memorize Inherent Rates SA: 60 to 100 AV: 40 to 60 Ventricles: 20 to 40 Normal
ECG Interpretation Cat Williams, DVM DACVIM (Cardiology)
") ECG Interpretation Cat Williams, DVM DACVIM (Cardiology) Providing the best quality care and service for the patient, the client, and the referring veterinarian. GOAL: Reduce Anxiety about ECGs Back to
ECG Interpretation Cat Williams, DVM DACVIM (Cardiology) Providing the best quality care and service for the patient, the client, and the referring veterinarian. GOAL: Reduce Anxiety about ECGs Back to
Cardiac Ischemia ECG Workshop
 Cardiac Ischemia ECG Workshop Classic, Confusing, and Confounding Patterns Amal Mattu, MD, NE Professor and Vice Chair Department of Emergency Medicine University of Maryland School of Medicine amalmattu@comcast.net
ECG Cases and Questions. Ashish Sadhu, MD, FHRS, FACC Electrophysiology/Cardiology
 ECG Cases and Questions Ashish Sadhu, MD, FHRS, FACC Electrophysiology/Cardiology 32 yo female Life Insurance Physical 56 yo male with chest pain Terminology Injury ST elevation Ischemia T wave inversion
ECG Practice Strips Discussion part 1:
 ECG Practice Strips Discussion part 1: The first 20 strips are for teaching various abnormalities of the morphology of the waves of the ECG. Strips 21 and following are for teaching some abnormalities
The Electrocardiogram part II. Dr. Adelina Vlad, MD PhD
 The Electrocardiogram part II Dr. Adelina Vlad, MD PhD Basic Interpretation of the ECG 1) Evaluate calibration 2) Calculate rate 3) Determine rhythm 4) Determine QRS axis 5) Measure intervals 6) Analyze
ELECTROCARDIOGRAPH. General. Heart Rate. Starship Children s Health Clinical Guideline
 General Heart Rate QRS Axis T Wave Axis PR Interval according to Heart Rate & Age P Wave Duration and Amplitude QRS Duration according to Age QT Interval R & S voltages according to Lead & Age R/S ratio
Electrocardiography Abnormalities (Arrhythmias) 7. Faisal I. Mohammed, MD, PhD
 7. Faisal I. Mohammed, MD, PhD") Electrocardiography Abnormalities (Arrhythmias) 7 Faisal I. Mohammed, MD, PhD 1 Causes of Cardiac Arrythmias Abnormal rhythmicity of the pacemaker Shift of pacemaker from sinus node Blocks at different
Electrocardiography Abnormalities (Arrhythmias) 7 Faisal I. Mohammed, MD, PhD 1 Causes of Cardiac Arrythmias Abnormal rhythmicity of the pacemaker Shift of pacemaker from sinus node Blocks at different
- why the T wave is deflected upwards although it's a repolarization wave?
 Cardiac Electrograph: - why the T wave is deflected upwards although it's a repolarization wave? After depolarization the ventricle contracts but since the heart is a volume conductor (3D not 2D), when
ECG Interpretation Made Easy
 ECG Interpretation Made Easy Dr. A Tageldien Abdellah, MSc MD EBSC Lecturer of Cardiology- Hull University Hull York Medical School 2007-2008 ECG Interpretation Made Easy Synopsis Benefits Objectives Process
402 Index. B β-blockers, 4, 5 Bradyarrhythmias, 76 77
 Index A Acquired immunodeficiency syndrome (AIDS), 126, 163 Action potentials, 1, 5, 27 Acute coronary syndromes, 123t, 129 Adenosine, intravenous, 277 Alcohol abuse, as T wave inversion cause, 199 Aneurysm,
SIMPLY ECGs. Dr William Dooley
 SIMPLY ECGs Dr William Dooley Content Basic ECG interpretation pattern Some common (examined) abnormalities Presenting ECGs in context Setting up an ECG Setting up an ECG 1 V1-4 th Right intercostal space
Understanding the 12-lead ECG, part II
 Bundle-branch blocks Understanding the 12-lead ECG, part II Most common electrocardiogram (ECG) abnormality Appears as a wider than normal S complex Occurs when one of the two bundle branches can t conduct
Abnormalities Caused by Left Bundle Branch Block
 Marquette University e-publications@marquette Physician Assistant Studies Faculty Research and Publications Physician Assistant Studies, Department 12-17-2010 Abnormalities Caused by Left Bundle Branch
Electrocardiogram ECG. Hilal Al Saffar FRCP FACC College of medicine,baghdad University
 Electrocardiogram ECG Hilal Al Saffar FRCP FACC College of medicine,baghdad University Tuesday 29 October 2013 ECG introduction Wednesday 30 October 2013 Abnormal ECG ( ischemia, chamber hypertrophy, heart
General Introduction to ECG. Reading Assignment (p2-16 in PDF Outline )
") General Introduction to ECG Reading Assignment (p2-16 in PDF Outline ) Objectives 1. Practice the 5-step Method 2. Differential Diagnosis: R & L axis deviation 3. Differential Diagnosis: Poor R-wave progression
General Introduction to ECG Reading Assignment (p2-16 in PDF Outline ) Objectives 1. Practice the 5-step Method 2. Differential Diagnosis: R & L axis deviation 3. Differential Diagnosis: Poor R-wave progression
UNDERSTANDING YOUR ECG: A REVIEW
 UNDERSTANDING YOUR ECG: A REVIEW Health professionals use the electrocardiograph (ECG) rhythm strip to systematically analyse the cardiac rhythm. Before the systematic process of ECG analysis is described
ECG Interpretation. Best to have a system to methodically evaluate ECG (from Dubin) * Rate * Rhythm * Axis * Intervals * Hypertrophy * Infarction
 * Rate * Rhythm * Axis * Intervals * Hypertrophy * Infarction") ECG to save Babies ECG Interpretation Best to have a system to methodically evaluate ECG (from Dubin) * Rate * Rhythm * Axis * Intervals * Hypertrophy * Infarction Electrical Activity in the heart 5 events
ECG to save Babies ECG Interpretation Best to have a system to methodically evaluate ECG (from Dubin) * Rate * Rhythm * Axis * Intervals * Hypertrophy * Infarction Electrical Activity in the heart 5 events
EKG. Danil Hammoudi.MD
 EKG Danil Hammoudi.MD What is an EKG? The electrocardiogram (EKG) is a representation of the electrical events of the cardiac cycle. Each event has a distinctive waveform, the study of which can lead to
SIMPLY ECGs. Dr William Dooley
 SIMPLY ECGs Dr William Dooley 1 No anatomy just interpretation 2 Setting up an ECG 3 Setting up an ECG 1 V1-4 th Right intercostal space at sternal border 2 V2-4 th Left intercostal space at sternal border
Determining Axis and Axis Deviation on an ECG
 Marquette University e-publications@marquette Physician Assistant Studies Faculty Research and Publications Health Sciences, College of 7-15-2010 Determining Axis and Axis Deviation on an ECG Patrick Loftis
Relax and Learn at the FARM 2012: Session 8: 12 Lead ECG 401: ECG Variants
 Relax and Learn at the FARM 2012: Session 8: 12 Lead ECG 401: ECG Variants A Ship in the Harbor is Safe But that is not what ships are built for. Karen Marzlin DNP, RN, CCNS, CCRN-CMC, CHFN Cardiovascular
15 16 September Seminar W10O. ECG for General Practice
 15 16 September 2012 Seminar W10O ECG for General Practice Speaker: Ms Natasha Eaton ECG for General Practice Speaker: Natasha Eaton Cardiac CNC Executive Representative Electrocardiography The graphic
Return to Basics. ECG Rate and Rhythm. Management of the Hospitalized Patient September 25, 2009
 Management of the Hospitalized Patient September 25, 2009 ECG Refresher and Update 2009 Return to Basics Determine rate and rhythm Determine intervals and axes Define morphology of P-QRS-T-U Compare with
Other 12-Lead ECG Findings
 Other 12-Lead ECG Findings Left Atrial Enlargement Left atrial enlargement is illustrated by increased P wave duration in lead II, top ECG, and by the prominent negative P terminal force in lead V1, bottom
Electrocardiography. Hilal Al Saffar College of Medicine,Baghdad University
 Electrocardiography Hilal Al Saffar College of Medicine,Baghdad University Which of the following is True 1. PR interval, represent the time taken for the impulse to travel from SA node to AV nose. 2.
TELEMETRY BASICS FOR NURSING STUDENTS
 TELEMETRY BASICS FOR NURSING STUDENTS Accuracy of cardiac monitoring is an important component of patient safety in hospitalized patients who meet the criteria for dysrhythmia monitoring. (AACN, 2016,
Preface: Wang s Viewpoints
 AHA/ACCF/HRS Recommendations for the Standardization and Interpretation of the Electrocardiogram: Ischemia and Infarction 103.10.07 Presented by: WANG, TZONG LUEN, MD, PhD, JM, FACC, FESC, FCAPSC Professor,
Solutions for Every Day Problems Cardiologists and the ECG: Are We Really That Good at It? Part II Daniel José Piñeiro Profesor Titular de Medicina,
 Solutions for Every Day Problems Cardiologists and the ECG: Are We Really That Good at It? Part II Daniel José Piñeiro Profesor Titular de Medicina, Universidad de Buenos Aires, Argentina Member, Membership
5- The normal electrocardiogram (ECG)
") 5- The (ECG) Introduction Electrocardiography is a process of recording electrical activities of heart muscle at skin surface. The electrical current spreads into the tissues surrounding the heart, a small
5- The (ECG) Introduction Electrocardiography is a process of recording electrical activities of heart muscle at skin surface. The electrical current spreads into the tissues surrounding the heart, a small
Electrocardiography negative zero LA/VL RA/VR LL/VF recording electrode exploring electrode Wilson right arm right arm, left arm left arm
 Electrocardiography In the previous lecture, we were talking about the unipolar limb leads. We said that to make the unipolar lead, you have to make the negative electrode as zero electrode, this is done
2/7/ LEAD ECG CASE STUDIES Lisa Riggs MSN, RN, ACNS-BC, CCRN-K CASE #1 WHAT ELSE WOULD YOU ASSESS? WHAT S YOUR DIAGNOSIS?
 12 LEAD ECG CASE STUDIES Lisa Riggs MSN, RN, ACNS-BC, CCRN-K CASE #1 31 y/o male is a direct admit from the physician s office with c/o chest pain and SOA WHAT ELSE WOULD YOU ASSESS? WHAT S YOUR DIAGNOSIS?
Ablative Therapy for Ventricular Tachycardia
 Ablative Therapy for Ventricular Tachycardia Nitish Badhwar, MD, FACC, FHRS 2 nd Annual UC Davis Heart and Vascular Center Cardiovascular Nurse / Technologist Symposium May 5, 2012 Disclosures Research
BEDSIDE ECG INTERPRETATION
 BEDSIDE ECG INTERPRETATION Presented by: Ryan Dean, RN, MSN, CCRN, CCNS, CFRN Flight Nurse 2017 Based on presentations originally by Gennifer DePaoli, RN Objectives Hospital policies Electrical conduction