regulation by amino acids
|
|
|
- Roland Hines
- 5 years ago
- Views:
Transcription
1 Novel modes of mtorc1 regulation by amino acids The Harvard community has made this article openly available. Please share how this access benefits you. Your story matters Citation Buel, Gwen Novel modes of mtorc1 regulation by amino acids. Doctoral dissertation, Harvard University, Graduate School of Arts & Sciences. Citable link Terms of Use This article was downloaded from Harvard University s DASH repository, and is made available under the terms and conditions applicable to Other Posted Material, as set forth at nrs.harvard.edu/urn-3:hul.instrepos:dash.current.terms-ofuse#laa
2 Novel modes of mtorc1 regulation by amino acids A dissertation presented by Gwen Buel to The Division of Medical Sciences in partial fulfillment of the requirements for the degree of Doctor of Philosophy in the subject of Biological and Biomedical Sciences Harvard University Cambridge, Massachusetts August 2016
3 2016 Gwen Buel All rights reserved.
4 Dissertation Advisor: John Blenis Gwen Buel Novel modes of mtorc1 regulation by amino acids Abstract In order to maintain homeostasis, cells must be able to sense, interpret, and coordinate responses to environmental factors including energy status, amino acid availability, and the presence of growth factors. One important pathway that coordinates these signals and dictates the appropriate response is the mechanistic target of Rapamycin complex 1 (mtorc1) pathway. In conditions that favor growth, mtorc1 activates pathways involved in protein, lipid, and nucleotide synthesis, and inhibits breakdown of biomolecules through lysosomal degradative pathways. Mutations in the pathways that regulate mtorc1 lead to constitutively activated mtorc1, which contributes to disease states such as cancer. My thesis attempts to elucidate the pathways involved in coordinating amino acid availability with mtorc1 activity so we may better understand how healthy cells maintain homeostasis given a constantly changing environment, and how diseased cells with mutations in these pathways will respond to various treatments. My thesis will show that cells respond to withdrawal of individual amino acids in a manner very distinct from the response to a lack of all amino acids. Cells sense the removal of amino acids and downregulate mtorc1 activity. I discovered that withdrawal of the individual amino acids arginine or leucine allows for mtorc1 reactivation for a period of several hours. This reactivation occurs after a brief decrease in mtorc1 activity, and is not observed following withdrawal of total amino acids. I demonstrate that this response requires an upstream activator of mtorc1, Akt, and is not due to amino acids being regenerated via autophagy or other means. I also observe an increase in Akt activity during the time frame of mtorc1 recovery, suggesting that longer term amino acid deprivation stimulates mtorc1 activity through activation of Akt. My thesis iii
5 also describes a phenomenon in which proteins involved in mtorc1 regulation alter their location in response to amino acids, and I summarize my work to investigate the mechanism and functions of this movement. I discuss the implications of these findings, and propose alternate interpretations to the current models of mtorc1 activation downstream of amino acids. iv
6 Table of Contents List of Figures... vii Acknowledgements... ix Chapter 1 General introduction... 1 Discovery of mtor: The Mechanistic Target of Rapamycin... 2 mtor structure and function... 3 mtorc1 regulation overview... 7 mtorc1 regulation by amino acids... 9 The TSC complex: a point of integration of growth factor and amino acid pathways? Other mechanisms of mtorc1 regulation mtorc1 mediated feedback loops Processes regulated by mtorc Chapter 2 mtorc1 reactivation follows prolonged deprivation of leucine or arginine Introduction Results mtorc1 reactivation follows prolonged deprivation of leucine or arginine mtorc1 reactivation is observed in many, but not all cell types The mtorc1 reactivation is independent of regeneration of amino acids from autophagy/lysosomal degradation or the proteasome The mtorc1 recovery response requires PI3K/Akt activity Akt activity increases during the mtorc1 recovery response in some, but not all cell lines The mtorc1 recovery response is independent of mtorc The recovery response is partially mediated by the TSC complex The increase in Akt signaling upon prolonged leucine or arginine deprivation is transient Discussion Chapter 3 Rag movement from lysosomes following amino acid stimulation Introduction Results RagA moves away from the lysosome following amino acid stimulation in an mtorindependent fashion Rag localization is governed by GDP/GTP nucleotide binding The Rag proteins enter the nucleus following amino acid stimulation v
7 N terminal modification/lipidation results in dysfunctional RagA protein Discussion Chapter 4 Discussion and future directions General Discussion The mtorc1 recovery response Rag movement from lysosomes Chapter 5 Materials and methods Cell culture and transfections Amino acid deprivations and stimulations Antibodies and reagents Cell Lysis and western blotting Immunoprecipitations Microscopy Generation of Rag fusion proteins Generation of stable cell lines Metabolite extraction SUnSET Translation Assay Nuclei isolation for flow cytometry Appendix A Supplemental figures References vi
8 List of Figures Figure 1.1 The mtor complexes... 6 Figure 1.2 Regulation of mtorc Figure 1.3 mtorc1 regulation by amino acids Figure 1.4 mtorc1 mediated feedback loops Figure 2.1 mtorc1 reactivation follows prolonged deprivation of leucine or arginine Figure 2.2 mtorc1 recovery occurs in many but not all cell lines Figure 2.3 The mtorc1 recovery response is independent of canonical autophagy or proteasomal degradation of proteins Figure 2.4 The mtorc1 recovery response requires PI3K/Akt activity Figure 2.5 Prolonged arginine or leucine deprivation leads to increased PI3K/Akt signaling. 35 Figure 2.6 The mtorc1 recovery response is independent of mtorc Figure 2.7 mtorc1 reactivation is partially mediated through the TSC complex Figure 2.8 SGK1 plays a role in mtorc1 activation, and inhibition of both Akt and SGK1 robustly inhibits mtorc1 signaling and recovery response Figure 2.9 The increase in Akt signaling upon prolonged leucine or arginine deprivation is transient Figure 2.10 Loss of the Rag GTPases prevents mtorc1 responsiveness/recovery following arginine or leucine withdrawal Figure 3.1 RagA moves away from the lysosome following amino acid stimulation Figure 3.2 Rag movement away from the lysosome is independent of mtor activity Figure 3.3 Rag localization is governed by GTP/GDP binding Figure 3.4 RagA enters the nucleus following amino acid stimulation Figure 3.5 RagA entry into the nucleus does not appear to be necessary for mtorc1 activation Figure 3.6 N terminal modification/lipidation of RagA results in dysfunctional protein Figure 3.7 RagA forced localization with the Rheb CAAX motif inhibits activation of mtorc1 to its full extent, but partially rescues mtorc1 activity in amino acid starve conditions Figure A 1 Rapamycin induces a large nuclei phenotype under arginine deprivation conditions Figure A 2 Amino acid levels following arginine removal Figure A 3 Amino acid levels following leucine removal Figure A 4 mtorc1 recovery cannot be blocked through additional deprivation of glutamine vii
9 Figure A 5 Rags appear to be shifting from lysosomes to another endo membrane structure viii
10 Acknowledgements I would like to thank everyone who has been a source of support throughout my years in graduate school. In particular, I would like to thank my adviser, Dr. John Blenis, for providing me with valuable advice, space, and resources to conduct research in his lab. I would also like to thank the members of my Dissertation Advisory Committee, Dr. Brendan Manning, Dr. Nika Danial, and Dr. Victor Hsu, for all the advice and encouragement on my projects. Importantly, I want to recognize all the students and post docs from the Blenis lab with whom I have interacted, who have taught me most of the things I have learned in graduate school, and who have been a source of moral support on a daily basis. I am also indebted to the folks at the Nikon Imaging Center and the Image and Data Analysis Core at Harvard Medical School for helping to teach and advise on all the imaging data I have collected. I would also like to extend my thanks to the community at Weill Cornell who welcomed me as a visiting student when the Blenis lab made the jump to New York City. I want to recognize my mentor from my undergraduate studies, Dr. Bryan Ballif, for continuing to be a source of advice and moral support throughout my years in graduate school. I would like to thank my family, for never questioning my abilities or my progress, and for always being supportive despite having their own constant barrage of challenges. I would like to sincerely thank my classmates, particularly those who were supportive through challenging times and never lost faith in me as a person or a scientist, even when I lost faith in both. ix
11 Lastly, I would like to thank my partner in crime for being endlessly supportive and helping me to see the sunlight in every day. You inspire me to be a better person, and your optimism has helped guide me through countless challenges. To anyone who I have not mentioned explicitly but who has positively influenced me in any way during my time in graduate school, please know that I am deeply indebted to your kindness, thoughtfulness, and generosity. x
12 Chapter 1 General introduction
13 Introduction A central hallmark of all cells is the ability to sense their environment and adapt in order to survive in a constantly changing environment. For most organisms, part of this adaptation requires being able to quickly transition between anabolic and catabolic states depending on the availability of nutrients. This allows a cell to avoid death during periods of nutrient depletion by reducing consumption, as well as allowing a cell to proliferate by increasing consumption when nutrients are abundant and growth is beneficial to the organism. One of the main mechanisms by which many organisms mediate this transition relies on a kinase complex called mtorc1, or the mechanistic target of Rapamycin complex 1. mtorc1 is able to sense various aspects of the cellular environment, and accordingly adjust the metabolism of the cell to suit the environment and needs of the organism. My thesis investigates the mechanisms involved in regulation of mtorc1 by the environment, specifically by amino acid levels. Discovery of mtor: The Mechanistic Target of Rapamycin The 289 kda protein now known as mtor, or the mechanistic target of Rapamycin, was named after a natural product isolated in the 1970 s from a species of bacteria from the island of Rapa Nui (Vezina et al., 1975). The compound, which its discoverers named Rapamycin after the island of its discovery, was originally found to have little anti bacterial activity, but displayed strong inhibition of growth of the yeast Candida albicans through an unknown mechanism. Rapamycin, which was later found to additionally have an inhibitory effect on immune responses in rats (Martel et al., 1977), was shown through initial characterization to inhibit synthesis of nucleic acids, proteins, and lipids, while 2
14 promoting degradation of macromolecules (Singh et al., 1979). Genetic studies in saccharomyces cerevisiae were the first to identify the molecular targets responsible for the action of Rapamycin; it was found that Rapamycin forms a complex with a protein now known as FKBP12 (Koltin et al., 1991), and that the Rapamycin FKBP12 complex in yeast binds two homologues of a protein named TOR (target of Rapamycin) (Heitman et al., 1991). Mammalian cells were later discovered to possess only one ortholog of the TOR genes, which was initially named the mammalian target of Rapamycin (mtor) (Sabers et al., 1995), in addition to other names given by groups who also discovered the protein around the same time: RAFT1 (Sabatini et al., 1994), FRAP (Brown et al., 1994), SEP (Chen et al., 1994), and RAPT1 (Chiu et al., 1994). In recent years, attempts to streamline nomenclature have led to mtor having an alternative definition of mechanistic target of Rapamycin (Hall, 2013), although both terms have remained prevalent in the field. mtor structure and function Following the discovery of mtor, it was found that mtor has homology to phosphatidylinositol kinases, but it was ultimately shown that mtor is itself a protein kinase (Brown et al., 1995) with serine/threonine kinase activity (Brunn et al., 1997; Burnett et al., 1998). Subsequent work led to the discovery that mtor in cells forms a complex with a protein termed Raptor (regulatory associated protein of mtor) (Hara et al., 2002; Kim et al., 2002), and in a separate complex, mtor associates with rapamycin insensitive companion of mtor (Rictor) (Sarbassov et al., 2004). The Raptor containing mtor complex has ultimately become known as mtor complex 1 (mtorc1), and the Rictor containing mtor complex has become known as mtorc2 (Figure 1.1). Both mtorc1 and mtorc1 contain the 3
15 protein mlst8 (mammalian lethal with SEC13 protein 8), also known as GβL (Kim et al., 2003), but the two mtor complexes have distinct sets of substrates. The earliest identified substrates of mtorc1, the eif 4E binding proteins (4E BP1 and 4E BP2) and p70 S6 Kinase 1 (S6K1) (Brunn et al., 1997; Burnett et al., 1998), are regulators of protein translation, demonstrating a mechanism for the observed role of mtor in regulation of protein synthesis. In addition to its regulation of protein synthesis, mtorc1 has also been shown to promote synthesis of other biomolecules including lipids (Porstmann et al., 2008; Yecies et al., 2011) and nucleotides (Ben Sahra et al., 2013, 2016), and to inhibit cellular degradation of proteins and other material via autophagy (Ganley et al., 2009; Hosokawa et al., 2009; Jung et al., 2009). mtorc1 exerts these effects both through regulation of transcription of metabolic genes (Düvel et al., 2010), and through direct posttranslational phosphorylation of proteins (Ben Sahra et al., 2013; Brunn et al., 1997; Burnett et al., 1998). In contrast to mtorc1, mtorc2 has been studied less well extensively, but it has been shown that mtorc2 plays roles in cell survival and proliferation through regulation of protein kinase B (PKB, also referred to as Akt) (Sarbassov et al., 2005), and in cytoskeletal reorganization through regulation of protein kinase Cα (PKCα) (Jacinto et al., 2004; Loewith et al., 2002; Sarbassov et al., 2004). Although Rapamycin is not thought to bind to mtor while it is bound to Rictor, prolonged treatment with rapamycin has been shown to inhibit mtorc2 assembly, seemingly by binding to newly synthesized mtor before it can bind and complex with Rictor (Sarbassov et al., 2006). Additional proteins found in the mtorc2 complex but not mtorc1 include msin1 (mammalian stress activated MAP Kinase interacting protein 1) (Frias et al., 2006; Yang et al., 2006a) and PROTOR1/2 (protein observed with Rictor) (Pearce et al., 2007). PROTOR1/2 activates mtorc2 through incompletely understood mechanisms, 4
16 while msin1 contains a pleckstrin homology (PH) domain and recruits the complex to the cell membrane following activation of the PI3K pathway (Liu et al., 2015). The structural architecture of the mtorc1 complexes has been hard to elucidate due to the large size of mtor and the difficulty in crystalizing full length mtor bound to its complex components. However, advancements in the field of cryo electron microscopy have led to structures of the mtor complexes that have allowed for a better understanding of the overall construction of the mtor complexes. Both mtorc1 and mtorc2 form dimeric complexes, leading to complexes in the megadalton range (Wullschleger et al., 2005; Yip et al., 2010). The mtor dimer forms something that resembles a doughnut, with mlst8 perched by the active site, helping to form a cleft, with the mtor active site at the base of the cleft (Gaubitz et al., 2015; Yang et al., 2013; Yip et al., 2010). In mtorc1, Raptor binds mtor at the junctions of the two mtor subunits, seemingly stabilizing the dimer, and additionally making the active site cleft smaller (Aylett et al., 2015). Deletion of sections of mtor, allowing for a more open active site, increase the activity of mtor in vitro, supporting a model in which mtor specificity is dependent on restriction of substrates to the active site (Yang et al., 2013). In agreement with this model, a domain of Raptor is able to recruit substrates containing a TOR signaling (TOS) motif to the catalytic site of mtorc1, helping to overcome the physical restriction of the catalytic site (Aylett et al., 2015; Schalm and Blenis, 2002). Based on the structural data, it appears that the Rapamycin FKBP12 complex inhibits mtorc1 by binding to mtor and further blocking access to the active site (Yang et al., 2013). However, Rapamycin does not have equally strong inhibition towards all mtorc1 substrates, and why this is the case is not fully understood (Choo et al., 2008). The domain of 5
17 mtor that is bound by Rapamycin FKBP12 is thought to be blocked by Rictor, explaining the insensitivity of mtorc2 to Rapamycin (Gaubitz et al., 2015). Figure 1.1 The mtor complexes. Both mtorc1 and mtorc2 form dimers of mtor which contain mlst8. mtorc1 additionally contains Raptor, while mtorc2 contains Rictor and SIN1. Endogenous proteins that interact with the complexes and regulate the actions of mtor include PRAS40, DEPTOR, and PROTOR. PRAS40 inhibits mtorc1 but not mtorc2, PROTOR activates mtorc2 but not mtorc1, and DEPTOR inhibits both complexes. The Rapamycin FKBP12 complex inhibits mtorc1 following treatment with Rapamycin, while effects of rapamycin on mtorc2 are only observed following longer term treatment. Growth factors regulate both mtorc1 and mtorc2, while levels of oxygen, amino acids, and energy levels additionally regulate mtorc1. mtorc2 regulates cell survival and cytoskeletal reorganization. mtorc1 regulates cell growth processes including nucleotide biosynthesis, autophagy, protein synthesis, and lipid synthesis. 6
18 mtorc1 regulation overview mtorc1 is regulated by a number of environmental signals, namely growth factors, energy status, oxygen, and amino acids (Figure 1.2). The integration of these signals by mtorc1 is important for cellular functioning, given the prominent role the protein complex plays in regulation of the growth favoring processes described above. There is a large body of research showing that improper regulation of mtorc1 can cause cells to overconsume under conditions of limiting nutrients, leading to metabolic catastrophe and cellular death (Choo et al., 2010; Efeyan et al., 2013; Teleman et al., 2005). However, hyperactivation of mtorc1 is often seen in cancers, giving cancerous cells a growth advantage, allowing them to steal nutrients from the rest of the body in order to produce the nucleotides, lipids, and proteins necessary to fuel cell division (Cargnello et al., 2015). Thus, intricate regulation of mtorc1 in accordance with the cellular environment and the growth requirements of the organism is essential for cellular functioning and organismal survival. Central to the regulation of mtorc1 is the tuberous sclerosis complex (TSC) complex, which is a protein complex named after a disease of the same name (Henske et al., 2016). The TSC complex consists of TSC1 (also called hamartin), TSC2 (also called tuberin), and TBC1D7 (Dibble et al., 2012), which together act as a GTPase activating protein (GAP) for the small GTPase Rheb (Ras homolog enriched in brain) (Inoki et al., 2003a; Tee et al., 2003). Rheb binds to mtor, and while in the GTP bound form, Rheb activates the kinase activity of mtorc1 (Long et al., 2005) but not mtorc2 (Yang et al., 2006b). Since the TSC2 complex stimulates Rheb to hydrolyze GTP to GDP, the TSC complex acts as a negative regulator of mtorc1. However, the TSC complex can be inactivated by phosphorylation of several residues catalyzed by Akt (Inoki et al., 2002; Manning et al., 2002; Potter et al., 2002). As a 7
19 part of the Phosphoinositide 3 Kinase (PI3K)/Akt pathway, Akt is regulated downstream of growth factor stimulation (Burgering and Coffer, 1995; Franke et al., 1995), and in this way, growth factors such as Insulin and Insulin like growth factor 1 (IGF 1) can stimulate mtorc1 activity through inactivation of the TSC complex. Additional data suggests that serum and glucocorticoid induced protein kinase (SGK1), a kinase highly related to Akt and also regulated by growth factor stimulation, can also phosphorylate TSC2 on the sites phosphorylated by Akt (Castel et al., 2016). In addition to Akt and SGK1, growth factor stimulated pathways result in activation of extracellular regulated kinases 1 and 2 (ERK1/2) and ribosomal S6 Kinase (RSK), which are also able to phosphorylate and inhibit the TSC complex (Ma et al., 2005; Roux et al., 2004). In addition to being regulated by growth factors, the TSC complex can also be regulated by energy status. In response to low energy, exhibited by low ATP to ADP ratio, AMP kinase (AMPK) becomes activated, and phosphorylates TSC2 at T1227 (Inoki et al., 2003b). In contrast to the phosphorylation of TSC2 by Akt, the phosphorylation site modified by AMPK promotes the activity of the TSC complex, thereby decreasing activation of mtorc1. In addition to the input AMPK gives to mtorc1 through the TSC complex, low energy also leads to AMPK phosphorylation of Raptor, which also leads to inhibition of mtorc1 (Gwinn et al., 2008). Oxygen is an essential nutrient necessary for much of cellular metabolism, and as such, cells have also evolved mechanisms to signal the availability of oxygen to mtorc1 (Arsham et al., 2003). Under conditions of modest, short term hypoxia, AMPK is activated and can inhibit mtorc1 through its effects on the TSC complex (Liu et al., 2006). Additionally, low oxygen levels can activate the hypoxia inducible factor family of transcription factors (HIFs). 8

20 One HIF 1 target gene, REDD1 (Shoshani et al., 2002), can inhibit mtorc1 through activation of the TSC complex (Brugarolas et al., 2004; Deyoung et al., 2008; Sofer et al., 2005). Figure 1.2 Regulation of mtorc1. mtorc1 is regulated by growth factors, amino acids, energy status, and hypoxia. Upon binding of growth factors to growth factor receptors like the insulin receptor, the PI3K and MAPK pathways become activated. This leads to phosphorylation of TSC2 by Akt, Erk, RSK, and SGK at sites that inhibit the ability of the TSC complex to act as a GAP for Rheb. Low energy leads to activation of AMPK, which also phosphorylates TSC2, but at a site that activates the ability of the complex to act as a GAP for Rheb. Acute hypoxia also activates AMPK, and it also leads to transcription of REDD1, which activates the TSC complex. Lastly, amino acids lead to mtorc1 activation through the Rag GTPases. mtorc1 regulation by amino acids In contrast to the mechanisms of regulation described above, the mechanisms of mtorc1 regulation by amino acids are largely independent of the TSC complex. Although 9
21 it had been clear by the 1990 s that amino acids are necessary for mtorc1 activation (Blommaart et al., 1995; Hara et al., 1998; Luiken et al., 1994), the mechanisms of this regulation remained elusive for the next decade. A breakthrough in the field came when it was discovered that amino acids allow for recruitment of mtorc1 to the surface of lysosomes (Kim et al., 2008; Sancak et al., 2008). It was found that this recruitment is mediated by a family of GTPases called the Rag GTPases, which themselves localize to the lysosome due to interactions with a pentameric complex called Ragulator (Sancak et al., 2010). In mammals there are four members of the Rag GTPase family: RagA, RagB, RagC, and RagD. RagA and RagB are orthologs of the yeast protein Gtr1, while RagC and RagD are orthologs of the yeast protein Gtr2 (Bun Ya et al., 1992; Hirose et al., 1998; Schürmann et al., 1995; Sekiguchi et al., 2001). The Rag proteins form obligate heterodimers of one Gtr1 like protein (RagA or B) and one Gtr2 like protein (RagC or D) (Nakashima et al., 1999; Sekiguchi et al., 2001). The fact that the Rag proteins form dimers is unusual, given that most GTPases are monomeric. Additionally, the Rag proteins are also unique in that they are not lipidated to allow for their localization to membranes. Instead, for their localization to lysosomal membranes, the Rags require the Ragulator complex, which also serves as a guanine nucleotide exchange factor (GEF) for RagA and RagB (Bar Peled et al., 2012). As with all GTPases, the Rags cycle between GTP bound and GDP bound states. The switch from GDP to GTP is mediated by GEFs, which stimulate release of GDP and allow for GTP, which is found in much higher concentrations in the cell, to take the place of GDP. The switch from GTP to GDP, however, is mediated by the intrinsic enzymatic activity of the GTPase, which is stimulated by GTPase activating proteins (GAPs). In many cases, the GTPbound form of a GTPase is considered the active form, while the GDP bound form is the inactive form, but this is not always the case. In the case of the Rag proteins, GTP bound 10
22 RagA/B is active in its ability to stimulate mtorc1 activity, while the GDP bound form of RagC/D is active in its ability to stimulate mtorc1 activity (Sancak et al., 2008). The relative contributions to mtorc1 activation by the Rag dimer components is a bit unclear, although there is data to suggest that the nucleotide binding state of RagC/D is more important for mtorc1 binding (and recruitment of mtorc1 to lysosomes) than that of RagA/B (Tsun et al., 2013). However, expression of a dominant active form of RagA/B (constitutively bound to GTP) has been shown to make the mtorc1 pathway completely insensitive to amino acid deprivation (Efeyan et al., 2013; Kim et al., 2008; Sancak et al., 2008), suggesting that RagA/B may regulate an important but less well understood process involved in mtorc1 regulation. Additionally, it is not yet understood why mammals contain four Rag proteins, while yeast only contain the two Gtr proteins; it is likely that there are tissue specific enrichments for RagA versus RagB, and RagC versus RagD, but this has yet to be studied in detail. As mentioned above, the Ragulator complex serves as a GEF for RagA/B. The Ragulator complex was originally identified to have three components: p18 (LAMTOR1), p14 (LAMTOR2), and MP1 (LAMTOR3) (Sancak et al., 2010). However, two more components of the Ragulator complex were later identified, C7orf59 (LAMTOR4) and HBXIP (LAMTOR5), which were found to be essential for the GEF function of the complex (Bar Peled et al., 2012). Following the discovery of the Ragulator as a RagA/B GEF, it was discovered that a trimeric complex now termed GATOR1 (GAP activity toward Rags 1) consisting of the proteins DEPDC5, Nprl2, and Nprl3, functions as a GAP for RagA/B (Bar Peled et al., 2013). In this regard, the Ragulator complex positively regulates mtorc1 through RagA/B, and the GATOR1 complex negatively regulates mtorc1 through RagA/B. The RagC/D portion of the dimer, however, is not affected by the known GEF/GAP proteins that regulate RagA/B. Rather, 11
23 it has been shown that the GAP for RagC/D is Folliculin in complex with its binding partners FNIP1/2 (FLCN FNIP) (Petit et al., 2013; Tsun et al., 2013), and a GEF for RagC/D has yet to be identified. The discovery of the GEFs and GAPs involved in the regulation of the Rags was illuminating, but it still did not explain how amino acids are being sensed by the cell, and how this sensing is then regulating the actions of the GEFs and GAPs. There is a body of work suggesting that the amino acid content within the lysosome is important in the regulation of the Rags by amino acids; specifically, the lysosomal amino acid transporter SLC38A9 can sense intralysosomal arginine levels, and together with the lysosomal v ATPase, is able to promote the Ragulator GEF activity towards RagA/B in amino acid replete conditions (Wang et al., 2015; Zoncu et al., 2011). In contrast to the lysosmal amino acid sensing pathway that has been proposed, additional proteins involved in sensing cytosolic amino acids have also been uncovered. Specifically, the Sestrin family of proteins have been found to bind directly to leucine (Saxton et al., 2016a; Wolfson et al., 2016), and the CASTOR (cellular arginine sensor for mtor) proteins have been found to bind directly to arginine (Chantranupong et al., 2016; Saxton et al., 2016b). Both the Sestrins and the CASTOR proteins exert their actions on a complex called GATOR2, which is a negative regulator of GATOR1 (Bar Peled et al., 2013). In the absence of leucine or arginine, respectively, Sestrins and CASTOR proteins bind to GATOR2, preventing it from inhibiting the GAP activity of GATOR1. In the presence of amino acids, however, binding of Sestrins and CASTOR to their respective amino acids prevents them from binding GATOR2 (Chantranupong et al., 2016; Wolfson et al., 2016). This allows GATOR2 to inhibit GATOR1, allowing for increased levels of GTP bound RagA/B and therefore increased mtorc1 recruitment and activation (Figure 1.3). 12

24 Figure 1.3 mtorc1 regulation by amino acids. mtorc1 is recruited to the lysosomal membrane by the Rag GTPases which localize to the lysosome via interactions with the Ragulator complex. RagA/B are positively regulated by the Ragulator complex, which serves as a GEF for RagA/B. GATOR1 acts as a GAP for RagA/B, negatively regulating the ability of RagA/B to activate mtorc1. GATOR1 is negatively regulated by GATOR2, which is negatively regulated by CASTOR1/2 and Sestrin1/2/3. Upon leucine binding to Sestrin1/2/3 or arginine binding to Castor1/2, the interactions between these proteins and GATOR2 are disrupted, leading to inhibition of GATOR1 and activation of RAGA/B. Folliculin serves as a GAP for RagC/D, positively regulating the ability of RagC/D to recruit mtorc1 to the lysosome. Once mtorc1 is at the lysosome, Rheb is able to activate mtorc1 through direct contacts. The TSC complex is a GAP for Rheb, and localization of the TSC complex to the lysosome is regulated by a host of factors including amino acids and growth factors, and potentially other stresses as well. The TSC complex: a point of integration of growth factor and amino acid pathways? To summarize the methods of regulation described above, it may be easiest to classify the factors that regulate mtorc1 into two classes: those that directly regulate the activity of mtorc1 through the TSC complex/rheb, and those that regulate the activity of mtorc1 indirectly by affecting its intracellular location/proximity to Rheb. In this 13
25 classification, growth factors, oxygen, and energy status would be in the first class, and amino acids would be in the second class. However, studies looking at the localization of the TSC complex have blurred the lines of these initially distinct classifications. It has been established that the TSC complex can be recruited to lysosomal membranes in order to inhibit Rheb, but some data shows that growth factor stimulated Akt phosphorylation of the TSC complex is needed to inhibit this recruitment (Menon et al., 2014), while other data demonstrate that amino acid deprivation allows for TSC complex recruitment (Demetriades et al., 2014). Newer data has suggested that both growth factor and amino acid inputs regulate the localization of the TSC complex, and additionally, other cellular stresses such as hypoxia, osmostress, energetic stress, and ph stress may be able to regulate this process as well (Demetriades et al., 2016). These data suggest that mtorc1 localization via the Rags is only one way by which amino acids can regulate mtorc1 activity, and that TSC complex localization may also play an important role in amino acid regulation of mtorc1. Since multiple factors seem to be able to regulate the localization of the TSC complex, it seems that the TSC complex may serve as a point of intersection of regulatory factors. Other mechanisms of mtorc1 regulation Other mechanisms of regulation of mtorc1 activity involve the proteins PRAS40 (proline rich Akt substrate 40 kda), DEPTOR (DEP domain containing mtor interacting protein), and PA (phosphatidic acid). PRAS40 is a Raptor interacting protein that potently inhibits mtorc1 kinase activity in vitro by blocking substrate binding. Phosphorylation of PRAS40 by Akt causes dissociation of PRAS40 from mtorc1, thus promoting mtorc1 activity (Vander Haar et al., 2007; Sancak et al., 2007; Thedieck et al., 2007; Wang et al., 2007). PRAS40 can also be phosphorylated by mtorc1 itself, which would 14
26 further promote mtorc1 activation once it is activated via other mechanisms (Oshiro et al., 2007). DEPTOR is an mtor interacting protein that also has inhibitory effects towards both mtorc1 and mtorc2 (Peterson et al., 2009). DEPTOR is regulated by its expression levels, with its proteasomal degradation being promoted through ubiquitination by the ubiquitin ligase SCF βtrcp. Phosphorylation of DEPTOR by mtor, CK1α, RSK1, S6K1, allow for its degron sequence to be recognized by SCF βtrcp, ultimately leading to its degradation and release of inhibition of mtor (Duan et al., 2011; Gao et al., 2011; Zhao et al., 2011). PA activates mtorc1 through mechanisms that have not been well defined (Fang et al., 2001). PA is a lipid second messenger that can be incorporated into cellular membranes from exogenous sources, or can be synthesized from lysophosphatidic acid (LPA), diacylglycerol (DG), or phosphatidylcholine (PC), though it seems that the route of synthesis most relevant is from PC through the enzyme phospholipase D (PLD). It has been proposed that PA acts through stabilization of the mtor complex (Toschi et al., 2009), however, more recent data suggests that PA acts by displacing DEPTOR from mtorc1 in a manner more acute than the methods of DEPTOR degradation described above (Yoon et al., 2015). mtorc1 mediated feedback loops Feedback loops have evolved in countless biological pathways to effectively regulate processes. While positive feedback loops produce unstable systems, negative feedback loops produce stable systems that resist change. In the context of mtorc1 activation, unchecked activation could potentially lead to overconsumption. Perhaps as a mechanism to avoid this situation, cells have evolved several negative feedback loops that become activated following mtorc1 activation. The key proteins involved in these feedback 15

27 Figure 1.4 mtorc1 mediated feedback loops. Active mtorc1 phosphorylates and activates target proteins, including S6K1 and Grb10. Phosphorylation of Grb10 by mtorc1 leads to stabilization of Grb10, which acts to inhibit signaling downstream of the insulin receptor. S6K1 phosphorylation of IRS1 leads to proteasomal degradation of IRS1, also leading to downregulation of growth factor signaling. S6K1 also phosphorylates Rictor, leading to inhibition of the ability of mtorc2 to phosphorylate and activate Akt. mtorc1 activation also leads to upregulation and secretion of IGFBP5, which is thought to sequester IGF1. All of these mechanisms lead to feedback inhibition of mtorc1. loops are insulin receptor substrate 1 (IRS1), growth factor receptor bound protein 10 (Grb10), Rictor, and IGF binding protein 5 (IGFBP5) (Figure 1.4). IRS1 binds to the intracellular portions of activated insulin receptors and IGF 1 receptors, and is tyrosine phosphorylated at multiple residues by these receptors, creating binding sites for proteins such as p85 regulatory 16
28 subunit of phosphatidylinositol 3 Kinase (PI3K). This allows for downstream activation of Akt, which then leads to mtorc1 activation, as described above. mtorc1 has been shown to regulate phosphorylation of IRS1 via S6K, and phosphorylation of these sites promote degradation if IRS1 (Haruta et al., 2000; Um et al., 2004). It has also been proposed that S6K1 suppresses IRS1 at the mrna level (Harrington et al., 2004). Grb10 is another insulin receptor associated protein, although its actions toward the insulin receptor are inhibitory. It has been shown that mtorc1 directly phosphorylates Grb10 and stabilizes the protein, thus leading to decreased insulin receptor signaling upon mtorc1 activation (Hsu et al., 2011; Yu et al., 2011). A key step in the activation of Akt is phosphorylation of Akt by mtorc2. It was found that S6K1 can phosphorylate Rictor and that this phosphorylation inhibits the ability of mtorc2 to phosphorylate and activate Akt (Dibble et al., 2009). In addition to these mechanisms of feedback downstream of receptor activation, another mechanism of mtorc1 mediated negative feedback is through the secreted protein IGFBP5. mtorc1 promotes expression of IGFBP5, which is secreted and is thought to sequester IGF1, blocking signaling through IGFR while mtorc1 is active (Ding et al., 2016). Processes regulated by mtorc1 The best characterized cellular process regulated by mtorc1 is protein synthesis. As mentioned above, mtorc1 directly phosphorylates S6K and 4E BP1, which both help mediate the effects of mtorc1 on protein translation. 4E BP1 is an inhibitor of the translation initiation factor eif4e, binding it and preventing binding of the scaffold protein eif4g. Phosphorylation of 4E BP1 by mtorc1 prevents binding of 4E BP to eif4e, allowing 17
29 recruitment of eif4g and eif4a to the 5 end of mrna (Brunn et al., 1997). This allows for subsequent recruitment of the initiating Met trna and additional factors comprising the 48S pre initiation complex, allowing for ribosome scanning and translation initiation (reviewed in Ma and Blenis, 2009). mtorc1 can phosphorylate both S6K1 and S6K2 (Burnett et al., 1998), though S6K1 has been studied more extensively than S6K2. mtorc1 phosphorylates S6K at T389 in the hydrophobic motif, and allows for docking of PDK1 (phosphoinositide dependent kinase 1), which phosphorylates S6K at T229 in the catalytic domain of S6K (for review, see Pearce et al., 2010). One of the main mechanisms by which mtorc1 and S6K promote translation is through increased biogenesis of ribosomes. One model proposed this to be mediated by S6K1 phosphorylation of ribosomal protein S6 (RPS6), which promotes translation of mrnas with an oligopyrimidine tract at their transcriptional start site, termed a 5 TOP. mrnas encoding ribosomal proteins have been shown to contain 5 TOPs, and thus mtorc1/s6k activation was proposed to promote expression of ribosomal proteins through this mechanism (Jefferies et al., 1997). However, later work showed that the translation of 5 TOP mrnas is independent of S6K and RPS6 (Tang et al., 2001), bringing into question how mtorc1 promotes translation of ribosomal proteins. mtorc1 also promotes ribosomal biogenesis through increased synthesis of ribosomal RNA (rrna) and transfer (trna). mtorc1 achieves this through activation of the transcription factor tripartite motif containing protein 24 (TIF 1A), which promotes transcription of rrna via RNA Pol I (Mayer et al., 2004). mtorc1 also phosphorylates and inhibits Maf 1, which is a repressor of RNA Pol III, and this leads to mtorc1 promotion of transcription of trna and 5S rrna (Kantidakis et al., 2010; Shor et al., 2010). In addition to mtorc1 regulated ribosome biogenesis, S6K can also promote translation directly through interactions with a number of translation initiation factors. S6K 18
30 and mtorc1 both associate with eif3, which acts as a scaffold to allow for efficient regulation of the translation machinery in response to stimuli (Holz et al., 2005). For example, S6K1 can phosphorylate eif4b at S422, which allows for eif4b to promote the helicase activity of eif4a and for recruitment of the translation pre initiation complex (Raught et al., 2004). S6K1 can also phosphorylate PDCD4 (programmed cell death 4) at S67, causing it to be recognized by the ubiquitin ligase β TrCP and ultimately be degraded by the proteasome (Dorrello et al., 2006). PDCD4 binds eif4a, preventing it from being recruited by eif4g to the translation initiation complex, so S6K1 mediated degradation of PDCD4 is another mechanism to allow for activation of translation by eif4a. Lastly, S6K has also been shown to promote efficient translation of spliced mrnas in the pioneer round of translation in a SKAR (S6K1 Aly/REF like substrate) dependent manner (Ma et al., 2008). In addition to regulation of protein synthesis, mtorc1 plays a role in regulation of lipid synthesis. mtorc1 achieves this goal primarily though regulation of the sterol regulatory element binding protein 1/2 (SREBP1/2) transcription factors (Düvel et al., 2010; Li et al., 2010; Porstmann et al., 2008; Wang et al., 2011). While inactive SREBP1/2 localize to the endoplasmic reticulum (ER), insulin stimulation or sterol depletion leads to transport of SREPB1/2 to the Golgi in COPII dependent vesicles, where it is proteolytically processed, allowing an active form of SREBP1/2 to enter the nucleus and promote expression of genes involved in fatty acid and cholesterol synthesis. The mechanisms by which mtorc1 regulate SREBP1/2 have been somewhat difficult to elucidate but it appears that it is at least partially dependent on S6K1 (Düvel et al., 2010; Li et al., 2011; Wang et al., 2011). mtorc1 can also directly phosphorylate lipin 1, a phosphatidic acid phosphatase which inhibits SREBP1/2 nuclear localization and transcriptional activity. Phosphorylation of lipin 1 by mtorc1 prevents lipin 1 from localizing to the nucleus and inhibiting SREBP1/2, and this serves as a 19
31 mechanism by which mtorc1 can promote SREBP1/2 function (Huffman et al., 2002; Peterson et al., 2011). Another mechanism by which mtorc1 can regulate SREBP1 is through CREB regulated transcription coactivator 2 (CRTC2). CRTC2 interferes with a component of the COPII complex, thus inhibiting transport of SREBP1 to the Golgi for processing to its active form. mtorc1 phosphorylates CRTC2 and inhibits it from acting on the COPII complex, allowing SREBP1 processing to proceed (Han et al., 2015). Another branch of mtorc1 regulation is that of nucleotide biosynthesis. It has been shown that mtorc1 positively regulates the synthesis of pyrimidines through S6K1 mediated phosphorylation of CAD (carbamoyl phosphate synthetase 2, aspartate transcarbamoylase, dihydroorotase) at S1859. CAD is the enzyme that catalyzes the first three steps of de novo pyrimidine synthesis, and phosphorylation at S1859 allows for increased flux through the pyrimidine synthetic pathway (Ben Sahra et al., 2013; Robitaille et al., 2013). Additionally, mtorc1 can promote the synthesis of purines through upregulation of the enzyme methylenetetrahydrofolate dehydrogenase 2 (MTHFD2). mtorc1 was shown to upregulate many enzymes necessary for purine synthesis, but in particular, mtorc1 promoted the stability and transcriptional activity of ATF4 toward its target gene MTHFD2 (Ben Sahra et al., 2016). MTHFD2 is an enzyme in the mitochondrial tetrahydrofolate cycle, and is essential for forming a pool of formate for use in purine biosynthesis. In combination with its promotion of protein translation, lipid synthesis, and nucleotide synthesis, mtorc1 promotes consumption of glucose in order to produce the adenosine triphosphate (ATP) required for the energy to drive these processes, and to produce the carbon necessary for synthesis of biomolecules. The main mechanism by which mtorc1 promotes this metabolic shift is through transcriptional and translational upregulation of the transcription factor hypoxia inducible factor 1α (HIF1α), which promotes 20
32 transcription of many glycolytic genes (Brugarolas et al., 2004; Düvel et al., 2010; Hudson et al., 2002; Laughner et al., 2001). In addition to promoting consumption and synthesis of biomolecules, mtorc1 also inhibits autophagic recycling of cellular proteins and organelles. Autophagy is necessary for clearing out damaged organelles, but is also induced in response to nutrient starvation as an adaptation response. Following nutrient depletion or mtorc1 inhibition, autophagosomes engulf cellular material, and fuse with lysosomes to allow for degradation and recycling of cellular building blocks. The main mechanism mtorc1 employs to mediate this inhibition is through direct phosphorylation of ULK1/Atg13/FIP200 (unc 51 like kinase 1/mammalian autophagy related gene 13/focal adhesion kinase family interacting protein of 200 kda), which is a kinase complex involved in the initiation of autophagy (Ganley et al., 2009; Hosokawa et al., 2009; Jung et al., 2009). In addition to the ULK complex, mtorc1 has also been shown to regulate death associated protein 1 (DAP1), which is a suppressor of autophagy (Koren et al., 2010). An additional study has identified WIPI2, an ortholog of a yeast protein involved in early autophagosome formation, as a potential mtorc1 effector, suggesting mtorc1 can inhibit autophagy through multiple mechanisms (Hsu et al., 2011). Another mechanism mtorc1 employs to inhibit degradation of cellular material is through negative regulation of lysosomal biogenesis. mtorc1 mediated phosphorylation of the transcription factor EB (TFEB) leads to its exclusion from the nucleus; inhibition of mtorc1 through nutrient starvation or other means leads to accumulation of TFEB in the nucleus and transcription of genes involved in lysosomal function (Peña Llopis et al., 2011; Settembre et al., 2011, 2012; Yu et al., 2010). In addition to autophagy, another cellular machinery involved in cellular degradation is the ubiquitin proteasome pathway. Two groups have published data to 21
33 suggest that mtorc1 inhibits breakdown of proteins through proteasomal degradation (Rousseau and Bertolotti, 2016; Zhao et al., 2015), however, a third group published data to suggest that mtorc1 can promote the expression of genes coding for proteasomal subunits, enhancing the capacity for protein degradation through the proteasome pathway (Zhang et al., 2014). The model put forth by the Bertolotti group proposes mtorc1 as an inhibitor of Erk5, which promotes upregulation of proteasome subunits and regulatory particle assembly chaperone proteins (RACs) (Rousseau and Bertolotti, 2016). The group supporting a model of mtorc1 enhancing proteasome expression shows this upregulation to be dependent on the transcription factor nuclear factor erythroid derived 2 related factor 1 (NRF1), which seems to be regulated by mtorc1 through SREBP1 (Zhang et al., 2014). The inconsistencies between the models may be due to differences in the extent of mtorc1 perturbation. In conditions of acute mtorc1 inhibition, as was studied by Rousseau and Bertolotti, and Zhao et al., upregulation of proteasomal degradation would increase pools of free amino acids, allowing for translation of proteins necessary for survival, and for reactivation of mtorc1 under times of nutrient or energy stress. In contrast, in situations of prolonged mtorc1 activation, as in the cells studied by Zhang et al., mtorc1 driven upregulation of proteasomes may serve to increase the pool of cellular free amino acids to allow for the increased translation also promoted by mtorc1. It may also help the cell deal with increased levels of misfolded and/or damaged proteins that may result from increased levels of protein synthesis. 22
34 Chapter 2 mtorc1 reactivation follows prolonged deprivation of leucine or arginine
35 Introduction Growth and function of mammalian cells depends largely on the availability of nutrients in the cellular environment. In order to appropriately function in the face of a changing nutritional environment, cells depend on the mechanistic target of rapamycin (mtor) complex 1 (mtorc1), a highly evolutionary conserved threonine/serine kinase that promotes growth favoring processes such as protein translation, lipid synthesis, and nucleotide biosynthesis under conditions of nutrient sufficiency (Laplante and Sabatini, 2012). Among the upstream cues that regulate mtorc1 activity, growth factors and amino acids have long been known to be crucial for mtorc1 activity (for review, see Kim et al., 2013b). Growth factor stimulation leads to activation of Phosphatidylinositol 4 5 bisphosphate 3 kinase (PI3K)/Akt signaling, which inactivates the Tuberous Sclerosis Complex (TSC) complex through its component TSC2, leading to activation of the small GTPase Rheb, a key regulator of mtorc1 (Long et al., 2005; Manning et al., 2002; Tee et al., 2003). On the contrary, amino acids have been shown to be communicated through a TSC2/Rheb independent mechanism, instead depending on the family of Rag small GTPases, which exists as heterodimers of RagA or RagB, and RagC or RagD (Nakashima et al., 1999; Sekiguchi et al., 2001). When the Rag GTPases are active, they recruit mtor in close proximity to Rheb at the lysosome, which leads to mtorc1 activation when growth factors are present (Sancak et al., 2008, 2010). Among the 20 proteinogenic amino acids, arginine and leucine are known to be key regulators of mtorc1 activity, as deprivation of these amino acids lead to rapid inhibition of Rag GTPases and mtorc1 activity (Hara et al., 1998). Recently, it was shown that cytosolic leucine and arginine are communicated to the Rag GTPases by the Sestrin and Castor proteins, respectively, through the Gator1 and Gator2 complexes (Chantranupong et al., 2016; Peng et al., 2014; Saxton et al., 2016a, 2016b; Wolfson et al., 2016). 24
36 The majority of studies to date studying amino acid regulation of mtorc1 have focused on short term mtorc1 regulation and thus, the effects of prolonged deprivation remain poorly characterized. Several studies have observed what appears to be a reactivation of mtorc1 activity upon prolonged deprivation of individual amino acids, but the molecular details and extent of this reactivation remains poorly understood (Chen et al., 2014; Iiboshi et al., 1999; Ye et al., 2015; Yu et al., 2010). Some reports have suggested that this mtorc1 reactivation is due to regeneration of free amino acids through autophagy, but often these studies have looked at glutamine starvation in combination with serum starvation (Chen et al., 2014; Yu et al., 2010), which would more strongly induce autophagy due to numerous growth factor regulated signaling pathways that regulate autophagy (He and Kilonsky, 2009). The complexity in regulation may explain why other studies have shown that deprivation of individual amino acids is not a strong enough stimulus to induce autophagy in certain contexts (Sheen et al., 2011). In this study, I address how prolonged arginine or leucine deprivation affects mtorc1 activity. I demonstrate that short term leucine or arginine deprivation leads to rapid inactivation of mtorc1 activity, but that prolonged starvation leads to mtorc1 reactivation, reaching activation levels similar to those observed during amino acid sufficient conditions. I find that this reactivation is independent of regeneration of amino acids by autophagy, the lysosome, or the proteasome. Instead, the reactivation is accompanied by increased activation of PI3K Akt signaling, which is necessary for the reactivation of mtorc1 activity to occur. Our results suggest crosstalk between different arms of mtorc1 regulation, allowing for increased signaling through one arm when input is decreased through another. Given the interest in specific targeting of mtorc1 in diseases such as cancer, compensatory signaling mechanisms such as these have important therapeutic implications. 25
37 Results mtorc1 reactivation follows prolonged deprivation of leucine or arginine. mtorc1 activity is known to be tightly regulated by the cellular availability of leucine and arginine (Hara et al., 1998), but how prolonged deprivation of these amino acids affects mtorc1 activity remains poorly characterized. In some studies investigating mtorc1 activity upon prolonged leucine starvation, it has been observed that mtorc1 becomes reactivated, but the extent of this reactivation, as well as the molecular mechanism for this recovery response, are still poorly characterized (Chen et al., 2014; Iiboshi et al., 1999; Yu et al., 2010). To address this further, I first deprived mouse embryonic fibroblasts (MEFs) of leucine or arginine for 45 minutes, and assessed mtorc1 activity by looking at phosphorylation of the mtorc1 substrates S6K1, 4E BP1, ULK1, and Grb10. In agreement with previous studies (Hara et al., 1998), mtorc1 activity rapidly decreased in cells that had been short term deprived of arginine or leucine as no phosphorylation of mtorc1 downstream targets could be observed after 45 minutes (Figure 2.1A). However, upon longer times of deprivation of leucine or arginine, mtorc1 was found to be reactivated, reaching activation levels similar to those observed under amino acid sufficient conditions after minutes of deprivation. Interestingly, reactivated mtorc1 levels remained comparable to levels found during amino acid sufficient conditions for as long as 12 hours after leucine or arginine deprivation, whereas after 24 hours of starvation, no mtorc1 activity could be detected (Figure 2.1B). The kinetics of mtorc1 reactivation were nearly identical between the arginine and leucine deprivation conditions (Figure 2.1B), but removal of all 20 proteinogenic amino acids from the growth media did not allow for a recovery response similar to that observed for arginine or leucine deprivation (Figure 2.1C). 26
 MEFs were deprived of either all amino acids (A,C), both arginine and leucine (A) or arginine or leucine alone")
38 Figure 2.1 mtorc1 reactivation follows prolonged deprivation of leucine or arginine. (A C) MEFs were deprived of either all amino acids (A,C), both arginine and leucine (A) or arginine or leucine alone (B C) for the indicated times. 27
 as did 293A cells (Figure 2.10).")
39 mtorc1 reactivation is observed in many, but not all cell types We further explored the extent of this reactivation by looking at the reactivation response in other cell lines. I found that the osteosarcoma cell line, U2OS, displayed clear reactivation similar to that observed in the MEFs (Figure 2.2A) as did 293A cells (Figure 2.10). However, in 293T cells, the recovery response was negligible (Figure 2.2B). The absence of an mtorc1 recovery response in 293T cells is significant, given that much of the work done to characterize amino acid sensing and signaling to mtorc1 has been worked out in 293T cells (Bar Peled et al., 2012; Sancak et al., 2008, 2010). Taken together, our data show that prolonged leucine or arginine deprivation leads to a potent but transient reactivation of mtorc1 activity in multiple cell types. Figure 2.2 mtorc1 recovery occurs in many but not all cell lines. (A B) U2OS cells (A) or 293T cells (B) were deprived of arginine or leucine for the indicated times. 28
40 The mtorc1 reactivation is independent of regeneration of amino acids from autophagy/lysosomal degradation or the proteasome Under conditions of limiting nutrients, cells can adapt by inducing autophagy to degrade proteins and other cytosolic macromolecules. Release of amino acids due to autophagy has been proposed to co occur with mtorc1 reactivation (Yu et al., 2010), but it remains unclear if the mtorc1 reactivation is dependent on autophagy per se, or if mtorc1 reactivates in an autophagy independent manner. To explore this, I utilized MEF cells that lack ATG5, and deprived these cells of leucine and arginine. Interestingly, the mtorc1 reactivation was observed also in the ATG5 autophagy deficient MEFs (Figure 2.3A), demonstrating that the recovery response is not due to induction of ATG5 mediated autophagy. To further investigate if the reactivation response was due to regeneration of amino acids through either lysosomal or proteasomal degradation of proteins, I treated cells with the lysosomal inhibitor chloroquine, or the proteasomal inhibitor MG132 for 6 hours, in combination with arginine deprivation. Neither inhibition of the lysosome or the proteasome interfered with the mtorc1 reactivation (Figure 2.3B,C), demonstrating that the mtorc1 recovery is not due to amino acids being regenerated through these protein degradation machineries. Moreover, prolonged arginine deprivation did not lead to any increased intracellular levels of arginine during the time course of reactivation, as measured by metabolic profiling (Figure 2.3D), strongly arguing against regeneration of arginine as the cause of the mtorc1 recovery. In sum, these data show that the mtorc1 reactivation observed upon leucine or arginine deprivation is independent of regeneration of these amino acids. 29
 Autophagy deficient ATG5 / MEFs or littermate controls were deprived of arginine or leucine for the indicated times.")
 and (C) were for a total of 6 hours.")
41 Figure 2.3 The mtorc1 recovery response is independent of canonical autophagy or proteasomal degradation of proteins. (A) Autophagy deficient ATG5 / MEFs or littermate controls were deprived of arginine or leucine for the indicated times. (B C) MEFs were deprived of arginine in the presence of 100 of the µm lysosomal inhibitor chloroquine (A) or 20 µm of the proteasomal inhibitor MG132 (B) as indicated. All drug treatments in (B) and (C) were for a total of 6 hours. (D) WT MEFs were deprived of arginine for 0 minutes, 45 minutes, 3 hr, or 6 hr, and intracellular metabolite levels were analyzed via mass spectrometry. The graph on the left shows arginine levels with standard deviations averaged from 4 separate experiments (left panel). Western blots of duplicate plates from a representative experiment are shown in the right panel. 30
42 The mtorc1 recovery response requires PI3K/Akt activity Given that the mtorc1 reactivation was found to be independent of regeneration of amino acids, I started to interrogate other signaling components that are known to be involved in mtorc1 activation, to explore their role in the mtorc1 recovery response. This approach included looking at PI3K Akt signaling, which is a major activator of mtorc1, through inactivation of the mtorc1 inhibitors TSC2 and PRAS40 (Dibble and Cantley, 2015). Interestingly, depriving cells of arginine in combination with pharmacological inhibition of PI3K severely blunted the mtorc1 recovery response (Figure 2.4A), suggesting that activation of the PI3K pathway is needed for the reactivation to occur. To investigate if this was due to PI3K signaling through Akt, I treated cells with two inhibitors of Akt, the PHdomain inhibitor MK2206, and the ATP competitive inhibitor GSK690693, to investigate if Akt is necessary for the mtorc1 recovery response. As with PI3K inhibition, pharmacological inhibition of Akt significantly blunted the mtorc1 reactivation, further suggesting an important role for PI3K/Akt signaling in the mtorc1 reactivation response. To confirm this, I knocked down Akt3 in Akt1/Akt2 double knock out (DKO) MEFs, to generate cells nearly completely deficient in Akt, and deprived these cells of leucine or arginine as previously described. Indeed, Akt deficient cells mirrored the pharmacological inhibition of PI3K/Akt signaling inhibitors, as these cells also exhibited a severely blunted mtorc1 recovery response (Figure 2.4D). Taken together, these data show that PI3K/Akt signaling is needed for the mtorc1 reactivation to occur. 31
43 Figure 2.4 The mtorc1 recovery response requires PI3K/Akt activity. (A) WT MEFs treated with the PI3K inhibitor GDC0941 at the indicated concentrations in combination with deprivation of arginine for the indicated times. (B C) MEFs were deprived of arginine (B) or Arginine and Leucine (C) and treated with 2 µm MK2206 (B) or 10 µm GSK (C) for up to 6 hours, as indicated. (D) Akt1 2 double KO MEFs treated with two different sirnas against Akt3 were deprived of arginine for the indicated times. 32


44 Figure 2.4 (Continued) 33
45 Akt activity increases during the mtorc1 recovery response in some, but not all cell lines Given that PI3K/AKT signaling was needed for the recovery response to be observed, I also investigated the activation levels of Akt during mtorc1 reactivation. Interestingly, I noted that Akt activation was robustly increased upon prolonged arginine and leucine deprivation, as judged by levels of phospho Akt at residues T308 and S473, which both correlate with Akt activity (Alessi et al., 1996) (Figure 2.5A). Our initial thought was that this increase in Akt activity was a direct consequence of the inhibition of mtorc1, due to the relief of a well described mtorc1 mediated feedback loop (Dibble et al., 2009; Haruta et al., 2000; Hsu et al., 2011; Yu et al., 2011). However, pharmacological inhibition of mtorc1 with rapamycin did not inhibit Akt activation upon prolonged arginine deficiency, demonstrating that the observed Akt activation is not due to the mtorc1 inhibition per se, but rather connected with the amino acid deficiency (Figure 2.5B). To investigate if the increase in Akt is due to a general activation of growth factor receptor pathways, I probed lysates that had been starved of arginine and leucine with an anti phosphotyrosine antibody, since a large part of growth factor signaling is mediated through tyrosine phosphorylation (Kawase et al., 1995). Remarkably, I did not find any evidence of a general increase in growth factor signaling activity, as overall phosphotyrosine levels robustly decreased during the arginine and leucine deprivation time course (Figure 2.5C). This data argues against a model in which amino acid deprivation upregulates growth factor signaling generally, and instead, may suggest that amino acid deprivation is activating the PI3K Akt pathway more specifically. Future investigations will be needed to thoroughly address this topic. 34

 MEFs deprived of both arginine and leucine (A) or arginine or")
46 Figure 2.5 Prolonged arginine or leucine deprivation leads to increased PI3K/Akt signaling. (A C) MEFs deprived of both arginine and leucine (A) or arginine or leucine alone (B C) for the indicated times. In B, cells were treated with 20 nm Rapamycin or DMSO as a control, as indicated. 35

47 The mtorc1 recovery response is independent of mtorc2 Based on the data from Figure 2.5C suggesting that growth factor receptor signaling is not globally upregulated during the mtorc1 recovery response, I was curious if there was a more specific upregulation happening. Akt is activated through phosphorylation of two key residues: T308 by PDK1 (phosphoinositide dependent kinase 1), and S473 by mtorc2. To test if Akt phosphorylation by mtorc2 is responsible for the mtorc1 recovery, I obtained Rictor KO MEFs and deprived these cells of arginine or leucine. These cells showed no phosphorylation of Akt at S473, but displayed robust mtorc1 recovery (Figure 2.6), arguing that mtorc2, and phosphorylation of Akt at S473 is not necessary for the mtorc1 recovery response. Figure 2.6 The mtorc1 recovery response is independent of mtorc2. Rictor KO MEFs were deprived of arginine or leucine for the indicated times and cell lysates were probed with the indicated antibodies. 36

48 The recovery response is partially mediated by the TSC complex To gain further understanding of how the recovery response might be occurring, I decided to test the role of the TSC complex in the response. One approach would be to test the recovery response in a setting without a functional TSC complex. However, this approach Figure 2.7 mtorc1 reactivation is partially mediated through the TSC complex. TSC2 / cells were infected with empty vector, TSC2 WT, or a version of TSC2 in which the Akt phosphorylation sites were mutated to alanines (TSC2 5A). Cells were deprived of arginine or leucine for the indicated times. Note, this experiment was only performed one time. proved difficult; cells lacking the TSC component TSC2 have such hyperactive levels of mtorc1 through Rheb activation, that these cells are largely unresponsive to single amino acid deprivation (Figure 2.7, left four lanes). To overcome this issue, I obtained a construct of TSC2 in which the residues that are phosphorylated by Akt were mutated to unphosphorylatable alanines (TSC2 5A). The protein encoded by this construct is fully 37
49 functional in its GAP activity toward Rheb, but it cannot be inhibited by Akt (Menon et al., 2014). Two of my colleagues, Julie Han and Dr. Ana Gomes, virally expressed this construct or a WT TSC2 construct in TSC2 / MEFs. Re expression of TSC2 in TSC2 KO MEFs slightly lowered the mtorc1 activity, and restored the responsiveness of mtorc1 activity to arginine and leucine (Figure 2.7, middle four lanes, both panels). Expression of the TSC2 5A construct also lowered the mtorc1 activation levels of the TSC2 / MEFs, and additionally lowered the phosphorylation levels of mtorc1 targets during the recovery response (Figure 2.7, right four lanes, both panels). The result from this experiment shows that the recovery response seems to be partially, but not completely mediated by TSC2 phosphorylation by Akt. Based on data suggesting that a kinase related to Akt, serum and glucocorticoid induced protein kinase 1 (SGK1), is able to phosphorylate TSC2 at the sites phosphorylated by Akt (Castel et al., 2016), I decided to investigate the role of SGK in the recovery response. There are three isoforms of SGK, and the compound 14g has selectivity toward SGK1 (Halland et al., 2015). I used this compound alone and in combination with the Akt inhibitor MK2206, and found that alone, the inhibitor had less of an effect on mtorc1 recovery than the Akt inhibitor, however, the two inhibitors together displayed potent inhibition of mtorc1 recovery (Figure 2.8). It is clear that there is some redundancy between the Akt and SGK proteins in regulation of mtorc1, however, the combination of inhibitors robustly inhibited mtorc1 signaling in both the growing condition and the recovery conditions, so it is unclear whether SGK plays a role specific in the recovery phase or simply acts as an mtorc1 activator in all conditions. 38
 and/or the SGK1 inhibitor 14g (10 µm).")
50 Figure 2.8 SGK1 plays a role in mtorc1 activation, and inhibition of both Akt and SGK1 robustly inhibits mtorc1 signaling and recovery response. MEFs were deprived of arginine in the presence of the Akt inhibitor MK2206 (2 µm) and/or the SGK1 inhibitor 14g (10 µm). Note, the experimental conditions containing 14g were only performed one time, and a portion of this gel was shown in Figure 2.4. The increase in Akt signaling upon prolonged leucine or arginine deprivation is transient To get a more complete view of the mtorc1 recovery response, I deprived cells of arginine and leucine for a longer period of time. I found that the mtorc1 recovery remained strong through 12 hours, and slowly diminished, reaching a minima around 36 hours (Figure 2.9A). Akt activation mirrored that of mtorc1, but the peak Akt activation and timing of the decrease was slightly quicker than that of mtorc1 (Figure 2.9A). mtorc1 regulates many cell growth processes, with protein translation being strongly promoted by mtorc1 (Laplante and Sabatini, 2012). I was curious, given the data showing that arginine levels remain low to undetectable during mtorc1 recovery, if protein translation is able to occur during mtorc1 recovery. To address this question, I employed a 39
51 method termed surface sensing of translation (SUnSET) to measure relative rates of global protein translation (Dadehbeigi and Dickson, 2013; Schmidt et al., 2009). This method takes advantage of the fact that puromycin, as a protein synthesis inhibitor, acts by itself incorporating into the end of nascent peptides. Considering that the rate of puromycin incorporation into peptides is proportional to the rate of protein translation, the relative levels of puromycin incorporation can be used as a readout for relative levels of translation. As can be observed in Figure 2.9B, puromycin incorporation into peptides was greatly diminished by 45 minutes of deprivation of either arginine or leucine, and rates did not increase during the timeframe of mtorc1 reactivation. These results indicate that despite the activation of mtorc1 in this context, protein translation remains globally low, presumably due to lack of charged arginine or leucine trnas. Discussion Taken together, our results demonstrate a novel mechanism of mtorc1 regulation by which Akt dependent mtorc1 activation occurs following prolonged deprivation of individual amino acids. I demonstrate that this reactivation is independent of amino acid levels, and that the phenomenon is dependent on signaling that can be blocked by disruption of Akt. While mtorc1 activity is known to promote numerous cell growth processes including protein, lipid, and nucleotide synthesis, our data show that at least one arm of this regulation, that of protein synthesis, is not able to resume during the mtorc1 recovery phase. It is not surprising that protein translation remains stalled, since peptides cannot be synthesized without the presence of all proteinogenic amino acids. Further characterization will be necessary to determine if the other effectors of mtorc1 signaling correlate with mtorc1 activity during the recovery phase or not. 40
52 Figure 2.9 The increase in Akt signaling upon prolonged leucine or arginine deprivation is transient. (A B) WT MEFs were deprived of arginine and leucine for the indicated times. In B, 10 µg/ml puromycin was added to the media 10 minutes prior to harvest to visualize cellular rates of translation. 25 µm cycloheximide was added to the media 45 minutes prior to harvest, as indicated. The puromycin blot shows approximately from kda. (C) Graphical summary of findings. 41


53 Figure 2.9 (Continued) 42
54 There are various arms of regulation of mtorc1, the two best characterized of which can loosely be labeled the growth factor arm and the amino acid arm. The growth factor arm largely relies on the Tuberous Sclerosis Complex (TSC) complex, which serves as a GTPase activating protein (GAP) for Rheb (Inoki et al., 2003b; Tee et al., 2003), an essential activator or mtorc1 (Long et al., 2005), that localizes to endomembranes, including lysosomes. It has been shown that the TSC complex can be recruited to lysosomal membranes in order to inhibit Rheb. However, to date, there is some controversy over what stimuli regulate the localization of the TSC complex. Some data argues that the localization of the TSC complex is regulated by growth factor stimulated Akt phosphorylation of the TSC complex (Menon et al., 2014), while other data argues that TSC complex localization is regulated by amino acids (Demetriades et al., 2014). Newer data suggests that both models may be true, with TSC localization being regulated by a number of cellular stresses (Demetriades et al., 2016). If both models do indeed hold true, then it seems that the TSC complex could be a point of intersection of the two regulatory arms. Based on the observed increase in Akt phosphorylation levels following amino acid deprivation and the inability of rapamycin to block this increase (Figure 2.4), it seems that amino acid deprivation is able to stimulate Akt activity independent of mtorc1. This suggests a model in which lack of input through one arm of mtorc1 regulation can be compensated for via upregulation of another arm (Figure 2.9C). This is in agreement with what I find in cells lacking amino acid input through the Rag GTPases; these cells have highly upregulated levels of Akt activation during all conditions tested (Figure 2.10). Additionally, the U2OS cells which also display mtorc1 recovery also display robust Akt activation following amino acid deprivation (Figure 2.2A), whereas the 293T cells which lack mtorc1 recovery show little change in Akt activation, suggesting they lack compensation through this 43

55 Figure 2.10 Loss of the Rag GTPases prevents mtorc1 responsiveness/recovery following arginine or leucine withdrawal. 293A cells with RagA and RagB knocked out via CRISPR/Cas9 were deprived of arginine or leucine for the indicated times. mechanism. If indeed, the localization of the TSC complex can be regulated both by the growth factor pathway and the amino acid pathway, then it is possible that this is the point of convergence that is able to modulate mtorc1 activity through a balance of inputs. This compensatory balancing of inputs, however, appears to only be sufficient to overcome deprivation of one or a few amino acids, and does not appear to be able to overcome the strong negative input to mtorc1 resulting from total amino acid deprivation (Figure 2.1C). Further work will be necessary to understand the functional role of the mtorc1 recovery response. I postulate that the recovery response is an adaptation, allowing the cell to maintain essential cellular functions in the expectation that levels of the lacking amino acid will be restored in the following hours. In addition to the role mtorc1 recovery plays in normal cells, the recovery response is important to take into account for therapeutic interventions, especially those involving specific amino acid depletions such as has been proposed for numerous cancer types (Feun et al., 2008; Huang et al., 2012; Kelly et al., 2012). 44
56 Inadvertent activation of mtorc1 and/or Akt in these contexts could have unwanted effects toward cancer cells that should be considered in these treatments. 45
57 Chapter 3 Rag movement from lysosomes following amino acid stimulation
58 Introduction The activity of mammalian target of rapamycin complex 1 (mtorc1) is regulated by numerous environmental factors, including growth factors, glucose, oxygen, and amino acids. While many of these factors exert their effects by regulating the guanine nucleotide binding state of Rheb (Manning et al., 2002; Tee et al., 2003), an essential activator of mtorc1 (Long et al., 2005), amino acids function in mtorc1 regulation largely through the guanine nucleotide binding states of the Rag GTPases. The Rag GTPases localize to the lysosomal surface, and in the presence of amino acids, the Rag GTPases recruit mtorc1 to the lysosome via interactions with the raptor component of mtorc1. At the lysosome, mtorc1 can interact with Rheb, allowing for activation of mtorc1 under favorable environmental conditions (Bar Peled et al., 2012; Sancak et al., 2008, 2010). The Rag GTPases are unusual for two main reasons. Firstly, while most GTPases are monomeric, the Rag GTPases form heterodimers of one Gtr1 like protein (RagA or RagB), and one Grt2 like protein (RagC or RagD). The GDP/GTP binding of the two components of the heterodimer are regulated independently of each other, suggesting the possibility that the two components can serve distinct functions. Secondly, the Rag GTPases are not prenylated to allow for their localization to membranes as most GTPases are. Instead, the Rag proteins rely on interactions with the Ragulator complex to remain localized to the lysosome, suggesting that constitutive localization of the Rags through lipidation has been evolutionarily selected against. There is data to suggest that interactions between the Rags and the Ragulator proteins weaken following amino acid stimulation (Bar Peled et al., 2012), but it has not been reported that the Rag proteins can move away from the Ragulator complex, and the current model maintains that the Rag proteins are constitutively localized to the lysosomal surface. In contrast to the current model, I find that the Rag proteins move 47
59 away from the lysosomal surface following amino acid stimulation. This finding is counterintuitive given that the Rags are essential for mtorc1 recruitment to the lysosomal membrane during amino acid replete conditions (Sancak et al., 2008), and suggests that the Rags may serve another unidentified function in amino acid sensing and mtorc1 signaling. Results RagA moves away from the lysosome following amino acid stimulation in an mtorindependent fashion Based on published data suggesting a regulated interaction between the Rag proteins and the regulator complex (Bar Peled et al., 2012), I decided to investigate whether the Rag proteins can move from the lysosomal surface to other cellular compartments. To do this, I performed immunofluorescence (IF), co staining mouse embryonic fibroblasts (MEFs) with antibodies to endogenous RagA and LAMP1, as a marker of lysosomes. I starved the cells of amino acids and stimulated with amino acids for various time points. As a control, I also stained cells separately with mtor and LAMP1. As expected, mtor was largely diffuse throughout the cytosol in amino acid starvation conditions, but a large amount of mtor was found co localized with LAMP1 in the amino acid stimulation conditions (Figure 3.1 A and C). Interestingly, the RagA staining pattern followed the opposite trend, with RagA becoming more diffuse throughout the cytosol following amino acid stimulation (Figure 3.1 B and D). The changes I observe in localization of mtor and RagA correlate well with the change in activation of mtorc1 as assessed by phosphorylation levels of the mtorc1 target protein S6K (Figure 3.1 E). 48
 MEFs were deprived of amino acids and stimulated with amino acids for either 10, 30, or 60 minutes, and stained with the indicated antibodies.")
60 Figure 3.1 RagA moves away from the lysosome following amino acid stimulation. (A B) MEFs were deprived of amino acids and stimulated with amino acids for either 10, 30, or 60 minutes, and stained with the indicated antibodies. (C D) Box plots of the colocalization of the indicated antibodies with the lysosomal marker, LAMP1. Data quantified in these plots are from Z stacks of the entire cell volume, analyzed to calculate the percent volume of RagA signal above threshold colocalized with LAMP1 signal. Data for each timepoint represents an average of a minimum of 12 distinct fields of view. Each plot is from a representative experiment. (E) Western blot of MEF cell lysates, showing the phosphorylation levels of the mtorc1 target protein S6K1 at the times indicated. 49
 or the mtorc1 specific inhibitor Rapamycin")
61 Figure 3.2 Rag movement away from the lysosome is independent of mtor activity. MEFs were starved and stimulated of amino acids in the presence of the ATP competitive mtor inhibitor Torin (250 nm) or the mtorc1 specific inhibitor Rapamycin (20 nm). Cells were fixed and stained for RagA and the lysosomal marker LAMP1. 50
62 I next questioned whether the change in RagA localization is a consequence of mtor activation, or if it occurs independently of the mtor activation state. To address this, I looked at the localization of RagA in starved and stimulated cells in the presence of the ATPcompetitive mtor inhibitor Torin, the mtorc1 specific inhibitor Rapamycin. In the presence of either of these inhibitors, I observe the diffusion of RagA following amino acid stimulation, demonstrating that the change in localization of RagA occurs independently of mtor activity (Figure 3.2) Rag localization is governed by GDP/GTP nucleotide binding Amino acids are known to regulate the Rag mtorc1 interaction by modulating the GDP/GTP binding status of the Rag proteins. Thus, I was curious if the changes in RagA localization I was observing were due to changes in the guanine nucleotide bound to the Rag protein. To address this, I took advantage of mutants that lock the GTPase in either a GTPbound state or a nucleotide free state that mimics the GDP bound state. A colleague of mine, Dr. Sang Gyun Kim, stably expressed these mutants in MEFs and stained the cells for mtor localization and Rag localization. Unsurprisingly, the cells expressing nucleotide free RagB (RagB TN) displayed diffuse staining of mtor irrespective of the presence of amino acids, due to the inability of this mutant to bind mtorc1. In contrast, the cells expressing RagB constitutively bound to GTP (RagB QL) displayed enrichment of mtorc1 at lysosomes irrespective of the presence of amino acids. The staining pattern of RagB, however, displayed the opposite trend as mtor: the RagB TN was largely lysosomal, and the RagB QL was largely diffuse (Figure 3.3). These results suggest that the guanine nucleotide binding of RagA/B regulates the localization of the Rag proteins. 51
63 Figure 3.3 Rag localization is governed by GTP/GDP binding. MEFs stably expressing FLAG tagged RagB (C), or RagB containing the Q99L mutation rendering RagB constitutively GTP bound (B), or RagB containing the T54N mutation rendering RagB unable to bind nucleotides (A) were starved of amino acids for 90 minutes ( AA) or starved of amino acids for 60 minutes followed by 30 minutes of amino acid stimulation (+AA). Cells were stained with FLAG and LAMP1 antibodies and imaged via confocal microscopy. 52

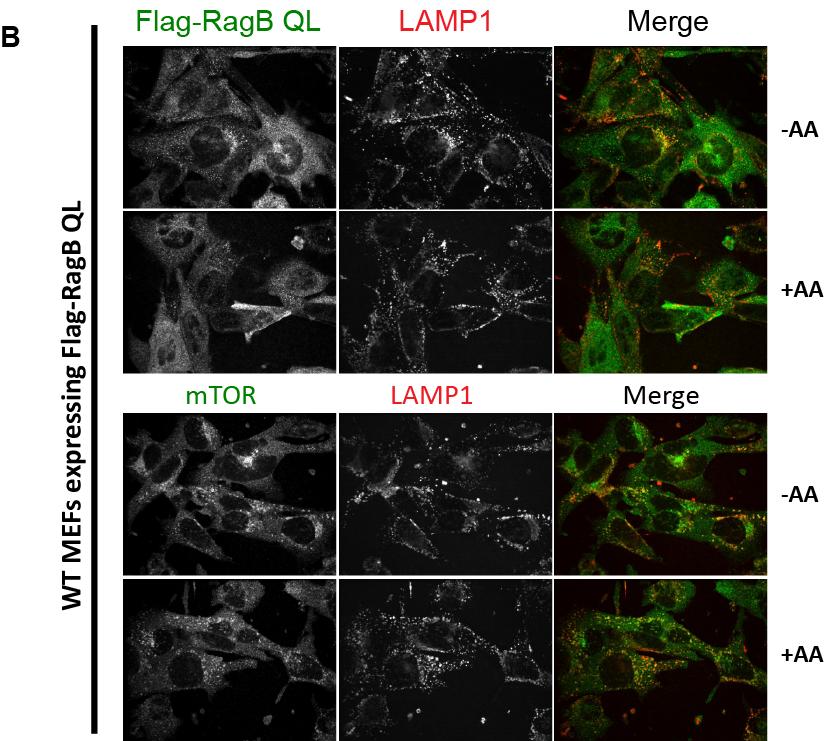
64 Figure 3.3 (Continued) 53

65 Figure 3.3 (Continued) 54
, starved for 90 minutes and stimulated with amino acids for 30 minutes (+AA")

66 Figure 3.4 RagA enters the nucleus following amino acid stimulation. Cells were either starved of amino acids for 2 hours ( AA 2hr), starved for 90 minutes and stimulated with amino acids for 30 minutes (+AA 30 ), or starved for 60 minutes and stimulated with amino acids for 60 minutes (+AA 60 ), such that all experimental conditions lasted 2 hours. Experimental conditions were performed in the presence or absence of leptomycin B, an inhibitor of nuclear export. Cells were fixed, stained with the indicated antibodies, and imaged via confocal microscopy. 55
67 The Rag proteins enter the nucleus following amino acid stimulation The staining pattern observed for RagA/B following amino acid stimulation/constitutive GTP binding did not seem to indicate a specific destination for RagA/B away from the lysosome. To investigate the possibility of Rag movement into the nucleus, I used an inhibitor of nuclear export, Leptomycin B (LMB). Following stimulation with amino acids, LMB treatment caused an increase in RagA staining in the nucleus, indicating that RagA enters the nucleus in amino acid stimulation conditions (Figure 3.4). To investigate a role for nuclear shuttling of the Rag proteins in mtorc1 activation, I looked at mtorc1 activation following amino acid stimulation in the presence of LMB. mtorc1 activation was only slightly decreased in cells treated with LMB, suggesting that nuclear shuttling of the Rags is not necessary for mtorc1 activation (Figure 3.5 A). To investigate this further, I designed an experimental scheme in which I starved and stimulated cells twice, in the presence of LMB (Figure 3.5 B). The goal was to test the hypothesis that nuclear entry of the Rag proteins is required for recycling of the Rag proteins back to the lysosome; that without nuclear entry following the Rag diffusion, they might not be able to localize back to the lysosome or recruit mtorc1. So I performed a double starve/stimulation experiment, outlined in Figure 3.5 B, to test whether trapping Rags in the nucleus with LMB prevents subsequent mtorc1 activation. I found this was not the case, since cells that were doubly starved and stimulated in the presence of LMB were just as capable of activating mtorc1 as cells that were only singly starved and stimulated (Figure 3.5 B). These results do not provide a strong argument that nuclear entry or shuttling of the Rag proteins is necessary for mtorc1 activation. 56
 MEFs were treated according to the treatment schemes are illustrated in the bottom panel.")
68 Figure 3.5 RagA entry into the nucleus does not appear to be necessary for mtorc1 activation. (A) MEFs were starved and stimulated as described in Figure 3.4, in the presence or absence of Leptomycin B. Cell lysates were probed with the indicated antibodies. (B) MEFs were treated according to the treatment schemes are illustrated in the bottom panel. Cell lysates were probed with the indicated antibodies (top panel). 57
69 N terminal modification/lipidation results in dysfunctional RagA protein To attempt to interrogate the role of Rag movement in mtorc1 activation, I designed a scheme to force the localization the Rag proteins to the lysosome. To force localize the Rags specifically to the lysosome, I considered various lysosomal proteins and their localization sequences that I could fuse to the Rags in order to artificially achieve lysosomal localization. I decided to use the N terminal 20 amino acids of the Ragulator component p18/lamtor1 (late endosomal/lysosomal adaptor, MAPK and MTOR activator 1), which contain myristoylation and palmitoylation sites that allow for localization of the protein to the lysosomal membrane (Nada et al., 2009). Localization of p18/lamtor1 allows for lysosomal localization of the entire Ragulator complex as well as the Rag heterodimer (Bar Peled et al., 2012; Sancak et al., 2010), so by fusing the N terminal 20 amino acids of p18/lamtor1 to RagA (Figure 3.6 A), the goal is to bypass the need for the Ragulator in the localization of the Rags, and to eliminate any potential regulation of Rag localization that may be occurring. IF staining for RagA in MEFs stably expressing an HA tagged p18 RagA fusion protein (referred to here as p18n HA RagA), indicated that the p18n terminal fusion caused a majority of RagA to constitutively localize to lysosomes (Figure 3.6 B). In comparison, a control construct which contained the same HA tag and N terminal p18/lamtor1 fusion as p18n HA RagA, but with the myristoylation and palmitoylation sites mutated to alanine (p18nmut HA RagA) (Figure 3.6 A), was observed in a largely cytoplasmic staining pattern (Figure 3.6 B). In these MEFs expressing p18n HA RagA or p18nmut HA RagA, I additionally knocked down the endogenous RagA with sirna to be able to more specifically look at the constitutively localized RagA, and looked at phosphorylation of mtorc1 targets to assay mtorc1 activation. I found that expression of the constitutively localized RagA caused a decrease in the level of activation of mtorc1, compared to expression of p18nmut HA RagA 58
70 Figure 3.6 N terminal modification/lipidation of RagA results in dysfunctional protein. (A) Diagram illustrating the p18/lamtor fusion proteins used. p18n HA RagAWT is a fusion between the N terminal 20 amino acids of p18/lamtor1 and RagA, with an HA tag in between the two. p18nmut HA RagAWT has mutations in the residues of p18 that are normally lipidated. (B) Stable cell lines were generated expressing the fusion proteins described in A. Cells were starved and stimulated as described above and stained with antibodies to RagA and LAMP1. (C) The same stable cell lines used in B had endogenous RagA knocked down, and following amino acid starvation and stimulation, cells were probed with the indicated antibodies. (D) 293T cells transiently expressing an HA tagged version of RagA, or the RagA constructs described above, were immunoprecipitated, and precipitates were probed with the indicated antibodies. 59

71 Figure 3.6 (Continued) 60
72 (Figure 3.6 C). Although this result would seem to suggest that RagA movement away from lysosomes is necessary for full activation of mtorc1, I was concerned that the modification to RagA was affecting the ability of RagA to function normally, beyond the effect of forced localization. Since the activation of RagA is dependent on its binding to the Ragulator components (Bar Peled et al., 2012), and its recruitment of mtorc1 is dependent on its binding to RagC/D (Sancak et al., 2008), I decided to test whether p18n HA RagA was able to bind these proteins when expressed in a cell. I immunoprecipitated HA RagA, p18n HA RagA, and p18nmut HA RagA from 293T cells, and probed the precipitates for RagC and the Ragulator components p18/lamtor1 and MP1/LAMTOR3. While HA RagA and p18nmut HA RagA both co precipitated RagC and the regulator components, these proteins were barely detectable in the p18n HA RagA precipitates (Figure 3.6 D), indicating that this fusion protein is not able to function as normal RagA would at the lysosome. For this reason, I cannot make any meaningful interpretations of the result from Figure 3.6 C or any other experiments using this fusion protein, since it is not only constitutively localized to the lysosome, but it is also at least partially non functional, explaining the observed decrease in mtorc1 activation in Figure 3.6 C. As an alternative approach to the N terminal p18 fusion, I also made versions of RagA with a C terminal fusion to the a portion of Rheb containing its CAAX motif (C=cysteine, A=aliphatic, X=terminal amino acid), which has been shown to be lipidated at the cysteine residue of the CAAX motif, and is sufficient for its localization (Hanker et al., 2010; Sancak et al., 2010). The drawback to this approach is that Rheb displays a much broader distribution than p18 (Hanker et al., 2010), so I knew these constructs would likely result in results that 61

73 are harder to interpret. I stably expressed the HA RagA WT CAAX construct, as well as a mutant with the cysteine of the CAAX mutated to serine (referred to here as SAAX). Interestingly, expression of HA RagA WT CAAX displayed lower mtorc1 activation than expression of HA RagA WT SAAX under amino acid stimulation conditions. However, expression of HA RagA WT CAAX appeared to slightly rescue the effects of amino acid starvation compared to expression of HA RagA WT SAAX (Figure 3.7) for unknown reasons. Figure 3.7 RagA forced localization with the Rheb CAAX motif inhibits activation of mtorc1 to its full extent, but partially rescues mtorc1 activity in amino acid starve conditions. H. Sapiens versions of HA RagA WT CAAX and HA RagA WT SAAX were stably expressed in MEFs, and the endogenous, mouse forms of RagA were knocked down with sirna. Discussion I describe here the novel phenomenon of Rag movement from the lysosome following amino acid stimulation (Figure 3.1). I find that this movement is independent of mtorc1 activity (Figure 3.2), and that this localization is governed by the GTP/GDP binding status of RagA/B (Figure 3.3). RagA can be observed in the nucleus, but a role for Rag nuclear 62
74 translocation in mtorc1 activation is unclear (Figure 3.4, Figure 3.5). There may be a different sub cellular location to which the Rag proteins are relocating, or there may be a non mtorc1 related function for the Rags in the nucleus. Unfortunately, the p18 fusion approach I took to force the localization of the Rag proteins to the lysosome caused problems in the functionality of RagA, so I was unable to use this approach to assess the role of Rag movement in mtorc1 activation. I also show data here with a Rheb fusion approach to attempt to localize RagA via the CAAX motif of Rheb. However, we had difficulty determining the exact localization of the Rheb construct, and detailed analysis will be necessary to establish the functionality of these constructs. It will be possible to attempt to force the localization of the Rag proteins through other analogous methods, however, it is likely that similar N terminal fusion methods may yield the same issue as with the p18 fusion. I have also made the construct p18n HA RagC, which is analogous to p18n HA RagA, but detailed analysis will be necessary to determine if this construct is able to function or if the p18 fusion causes it to be dysfunctional as well. There are a number of possibilities why the Rag proteins may alter their location in response to amino acid stimulation. It has been proposed that potentially due to the large size of mtorc1, the Rags may leave the lysosome in order to bind mtorc1 and bring it to the lysosome (Bar Peled et al., 2012), however there is currently no published data to support this model. I question this model because it implies that RagA would need to leave and then return to the lysosome in the time it takes mtor to arrive at the lysosome. Based on our quantitation of the mtor and RagA localization data, by an hour following amino acid stimulation, a majority of RagA is localized away from the lysosome while a majority of mtor is localized at the lysosome. It may be that the stoichiometric ratio of Rag proteins in a cell compared to mtorc1 complexes is very high, and only a small proportion of the total Rag proteins may be necessary to bind mtorc1 at the lysosome. If this is the case, while I am 63
75 observing a net decrease in Rag localization at the lysosome, perhaps only a small proportion of the Rags are needed to shuttle out and back to the lysosome. To address this, it might be useful to assess the movement of the Rag proteins in a live cell to determine if the Rag proteins are indeed shuttling back and forth from the lysosome following amino acid stimulation. Another possibility is that the Rag proteins diffuse away from the lysosome following binding to mtorc1, and that the Rag proteins have a role in mediating mtorc1 phosphorylation of substrates. Most mtorc1 substrates are found at locations other than the lysosome, so a question exists as to whether substrates need to come in proximity of the lysosome, or whether mtorc1 shuttles to the locations of substrates, and returns to the lysosome to keep being activated by Rheb. If the latter case is true, then perhaps the Rag proteins play a role in this shuttling to substrates, or perhaps prolonging the activation of mtorc1 while it is away from the lysosome and not bound to Rheb. A third possibility is that Rag movement is involved in the inactivation of mtorc1. The data with HA RagA WT CAAX suggests that forced localization of Rag to the cellular compartment of Rheb inhibits the ability of mtorc1 to turn off in situations of amino acid deficiency. It is likely that the Rags and Rheb occupy distinct locations, and only a portion of them overlap. The Rags may have a function that requires localizing more specifically with Rheb. For example, they may have to shuttle mtorc1 to Rheb, or facilitate mtorc1 binding to Rheb. If this is the case, then the HA RagA WT CAAX construct would allow for decreased inactivation of mtorc1 in amino acid starve cases because it would be unable to leave the Rheb subcellular location, and would continue to activate mtorc1 even under amino acid starve conditions. However, another possibility is that the altered location of RagA fused to 64
76 the Rheb CAAX causes it to have decreased access to its GEF an GAP, leaving it in a neutral state, irrespective of amino acid status. A fourth possibility as to why the Rag proteins move is to function in another amino acid regulated process unrelated to mtorc1 activity, and yet a fifth possibility is that the Rag movement serves no functional role at all. The Ragulator not only serves as the docking point for the Rags, but it also serves as a guanine nucleotide exchange factor (GEF) for RagA/B (Bar Peled et al., 2012; Sancak et al., 2010). Detailed binding affinities for Ragulator toward RagA/B have not been determined, but initial analysis of the Rags and detailed analysis of other Ras related GTPases have revealed that GEFs bind the nucleotide free form of their GTPases more strongly than a nucleotide bound form (Bar Peled et al., 2012; Klebe et al., 1995; Sprang and Coleman, 1998). This alone could explain the observed localization of RagB in Figure 3.3, with decreased binding affinity leading to decreased association. However, analysis of the interaction between Ran and its GEF RCC1, showed that the binding affinities of RCC1 to Ran GDP and Ran GTP are similar (Klebe et al., 1995); if this is also the case for the association of Ragulator with RagA/B GDP and RagA/B GTP, then binding affinity of Ragulator toward RagA/B might not be sufficient to explain the change in localization I observe. More detailed studies of the binding affinities of Ragulator toward the specific nucleotide bound Rag proteins will be needed to determine this. 65
77 Chapter 4 Discussion and future directions
78 General Discussion I have described in this thesis two distinct mechanisms by which amino acids can regulate aspects of the mtorc1 pathway in novel ways. In Chapter 2, I describe how a relatively mild insult to mtorc1, that of deprivation of arginine or leucine, allows for reactivation of mtorc1 for a period of several hours. In Chapter 3, I describe how amino acid stimulation leads to movement of the Rag proteins away from their known location, the lysosome. The mechanisms of mtorc1 regulation by amino acids are complex and are still far from well understood. Although there is still much to study and decipher in regard to the mechanisms of regulation I describe above, it is my hope that these topics will be integrated into the overall understanding of mtor regulation and function to help clarify what is still unknown. The mtorc1 recovery response The biggest question I would like to address in regard to the mtorc1 recovery response described in Chapter 2 is the cellular function of the response. My thought is that the response is a temporary adaptation response, to allow the cells to maintain essential cellular functions so they can survive the period of nutrient loss. However, in my attempts to block the recovery response through pharmacological inhibition of mtorc1, I have failed to observe any significant reproducible phenotypes in regard to cell death or apoptotic markers (data not shown). Preliminary data shows that rapamycin treatment causes an increase in nuclei size that is specific to the arginine deprivation condition; rapamycin treatment in growing cells induces a decrease in nuclei size (Figure A 1). While this may be indicative of mtorc1 reactivation inducing changes in cell cycle, additional studies are needed to confirm 67
79 this. Further, why this cell cycle phenotype may be beneficial for the cell under arginine deprivation conditions is not clear. Another possibility as to why cells reactivate mtorc1 following arginine or leucine withdrawal is related to autophagy and its regulation by mtorc1. It might be possible that arginine or leucine deprivation causes induction of autophagy, but that long term induction of autophagy is detrimental to the cells. This may lead to the cells turning on mtorc1 with the goal of inhibiting autophagy through ULK1, DAP1, or other mechanisms (Ganley et al., 2009; Hosokawa et al., 2009; Jung et al., 2009; Koren et al., 2010) to limit the extent of cell self eating. A related question that might help provide clues as to the function of the mtorc1 recovery response is, what happens when you give back arginine to a cell that has been lacking it? Does the mtorc1 recovery response allow for these cells to return to a normal state more quickly than a cell that has not had mtorc1 active during the deprivation period? To fully address this question, a multi level approach may be necessary in order to assess the metabolic and signaling changes that occur when arginine is added to cells following prolonged deprivation, either in the presence of Rapamycin or in cells where the recovery response is allowed to occur. It is likely that the cells that undergo the mtorc1 recovery response will have an advantage, either in viability, functionality, or in the general quickness that homeostasis is returned to normal. In addition to questions about the function of the mtorc1 recovery response, questions still remain in regard to the full mechanism of the recovery response. I present data to suggest a role for Akt activation in the mtorc1 recovery response (Figure 2.4, Figure 2.5), however, it does not seem that Akt is solely responsible for the increase in mtorc1 activity 68
80 during the recovery response, as inhibition of Akt does not completely eliminate the response Figure 2.4B). Addition of an SGK1 inhibitor allows for more complete inhibition of the recovery response, however, this also causes a potent decrease in the levels of mtorc1 activity in the absence of arginine starve (Figure 2.8), suggesting that this effect is more general to mtorc1 activation and not specific toward the reactivation phase. Secondly, data from the Rictor KO MEFs also brings question to the model of Akt activation leading to mtorc1 recovery; the Rictor KO MEFs display robust mtorc1 recovery despite having no phosphorylation of Akt at S473 (Figure 2.6). It could be argued that Akt activation through phosphorylation of T308 by PDK is enough to activate Akt and then mtorc1 downstream, however, the WT littermate control cells do not display increased T308 phosphorylation during the recovery response (Figure 2.6), suggesting they are able to induce mtorc1 recovery through Akt independent mechanisms. In considering other mechanisms that may be contributing to the mtorc1 recovery response, several possibilities are immediately discernable. One possibility is that other signaling pathways known to regulate mtorc1 are also being activated in response to arginine or leucine deprivation, and these pathways are able to cause mtorc1 reactivation. I have tested a number of known mtorc1 regulatory pathways (data not shown), none of which have affected the mtorc1 recovery. However, there are a number of stress pathways whose involvement in mtorc1 regulation are not well characterized, which may be worth looking into for their role in the mtorc1 recovery response. However, western blotting for phosphor p38 and JNK, two well known stress kinases (Han et al., 1994; Hibi et al., 1993), did not show any correlations that might explain the mtorc1 recovery response (Figure A 4). Another possibility is that metabolic changes that occur following arginine or leucine withdrawal could be contributing to the recovery. A plot of the fold changes in amino acid 69
81 levels following arginine withdrawal and leucine withdrawal show changes in the levels of most amino acids (Figure A 2, and Figure A 3). It is possible that an increase in the levels of certain amino acids can somehow stand in for the lacking arginine or leucine. Initial experiments with double dropout media (lacking two amino acids, ie. arginine and glutamine, or leucine and glutamine), were unable to block the recovery response (Figure A 4). However, before we can rule out this possibility as a contributor to the mtorc1 recovery response, a more systematic approach needs to be taken, looking at each amino acid, and potentially blocking intracellular synthesis if the amino acids are being generated endogenously. It is worth noting that another group recently published data suggesting that the expression Sestrin2, a sensor of leucine (Chantranupong et al., 2014; Saxton et al., 2016a), is induced by the transcription factor ATF4, downstream of GCN2 activation (Ye et al., 2015). GCN2 is an eif2α kinase which is activated by low levels of amino acids, which it detects by binding uncharged trnas (Wek et al., 1995). Through its induction of ATF4 and Sestrin2, GCN2 is able to decrease mtorc1 activity. However, the authors found that this inhibition was specific to later timepoints, and was necessary for continued suppression of mtorc1, but not the initial decrease in mtorc1 activity. Although the authors do not describe the recovery response per se, their data is consistent with what I see in my experiments. The data published by Ye et al. suggests that the Sestrin2 induction limits the mtorc1 recovery response, but it seems that the recovery response itself is independent of Sestrin2. This study is significant also because it highlights what seems to be a growing theory that mtorc1 regulation by amino acids seems to be biphasic, with acute starvation being signaled to mtorc1 through mechanisms that are quite distinct from longer term starvation. There is some data to suggest that these two phases are regulated by distinct amino acids (Jewell et 70
82 al., 2015), however, more work will need to be done to understand the complexities of this regulation. Rag movement from lysosomes In Chapter 3 of this thesis, I present data showing that RagA proteins move away from their canonical subcellular location, the lysosomal membrane (Figure 3.1) in an mtorc1 independent manner (Figure 3.2). I observe RagA in the nucleus (Figure 3.4), but I am unsure of the potential role for nuclear entry of RagA (Figure 3.5) or Rag movement from the lysosome to any other subcellular location. I summarize my attempts to force the localization of the Rag proteins, which were largely unsuccessful (Figure 3.6). The crystal structure of the Gtr1p Gtr2p heterodimer, the yeast homolog of the RagA/B RagC/D heterodimer has been solved (Gong et al., 2011; Jeong et al., 2012), and may explain some of the difficulties I have faced with my attempts to create an N terminal fusion protein. The structure reveals that the Gtr proteins each consist of two main domains: an N terminal GTPase domain, and a C terminal dimerization domain. The N teminal GTPase domains undergo structural rearrangements following GTP hydrolysis which regulates binding to Raptor, and the C terminal domain seems to be important for both heterodimerization and localization to the lysosome through interactions with the Ragulator complex (Gong et al., 2011; Jeong et al., 2012). The architecture of these proteins suggests that their orientation is extremely important for their ability to function, and also that both the domains are involved in important interactions. Based on what we can tell from the structure, it may be that the N terminal fusion of RagA with the segment of p18/lamtor1 caused RagA to be turned sideways at the membrane, in such a way that it is unable to interact with the Ragulator 71
83 components, and less efficiently bind RagC/D or Raptor. In terms of allowing for proper orientation of the heterodimer, it does seem that a perhaps less invasive approach would be C terminal modification. However, C terminal modification of either RagA/B or RagC/D may block the ability of the Ragulator complex to bind the heterodimer, which would cause RagA/B to be inhibited due to lack of GEF activity from Ragulator. The question of where the Rag proteins are going and the function of the movement is still unanswered. There has been data published that substantiates my findings of Rag movement in accordance with GDP/GTP binding (Bar Peled et al., 2012; Sekiguchi et al., 2001), however, a lack of additional reports in this regard suggests that other groups have also encountered difficulty in studying the issue further. Curiously, multiple groups have published data arguing that the Rag GTPases serve functions independent of mtorc1 regulation, and it seems that these functions are related to lysosomal function (Kim et al., 2014; Shen et al., 2016). Part of this phenotype is likely due to the downregulation of mtorc1 and the subsequent upregulation of lysosomal biogenesis genes through TFEB (Peña Llopis et al., 2011; Settembre et al., 2011, 2012; Yu et al., 2010), however, this does not explain the entire phenotype for Rag loss. Rather, it seems that Rag mutation allows for normal autophagy initiation, but defects in lysosomal acidification and degradation (Kim et al., 2014; Shen et al., 2016). In my attempts to understand Rag localization changes, I did some IF experiments looking at the localization of RagA and RagC compared to Rheb. These experiments were technically challenging, partially due to the fixation required prior to immunostaining, which would often lead to a fuzzy, unclear staining pattern of Rheb and Rags. However, in some experiments, as shown in Figure A 5, we were able to obtain a clearer view of the localization pattern. Although it is not clear whether RagA or RagC colocalization with Rheb increases following amino acid stimulation, it does appear that the Rags move to 72
84 another endomembrane structure in the amino acid stimulation condition, and not simply diffuse away from the lysosome. It is possible that these structures are tubules involved in autophagic lysosome reformation or another process that is involved in maintenance of lysosomal function. Future studies with additional cellular markers may help identify the structures to where Rags are relocalizing, and may help determine whether the function of the Rag movement may be in lysosomal function or in mtorc1 signaling, or another possibility altogether. 73
85 Chapter 5 Materials and methods
86 Materials and Methods Cell culture and transfections All cell lines were cultured in DMEM supplemented with 10% fetal bovine serum (FBS) (Sigma Aldrich) at 37 C with 5% CO 2. TSC2 / mouse embryonic fibroblasts (MEFs) lacking p53 (p53 / ) and littermate control MEFs were a generous gift from Dr. David Kwiatkowski (Brigham and Women s Hospital, Boston, MA). In most experiments, except those experiments done side by side with knockout (KO) MEFs described below, the littermate controls to the TSC2 / MEFs were used as wild type (WT) MEFs. ATG5+/+ and ATG5 / MEFs were obtained from Dr. N. Mizushima. The Akt1/Akt2 double knockout (DKO) MEFs and littermate controls were kindly provided by Dr. M. Birnbaum. 293A RagA and RagB CRISPR/Cas9 knock out cells and 293A control cells were a kind gift from Dr. K L Guan (University of California, San Diego). Rictor KO MEFs and littermate controls were a kind gift of Dr. David Sabatini (MIT). sirnas targeted against Akt3 and negative control were purchased from Sigma Aldrich: SASI_Mm01_ (Akt3 #1) and SASI_Mm01_ (Akt3 #2) and SIC001 (Mission sirna Universal Negative Control). sirna used for RagA knockdown and control were purchased from Qiagen: #SI (Mm_Rraga_2), #SI (Mm_Rraga_3), and # (AllStars Neg. Control sirna). sirna transfections were performed with lipofectamine RNAiMax (LifeTechnologies). Amino acid deprivations and stimulations Cells were plated two days prior to harvesting, with cell confluency for western blot experiments being around 90% at time of harvest. To avoid cell detachment during media changes, 20 µg/ml fibronectin (Corning #356009) in phosphate buffered saline (PBS) was added to the dish for 1 hr prior to cell plating. Medias used for amino acid deprivations 75
87 in Chapter 2 were purchased from the Memorial Sloan Kettering Cancer Center Media Core (New York, NY), formulated as normal high glucose (4.5 g/l) DMEM (exact formulation can be found on the ThermoFisher website), lacking only the indicated amino acid. Medias used for amino acid deprivations in Chapter 3 were made by hand according to the same DMEM formulation mentioned above. Amino acid deficient medias were supplemented with 10% dialyzed FBS (dfbs) (Sigma Aldrich) instead of normal FBS to avoid inadvertently adding amino acids to the media. During amino acid deprivation experiments, except where indicated differently, experimental conditions specified as 0 starves were placed in complete amino acid media, also purchased from the Sloan Kettering Media Core and supplemented with dfbs, for the same duration as the longest deprivation condition in the given experiment. Experimental conditions with intermediate length amino acid deprivations (for example, 45 or 3hr) were treated as the 0 starve conditions until the beginning of the indicated starve, at which point they were placed in the indicated starve media. Unless indicated otherwise, for experiments in Chapter 2, all conditions received fresh media with fresh dfbs at each time point. For amino acid stimulations performed in Chapter 3, stimulations were either performed by changing the media to full amino acid media, or by adding the appropriate amount of a 50x stock solution of amino acids made by hand according to the formulation of DMEM. Unless indicated otherwise, stimulations were performed such that the total treatment (starvation + stimulation) lasted 2 hours, with the starvation time being appropriately shortened based on the length of the stimulation. Antibodies and reagents The following antibodies were purchased from Cell Signaling Technologies: p 4E BP1 S65 (#9451), p S6K1 T389 (#9234), S6K1 (#2708), mtor (#2983), p TSC2 T
88 (#3611), p Akt T308 (#13038), p Akt S473 (#4060), p ULK S757 (#6888), 4E BP1 (#9644), LC3B (#3868), ubiquitin (#3933), ATG5 (#12994), Akt1 (#2983), Akt2 (#3063), Akt3 (#14982), pan Akt (#4691), p GSK3β S9 (#9336), p NDRG1 T346 (#5842), RagA/B (#4357), ATF4 (#11815), p PRAS40 T246 (#2997), p Tyr (#8954), RagC (CST 3360), LAMTOR1/p18 (CST 8975), and LAMTOR3/MP1 (CST 8168). Antibodies to vinculin (V9264), GAPDH (G8795) and FLAG (M2) were purchased from Sigma. The anti puromycin antibody clone 12D10 (MABE343) and p Grb10 S501/S503 ( ) were purchased from EMD Milipore. The HA tag antibody used for western blotting was from Santa Cruz (# 7392), The LAMP1 antibody (#553792) was purchased from BD biosciences. Rapamycin and MG132 were purchased from Calbiochem, MK2206 was purchased from Medchem express, GSK and GDC0941 were purchased from Selleck Chemicals, Chloroquine was purchased from Invitrogen, puromycin and cycloheximide were purchased from Sigma Aldrich. 14g was a kind gift of Dr. Jose Baselga (Memorial Sloan Kettering). Cell Lysis and western blotting Cell lysis was performed on ice following a wash with cold PBS. The lysis buffer contained 10 mm KPO 4, 1mM EDTA, 5 mm EGTA, 10 mm MgCl 2, 0.5% NP 40, 0.1% Brij 35, 0.1% deoxycholate, 1 mm sodium vanadate, 50 mm beta glycerophosphate, 400 um PMSF, 0.02 ug/ul Leupeptin, 0.1 ug/ul pepstatin A, and 0.02 ug/ul aprotinin. Lysates were cleared by centrifugation at 13,000g for 25 minutes at 4 C. Protein concentration of lysates was determined by Bio Rad Protein Assay (Bio Rad). Cellular lysates were run on large SDS PAGE gels overnight and transferred to 0.2 um nitrocellulose membranes at 4 C for at least 4 hours. Membrane blocking was performed with 5% milk in TBST. Primary antibody incubations were 77
89 performed overnight in TBST with 7% BSA. Secondary antibody (HRP from GE healthcare) incubations were performed in 5% milk in TBST at room temperature for 2 hours. Immunoprecipitations 293T cells were transfected with the indicated HA RagA constructs and incubated for 48 hrs. Cells were washed with cold PBS, then harvested in Buffer A (10mM KPO₄, 1.27mM EDTA, 5mM EGTA, 10mM MgCl2, 0.5% Igepal CA 360, 0.1% Brij 35, 1mM Na3VO4, 50 mm β glycerophosphate, 0.4mM PMSF, 0.02μg/μL Leupeptin, 0.01μg/μL Pepstatin A, 0.02μg/μL Aprotinin). Following centrifugation, 90% of lysates were immunoprecipitated with immobilized α HA antibody (Roche Anti HA Affinity Matrix product no ). Immunoprecipitates were washed 3 times with Buffer A, then subjected to 11% SDS PAGE, transferred to nitrocellulose membrane, and subjected to western blotting as described above. Microscopy Glass coverslips (Fisherbrand Microscope Cover Glass CIR. 1) were incubated in 20 µg/ml fibronectin (Corning #356009) in PBS for 1 hr prior to cell plating. Experimental conditions and cell fixation were performed two days after plating. Cells were fixed in 4% formaldehyde in PBS for 10 minutes on ice followed by 25 minutes at room temperature. Cells were washed 3 times with 0.05% saponin in PBS to permeablize. Cells were blocked in a 50/50 mix of odyssey blocking buffer (LI COR Biosciences ) and a 0.05% saponin in PBS solution at 4 C for at least one hour. Primary antibody incubations were performed overnight in a fresh solution of 50/50 odyssey blocking buffer and 0.05% saponin in PBS. mtor (CST #2983), RagA (CST #4357) and RagC (CST #3360) were diluted 1:100, 78
90 LAMP1 (BD biosciences # ) was diluted 1:500, Rheb (Abnova H M01) was diluted 1:1000. Cells were washed three times with the 50/50 solution described above. Alexa Fluor secondary antibodies (purchased from Life Technologies) were diluted 1:1,000 in the 50/50 mix and incubated with the cells for 2 hours with gentle agitation. Cells were washed four times with PBS, the third wash containing Hoechst stain at 1:10,000 (Life Technologies, H3569). Glass coverslips containing the stained cells were mounted on glass slides (VWR ) using Dako fluorescence mounting medium. Images were collected with a Yokagawa CSU X1 spinning disk confocal on a Nikon Ti motorized inverted microscope with a Nikon Plan Apo 60x 1.4 NA at the Nikon imaging center at Harvard Medical School. RagA or mtor labeled with Alexa488 and LAMP1 or Rheb labeled with Alexa568 were excited with a Spectral Applied Research LMM 5 laser merge module with AOTF controlled solid state lasers, 488nm (100mW) and 561nm (100mW), and collected with a 405/491/561/642 Quad mirror, and a 525/50 emission filter (RagA and mtor), or 620/60 emission filter (LAMP1). Hoechst stained nuclei were imaged using a Lumencor SOLA fluorescence light source using a 395/25 excitation filter and collected with a 400lp mirror and a 460/25 emission filter. Images were acquired with a Hamamatsu ORCA AG cooled CCD camera (confocal images of fluorophores labeling RagA, mtor, and LAMP1) and Hamamatsu ORCA R2 cooled CCD camera (widefield images of Hoechst stained nuclei) using MetaMorph image acquisition software. Colocalization quantitiation was performed using Imaris with guidance at the Image and Data Analysis Core (IDAC) at Harvard Medical School. Thresholds were calculated via algorithms described by Costes et al.,
91 Generation of Rag fusion proteins RagA was PCR amplified off of a prk7 backbone using the following primers to simultaneously add the N terminal 20 amino acids of p18 and and HA tag onto RagA (see below for color coding). p18n HA RagA forward primer: 5 GATCCTCGAGATGGGGTGCTGCTACAGCAGCGAGAACGAGGACTCGGACCAGGACCGAGAGG AGCGGAAGTACCCATACGATGTTCCAGATTACGCTATGCCAAATACAGCCATGAAG 3 To create a mutant that is not able to be myristoylated or palmitoylated, the glycine and cysteines following the methionine at the beginning of the p18 segment were mutated to alanine: P18Nmut HA RagA forward primer: 5 GATCCTCGAGATGGCGGCCGCCTACAGCAGCGAGAACGAGGACTCGGACCAGGACCGAGAGG AGCGGAAGTACCCATACGATGTTCCAGATTACGCTATGCCAAATACAGCCATGAAG 3 For generation of both p18n HA RagA and p18nmut HA RagA, the following reverse primer was used: 5 GCGGCCGCTCAACGCATAAGGAGACTGTG 3 Extra bases for efficient restriction digestion XhoI restriction site N terminal 20 amino acids of p18 (purple indicates mutation to alanine) HA tag RagA NotI restriction site 80
92 The PCR products were digested with XhoI and NotI and ligated into a plpcx vector digested with the same enzymes. Constructs were sequence verified. The FLAG tagged RagB constructs were previously described (Kim et al., 2013b). To create a version of RagA fused to the C terminal 15 amino acids of Rheb (containing the CAAX motif), I used the following reverse primer: RagA reverse primer: 5 GATCATCGATTCACATCACCGAGCATGAAGACTTGCCTTGTGAAGCTGCCCCGTCCATACGCATA AGGAGACTGTGCTT 3 To create a mutant that lacks the cysteine required for modification (mutated to serine) I used the following primer: RagA reverse primer: 5 GATCATCGATTCACATCACCGAGCTTGAAGACTTGCCTTGTGAAGCTGCCCCGTCCATACGCATA AGGAGACTGTGCTT 3 Extra bases for efficient restriction digestion C terminal 15 amino acids of Rheb1, containing the CAAX motif (purple indicates mutation to serine) ClaI site RagA (minus the stop codon) The RagA CAAX and RagA SAAX constructs were cloned into a version of plpcx that had an HA tag pre cloned into the N terminus. A RagA forward primer was designed based on the specific sequence of the modified plpcx vector. 81
93 Generation of stable cell lines Retroviruses were produced using the HEK293 GPG packaging cell line. HEK293 GPG cells were washed with OptiMEM media (Life Technologies ) and transfected with expression constructs using Lipofectamine (Life Technologies). Seven hours following transfection, DMEM with 10% FBS was added to the cells. After 22 hours, media was changed to fresh DMDM with 10% FBS. Starting 3 days after transfection, continuing until 6 days after transfection, supernatant containing the retrovirus was collected and stored at 80 C. Prior to use, virus supernatant was thawed, filtered through a.45 µm filter, and aliquoted into 1 ml Eppendorf tubes, and refrozen at 80 C. Stable MEF cell lines were generated through three rounds of infection with the virus supernatant in the presence of polybrene (Sigma Aldrich H9268 5G) (media was replaced with fresh media containing fresh FBS, polybrene, and virus supernatant every 24 hours). Three days after the initial infection, cells were trypsinized, moved to a larger dish, and 3 µg/ml puromycin was added immediately to select cells. The TSC2 constructs were obtained from Dr. Brendan Manning and were described previously (Menon et al., 2014). Metabolite extraction Cells were washed once with cold PBS on ice, then flash frozen in liquid nitrogen and placed on dry ice. Cells were stored at 80 C. 1.5 ml of 80% methanol was added to each 6 cm plate and cells were incubated at 80 C for 1 hour. Plates were scraped as for cell harvesting and centrifuged at 4 C. The supernatant was dried by vacuum under centrifugation, and the metabolites were resuspended in water and measured via GC MS by the Mass Spectrometry Core at Beth Israel Deaconess Medical Center, Boston, MA
94 SUnSET Translation Assay Cells were deprived of amino acids as indicated above. 10 minutes prior to harvesting cells, 10 ug/ml Puromycin was added to each condition. Cells were harvested and cell lysates were processed for western blotting as described above. Nuclei isolation for flow cytometry Cells from a 10 cm plate were washed in PBS and re suspended in Solution I (10 mm NaCl, 3.4 mm sodium citrate, and 0.03% NP 40) and incubated in the dark for 1 hour. To the cell suspension, 1 ml of Solution II (78 mm citric acid, 250 mm sucrose) was added. Suspensions were spun down for 5 min at 1000 rpm, and a majority of the supernatant was aspirated. Cells were re suspended in the remaining solution and analyzed on a BD Accuri flow cytometer. 83
95 Appendix A Supplemental figures 84
96 Figure A 1 Rapamycin induces a large nuclei phenotype under arginine deprivation conditions. MEFs were deprived of arginine for 72 hours. At 45 of starvation, either DMSO or 20 nm Rapamycin was added to the media to block mtorc1 reactivation. Nuclei were isolated and nuclei size was analyzed via flow cytometry with the assistance of my colleague, Tanya Schild. The plot shown is a representative set of samples performed in triplicate. Figure A 2 Amino acid levels following arginine removal. WT MEFs were deprived of arginine for 0 minutes, 45 minutes, 3 hr, or 6 hr, and intracellular metabolite levels were analyzed via mass spectrometry. The graph shows the results of a representative experiment performed a total of 4 times. 85
97 Figure A 3 Amino acid levels following leucine removal. WT MEFs were deprived of arginine for 0 minutes, 45 minutes, 3 hr, or 6 hr, and intracellular metabolite levels were analyzed via mass spectrometry. The graph shows the results of a representative experiment performed a total of 4 times. 86

98 Figure A 4 mtorc1 recovery cannot be blocked through additional deprivation of glutamine. WT MEFs were deprived of arginine, leucine, glutamine, or glucose either singly or in the combinations shown. 87

99 Figure A 5 Rags appear to be shifting from lysosomes to another endo membrane structure. MEFs starved of amino acids or starved and then stimulated with amino acids were fixed and stained with the indicated antibodies, and were imaged by confocal microscopy. 88
A particular set of insults induces apoptosis (part 1), which, if inhibited, can switch to autophagy. At least in some cellular settings, autophagy se
, which, if inhibited, can switch to autophagy. At least in some cellular settings, autophagy se") A particular set of insults induces apoptosis (part 1), which, if inhibited, can switch to autophagy. At least in some cellular settings, autophagy serves as a defence mechanism that prevents or retards
A particular set of insults induces apoptosis (part 1), which, if inhibited, can switch to autophagy. At least in some cellular settings, autophagy serves as a defence mechanism that prevents or retards
PREPARED FOR: U.S. Army Medical Research and Materiel Command Fort Detrick, Maryland
 AD Award Number: W81XWH-09-1-0279 TITLE: Regulation of mtor by Nutrients PRINCIPAL INVESTIGATOR: Kun-Liang Guan CONTRACTING ORGANIZATION: University of San Diego La Jolla, CA 92093 REPORT DATE: July 2010
Receptor mediated Signal Transduction
 Receptor mediated Signal Transduction G-protein-linked receptors adenylyl cyclase camp PKA Organization of receptor protein-tyrosine kinases From G.M. Cooper, The Cell. A molecular approach, 2004, third
Signal Transduction Cascades
 Signal Transduction Cascades Contents of this page: Kinases & phosphatases Protein Kinase A (camp-dependent protein kinase) G-protein signal cascade Structure of G-proteins Small GTP-binding proteins,
Cell Signaling part 2
 15 Cell Signaling part 2 Functions of Cell Surface Receptors Other cell surface receptors are directly linked to intracellular enzymes. The largest family of these is the receptor protein tyrosine kinases,
KEY CONCEPT QUESTIONS IN SIGNAL TRANSDUCTION
 Signal Transduction - Part 2 Key Concepts - Receptor tyrosine kinases control cell metabolism and proliferation Growth factor signaling through Ras Mutated cell signaling genes in cancer cells are called
The elements of G protein-coupled receptor systems
 The elements of G protein-coupled receptor systems Prostaglandines Sphingosine 1-phosphate a receptor that contains 7 membrane-spanning domains a coupled trimeric G protein which functions as a switch
Enzyme-coupled Receptors. Cell-surface receptors 1. Ion-channel-coupled receptors 2. G-protein-coupled receptors 3. Enzyme-coupled receptors
 Enzyme-coupled Receptors Cell-surface receptors 1. Ion-channel-coupled receptors 2. G-protein-coupled receptors 3. Enzyme-coupled receptors Cell-surface receptors allow a flow of ions across the plasma
Signal Transduction: G-Protein Coupled Receptors
 Signal Transduction: G-Protein Coupled Receptors Federle, M. (2017). Lectures 4-5: Signal Transduction parts 1&2: nuclear receptors and GPCRs. Lecture presented at PHAR 423 Lecture in UIC College of Pharmacy,
mtor Signaling in Growth Control and Disease
 Leading Edge Review mtor Signaling in Growth Control and Disease Mathieu Laplante 1,2,3,4 and David M. Sabatini 1,2,3, * 1 Whitehead Institute for Biomedical Research, Nine Cambridge Center, Cambridge,
Regulation of the mtor Complex 1 Pathway by Nutrients, Growth Factors, and Stress
 Regulation of the mtor Complex 1 Pathway by Nutrients, Growth Factors, and Stress The MIT Faculty has made this article openly available. Please share how this access benefits you. Your story matters.
Lipids and Membranes
 Lipids and Membranes Presented by Dr. Mohammad Saadeh The requirements for the Pharmaceutical Biochemistry I Philadelphia University Faculty of pharmacy Membrane transport D. Endocytosis and Exocytosis
Chapter 15: Signal transduction
 Chapter 15: Signal transduction Know the terminology: Enzyme-linked receptor, G-protein linked receptor, nuclear hormone receptor, G-protein, adaptor protein, scaffolding protein, SH2 domain, MAPK, Ras,
FACTORS AFFECTING SKELETAL MUSCLE PROTEIN SYNTHESIS IN THE HORSE
 University of Kentucky UKnowledge Theses and Dissertations--Animal and Food Sciences Animal and Food Sciences 2011 FACTORS AFFECTING SKELETAL MUSCLE PROTEIN SYNTHESIS IN THE HORSE Ashley Leigh Wagner University
Cell Quality Control. Peter Takizawa Department of Cell Biology
 Cell Quality Control Peter Takizawa Department of Cell Biology Cellular quality control reduces production of defective proteins. Cells have many quality control systems to ensure that cell does not build
CONTRACTING ORGANIZATION: University of California, San Diego La Jolla, CA
 AWARD NUMBER: W81XWH-13-1-0055 TITLE: Crosstalk between mtorc1 and camp Signaling PRINCIPAL INVESTIGATOR: Kun-Liang Guan CONTRACTING ORGANIZATION: University of California, San Diego La Jolla, CA 92093-0621
Chapter 9. Cellular Signaling
 Chapter 9 Cellular Signaling Cellular Messaging Page 215 Cells can signal to each other and interpret the signals they receive from other cells and the environment Signals are most often chemicals The
Tala Saleh. Ahmad Attari. Mamoun Ahram
 23 Tala Saleh Ahmad Attari Minna Mushtaha Mamoun Ahram In the previous lecture, we discussed the mechanisms of regulating enzymes through inhibitors. Now, we will start this lecture by discussing regulation
Signal Transduction Pathways. Part 2
 Signal Transduction Pathways Part 2 GPCRs G-protein coupled receptors > 700 GPCRs in humans Mediate responses to senses taste, smell, sight ~ 1000 GPCRs mediate sense of smell in mouse Half of all known
Enzymes Part III: regulation II. Dr. Mamoun Ahram Summer, 2017
 Enzymes Part III: regulation II Dr. Mamoun Ahram Summer, 2017 Advantage This is a major mechanism for rapid and transient regulation of enzyme activity. A most common mechanism is enzyme phosphorylation
G-Protein Signaling. Introduction to intracellular signaling. Dr. SARRAY Sameh, Ph.D
 G-Protein Signaling Introduction to intracellular signaling Dr. SARRAY Sameh, Ph.D Cell signaling Cells communicate via extracellular signaling molecules (Hormones, growth factors and neurotransmitters
Biol403 MAP kinase signalling
 Biol403 MAP kinase signalling The mitogen activated protein kinase (MAPK) pathway is a signalling cascade activated by a diverse range of effectors. The cascade regulates many cellular activities including
RAS Genes. The ras superfamily of genes encodes small GTP binding proteins that are responsible for the regulation of many cellular processes.
 ۱ RAS Genes The ras superfamily of genes encodes small GTP binding proteins that are responsible for the regulation of many cellular processes. Oncogenic ras genes in human cells include H ras, N ras,
THE IMPACT OF MTOR, TFEB AND BID ON NON-ALCOHOLIC FATTY LIVER DISEASE AND METABOLIC SYNDROME
 THE IMPACT OF MTOR, TFEB AND BID ON NON-ALCOHOLIC FATTY LIVER DISEASE AND METABOLIC SYNDROME Hao Zhang Submitted to the faculty of the University Graduate School in partial fulfillment of the requirements
Sestrin2 is a leucine sensor for the mtorc1 pathway
 Sestrin2 is a leucine sensor for the mtorc1 pathway The MIT Faculty has made this article openly available. Please share how this access benefits you. Your story matters. Citation Wolfson, R. L., L. Chantranupong,
Propagation of the Signal
 OpenStax-CNX module: m44452 1 Propagation of the Signal OpenStax College This work is produced by OpenStax-CNX and licensed under the Creative Commons Attribution License 3.0 By the end of this section,
Amino acids and mtorc1: from lysosomes to disease
 Review Amino acids and mtorc1: from lysosomes to disease Alejo Efeyan 1,2,3,4*, Roberto Zoncu 1,2,3,4* and David M. Sabatini 1,2,3,4,5 1 Whitehead Institute for Biomedical Research, Nine Cambridge Center,
Principles of Genetics and Molecular Biology
 Cell signaling Dr. Diala Abu-Hassan, DDS, PhD School of Medicine Dr.abuhassand@gmail.com Principles of Genetics and Molecular Biology www.cs.montana.edu Modes of cell signaling Direct interaction of a
Lecture 15. Signal Transduction Pathways - Introduction
 Lecture 15 Signal Transduction Pathways - Introduction So far.. Regulation of mrna synthesis Regulation of rrna synthesis Regulation of trna & 5S rrna synthesis Regulation of gene expression by signals
Signaling Through Immune System Receptors (Ch. 7)
") Signaling Through Immune System Receptors (Ch. 7) 1. General principles of signal transduction and propagation. 2. Antigen receptor signaling and lymphocyte activation. 3. Other receptors and signaling
Signaling Through Immune System Receptors (Ch. 7) 1. General principles of signal transduction and propagation. 2. Antigen receptor signaling and lymphocyte activation. 3. Other receptors and signaling
Regulation of TORC1 in Response to Amino Acid Starvation via Lysosomal Recruitment of TSC2
 Regulation of TORC1 in Response to Amino Acid Starvation via Lysosomal Recruitment of TSC2 Constantinos Demetriades, 1, * Nikolaos Doumpas, 1 and Aurelio A. Teleman 1, * 1 German Cancer Research Center
A Tumor Suppressor Complex with GAP Activity for the Rag GTPases That Signal Amino Acid Sufficiency to mtorc1
 A Tumor Suppressor Complex with GAP Activity for the Rag GTPases That Signal Amino Acid Sufficiency to mtorc1 The MIT Faculty has made this article openly available. Please share how this access benefits
Signaling. Dr. Sujata Persad Katz Group Centre for Pharmacy & Health research
 Signaling Dr. Sujata Persad 3-020 Katz Group Centre for Pharmacy & Health research E-mail:sujata.persad@ualberta.ca 1 Growth Factor Receptors and Other Signaling Pathways What we will cover today: How
Cellular Signaling Pathways. Signaling Overview
 Cellular Signaling Pathways Signaling Overview Signaling steps Synthesis and release of signaling molecules (ligands) by the signaling cell. Transport of the signal to the target cell Detection of the
The PI3K/AKT axis. Dr. Lucio Crinò Medical Oncology Division Azienda Ospedaliera-Perugia. Introduction
 The PI3K/AKT axis Dr. Lucio Crinò Medical Oncology Division Azienda Ospedaliera-Perugia Introduction Phosphoinositide 3-kinase (PI3K) pathway are a family of lipid kinases discovered in 1980s. They have
MOLECULAR CELL BIOLOGY
 1 Lodish Berk Kaiser Krieger scott Bretscher Ploegh Matsudaira MOLECULAR CELL BIOLOGY SEVENTH EDITION CHAPTER 13 Moving Proteins into Membranes and Organelles Copyright 2013 by W. H. Freeman and Company
It has long been appreciated that in addition
 RESEARCH RESEARCH ARTICLES METABOLISM Sestrin2 is a leucine sensor for the mtorc1 pathway Rachel L. Wolfson, 1,2,3,4 * Lynne Chantranupong, 1,2,3,4 * Robert A. Saxton, 1,2,3,4 Kuang Shen, 1,2,3,4 Sonia
Expanding mtor signaling
 666 REVIEW Cell Research (2007) 17:666-681. 2007 IBCB, SIBS, CAS All rights reserved 1001-0602/07 $ 30.00 www.nature.com/cr Qian Yang 1,2, Kun-Liang Guan 1,2,3 1 Life Sciences Institute; 2 Department of
mtor: a pharmacologic target for autophagy regulation
 The Journal of Clinical Investigation mtor: a pharmacologic target for autophagy regulation Young Chul Kim and Kun-Liang Guan Department of Pharmacology and Moores Cancer Center, UCSD, La Jolla, California,
Growth and Differentiation Phosphorylation Sampler Kit
 Growth and Differentiation Phosphorylation Sampler Kit E 0 5 1 0 1 4 Kits Includes Cat. Quantity Application Reactivity Source Akt (Phospho-Ser473) E011054-1 50μg/50μl IHC, WB Human, Mouse, Rat Rabbit
SUPPLEMENTARY INFORMATION
 doi:10.1038/nature22314 Supplementary Discussion In mammals, BCAAs are essential amino acids that must be supplied from food. These dietary BCAAs are subsequently used for protein synthesis or are catabolized
1. Activated receptor tyrosine kinases (RTKs) phosphorylates themselves
 phosphorylates themselves") Enzyme-coupled receptors Transmembrane proteins Ligand-binding domain on the outer surface Cytoplasmic domain acts as an enzyme itself or forms a complex with enzyme 1. Activated receptor tyrosine kinases
Enzyme-coupled receptors Transmembrane proteins Ligand-binding domain on the outer surface Cytoplasmic domain acts as an enzyme itself or forms a complex with enzyme 1. Activated receptor tyrosine kinases
Lecture: CHAPTER 13 Signal Transduction Pathways
 Lecture: 10 17 2016 CHAPTER 13 Signal Transduction Pathways Chapter 13 Outline Signal transduction cascades have many components in common: 1. Release of a primary message as a response to a physiological
eif4a inactivates TORC1 in response to amino acid starvation
 Article eif4a inactivates TORC1 in response to amino acid starvation Foivos-Filippos Tsokanos 1,, Marie-Astrid Albert 1,, Constantinos Demetriades 1,, Kerstin Spirohn 2, Michael Boutros 2 & Aurelio A Teleman
Regulation of cell function by intracellular signaling
 Regulation of cell function by intracellular signaling Objectives: Regulation principle Allosteric and covalent mechanisms, Popular second messengers, Protein kinases, Kinase cascade and interaction. regulation
DISRUPTION OF BRANCHED-CHAIN AMINO ACID CATABOLISM IMPAIRS RAT MYOBLAST SURVIVAL AND DIFFERENTIATION ZAMEER N. DHANANI
 DISRUPTION OF BRANCHED-CHAIN AMINO ACID CATABOLISM IMPAIRS RAT MYOBLAST SURVIVAL AND DIFFERENTIATION ZAMEER N. DHANANI A thesis submitted to the Faculty of Graduate Studies in partial fulfillment of the
Amino acids and mtorc1: from lysosomes to disease
 Amino acids and mtorc1: from lysosomes to disease The MIT Faculty has made this article openly available. Please share how this access benefits you. Your story matters. Citation As Published Publisher
Practice Exam 2 MCBII
 1. Which feature is true for signal sequences and for stop transfer transmembrane domains (4 pts)? A. They are both 20 hydrophobic amino acids long. B. They are both found at the N-terminus of the protein.
The role of amino acid-induced mammalian target of rapamycin complex 1(mTORC1) signaling in insulin resistance
 signaling in insulin resistance") OPEN (2016) 48, e201; doi:10.1038/emm.2015.93 & 2016 KSBMB. All rights reserved 2092-6413/16 www.nature.com/emm REVIEW The role of amino acid-induced mammalian target of rapamycin complex 1(mTORC1) signaling
OPEN (2016) 48, e201; doi:10.1038/emm.2015.93 & 2016 KSBMB. All rights reserved 2092-6413/16 www.nature.com/emm REVIEW The role of amino acid-induced mammalian target of rapamycin complex 1(mTORC1) signaling
Chapter 11. Cell Communication
 Chapter 11 Cell Communication Overview: The Cellular Internet Cell-to-cell communication Is absolutely essential for multicellular organisms Concept 11.1: External signals are converted into responses
Chapter 20. Cell - Cell Signaling: Hormones and Receptors. Three general types of extracellular signaling. endocrine signaling. paracrine signaling
 Chapter 20 Cell - Cell Signaling: Hormones and Receptors Three general types of extracellular signaling endocrine signaling paracrine signaling autocrine signaling Endocrine Signaling - signaling molecules
REGULATION OF ENZYME ACTIVITY. Medical Biochemistry, Lecture 25
 REGULATION OF ENZYME ACTIVITY Medical Biochemistry, Lecture 25 Lecture 25, Outline General properties of enzyme regulation Regulation of enzyme concentrations Allosteric enzymes and feedback inhibition
The expanding role of mtor in cancer cell growth and proliferation
 Mutagenesis, 2015, 30, 169 176 doi:10.1093/mutage/geu045 Review Review The expanding role of mtor in cancer cell growth and proliferation Marie Cargnello 1, Joseph Tcherkezian 2 and Philippe P. Roux 1,3,
Cell Communication. Chapter 11. PowerPoint Lectures for Biology, Seventh Edition. Lectures by Chris Romero. Neil Campbell and Jane Reece
 Chapter 11 Cell Communication PowerPoint Lectures for Biology, Seventh Edition Neil Campbell and Jane Reece Lectures by Chris Romero Overview: The Cellular Internet Cell-to-cell communication Is absolutely
BIOL 4374/BCHS 4313 Cell Biology Exam #1 February 13, 2001
 BIOL 4374/BCHS 4313 Cell Biology Exam #1 February 13, 2001 SS# Name This exam is worth a total of 100 points. The number of points each question is worth is shown in parentheses. Good luck! 1. (2) The
Lecture #27 Lecturer A. N. Koval
 Lecture #27 Lecturer A. N. Koval Hormones Transduce Signals to Affect Homeostatic Mechanisms Koval A. (C), 2011 2 Lipophilic hormones Classifying hormones into hydrophilic and lipophilic molecules indicates
Molecular Bioscience 401: Lecture 11.1 Cell Signaling. Slide #1
 Molecular Bioscience 401: Lecture 11.1 Cell Signaling Slide #1 Cell Communication Necessary for multicellular organisms Unlike unicellular organisms, multicellular Organisms require elaborate cell communication
Cell Biology Lecture 9 Notes Basic Principles of cell signaling and GPCR system
 Cell Biology Lecture 9 Notes Basic Principles of cell signaling and GPCR system Basic Elements of cell signaling: Signal or signaling molecule (ligand, first messenger) o Small molecules (epinephrine,
mtor Function and Therapeutic Targeting in Breast Cancer Stephen H Hare and Amanda J Harvey*
 mtor Function and Therapeutic Targeting in Breast Cancer Stephen H Hare and Amanda J Harvey* Institute for Environment Health and Societies, Brunel University London, Uxbridge, UB8 3PH, United Kingdom.
Evidence for an Alternative Glycolytic Pathway in Rapidly Proliferating Cells. Matthew G. Vander Heiden, et al. Science 2010
 Evidence for an Alternative Glycolytic Pathway in Rapidly Proliferating Cells Matthew G. Vander Heiden, et al. Science 2010 Introduction The Warburg Effect Cancer cells metabolize glucose differently Primarily
Cellular Physiology (PHSI3009) Contents:
 Contents:") Cellular Physiology (PHSI3009) Contents: Cell membranes and communication 2 nd messenger systems G-coupled protein signalling Calcium signalling Small G-protein signalling o RAS o MAPK o PI3K RHO GTPases
Cellular Physiology (PHSI3009) Contents: Cell membranes and communication 2 nd messenger systems G-coupled protein signalling Calcium signalling Small G-protein signalling o RAS o MAPK o PI3K RHO GTPases
Homework Hanson section MCB Course, Fall 2014
 Homework Hanson section MCB Course, Fall 2014 (1) Antitrypsin, which inhibits certain proteases, is normally secreted into the bloodstream by liver cells. Antitrypsin is absent from the bloodstream of
The Tissue Engineer s Toolkit
 The Tissue Engineer s Toolkit Stimuli Detection and Response Ken Webb, Ph. D. Assistant Professor Dept. of Bioengineering Clemson University Environmental Stimulus-Cellular Response Environmental Stimuli
Signal Transduction I
 Signal Transduction I Prof. Tianhua Zhou Department of Cell Biology Zhejiang University School of Medicine Office hours by appointment tzhou@zju.edu.cn Signal transduction: Key contents for signal transduction:
Mechanisms of Hormone Action
 Mechanisms of Hormone Action General principles: 1. Signals act over different ranges. 2. Signals have different chemical natures. 3. The same signal can induce a different response in different cells.
NIH Public Access Author Manuscript Science. Author manuscript; available in PMC 2013 September 15.
 NIH Public Access Author Manuscript Published in final edited form as: Science. 2013 March 15; 339(6125): 1323 1328. doi:10.1126/science.1228792. Stimulation of de novo pyrimidine synthesis by growth signaling
MCB*4010 Midterm Exam / Winter 2008
 MCB*4010 Midterm Exam / Winter 2008 Name: ID: Instructions: Answer all 4 questions. The number of marks for each question indicates how many points you need to provide. Write your answers in point form,
Cell Communication. Chapter 11. Biology Eighth Edition Neil Campbell and Jane Reece. PowerPoint Lecture Presentations for
 Chapter 11 Cell Communication PowerPoint Lecture Presentations for Biology Eighth Edition Neil Campbell and Jane Reece Lectures by Chris Romero, updated by Erin Barley with contributions from Joan Sharp
Molecular Cell Biology - Problem Drill 19: Cell Signaling Pathways and Gene Expression
 Molecular Cell Biology - Problem Drill 19: Cell Signaling Pathways and Gene Expression Question No. 1 of 10 1. Which statement about cell signaling is correct? Question #1 (A) Cell signaling involves receiving
Molecular Cell Biology Problem Drill 16: Intracellular Compartment and Protein Sorting
 Molecular Cell Biology Problem Drill 16: Intracellular Compartment and Protein Sorting Question No. 1 of 10 Question 1. Which of the following statements about the nucleus is correct? Question #01 A. The
Ras and Cell Signaling Exercise
 Ras and Cell Signaling Exercise Learning Objectives In this exercise, you will use, a protein 3D- viewer, to explore: the structure of the Ras protein the active and inactive state of Ras and the amino
1. to understand how proteins find their destination in prokaryotic and eukaryotic cells 2. to know how proteins are bio-recycled
 Protein Targeting Objectives 1. to understand how proteins find their destination in prokaryotic and eukaryotic cells 2. to know how proteins are bio-recycled As a protein is being synthesized, decisions
Critical Review. What Controls TOR? Estela Jacinto Department of Physiology and Biophysics, UMDNJ-Robert Wood Johnson Medical School, Piscataway, NJ
 IUBMB Life, 60(8): 483 496, August 2008 Critical Review What Controls TOR? Estela Jacinto Department of Physiology and Biophysics, UMDNJ-Robert Wood Johnson Medical School, Piscataway, NJ Summary The target
1- Which of the following statements is TRUE in regards to eukaryotic and prokaryotic cells?
 Name: NetID: Exam 3 - Version 1 October 23, 2017 Dr. A. Pimentel Each question has a value of 4 points and there are a total of 160 points in the exam. However, the maximum score of this exam will be capped
Life Science 1A Final Exam. January 19, 2006
 ame: TF: Section Time Life Science 1A Final Exam January 19, 2006 Please write legibly in the space provided below each question. You may not use calculators on this exam. We prefer that you use non-erasable
Molecular mechanisms of metabolic regulation by insulin in Drosophila
 Biochem. J. (2010) 425, 13 26 (Printed in Great Britain) doi:10.1042/bj20091181 13 REVIEW ARTICLE Molecular mechanisms of metabolic regulation by insulin in Drosophila Aurelio A. TELEMAN 1 German Cancer
SUPPLEMENTARY INFORMATION
 doi:.38/nature234 Note 1. LINC00961 encodes a lysosomal Type I transmembrane polypeptide In order to determine if the polypeptide encoded by LINC00961 was an integral membrane protein or simply associated
Branched-Chain Amino Acids: Metabolism, Physiological Function, and Application
 Branched-Chain Amino Acids: Metabolism, Physiological Function, and Application Signaling Pathways and Molecular Mechanisms through which Branched-Chain Amino Acids Mediate Translational Control of Protein
Biol220 Cell Signalling Cyclic AMP the classical secondary messenger
 Biol220 Cell Signalling Cyclic AMP the classical secondary messenger The classical secondary messenger model of intracellular signalling A cell surface receptor binds the signal molecule (the primary
Principles of cell signaling Lecture 4
 Principles of cell signaling Lecture 4 Johan Lennartsson Molecular Cell Biology (1BG320), 2014 Johan.Lennartsson@licr.uu.se 1 Receptor tyrosine kinase-induced signal transduction Erk MAP kinase pathway
Cell Injury MECHANISMS OF CELL INJURY
 Cell Injury MECHANISMS OF CELL INJURY The cellular response to injurious stimuli depends on the following factors: Type of injury, Its duration, and Its severity. Thus, low doses of toxins or a brief duration
Metabolism. Metabolic pathways. BIO 5099: Molecular Biology for Computer Scientists (et al) Lecture 11: Metabolic Pathways
 Lecture 11: Metabolic Pathways") BIO 5099: Molecular Biology for Computer Scientists (et al) Lecture 11: Metabolic Pathways http://compbio.uchsc.edu/hunter/bio5099 Larry.Hunter@uchsc.edu Metabolism Metabolism is the chemical change of
BIO 5099: Molecular Biology for Computer Scientists (et al) Lecture 11: Metabolic Pathways http://compbio.uchsc.edu/hunter/bio5099 Larry.Hunter@uchsc.edu Metabolism Metabolism is the chemical change of
Molecular Biology (BIOL 4320) Exam #2 May 3, 2004
 Exam #2 May 3, 2004") Molecular Biology (BIOL 4320) Exam #2 May 3, 2004 Name SS# This exam is worth a total of 100 points. The number of points each question is worth is shown in parentheses after the question number. Good
Molecular Biology (BIOL 4320) Exam #2 May 3, 2004 Name SS# This exam is worth a total of 100 points. The number of points each question is worth is shown in parentheses after the question number. Good
Chapter 10. Regulatory Strategy
 Chapter 10 Regulatory Strategy Regulation of enzymatic activity: 1. Allosteric Control. Allosteric proteins have a regulatory site(s) and multiple functional sites Activity of proteins is regulated by
Effects of Second Messengers
 Effects of Second Messengers Inositol trisphosphate Diacylglycerol Opens Calcium Channels Binding to IP 3 -gated Channel Cooperative binding Activates Protein Kinase C is required Phosphorylation of many
CELLS. Cells. Basic unit of life (except virus)
") Basic unit of life (except virus) CELLS Prokaryotic, w/o nucleus, bacteria Eukaryotic, w/ nucleus Various cell types specialized for particular function. Differentiation. Over 200 human cell types 56%
Basic unit of life (except virus) CELLS Prokaryotic, w/o nucleus, bacteria Eukaryotic, w/ nucleus Various cell types specialized for particular function. Differentiation. Over 200 human cell types 56%
Target of rapamycin (TOR): an integrator of nutrient and growth factor signals and coordinator of cell growth and cell cycle progression
: an integrator of nutrient and growth factor signals and coordinator of cell growth and cell cycle progression") (2004) 23, 3151 3171 & 2004 Nature Publishing Group All rights reserved 0950-9232/04 $25.00 www.nature.com/onc Target of rapamycin (TOR): an integrator of nutrient and growth factor signals and coordinator
(2004) 23, 3151 3171 & 2004 Nature Publishing Group All rights reserved 0950-9232/04 $25.00 www.nature.com/onc Target of rapamycin (TOR): an integrator of nutrient and growth factor signals and coordinator
General Principles of Endocrine Physiology
 General Principles of Endocrine Physiology By Dr. Isabel S.S. Hwang Department of Physiology Faculty of Medicine University of Hong Kong The major human endocrine glands Endocrine glands and hormones
Revision. camp pathway
 االله الرحمن الرحيم بسم Revision camp pathway camp pathway Revision camp pathway Adenylate cyclase Adenylate Cyclase enzyme Adenylate cyclase catalyses the formation of camp from ATP. Stimulation or inhibition
Lecture 6: Allosteric regulation of enzymes
 Chem*3560 Lecture 6: Allosteric regulation of enzymes Metabolic pathways do not run on a continuous basis, but are regulated according to need Catabolic pathways run if there is demand for ATP; for example
Eukaryotic Initiation Factor 2 Phosphorylation and Translational Control in Metabolism 1,2
 Thematic Review Series: Nutrient Control of Metabolism and Cell Signaling Eukaryotic Initiation Factor 2 Phosphorylation and Translational Control in Metabolism 1,2 Thomas D. Baird and Ronald C. Wek* Department
Zool 3200: Cell Biology Exam 1 1/30/15
 Name: TRASK Zool 3200: Cell Biology Exam 1 1/30/15 Answer each of the following short- and long- answer questions in the space provided; circle the BEST answer or answers for each of the multiple choice
PHSI3009 Frontiers in Cellular Physiology 2017
 Overview of PHSI3009 L2 Cell membrane and Principles of cell communication L3 Signalling via G protein-coupled receptor L4 Calcium Signalling L5 Signalling via Growth Factors L6 Signalling via small G-protein
BIOLOGY. Cell Communication CAMPBELL. Reece Urry Cain Wasserman Minorsky Jackson. Lecture Presentation by Nicole Tunbridge and Kathleen Fitzpatrick
 CAMPBELL BIOLOGY TENTH EDITION Reece Urry Cain Wasserman Minorsky Jackson 11 Cell Communication Lecture Presentation by Nicole Tunbridge and Kathleen Fitzpatrick Cellular Messaging Cells can signal to
Introduction. Biochemistry: It is the chemistry of living things (matters).
.") Introduction Biochemistry: It is the chemistry of living things (matters). Biochemistry provides fundamental understanding of the molecular basis for the function and malfunction of living things. Biochemistry
Introduction Biochemistry: It is the chemistry of living things (matters). Biochemistry provides fundamental understanding of the molecular basis for the function and malfunction of living things. Biochemistry
Companion to Biosynthesis of Ketones & Cholesterols, Regulation of Lipid Metabolism Lecture Notes
 Companion to Biosynthesis of Ketones & Cholesterols, Regulation of Lipid Metabolism Lecture Notes The major site of acetoacetate and 3-hydorxybutyrate production is in the liver. 3-hydorxybutyrate is the
Optimizing Nutritional Strategies to Promote Growth in Newborns
 Optimizing Nutritional Strategies to Promote Growth in Newborns Teresa A. Davis, Ph.D. Professor of Pediatrics USDA/ARS Children s Nutrition Research Center, Baylor College of Medicine, Houston, TX Disclosure
Signal Transduction Pathway Smorgasbord
 Molecular Cell Biology Lecture. Oct 28, 2014 Signal Transduction Pathway Smorgasbord Ron Bose, MD PhD Biochemistry and Molecular Cell Biology Programs Washington University School of Medicine Outline 1.
Resp & Cell Comm Review
 Resp & Cell Comm Review Two main catabolic processes: fermentation: partial degradation of sugars in the absence of oxygen. cellular respiration: uses oxygen to complete the breakdown of many organic molecules.