STUDENT KATHERINE OSTBYE MPH 2009 PRECEPTOR CAROLINE FICHTENBERG, PHD
|
|
|
- Bernice Russell
- 5 years ago
- Views:
Transcription
1 Baltimore City Health Department Unintentional Injury Mortality Needs Assessment STUDENT KATHERINE OSTBYE MPH 2009 PRECEPTOR CAROLINE FICHTENBERG, PHD
2 Unintentional Injury Mortality Review Maryland Vital Statistics data for Baltimore City, Objectives 1. Characterize Unintentional Injury Mortality for Baltimore City 2. Compare to other deaths 3. Compare to similar, US 4. Identify Unintentional Injury of Need/Importance 5. Identify prevention and monitoring methods
3 What is Unintentional Injury Death? Classifications based on National Center for Vital Statistics and the World Health Organization: WHO ICD-10 codes identify specific underlying cause of death Excludes ICD-10 codes for intentional mortality (e.g. homicide and suicide) Includes: MV Accidents Falls, Fires, Poisoning, etc. Intention must be definitively unintentional (Excludes unknown intent) AKA Accidents preventable deaths.
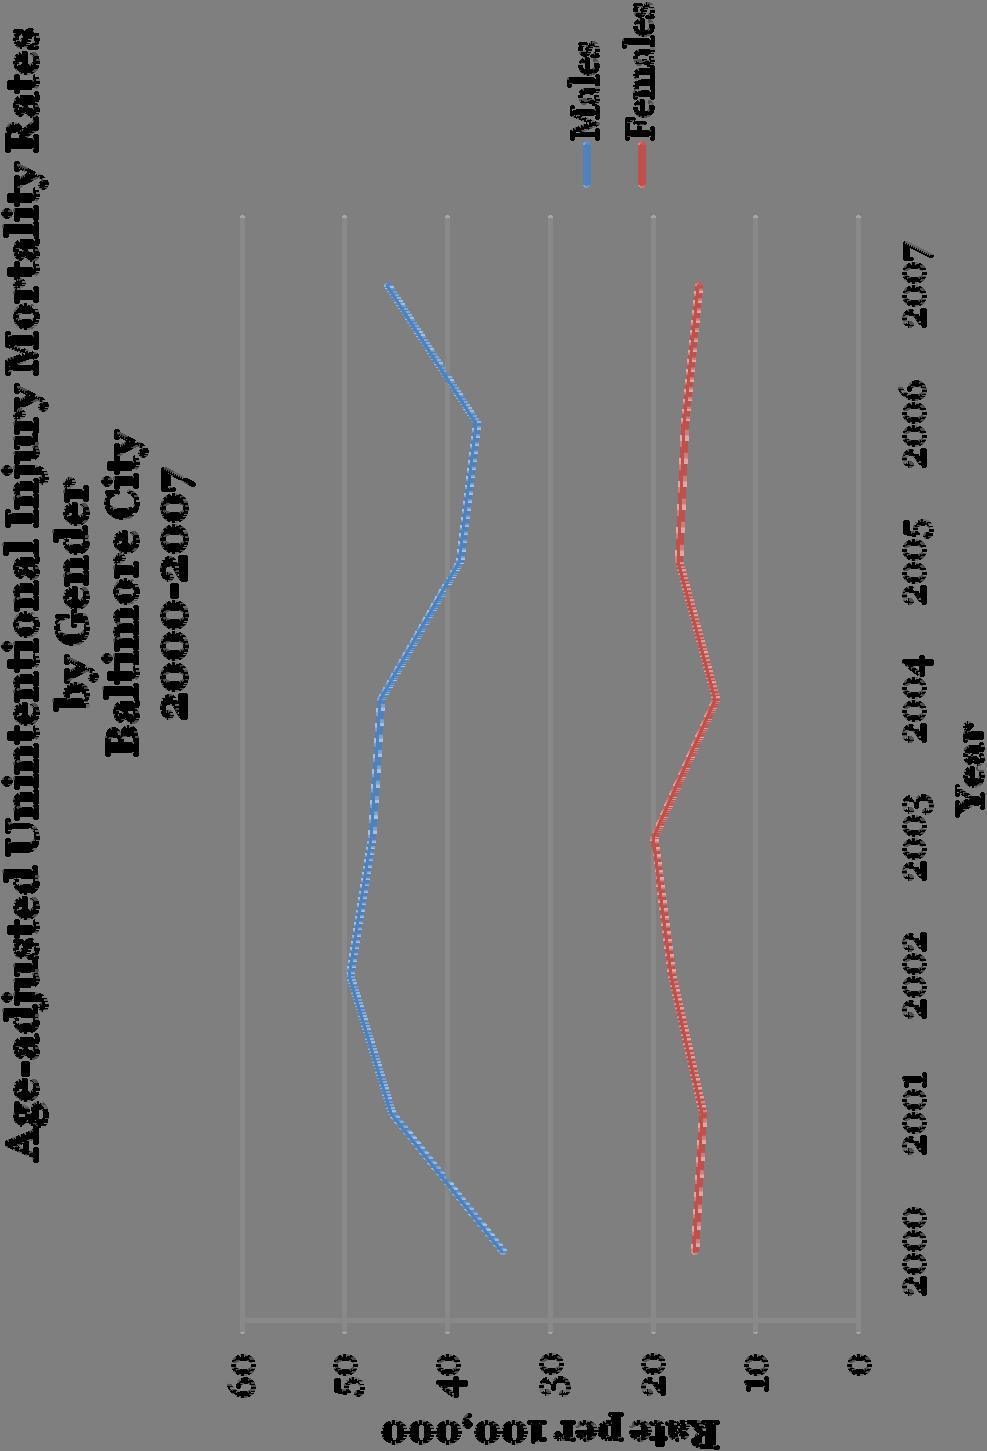
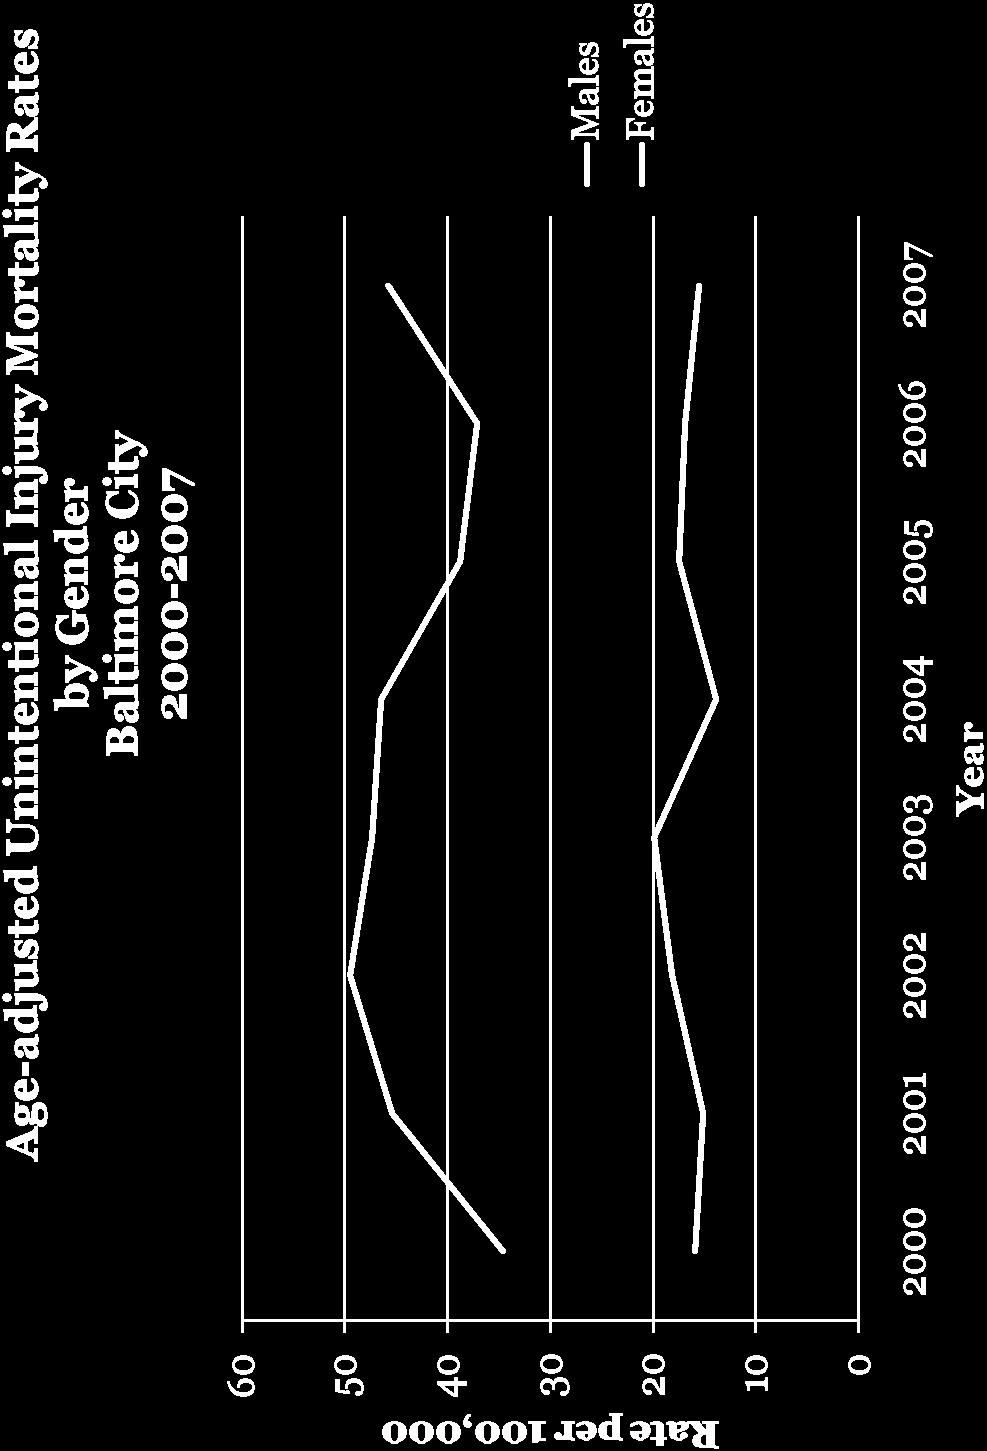
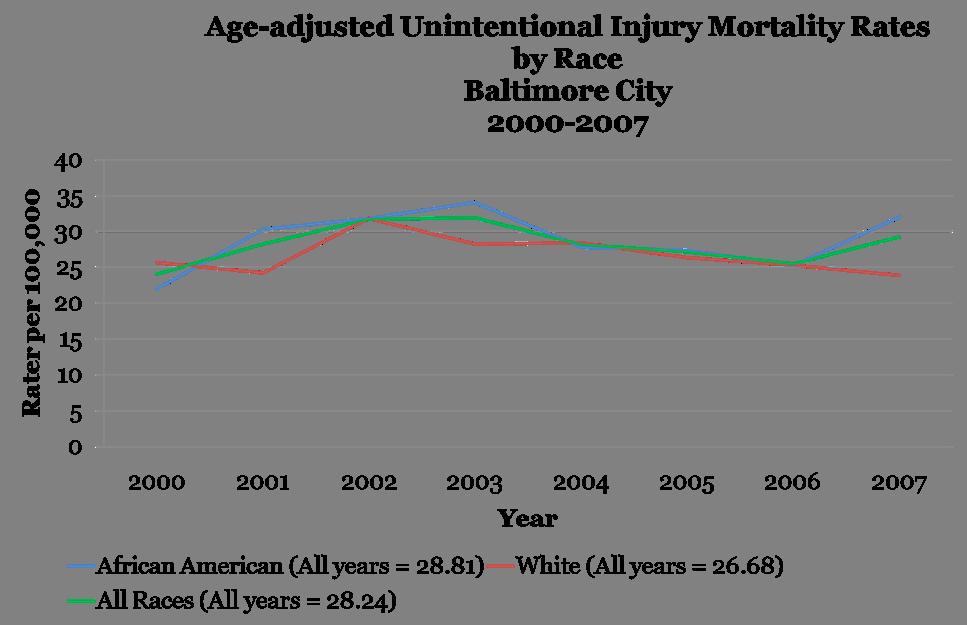
4 Unintentional Injury Mortality Review ICD-10 Code from death certificate/md VS data Characterization based on demographics Age, Sex and Race Age-adjusted rates Looking for Differences among groups Time trends ( ) Extension to Community Statistical Area analysis
5

6


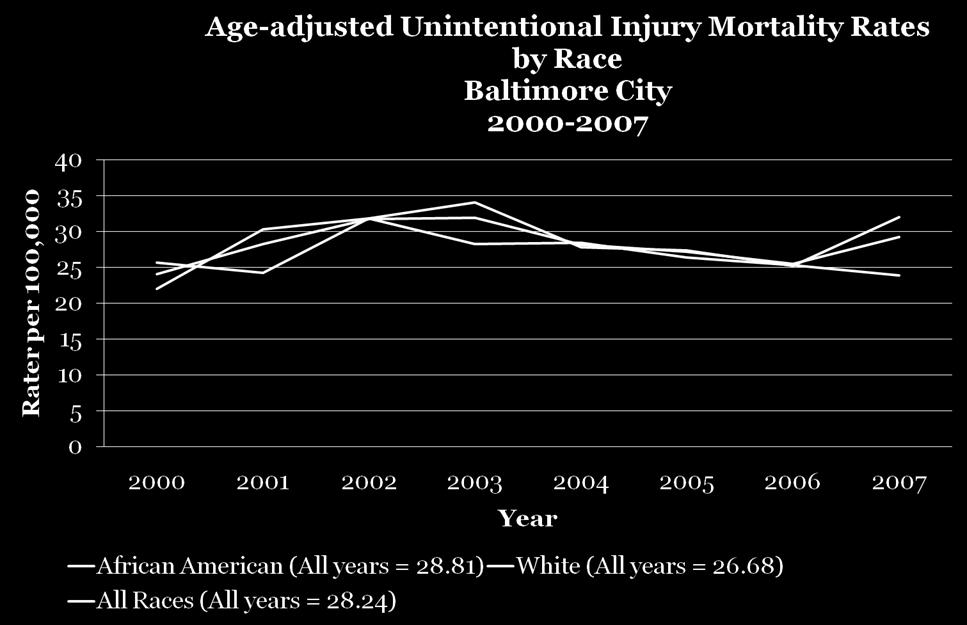
7
8 2. Compare UI Mortality to Other Causes of Death 10 Leading Causes of Death for Baltimore City Determining Counts 113 Leading causes of death (adults) 50 Leading causes of death (infants) Unknown ages (n=20) Determining Population Denominators CDC Wonder Population, vintage 2007 (CSA, 2000 Census)
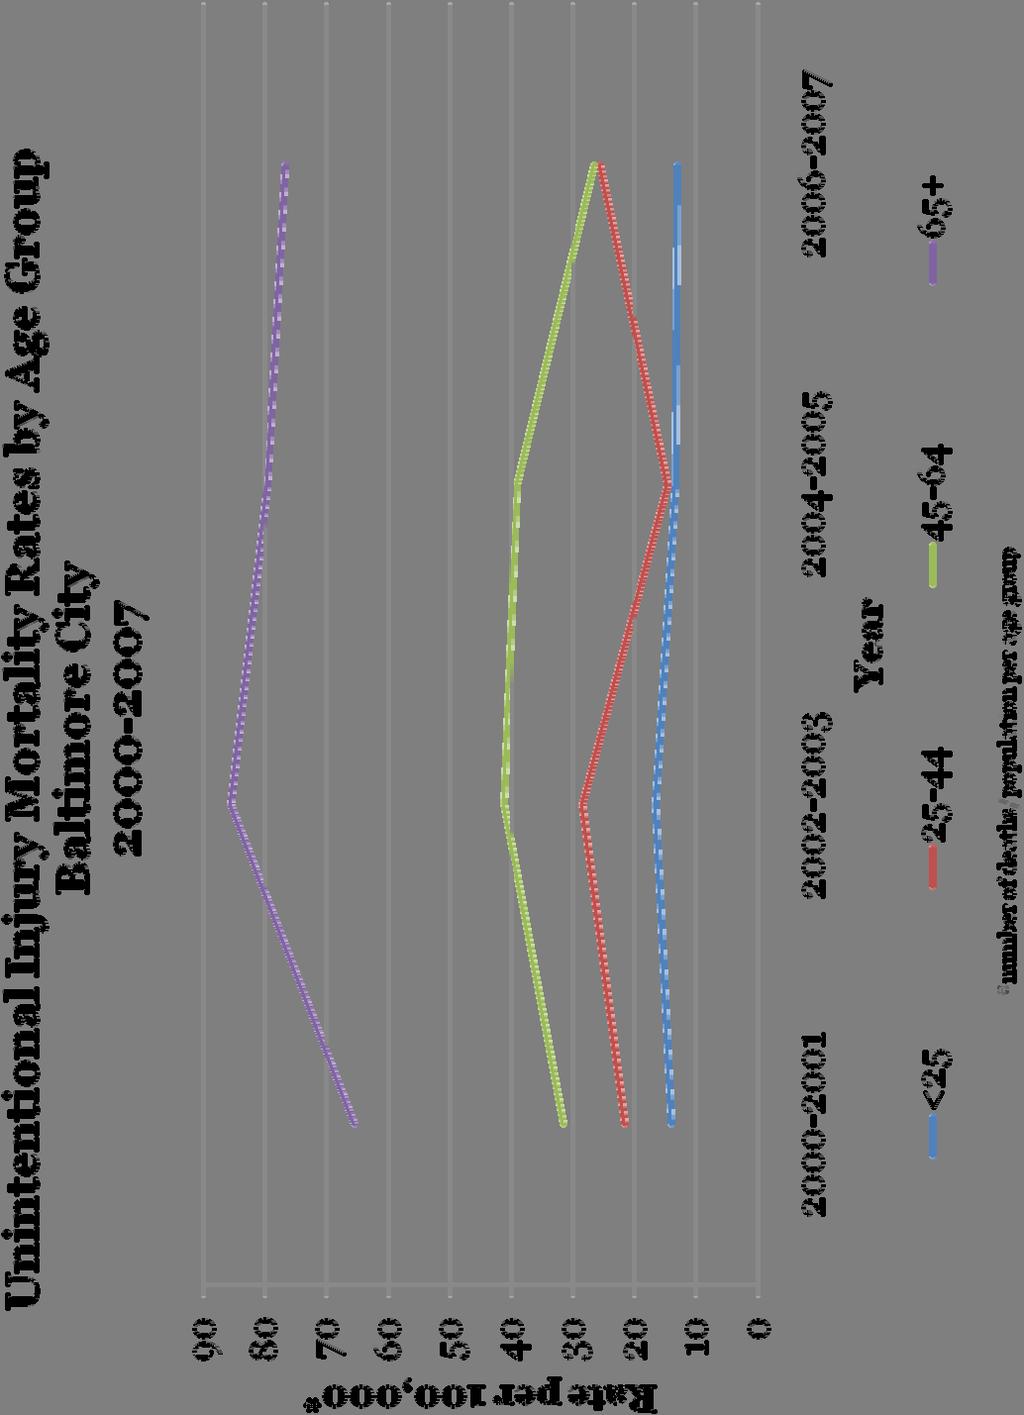
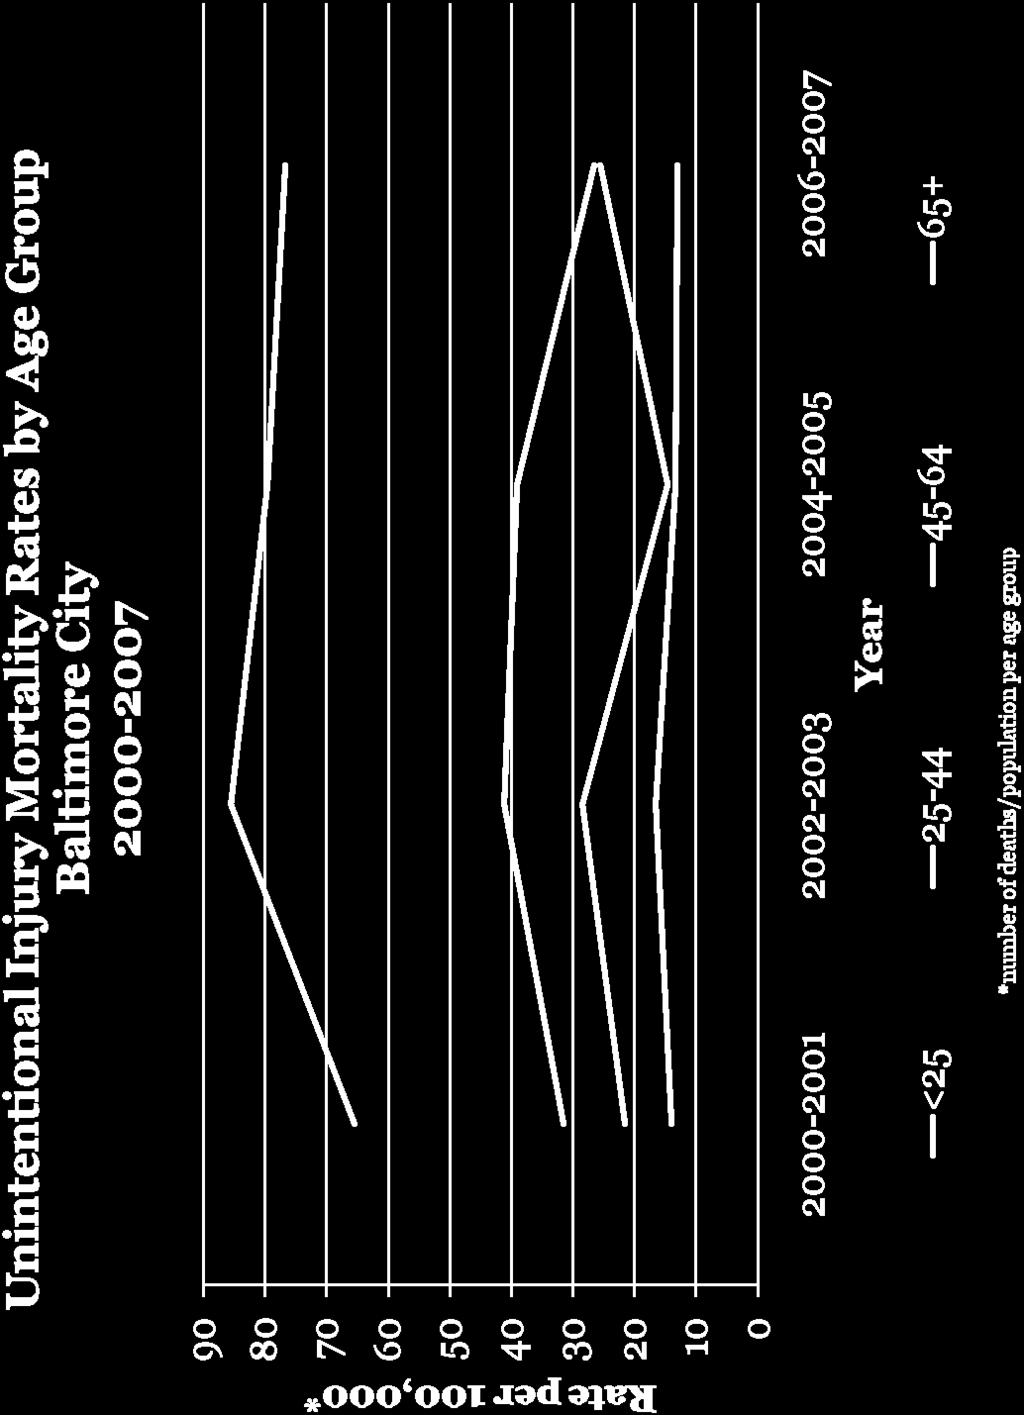
9 Baltimore City Leading Cause of Death by Age Group Rank Total 1 Short gestation (210) Unintentional injuries (37) Unintentional injuries (75) Homicide (831) Homicide (526) HIV/AIDS (986) Heart disease (1,508) Malignant Neoplasms (2,367) Malignant Neoplasms (3,136) Heart disease (4,260) Heart disease (4,192) Heart disease (15,721) 2 SIDS (142) Congenital anomalies (18) Homicide (30) Unintentional injuries (131) HIV/AIDS (216) Heart disease (511) Malignant Neoplasms (1,408) Heart disease (2,145) Heart disease (2,924) Malignant Neoplasms (3,468) Malignant Neoplasms (1,558) Malignant Neoplasms (12,527) 3 Congenital anomalies (92) Homicide (14) Malignant Neoplasms (20) Suicide (54) Heart disease (146) Malignant neoplasm (454) HIV/AIDS (911) Cerebrovascular Disease (366) Diabetes mellitus (519) Cerebrovascular Disease (999) Cerebrovascular Disease (938) Cerebrovascular Disease (3,219) 4 Maternal Complication (57) Malignant Neoplasms (7) Chronic lower respiratory disease (12) Malignant Neoplasm (28) Unintentional injuries (139) Homicide (285) Cerebrovascular Disease (261) Diabetes mellitus (339) Cerebrovascular Disease (495) Chronic lower respiratory disease (717) Chronic lower respiratory disease (481) HIV/AIDS (2,525) 5 Bacterial sepsis (43) Cerebrovascular disease (4) Suicide (11) Heart disease (27) Suicide (86) Unintentional injuries (193) Chronic Liver Disease (238) HIV/AIDS (319) Chronic lower respiratory disease (454) Diabetes mellitus (613) Influenza and pneumonia (444) Chronic lower respiratory disease (2,068) 6 Placenta, cord, membrane (36) Chronic lower respiratory disease (4) Benign neoplasm (5) Chronic lower respiratory disease (13) Malignant Neoplasms (81) Cerebrovascular Disease (131) Septicemia (211) Septicemia (282) Septicemia (387) Septicemia (609) Septicemia (438) Septicemia (2,063) 7 Respiratory distress (36) Heart disease (4) Congenital anomalies (5) HIV/AIDS (13) Septicemia (30) Chronic Liver Disease (103) Unintentional injuries (206) Chronic lower respiratory disease (213) Nephritis, Nephrotic (230) Influenza and pneumonia (392) Alzheimer s disease (403) Diabetes mellitus (2,054) 8 Unintentional injuries (18) Influenza and pneumonia (3) Heart disease (4) Congenital anomalies (10) Diabetes mellitus (19) Suicide (97) Diabetes mellitus (184) Chronic Liver Disease (180) Influenza and pneumonia (195) Nephritis, Nephrotic (306) Diabetes mellitus (316) Homicide (1,903) 9 Homicide (17) Medical complications (2) HIV/AIDS (3) Legal Intervention (10) Cerebrovascular Disease (18) Septicemia (91) Influenza and pneumonia (136) Unintentional injuries (168) Unintentional injuries (160) Unintentional injuries (211) Nephritis, nephritic (229) Unintentional injuries (1,459) 10 Perinatal period (17) Suicide (2) Septicemia (2) Septicemia (8) Chronic lower respiratory disease (17) Influenza and pneumonia (75) Nephritis, nephritic (123) Nephritis, nephritic (165) Hypertension (120) Alzheimer s disease (203) Hypertension (193) Influenza and pneumonia (1,391)
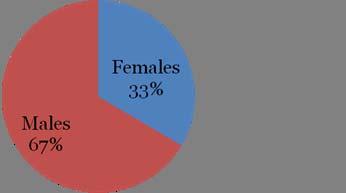
10 Baltimore City Leading Cause of Death by Sex Men Women Leading Causes of Death N Leading Causes of Death N Heart disease 7,680 Heart disease 8,048 Malignant neoplasm 6,317 Malignant neoplasm 6,210 Homicide 1,706 Cerebrovascular disease 1,878 HIV/AIDS 1,678 Diabetes mellitus 1,174 Cerebrovascular disease 1,341 Chronic lower respiratory disease 1,171 Unintentional injuries 972 Septicemia 1,117 Septicemia 947 HIV/AIDS 847 Chronic lower respiratory disease 897 Influenza and Pneumonia 693 Diabetes mellitus 880 Nephritis 595 Influenza and Pneumonia 699 Unintentional injuries 489
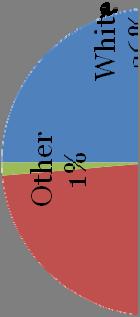
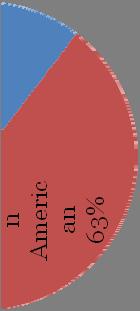
11 Baltimore City Leading Cause of Death by Race African Americans Whites Leading Causes of Death N Leading Causes of Death N Heart disease 9,162 Heart disease 6,479 Malignant neoplasm 7,726 Malignant neoplasm 4,734 HIV/AIDS 2,347 Cerebrovascular disease 1,215 Cerebrovascular disease 1,986 Chronic lower respiratory disease 1,157 Homicide 1,783 Septicemia 697 Diabetes mellitus 1,440 Influenza and Pneumonia 619 Septicemia 1,357 Diabetes mellitus 601 Unintentional injuries 923 Unintentional injuries 518 Chronic lower respiratory disease 905 Alzheimer's disease 353 Nephritis 840 Chronic liver disease 293
12 3. Comparison to Other Cities, US DC, NYC, Pittsburgh, Detroit Data collected from respective HD websites Age-adjusted rates used when available Created crude rates with CDC Wonder populations if only N s were provided Overall, Baltimore has a lower rate of Unintentional Injury mortality than comparable cities (except for NYC) Baltimore and the state of Maryland have lower rates of Unintentional Injury mortality than the United States
13 Unintentional Injury Mortality Rates Location Baltimore City New York City 2006 Philadelphia Pittsburgh 2000 Wayne County (Detroit) 2006 D.C Maryland New York U.S * Crude rate Rate per 100,000 per year * 38.6*
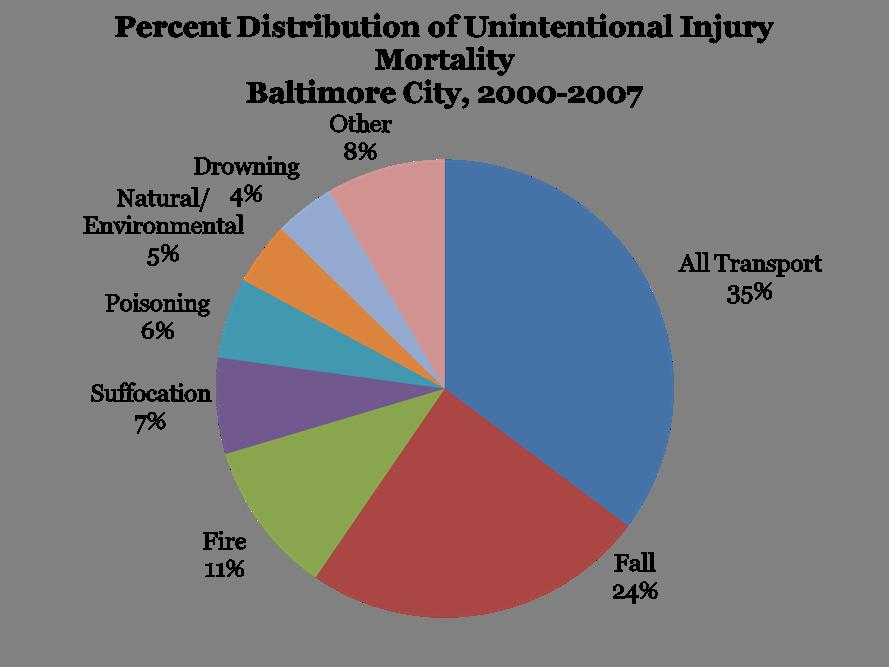
14 4. Identify Unintentional Injury of Need/Importance Utilized the CDC NCHS ICE ICD-10 Matrix for Injury Mortality Characterize UI Subgroups Age-adjusted rates Counts by age group Characterize Falls
15
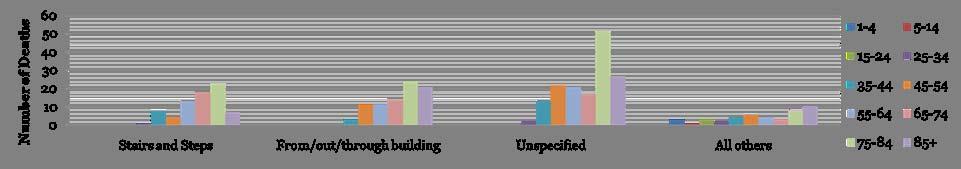
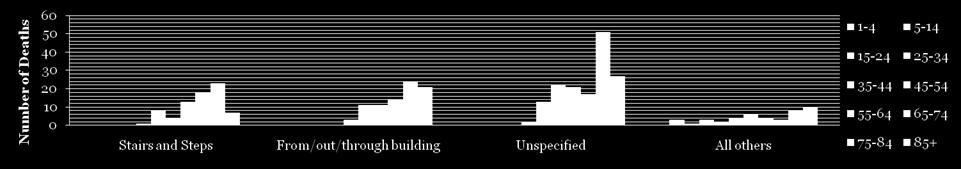
16 5 Leading Unintentional Injury Mortalities by Age Group, Baltimore City, Rank Total 1 Suffocation 14 Fire 16 All Transport 32 All Transport 97 All Transport 92 All Transport 85 All Transport 71 Fall 49 Fall 52 Fall 106 Fall 65 All Transport Fire 3 All Transport 9 Fire 24 Fire 10 Fire 15 Fall 28 Fall 43 All Transport 46 All Transport 37 All Transport 31 Suffocation 27 Fall Natural/ Environmental 1 Drowning 5 Drowning 11 Drowning 8 Poisoning 7 Poisoning 26 Fire 20 Fire 20 Fire 18 Suffocation 27 All Transport 31 Fire Suffocation 4 Poisoning 3 Poisoning 5 Fall 5 Fire 15 Poisoning 18 Natural/ Environmental 15 Suffocation 12 Unspecified 13 Unspecified 13 Suffocation 99 5 Fall 3 Unspecified 2 Fall 3 Drowning 4 Drowning 11 Natural/ Environmental 16 Unspecified 9 Natural/ Environmental 9 Natural/ Environmental 11 Fire 9 Poisoning 83


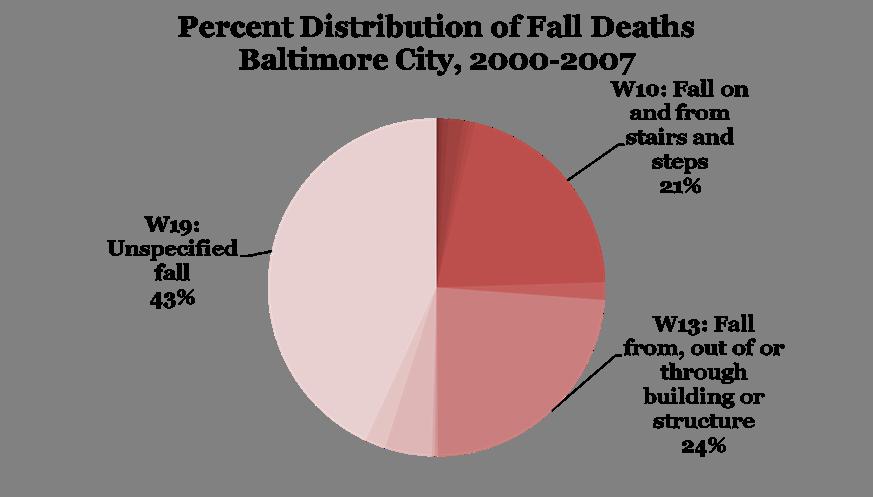
17 Leading Unintentional Injury Deaths by Injury Type Baltimore City,
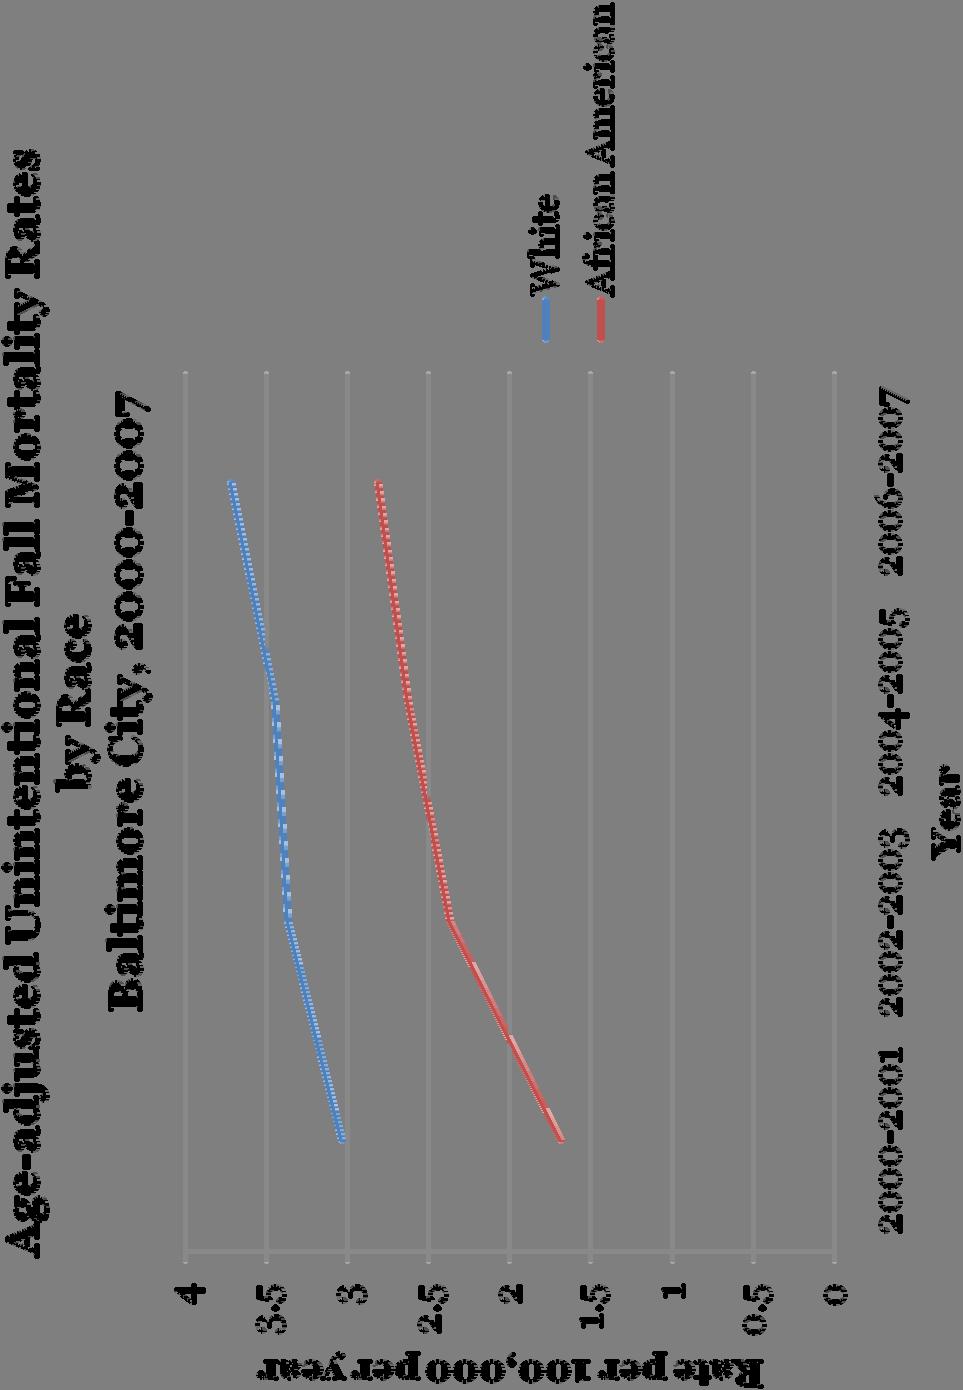
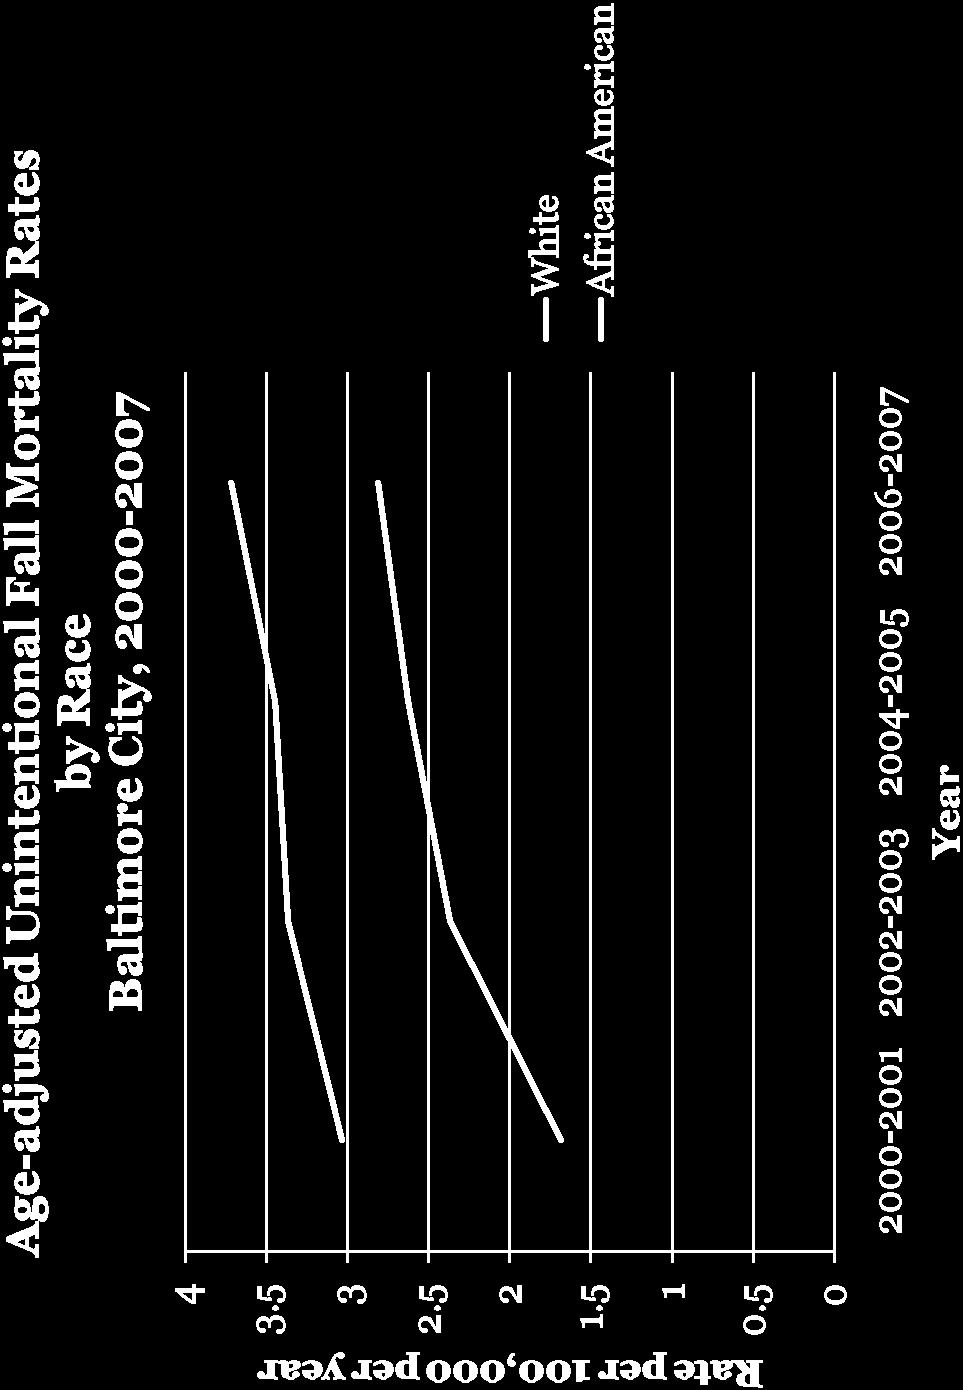
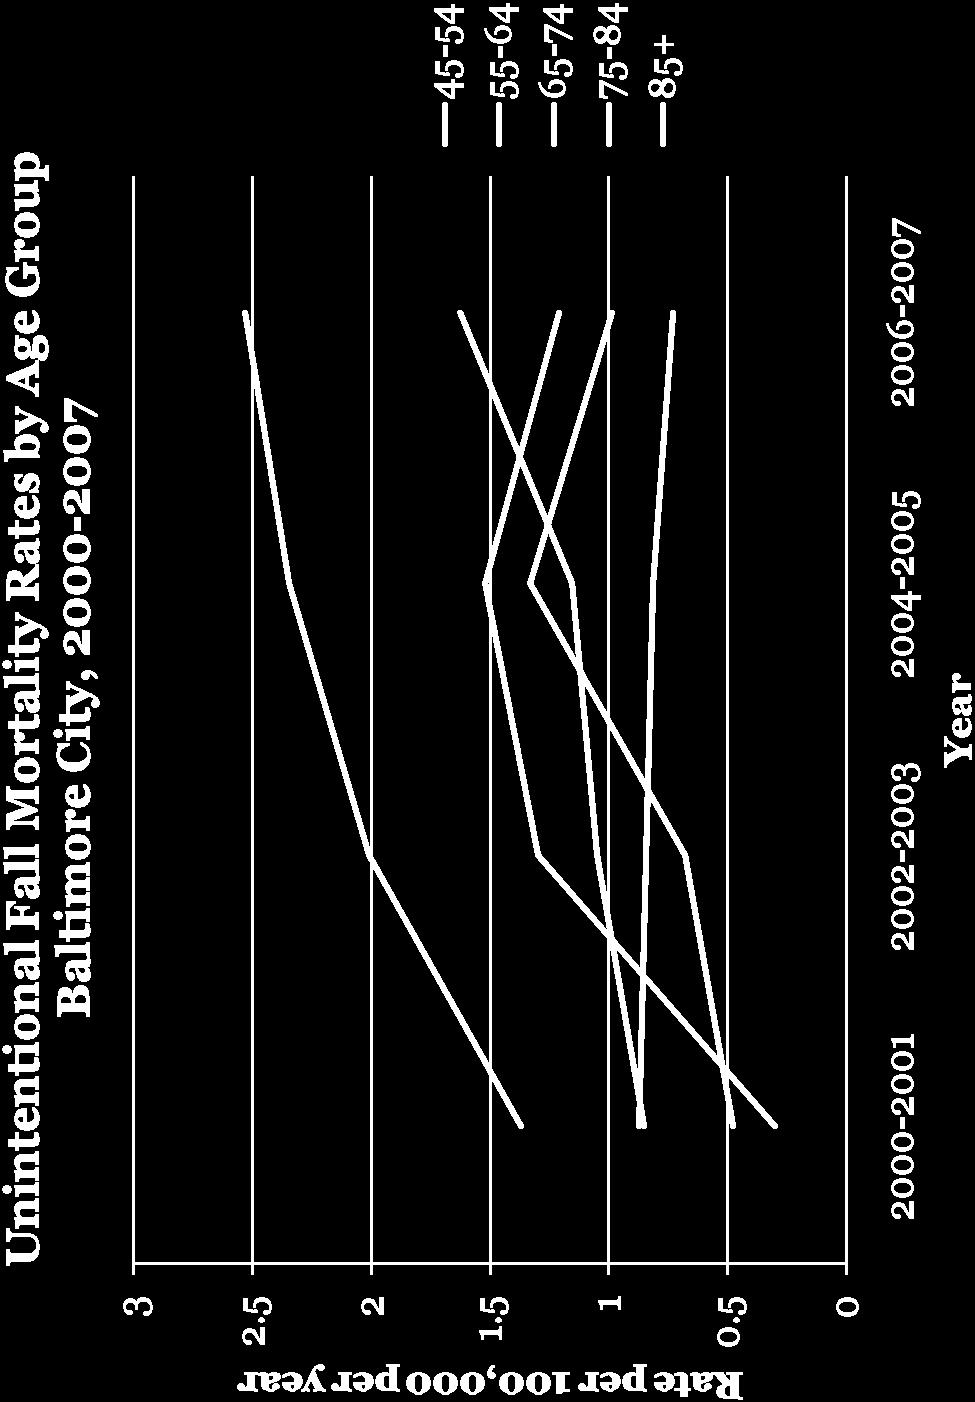
18 Fall Mortality Rates Age-adjusted Fall Mortality Rate Per 100,000/yr Baltimore City New York City 2006 D.C Maryland New York U.S
19
20

21

22

23 CSA Map Rates per 100,000 population, shaded by quintiles. Potential to identify high risk areas. Healthy Homes CARE
24 Prevention & Monitoring Why are falls increasing, and what can be done to prevent them? Why is difficult to answer because the rates are increasing across nearly all of the population demographics, despite noticeable gaps between population subgroups. High incidence + High susceptibility to injury Prevention will have to focus on all races, both sexes, and all ages >55 years. Prevention Identification of Organizations in contact with this age group Healthy Homes CARE Identification of intervention techniques
25 Prevention & Monitoring Psychosocial Support & Healthy Aging 1 : Beneficial effects on health behaviors Preventing poor diet, medication misuse, physical inactivity, and social isolation Research shows that detection and amelioration of risk factors can significantly reduce the rate of future falls. Other evidence-based fall reduction methods include systematic exercise programs and environmental inspection and improvement programs. 2 1 Peel et al. Ann. N.Y. Acad. Sci. 1114: (2007). 2 Rubenstein LZ. Age and Ageing 2006; 35-S2: ii37 ii41
26 Thank You Alisa Ames, MHS Baltimore City Health Department PHASE & JHSPH
State Injury Profile for District of Columbia
 State Injury Profile for District of Columbia The CDC State Injury Profiles Gathering and sharing reliable data about the broad range of public health problems is among the many ways the Centers for Control
Leading Causes of Death, Tarrant County, 2008
 Tarrant County Public Health Division of Epidemiology and Health Information Leading Causes of Death, Tarrant County, 00 Table 1. deaths by gender, Tarrant County, 00 Male,7. 70. Female,7 0.1 7. Total,7
Leading Causes of Death
 Updated: 9/26/2017 Definition: The leading causes of death are the causes of death that account for the highest number of all deaths in a population in a given time period. The leading causes of death
Leading Causes of Death, Tarrant County, 2007
 Tarrant County Public Health Division of Epidemiology and Health Information Leading Causes of Death, Tarrant County, 007 Table 1. deaths by gender, Tarrant County, 007 Males,1 4. 70. Females,7 0. 741.
Leading Causes of Death, Tarrant County, 2009
 Tarrant County Public Health Division of Epidemiology and Health Information Leading Causes of Death, Tarrant County, 009 Table. deaths by gender, Tarrant County, 009 Male 5,5 9. 90. Female 5, 50. 70.
National Vital Statistics Reports
 National Vital Statistics Reports Volume 65, Number 4 June 30, 2016 Deaths: Final Data for 2014 by Kenneth D. Kochanek, M.A., Sherry L. Murphy, B.S., Jiaquan Xu, M.D., and Betzaida Tejada-Vera, M.S., Division
Leading causes of death among Minneapolis residents,
 Leading causes of death among Minneapolis residents, 2005-2014 Leading causes of death in Minneapolis and the U.S. March 2016 Final Report (Revised May 2016) T he five leading causes of death among Minneapolis
Table A: Leading Causes of Death* by Age Group North Carolina Residents, 2016
 Table A: Leading Causes of Death* by Age Group All Ages 1 Cancer 19,526 2 Diseases of the heart 18,276 3 Chronic lower respiratory diseases 5,317 4 Cerebrovascular disease 4,941 5 Alzheimer's disease 4,152
Alaska Native Injury Atlas of Mortality and Morbidity. Prepared by: The Injury Prevention Program and the Alaska Native Epidemiology Center
 Alaska Native Injury Atlas of Mortality and Morbidity Prepared by: The Injury Prevention Program and the Alaska Native Epidemiology Center Alaska Native Tribal Health Consortium January 2008 Acknowledgements
TABLE C-1 RESIDENT DEATHS, LIVE BIRTHS, FETAL, INFANT, NEONATAL, AND MATERNAL DEATHS: PENNSYLVANIA,
 TABLE C-1 RESIDENT DEATHS, LIVE BIRTHS, FETAL, INFANT, NEONATAL, AND MATERNAL DEATHS: PENNSYLVANIA, 1950-1997 - TOTAL LIVE FETAL INFANT NEONATAL MATERNAL DEATHS BIRTHS DEATHS DEATHS DEATHS DEATHS ----------------------------------------------------------------------------------
Childhood Injury Deaths in Baltimore City
 Childhood Injury Deaths in Baltimore City 2002-2006 A Report from the Office of Epidemiology and Planning Baltimore City Health Department Prepared for the Baltimore City Child Fatality Review Team February
A Closer Look at Leading Causes of Death in Guilford County
 2015 GCDHHS Division of Public Health Data Brief A Closer Look at Leading Causes of Death in Guilford County Highlights Heart disease mortality rates declined 43% from 244.8 deaths per 100,000 in 1995
County of Orange Health Care Agency. Orange County Mortality Data 2000
 County of Orange Health Care Agency Orange County Mortality Data 2000 November 2002 Prepared by: Public Health Services Epidemiology & Assessment Stephen Klish, MPH Epidemiologist Michael Carson, MS Senior
Orange County Mortality Data, 1999
 Orange County Mortality Data, 1999 Prepared by: County of Orange, Health Care Agency Communicable Disease Control and Epidemiology February 22 Prepared by: Public Health Services Epidemiology and Assessment
Deaths: Final Data for 2000
 Volume 50, Number 15 September 16, 2002 Deaths: Final Data for 2000 by Arialdi M. Miniño, M.P.H., Elizabeth Arias, Ph.D., Kenneth D. Kochanek, M.A., Sherry L. Murphy, B.S., Betty L. Smith, B.S. Ed., Division
County of Orange Health Care Agency. Orange County Mortality Data, 2002
 County of Orange Health Care Agency Orange County Mortality Data, 2002 October 2005 Prepared by: County of Orange Health Care Agency Disease Control & Epidemiology Division Epidemiology & Assessment Juliette
STATISTICAL NEWS. Breast Cancer Cases Up; Mortality Rates Down. Multiple Race Reporting In 2000 Census Noted
 STATISTICAL NEWS Pennsylvania Department of Health Bureau of Health Statistics Vol. 24 No. 3 May 2001 Multiple Race Reporting In 2000 Census Noted Multiple Race Reporting Will Start with 2003 Birth/Death
Deaths: Final Data for 2002
 Volume 53, Number 5 October 12, 2004 Deaths: Final Data for 2002 by Kenneth D. Kochanek, M.A., Sherry L. Murphy, B.S., Robert N. Anderson, Ph.D., and Chester Scott, Division of Vital Statistics Abstract
PHO: Metadata for Mortality from Avoidable Causes
 Snapshots @ PHO: Metadata for Mortality from Avoidable Causes This indicator captures individuals under 75 years of age who have died with a condition considered as avoidable recorded as the primary cause
BREAST CANCER IN TARRANT COUNTY: Screening, Incidence, Mortality, and Stage at Diagnosis
 NIMHD* CENTER OF EXCELLENCE: COMMUNITY OUTREACH CORE* BREAST CANCER IN TARRANT COUNTY: Screening, Incidence, Mortality, and Stage at Diagnosis Updated January 2014 *Supported by the National Institute
Preventable Child Mortality in Massachusetts. State Child Fatality Review Team Legislative Briefing March 2012
 Preventable Child Mortality in Massachusetts State Child Fatality Review Team Legislative Briefing March 202 State Child Fatality Review Team Co-chaired by Chief Medical Examiner and Department of Public
APPENDIX A. Comparability Ratios for the Major Causes of Death in North Carolina Vital Statistics, Volume 2
 APPENDIX A Comparability Ratios for the Major Causes of Death in North Carolina Vital Statistics, Volume 2 The comparability ratio is an adjustment factor that is applied to the number of deaths coded
LEADING CAUSES OF DEATH IN CHICAGO
 Health Status Index Series Volume XVII Number II LEADING OF DEATH IN CHICAGO DATA FROM 00 CITY OF CHICAGO DEPARTMENT OF PUBLIC HEALTH OFFICE OF EPIDEMIOLOGY Leading Causes of Death in Chicago Dana M. Harper-Jemison,
2015 United States Fact Sheet
 Fact Sheet Unintentional injuries and violence are the leading causes of death, hospitalization, and disability for children ages -. This fact sheet provides a state snapshot of data on the injury-related
TABLE I-1: RESIDENT INFANT DEATHS PER 1,000 LIVE BIRTHS, BY RACE AND ETHNICITY, FLORIDA AND UNITED STATES, CENSUS YEARS AND
 TABLE I-1: RESIDENT INFANT DEATHS PER 1,000 LIVE BIRTHS, BY RACE AND ETHNICITY, FLORIDA AND UNITED STATES, CENSUS YEARS 1970-2000 AND 2004-2014 FLORIDA 1 UNITED STATES 1 YEAR WHITE2 BLACK2 HISPANIC3 WHITE2
Illinois Emergency Medical Services for Children (EMSC)
") Illinois Emergency Medical Services for Children (EMSC) Authors Ruth Kafensztok, DrPH, IL EMSC Program, Loyola University Medical Center, Maywood, IL Daniel Leonard, MS, IL EMSC Program, Loyola University
Illinois Emergency Medical Services for Children (EMSC) Authors Ruth Kafensztok, DrPH, IL EMSC Program, Loyola University Medical Center, Maywood, IL Daniel Leonard, MS, IL EMSC Program, Loyola University
American Association of Suicidology. Statistics AAS. Statistics. National Statistical Information FMHI. American Association of Suicidology (AAS)
") American Association of Suicidology Statistics AAS Statistics S National Statistical Information The following pages of statistical informartion are provided with permission from the web site of the American
American Association of Suicidology Statistics AAS Statistics S National Statistical Information The following pages of statistical informartion are provided with permission from the web site of the American
Baseline Health Data Report: Cambria and Somerset Counties, Pennsylvania
 Baseline Health Data Report: Cambria and Somerset Counties, Pennsylvania 2017 2018 Page 1 Table of Contents Executive Summary.4 Demographic and Economic Characteristics 6 Race and Ethnicity (US Census,
Portland Area Health Priorities
 Portland Area Indian Health Service Portland Area Health Priorities CAPT Thomas Weiser, MD, MPH Medical Epidemiologist Portland Area Budget Formulation Meeting Portland, November 30, 2017 Overview Brief
Suicide in Missouri: Where We Stand
 Suicide in Missouri: Where We Stand Liz Sale, PhD Missouri Institute of Mental Health University of Missouri-St. Louis August 2017 Outline Prevalence of suicide World, U.S., Missouri comparisons Trends
Data Dictionary FloridaCHARTS.com Infant Mortality Query
 About the System The Infant Mortality Query System provides counts and rates of infant deaths from 1989 to the present. Data are final unless marked as provisional. Provisional data is updated weekly.
MISSISSIPPI VITAL STATISTICS
 MISSISSIPPI VITAL STATISTICS 2008 TABLE OF CONTENTS Page INTRODUCTION Description of Bulletin...1 Definitions of Live Birth, Fetal Death, Induced Termination, and Death... 1 Occurrence and Residence Allocation...2
Health is excellent, very good, or good
 Health is excellent, very good, or good Source Description Item National Health Interview Survey Health is excellent, very good, or good Would you say [fill: your/alias s] health in general is excellent,
Table E1. Standardized Mortality Ratios for Total and Specific Causes of Death Parameter Radiologists Psychiatrists No. of Deaths
 RSNA, 2016 10.1148/radiol.2016152472 Table E1. Standardized Mortality Ratios for Total and Specific Causes of Death Parameter Radiologists Psychiatrists No. of Deaths Observed/Expected No. of Deaths Observed/Expected
POPULATION 2000 Census Population, by Age, Race, and Sex, Residents of Mississippi... 7
 TABLE OF CONTENTS Page INTRODUCTION Description of Bulletin... 1 Definitions of Live Birth, Fetal Death, Induced Termination, and Death... 1 Occurrence and Residence Allocation... 2 Population... 2 Race...
Population Population Projections 2005, Region of Peel and Municipalities Mississauga Brampton Caledon Peel Male Female
 Peel Health Facts Population Population Projections 2005, Region of Peel and Municipalities Mississauga Brampton Caledon Peel Male 322,000 195,000 28,000 545,000 Female 330,000 199,000 28,000 557,000 Total
Texas Chronic Disease Burden Report. April Publication #E
 Texas Chronic Disease Burden Report April 2010 Publication #E81-11194 Direction and Support Lauri Kalanges, MD, MPH Medical Director Health Promotion and Chronic Disease Prevention Section, Texas Department
MISSISSIPPI VITAL STATISTICS
 MISSISSIPPI VITAL STATISTICS 2004 TABLE OF CONTENTS Page INTRODUCTION Description of Bulletin...1 Definitions of Live Birth, Fetal Death, Induced Termination, and Death... 1 Occurrence and Residence Allocation...2
Safe States Conference on Vulnerable Populations and Research. Atlanta Metro Region
 Safe States Conference 2012 Emory Center for Injury Control: Focusing on Vulnerable Populations and Research Translation through Collaborations in the Atlanta Metro Region Lisa Dawson Shakiyla Smith Injury
The Burden Report: Cardiovascular Disease & Stroke in Texas
 The Burden Report: Cardiovascular Disease & Stroke in Texas Texas Cardiovascular Health and Wellness Program www.dshs.state.tx.us/wellness Texas Council on Cardiovascular Disease and Stroke www.texascvdcouncil.org
Injury Epidemiology. An Introduction. Thomas Songer, PhD University of Pittsburgh
 Injury Epidemiology An Introduction Thomas Songer, PhD University of Pittsburgh readings This lecture introduces an emerging topic in global health today; injury epidemiology. Injuries represent a significant
Worcester County Report Card 2012
 Worcester County Report Card 2012 W H Deborah Goeller, R.N., M.S. Health Officer Introduction This community health 2012 Report Card is the fourth published by the Worcester County Health Department. There
Kansas City Data Collective Technical Report, June 2015
 Kansas City Data Collective Technical Report, June 2015 Top 10 leading causes of death, Kansas City Metro Area, 2007-2011 Background Kansas City Data Collective (KCDC) is a group of epidemiologists and
SECTION 2. Health Status, Health Risks, and Use of Health Services
 SECTION 2 Health Status, Health Risks, and Use of Health Services This section presents an overview of the health status of the population, including general health status, mortality rates, and rates of
WESTERN PACIFIC REGION HEALTH DATABANK, 2011 Revision. Total Total. Number of new cases. Total
 COUNTRY HEALTH INFORMATION PROFILE WESTERN PACIFIC REGION HEALTH BANK, 2011 Revision Demographics 1 Area (1 000 km2) 299.76 1 2 Estimated population ('000s) 94 013.20 47 263.60 46 749.60 2010 est 2 3 Annual
P ennsylvania S t a te Da ta C enter RESEARCH BRIEF. Causes of Death in the Commonwealth: Pennsylvania Trends in Mortality, 2015
 P ennsylvania S t a te Da ta C enter October 2017 RESEARCH BRIEF Causes of Death in the Commonwealth: Pennsylvania Trends in Mortality, 2015 HARRISBURG Now an exciting time of year where one dresses in
Summit County Public Health
 Page 1 Death and Life Expectancy Summit County Public Health Population Health Vital Statistics Brief: VOLUME 1: DEATH AND LIFE EXPECTANCY Summit County Public Health Population Health Division 1867 W.
Mississauga Brampton Caledon Peel Male 351, ,910 30, ,410 Female 353, ,090 30, ,560 Total* 705, ,000 61,000 1,225,970
 Peel Health Facts Population Population Projections 2007, Region of Peel and Municipalities Mississauga Brampton Caledon Peel Male 351,890 230,910 30,640 613,410 Female 353,110 229,090 30,360 612,560 Total*
Peel Health Facts. Population Projections 2004, Region of Peel and Municipalities
 Peel Health Facts Population Population Projections 2004, Region of Peel and Municipalities Mississauga Brampton Caledon Peel Male 318,004 188,688 27,476 534,084 Female 326,991 191,315 27,524 545,922 Total
Behavioral Health: Public Health Challenge Public Health Opportunity. Pamela S. Hyde, J.D. SAMHSA Administrator
 Behavioral Health: Public Health Challenge Public Health Opportunity Pamela S. Hyde, J.D. SAMHSA Administrator American Public Health Association 139 th Annual Meeting and Exposition Washington, DC October
Populations of Color in Minnesota
 Populations of Color in Minnesota Health Status Report Update Summary Fall 2002 Center for Health Statistics Minnesota Department of Health Table of Contents Part I: Birth Related Indicators...1 Low Birthweight...1
Colorado Health Disparities Profiles
 Health Disparities Profiles includes: Larimer County Population Total Population Source: CDC/NCHS 2007-based, bridged-race population estimates, 2007. Social Determinants of Health 287,574 248,312 26,629
Public Health. In 2006, 23% of births were to mothers between the ages of 15 and 19. This is a decline from 25% in 2001.
 Public Health In 2006, 23% of births were to mothers between the ages of 15 and 19. This is a decline from 25% in 2001. Eleven percent of children born in 2006 had a low birth weight (< 2,500 grams or
LEADING CAUSES OF DEATH, EL DORADO,
 LEADING CAUSES OF DEATH, EL DORADO, 2006-2010 EL DORADO COUNTY HEALTH SERVICES DEPARTMENT DIVISON OF PUBLIC HEALTH Date: 05/12/2011 CREATED BY OLIVIA BYRON-COOPER, MPH EPIDEMIOLOGIST LEADING CAUSES OF
2013 Arizona State Health Assessment Summary and Findings. Health and Wellness for all Arizonans
 2013 Arizona State Health Assessment Summary and Findings Health and Wellness for all Arizonans Presentation Overview The State Health Assessment Process Health Indicators 15 Leading Health Issues: o County
The comparability ratio is an adjustment factor
 Appendix A Comparability Ratios for the Major Causes of Death in North Carolina Vital Statistics, Volume 2 The comparability ratio is an adjustment factor that is applied to the number of deaths coded
Colorado Health Disparities Profiles
 Health Disparities Profiles County includes: Jackson, Moffat, Rio Blanco, and Counties Population Total Population 22,382 43,638 4,861,515 21,015 39,473 3,508,736 904 3,224 909,833 140 263 228,718 210
yrs life expectancy for women in 1900
 Come Join Us to Help Celebrate Women s Health! The Office of Women s Health (OWH) serves to educate the public and to be an advocate for women s health. The goal of this calendar is to present the 10 leading
Catalogue no. 84F0209X. Mortality, Summary List of Causes
 Catalogue no. 84F0209X Mortality, Summary List of Causes 2008 How to obtain more information For information about this product or the wide range of services and data available from Statistics Canada,
2013 Emergency Department Data Annual Report
 2013 Emergency Department Data Annual Report Health Systems Epidemiology Program And Environmental Health Tracking Program Epidemiology and Response Division 2013 Emergency Department Data Annual Report
How a universal health system reduces inequalities: lessons from England
 How a universal health system reduces inequalities: lessons from England Appendix 1: Indicator Definitions Primary care supply Definition: Primary care supply is defined as the number of patients per full
Mortality patterns in Spain, 2010
 Mortality patterns in Spain, 2010 STATISTICS 2013 MINISTRY OF HEALTH, SOCIAL SERVICES AND EQUALITY Mortality patterns in Spain, 2010 STATISTICS 2013 MINISTRY OF HEALTH, SOCIAL SERVICES AND EQUALITY Director
Collection of Statistics on Causes of Death Azza Badr, PhD, Vital Statistics and Country Support WHO/EMRO
 Collection of Statistics on Causes of Death Azza Badr, PhD, Vital Statistics and Country Support WHO/EMRO ESCWA-UNSD GCCSTAT Meeting Muscat-Oman, 14-17 November 2016 Relevance of cause of death information
Population Health Vital Statistics Brief:
 Page 1 Death and Life Expectancy Summit County Public Health Population Health Vital Statistics Brief: VOLUME 1: DEATH AND LIFE EXPECTANCY Summit County Public Health Populaon Health Division 1867 W. Market
Demographics and Health Data
 Demographics and Health Data Information for Local Planners City of Puyallup, WA Demographic Characteristics Environmental Health Division 3629 South D Street, Tacoma, WA 98418 (253) 798-6470 Table 1 presents
Community Health Needs Assessment for UI Health Hospital & Clinics
 Community Health Needs Assessment for UI Health Hospital & Clinics Office of the Vice Chancellor for Health Affairs Community Engagement & Neighborhood Health Health Policy & Strategy Population Health
Behavioral Health: Public Health Challenge Public Health Opportunity. Pamela S. Hyde, J.D. SAMHSA Administrator
 Behavioral Health: Public Health Challenge Public Health Opportunity Pamela S. Hyde, J.D. SAMHSA Administrator New Orleans, LA January 25, 2012 MAKING THE CASE 3 BEHAVIORAL HEALTH: AMERICA S #1 PUBLIC
The Burden of Cardiovascular Disease in North Carolina. Justus-Warren Heart Disease and Stroke Prevention Task Force April 11, 2018
 The Burden of Cardiovascular Disease in North Carolina Justus-Warren Heart Disease and Stroke Prevention Task Force April 11, 2018 Purpose 1. To detail the burden of heart disease and stroke in North Carolina
2018 Community Health Assessment
 2018 Community Health Assessment Community Health Status Assessment Linn County, IA Prepared by Amy Hockett, PhD, MPH, CHES Epidemiologist Linn County Public Health August 9, 2018 Community Health Status
Demographics and Health Data
 Demographics and Health Data Information for Local Planners City of Lakewood, WA Demographic Characteristics Environmental Health Division 3629 South D Street, Tacoma, WA 98418 (253) 798-6470 Table 1 presents
Special Topic. The ten leading causes of death in countries of the Americas
 The ten leading causes of death in countries of the Americas Table 1: Country specific information on the ten leading causes of death in broad age groups, by sex, for the latest two or three data years
Health of the City & Community Health Improvement Planning. Raynard Washington, PhD, MPH Chief Epidemiologist
 Health of the City & Community Health Improvement Planning Raynard Washington, PhD, MPH Chief Epidemiologist What is the Community Health Assessment (CHA)? An annual assessment of population health in
Catalogue no. 84F0209X. Mortality, Summary List of Causes
 Catalogue no. 84F0209X Mortality, Summary List of Causes 2006 How to obtain more information For information about this product or the wide range of services and data available from Statistics Canada,
New York & National Suicide-Related Statistics
 New York & National Suicide-Related Statistics Statistics S Orange County New york New York Statistics New York ranked 49th among all states and the District of Columbia for rates of suicide among all
Cambridge Health Indicators 2015
 Cambridge Health Indicators 2015 Cambridge Health Indicators Broad Measures of Health for Cambridge, Massachusetts, and the United States Division of Epidemiology & Data Services November 2015 Claude-Alix
New Mexico Department of Health. Racial and Ethnic Health Disparities Report Card
 New Mexico Department of Health Racial and Ethnic Health Disparities Report Card August 30, 2006 Acknowledgments Many individuals contributed to the production of this report card and the Office of Policy
Page County Virginia
 Page County Virginia Health Needs Assessment Part 2 Health Status Assessment October, 2001 Compiled and Printed by Blue Ridge Area Health Education Center James Madison University Page County, Virginia
SmartVA Analyze Outputs Interpretation Sheet
 SmartVA Analyze Outputs Interpretation Sheet SmartVA-Analyze uses an algorithm called Tariff 2.0 to assign the cause of death based on the details of the verbal autopsy (VA) interview. The output from
Data Sources, Methods and Limitations
 Data Sources, Methods and Limitations The main data sources, methods and limitations of the data used in this report are described below: Local Surveys Rapid Risk Factor Surveillance System Survey The
STEPHEN P. NONN OFFICE OF THE CORONER MADISON COUNTY, ILLINOIS 157 MAIN STREET SUITE 354 EDWARDSVILLE, IL
 MAIN OFFICE: (618) 692-7478 MORGUE: (618) 296-4525 FAX: (618) 692-6042 FAX: (618) 692-9304 STEPHEN P. NONN OFFICE OF THE CORONER MADISON COUNTY, ILLINOIS 157 MAIN STREET SUITE 354 EDWARDSVILLE, IL. 62025-1962
Cancer Statistics, 2014
 CA CANCER J CLIN 2014;64:9 29 Cancer Statistics, 2014 Rebecca Siegel, MPH 1 ; Jiemin Ma, PhD 2, *; Zhaohui Zou, MS 3 ; Ahmedin Jemal, DVM, PhD 4 Each year, the American Cancer Society estimates the numbers
Community Health Needs Assessment
 Community Health Needs Assessment Scott County, Missouri This assessment will identify the health needs of the residents of Scott County, Missouri, and those needs will be prioritized and recommendations
LAO PEOPLE'S DEMOCRATIC REPUBLIC
 COUNTRY HEALTH INFORMATION PROFILE LAO PEOPLE'S DEMOCRATIC REPUBLIC WESTERN PACIFIC REGION HEALTH BANK, 2011 Revision Demographics 1 Area (1 000 km2) 236.80 2009 1 2 Estimated population ('000s) 6128.00
HealtheCNY Indicator List by Data Source
 American Community Survey 23 Adults with Health Insurance Children Living Below Poverty Level Children with Health Insurance Families Living Below Poverty Level Homeowner Vacancy Rate Homeownership Households
STATE OF THE COUNTY HEALTH REPORT
 STATE OF THE COUNTY HEALTH REPORT 2015 Teresa C. Ellen, RN., MPH Health Director Matthew A. Hojatzadeh, MPH Public Health Educator II Wilson County Health Department 1801 Glendale Dr. SW Wilson, NC 27893
Drug Overdose Summary- Mendocino County, CA. Mendocino County Health & Human Services Agency Healthy People, Healthy Communities
 Drug Overdose Summary- Mendocino County, CA Mendocino County Health & Human Services Agency Healthy People, Healthy Communities Injury Fact Sheet: Mendocino County Drug Overdose Summary Tables Deaths 2002
Cancer Statistics, 2009 Ahmedin Jemal, Rebecca Siegel, Elizabeth Ward, Yongping Hao, Jiaquan Xu and Michael J. Thun. DOI: /caac.
 Cancer Statistics, 2009 Ahmedin Jemal, Rebecca Siegel, Elizabeth Ward, Yongping Hao, Jiaquan Xu and Michael J. Thun CA Cancer J Clin 2009;59;225-249; originally published online May 27, 2009; DOI: 10.3322/caac.20006
Report Card of Community Health Indicators March 2001
 Report Card of Community Health Indicators March 2001 Building Healthier Communities Janet S. Owens County Executive Frances B. Phillips, R.N., M.H.A. Health Officer Anne Arundel County Department of Health
Health Status of New Mexico 2015
 Health Status of New Mexico 2015 New Mexico Health s Northwest Northeast Metro Southwest Southeast NM Urban-Rural County Classification Metropolitan Counties Small Metro Counties Mixed Urban/Rural Counties
Cancer Statistics, 2010 Ahmedin Jemal, Rebecca Siegel, Jiaquan Xu and Elizabeth Ward. DOI: /caac.20073
 Statistics, 21 Ahmedin Jemal, Rebecca Siegel, Jiaquan Xu and Elizabeth Ward CA J Clin 21;6;277-3; originally published online Jul 7, 21; DOI: 1.3322/caac.273 This information is current as of February
Saratoga County Health Profile
 Saratoga County Health Profile Prepared by: www.hcdiny.org General Health: Saratoga County Saratoga Capital NYS, except PA 17 Indicator Year(s) County Region NYC For rate/% Rate/% Rate/% Rate/% Rate/%
ALASKA NATIVE MORTALITY UPDATE: EXECUTIVE SUMMARY
 All-Cause Mortality The Alaska Native people all-cause mortality rate, both genders combined, during the period 2009-2013, was 51% higher than the U.S. White rate (2009-2013). Alaska Native people, both
Life Expectancy Female
 The State of Women s Health lh Yvonne T. Green Centers for Disease Control and Prevention Office of Women s Health December 4, 2013 1 Life Expectancy Female Life Expectancy Year All Races Female Black
Diagnosis-specific morbidity - European shortlist
 I Certain infectious and parasitic diseases 1 Tuberculosis A15-A19 X X Z 2 Sexually transmitted diseases (STD) A50-A64 Y Z 3 Viral hepatitis (incl. hepatitis B) B15-B19 X Z 4 Human immunodeficiency virus
JOINING HANDS: SHARING RESOURCES AND DATA ACROSS SECTORS TO IMPROVE POPULATION HEALTH
 JOINING HANDS: SHARING RESOURCES AND DATA ACROSS SECTORS TO IMPROVE POPULATION HEALTH Virginia Population Health Summit Charlottesville, Virginia March 29, 2017 Steven H. Woolf, MD, MPH Director, Center
Figure 4: Leading C auses (by Rate) of Emergency Room Visi ts by Year, DeKal b County,
 of Emergency Room Visi ts by Year, DeKal b County,") Leading Causes Figure 4: Leading C auses (by Rate) of Emergency Room Visi ts by Year, DeKal b County, 2008-2012 Leading Causes This section presents the leading causes of emergency room visits, hospitalizations,
Leading Causes Figure 4: Leading C auses (by Rate) of Emergency Room Visi ts by Year, DeKal b County, 2008-2012 Leading Causes This section presents the leading causes of emergency room visits, hospitalizations,
A chapter by chapter look at the ICD-10-CM code set Coding Tip Sheet
 Coding Tip Sheet Chapter 1 - Certain Infectious and Parasitic Diseases Terminology changes: The term Sepsis (ICD-10-CM) has replaced the term Septicemia (ICD-9-CM) Urosepsis is a nonspecific term and is
All-Cause Mortality, Waterloo Region and Ontario, 2010, 2011 and 2012
 All-Cause Mortality, Waterloo Region and Ontario, 2010, 2011 and 2012 Table 1. Number of deaths and age-standardized mortality rate per 100,000 population, by place of residence, Waterloo Region and Ontario,
2014 Hospital Inpatient Discharge Data Annual Report
 2014 Hospital Inpatient Discharge Data Annual Report Health Systems Epidemiology Program Epidemiology and Response Division New Mexico Department of Health 2014 Hospital Inpatient Discharge Data Report
Colorado Trends in Suicide: Annual Report from the Office of Suicide Prevention Suicide Prevention Coalition of Colorado August 12, 2015
 Colorado Trends in Suicide: Annual Report from the Office of Suicide Prevention Suicide Prevention Coalition of Colorado August 12, 2015 Sources of information/data National National Violent Death Reporting