CASINO REVENUE AND AMERICAN INDIAN HEALTH
|
|
|
- Collin Barton
- 6 years ago
- Views:
Transcription
1 CASINO REVENUE AND AMERICAN INDIAN HEALTH The Link Between Tribal Gaming and the Health Status and Behaviors of American Indians Barbara Wolfe Jessica Jakubowski Robert Haveman Hannah Goble Marissa Courey University of Wisconsin-Madison
2 Background: Income and Health Many studies have linked income and health Yet, the nature of this relationship remains elusive. Most research plagued by issues of: Reverse causality Endogeneity - unobserved factors influencing both income and health Here view operation of gaming casinos by American Indian tribes as a natural experiment which provides an opportunity to estimate the relationship between an exogenous income shock and health of a vulnerable group-- American Indians Gaming is defined as class III gaming (Casino) Includes Slot Machines, Black Jack, Craps, Roulette
3 American Indian Health 3.1 million American Indians Self Assessed Health Poor or Fair 12.1% compared to 8.6% among Whites (18+) Binge Alcohol use (5+ drinks one sitting) 32.8% vs. 23.4% Whites (12+) Limitation in Activity 18.4% compared to 11.4% Whites (18+) Any tobacco use 41.7% compared to 31.2% Whites (12+)
4 Infant Mortality Rates per 1,000 Live Births by Detailed Race and Hispanic Origin of Mother: U.S., Infant Mortality Rate per 1,000 Live Births All Races White Non-Hispanic White African American Non-Hispanic African American American Indian/Alaska Native Asian/Pacific Islander Hispanic Mexican Puerto Rican Cuban Central & South American Other & Unknown Hispanic/Latino
5 Age-Adjusted Death Rates per 100,000 Persons by Race and Hispanic Origin for Diabetes: U.S., 2005 Age-Adjusted Death Rate per 100,000 Persons All Races White African American 41.5 American Indian/Alaska Native 16.6 Asian/Pacific Islander 33.6 Hispanic
6 Age-Adjusted Death Rates per 100,000 Persons by Race & Hispanic Origin for Chronic Liver Disease & Cirrhosis: U.S., 2005 Age-Adjusted Death Rate per 100,000 Persons All Races White African American 22.6 American Indian/Alaska Native 3.6 Asian/Pacific Islander 13.9 Hispanic
7 Age-Adjusted Death Rates per 100,000 Persons by Race and Hispanic Origin for All Causes: U.S., 2005 AI disparity in health now limited to particular diseases. Age-Adjusted Death Rate per 100,000 Persons All Races White African American American Indian/Alaska Native Asian/Pacific Islander Hispanic
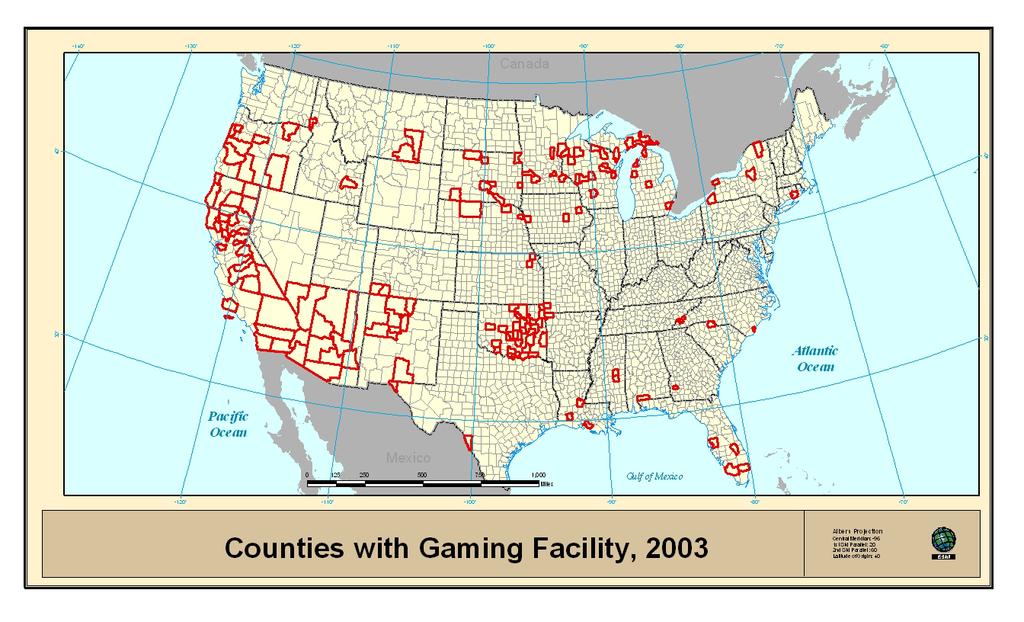
8 How Widespread is Gaming? In 2005, 202 out of 562 federally recognized tribes (FRT) had established gaming compacts. Approximately one third of AI living on a reservation were part of a FRT with a gaming compact
9
10 Is there evidence of selectivity in location of casinos? Poverty rate, Median family income, Percent Native American, Unemployment rate, State conservatism rank *** Number of religious adherents /1, Constant ** N 342 Pseudo R-Squared.09
11 Study Questions 1. Did the income of American Indians increase as a result of tribal gaming? 2. Did American Indians experience better health as a result of tribal gaming? 3. Did American Indians experience better health as a result of income increases tied to tribal gaming?
12 Multi-level Data Structure Behavioral Risk Factors Surveillance System Tribal Gaming Data County Geocode Area Resource File 1990 Merged individual-level data file
13 Multi-level Data Structure Tribal Gaming Data Behavioral Risk Factors Surveillance System Casino-style gaming Date casino opened Tribal affiliation County Geocode Area Resource File 1990 Merged individual-level data file
14
15
16 Multi-level Data Structure Behavioral Risk Factors Surveillance System Individual-level outcomes: Tribal Gaming Income Data Health conditions Risk Behaviors Access to care Individual-level controls Demographic characteristics County Geocode Merged individual-level data file Area Resource File 1990
17 Multi-level Data Structure County level environmental controls: Poverty Employment Per capita income Tribal Gaming Data Behavioral Risk Factors Surveillance System County Geocode Area Resource File 1990 Merged individual-level data file
18 Multi-level Data Structure Tribal Gaming Data Behavioral Risk Factors Surveillance System County Geocode 24,000 American Indian adults Pooled cross sections Allows a With Gaming v. Without Gaming comparison among American Indians Allows a before-after Area comparison among Resource American Indians File 1990 Not limited to reservation pop or IHS Merged individual-level data file
19 When we talk of a tribe having a gaming facility, this means they had a facility for at least two years Two samples Full sample (N=24,079): all American Indians included in BRFSS Before-after sample (N=8,973): All AI respondents linked to a tribe that operated a Class III gaming facility at any point during the period of observation
20 Models Y = αdind + βx + γc + θr + μ Where Y = income, DinD = [Casino ever=1*casino=1], X=individual variables, C: community variables, R=casino ever=1 H =δdind + θy +ξx + ψc + φr + η (H is vector of health outcomes) Note: ESTIMATED MODELS RUN ON INDIVIDUALS BUT ADJUSTED FOR COUNTY OF RESIDENCE USING CLUSTER ADJUSTMENT OF SE
21 Multiple Regression Analysis: Income Dependent Variable Household Income (self report) midpoints of brackets (and 1.5* times highest bracket) Key Independent Variable DinD (Casino ever*casino) County-level Controls % unemployed 1990 % poverty 1990 Per capita income 1990 MDs per capita Individual-level Controls Age Gender Education Marital Status Employment Year
22 Results: Income Mean annual household income of ~$33,000 (year 2000 dollars) At median estimate of effect of DinD (Gaming) on Income and ln income (OLS) Income ln income DinD 2451 (7.4%)*** 1283 (3.9%)***
23 Results: Income Mean annual household income of ~$33,000 (year 2000 dollars) At median estimate of effect of DinD (Gaming) on Income and ln income (OLS) Income ln income DinD 2451 (7.4%)*** 1283 (3.9%)*** Sensitivity tests Pre-Post 2647*** 1450*** Interval DinD 1941*** 1544*** No Added controls 2659*** 1732***
24 Health Outcomes Health Indicators 1. Poor/fair health 2. Hypertension 3. High cholesterol 4. Asthma 5. Disability 6. Obesity 7. Diabetes Access to Care 1. Health Coverage 2. Foregone Care Risk behaviors 1. Smoking 2. Binge drinking (days) Mental Health (days) 1. Poor mental health 2. Depression 3. Anxiety
25 Results: Direct Effect of Gaming DinD Health Indicators [-] Poor/fair health [-] Hypertension [+] High cholesterol [-] Asthma [-] Disability [-] Obesity [-] Diabetes Access to Care [+] Health Coverage [-] Forgone Care Risk behaviors [-] Smoking [-] Binge drinking (days) Mental Health (days) [+] Poor mental health [+] Depression [+] Anxiety
26 Results: Direct Effect of Gaming DinD Health Indicators [-] Poor/fair health [-] Hypertension [+] High cholesterol [-] Asthma [-] Disability [-] Obesity [-] Diabetes Access to Care [+] Health Coverage [-] Forgone Care Risk behaviors [-] Smoking [-] Binge drinking (days) Mental Health (days) [+] Poor mental health [+] Depression [+] Anxiety
27 Results: Total Effect of Gaming (Direct+indirect effect through change in income) Core Results Health Indicators Poor/fair health ( %) Hypertension (-4.1%) High cholesterol (.3%)ns Asthma (-2.7%) Disability (-10.1%) Obesity (-1.7%) Diabetes (-7.8%)
28 Core results continued Risk behaviors Smoking (-5.3%) Binge drinking (days) (-.4) Mental Health (days) Poor mental health ( %) Depression ( %) Anxiety ( %)* *LN specification has negative results. Both Statistically significant.
29 Core Results - 3 Access to Care Health Coverage ( %) Forgone Care (-3 3.5%)
30 Sensitivity Results: Specification with DinD, income and with Casino dummy only [NO ADDED CONTROLS] Before Gaming vs. After Gaming Restricted sample of American Indians living in counties that have gaming tribes by 2003 Recall Positive, statistically significant association between income and gaming
31 Sensitivity Results: Total Effect of Gaming (Direct+indirect effect through change in income) Health Status Health Indicators No added controls Poor/fair health -10.5% Hypertension -4.7% High cholesterol -3% Asthma -18% Disability -27% Obesity +10% Diabetes +6%
32 Sensitivity results continued Health indicator No added controls Smoking -10% Binge drinking (days) -10.6% Days of Poor mental health -13% Depression -32% Anxiety -20.5% Access to Care Health Coverage -1.9% Forgone Care -18%
33 Sensitivity Results: Total Effect of Gaming (Direct+indirect effect through change in income) Health Status Health Indicators Before-after sample Core Poor/fair health -1.6% -1.5% Hypertension -4% -4% High cholesterol -.4ns.3% Asthma -8% -3% Disability -10% -10% Obesity -1.7% -1.7% Diabetes -8% -8%
34 Sensitivity results continued Health indicator Before-after Core Smoking -5.5% -5.3% Binge drinking (days) +2.5% -.4% Days of Poor mental health 2.5% 2.7% Depression 6% 1.2% Anxiety 1.2% % Access to Care Health Coverage 2.4% 1.3% Forgone Care -3.3% -3.3%
35 Conclusions Strong evidence that gaming is associated with income increases for American Indians Gaming is associated with better health outcomes, access, and less risk taking behaviors both in terms of full effect (direct and indirect) and through income increases (indirect). Gaming has unexpected positive associations with measures of mental health (though association with indirect effect via income is to reduce days with poor mental health, depression and anxiety.)
36 Limitations/Future Work Limitations Associations likely underestimated due to: Measurement error Tribal affiliation Casino income National Aggregate BRFSS 11.9% of AIAN households are phoneless compared to 2.4% of all households ( 2000 Census) Cross-sectional Future Work: Non-AI comparisons, regional variation
Community Health Profile: Minnesota, Wisconsin, & Michigan Tribal Communities 2006
 Community Health Profile: Minnesota, Wisconsin, & Michigan Tribal Communities 26 This report is produced by: The Great Lakes EpiCenter If you would like to reproduce any of the information contained in
ELIMINATING HEALTH DISPARITIES IN AN URBAN AREA. VIRGINIA A. CAINE, M.D., DIRECTOR MARION COUNTY HEALTH DEPARTMENT INDIANAPOLIS, INDIANA May 1, 2002
 ELIMINATING HEALTH DISPARITIES IN AN URBAN AREA VIRGINIA A. CAINE, M.D., DIRECTOR MARION COUNTY HEALTH DEPARTMENT INDIANAPOLIS, INDIANA May 1, 2002 Racial and ethnic disparities in health care are unacceptable
Demographics and Health Data
 Demographics and Health Data Information for Local Planners City of Lakewood, WA Demographic Characteristics Environmental Health Division 3629 South D Street, Tacoma, WA 98418 (253) 798-6470 Table 1 presents
Community Health Profile: Minnesota, Wisconsin & Michigan Tribal Communities 2005
 Community Health Profile: Minnesota, Wisconsin & Michigan Tribal Communities 25 This report is produced by: The Great Lakes EpiCenter If you would like to reproduce any of the information contained in
PHACS County Profile Report for Searcy County. Presented by: Arkansas Center for Health Disparities and Arkansas Prevention Research Center
 PHACS County Profile Report for Searcy County Presented by: Arkansas Center for Health Disparities and Arkansas Prevention Research Center Contents Introduction... Page 2 Demographics...Page 3 Social Environment
Walworth County Health Data Report. A summary of secondary data sources
 Walworth County Health Data Report A summary of secondary data sources 2016 This report was prepared by the Design, Analysis, and Evaluation team at the Center for Urban Population Health. Carrie Stehman,
Demographics and Health Data
 Demographics and Health Data Information for Local Planners City of Puyallup, WA Demographic Characteristics Environmental Health Division 3629 South D Street, Tacoma, WA 98418 (253) 798-6470 Table 1 presents
2014 Butte County BUTTE COUNTY COMMUNITY HEALTH ASSESSMENT
 2014 Butte County BUTTE COUNTY COMMUNITY HEALTH ASSESSMENT EXECUTIVE SUMMARY 2015 2017 EXECUTIVE SUMMARY TOGETHER WE CAN! HEALTHY LIVING IN BUTTE COUNTY Hundreds of local agencies and community members
Measuring Equitable Care to Support Quality Improvement
 Measuring Equitable Care to Support Quality Improvement Berny Gould RN, MNA Sr. Director, Quality, Hospital Oversight, and Equitable Care Prepared by: Sharon Takeda Platt, PhD Center for Healthcare Analytics
Health Profile Chartbook 2016 Kalkaska County
 Health Profile Chartbook 2016 Kalkaska County 2016 Chartbooks The 2016 Chartbooks provide a snapshot of the health status of the District Health Department #10 jurisdiction. Information is presented by
Health Profile Chartbook 2016 Mecosta County
 Health Profile Chartbook 2016 Mecosta County 2016 Chartbooks The 2016 Chartbooks provide a snapshot of the health status of the District Health Department #10 jurisdiction. Information is presented by
Data Disaggregation to Inform Health Policy
 Data Disaggregation to Inform Health Policy Minh Wendt Data Policy Lead Division of Policy & Data Office of Minority Health Department of Health and Human Services The Report of the Secretary s Task Force
Regional and Hispanic Subgroup Disparities in the Prevalence of Diabetes & Hypertension Among Older Adults
 Regional and Hispanic Subgroup Disparities in the Prevalence of Diabetes & Hypertension Among Older Adults Catherine Pérez Jennifer A. Ailshire Conference Series on Aging in the Americas September 21,
Community Health Needs Assessment (CHNA)
") Community Health Needs Assessment (CHNA) Pierce ; St. Croix Contents Demographics... 3 Total Population... 4 Median Age... 6 Population Under Age 18... 8 Population Age 65+... 9 Population with Any Disability...
Community Health Needs Assessment (CHNA) Pierce ; St. Croix Contents Demographics... 3 Total Population... 4 Median Age... 6 Population Under Age 18... 8 Population Age 65+... 9 Population with Any Disability...
Colorado Health Disparities Profiles
 Health Disparities Profiles includes: Larimer County Population Total Population Source: CDC/NCHS 2007-based, bridged-race population estimates, 2007. Social Determinants of Health 287,574 248,312 26,629
Colorado Health Disparities Profiles
 Health Disparities Profiles County includes: Jackson, Moffat, Rio Blanco, and Counties Population Total Population 22,382 43,638 4,861,515 21,015 39,473 3,508,736 904 3,224 909,833 140 263 228,718 210
Issues in Women & Minority Health
 Issues in Women & Minority Health Dr. Dawn Upchurch Professor Department of Community Health Sciences PH 150 Dr. Upchurch 1 Overview of Session HP 2010 Model: Determinants of Health Review of HP 2010 Goals
5. Cardiovascular Disease & Stroke
 5. Cardiovascular Disease & Stroke 64: Self-Reported Heart Disease 66: Heart Disease Management 68: Heart Disease Mortality 70: Heart Disease Mortality Across Life Span 72: Stroke Mortality 185: Map 3:
Quantitative Data: Measuring Breast Cancer Impact in Local Communities
 Quantitative Data: Measuring Breast Cancer Impact in Local Communities Quantitative Data Report Introduction The purpose of the quantitative data report for the Southwest Florida Affiliate of Susan G.
Northampton County. State of the County Health Report (SOTCH)
") ampton County 2015 State of the County Health Report (SOTCH) ampton County Health Department 9495 NC Highway 305 P.O. Box 635 Jackson, NC 27845 252-534-5841 John White, Acting Health Director Virginia
ampton County 2015 State of the County Health Report (SOTCH) ampton County Health Department 9495 NC Highway 305 P.O. Box 635 Jackson, NC 27845 252-534-5841 John White, Acting Health Director Virginia
Survival among Native American Adolescent and Young Adult Cancer Patients in California
 Survival among Native American Adolescent and Young Adult Cancer Patients in California Cyllene R. Morris, 1 Yi W. Chen, 1 Arti Parikh-Patel, 1 Kenneth W. Kizer, 1 Theresa H. Keegan 2 1 California Cancer
Cultural Competency: Serving American Indian Patients
 Cultural Competency: Serving American Indian Patients First Time Motherhood/New Parent Initiative EDGECOMBE HALIFAX HERTFORD GATES NASH NORTHAMPTON Goal To increase the effectiveness of health care with
Community Health Status Assessment
 Community Health Status Assessment EXECUTIVE SUMMARY The Community Health Status Assessment (CHSA) is one of four assessments completed as part of the 2015-2016 Lane County Community Health Needs Assessment
Lung Cancer Burden among the American Indian and Alaska NaEve PopulaEons
 NaEonal NaEve Network Cancer Risk ReducEon Webinar Series: Lung Cancer Burden among the American Indian and Alaska NaEve PopulaEons J. Michael Underwood, PhD Epidemiologist Comprehensive Cancer Control
Incidence of Primary Liver Cancer in American Indians and Alaska Natives
 Incidence of Primary Liver Cancer in American Indians and Alaska Natives Stephanie C. Melkonian, PhD Epidemiologist Epidemiology and Applied Research Branch NAACCR Annual Conference June 21, 2017 Overview
Table of Contents. 2 P age. Susan G. Komen
 RHODE ISLAND Table of Contents Table of Contents... 2 Introduction... 3 About... 3 Susan G. Komen Affiliate Network... 3 Purpose of the State Community Profile Report... 4 Quantitative Data: Measuring
Are You Ready to Sail. February 11, 2016
 Are You Ready to Sail your SHIP?! February 11, 2016 Acknowledgement and Disclaimer This webinar was supported by funds made available from the Centers for Disease Control and Prevention, Office for State,
Healthy People 2010 Leading Health Indicators: California, 2000
 January 4 DATA SUMMARY No. DS4- Healthy People Leading Health Indicators: California, By Jim Sutocky This report focuses on the Healthy People Leading Health Indicators (LHIs). H i g h l i g h t s As of
Community Health Needs Assessment
 Community Health Needs Assessment Gratiot County Community Health Assessment Community Health Assessment Data Sources Primary Data (new data collected first-hand) Community Opinion Survey Provider Opinion
Early Childhood Caries in American Indian Children: DISPARITIES & PREVENTION
 Early Childhood Caries in American Indian Children: DISPARITIES & PREVENTION UCSF Dental Public Health Seminar Series, May 10, 2016 Tamanna Tiwari, MPH, MDS, BDS Clinical Instructor School of Dental Medicine
Table of Contents. 2 P a g e. Susan G. Komen
 NEW HAMPSHIRE Table of Contents Table of Contents... 2 Introduction... 3 About... 3 Susan G. Komen Affiliate Network... 3 Purpose of the State Community Profile Report... 4 Quantitative Data: Measuring
New Mexico Department of Health. Racial and Ethnic Health Disparities Report Card
 New Mexico Department of Health Racial and Ethnic Health Disparities Report Card August 30, 2006 Acknowledgments Many individuals contributed to the production of this report card and the Office of Policy
Table of Contents. Executive Summary.3. McLaren Central Michigan Priority Needs Identified 9. Service Area Profile 11
 Community Health Needs Assessment 2016 2019 1 Table of Contents Executive Summary.3 McLaren Central Michigan Priority Needs Identified 9 Service Area Profile 11 Demographic and Socioeconomic Indicators.12
Executive Summary To access the report in its entirety, visit
 Executive Summary To access the report in its entirety, visit http://www.hpcswf.com/health-planning/health-planningprojects/. Demographic and Socioeconomic Characteristics Population Demographics has a
Baseline Health Data Report: Cambria and Somerset Counties, Pennsylvania
 Baseline Health Data Report: Cambria and Somerset Counties, Pennsylvania 2017 2018 Page 1 Table of Contents Executive Summary.4 Demographic and Economic Characteristics 6 Race and Ethnicity (US Census,
Descriptive Statistics and Trends for Michigan Community Health Centers Region 1
 August 2018 Descriptive Statistics and Trends for Michigan Community Health Centers Region 1 Michigan Primary Care Association www.mpca.net Overview Demographics Health Center Trends Health Indicators
Profile of DeKalb County
 Profile of DeKalb County Figure 1: Population by Race, DeK alb County, 2012 Estimate Table 1: DeK alb County Population Profile Profile of DeKalb County POPULATION ESTIMATES According to the 2008 and 2012
Consolidated Project Information Project 4.a.ii Substance Abuse Prevention and Identification Initiative
 Consolidated Project Information Project 4.a.ii Substance Abuse Prevention and Identification Initiative Contents 4.a.ii Prevent Substance Abuse and Other Mental Emotional Disorders (Focus Area 2)... 3
Consolidated Project Information Project 4.b.ii Access to Chronic Disease Preventive Care Initiative
 Consolidated Project Information Project 4.b.ii Access to Chronic Disease Preventive Care Initiative Contents 4.b.ii Increase Access to High Quality Chronic Disease Preventative Care and Management in
Table of Contents. 2 P age. Susan G. Komen
 NEVADA Table of Contents Table of Contents... 2 Introduction... 3 About... 3 Susan G. Komen Affiliate Network... 3 Purpose of the State Community Profile Report... 4 Quantitative Data: Measuring Breast
Health Status of New Mexico 2015
 Health Status of New Mexico 2015 New Mexico Health s Northwest Northeast Metro Southwest Southeast NM Urban-Rural County Classification Metropolitan Counties Small Metro Counties Mixed Urban/Rural Counties
CHRONOLOGICAL RECORD OF MEDICAL CARE Behavioral Medicine Associates, Inc North Virginia Avenue Roswell, NM 88201
 CHRONOLOGICAL RECORD OF MEDICAL CARE Behavioral Medicine Associates, Inc. 1010 North Virginia Avenue Roswell, NM 88201 Instructions: Please fill this form out completely. All items must be responded to.
CDRI Cancer Disparities Geocoding Project. November 29, 2006 Chris Johnson, CDRI
 CDRI Cancer Disparities Geocoding Project November 29, 2006 Chris Johnson, CDRI cjohnson@teamiha.org CDRI Cancer Disparities Geocoding Project Purpose: To describe and understand variations in cancer incidence,
The Heterosexual HIV Epidemic in Chicago: Insights into the Social Determinants of HIV
 The Heterosexual HIV Epidemic in Chicago: Insights into the Social Determinants of HIV Nikhil Prachand, MPH Board of Health Meeting January 19, 2011 STI/HIV/AIDS Division Today s Presentation Epidemiology
WASHINGTON STATE COMPARISONS TO: KITSAP COUNTY CORE PUBLIC HEALTH INDICATORS May 2015
 WASHINGTON STATE COMPARISONS TO: KITSAP COUNTY CORE PUBLIC HEALTH INDICATORS This is a companion document to the Core Public Health Indicators that provides a comparison of to Washington State for the
DEPRESSION AND ANXIETY STATUS IN KANSAS
 DEPRESSION AND ANXIETY STATUS IN KANSAS 2011 Behavioral Risk Factor Surveillance System This report was prepared by the Bureau of Health Promotion, Kansas Department of Health and Environment February
2016 Collier County Florida Health Assessment Executive Summary
 2016 Florida Health Assessment Executive Summary Prepared by: The Health Planning Council of Southwest Florida, Inc. www.hpcswf.com Executive Summary To access the report in its entirety, visit http://www.hpcswf.com/health-planning/health-planningprojects/.
Wellness County Profile ROGERS
 Wellness County Profile 2018 ROGERS OKLAHOMA MAPS This image cannot currently be displayed. ROGERS Insurance Coverage Population 91,766 Unemployment Rate (2013-2015) High School Dropouts: Class
Wellness County Profile STEPHENS
 Wellness County Profile 2018 STEPHENS OKLAHOMA MAPS STEPHENS Insurance Coverage Population 44,090 Unemployment Rate (2013-2015) High School Dropouts: Class of 16 Uninsured Insured 15.9% Stephens
Wellness County Profile JOHNSTON
 Wellness County Profile 2018 JOHNSTON OKLAHOMA MAPS JOHNSTON Insurance Coverage Population 11,087 Unemployment Rate (2013-2015) High School Dropouts: Class of 16 Uninsured Insured 19.1% Johnston
Wellness County Profile CRAIG
 Wellness County Profile 2018 CRAIG OKLAHOMA MAPS CRAIG Insurance Coverage Population 14,625 Unemployment Rate (2013-2015) High School Dropouts: Class of 16 Uninsured Insured 18.1% Craig 5.6
LATINO OLDER ADULTS AND ALCOHOL USE: A DESCRIPTIVE ANALYSIS. Andrea Soria California State University, Long Beach May 2015
 LATINO OLDER ADULTS AND ALCOHOL USE: A DESCRIPTIVE ANALYSIS Andrea Soria California State University, Long Beach May 2015 INTRODUCTION The purpose of this cross-sectional study was to gain a better understanding
Diversity Data Snapshots March 2014 Edition
 Diversity Data Snapshots March 2014 Edition Diversity Policy and Programs CDC Health Disparities and Inequalities Report United States, 2013 CDC Health Disparities and Inequalities Report United States,
Central New York Care Collaborative, Inc. PPS Community Profile
 Central New York Care Collaborative, Inc. PPS Community Profile Counties served: Cayuga, Lewis, Madison, Oneida, Onondaga, and Oswego DEMOGRAPHICS 1 The total population of the Central New York Care Collaborative
Wellness County Profile GARFIELD
 Wellness County Profile 2018 GARFIELD OKLAHOMA MAPS GARFIELD Insurance Coverage Population 62,603 Unemployment Rate (2013-2015) High School Dropouts: Class of 16 Uninsured Insured 16.5% Garfield
Wellness County Profile GARVIN
 Wellness County Profile 2018 GARVIN OKLAHOMA MAPS GARVIN Insurance Coverage Population 27,838 Unemployment Rate (2013-2015) High School Dropouts: Class of 16 Uninsured Insured 16.7% Garvin
MARICOPA COUNTY COMMUNITY HEALTH ASSESSMENT. Maricopa County Board of Health July 23, 2012 Eileen Eisen-Cohen, PhD
 MARICOPA COUNTY COMMUNITY HEALTH ASSESSMENT Maricopa County Board of Health July 23, 2012 Eileen Eisen-Cohen, PhD 1 What? Why? We Are Here 2 Local Public Health System Faith Instit. Military Dentists Labs
Wellness County Profile BECKHAM
 Wellness County Profile 2018 BECKHAM OKLAHOMA MAPS BECKHAM Insurance Coverage Population 22,519 Unemployment Rate (2013-2015) High School Dropouts: Class of 16 Uninsured Insured 15.2% Beckham
Wellness County Profile SEMINOLE
 Wellness County Profile 2018 SEMINOLE OKLAHOMA MAPS SEMINOLE Insurance Coverage Population 25,207 Unemployment Rate (2013-2015) High School Dropouts: Class of 16 Uninsured Insured 18.9% Seminole
Wellness County Profile SEQUOYAH
 Wellness County Profile 2018 SEQUOYAH OKLAHOMA MAPS SEQUOYAH Insurance Coverage Population 41,294 Unemployment Rate (2013-2015) High School Dropouts: Class of 16 Uninsured Insured 18.1% Sequoyah
Wellness County Profile PAYNE
 Wellness County Profile 2018 PAYNE OKLAHOMA MAPS PAYNE Insurance Coverage Population 81,131 Unemployment Rate (2013-2015) High School Dropouts: Class of 16 Uninsured Insured 15.6% Payne 3.9
Walkability vs. Several Health Diagnoses for Klamath Falls, OR
 Walkability vs. Several Health Diagnoses for Klamath Falls, OR John Ritter, Ph.D. Geomatics Dept, Oregon Tech Stephanie Van Dyke, MD, MPH Medical Director, Sky Lakes Wellness Center Katherine Pope, RN,
Mark B Horton, MD, MSPH 22 March 2011
 Mark B Horton, MD, MSPH 22 March 2011 Major Points Need for better data Focus on disparities Focus on social determinants Focus on healthy communities Focus on health care quality Public Health Data Sources
Wellness County Profile MCCLAIN
 Wellness County Profile 2018 MCCLAIN OKLAHOMA MAPS McCLAIN Insurance Coverage Population 38,682 Unemployment Rate (2013-2015) High School Dropouts: Class of 16 Uninsured Insured 15.3% McClain
This slide set provides an overview of the impact of type 1 and type 2 diabetes mellitus in the United States, focusing on epidemiology, costs both
 This slide set provides an overview of the impact of type 1 and type 2 diabetes mellitus in the United States, focusing on epidemiology, costs both direct and indirect and the projected burden of diabetes,
David V. McQueen. BRFSS Surveillance General Atlanta - Rome 2006
 David V. McQueen Associate Director for Global Health Promotion, National Center for Chronic Disease Prevention and Health Promotion, Atlanta BRFSS Surveillance General Atlanta - Rome 2006 Behavioral Risk
Overweight and Obesity Rates Among Upstate New York Adults
 T H E F A C T S A B O U T Overweight and Obesity Rates Among Upstate New York Adults Upstate New York Obesity Rate: 27.5% Overweight Rate: 35.5% Increase in the combined overweight/ obesity rate from 2003
Racial disparities in health outcomes and factors that affect health: Findings from the 2011 County Health Rankings
 Racial disparities in health outcomes and factors that affect health: Findings from the 2011 County Health Rankings Author: Nathan R. Jones, PhD University of Wisconsin Carbone Cancer Center Introduction
Northampton County State of the County Health Report (SOTCH)
") Northampton County 2017 State of the County Health Report (SOTCH) Northampton County Health Department 9495 NC Highway 305 P.O. Box 635 Jackson, NC 27845 (252)534-5841 Andy Smith, Health Director Virginia
Northampton County 2017 State of the County Health Report (SOTCH) Northampton County Health Department 9495 NC Highway 305 P.O. Box 635 Jackson, NC 27845 (252)534-5841 Andy Smith, Health Director Virginia
2010 Community Health Needs Assessment Final Report
 2010 Community Health Needs Assessment Final Report April 2011 TABLE OF CONTENTS A. BACKGROUND 3 B. DEMOGRAPHICS 4 C. GENERAL HEALTH STATUS 10 D. ACCESS TO CARE 11 E. DIABETES 12 F. HYPERTENSION AWARENESS
Table of Contents. 2 P age. Susan G. Komen
 WYOMING Table of Contents Table of Contents... 2 Introduction... 3 About... 3 Susan G. Komen Affiliate Network... 3 Purpose of the State Community Profile Report... 4 Quantitative Data: Measuring Breast
Secondary Data Report. Prepared by: Sponsored by: Health System Members of the Milwaukee Health Care Partnership
 Secondary Data Report A summary of secondary data sources related to health in County. 2015-2016 Sponsored by: Health System Members of the Health Care Partnership Aurora Health Care Children s Hospital
ABSTRACT. Effects of Birthplace, Language, and Length of Time in the U.S. on Receipt of Asthma Management Plans Among U.S. Adults with Current Asthma
 ABSTRACT Title of thesis: Effects of Birthplace, Language, and Length of Time in the U.S. on Receipt of Asthma Management Plans Among U.S. Adults with Current Asthma Sonja Natasha Williams, Masters of
2013 Arizona State Health Assessment Summary and Findings. Health and Wellness for all Arizonans
 2013 Arizona State Health Assessment Summary and Findings Health and Wellness for all Arizonans Presentation Overview The State Health Assessment Process Health Indicators 15 Leading Health Issues: o County
Millennium Collaborative Care PPS Community Profile
 Millennium Collaborative Care PPS Community Profile Counties served: Allegany, Cattaraugus, Chautauqua, Erie, Genesee, Niagara, Orleans, and Wyoming DEMOGRAPHICS 1 Millennium Collaborative Care (MCC) PPS
American Indian Initiative to Prevent and Reduce the Use of Commercial Tobacco Products
 American Indian Initiative to Prevent and Reduce the Use of Commercial Tobacco Products APRIL ROESELER, BRANCH CHIEF, CALIFORNIA TOBACCO CONTROL PROGRAM JENNY WONG, CHIEF, HEALTH EQUITY & LOCAL PROGRAMS
2019 COMMUNITY HEALTH ASSESSMENT
 2019 COMMUNITY HEALTH ASSESSMENT Northampton County Health Department 9495 NC Highway 305 P.O. Box 635, Jackson, NC 27845 Andy Smith, Health Director Virginia McClary, Health Educator/Author 1 Table of
Healthy Montgomery Obesity Work Group Montgomery County Obesity Profile July 19, 2012
 Healthy Montgomery Obesity Work Group Montgomery County Obesity Profile July 19, 2012 Prepared by: Rachel Simpson, BS Colleen Ryan Smith, MPH Ruth Martin, MPH, MBA Hawa Barry, BS Executive Summary Over
Federation of State Boards of Physical Therapy Minimum Data Set Questionnaire
 Federation of State Boards of Physical Therapy Minimum Data Set Questionnaire Purpose: Understanding the current United States Health Workforce enables Federal and State Governments and Health Professional
The Great Lakes EpiCenter News
 The Great Lakes EpiCenter News Epidemiology Project of the Great Lakes Inter-Tribal Council, Inc. Vol.7, No.2 Spring 2006 Epidemiology is the study of the distribution and determinants of health-related
Community Health Profile: Native American Community Health Center
 A Division of the Seattle Indian Health Board Community Health Profile: Native American Community Health Center Phoenix, AZ December 2011 Community Health Profile: Native American Community Health Center
Community Health Profile: Seattle Indian Health Board
 A Division of the Seattle Indian Health Board Community Health Profile: Seattle Indian Health Board Seattle, WA December 2011 Community Health Profile: Seattle Indian Health Board i The mission of the
Table of Contents. 2 P age. Susan G. Komen
 NEW MEXICO Table of Contents Table of Contents... 2 Introduction... 3 About... 3 Susan G. Komen Affiliate Network... 3 Purpose of the State Community Profile Report... 3 Quantitative Data: Measuring Breast
Maryland SHIP Anne Arundel Baseline Data 10/26/2011. MD Baseline. County Baseline. National Baseline
 Arundel Data 10/26/2011 Increase life expectancy in Arundel 1 Reduce infant Arundel 2 deaths Arundel 3 Arundel 4 Arundel 6 Reduce low birth weight (LBW) & very low birth weight (VLBW) Reduce sudden unexpected
Populations of Color in Minnesota
 Populations of Color in Minnesota Health Status Report Update Summary Fall 2002 Center for Health Statistics Minnesota Department of Health Table of Contents Part I: Birth Related Indicators...1 Low Birthweight...1
Population Percent C.I. All Hennepin County adults aged 18 and older 12.1% ± 1.2
 Overview ` Why Is This Indicator Important? Tobacco use remains the single most preventable cause of disease, disability and death in the United States. How Are We Doing? In the past decade, smoking rate
Bassett Medical Center PPS Community Profile
 Bassett Medical Center PPS Community Profile Counties served: Delaware, Herkimer, Madison, Otsego, and Schoharie DEMOGRAPHICS 1 The Bassett Medical Center PPS s total population is 278,214. Age: Residents
STUDENT VERSION. Community Health Assessment: Pitt County, North Carolina. Cases in Population-Oriented Prevention (C-POP)-based teaching
-based teaching") STUDENT VERSION This project has the objective to develop preventive medicine teaching cases that will motivate medical students, residents and faculty to improve clinical preventive competencies complemented
STUDENT VERSION This project has the objective to develop preventive medicine teaching cases that will motivate medical students, residents and faculty to improve clinical preventive competencies complemented
Worcester County Report Card 2012
 Worcester County Report Card 2012 W H Deborah Goeller, R.N., M.S. Health Officer Introduction This community health 2012 Report Card is the fourth published by the Worcester County Health Department. There
Community Health Profile: Native American Lifelines
 A Division of the Seattle Indian Health Board Community Health Profile: Native American Lifelines Boston, MA December 2011 Community Health Profile: Native American Lifelines i The mission of the Urban
Behavioral Risk Factor Surveillance System (BRFSS)
") Behavioral Risk Factor Surveillance System (BRFSS) LINA BALLUZ, MPH, Sc.D. Chief Proposed Office of Surveillance, Epidemiology and Laboratory Services Behavior Surveillance Division Overview Background
Behavioral Risk Factor Surveillance System (BRFSS) LINA BALLUZ, MPH, Sc.D. Chief Proposed Office of Surveillance, Epidemiology and Laboratory Services Behavior Surveillance Division Overview Background
Trends in Pneumonia and Influenza Morbidity and Mortality
 Trends in Pneumonia and Influenza Morbidity and Mortality American Lung Association Epidemiology and Statistics Unit Research and Health Education Division November 2015 Page intentionally left blank Introduction
Racial Differences in the Prevalence of Depressive Disorders Among U.S. Adult Population
 Georgia State University ScholarWorks @ Georgia State University Mathematics Theses Department of Mathematics and Statistics Fall 12-11-2012 Racial Differences in the Prevalence of Depressive Disorders
Lincoln Trail District Health Department. Health Report Card
 Lincoln Trail District Health Department 2015 Health Report Card 108 New Glendale Road, Elizabethtown, KY 42701 Phone: 270-769-1601 Fax: 270-765-7274 Website: www.ltdhd.ky.gov Mission The Lincoln Trail
CHS 2009 Baltimore City Community Health Survey: Summary Results Report
 CHS 2009 Baltimore City Community Health Survey: Summary Results Report About the Survey: A representative sample of 1,134 Baltimore residents participated in the Community Health Survey The survey reached
Table of Contents. 2 P age. Susan G. Komen
 OREGON Table of Contents Table of Contents... 2 Introduction... 3 About... 3 Susan G. Komen Affiliate Network... 3 Purpose of the State Community Profile Report... 4 Quantitative Data: Measuring Breast
Health System Members of the Milwaukee Health Care Partnership
 Health System Members of the Milwaukee Health Care Partnership Aurora Health Care Children s Hospital of Wisconsin Columbia St. Mary s Health System Froedtert Health Wheaton Franciscan Healthcare In Collaboration
County-Level Analysis of U.S. Licensed Psychologists and Health Indicators
 County-Level Analysis of U.S. Licensed Psychologists and Health Indicators American Psychological Association Center for Workforce Studies Luona Lin, Karen Stamm and Peggy Christidis March 2016 Recommended
Disparities in Tobacco Product Use in the United States
 Disparities in Tobacco Product Use in the United States ANDREA GENTZKE, PHD, MS OFFICE ON SMOKING AND HEALTH CENTERS FOR DISEASE CONTROL AND PREVENTION Surveillance & Evaluation Webinar July 26, 2018 Overview
State of Iowa Outcomes Monitoring System
 State of Iowa Outcomes Monitoring System THE IOWA CONSORTIUM FOR SUBSTANCE ABUSE RESEARCH AND EVALUATION Year 17 Annual Outcome Evaluation Trend Report November 2015 With Funds Provided By: Iowa Department