To compare the relative amount of of selected gene expression between sham and
|
|
|
- Daniel Goodwin
- 5 years ago
- Views:
Transcription
1 Supplementary Materials and Methods Gene Expression Analysis To compare the relative amount of of selected gene expression between sham and mice given renal ischemia-reperfusion injury (IRI), ncounter Analysis System was used (Nanostring, Seattle, USA). In brief, mice were sacrificed 4 hrs post reperfusion, and total RNA was isolated from kidney tissue and splenic B cells sorted out using FACSAria III (BD). The experiment using ncounter GX Mouse Immunology V1 kit (Nanostring) was performed by PhileKorea Technology, Inc. (Seoul, Korea), following the manufacturers instructions. The full list of analyzed genes can be found in Among the genes with significantly changed expressions, cytokine, chemokine and their receptor genes were selected in Supplementary Tables 1-2. Magnetic Resonance Imaging MRI experiments were performed with a 9.4 T/160 mm Agilent MRI scanner (Agilent Inc., Palo Alto, CA) using a millipede RF volume coil (inner diameter, 3.5 cm). Mice were anesthetized through a mask via spontaneous inhalation of 1.5% 2.0% isoflurane and placed in the handling system in the prone position. Automatic first-order shimming was performed to minimize B0 in homogeneities prior to MRI scanning. Coronal T2-weighted fast spin-echo images were obtained (repetition time [TR] = 4500 ms; kzero = 4; echo spacing = 12 ms; 16 segments; echo train length = 8; effective echo time [TE] = 48 ms; 4 averages; matrix = ; field of view = mm; slice thickness = 1.2 mm). DTI was performed using a spin-echo sequence with a Jones6 software (TR/TE = 2500/31.3 ms; slice thickness = 1.2 mm; 4 averages; matrix = ; gradient amplitude = 16.4 G/cm; duration = 4 ms; separation 1
2 = 10 ms; target b value = 300 s/mm; 6 directions). ADC and FA maps were processed using VNMRJ software (Agilent Technologies). Regions of interest (ROIs) were carefully drawn over the renal cortex, corticomedulla, and medulla in a T2-weighted image. ADC and FA values were measured and analyzed in each ROI. 2
3 Supplementary Tables Table S1. Fold changes of cytokines/chemokines and their receptors gene expression of renal IRI kidneys compared with that of healthy kidneys (n=2) Up-regulated Gene Name Common name Ratio Down-regulated Gene Name 3 Common name Ratio CX3C chemokine Il6 Interleukin Cx3cr receptor 1 tumor necrosis factor chemokine (C-X-C Cxcl Tnfsf10 (ligand) superfamily, motif) ligand 1 member 10 Interleukin 1 receptor, Il1r Il15 Interleukin type II (IL1R2) stromal cell-derived Ccl2 Ccl7 Il1rn Ccl3 Ccl4 Tnfrsf1b Tnfsf18 Ccl9 chemokine (C-C motif) Cxcl12 ligand 2 Chemokine (C-C motif) 7.41 ligand 7 interleukin-1 receptor 6.44 antagonist Chemokine (C-C motif) 6.31 ligand 3 Chemokine (C-C motif) 5.65 ligand 4 Tumor necrosis factor receptor superfamily 4.64 member 1B Tumor necrosis factor ligand superfamily 4.54 member 18 Chemokine (C-C motif) 3.86 ligand 9 Il1b Interleukin-1 beta 3.44 Il1r1 Il4ra Cxcl10 Il6ra Cxcr4 Interleukin 1 receptor, 3.33 type I interleukin 4 receptor, 3.28 C-X-C motif 2.65 chemokine 10 interleukin 6 receptor, 2.64 C-X-C chemokine 2.22 receptor type 4 factor 1 (SDF-1) also known as C-X-C motif chemokine 12
4 Table S2. Fold changes of cytokines/chemokines and their receptors gene expression of splenic B cells from renal IRI mice compared with that of healthy (n=2) Gene Name Up-regulated Common name Ratio 4 Gene Name Down-regulated Common name Il7r interleukin-7 receptor Il18 Interleukin-18 (interferongamma inducing factor) Tumor necrosis factor receptor superfamily Il18r1 interleukin-18 receptor member 13C Tnfrsf13c 1 (B-cell-activating factor receptor or BAFF receptor) Il2rb Tumor necrosis factor Interleukin-2 receptor Tnfrsf13b receptor superfamily subunit beta member 13B Ccl5 Cxcr6 Tnfsf8 Il1rl2 Il6st Ccr9 Il18rap Il6ra Tnfsf10 Il2ra Tnfrsf4 Ifngr1 Cxcr3 Tnfaip3 Il27ra Chemokine (C-C motif) ligand 5 C-X-C chemokine receptor type 6 tumor necrosis factor (ligand) superfamily, member 8 Interleukin-1 receptorlike 2 interleukin 6 signal transducer C-C chemokine receptor type 9 Interleukin 18 receptor accessory protein interleukin 6 receptor, tumor necrosis factor (ligand) superfamily, member 10 interleukin 2 receptor, tumor necrosis factor (ligand) superfamily, member 4 Interferon gamma receptor 1 (IFNGR1) C-X-C chemokine receptor type 3 tumor necrosis factor, -induced protein 3 Interleukin 27 receptor, Cxcr Il10ra Il12a C-X-C chemokine receptor type 5 Interleukin 10 receptor, subunit Interleukin-12 subunit Ratio
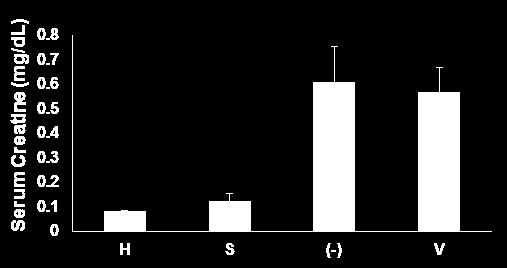
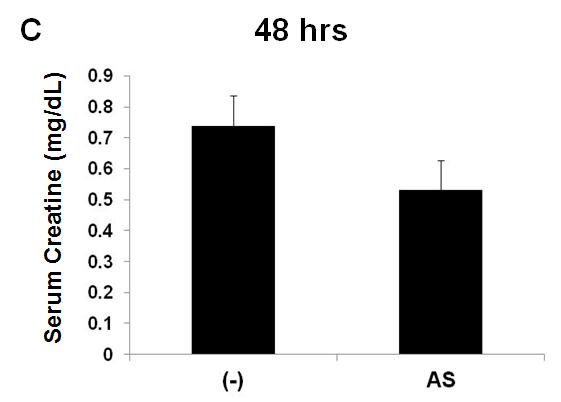
5 Supplementary Figure Legends Figure S1. The results of a serum creatine assay. (A) Mice were administered per os with designated inhibitors and, 24 hours later, sera were collected for a creatine assay. The error bars represent the SEM. n=2 5 mice. H, healthy; V, vehicle control; LY, LY294002; AS, AS252424; IC, IC The numbers indicate the doses in milligrams/kilogram. (B) Mice were administered per os with the designated inhibitors 30 min prior to anesthesia and, 4 hrs post-ischemia, sera were collected for a creatine assay. The error bars represent the SEM. n=4 6 mice/group. H, healthy; S, sham; (-), negative control given renal IRI without any reagents; V, vehicle control. (C) Mice were administered per os with designated inhibitors 30 min prior to anesthesia and, 48 hours post-ischemia, sera were collected for a creatine assay. The error bars represent the SEM. n=5 7 mice. (-), negative control given renal IRI without any reagents; AS, 5 mg/kg AS Figure S2. Less ATN in the AS treated kidneys following renal IRI. Mice were administered per os with designated inhibitors 30 min prior to anesthesia, and the kidneys were harvested for PAS staining 24 hours post-ischemia. The magnification of the far left panels is 40, whereas that of the other images is 200. Arrows indicate ATN. H, healthy; S, sham; (-), negative control given renal IRI without any reagents; V, vehicle control, LY, 10 mg/kg LY294002; AS, 5 mg/kg AS Figure S3. The number of kidney-infiltrated Gr-1 + cells were reduced by AS Four hours post-ischemia, single-cell suspensions of the kidneys were prepared for flow cytometry. The numbers of Gr-1 + cells were calculated. The results are from three independent experiments. n=3 8 mice/group. The error bars represent the SEM. 5
6 Figure S4. MRI results could predict recovery earlier than serum creatine or histology. (A) MRI images before and after (0, 3, 8, 24 and 48 hr) renal IRI of an untreated kidney. The T2-weighted images were obtained as anatomical images and ADC and FA maps were processed. ROIs at three regions (red line, cortex; yellow line, cortico-medulla; blue line, medulla) were drawn to measure ADC and FA values. (B) The time-course change in ADC values. (C) The time-course change in FA values. N=6 7 mice/group. The error bars represent SEM. *P<

7 A Figure S1 B 7

8 Figure S2. 8
9 Figure S S V LY AS IC 9

10 Figure S4. 10
Eosinophils! 40! 30! 20! 10! 0! NS!
 A Macrophages Lymphocytes Eosinophils Neutrophils Percentage (%) 1 ** 4 * 1 1 MMA SA B C Baseline FEV1, % predicted 15 p = 1.11 X 10⁻⁹ 5 CD4:CD8 ratio 1 Supplemental Figure 1. Cellular infiltrate in the
Synergy of radiotherapy and PD-1 blockade in Kras-mutant lung cancer
 Supplementary Information Synergy of radiotherapy and PD-1 blockade in Kras-mutant lung cancer Grit S. Herter-Sprie, Shohei Koyama, Houari Korideck, Josephine Hai, Jiehui Deng, Yvonne Y. Li, Kevin A. Buczkowski,
mm Distance (mm)
") b a Magnet Illumination Coverslips MPs Objective 2575 µm 1875 µm 1575 µm 1075 µm 875 µm 545 µm 20µm 2 3 0.5 0.3mm 1 1000 100 10 1 0.1 1000 100 10 1 0.1 Field Induction (Gauss) 1.5 0 5 10 15 20 Distance
b a Magnet Illumination Coverslips MPs Objective 2575 µm 1875 µm 1575 µm 1075 µm 875 µm 545 µm 20µm 2 3 0.5 0.3mm 1 1000 100 10 1 0.1 1000 100 10 1 0.1 Field Induction (Gauss) 1.5 0 5 10 15 20 Distance
Supplementary Figure 1. ETBF activate Stat3 in B6 and Min mice colons
 Supplementary Figure 1 ETBF activate Stat3 in B6 and Min mice colons a pstat3 controls Pos Neg ETBF 1 2 3 4 b pstat1 pstat2 pstat3 pstat4 pstat5 pstat6 Actin Figure Legend: (a) ETBF induce predominantly
1,000 in silico simulated alpha, beta, gamma and delta TCR repertoires were created.
 938 939 940 941 942 Figure S1 Schematic of the in silico TCRminer and MiXCR validation. 1,000 in silico simulated alpha, beta, gamma and delta TCR repertoires were created. Then, 100,000 simulated 80 bp
Supplemental Table 1. Primer sequences for transcript analysis
 Supplemental Table 1. Primer sequences for transcript analysis Primer Sequence (5 3 ) Primer Sequence (5 3 ) Mmp2 Forward CCCGTGTGGCCCTC Mmp15 Forward CGGGGCTGGCT Reverse GCTCTCCCGGTTTC Reverse CCTGGTGTGCCTGCTC
Bezzi et al., Supplementary Figure 1 *** Nature Medicine: doi: /nm Pten pc-/- ;Zbtb7a pc-/- Pten pc-/- ;Pml pc-/- Pten pc-/- ;Trp53 pc-/-
 Gr-1 Gr-1 Gr-1 Bezzi et al., Supplementary Figure 1 a Gr1-CD11b 3 months Spleen T cells 3 months Spleen B cells 3 months Spleen Macrophages 3 months Spleen 15 4 8 6 c CD11b+/Gr1+ cells [%] 1 5 b T cells
Transduction of lentivirus to human primary CD4+ T cells
 Transduction of lentivirus to human primary CD4 + T cells Human primary CD4 T cells were stimulated with anti-cd3/cd28 antibodies (10 µl/2 5 10^6 cells of Dynabeads CD3/CD28 T cell expander, Invitrogen)
qpcr-array Analysis Service
 qpcr-array Analysis Service Customer Name Institute Telephone Address E-mail PO Number Service Code Report Date Service Laboratory Department Phalanx Biotech Group, Inc 6 Floor, No.6, Technology Road 5,
Supplementary Figure 1: TSLP receptor skin expression in dcssc. A: Healthy control (HC) skin with TSLP receptor expression in brown (10x
 skin with TSLP receptor expression in brown (10x") Supplementary Figure 1: TSLP receptor skin expression in dcssc. A: Healthy control (HC) skin with TSLP receptor expression in brown (10x magnification). B: Second HC skin stained for TSLP receptor in brown
Supplementary Figure 1: TSLP receptor skin expression in dcssc. A: Healthy control (HC) skin with TSLP receptor expression in brown (10x magnification). B: Second HC skin stained for TSLP receptor in brown
Supporting Information
 Supporting Information Franco et al. 10.1073/pnas.1015557108 SI Materials and Methods Drug Administration. PD352901 was dissolved in 0.5% (wt/vol) hydroxyl-propyl-methylcellulose, 0.2% (vol/vol) Tween
Supplementary Materials
 Supplementary Materials Fig. S1. Weights of full-dose treatment groups comparing 1 st, 2 nd, and 3 rd generation gene replacement therapy. Mice were treated at p1 with 4x10 11 GC of the three different
Supplementary Figure 1 Chemokine and chemokine receptor expression during muscle regeneration (a) Analysis of CR3CR1 mrna expression by real time-pcr
 Analysis of CR3CR1 mrna expression by real time-pcr") Supplementary Figure 1 Chemokine and chemokine receptor expression during muscle regeneration (a) Analysis of CR3CR1 mrna expression by real time-pcr at day 0, 1, 4, 10 and 21 post- muscle injury. (b)
Supplementary Figure 1 Chemokine and chemokine receptor expression during muscle regeneration (a) Analysis of CR3CR1 mrna expression by real time-pcr at day 0, 1, 4, 10 and 21 post- muscle injury. (b)
Supplementary Table S1. Primers used for quantitative real-time polymerase chain reaction. Marker Sequence (5 3 ) Accession No.
 Accession No.") Supplementary Tables Supplementary Table S1. Primers used for quantitative real-time polymerase chain reaction Marker Sequence (5 3 ) Accession No. Angiopoietin 1, ANGPT1 A CCCTCCGGTGAATATTGGCTGG NM_001146.3
Supplementary Tables Supplementary Table S1. Primers used for quantitative real-time polymerase chain reaction Marker Sequence (5 3 ) Accession No. Angiopoietin 1, ANGPT1 A CCCTCCGGTGAATATTGGCTGG NM_001146.3
Supplementary Figure 1. Flow cytometry panels used for BD Canto (A) and BD Fortessa (B).
 and BD Fortessa (B).") Intra Immune nalysis Surface Supplementary Figure 1. Flow cytometry panels used for D Canto () and D Fortessa (). Name Fluorochrome ID F488 PE PerCp-Cy5.5 PC Paclue PE-Cy7 PC-H7 Lympho* 1 CD56 CD8 CD16
Intra Immune nalysis Surface Supplementary Figure 1. Flow cytometry panels used for D Canto () and D Fortessa (). Name Fluorochrome ID F488 PE PerCp-Cy5.5 PC Paclue PE-Cy7 PC-H7 Lympho* 1 CD56 CD8 CD16
D CD8 T cell number (x10 6 )
") IFNγ Supplemental Figure 1. CD T cell number (x1 6 ) 18 15 1 9 6 3 CD CD T cells CD6L C CD5 CD T cells CD6L D CD8 T cell number (x1 6 ) 1 8 6 E CD CD8 T cells CD6L F Log(1)CFU/g Feces 1 8 6 p
IFNγ Supplemental Figure 1. CD T cell number (x1 6 ) 18 15 1 9 6 3 CD CD T cells CD6L C CD5 CD T cells CD6L D CD8 T cell number (x1 6 ) 1 8 6 E CD CD8 T cells CD6L F Log(1)CFU/g Feces 1 8 6 p
Supplementary Figure 1.
 Supplementary Figure 1. Female Pro-ins2 -/- mice at 5-6 weeks of age were either inoculated i.p. with a single dose of CVB4 (1x10 5 PFU/mouse) or PBS and treated with αgalcer or control vehicle. On day
SUPPLEMENTARY INFORMATION
 SUPPLEMENTARY INFORMATION Supplementary Figure 1. Long-term protection studies. 45 minutes of ischemia was induced in wild type (S1pr2 +/+ ) and S1pr2 -/- by MCAO. A) 5 days later brains were harvested
Nature Immunology: doi: /ni Supplementary Figure 1. Cytokine pattern in skin in response to urushiol.
 Supplementary Figure 1 Cytokine pattern in skin in response to urushiol. Wild-type (WT) and CD1a-tg mice (n = 3 per group) were sensitized and challenged with urushiol (uru) or vehicle (veh). Quantitative
Cytokine Complex Expanded Natural Killer Cells Improve Allogeneic Lung. Transplant Function via Depletion of Donor Dendritic Cells
 Cytokine Complex Expanded Natural Killer Cells Improve Allogeneic Lung Transplant Function via Depletion of Donor Dendritic Cells Wolfgang Jungraithmayr, Laura Codarri, Gregory Bouchaud,Carsten Krieg,
An epithelial circadian clock controls pulmonary inflammation and glucocorticoid action
 An epithelial circadian clock controls pulmonary inflammation and glucocorticoid action Supplementary Figure : Expression levels of toll-like receptor 4 (Tlr4) in muse lung does not change throughout the
well for 2 h at rt. Each dot represents an individual mouse and bar is the mean ±
 Supplementary data: Control DC Blimp-1 ko DC 8 6 4 2-2 IL-1β p=.5 medium 8 6 4 2 IL-2 Medium p=.16 8 6 4 2 IL-6 medium p=.3 5 4 3 2 1-1 medium IL-1 n.s. 25 2 15 1 5 IL-12(p7) p=.15 5 IFNγ p=.65 4 3 2 1
Suppl Video: Tumor cells (green) and monocytes (white) are seeded on a confluent endothelial
 and monocytes (white) are seeded on a confluent endothelial") Supplementary Information Häuselmann et al. Monocyte induction of E-selectin-mediated endothelial activation releases VE-cadherin junctions to promote tumor cell extravasation in the metastasis cascade
Supplementary Information Häuselmann et al. Monocyte induction of E-selectin-mediated endothelial activation releases VE-cadherin junctions to promote tumor cell extravasation in the metastasis cascade
Supplemental Table 1. Eighty-nine single nucleotide polymorphisms of 49 immune response genes analyzed in the study
 Supplemental Table 1. Eighty-nine single nucleotide polymorphisms of 49 immune response genes analyzed in the study Gene Symbol Gene ID Gene Full Name SNP ID (alphabetical order) CARD15/NOD2 64127 nucleotide-binding
SUPPLEMENTARY INFORMATION
 doi:1.138/nature1554 a TNF-α + in CD4 + cells [%] 1 GF SPF 6 b IL-1 + in CD4 + cells [%] 5 4 3 2 1 Supplementary Figure 1. Effect of microbiota on cytokine profiles of T cells in GALT. Frequencies of TNF-α
Supplementary Figure 1. NAFL enhanced immunity of other vaccines (a) An over-the-counter, hand-held non-ablative fractional laser (NAFL).
 An over-the-counter, hand-held non-ablative fractional laser (NAFL).") Supplementary Figure 1. NAFL enhanced immunity of other vaccines (a) An over-the-counter, hand-held non-ablative fractional laser (NAFL). (b) Depiction of a MTZ array generated by NAFL. (c-e) IgG production
Supplementary Figure 1. NAFL enhanced immunity of other vaccines (a) An over-the-counter, hand-held non-ablative fractional laser (NAFL). (b) Depiction of a MTZ array generated by NAFL. (c-e) IgG production
Nature Neuroscience: doi: /nn Supplementary Figure 1. Large-scale calcium imaging in vivo.
 Supplementary Figure 1 Large-scale calcium imaging in vivo. (a) Schematic illustration of the in vivo camera imaging set-up for large-scale calcium imaging. (b) High-magnification two-photon image from
SUPPLEMENTARY INFORMATION
 SUPPLEMENTARY INFORMATION Pleiotrophin Regulates the Expansion and Regeneration of Hematopoietic Stem Cells Heather A Himburg 1, Garrett G Muramoto 1 *, Pamela Daher 1*, Sarah K Meadows 1, J. Lauren Russell
Supplementary Table 1. Genes analysed for expression by angiogenesis gene-array.
 Supplementary Table 1. Genes analysed for expression by angiogenesis gene-array. Gene symbol Gene name TaqMan Assay ID UniGene ID 18S rrna 18S ribosomal RNA Hs99999901_s1 Actb actin, beta Mm00607939_s1
Visualization strategies for major white matter tracts identified by diffusion tensor imaging for intraoperative use
 International Congress Series 1281 (2005) 793 797 www.ics-elsevier.com Visualization strategies for major white matter tracts identified by diffusion tensor imaging for intraoperative use Ch. Nimsky a,b,
c Ischemia (30 min) Reperfusion (8 w) Supplementary Figure bp 300 bp Ischemia (30 min) Reperfusion (4 h) Dox 20 mg/kg i.p.
 Reperfusion (8 w) Supplementary Figure bp 300 bp Ischemia (30 min) Reperfusion (4 h) Dox 20 mg/kg i.p.") a Marker Ripk3 +/ 5 bp 3 bp b Ischemia (3 min) Reperfusion (4 h) d 2 mg/kg i.p. 1 w 5 w Sacrifice for IF size A subset for echocardiography and morphological analysis c Ischemia (3 min) Reperfusion (8
a Marker Ripk3 +/ 5 bp 3 bp b Ischemia (3 min) Reperfusion (4 h) d 2 mg/kg i.p. 1 w 5 w Sacrifice for IF size A subset for echocardiography and morphological analysis c Ischemia (3 min) Reperfusion (8
Supplementary Figure 1:
 Supplementary Figure 1: (A) Whole aortic cross-sections stained with Hematoxylin and Eosin (H&E), 7 days after porcine-pancreatic-elastase (PPE)-induced AAA compared to untreated, healthy control aortas
Nature Immunology: doi: /ni Supplementary Figure 1. Gene expression profile of CD4 + T cells and CTL responses in Bcl6-deficient mice.
 Supplementary Figure 1 Gene expression profile of CD4 + T cells and CTL responses in Bcl6-deficient mice. (a) Gene expression profile in the resting CD4 + T cells were analyzed by an Affymetrix microarray
Supplemental Material
 Supplemental Material Supplementary Fig. 1. EETs stimulate primary tumor growth. a) Schematic presentation of genetic and pharmacological tools used to manipulate endogenous EET levels. b) Endothelial
Nature Immunology: doi: /ni Supplementary Figure 1. Production of cytokines and chemokines after vaginal HSV-2 infection.
 Supplementary Figure 1 Production of cytokines and chemokines after vaginal HSV-2 infection. C57BL/6 mice were (a) treated intravaginally with 20 µl of PBS or infected with 6.7x10 4 pfu of HSV-2 in the
SUPPLEMENTARY MATERIAL
 SUPPLEMENTARY MATERIAL IL-1 signaling modulates activation of STAT transcription factors to antagonize retinoic acid signaling and control the T H 17 cell it reg cell balance Rajatava Basu 1,5, Sarah K.
Supporting Information
 Supporting Information M1 macrophage-derived nanovesicles potentiate the anticancer efficacy of immune checkpoint inhibitors Yeon Woong Choo, 1, Mikyung Kang, 2, Han Young Kim, 1 Jin Han, 1 Seokyung Kang,
Cover Page. The handle holds various files of this Leiden University dissertation.
 Cover Page The handle http://hdl.handle.net/1887/35124 holds various files of this Leiden University dissertation. Author: Wokke, Beatrijs Henriette Aleid Title: Muscle MRI in Duchenne and Becker muscular
Programmed necrosis, not apoptosis, is a key mediator of cell loss and DAMP-mediated inflammation in dsrna-induced retinal degeneration
 Programmed necrosis, not apoptosis, is a key mediator of cell loss and DAMP-mediated inflammation in dsrna-induced retinal degeneration The Harvard community has made this article openly available. Please
Supplementary information CD4 T cells are required for both development and maintenance of disease in a new model of reversible colitis
 Supplementary information CD4 T cells are required for both development and maintenance of disease in a new model of reversible colitis rasseit and Steiner et al. .. Supplementary Figure 1 % of initial
VEGFR2-Mediated Vascular Dilation as a Mechanism of VEGF-Induced Anemia and Bone Marrow Cell Mobilization
 Cell Reports, Volume 9 Supplemental Information VEGFR2-Mediated Vascular Dilation as a Mechanism of VEGF-Induced Anemia and Bone Marrow Cell Mobilization Sharon Lim, Yin Zhang, Danfang Zhang, Fang Chen,
Diffusion weighted MRI in evaluation of transplanted kidney: Preliminary clinical experience
 African Journal of Nephrology (2009) 13: 26-30 Original Article AJN Diffusion weighted MRI in evaluation of transplanted kidney: Preliminary clinical experience Mohamed Abou El-Ghar; M.D, Huda Refaie;
Figure S1. Sorting nexin 9 (SNX9) specifically binds psmad3 and not psmad 1/5/8. Lysates from AKR-2B cells untreated (-) or stimulated (+) for 45 min
 specifically binds psmad3 and not psmad 1/5/8. Lysates from AKR-2B cells untreated (-) or stimulated (+) for 45 min") Figure S1. Sorting nexin 9 (SNX9) specifically binds psmad3 and not psmad 1/5/8. Lysates from AKR2B cells untreated () or stimulated () for 45 min with 5 ng/ml TGFβ or 10 ng/ml BMP4 were incubated with
Figure S1. Sorting nexin 9 (SNX9) specifically binds psmad3 and not psmad 1/5/8. Lysates from AKR2B cells untreated () or stimulated () for 45 min with 5 ng/ml TGFβ or 10 ng/ml BMP4 were incubated with
Supplementary Information
 Nature Immunology doi:1.138/ni.2477 Supplementary Information Capillary and arteriolar pericytes attract innate leukocytes exiting through venules and instruct them with pattern recognition and motility
Supplementary Figure S1. Flow cytometric analysis of the expression of Thy1 in NH cells. Flow cytometric analysis of the expression of T1/ST2 and
 Supplementary Figure S1. Flow cytometric analysis of the expression of Thy1 in NH cells. Flow cytometric analysis of the expression of T1/ST2 and Thy1 in NH cells derived from the lungs of naïve mice.
Electrolytes. Summary: (This area will include a brief description of what the protocol is used for and why someone would need to use it.
 Electrolytes Version: 1 Edited by: Jason Kim (note that the following list should be linked to the appropriate location.) Summary Reagents and Materials Protocol Reagent Preparation Reagent 1 Reagent 2
Effects of Ole e 1 allergen on human bronchial epithelial cells cultured at air-liquid interface (No. JIACI-D )
") 1 SUPPLEMENTAL TABLES Effects of Ole e 1 allergen on human bronchial epithelial cells cultured at air-liquid interface (No. JIACI-D-17-00149) Juan C. López-Rodríguez 1, Guillermo Solís-Fernández 1, Rodrigo
1 SUPPLEMENTAL TABLES Effects of Ole e 1 allergen on human bronchial epithelial cells cultured at air-liquid interface (No. JIACI-D-17-00149) Juan C. López-Rodríguez 1, Guillermo Solís-Fernández 1, Rodrigo
MR Tumor Staging for Treatment Decision in Case of Wilms Tumor
 MR Tumor Staging for Treatment Decision in Case of Wilms Tumor G. Schneider, M.D., Ph.D.; P. Fries, M.D. Dept. of Diagnostic and Interventional Radiology, Saarland University Hospital, Homburg/Saar, Germany
Supplementary Appendix
 Supplementary Appendix This appendix has been provided by the authors to give readers additional information about their work. Supplement to: Johnson DB, Balko JM, Compton ML, et al. Fulminant myocarditis
Supplementary appendix
 Supplementary appendix This appendix formed part of the original submission and has been peer reviewed. We post it as supplied by the authors. Supplement to: Kennedy GA, Varelias A, Vuckovic S, et al.
Investigations in Resting State Connectivity. Overview
 Investigations in Resting State Connectivity Scott FMRI Laboratory Overview Introduction Functional connectivity explorations Dynamic change (motor fatigue) Neurological change (Asperger s Disorder, depression)
Supplementary Figure 1. Characterization of basophils after reconstitution of SCID mice
 Supplementary figure legends Supplementary Figure 1. Characterization of after reconstitution of SCID mice with CD4 + CD62L + T cells. (A-C) SCID mice (n = 6 / group) were reconstituted with 2 x 1 6 CD4
Table 1. Summary of PET and fmri Methods. What is imaged PET fmri BOLD (T2*) Regional brain activation. Blood flow ( 15 O) Arterial spin tagging (AST)
 Regional brain activation. Blood flow ( 15 O) Arterial spin tagging (AST)") Table 1 Summary of PET and fmri Methods What is imaged PET fmri Brain structure Regional brain activation Anatomical connectivity Receptor binding and regional chemical distribution Blood flow ( 15 O)
Table 1 Summary of PET and fmri Methods What is imaged PET fmri Brain structure Regional brain activation Anatomical connectivity Receptor binding and regional chemical distribution Blood flow ( 15 O)
Supplementary Figure 1: STAT3 suppresses Kras-induced lung tumorigenesis
 Supplementary Figure 1: STAT3 suppresses Kras-induced lung tumorigenesis (a) Immunohistochemical (IHC) analysis of tyrosine 705 phosphorylation status of STAT3 (P- STAT3) in tumors and stroma (all-time
DTI fiber tracking at 3T MR using b-1000 value in the depiction of periprostatic nerve before and after nervesparing prostatectomy
 DTI fiber tracking at 3T MR using b-1000 value in the depiction of periprostatic nerve before and after nervesparing prostatectomy Poster No.: C-2328 Congress: ECR 2012 Type: Scientific Paper Authors:
Mst1 regulates integrin-dependent thymocyte trafficking and antigen recognition in the thymus
 Mst1 regulates integrin-dependent thymocyte trafficking and antigen recognition in the thymus Yoshihiro Ueda, Koko Katagiri, Takashi Tomiyama, Kaneki Yasuda, Katsuyoshi Habiro, Tomoya Katakai, Susumu Ikehara,
LPS CD40 + IL-4. Vorinostat (24 Hours) Vorinostat (24 Hours) Panobinostat (24 Hours) Panobinostat (24 Hours) Romidepsin (48 Hours)
 Vorinostat (24 Hours) Panobinostat (24 Hours) Panobinostat (24 Hours) Romidepsin (48 Hours)") A) CD + IL- B) LPS ( Hours) ( Hours) Cell number (x1-3 ) 1 1 3.7 M 1. M. M.1 M Cell number (x1 - ) 1 1 3. M 1. M.7 M.38 M Cell number (x1-3 ) Cell number (x1-3 ) 3 1 1 1 ( Hours) 7.nM.nM 1.7nM.nM Romidepsin
A) CD + IL- B) LPS ( Hours) ( Hours) Cell number (x1-3 ) 1 1 3.7 M 1. M. M.1 M Cell number (x1 - ) 1 1 3. M 1. M.7 M.38 M Cell number (x1-3 ) Cell number (x1-3 ) 3 1 1 1 ( Hours) 7.nM.nM 1.7nM.nM Romidepsin
* Kyoto Encyclopedia of Genes and Genomes.
 Supplemental Material Complete gene expression data using Affymetrix 3PRIME IVT ID Chip (54,614 genes) and human immature dendritic cells stimulated with rbmasnrs, IL-8 and control (media) has been deposited
Experimental Assessment of Infarct Lesion Growth in Mice using Time-Resolved T2* MR Image Sequences
 Experimental Assessment of Infarct Lesion Growth in Mice using Time-Resolved T2* MR Image Sequences Nils Daniel Forkert 1, Dennis Säring 1, Andrea Eisenbeis 2, Frank Leypoldt 3, Jens Fiehler 2, Heinz Handels
Supporting Information
 Supporting Information Desnues et al. 10.1073/pnas.1314121111 SI Materials and Methods Mice. Toll-like receptor (TLR)8 / and TLR9 / mice were generated as described previously (1, 2). TLR9 / mice were
sfigure 1: Detection of L-fucose in normal mouse renal cortex using the plant lectin LTL
 sfigure 1: Detection of L-fucose in normal mouse renal cortex using the plant lectin LTL LTL staining Negative control Fluorescence microscopy of normal (CL-11 +/+ ) mouse renal tissue after staining with
Effect of intravenous contrast medium administration on prostate diffusion-weighted imaging
 Effect of intravenous contrast medium administration on prostate diffusion-weighted imaging Poster No.: C-1766 Congress: ECR 2015 Type: Authors: Keywords: DOI: Scientific Exhibit J. Bae, C. K. Kim, S.
Whole-tumor apparent diffusion coefficient measurements in nephroblastoma: Can it identify blastemal predominance? Abstract Purpose To explore the
 Whole-tumor apparent diffusion coefficient measurements in nephroblastoma: Can it identify blastemal predominance? Abstract Purpose To explore the potential relation between whole-tumor apparent diffusion
Supplementary fig. 1. Crystals induce necroptosis does not involve caspases, TNF receptor or NLRP3. A. Mouse tubular epithelial cells were pretreated
 Supplementary fig. 1. Crystals induce necroptosis does not involve caspases, TNF receptor or NLRP3. A. Mouse tubular epithelial cells were pretreated with zvad-fmk (10µM) and exposed to calcium oxalate
Pathologic Stage. Lymph node Stage
 ASC ASC a c Patient ID BMI Age Gleason score Non-obese PBMC 1 22.1 81 6 (3+3) PBMC 2 21.9 6 6 (3+3) PBMC 3 22 84 8 (4+4) PBMC 4 24.6 68 7 (3+4) PBMC 24. 6 (3+3) PBMC 6 24.7 73 7 (3+4) PBMC 7 23. 67 7 (3+4)
Supplementary Figure 1. mrna expression of chitinase and chitinase-like protein in splenic immune cells. Each splenic immune cell population was
 Supplementary Figure 1. mrna expression of chitinase and chitinase-like protein in splenic immune cells. Each splenic immune cell population was sorted by FACS. Surface markers for sorting were CD11c +
TNFSF13B tumor necrosis factor (ligand) superfamily, member 13b NF-kB pathway cluster, Enrichment Score: 3.57
 superfamily, member 13b NF-kB pathway cluster, Enrichment Score: 3.57") Appendix 2. Highly represented clusters of genes in the differential expression of data. Immune Cluster, Enrichment Score: 5.17 GO:0048584 positive regulation of response to stimulus GO:0050778 positive
Appendix 2. Highly represented clusters of genes in the differential expression of data. Immune Cluster, Enrichment Score: 5.17 GO:0048584 positive regulation of response to stimulus GO:0050778 positive
Supplemental Information. CD4 + CD25 + Foxp3 + Regulatory T Cells Promote. Th17 Cells In Vitro and Enhance Host Resistance
 Immunity, Volume 34 Supplemental Information D4 + D25 + + Regulatory T ells Promote Th17 ells In Vitro and Enhance Host Resistance in Mouse andida albicans Th17 ell Infection Model Pushpa Pandiyan, Heather
Supplementary Table 1 Clinicopathological characteristics of 35 patients with CRCs
 Supplementary Table Clinicopathological characteristics of 35 patients with CRCs Characteristics Type-A CRC Type-B CRC P value Sex Male / Female 9 / / 8.5 Age (years) Median (range) 6. (9 86) 6.5 (9 76).95
INTRO TO BOLD FMRI FRANZ JOSEPH GALL ( ) OUTLINE. MRI & Fast MRI Observations Models Statistical Detection
 OUTLINE. MRI & Fast MRI Observations Models Statistical Detection") INTRO TO BOLD FMRI 2014 M.S. Cohen all rights reserved mscohen@g.ucla.edu OUTLINE FRANZ JOSEPH GALL (1758-1828) MRI & Fast MRI Observations Models Statistical Detection PAUL BROCA (1824-1880) WILLIAM JAMES
INTRO TO BOLD FMRI 2014 M.S. Cohen all rights reserved mscohen@g.ucla.edu OUTLINE FRANZ JOSEPH GALL (1758-1828) MRI & Fast MRI Observations Models Statistical Detection PAUL BROCA (1824-1880) WILLIAM JAMES
Endogenous TNFα orchestrates the trafficking of neutrophils into and within lymphatic vessels during acute inflammation
 SUPPLEMENTARY INFORMATION Endogenous TNFα orchestrates the trafficking of neutrophils into and within lymphatic vessels during acute inflammation Samantha Arokiasamy 1,2, Christian Zakian 1, Jessica Dilliway
P2 Visual - Perception
 P2 Visual - Perception 2014 SOSE Neuroimaging of high-level visual functions gyula.kovacs@uni-jena.de 11/09/06 Functional magnetic resonance imaging (fmri) The very basics What is fmri? What is MRI? The
Trim29 gene-targeting strategy. (a) Genotyping of wildtype mice (+/+), Trim29 heterozygous mice (+/ ) and homozygous mice ( / ).
 Genotyping of wildtype mice (+/+), Trim29 heterozygous mice (+/ ) and homozygous mice ( / ).") Supplementary Figure 1 Trim29 gene-targeting strategy. (a) Genotyping of wildtype mice (+/+), Trim29 heterozygous mice (+/ ) and homozygous mice ( / ). (b) Immunoblot analysis of TRIM29 in lung primary
Supplementary Figure 1 Trim29 gene-targeting strategy. (a) Genotyping of wildtype mice (+/+), Trim29 heterozygous mice (+/ ) and homozygous mice ( / ). (b) Immunoblot analysis of TRIM29 in lung primary
SUPPLEMENTARY INFORMATION
 1. Supplementary Figures and Legends Supplementary Fig. 1. S1P-mediated transcriptional regulation of integrins expressed in OP/monocytoid cells. Real-time quantitative PCR analyses of mrna for two integrins,
Pearson r = P (one-tailed) = n = 9
 = n = 9") 8F4-Specific Lysis, % 1 UPN1 UPN3 8 UPN7 6 Pearson r =.69 UPN2 UPN5 P (one-tailed) =.192 4 UPN8 n = 9 2 UPN9 UPN4 UPN6 5 1 15 2 25 8 8F4, % Max MFI Supplementary Figure S1. AML samples UPN1-UPN9 show variable
8F4-Specific Lysis, % 1 UPN1 UPN3 8 UPN7 6 Pearson r =.69 UPN2 UPN5 P (one-tailed) =.192 4 UPN8 n = 9 2 UPN9 UPN4 UPN6 5 1 15 2 25 8 8F4, % Max MFI Supplementary Figure S1. AML samples UPN1-UPN9 show variable
COPD lungs show an attached stratified mucus layer that separate. bacteria from the epithelial cells resembling the protective colonic
 COPD lungs show an attached stratified mucus layer that separate bacteria from the epithelial cells resembling the protective colonic mucus SUPPLEMENTARY TABLES AND FIGURES Tables S1 S8, page 1 and separate
Supplemental Table 1. Echocardiography Control (n=4)
") Supplemental Table 1. Echocardiography (n=4) Mlc2v cre/+ ; DNMAML (n=4) LVIDd, mm 3.9±0.3 4.3±0.3 LVIDs, mm 2.6±0.4 2.9±0.2 d, mm 0.72±0.06 0.75±0.1 LVPWd, mm 0.72±0.06 0.77±0.11 FS, % 33±6 33±1 EF, %
Supplemental Table 1. Echocardiography (n=4) Mlc2v cre/+ ; DNMAML (n=4) LVIDd, mm 3.9±0.3 4.3±0.3 LVIDs, mm 2.6±0.4 2.9±0.2 d, mm 0.72±0.06 0.75±0.1 LVPWd, mm 0.72±0.06 0.77±0.11 FS, % 33±6 33±1 EF, %
Supplementary Figure 1. Antibiotic partially rescues mice from sepsis. (ab) BALB/c mice under CLP were treated with antibiotic or PBS.
 BALB/c mice under CLP were treated with antibiotic or PBS.") 1 Supplementary Figure 1. Antibiotic partially rescues mice from sepsis. (ab) BALB/c mice under CLP were treated with antibiotic or PBS. (a) Survival curves. WT Sham (n=5), WT CLP or WT CLP antibiotic
1 Supplementary Figure 1. Antibiotic partially rescues mice from sepsis. (ab) BALB/c mice under CLP were treated with antibiotic or PBS. (a) Survival curves. WT Sham (n=5), WT CLP or WT CLP antibiotic
The Effects of Music intervention on Functional connectivity. Supplemental Information
 Yang et al. 0 The Effects of Music intervention on Functional connectivity strength of Brain in Schizophrenia Supplemental Information Mi Yang,#, Hui He #, Mingjun Duan,, Xi Chen, Xin Chang, Yongxiu Lai,
Supplementary Online Content
 Supplementary Online Content Hooshmand B, Magialasche F, Kalpouzos G, et al. Association of vitamin B, folate, and sulfur amino acids with brain magnetic resonance imaging measures in older adults: a longitudinal
Supplementary information. The proton-sensing G protein-coupled receptor T-cell death-associated gene 8
 1 Supplementary information 2 3 The proton-sensing G protein-coupled receptor T-cell death-associated gene 8 4 (TDAG8) shows cardioprotective effects against myocardial infarction 5 Akiomi Nagasaka 1+,
SUPPLEMENTARY INFORMATION
 doi: 1.138/nature89 IFN- (ng ml ) 5 4 3 1 Splenocytes NS IFN- (ng ml ) 6 4 Lymph node cells NS Nfkbiz / Nfkbiz / Nfkbiz / Nfkbiz / IL- (ng ml ) 3 1 Splenocytes IL- (ng ml ) 1 8 6 4 *** ** Lymph node cells
IKKα Causes Chromatin Modification on Pro-Inflammatory Genes by Cigarette Smoke in Mouse Lung
 IKKα Causes Chromatin Modification on Pro-Inflammatory Genes by Cigarette Smoke in Mouse Lung Se-Ran Yang, Samantha Valvo, Hongwei Yao, Aruna Kode, Saravanan Rajendrasozhan, Indika Edirisinghe, Samuel
Role of Tyk-2 in Th9 and Th17 cells in allergic asthma
 Supplementary File Role of Tyk-2 in Th9 and Th17 cells in allergic asthma Caroline Übel 1*, Anna Graser 1*, Sonja Koch 1, Ralf J. Rieker 2, Hans A. Lehr 3, Mathias Müller 4 and Susetta Finotto 1** 1 Laboratory
Assessment of Adipose Tissue from Whole Body 3T MRI Scans
 Assessment of Adipose Tissue from Whole Body 3T MRI Scans Ting Song 1, Jing An 2, Qun Chen 2, Vivian Lee 2, Andrew Laine 1 1 Department of Biomedical Engineering, Columbia University, New York, NY, USA
Chronic variable stress activates hematopoietic stem cells
 SUPPLEMENTARY INFORMATION Chronic variable stress activates hematopoietic stem cells Timo Heidt *, Hendrik B. Sager *, Gabriel Courties, Partha Dutta, Yoshiko Iwamoto, Alex Zaltsman, Constantin von zur
Magnetic Resonance Angiography
 Magnetic Resonance Angiography 1 Magnetic Resonance Angiography exploits flow enhancement of GR sequences saturation of venous flow allows arterial visualization saturation of arterial flow allows venous
") Supplementary Figure 1 (Mu) SBP (mmhg) 2 18 16 p
Supplementary Figure 1 (Mu) SBP (mmhg) 2 18 16 p Welcome. Nanostring Immuno-Oncology Summit. September 21st, FOR RESEARCH USE ONLY. Not for use in diagnostic procedures.
 Welcome Nanostring Immuno-Oncology Summit September 21st, 2017 1 FOR RESEARCH USE ONLY. Not for use in diagnostic procedures. FOR RESEARCH USE ONLY. Not for use in diagnostic procedures. Agenda 4:00-4:30
Supplementary Figures
 Inhibition of Pulmonary Anti Bacterial Defense by IFN γ During Recovery from Influenza Infection By Keer Sun and Dennis W. Metzger Supplementary Figures d a Ly6G Percentage survival f 1 75 5 1 25 1 5 1
Improved efficacy and in vivo cellular properties of human embryonic stem cell derivative
 Supplementary Information Improved efficacy and in vivo cellular properties of human embryonic stem cell derivative in a preclinical model of bladder pain syndrome Aram Kim 1,11,, Hwan Yeul Yu 1,2,, Jisun
Supplementary Materials for
 www.sciencemag.org/content/348/6241/aaa825/suppl/dc1 Supplementary Materials for A mucosal vaccine against Chlamydia trachomatis generates two waves of protective memory T cells Georg Stary,* Andrew Olive,
Pair-fed % inkt cells 0.5. EtOH 0.0
 MATERIALS AND METHODS Histopathological analysis Liver tissue was collected 9 h post-gavage, and the tissue samples were fixed in 1% formalin and paraffin-embedded following a standard procedure. The embedded
Supplementary Materials:
 Supplementary Materials: Supplemental Figure 1: Profibrotic markers in wt/wt or ex/ex mouse kidneys 42 days post IRI. The levels of fibronectin and αsma were examined by immunostaining in ADAM17 wt/wt
Magnetic resonance (MR) diffusion-weighted imaging (DWI) is
 diffusion-weighted imaging (DWI) is") Diagn Interv Radiol DOI 10.4261/1305-3825.DIR.3892-10.1 Turkish Society of Radiology 2010 ABDOMINAL IMAGING ORIGINAL ARTICLE Diffusion tensor imaging of the kidney at 3 Tesla: normative values and repeatability
Diagn Interv Radiol DOI 10.4261/1305-3825.DIR.3892-10.1 Turkish Society of Radiology 2010 ABDOMINAL IMAGING ORIGINAL ARTICLE Diffusion tensor imaging of the kidney at 3 Tesla: normative values and repeatability
Wenqin Hu, Cuiping Tian, Tun Li, Mingpo Yang, Han Hou & Yousheng Shu
 Distinct contributions of Na v 1.6 and Na v 1.2 in action potential initiation and backpropagation Wenqin Hu, Cuiping Tian, Tun Li, Mingpo Yang, Han Hou & Yousheng Shu Supplementary figure and legend Supplementary
Irf1 fold changes (D) 24h 48h. p-p65. t-p65. p-irf3. t-irf3. β-actin SKO TKO 100% 80% 60% 40% 20%
 24h 48h. p-p65. t-p65. p-irf3. t-irf3. β-actin SKO TKO 100% 80% 60% 40% 20%") Irf7 Fold changes 3 1 Irf1 fold changes 3 1 8h h 8h 8h h 8h p-p6 p-p6 t-p6 p-irf3 β-actin p-irf3 t-irf3 β-actin TKO TKO STKO (E) (F) TKO TKO % of p6 nuclear translocation % % 1% 1% % % p6 TKO % of IRF3
Irf7 Fold changes 3 1 Irf1 fold changes 3 1 8h h 8h 8h h 8h p-p6 p-p6 t-p6 p-irf3 β-actin p-irf3 t-irf3 β-actin TKO TKO STKO (E) (F) TKO TKO % of p6 nuclear translocation % % 1% 1% % % p6 TKO % of IRF3
SUPPLEMENTARY DATA Expression of complement factors is induced in DBA/2 mice following administration of C. albicans
 SUPPLEMENTARY DATA Expression of complement factors is induced in DBA/2 mice following administration of C. albicans water-soluble mannoprotein-beta-glucan complex (CAWS) Noriko Nagi-Miura 1,, Daisuke
Supplementary Figure 1. Dynamic Response of WT and mir-21 -/- mice to caerulein. (a) Representative histological sections of mouse pancreas stained
 Representative histological sections of mouse pancreas stained") Supplementary Figure 1. Dynamic Response of WT and mir-21 -/- mice to caerulein. (a) Representative histological sections of mouse pancreas stained with hematoxylin from caerulein-treated WT and mir-21
Supplementary Figure 1. Dynamic Response of WT and mir-21 -/- mice to caerulein. (a) Representative histological sections of mouse pancreas stained with hematoxylin from caerulein-treated WT and mir-21
4. Th1-related gene expression in infected versus mock-infected controls from Fig. 2 with gene annotation.
 List of supplemental information 1. Graph of mouse weight loss during course of infection- Line graphs showing mouse weight data during course of infection days 1 to 10 post-infections (p.i.). 2. Graph