Supplementary Figure 1. Expression of phospho-sik3 in normal and osteoarthritic articular cartilage in the knee. (a) Semiserial histological sections
|
|
|
- Martin Perkins
- 5 years ago
- Views:
Transcription


1 Supplementary Figure 1. Expression of phospho-sik3 in normal and osteoarthritic articular cartilage in the knee. (a) Semiserial histological sections of normal cartilage were stained with safranin O-fast green-iron hematoxylin and immunostained using anti-sik3 and anti-psik3 antibodies. Scale bars, 100 μm (b) We assessed safranin O-stained sections with the OARSI cartilage osteoarthritis 1
2 histopathology grading system. A representative image of sections with each OARSI grade is shown. Boxed regions are shown in the respective right panels. Scale bars, 100 μm. The graph shows the percentage of cells expressing psik3 per total cell number in the superficial layer. 2

3 Supplementary Figure 2. Generation of Col11a2-CreER transgenic mice. (a) Schematic representation of the Col11a2-CreER transgene construct. The CreER sequence was linked to Col11a2 promoter/enhancer sequences. pa, polyadenylation signal sequence. (b) A pregnant Col11a2-CreER mouse that had been mated with a Rosa26-stopflox-EYFP male mouse was injected with tamoxifen at 12.5 dpc and 13.5 dpc, and sacrificed at 14.5 dpc. Embryos were observed under a fluorescence microscope using a GFP filter. (c) 12-week old Col11a2-CreER; Rosa26-stopflox-EYFP mice were injected with tamoxifen or vehicle daily for 5 consecutive days and sacrificed at 16-weeks old. Knee joints were harvested and subjected to immunohisctochemical analysis for YFP expression. Scale bars, 50 μm. The images are representative of two independent experiments. 3
 Gene targeting strategy.")
4 Supplementary Figure 3. Generation of tamoxifen-inducible Sik3 conditional knockout mice. (a) Gene targeting strategy. Structure of the Sik3 tm1a (EUCOMM) Hmgu allele (modified from the 4
5 EUCOMM manual). (b) Tamoxifen-induced Sik3 knockout in chondrocytes in Col11a2-CreER; Sik3 flox/flox mice. After treatment with or without tamoxifen, as indicated at the bottom of the membrane, mice with the genotypes indicated above were sacrificed at 7-days old. Epiphyseal cartilage of the knees and femoral heads was harvested and subjected to western blot analysis. (c) Primary chondrocytes from Col11a2-CreER; Sik3 flox/flox mice were cultured in the presence or absence of 4-OH tamoxifen and subjected to pellet cultured for 4 weeks. Real-time RT-PCR expression analysis. The error bars denote means ± s.d. n = 3 pellets. **P < 0.01 and N. S., not significantly different by the t-test. 5
6 6
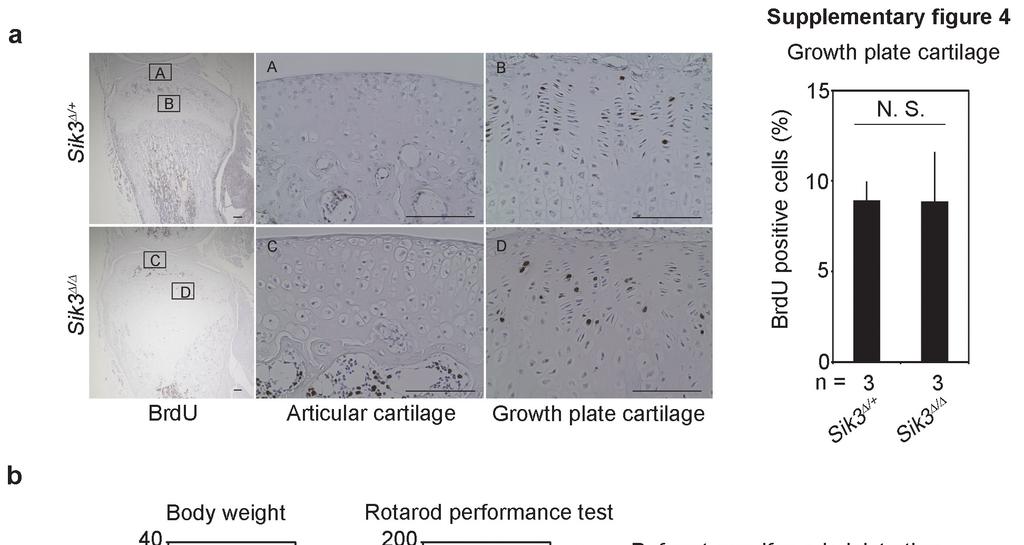
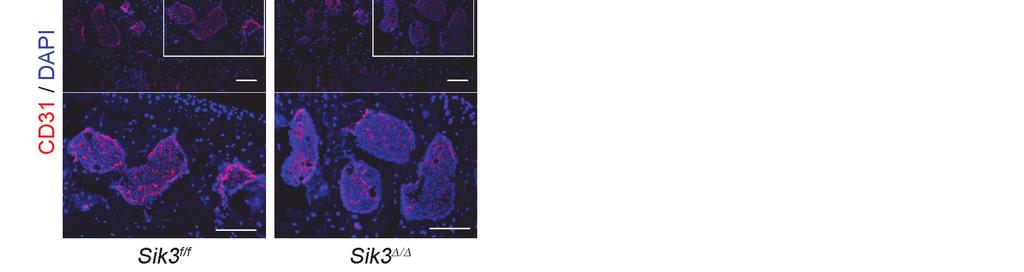
7 Supplementary Figure 4. BrdU labelling of proximal tibia, body weight and rotarod performance, and analysis of CD31 expression. (a) We injected Col11a2-CreER; Sik3 flox/flox ; Rosa26-stop flox -EYFP mice with tamoxifen at 2-weeks old and sacrificed them at 4-weeks old. BrdU were injected 3 hours before sacrifice. Numbers of mice examined are indicated at the bottom of the graphs. (b) 8-week old Sik3 flox/flox and Col11a2-CreER; Sik3 flox/flox mice were subjected to body weight measurements and the rotarod performance test. The mice were injected with tamoxifen and were subjected to body weight measurements and the rotarod performance test again 8 weeks later (16-weeks old). Error bars denote means ± s.d. Numbers of mice examined are indicated at the bottom of the graphs. N. S., not significantly different by the t-test. (c) 7-week old Sik3 flox/flox and Col11a2-CreER; Sik3 flox/flox mice were treated with tamoxifen for 5 days, subjected to sham operation, and sacrificed at 16-weeks old. Knee joints were harvested and subjected to immunohistochemical analysis using anti-cd31 antibody (red). Blue color is DAPI. Images of subchondral bone areas in the proximal tibia are shown. Scale bars, 100 μm. The images are representative of two independent experiments. 7
8 Supplementary Figure 5. Biological activity of synthesized pterosin B. (a) Method for the synthesis of pterosin B. Reaction steps are shown. (b) MEF2 or CRTC2 activities were measured using the GAL4-based luciferase reporter system in HEK293 cells in the presence or absence of pterosin B. n = 2. (c) ATDC5 cells were transformed with a MEF2 or CRTC1 reporter together with SIK1-3 expression vectors and treated with pterosin B (300 µm). The fold differences in the reporter activities by the pterosin B treatment are indicated (Means ± SD). n = 2. 8
9 9
10 Supplementary Figure 6. Effects of pterosin B on the expression of cartilage genes. (a) mrna expression levels of catalytic enzymes in pellet culture of mouse primary chondrocytes. Pellet cultures were performed for 4 weeks. Subsequently, pellets were treated with 10 ng/ml interleukin 1 (IL-1β) in various concentrations of pterosin B (0, 100, 200, 300 M) for 24 hrs. Error bars denote means ± s.d. n = 3 pellets. Not significant difference by the Tukey Kramer post-hoc test. (b) Prg4 mrna expression in mouse primary chondrocytes. Pellets of mouse primary chondrocytes were cultured in hypertrophic medium in the absence or presence of 300 µm pterosin B and various concentrations (1, 5, 20 M) of CBP-CREB interaction inhibitor for two weeks. Error bars denote means ± s.d. n = 3 pellets. **P < 0.01 by the Tukey Kramer post-hoc test. 10
11 Supplementary Figure 7. RNA-sequencing analysis on mouse chondrocyte pellet culture in the absence or presence of pterosin B and various mouse tissues. Cluster analysis based on whole mrna transcripts is shown. Vehicle, mouse chondrocyte pellets cultured in the absence of pterosin B. Pterosin B, mouse chondrocyte pellets cultured in the presence of pterosin B. 11

12 Supplementary Figure 8. Expression of marker genes in mouse chondrocyte pellet culture in the absence or presence of 300 μm pterosin B based on RNA-sequencing analysis. RPKM, reads per kirobase of exon per million sequence reads. Vehicle, mouse chondrocyte pellets cultured in the absence of pterosin B. Pterosin B, mouse chondrocyte pellets cultured in the presence of pterosin B. Error bars denote means ± s.d. n = 3 pellets. 12


13 Supplementary Figure 9. Full scans of western blots related to respective figures as indicated. The protein of interest being detected is labeled to the right of each blot. 13
14 Supplementary Table 1. Gene Ontology analysis of genes down-regulated by pterosin B treatment GOBPID Term P value Count Size GO: bone mineralization 5.17E GO: biomineral tissue development 9.46E GO: regulation of bone mineralization 8.58E GO: myeloid leukocyte migration 1.08E GO: leukocyte chemotaxis 1.56E GO: regulation of biomineral tissue development 2.28E
15 Supplementary Table 2. Articular cartilage from OA patients No. Age Sex OARSI grade 1 71 F F M F F M F F F F M F F F F F 5 15
16 Supplementary Table 3. Articular cartilage from nonsymptomatic cadavers No. Age Sex OARSI grade 1 95 M M F 0 16
17 Supplementary Table 4. The sequence of primers for mouse genes Primer Col10a1 F Col10a1 R Mef2c F Mef2c R Alp F Alp R Col2a1 F Col2a1 R Sox9 F Sox9 R Prg4 F Prg4 R Runx2 F Runx2 R Ihh F Ihh R Acan F Acan R Col1a1F Col1a1R Mmp3 F Mmp3 R Mmp13 F Mmp13 R Adamts5 F Adamts5 R Adamts4 F Adamts4 R Gapdh F Gapdh R Sequence TTCTGCTGCTAATGTTCTTGACC GGGATGAAGTATTGTGTCTTGGG ACGAGGATAATGGATGAGCGT ATCAGTGCAATCTCACAGTCG CCAACTCTTTTGTGCCAGAGA GGCTACATTGGTGTTGAGCTTTT TTGAGACAGCACGACGTGGAG AGCCAGGTTGCCATCGCCATA TGAAGAAGGAGAGCGAGGAGGA ATCTCCCCCAACGCCATCTT TGGAGTGCTGTCCTGATTTCAAGAG GGTGATTTGGGTGAGCGTTTGGTA GACTGTGGTTACCGTCATGGC ACTTGGTTTTTCATAACAGCGGA CTCTTGCCTACAAGCAGTTCA CCGTGTTCTCCTCGTCCTT CCCTCGGGCAGAAGAAAGAT CGCTTCTGTAGCCTGTGCTTG GCAACAGTCGCTTCACCTAC GTGGGAGGGAACCAGATTG GGCCTGGAACAGTCTTGGC TGTCCATCGTTCATCATCGTCA TGTTTGCAGAGCACTACTTGAA CAGTCACCTCTAAGCCAAAGAAA CCCAGGATAAAACCAGGCAG CGGCCAAGGGTTGTAAATGG ATGGCCTCAATCCATCCCAG GCAAGCAGGGTTGGAATCTTTG AAGCCCATCACCATCTTCCAGGAG ATGAGCCCTTCCACAATGCCAAAG 17
18 Supplementary Table 5. The sequence of primers for human genes Primer COL10A1 F COL10A1 R ALP F ALP R COL2A1 F COL2A1 R SOX9 F SOX9 R PRG4 F PRG4 R GAPDH F GAPDH R Sequence ATGCTGCCACAAATACCCTTT GGAATGAAGAACTGTGTCTTGGT ACCACCACGAGAGTGAACCA CGTTGTCTGAGTACCAGTCCC GTGGAGCAGCAAGAGCAA TGTTGGGAGCCAGATTGT AGCGAACGCACATCAAGAC CTGTAGGCGATCTGTTGGGG AAAGTCAGCACATCTCCCAAG GTGTCTCTTTAGCGGAAGTAGTC AATGGACAACTGGTCGTGGAC CCCTCCAGGGGATCTGTTTG 18
Nature Medicine: doi: /nm.4324
 1 2 3 4 5 6 7 8 9 10 11 12 13 14 15 16 17 18 19 20 21 22 23 24 25 Supplementary Figure 1. Kinetics of SnCs development in surgically-induced OA and effect of GCV-induced SnC clearance on OA disease progression
Supplemental Tables and Figures. The metalloproteinase-proteoglycans ADAMTS7 and ADAMTS12 provide an innate,
 Supplemental Tables and Figures The metalloproteinase-proteoglycans ADAMTS7 and ADAMTS12 provide an innate, tendon-specific protective mechanism against heterotopic ossification Timothy Mead et al Supplemental
(A) RT-PCR for components of the Shh/Gli pathway in normal fetus cell (MRC-5) and a
 RT-PCR for components of the Shh/Gli pathway in normal fetus cell (MRC-5) and a") Supplementary figure legends Supplementary Figure 1. Expression of Shh signaling components in a panel of gastric cancer. (A) RT-PCR for components of the Shh/Gli pathway in normal fetus cell (MRC-5) and
Supplementary figure legends Supplementary Figure 1. Expression of Shh signaling components in a panel of gastric cancer. (A) RT-PCR for components of the Shh/Gli pathway in normal fetus cell (MRC-5) and
Postn MCM Smad2 fl/fl Postn MCM Smad3 fl/fl Postn MCM Smad2/3 fl/fl. Postn MCM. Tgfbr1/2 fl/fl TAC
 A Smad2 fl/fl Smad3 fl/fl Smad2/3 fl/fl Tgfbr1/2 fl/fl 1. mm B Tcf21 MCM Tcf21 MCM Smad3 fl/fl Tcf21 MCM Smad2/3 fl/fl Tcf21 MCM Tgfbr1/2 fl/fl αmhc MCM C 1. mm 1. mm D Smad2 fl/fl Smad3 fl/fl Smad2/3
Wnt7a Inhibits Cartilage Matrix Degradation in a Mouse In Vivo Osteoarthritis Model
 Wnt7a Inhibits Cartilage Matrix Degradation in a Mouse In Vivo Osteoarthritis Model Averi Leahy, Andrea Foote, Tomoya Uchimura, Li Zeng, PhD. Tufts University, Boston, MA, USA. Disclosures: A. Leahy: None.
Figure 1. Dnmt3b expression in murine and human knee joint cartilage. (A) Representative images
 Representative images") Figure Legends Figure. expression in murine and human knee joint cartilage. () Representative images showing that Dnmta is not expressed in chondrocytes from mo W articular cartilage [Dnmta expression
Figure Legends Figure. expression in murine and human knee joint cartilage. () Representative images showing that Dnmta is not expressed in chondrocytes from mo W articular cartilage [Dnmta expression
Figure S1. (A) Schematic diagram of dnrar transgene allele. (B) X-Gal staining of testis from
 Schematic diagram of dnrar transgene allele. (B) X-Gal staining of testis from") Figure S1. (A) Schematic diagram of dnrar transgene allele. (B) X-Gal staining of testis from germ cell mutants (dnrar flox/flox, Stra8-Cre +, RARElacZ) (A ), controls (dnrar flox/flox, RARElacZ) (B ),
Figure S1. (A) Schematic diagram of dnrar transgene allele. (B) X-Gal staining of testis from germ cell mutants (dnrar flox/flox, Stra8-Cre +, RARElacZ) (A ), controls (dnrar flox/flox, RARElacZ) (B ),
Specimen. Humeral Head. Femoral Head. Objective. Femoral Condyle (medial) Supplementary Figure 1
 Supplementary Figure 1") A B Specimen Humeral Head 2 1 µm 76 µm Femoral Head Objective Femoral Condyle (medial) Supplementary Figure 1 A Femoral Head Global Cell Density Superficial Cell Density Cell Number at 1 µm Nuclei /.1
A B Specimen Humeral Head 2 1 µm 76 µm Femoral Head Objective Femoral Condyle (medial) Supplementary Figure 1 A Femoral Head Global Cell Density Superficial Cell Density Cell Number at 1 µm Nuclei /.1
Supplementary Figure 1. SA-β-Gal positive senescent cells in various cancer tissues. Representative frozen sections of breast, thyroid, colon and
 Supplementary Figure 1. SA-β-Gal positive senescent cells in various cancer tissues. Representative frozen sections of breast, thyroid, colon and stomach cancer were stained with SA-β-Gal and nuclear fast
SOPten flox/flox (KO) Pten flox/flox (WT) flox allele 6.0 kb. Pten. Actin. ! allele 2.3 kb. Supplementary Figure S1. Yanagi, et al.
 Pten flox/flox (WT) flox allele 6.0 kb. Pten. Actin. ! allele 2.3 kb. Supplementary Figure S1. Yanagi, et al.") s1 A Pten flox/flox () SOPten flox/flox () flox allele 6. kb B Pten flox/flox () SOPten flox/flox () Pten Actin! allele 2.3 kb Supplementary Figure S1. Yanagi, et al. A B BrdU BrdU positive cells ( ) 3
s1 A Pten flox/flox () SOPten flox/flox () flox allele 6. kb B Pten flox/flox () SOPten flox/flox () Pten Actin! allele 2.3 kb Supplementary Figure S1. Yanagi, et al. A B BrdU BrdU positive cells ( ) 3
SUPPLEMENTARY INFORMATION
 SUPPLEMENTARY INFORMATION Supplementary Figure 1. Generation of a conditional allele of the Kindlin-2 gene. (A) A restriction map of the relevant genomic region of Kindlin-2 (top), the targeting construct
Supplementary Table 1. List of primers used in this study
 Supplementary Table 1. List of primers used in this study Gene Forward primer Reverse primer Rat Met 5 -aggtcgcttcatgcaggt-3 5 -tccggagacacaggatgg-3 Rat Runx1 5 -cctccttgaaccactccact-3 5 -ctggatctgcctggcatc-3
c Ischemia (30 min) Reperfusion (8 w) Supplementary Figure bp 300 bp Ischemia (30 min) Reperfusion (4 h) Dox 20 mg/kg i.p.
 Reperfusion (8 w) Supplementary Figure bp 300 bp Ischemia (30 min) Reperfusion (4 h) Dox 20 mg/kg i.p.") a Marker Ripk3 +/ 5 bp 3 bp b Ischemia (3 min) Reperfusion (4 h) d 2 mg/kg i.p. 1 w 5 w Sacrifice for IF size A subset for echocardiography and morphological analysis c Ischemia (3 min) Reperfusion (8
a Marker Ripk3 +/ 5 bp 3 bp b Ischemia (3 min) Reperfusion (4 h) d 2 mg/kg i.p. 1 w 5 w Sacrifice for IF size A subset for echocardiography and morphological analysis c Ischemia (3 min) Reperfusion (8
Supplementary Figure 1. EC-specific Deletion of Snail1 Does Not Affect EC Apoptosis. (a,b) Cryo-sections of WT (a) and Snail1 LOF (b) embryos at
 Cryo-sections of WT (a) and Snail1 LOF (b) embryos at") Supplementary Figure 1. EC-specific Deletion of Snail1 Does Not Affect EC Apoptosis. (a,b) Cryo-sections of WT (a) and Snail1 LOF (b) embryos at E10.5 were double-stained for TUNEL (red) and PECAM-1 (green).
Supplementary Figure 1. EC-specific Deletion of Snail1 Does Not Affect EC Apoptosis. (a,b) Cryo-sections of WT (a) and Snail1 LOF (b) embryos at E10.5 were double-stained for TUNEL (red) and PECAM-1 (green).
SUPPLEMENTARY INFORMATION
 1. Supplementary Figures and Legends Supplementary Fig. 1. S1P-mediated transcriptional regulation of integrins expressed in OP/monocytoid cells. Real-time quantitative PCR analyses of mrna for two integrins,
Supplementary Information Titles Journal: Nature Medicine
 Supplementary Information Titles Journal: Nature Medicine Article Title: Corresponding Author: Supplementary Item & Number Supplementary Fig.1 Fig.2 Fig.3 Fig.4 Fig.5 Fig.6 Fig.7 Fig.8 Fig.9 Fig. Fig.11
Figure S1. Reduction in glomerular mir-146a levels correlate with progression to higher albuminuria in diabetic patients.
 Supplementary Materials Supplementary Figures Figure S1. Reduction in glomerular mir-146a levels correlate with progression to higher albuminuria in diabetic patients. Figure S2. Expression level of podocyte
Supplemental Figure 1. Western blot analysis indicated that MIF was detected in the fractions of
 Supplemental Figure Legends Supplemental Figure 1. Western blot analysis indicated that was detected in the fractions of plasma membrane and cytosol but not in nuclear fraction isolated from Pkd1 null
Supplemental Data. Wnt/β-Catenin Signaling in Mesenchymal Progenitors. Controls Osteoblast and Chondrocyte
 Supplemental Data Wnt/β-Catenin Signaling in Mesenchymal Progenitors Controls Osteoblast and Chondrocyte Differentiation during Vertebrate Skeletogenesis Timothy F. Day, Xizhi Guo, Lisa Garrett-Beal, and
SUPPLEMENTARY INFORMATION
 DOI:.38/ncb3399 a b c d FSP DAPI 5mm mm 5mm 5mm e Correspond to melanoma in-situ Figure a DCT FSP- f MITF mm mm MlanaA melanoma in-situ DCT 5mm FSP- mm mm mm mm mm g melanoma in-situ MITF MlanaA mm mm
Supplementary Figure 1. Confocal immunofluorescence showing mitochondrial translocation of Drp1. Cardiomyocytes treated with H 2 O 2 were prestained
 Supplementary Figure 1. Confocal immunofluorescence showing mitochondrial translocation of Drp1. Cardiomyocytes treated with H 2 O 2 were prestained with MitoTracker (red), then were immunostained with
SUPPLEMENTARY INFORMATION
 DOI: 10.1038/ncb2566 Figure S1 CDKL5 protein expression pattern and localization in mouse brain. (a) Multiple-tissue western blot from a postnatal day (P) 21 mouse probed with an antibody against CDKL5.
Supplementary Figure 1. Expression of CUGBP1 in non-parenchymal liver cells treated with TGF-β
 Supplementary Figures Supplementary Figure 1. Expression of CUGBP1 in non-parenchymal liver cells treated with TGF-β and LPS. Non-parenchymal liver cells were isolated and treated with or without TGF-β
Supplementary Figure 1: si-craf but not si-braf sensitizes tumor cells to radiation.
 Supplementary Figure 1: si-craf but not si-braf sensitizes tumor cells to radiation. (a) Embryonic fibroblasts isolated from wildtype (WT), BRAF -/-, or CRAF -/- mice were irradiated (6 Gy) and DNA damage
SUPPLEMENTARY INFORMATION
 Supplementary Figure 1. Behavioural effects of ketamine in non-stressed and stressed mice. Naive C57BL/6 adult male mice (n=10/group) were given a single dose of saline vehicle or ketamine (3.0 mg/kg,
Supplementary Information
 Supplementary Information Astrocytes regulate adult hippocampal neurogenesis through ephrin-b signaling Randolph S. Ashton, Anthony Conway, Chinmay Pangarkar, Jamie Bergen, Kwang-Il Lim, Priya Shah, Mina
Supplementary Information
 Supplementary Information mediates STAT3 activation at retromer-positive structures to promote colitis and colitis-associated carcinogenesis Zhang et al. a b d e g h Rel. Luc. Act. Rel. mrna Rel. mrna
Supplementary Figures
 Supplementary Figures Supplementary Figure 1 Characterization of stable expression of GlucB and sshbira in the CT26 cell line (a) Live cell imaging of stable CT26 cells expressing green fluorescent protein
a b c periosteum parietal bone bone marrow dura periosteum suture mesenchyme osteogenic front suture mesenchyme 1
 coronary suture sagittal suture DOI: 10.1038/ncb3139 a b c e parietal bone suture mesenchyme parietal bone bone marrow ura ura ura f parietal bone ura suture mesenchyme bone g ura osteogenic front suture
Supplemental Figure 1. Intracranial transduction of a modified ptomo lentiviral vector in the mouse
 Supplemental figure legends Supplemental Figure 1. Intracranial transduction of a modified ptomo lentiviral vector in the mouse hippocampus targets GFAP-positive but not NeuN-positive cells. (A) Stereotaxic
Supplementary methods:
 Supplementary methods: Primers sequences used in real-time PCR analyses: β-actin F: GACCTCTATGCCAACACAGT β-actin [11] R: AGTACTTGCGCTCAGGAGGA MMP13 F: TTCTGGTCTTCTGGCACACGCTTT MMP13 R: CCAAGCTCATGGGCAGCAACAATA
Supplemental Information. Menin Deficiency Leads to Depressive-like. Behaviors in Mice by Modulating. Astrocyte-Mediated Neuroinflammation
 Neuron, Volume 100 Supplemental Information Menin Deficiency Leads to Depressive-like Behaviors in Mice by Modulating Astrocyte-Mediated Neuroinflammation Lige Leng, Kai Zhuang, Zeyue Liu, Changquan Huang,
Supplementary Figure 1: Hsp60 / IEC mice are embryonically lethal (A) Light microscopic pictures show mouse embryos at developmental stage E12.
 Light microscopic pictures show mouse embryos at developmental stage E12.") Supplementary Figure 1: Hsp60 / IEC mice are embryonically lethal (A) Light microscopic pictures show mouse embryos at developmental stage E12.5 and E13.5 prepared from uteri of dams and subsequently genotyped.
Supplementary Figure 1: Hsp60 / IEC mice are embryonically lethal (A) Light microscopic pictures show mouse embryos at developmental stage E12.5 and E13.5 prepared from uteri of dams and subsequently genotyped.
Santulli G. et al. A microrna-based strategy to suppress restenosis while preserving endothelial function
 ONLINE DATA SUPPLEMENTS Santulli G. et al. A microrna-based strategy to suppress restenosis while preserving endothelial function Supplementary Figures Figure S1 Effect of Ad-p27-126TS on the expression
Supplementary Figure 1.TRIM33 binds β-catenin in the nucleus. a & b, Co-IP of endogenous TRIM33 with β-catenin in HT-29 cells (a) and HEK 293T cells
 and HEK 293T cells") Supplementary Figure 1.TRIM33 binds β-catenin in the nucleus. a & b, Co-IP of endogenous TRIM33 with β-catenin in HT-29 cells (a) and HEK 293T cells (b). TRIM33 was immunoprecipitated, and the amount of
Supplementary Figure 1.TRIM33 binds β-catenin in the nucleus. a & b, Co-IP of endogenous TRIM33 with β-catenin in HT-29 cells (a) and HEK 293T cells (b). TRIM33 was immunoprecipitated, and the amount of
Supplementary Figure 1
 Supplementary Figure 1 3 3 3 1 1 Bregma -1.6mm 3 : Bregma Ref) Http://www.mbl.org/atlas165/atlas165_start.html Bregma -.18mm Supplementary Figure 1 Schematic representation of the utilized brain slice
SUPPLEMENTARY INFORMATION
 SUPPLEMENTARY INFORMATION Supplementary Figure 1. Long-term protection studies. 45 minutes of ischemia was induced in wild type (S1pr2 +/+ ) and S1pr2 -/- by MCAO. A) 5 days later brains were harvested
GFP/Iba1/GFAP. Brain. Liver. Kidney. Lung. Hoechst/Iba1/TLR9!
 Supplementary information a +KA Relative expression d! Tlr9 5!! 5! NSC Neuron Astrocyte Microglia! 5! Tlr7!!!! NSC Neuron Astrocyte! GFP/Sβ/! Iba/Hoechst Microglia e Hoechst/Iba/TLR9! GFP/Iba/GFAP f Brain
Nature Neuroscience: doi: /nn Supplementary Figure 1
 Supplementary Figure 1 Quantification of myelin fragments in the aging brain (a) Electron microscopy on corpus callosum is shown for a 18-month-old wild type mice. Myelin fragments (arrows) were detected
Atg5 flox/flox ; CAG-Cre, 19M brain heart lung. spleen stomach colon. Takamura_Fig. S1
 Takamura_Fig. S1 brain heart lung spleen stomach colon kidney SM Supplemental Figure 1 Histological findings of tg5 flox/flox ;CG-Cre mouse tissues. H&E staining of the brain, heart, lung, spleen, stomach,
(a) Significant biological processes (upper panel) and disease biomarkers (lower panel)
 Significant biological processes (upper panel) and disease biomarkers (lower panel)") Supplementary Figure 1. Functional enrichment analyses of secretomic proteins. (a) Significant biological processes (upper panel) and disease biomarkers (lower panel) 2 involved by hrab37-mediated secretory
Supplementary Figure 1. Functional enrichment analyses of secretomic proteins. (a) Significant biological processes (upper panel) and disease biomarkers (lower panel) 2 involved by hrab37-mediated secretory
Title: Smooth muscle cell-specific Tgfbr1 deficiency promotes aortic aneurysm formation by stimulating multiple signaling events
 Title: Smooth muscle cell-specific Tgfbr1 deficiency promotes aortic aneurysm formation by stimulating multiple signaling events Pu Yang 1, 3, radley M. Schmit 1, Chunhua Fu 1, Kenneth DeSart 1, S. Paul
Supplementary Figure 1. AdipoR1 silencing and overexpression controls. (a) Representative blots (upper and lower panels) showing the AdipoR1 protein
 Representative blots (upper and lower panels) showing the AdipoR1 protein") Supplementary Figure 1. AdipoR1 silencing and overexpression controls. (a) Representative blots (upper and lower panels) showing the AdipoR1 protein content relative to GAPDH in two independent experiments.
Supplementary Figure 1. AdipoR1 silencing and overexpression controls. (a) Representative blots (upper and lower panels) showing the AdipoR1 protein content relative to GAPDH in two independent experiments.
SUPPLEMENTARY LEGENDS...
 TABLE OF CONTENTS SUPPLEMENTARY LEGENDS... 2 11 MOVIE S1... 2 FIGURE S1 LEGEND... 3 FIGURE S2 LEGEND... 4 FIGURE S3 LEGEND... 5 FIGURE S4 LEGEND... 6 FIGURE S5 LEGEND... 7 FIGURE S6 LEGEND... 8 FIGURE
1.5 ASK1KO fed. fasted 16 hrs w/o water. Fed. 4th. 4th WT ASK1KO N=29, 11(WT), ,5(ASK1KO) ASK1KO ASK1KO **** Time [h]
![1.5 ASK1KO fed. fasted 16 hrs w/o water. Fed. 4th. 4th WT ASK1KO N=29, 11(WT), ,5(ASK1KO) ASK1KO ASK1KO **** Time [h]](/thumbs/87/97258189.jpg "1.5 ASK1KO fed. fasted 16 hrs w/o water. Fed. 4th. 4th WT ASK1KO N=29, 11(WT), ,5(ASK1KO) ASK1KO ASK1KO **** Time [h]") 7: 13: 19: 1: 7: 151117 a 151117 4th 4th b c RQ.95 KO.9.85.8.75.7 light dark light dark.65 7: 19: 7: 19: 7: Means ± SEM, N=6 RQ 1..9.8.7.6.6 KO CL (-) CL (+) ibat weight ratio (/body weight) [%].5.4.3.2.1
7: 13: 19: 1: 7: 151117 a 151117 4th 4th b c RQ.95 KO.9.85.8.75.7 light dark light dark.65 7: 19: 7: 19: 7: Means ± SEM, N=6 RQ 1..9.8.7.6.6 KO CL (-) CL (+) ibat weight ratio (/body weight) [%].5.4.3.2.1
SUPPLEMENTARY INFORMATION
 doi:10.1038/nature12652 Supplementary Figure 1. PRDM16 interacts with endogenous EHMT1 in brown adipocytes. Immunoprecipitation of PRDM16 complex by flag antibody (M2) followed by Western blot analysis
CHAPTER 5 RESULTS Previous study: cell culture and organotypical slices
 45 CHAPTER 5 RESULTS 5.1. Previous study: cell culture and organotypical slices Initial experiments have been conducted to ensure that the tet-on system works. A neuronal cell culture from mice expressing
SUPPLEMENTARY FIGURES AND TABLES
 SUPPLEMENTARY FIGURES AND TABLES Supplementary Figure S1: CaSR expression in neuroblastoma models. A. Proteins were isolated from three neuroblastoma cell lines and from the liver metastasis of a MYCN-non
Discovery of a Small Molecule Inhibitor of the Wnt Pathway as a Potential Disease Modifying Treatment for Knee Osteoarthritis
 Discovery of a Small Molecule Inhibitor of the Wnt Pathway as a Potential Disease Modifying Treatment for Knee Osteoarthritis Charlene Barroga, Ph.D., Yong Hu, Ph.D., Vishal Deshmukh, Ph.D., and John Hood,
Supplemental Data Tamoxifen administration to Vil-Scap- mice.
 Supplemental Data FIGURE S1. Tamoxifen administration to Vil-Scap - mice. In the experiments shown in Fig. 1 to Fig. 5, tamoxifen (2 mg per dose) was dissolved in corn oil and administered by orogastric
293T cells were transfected with indicated expression vectors and the whole-cell extracts were subjected
 SUPPLEMENTARY INFORMATION Supplementary Figure 1. Formation of a complex between Slo1 and CRL4A CRBN E3 ligase. (a) HEK 293T cells were transfected with indicated expression vectors and the whole-cell
The Ufm1-activating enzyme Uba5 is indispensable for erythroid differentiation in mice
 Supplementary information The Ufm1-activating enzyme Uba5 is indispensable for erythroid differentiation in mice Kanako Tatsumi 1, 2, Harumi Yamamoto-Mukai 2, Ritsuko Shimizu 3, Satoshi Waguri 4, Yu-Shin
In vivo bromodeoxyuridine (BrdU) incorporation was performed to analyze cell
 incorporation was performed to analyze cell") Supplementary Methods BrdU incorporation in vivo In vivo bromodeoxyuridine (BrdU) incorporation was performed to analyze cell proliferation in the heart. Mice were subjected to LI-TAC, and 5 days later
Supplementary Methods BrdU incorporation in vivo In vivo bromodeoxyuridine (BrdU) incorporation was performed to analyze cell proliferation in the heart. Mice were subjected to LI-TAC, and 5 days later
marker. DAPI labels nuclei. Flies were 20 days old. Scale bar is 5 µm. Ctrl is
 Supplementary Figure 1. (a) Nos is detected in glial cells in both control and GFAP R79H transgenic flies (arrows), but not in deletion mutant Nos Δ15 animals. Repo is a glial cell marker. DAPI labels
Supplementary Figure 1. PD-L1 is glycosylated in cancer cells. (a) Western blot analysis of PD-L1 in breast cancer cells. (b) Western blot analysis
 Western blot analysis of PD-L1 in breast cancer cells. (b) Western blot analysis") Supplementary Figure 1. PD-L1 is glycosylated in cancer cells. (a) Western blot analysis of PD-L1 in breast cancer cells. (b) Western blot analysis of PD-L1 in ovarian cancer cells. (c) Western blot analysis
Supplementary Figure 1. PD-L1 is glycosylated in cancer cells. (a) Western blot analysis of PD-L1 in breast cancer cells. (b) Western blot analysis of PD-L1 in ovarian cancer cells. (c) Western blot analysis
Supplementary Figure 1. Lkb1-deficient lung ADC progressively transdifferentiates into SCC. (a) A scheme showing the progression pattern of atypical
 A scheme showing the progression pattern of atypical") Supplementary Figure 1. Lkb1-deficient lung ADC progressively transdifferentiates into SCC. (a) A scheme showing the progression pattern of atypical adenomatous hyperplasia/epithelial hyperplasia (AAH/EH),
Supplementary Figure 1. Lkb1-deficient lung ADC progressively transdifferentiates into SCC. (a) A scheme showing the progression pattern of atypical adenomatous hyperplasia/epithelial hyperplasia (AAH/EH),
Supplementary Figures
 Supplementary Figures Supplementary Fig. 1. Galectin-3 is present within tumors. (A) mrna expression levels of Lgals3 (galectin-3) and Lgals8 (galectin-8) in the four classes of cell lines as determined
Supplementary Figure 1. Genotyping strategies for Mcm3 +/+, Mcm3 +/Lox and Mcm3 +/- mice and luciferase activity in Mcm3 +/Lox mice. A.
 Supplementary Figure 1. Genotyping strategies for Mcm3 +/+, Mcm3 +/Lox and Mcm3 +/- mice and luciferase activity in Mcm3 +/Lox mice. A. Upper part, three-primer PCR strategy at the Mcm3 locus yielding
A Normal Exencephaly Craniora- Spina bifida Microcephaly chischisis. Midbrain Forebrain/ Forebrain/ Hindbrain Spinal cord Hindbrain Hindbrain
 A Normal Exencephaly Craniora- Spina bifida Microcephaly chischisis NTD Number of embryos % among NTD Embryos Exencephaly 52 74.3% Craniorachischisis 6 8.6% Spina bifida 5 7.1% Microcephaly 7 1% B Normal
SHREE ET AL, SUPPLEMENTAL MATERIALS. (A) Workflow for tumor cell line derivation and orthotopic implantation.
 Workflow for tumor cell line derivation and orthotopic implantation.") SHREE ET AL, SUPPLEMENTAL MATERIALS SUPPLEMENTAL FIGURE AND TABLE LEGENDS Supplemental Figure 1. Derivation and characterization of TS1-TGL and TS2-TGL PyMT cell lines and development of an orthotopic
SHREE ET AL, SUPPLEMENTAL MATERIALS SUPPLEMENTAL FIGURE AND TABLE LEGENDS Supplemental Figure 1. Derivation and characterization of TS1-TGL and TS2-TGL PyMT cell lines and development of an orthotopic
Tcf21 MCM ; R26 mtmg Sham GFP Col 1/3 TAC 8W TAC 2W. Postn MCM ; R26 mtmg Sham GFP Col 1/3 TAC 8W TAC 2W
 A Tcf21 MCM ; R26 mtmg Sham GFP Col 1/3 Tcf21 MCM ; R26 mtmg TAC 2W Tcf21 MCM ; R26 mtmg TAC 8W B Postn MCM ; R26 mtmg Sham GFP Col 1/3 Postn MCM ; R26 mtmg TAC 2W Postn MCM ; R26 mtmg TAC 8W Supplementary
TITLE: Local Blockade of CCL21 and CXCL13 Signaling as a New Strategy to Prevent and Treat Osteoarthritis
 AWARD NUMBER: W1XWH-15-1-31 TITLE: Local Blockade of CCL1 and CXCL13 Signaling as a New Strategy to Prevent and Treat Osteoarthritis PRINCIPAL INVESTIGATOR: Bouchra Edderkaoui., Ph.D. CONTRACTING ORGANIZATION:
The subcortical maternal complex controls symmetric division of mouse zygotes by
 The subcortical maternal complex controls symmetric division of mouse zygotes by regulating F-actin dynamics Xing-Jiang Yu 1,2, Zhaohong Yi 1, Zheng Gao 1,2, Dan-dan Qin 1,2, Yanhua Zhai 1, Xue Chen 1,
(a) Schematic diagram of the FS mutation of UVRAG in exon 8 containing the highly instable
 Schematic diagram of the FS mutation of UVRAG in exon 8 containing the highly instable") Supplementary Figure 1. Frameshift (FS) mutation in UVRAG. (a) Schematic diagram of the FS mutation of UVRAG in exon 8 containing the highly instable A 10 DNA repeat, generating a premature stop codon
Supplementary Figure 1. Frameshift (FS) mutation in UVRAG. (a) Schematic diagram of the FS mutation of UVRAG in exon 8 containing the highly instable A 10 DNA repeat, generating a premature stop codon
Breeding scheme, transgenes, histological analysis and site distribution of SB-mutagenized osteosarcoma.
 Supplementary Figure 1 Breeding scheme, transgenes, histological analysis and site distribution of SB-mutagenized osteosarcoma. (a) Breeding scheme. R26-LSL-SB11 homozygous mice were bred to Trp53 LSL-R270H/+
Supplementary Figure 1. Baf60c and baf180 are induced during cardiac regeneration in zebrafish. RNA in situ hybridization was performed on paraffin
 Supplementary Figure 1. Baf60c and baf180 are induced during cardiac regeneration in zebrafish. RNA in situ hybridization was performed on paraffin sections from sham-operated adult hearts (a and i) and
Supplemental Figure 1
 Supplemental Figure 1 1a 1c PD-1 MFI fold change 6 5 4 3 2 1 IL-1α IL-2 IL-4 IL-6 IL-1 IL-12 IL-13 IL-15 IL-17 IL-18 IL-21 IL-23 IFN-α Mut Human PD-1 promoter SBE-D 5 -GTCTG- -1.2kb SBE-P -CAGAC- -1.kb
Supplementary Figure 1
 Supplementary Figure 1 Supplementary Figure 1 Schematic depiction of the tandem Fc GDF15. Supplementary Figure 2 Supplementary Figure 2 Gfral mrna levels in the brains of both wild-type and knockout Gfral
Supplementary Figure 1: Expression of Gli1-lacZ in E17.5 ovary and mesonephros. a,
 Supplementary Figure 1: Expression of Gli1-lacZ in E17.5 ovary and mesonephros. a, Transverse sections of E17.5 ovary and mesonephros from Gli1-LacZ reporter embryos (n=3) after LacZ staining (blue). The
Supplementary Figures
 Supplementary Figures Supplementary Figure 1. Confirmation of Dnmt1 conditional knockout out mice. a, Representative images of sorted stem (Lin - CD49f high CD24 + ), luminal (Lin - CD49f low CD24 + )
Supplementary Fig. 1. Delivery of mirnas via Red Fluorescent Protein.
 prfp-vector RFP Exon1 Intron RFP Exon2 prfp-mir-124 mir-93/124 RFP Exon1 Intron RFP Exon2 Untransfected prfp-vector prfp-mir-93 prfp-mir-124 Supplementary Fig. 1. Delivery of mirnas via Red Fluorescent
Supplemental Figure 1. Egr1 expression in adult Achilles tendons. (A,B) Achilles tendons were isolated from 2 month-old Egr1 +/- mice and stained for
 Achilles tendons were isolated from 2 month-old Egr1 +/- mice and stained for") Supplemental Figure 1. Egr1 expression in adult Achilles tendons. (A,B) Achilles tendons were isolated from 2 month-old Egr1 +/- mice and stained for LacZ activity, which reflects Egr1 expression. (A)
Supplemental Figure 1. Egr1 expression in adult Achilles tendons. (A,B) Achilles tendons were isolated from 2 month-old Egr1 +/- mice and stained for LacZ activity, which reflects Egr1 expression. (A)
SUPPLEMENTARY FIGURES AND TABLE
 SUPPLEMENTARY FIGURES AND TABLE Supplementary Figure S1: Characterization of IRE1α mutants. A. U87-LUC cells were transduced with the lentiviral vector containing the GFP sequence (U87-LUC Tet-ON GFP).
Plasma exposure levels from individual mice 4 hours post IP administration at the
 Supplemental Figure Legends Figure S1. Plasma exposure levels of MKC-3946 in mice. Plasma exposure levels from individual mice 4 hours post IP administration at the indicated dose mg/kg. Data represent
High expression of cellular retinol binding protein-1 in lung adenocarcinoma is associated with poor prognosis
 High expression of cellular retinol binding protein-1 in lung adenocarcinoma is associated with poor prognosis Supplementary Material Supplementary Figure S1. Representative CRBP-1 immunostaining of non-neoplastic
Supplementary Information
 Supplementary Information Supplementary Figure 1! a! b! Nfatc1!! Nfatc1"! P1! P2! pa1! pa2! ex1! ex2! exons 3-9! ex1! ex11!!" #" Nfatc1A!!" Nfatc1B! #"!" Nfatc1C! #" DN1! DN2! DN1!!A! #A!!B! #B!!C! #C!!A!
Supplementary Figure S1. Flow cytometric analysis of the expression of Thy1 in NH cells. Flow cytometric analysis of the expression of T1/ST2 and
 Supplementary Figure S1. Flow cytometric analysis of the expression of Thy1 in NH cells. Flow cytometric analysis of the expression of T1/ST2 and Thy1 in NH cells derived from the lungs of naïve mice.
Supplementary Figure 1 (Related with Figure 4). Molecular consequences of Eed deletion. (a) ChIP analysis identifies 3925 genes that are associated
. Molecular consequences of Eed deletion. (a) ChIP analysis identifies 3925 genes that are associated") Supplementary Figure 1 (Related with Figure 4). Molecular consequences of Eed deletion. (a) ChIP analysis identifies 3925 genes that are associated with the H3K27me3 mark in chondrocytes (see Table S1,
Supplementary Figure 1 (Related with Figure 4). Molecular consequences of Eed deletion. (a) ChIP analysis identifies 3925 genes that are associated with the H3K27me3 mark in chondrocytes (see Table S1,
SUPPLEMENTARY INFORMATION
 doi: 1.138/nature89 IFN- (ng ml ) 5 4 3 1 Splenocytes NS IFN- (ng ml ) 6 4 Lymph node cells NS Nfkbiz / Nfkbiz / Nfkbiz / Nfkbiz / IL- (ng ml ) 3 1 Splenocytes IL- (ng ml ) 1 8 6 4 *** ** Lymph node cells
!! INL!!!! ONL!! IS/OS!!
 SUPPLEMENTARY FIGURES GCL INL ONL IS/OS RPE Choroid GR MR A B C HSD2 Cc RPE CV D Cc RPE CV E RPE Cc CV F RPE Cc CV Figure S1 Figure S1: Immunohistochemistry eidence for glucocorticoid receptor (GR), mineralocorticoid
Supplementary Figure 1
 Supplementary Figure 1 AAV-GFP injection in the MEC of the mouse brain C57Bl/6 mice at 4 months of age were injected with AAV-GFP into the MEC and sacrificed at 7 days post injection (dpi). (a) Brains
Supplementary Figure 1. IDH1 and IDH2 mutation site sequences on WHO grade III
 Supplementary Materials: Supplementary Figure 1. IDH1 and IDH2 mutation site sequences on WHO grade III patient samples. Genomic DNA samples extracted from punch biopsies from either FFPE or frozen tumor
Supplementary Figure 1
 Combination index (CI) Supplementary Figure 1 2. 1.5 1. Ishikawa AN3CA Nou-1 Hec-18.5...2.4.6.8 1. Fraction affected (Fa) Supplementary Figure 1. The synergistic effect of PARP inhibitor and PI3K inhibitor
SUPPLEMENTARY INFORMATION
 DOI: 10.1038/ncb2535 Figure S1 SOX10 is expressed in human giant congenital nevi and its expression in human melanoma samples suggests that SOX10 functions in a MITF-independent manner. a, b, Representative
Vascular Endothelial Growth Factor in Cartilage Development and Osteoarthritis
 www.nature.com/scientificreports Received: 18 July 2017 Accepted: 21 September 2017 Published: xx xx xxxx OPEN Vascular Endothelial Growth Factor in Cartilage Development and Osteoarthritis Masashi Nagao
SUPPLEMENTARY INFORMATION
 DOI: 10.1038/ncb2697 Figure S1 Cytokeratin 5 is a specific marker for basal and intermediate cells in all mouse prostate lobes. (a) Immunofluorescence staining showing co-localization of YFP with p63 in
Supplementary fig. 1. Crystals induce necroptosis does not involve caspases, TNF receptor or NLRP3. A. Mouse tubular epithelial cells were pretreated
 Supplementary fig. 1. Crystals induce necroptosis does not involve caspases, TNF receptor or NLRP3. A. Mouse tubular epithelial cells were pretreated with zvad-fmk (10µM) and exposed to calcium oxalate
Supplemental Table S1
 Supplemental Table S. Tumorigenicity and metastatic potential of 44SQ cell subpopulations a Tumorigenicity b Average tumor volume (mm ) c Lung metastasis d CD high /4 8. 8/ CD low /4 6./ a Mice were injected
SUPPLEMENTARY FIGURES
 SUPPLEMENTARY FIGURES 1 Supplementary Figure 1, Adult hippocampal QNPs and TAPs uniformly express REST a-b) Confocal images of adult hippocampal mouse sections showing GFAP (green), Sox2 (red), and REST
Supplementary Figure 1. Prevalence of U539C and G540A nucleotide and E172K amino acid substitutions among H9N2 viruses. Full-length H9N2 NS
 Supplementary Figure 1. Prevalence of U539C and G540A nucleotide and E172K amino acid substitutions among H9N2 viruses. Full-length H9N2 NS nucleotide sequences (a, b) or amino acid sequences (c) from
Supplementary Figure 1 IMQ-Induced Mouse Model of Psoriasis. IMQ cream was
 Supplementary Figure 1 IMQ-Induced Mouse Model of Psoriasis. IMQ cream was painted on the shaved back skin of CBL/J and BALB/c mice for consecutive days. (a, b) Phenotypic presentation of mouse back skin
Supplementary Figure 1 hlrrk2 promotes CAP dependent protein translation.
 ` Supplementary Figure 1 hlrrk2 promotes CAP dependent protein translation. (a) Overexpression of hlrrk2 in HeLa cells enhances total protein synthesis in [35S] methionine/cysteine incorporation assays.
Control. csarnt -/- Cre, f/f
 ody weight (g) A re,f/f re x f/f f/+ re, f/+ re,f/+ f/f x f/f f/+ cs -/- re, f/f re f/f re, f/f Normal chow Tamoxifen Tamoxifen Tamoxifen W 4W re f/f re, re/ff f/f re f/f re, re/ff f/f Normal chow Tamoxifen
Figure S1. Sorting nexin 9 (SNX9) specifically binds psmad3 and not psmad 1/5/8. Lysates from AKR-2B cells untreated (-) or stimulated (+) for 45 min
 specifically binds psmad3 and not psmad 1/5/8. Lysates from AKR-2B cells untreated (-) or stimulated (+) for 45 min") Figure S1. Sorting nexin 9 (SNX9) specifically binds psmad3 and not psmad 1/5/8. Lysates from AKR2B cells untreated () or stimulated () for 45 min with 5 ng/ml TGFβ or 10 ng/ml BMP4 were incubated with
Figure S1. Sorting nexin 9 (SNX9) specifically binds psmad3 and not psmad 1/5/8. Lysates from AKR2B cells untreated () or stimulated () for 45 min with 5 ng/ml TGFβ or 10 ng/ml BMP4 were incubated with
Electron micrograph of phosphotungstanic acid-stained exosomes derived from murine
 1 SUPPLEMENTARY INFORMATION SUPPLEMENTARY FIGURES Supplementary Figure 1. Physical properties of murine DC-derived exosomes. a, Electron micrograph of phosphotungstanic acid-stained exosomes derived from
Supporting Information
 Supporting Information Rock et al. 10.1073/pnas.1117988108 Fig. S1. Heterogeneity of stromal cells in normal and fibrotic mouse lungs. Sections of normal mouse lungs (A and D) and fibrotic lungs collected
SUPPLEMENTARY INFORMATION
 DOI: 10.1038/ncb2607 Figure S1 Elf5 loss promotes EMT in mammary epithelium while Elf5 overexpression inhibits TGFβ induced EMT. (a, c) Different confocal slices through the Z stack image. (b, d) 3D rendering
Primary Cilia Can Both Mediate and Suppress Hedgehog Pathway- Dependent Tumorigenesis (Supplementary Figures and Materials)
") Primary Cilia Can Both Mediate and Suppress Hedgehog Pathway- Dependent Tumorigenesis (Supplementary Figures and Materials) Sunny Y. Wong, Allen D. Seol, Po-Lin So, Alexandre N. Ermilov, Christopher K.
Primary Cilia Can Both Mediate and Suppress Hedgehog Pathway- Dependent Tumorigenesis (Supplementary Figures and Materials) Sunny Y. Wong, Allen D. Seol, Po-Lin So, Alexandre N. Ermilov, Christopher K.
III. Results and Discussion
 III. Results and Discussion 1. Histological findings in the coronary artery Twenty-four swine had surgical treatments performed in two of the coronary arteries, LAD as well as either the LCX or RCA. A
Rescue of mutant rhodopsin traffic by metformin-induced AMPK activation accelerates photoreceptor degeneration Athanasiou et al
 Supplementary Material Rescue of mutant rhodopsin traffic by metformin-induced AMPK activation accelerates photoreceptor degeneration Athanasiou et al Supplementary Figure 1. AICAR improves P23H rod opsin