Specimen. Humeral Head. Femoral Head. Objective. Femoral Condyle (medial) Supplementary Figure 1
|
|
|
- Kerrie Barton
- 5 years ago
- Views:
Transcription


")
1 A B Specimen Humeral Head 2 1 µm 76 µm Femoral Head Objective Femoral Condyle (medial) Supplementary Figure 1


2 A Femoral Head Global Cell Density Superficial Cell Density Cell Number at 1 µm Nuclei /.1 mm Nuclei /.1 mm #1 left 1 #2 right 2 #3 left 1 #1 left 1 #2 right 2 #3 left Number of Nuclei #1 #2 #3 B Humeral Head Global Cell Density Superficial Cell Density Cell Number at 1 µm Nuclei /.1 mm #1 left 3 right #2 4 #3 left 5 #4 left Nuclei/.1mm^ #1 left 3 right #2 4 #3 left 5 #4 left Number of Nuclei #1 #2 #3 #4 Supplementary Figure 2
3 A Humeral Head Global Cell Density Superficial Cell Density Cell Number at 1 µm Cell Number at 2 µm Difference in Nuclei /.1 mm 3 (Left - Right) Average Number /.1 mm 3 (Left and Right) Difference in Nuclei /.1 mm 3 (Left - Right) Average Number /.1 mm 3 (Left and Right) Difference in Number of Nuclei (Left - Right) Average Number of Nuclei (Left and Right) Difference in Number of Nuclei (Left - Right) Average Number of Nuclei (Left and Right) B Lateral Femoral Condyle Global Cell Density Superficial Cell Density Cell Number at 1 µm Cell Number at 2 µm Difference in Nuclei /.1 mm 3 (Left - Right) Average Number /.1 mm 3 (Left and Right) Difference in Nuclei /.1 mm 3 (Left - Right) Average Number /.1 mm 3 (Left and Right) Difference in Number of Nuclei (Left - Right) Average Number of Nuclei (Left and Right) Difference in Number of Nuclei (Left - Right) Average Number of Nuclei (Left and Right) C Medial Femoral Condyle Global Cell Density Superficial Cell Density Cell Number at 1 µm Cell Number at 2 µm Difference in Nuclei /.1 mm 3 (Left - Right) Average Number /.1 mm 3 (Left and Right) Difference in Nuclei /.1 mm 3 (Left - Right) Average Number /.1 mm 3 (Left and Right) Difference in Number of Nuclei (Left - Right) Average Number of Nuclei (Left and Right) Difference in Number of Nuclei (Left - Right) Average Number of Nuclei (Left and Right) Supplementary Figure 3
4 Nuclei /.1 mm 3 A Humeral Head Global Cell Density Superficial Cell Density Cell Number at 1 µm Cell Number at 2 µm 8 p =.15 p =.99 1 Days Nuclei /.1 mm 3 1 Days Number of Nuclei p =.83 1 Days 8 p <.1* Number of Nuclei Days Nuclei /.1 mm 3 B Lateral Femoral Condyle Global Cell Density Superficial Cell Density Cell Number at 1 µm Cell Number at 2 µm 6 p = Days Nuclei /.1 mm 3 8 p =.37* Days Number of Nuclei 1 p = Days Number of Nuclei 1 8 p = Days C Medial Femoral Condyle Global Cell Density Superficial Cell Density Cell Number at 1 µm Cell Number at 2 µm Nuclei /.1 mm p =.32 p =.65 1 Days Nuclei /.1 mm 3 1 Days Number of Nuclei p =.17 1 Days 8 p =.52 Number of Nuclei Days Supplementary Figure 4


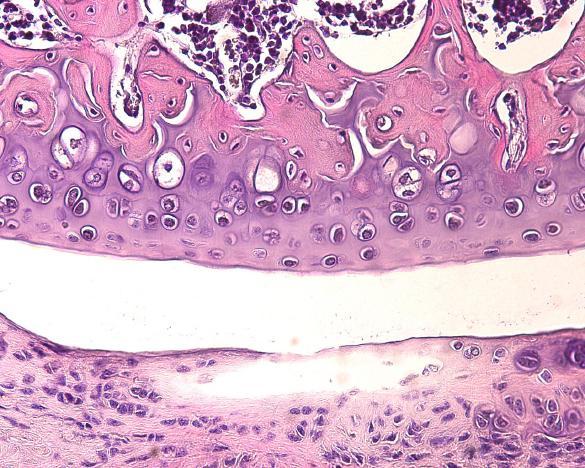
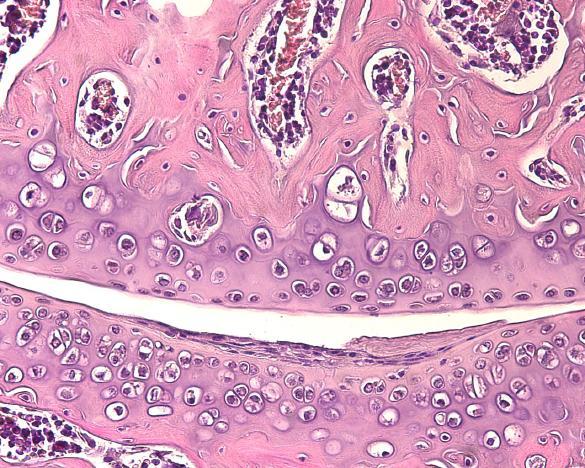
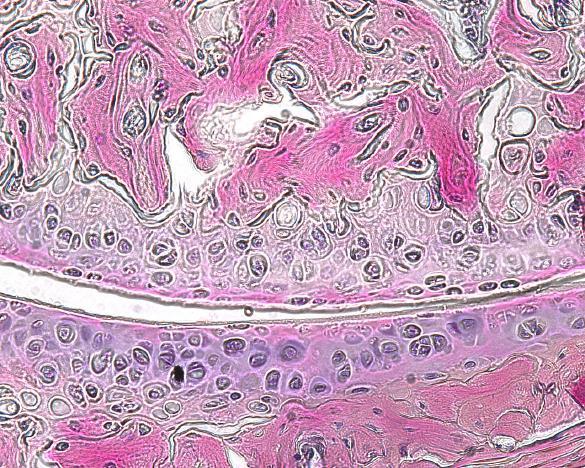
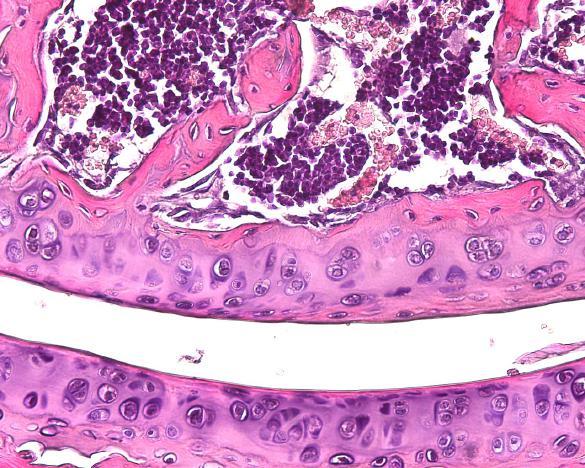
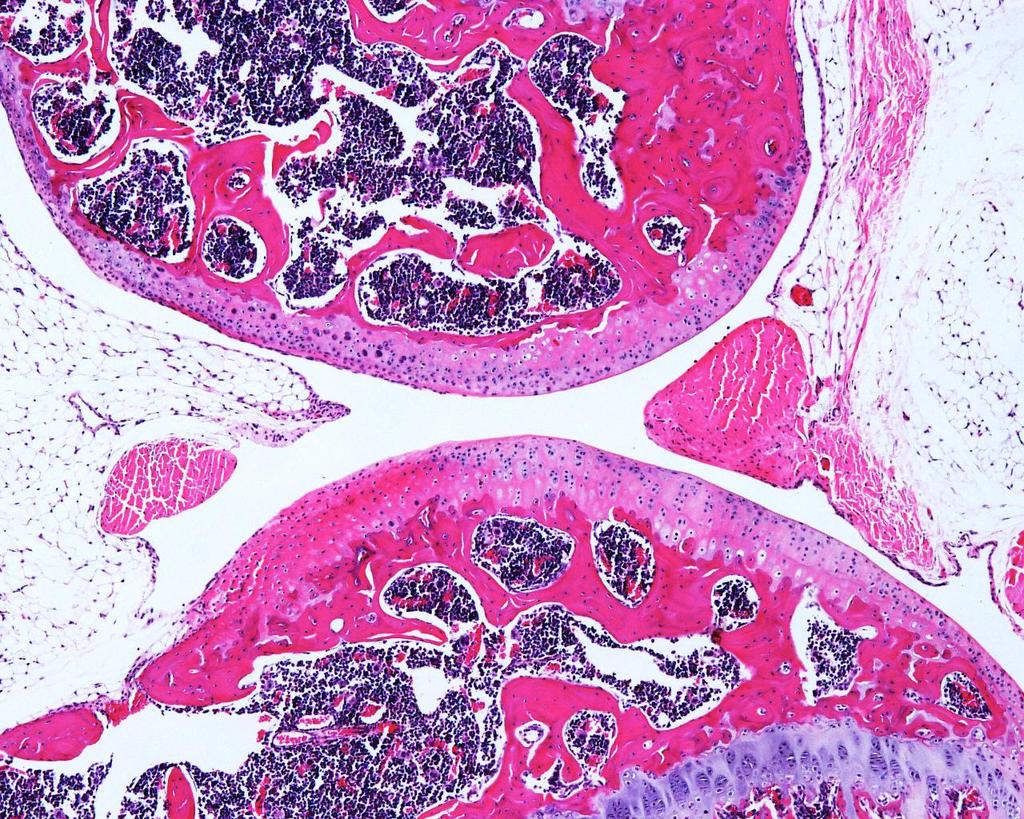
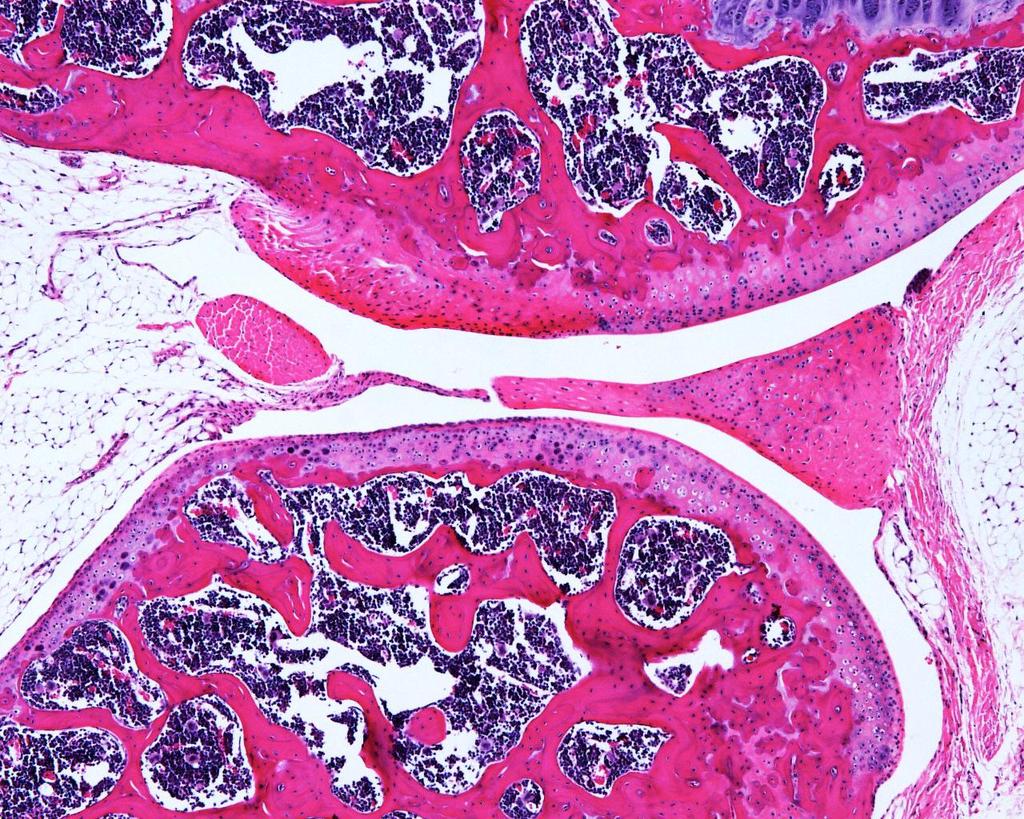
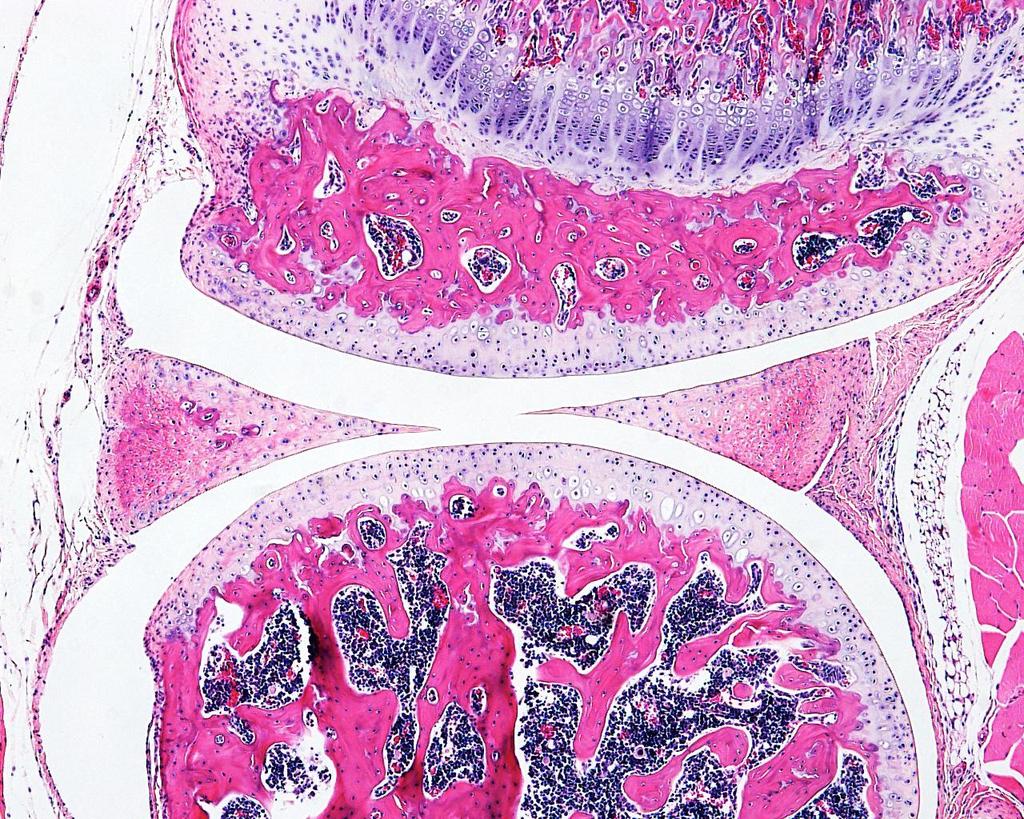
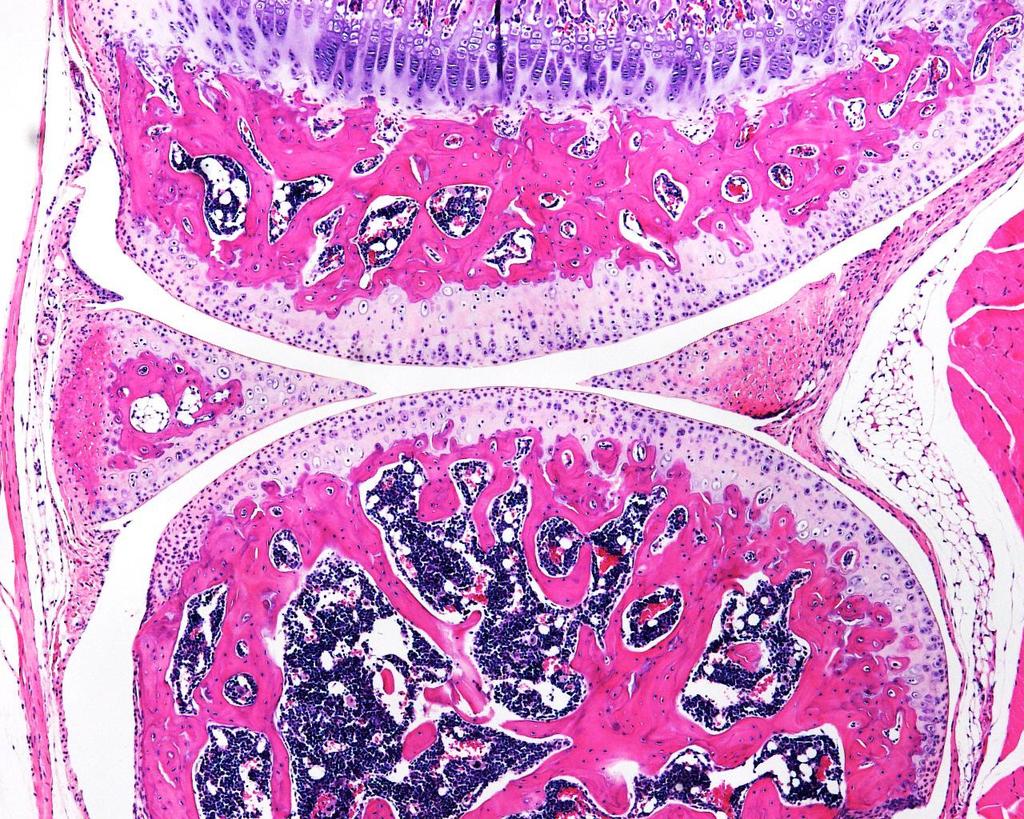
5 A D 4-Day-Old 4-Day-Old B E F Global Cell Density Superficial Cell Density 1 Nuclei /.1 mm3 Nuclei /.1 mm Month-Old 9-Month-Old G 3-Month-Old 3-Month-Old C * * * * * p <.5 2 4DO 3MO Supplementary Figure 5 9MO 4DO 3MO 9MO

6 A C 9-Month-Old 4-Day-Old B 3-Month-Old Supplementary Figure 6 D 6-Month-Old


7 A Tamoxifen 3 6 Months X B : Prg4 CreERt2/+ ;R26 mtmg/+ : Prg4 CreERt2/+ ;R26 mtmg/lsl- C Global Density Femoral Condyle Superficial Density Femoral Condyle D GFP+ Cell Global Density Femoral Condyle GFP+ Cell Superficial Density Femoral Condyle Nuclei /.1 mm Nuclei /.1 mm Nuclei /.1 mm * Nuclei /.1 mm * * p <.5 Supplementary Figure 7


8 A D B 4-Day-Old EdU DAPI E 4-Day-Old EdU DAPI 3-Month-Old C EdU DAPI 3-Month-Old F EdU DAPI 9-Month-Old DAPI 9-Month-Old DAPI Supplementary Figure 8
9 Supplementary Table 1
10 (.1 mm 3 ) (.1 mm 3 ) (.1 mm 3 ) (.1 mm 3 ) (.1 mm 3 ) (.1 mm 3 ) (.1 mm 3 ) (.1 mm 3 ) Supplementary Table 2
11 Supplementary Table 3
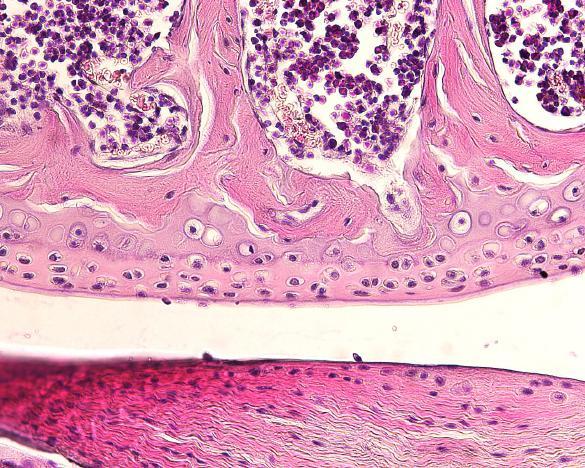
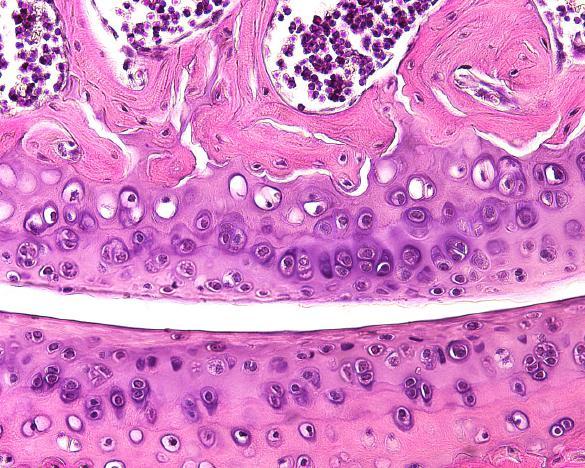
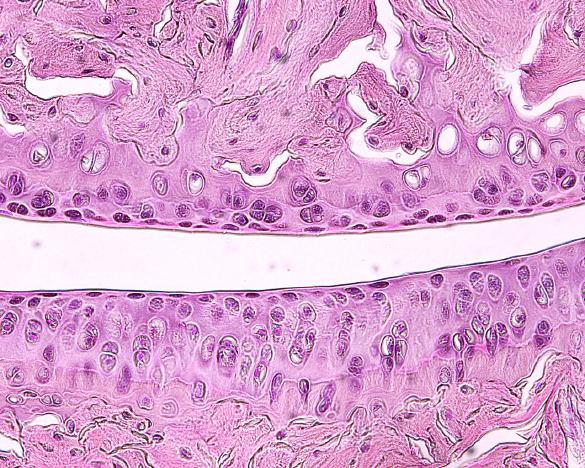
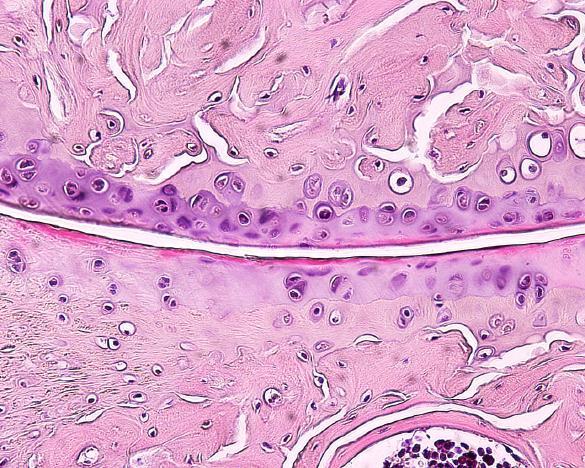
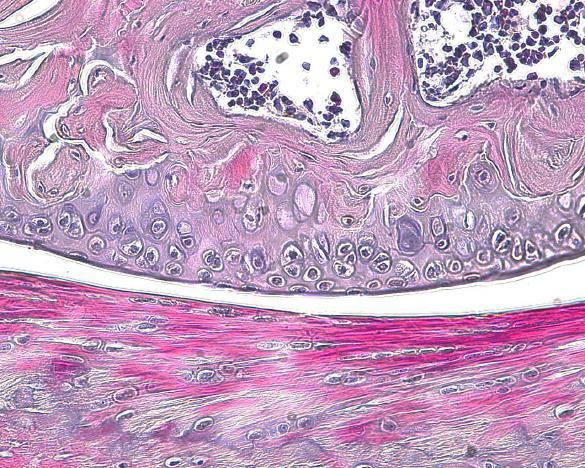
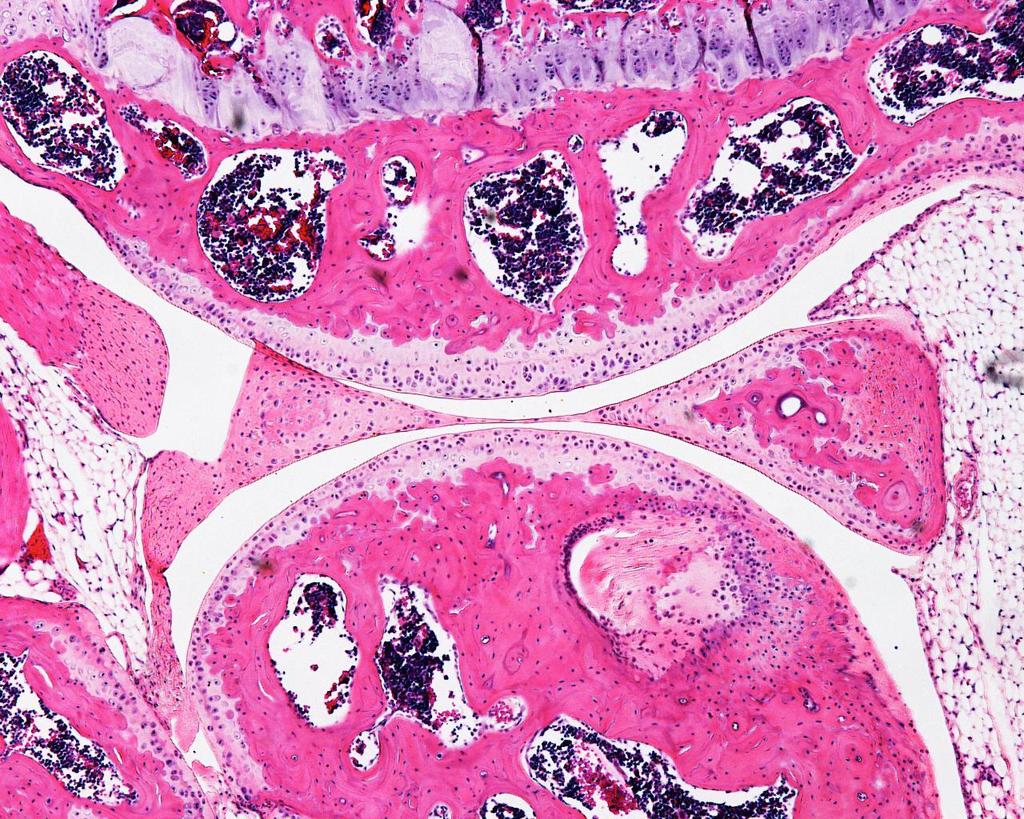
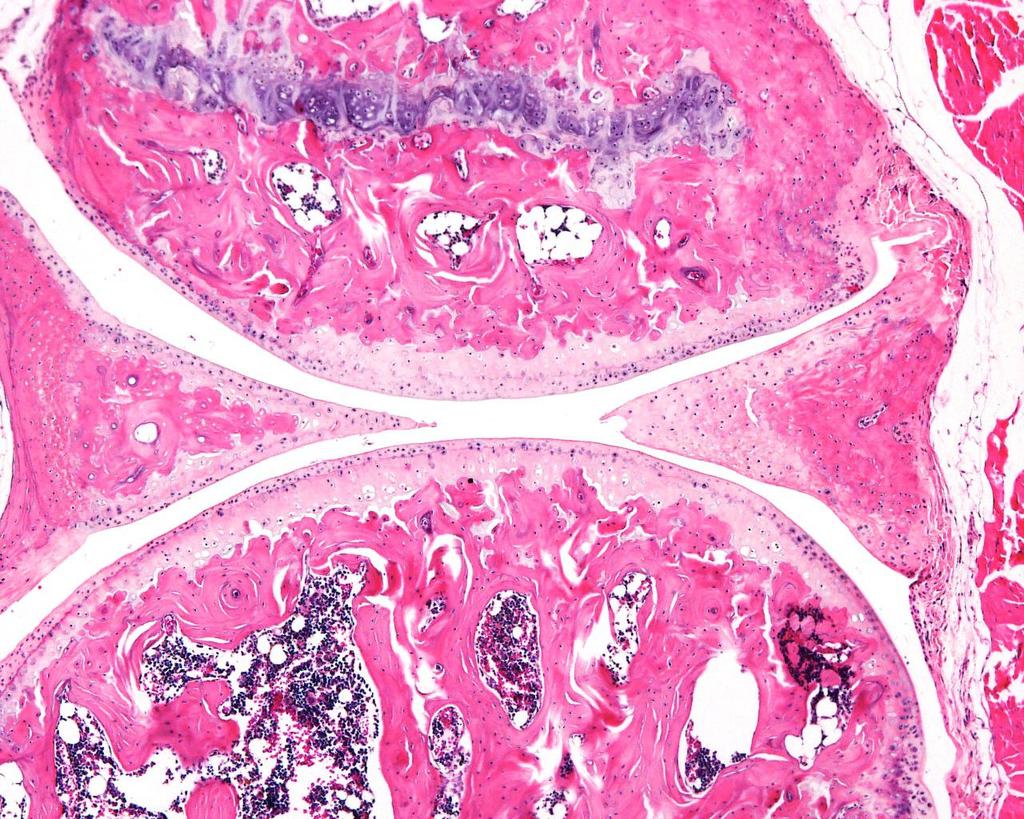
12 Supplementary Figure 1. (A) Photographs depicting the orientations of samples when collecting confocal images. Arrows indicate the region of articular cartilage in contact with the glass surface; medial and lateral femoral condyles are imaged separately. (B) Diagram illustrating the relative sizes of the microscope aperture and articular cartilage. A histologic section through the humeral head is used to indicate the width and depth of the specimen and the organization of chondrocytes within the specimen. The black bar indicates an imaging plane that is 3 µm below the surface where the cartilage and glass meet. Due to the curvature of the cartilage surface, chondrocytes at the periphery in this plane are nearer to the surface than chondrocytes at the center. Supplementary Figure 2. Bar graphs depicting the mean (± SD) values for global cell density, superficial cell density, and cell number in the center 1 µm x 1 µm area at 1 µm below the surfaces of the femoral (A) and humeral heads (B) from individual 1-month-old C57/Bl6J mice (numbered from 1 to 4). Each specimen was oriented and imaged 1 times. Supplementary Figure 3. Bland-Altman plots comparing measures of cell density (number of chondrocytes/.1 mm 3 cartilage) across the entire cartilage volume (Global cell density), the superficial volume extending to a depth of 1 µm (Superficial cell density), and cell numbers in the center 1 µm x 1 µm areas at 1 µm and 2 µm depths for the humeral head (A), lateral femoral condyle (B), and medial femoral condyle (C). Each circle represents a comparison between contralateral joint surfaces (n = 1 mice and 3 technical replicates/cartilage). Blue lines indicate the mean ± 1.96 SD, analogous to a 95% confidence interval. Supplementary Figure 4. Bar graphs depicting mean (± SD) values that were calculated using ANOVA with a generalized estimating equations (GEE) approach for each of the 4 primary measures for the humeral head (A), lateral femoral condyle (B), and medial femoral condyle (C) specimens that had been in fixative for 3 days, 1 days, and 14 days (n = 1). When evaluated for directionality of differences between the 3 days, 1 days, and 17 days measurements using a 1-sided t-test, time in fixative was not found to be a significant factor for the superficial femoral density for most measurements. For the few instances when a significant difference was detected between the 3 days and later measurements, (e.g., global cell density of the femoral head), there also was a difference in the coefficient of variance between the measurements performed on different days, indicative of the measurements being influenced by outlying or dissimilar variables. Thus, it was concluded that length of fixation time does not have a significant impact on any of these measurements. Supplementary Figure 5. (A, B, C) H & E stained sagittal sections (scale bar = 5 µm) through the humeral heads and glenoid fossae of 4-day-old (A), 3- month-old (B) and 9-month-old (C) control mice (left) and -ablated mice (right). (D, E, F) H & E stained sagittal sections (scale bar = 5 µm) through the
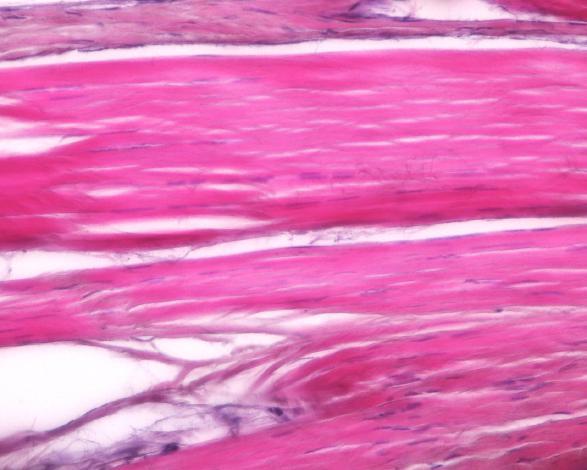
13 femoral heads and acetabuli of 4-day-old (D), 3-month-old (E) and 9-month-old (F) control mice (left) and -ablated mice (right). (G) Bar graphs depicting the mean (± SD) global cell densities and superficial cell densities in the humeral heads of 4-day-old, 3-month-old, and 9-month-old control and -ablated mice (n = 5). Note chondrocyte density measured globally and at the superficial zone decreased significantly (*p <.5) in 4-day-old -ablated mice compared to controls Supplementary Figure 6. (A, B, C) H & E stained knee joint synovium of 4- day-old (A), 3-month-old (B) and 9-month-old (C) control mice (left) and ablated mice (right). (D) H & E stained tail tendon of 6-month-old control mice (left) and -ablated mice (right). Supplementary Figure 7. (A) Schematic depicting the experimental timeline for inducing -mediated cell death by administering Tamoxifen for 1 consecutive days at 3 months of age. Animals were analyzed at 6 months of age. (B) H & E stained sagittal sections (scale bar = 5 µm) through the tibial-femoral joint of control mice (left) and -ablated mice (right). (C, D) Bar graphs depicting the mean (± SD) DAPI stained (C) and GFP+ (D) global cell densities and superficial cell densities in the lateral femoral condyle of control and -ablated mice (n = 3). Although there were significant decreases in the chondrocyte densities of Prg4 expressing (i.e., GFP+) cells in the femoral condyles of -ablated mice compared to controls, nuclear cell density did not differ. Supplementary Figure 8. (A, B, C) Confocal images showing DAPI stained chondrocytes at a depth of 2 µm in the lateral femoral condyles from 4-day-old (A), 3-month-old (B), and 9-month-old (C) control mice (left) and -ablated mice (right). (D, E, F) Confocal images showing DAPI stained chondrocytes at a depth of 2 µm in humeral heads from 4-day-old (D), 3-month-old (E), and 9- month-old (F) control mice (left) and -ablated mice (right). Nuclei of cells that had divided, as indicated by EdU incorporation, are pink in panels A, B, D, and E. Supplementary Table 1. Results of the 1-sided t-tests used to supplement the Bland-Altman analyses on agreement. Supplementary Table 2. Coefficient of variance values for each measurement obtained after 3 days (Scan 1), 1 days (Scan 2), and 17 days (Scan 3) in fixative for the femoral head, humeral head, lateral femoral condyle, and medial femoral condyle. (n = 1 cartilages and 3 technical replicates per cartilage.) Supplementary Table 3. Estimations of sample sizes that will be required to detect significant differences between experimental animals and their controls, with respect to cell numbers in the center 1 µm x 1 µm areas at 1 µm and 2 µm depths, global cell density (.1 mm 3 ), and superficial cell density (.1 mm 3 ) for the femoral head, humeral head, lateral femoral condyle, and medial
14 femoral condyle. Note that for most measurements, < 1 mice/group are needed to detect a 2% change and < 5 animals/group are needed to detect a 3% change.
15 Supplemental Methods 3-D Reconstruction of the Articular Cartilage and Quantitative Analysis 1. Load image file into Imaris and calibrate the image pixel size, if necessary. 2. Start a new Measurement Points object in Surpass view. In Select mode, use Shift+Left-click to select excessive soft tissues and Set Intensity to to delete selected objects, if necessary. 3. Surface creation. (i) Click on Add new surfaces button in the Object toolbar. (ii) In the wizard opened in the Object Properties Area, select the channel that is used to determine the volume. Set Smooth at 2 µm. Select Background Subtraction and set it for 7 µm, which is approximately the diameter of nuclei of the largest object. Click the blue arrow Next button to go to next step. (iii) Use Auto Threshold, deselect Filters and finish surface rendering by clicking the green arrow Finish button. In the View Area, a surface will be overlaid on the 3D image. (iv) Click on Color and change the color of the new surface to white, in order to better visualize. (v) Click on Edit (pencil). In the Select mode, delete all the out-of-plane objects. 4. Create a channel based on the surface (i) In Edit panel, select mask all. A window will popup. (ii) In this window, select the channel that is used to determine the volume, and set Voxels Outside Surface to and Voxels Inside Surface to 1. Click OK and a new channel is created and shown in Display Adjustment. 5. Image processing (i) Click on Image Processing" In the main toolbar and select Channel Arithmetics. (ii) In the popup window, type in bwconvhull(chx>). Note, X is the number of the channel created in step 4. (iii) A new channel is created and can be seen in Display Adjustment. 6. Distance transformation (i) Create new surface and select the channel created in step 5 as source channel. (ii) Uncheck Smooth and Background Subtraction, and click Next. (iii) Use Auto Threshold, deselect Filters and finish creating surface. (iv) Use Clipping Plane in the Object toolbar to visualize the new surface in 3D. (v) Click on Edit in the main toolbar and select Change Data Type. Then select 32 Bit Float in the popup window. (vi) In the wizard in the Object Properties Area, click on the Tool tab and select Distance Transformation. (vii) Select Inside Surface Object and then the Distance Channel is created.
16 7. Spot detection (i) Click on Add New Spot button in the Object toolbar. (ii) Select the channel with DAPI, EdU or GFP labeled cells as source channel. Use Estimated XY Diameter at 5 µm for DAPI and EdU and 1 µm for GFP. (iii) Use Quality filter, set lower threshold at 9 for DAPI and EdU and 1 for GFP, and click on Finish button. (iv) Click on Filters and add Intensity Center Ch=Y as a filter. Note, Y is the number of the channel created in step 6. (v) The maximum threshold shown in the wizard is the maximum thickness of the object. (vi) Set Lower Threshold at and Upper Threshold at 1 to calculate number of cells in the superficial region; and set Lower Threshold at and Upper Threshold to maximum to calculate number of cells in the global region (vii) Use Filters Position X, Y or Z to calculate number of cells in different regions in the 3D image. (viii) Click on Duplicate Selection to New Spot, click on Statistics then Detailed, select the statistics of interest and Export Statistics. For example, select Intensity Center Ch=Y (Y is the number of the Distance Channel created in step 6) to export distance of the center of each nucleus from the surface of the object. 8. Volume Calculation (i) Create new surface using the Distance Channel as source channel. (ii) Uncheck Smoothing and Background Subtraction. (iii) To calculate Global Volume, set as Lower Threshold and the value of maximum thickness as Upper Threshold. To calculate Superficial Volume, set as Lower Threshold and 1 as Upper Threshold. (iv) Finish calculation and click on Statistics, Detailed and Volume to see the result.
Supplementary Figure 1. Nature Neuroscience: doi: /nn.4547
 Supplementary Figure 1 Characterization of the Microfetti mouse model. (a) Gating strategy for 8-color flow analysis of peripheral Ly-6C + monocytes from Microfetti mice 5-7 days after TAM treatment. Living
Supplementary Figure 1. Expression of phospho-sik3 in normal and osteoarthritic articular cartilage in the knee. (a) Semiserial histological sections
 Semiserial histological sections") Supplementary Figure 1. Expression of phospho-sik3 in normal and osteoarthritic articular cartilage in the knee. (a) Semiserial histological sections of normal cartilage were stained with safranin O-fast
Supplementary Figure 1. Expression of phospho-sik3 in normal and osteoarthritic articular cartilage in the knee. (a) Semiserial histological sections of normal cartilage were stained with safranin O-fast
Nature Neuroscience doi: /nn Supplementary Figure 1. Characterization of viral injections.
 Supplementary Figure 1 Characterization of viral injections. (a) Dorsal view of a mouse brain (dashed white outline) after receiving a large, unilateral thalamic injection (~100 nl); demonstrating that
Supplementary Materials for
 www.sciencetranslationalmedicine.org/cgi/content/full/4/117/117ra8/dc1 Supplementary Materials for Notch4 Normalization Reduces Blood Vessel Size in Arteriovenous Malformations Patrick A. Murphy, Tyson
Supplementary information - Table (1), Figures (12), and Videos (5)
, Figures (12), and Videos (5)") Supplementary information - Table (1), Figures (12), and Videos (5) A soft, transparent, freely accessible cranial window for chronic imaging and electrophysiology Chaejeong Heo 1, Hyejin Park 1, 2, Yong-Tae
Supplementary information - Table (1), Figures (12), and Videos (5) A soft, transparent, freely accessible cranial window for chronic imaging and electrophysiology Chaejeong Heo 1, Hyejin Park 1, 2, Yong-Tae
Technical Bulletin. Technical Information for Quidel Molecular Influenza A+B Assay on the Bio-Rad CFX96 Touch
 Technical Bulletin Technical Information for Quidel Molecular Influenza A+B Assay on the Bio-Rad CFX96 Touch Quidel Corporation has verified the performance of the Quidel Molecular Influenza A+B Assay
Nature Neuroscience: doi: /nn Supplementary Figure 1
 Supplementary Figure 1 Atlas representations of the midcingulate (MCC) region targeted in this study compared against the anterior cingulate (ACC) region commonly reported. Coronal sections are shown on
Disclosures: C.B. Raub: None. B.C. Hansen: None. T. Yamaguchi: None. M.M. Temple-Wong: None. K. Masuda: None. R.L. Sah: None.
 En Face Microscopy of Rabbit Knee Articular Cartilage Following Anterior Cruciate Ligament Transection Reveals Early Matrix Damage, Chondrocyte Loss and Cloning Christopher B. Raub, PhD, Bradley C. Hansen,
Supplementary Figure 1 Expression of Crb3 in mouse sciatic nerve: biochemical analysis (a) Schematic of Crb3 isoforms, ERLI and CLPI, indicating the
 Schematic of Crb3 isoforms, ERLI and CLPI, indicating the") Supplementary Figure 1 Expression of Crb3 in mouse sciatic nerve: biochemical analysis (a) Schematic of Crb3 isoforms, ERLI and CLPI, indicating the location of the transmembrane (TM), FRM binding (FB)
Supplementary Figure 1 Expression of Crb3 in mouse sciatic nerve: biochemical analysis (a) Schematic of Crb3 isoforms, ERLI and CLPI, indicating the location of the transmembrane (TM), FRM binding (FB)
Nature Medicine: doi: /nm.4324
 1 2 3 4 5 6 7 8 9 10 11 12 13 14 15 16 17 18 19 20 21 22 23 24 25 Supplementary Figure 1. Kinetics of SnCs development in surgically-induced OA and effect of GCV-induced SnC clearance on OA disease progression
Microtubule Teardrop Patterns
 Supporting Information Microtubule Teardrop Patterns Kosuke Okeyoshi 1, Ryuzo Kawamura 1, Ryo Yoshida 2, and Yoshihito Osada 1 * 1 RIKEN Advanced Science Institute, 2-1 Hirosawa, Wako-shi, Saitama 351-0198,
Nature Neuroscience: doi: /nn Supplementary Figure 1
 Supplementary Figure 1 Quantification of myelin fragments in the aging brain (a) Electron microscopy on corpus callosum is shown for a 18-month-old wild type mice. Myelin fragments (arrows) were detected
ROCK/Cdc42-mediated microglial motility and gliapse formation lead to phagocytosis of degenerating dopaminergic neurons in vivo
 Supplementary Information ROCK/Cdc42-mediated microglial motility and gliapse formation lead to phagocytosis of degenerating dopaminergic neurons in vivo Carlos Barcia* 1,2, Carmen M Ros 1,2, Valentina
ANATOMIC. Navigated Surgical Technique 4 in 1 TO.G.GB.016/1.0
 ANATOMIC Navigated Surgical Technique 4 in 1 TO.G.GB.016/1.0 SCREEN LAYOUT Take screenshot Surgical step Dynamic navigation zone Information area and buttons 2 SCREEN LAYOUT Indicates action when yellow
Supplementary Figure 1. Satellite cell contribution to myofibers in whole. gastrocnemius/plantaris/soleus, diaphragm, and EOM of 12 or 20 month
 Keefe et al. p. 1 Supplementary Figure 1. Satellite cell contribution to myofibers in whole muscles. (a-l) Representative cross-sections through whole TA/EDL, gastrocnemius/plantaris/soleus, diaphragm,
SUPPLEMENTARY INFORMATION
 DOI: 0.038/ncb33 a b c 0 min 6 min 7 min (fixed) DIC -GFP, CenpF 3 µm Nocodazole Single optical plane -GFP, CenpF Max. intensity projection d µm -GFP, CenpF, -GFP CenpF 3-D rendering e f 0 min 4 min 0
Supplementary Data Dll4-containing exosomes induce capillary sprout retraction ina 3D microenvironment
 Supplementary Data Dll4-containing exosomes induce capillary sprout retraction ina 3D microenvironment Soheila Sharghi-Namini 1, Evan Tan 1,2, Lee-Ling Sharon Ong 1, Ruowen Ge 2 * and H. Harry Asada 1,3
Voxar 3D CardiaMetrix. Reference Guide
 Voxar 3D CardiaMetrix Reference Guide The software described in this document is furnished under a license, and may be used or copied only according to the terms of such license. Toshiba means, Toshiba
Wenqin Hu, Cuiping Tian, Tun Li, Mingpo Yang, Han Hou & Yousheng Shu
 Distinct contributions of Na v 1.6 and Na v 1.2 in action potential initiation and backpropagation Wenqin Hu, Cuiping Tian, Tun Li, Mingpo Yang, Han Hou & Yousheng Shu Supplementary figure and legend Supplementary
Supplemental Tables and Figures. The metalloproteinase-proteoglycans ADAMTS7 and ADAMTS12 provide an innate,
 Supplemental Tables and Figures The metalloproteinase-proteoglycans ADAMTS7 and ADAMTS12 provide an innate, tendon-specific protective mechanism against heterotopic ossification Timothy Mead et al Supplemental
Supporting Information
 Supporting Information Rock et al. 10.1073/pnas.1117988108 Fig. S1. Heterogeneity of stromal cells in normal and fibrotic mouse lungs. Sections of normal mouse lungs (A and D) and fibrotic lungs collected
Nanomechanical Symptoms in Cartilage Precede Histological Osteoarthritis Signs after the Destabilization of Medial Meniscus in Mice
 Nanomechanical Symptoms in Cartilage Precede Histological Osteoarthritis Signs after the Destabilization of Medial Meniscus in Mice Basak Doyran 1, Wei Tong 2, Qing Li 1, Haoruo Jia 2, Xianrong Zhang 3,
Reward prediction based on stimulus categorization in. primate lateral prefrontal cortex
 Reward prediction based on stimulus categorization in primate lateral prefrontal cortex Xiaochuan Pan, Kosuke Sawa, Ichiro Tsuda, Minoro Tsukada, Masamichi Sakagami Supplementary Information This PDF file
Supplementary Information
 Supplementary Information Title Degeneration and impaired regeneration of gray matter oligodendrocytes in amyotrophic lateral sclerosis Authors Shin H. Kang, Ying Li, Masahiro Fukaya, Ileana Lorenzini,
RECENT ADVANCES IN CLINICAL MR OF ARTICULAR CARTILAGE
 In Practice RECENT ADVANCES IN CLINICAL MR OF ARTICULAR CARTILAGE By Atsuya Watanabe, MD, PhD, Director, Advanced Diagnostic Imaging Center and Associate Professor, Department of Orthopedic Surgery, Teikyo
Macrophages form functional vascular mimicry channels in vivo. SI Figures and Legend
 Macrophages form functional vascular mimicry channels in vivo Authors: *Faith H. Barnett, *Mauricio Rosenfeld, Malcolm Wood, William Kiosses, Yoshihiko Usui, Valentina Marchetti, Edith Aguilar, and Martin
Postn MCM Smad2 fl/fl Postn MCM Smad3 fl/fl Postn MCM Smad2/3 fl/fl. Postn MCM. Tgfbr1/2 fl/fl TAC
 A Smad2 fl/fl Smad3 fl/fl Smad2/3 fl/fl Tgfbr1/2 fl/fl 1. mm B Tcf21 MCM Tcf21 MCM Smad3 fl/fl Tcf21 MCM Smad2/3 fl/fl Tcf21 MCM Tgfbr1/2 fl/fl αmhc MCM C 1. mm 1. mm D Smad2 fl/fl Smad3 fl/fl Smad2/3
F-actin VWF Vinculin. F-actin. Vinculin VWF
 a F-actin VWF Vinculin b F-actin VWF Vinculin Supplementary Fig. 1. WPBs in HUVECs are located along stress fibers and at focal adhesions. (a) Immunofluorescence images of f-actin (cyan), VWF (yellow),
Allergy Basics. This handout describes the process for adding and removing allergies from a patient s chart.
 Allergy Basics This handout describes the process for adding and removing allergies from a patient s chart. Accessing Allergy Information Page 1 Recording No Known Medication Allergies Page 2 Recording
File name: Supplementary Information Description: Supplementary Figures, Supplementary Table and Supplementary References
 File name: Supplementary Information Description: Supplementary Figures, Supplementary Table and Supplementary References File name: Supplementary Data 1 Description: Summary datasheets showing the spatial
BlueBayCT - Warfarin User Guide
 BlueBayCT - Warfarin User Guide December 2012 Help Desk 0845 5211241 Contents Getting Started... 1 Before you start... 1 About this guide... 1 Conventions... 1 Notes... 1 Warfarin Management... 2 New INR/Warfarin
A genetically targeted optical sensor to monitor calcium signals in astrocyte processes
 A genetically targeted optical sensor to monitor calcium signals in astrocyte processes 1 Eiji Shigetomi, 1 Sebastian Kracun, 2 Michael V. Sofroniew & 1,2 *Baljit S. Khakh Ψ 1 Departments of Physiology
v Feature Stamping SMS 12.0 Tutorial Prerequisites Requirements TABS model Map Module Mesh Module Scatter Module Time minutes
 v. 12.0 SMS 12.0 Tutorial Objectives In this lesson will teach how to use conceptual modeling techniques to create numerical models that incorporate flow control structures into existing bathymetry. The
Feature Stamping SURFACE WATER MODELING SYSTEM. 1 Introduction. 2 Opening a Background Image
 SURFACE WATER MODELING SYSTEM Feature Stamping 1 Introduction In this lesson you will learn how to use conceptual modeling techniques to create numerical models that incorporate flow control structures
GFP/Iba1/GFAP. Brain. Liver. Kidney. Lung. Hoechst/Iba1/TLR9!
 Supplementary information a +KA Relative expression d! Tlr9 5!! 5! NSC Neuron Astrocyte Microglia! 5! Tlr7!!!! NSC Neuron Astrocyte! GFP/Sβ/! Iba/Hoechst Microglia e Hoechst/Iba/TLR9! GFP/Iba/GFAP f Brain
MS/MS Library Creation of Q-TOF LC/MS Data for MassHunter PCDL Manager
 MS/MS Library Creation of Q-TOF LC/MS Data for MassHunter PCDL Manager Quick Start Guide Step 1. Calibrate the Q-TOF LC/MS for low m/z ratios 2 Step 2. Set up a Flow Injection Analysis (FIA) method for
B220 CD4 CD8. Figure 1. Confocal Image of Sensitized HLN. Representative image of a sensitized HLN
 B220 CD4 CD8 Natarajan et al., unpublished data Figure 1. Confocal Image of Sensitized HLN. Representative image of a sensitized HLN showing B cell follicles and T cell areas. 20 µm thick. Image of magnification
Supplementary Figure 1. Mother centrioles can reduplicate while in the close association
 C1-GFP distance (nm) C1-GFP distance (nm) a arrested HeLa cell expressing C1-GFP and Plk1TD-RFP -3 s 1 2 3 4 5 6 7 8 9 11 12 13 14 16 17 18 19 2 21 22 23 24 26 27 28 29 3 b 9 8 7 6 5 4 3 2 arrested HeLa
Posner s Attention Test
 iworx Physiology Lab Experiment Experiment HP-18 Posner s Attention Test Background Setup Lab Note: The lab presented here is intended for evaluation purposes only. iworx users should refer to the User
Commonwealth of Pennsylvania PA Test Method No. 423 Department of Transportation October Pages LABORATORY TESTING SECTION. Method of Test for
 Commonwealth of Pennsylvania PA Test Method No. 423 Department of Transportation 10 Pages 1. SCOPE LABORATORY TESTING SECTION Method of Test for RETRO-DIRECTIVE REFLECTIVITY OF REFLECTIVE MATERIALS 1.1
General Single Ion Calibration. Pete 14-May-09
 General Single Ion Calibration Pete 14-May-09 Purpose of SI calibration Measure the instrument response of a single ion. Necessary for understanding of error in instrument (counting statistics) Calculation
Straumann CARES Visual 9
 Straumann CARES Visual 9 Software Update What s New Software Version 9.0 Release Date October 15 th 2014 New Feature Highlights New Graphical User Interface New Bar Types Different Custom Abutment Types
Warfarin Help Documentation
 Warfarin Help Documentation Table Of Contents Warfarin Management... 1 iii Warfarin Management Warfarin Management The Warfarin Management module is a powerful tool for monitoring INR results and advising
v Feature Stamping SMS 13.0 Tutorial Prerequisites Requirements Map Module Mesh Module Scatter Module Time minutes
 v. 13.0 SMS 13.0 Tutorial Objectives Learn how to use conceptual modeling techniques to create numerical models which incorporate flow control structures into existing bathymetry. The flow control structures
Santulli G. et al. A microrna-based strategy to suppress restenosis while preserving endothelial function
 ONLINE DATA SUPPLEMENTS Santulli G. et al. A microrna-based strategy to suppress restenosis while preserving endothelial function Supplementary Figures Figure S1 Effect of Ad-p27-126TS on the expression
Nature Neuroscience: doi: /nn Supplementary Figure 1. Trial structure for go/no-go behavior
 Supplementary Figure 1 Trial structure for go/no-go behavior a, Overall timeline of experiments. Day 1: A1 mapping, injection of AAV1-SYN-GCAMP6s, cranial window and headpost implantation. Water restriction
Supplementary Figure 1. Analysis of LN S1P gradients.
 Supplementary Figure 1 Analysis of LN S1P gradients. (a) Diagram showing the spatial distribution of NK cells in WT LN. Inset: Upon infection, sinus-lining macrophages secrete IL-18 and other cytokines,
Release Notes DWOS Lava Edition
 Release Notes DWOS Lava Edition Version 2.0 10/15/2013 Summary The present document contains step-by-step instructions and images to explain the major new features and improvements included in the Dental
Tutorial: RNA-Seq Analysis Part II: Non-Specific Matches and Expression Measures
 : RNA-Seq Analysis Part II: Non-Specific Matches and Expression Measures March 15, 2013 CLC bio Finlandsgade 10-12 8200 Aarhus N Denmark Telephone: +45 70 22 55 09 Fax: +45 70 22 55 19 www.clcbio.com support@clcbio.com
SUPPLEMENTARY INFORMATION
 DOI: 10.1038/ncb2988 Supplementary Figure 1 Kif7 L130P encodes a stable protein that does not localize to cilia tips. (a) Immunoblot with KIF7 antibody in cell lysates of wild-type, Kif7 L130P and Kif7
Patients & Physicians
 Patients & Physicians The patients and Physicians window presents options for managing your patients information, treatment records and much more. It is also possible to manage the physicians information
Adding an Event to the Campus Calendar
 Adding an Event to the Campus Calendar To get your event on the UMSL calendar, you ll first have to log in to Cascade (the CMS) at http://cms.umsl.edu/. If you do not have CMS access, please pass the event
SUPPLEMENTARY INFORMATION
 SUPPLEMENTARY INFORMATION doi:10.1038/nature11306 Supplementary Figures Supplementary Figure 1. Basic characterization of GFP+ RGLs in the dentate gyrus of adult nestin-gfp mice. a, Sample confocal images
Fully Automated IFA Processor LIS User Manual
 Fully Automated IFA Processor LIS User Manual Unless expressly authorized, forwarding and duplication of this document is not permitted. All rights reserved. TABLE OF CONTENTS 1 OVERVIEW... 4 2 LIS SCREEN...
Nature Neuroscience: doi: /nn Supplementary Figure 1. Splenic atrophy and leucopenia caused by T3 SCI.
 Supplementary Figure 1 Splenic atrophy and leucopenia caused by T3 SCI. (a) Gross anatomy of representative spleens from control and T3 SCI mice at 28 days post-injury. (b and c) Hematoxylin and eosin
Nature Methods: doi: /nmeth Supplementary Figure 1. Activity in turtle dorsal cortex is sparse.
 Supplementary Figure 1 Activity in turtle dorsal cortex is sparse. a. Probability distribution of firing rates across the population (notice log scale) in our data. The range of firing rates is wide but
Musculoskeletal Ultrasound. Technical Guidelines SHOULDER
 Musculoskeletal Ultrasound Technical Guidelines SHOULDER 1 Although patient s positioning for shoulder US varies widely across different Countries and Institutions reflecting multifaceted opinions and
AudioConsole. User Guide. Doc. No EN/01 Part No EN
 AudioConsole Doc. No. 7-50-2180-EN/01 Part No. 7-50-21800-EN Copyright notice [2003], 2018 Inmedico A/S. All rights reserved. Oscilla is aregistered trademark of Inmedico A/S in the U.S.A. and/or other
3D Morphological Tumor Analysis Based on Magnetic Resonance Images
 3D Morphological Tumor Analysis Based on Magnetic Resonance Images Sirwoo Kim Georgia Institute of Technology The Wallace H. Coulter Department of Biomedical Engineering, Georgia. Abstract In this paper,
CD3 coated cover slips indicating stimulatory contact site, F-actin polymerization and
 SUPPLEMENTAL FIGURES FIGURE S1. Detection of MCs. A, Schematic representation of T cells stimulated on anti- CD3 coated cover slips indicating stimulatory contact site, F-actin polymerization and microclusters.
Broad Integration of Expression Maps and Co-Expression Networks Compassing Novel Gene Functions in the Brain
 Supplementary Information Broad Integration of Expression Maps and Co-Expression Networks Compassing Novel Gene Functions in the Brain Yuko Okamura-Oho a, b, *, Kazuro Shimokawa c, Masaomi Nishimura b,
iworx Sample Lab Experiment AN-5: Cockroach Leg Mechanoreceptors
 Experiment AN-5: Cockroach Leg Mechanoreceptors Exercise 1: Chordotonal Organs Aim: To explore the basic characteristics of the chordotonal organs, their response to direction and intensity of leg movement,
Supplemental Information. Myocardial Polyploidization Creates a Barrier. to Heart Regeneration in Zebrafish
 Developmental Cell, Volume 44 Supplemental Information Myocardial Polyploidization Creates a Barrier to Heart Regeneration in Zebrafish Juan Manuel González-Rosa, Michka Sharpe, Dorothy Field, Mark H.
Meta-analysis using RevMan. Yemisi Takwoingi October 2015
 Yemisi Takwoingi October 2015 Contents 1 Introduction... 1 2 Dataset 1 PART I..2 3 Starting RevMan... 2 4 Data and analyses in RevMan... 2 5 RevMan calculator tool... 2 Table 1. Data for derivation of
Program Tooth Thickness/Space Width & Pressure Angle at Shifted Diameter
 Program 60-132 Tooth Thickness/Space Width & Pressure Angle at Shifted Diameter Introduction The purpose of this model is to enable you to find the tooth thickness (or space width for internal gears),
LEFT VENTRICLE SEGMENTATION AND MEASUREMENT Using Analyze
 LEFT VENTRICLE SEGMENTATION AND MEASUREMENT Using Analyze 2 Table of Contents 1. Introduction page 3 2. Segmentation page 4 3. Measurement Instructions page 11 4. Calculation Instructions page 14 5. References
Iso-inertial dynamometer
 Iso-inertial dynamometer A. Equipment set up B. Data acquisition and export C. Training mode 1 P a g e A. Equipment set up 1. Connect all the devices as depicted below: 2. Launch the software by clicking
Induced superficial chondrocyte death reduces catabolic cartilage damage in murine posttraumatic osteoarthritis
 Induced superficial chondrocyte death reduces catabolic cartilage damage in murine posttraumatic osteoarthritis Minjie Zhang, 1,2 Sriniwasan B. Mani, 1 Yao He, 1,3 Amber M. Hall, 4 Lin Xu, 5 Yefu Li, 5
Supplementary Fig. S1. Schematic diagram of minigenome segments.
 open reading frame 1565 (segment 5) 47 (-) 3 5 (+) 76 101 125 149 173 197 221 246 287 open reading frame 890 (segment 8) 60 (-) 3 5 (+) 172 Supplementary Fig. S1. Schematic diagram of minigenome segments.
mm Distance (mm)
") b a Magnet Illumination Coverslips MPs Objective 2575 µm 1875 µm 1575 µm 1075 µm 875 µm 545 µm 20µm 2 3 0.5 0.3mm 1 1000 100 10 1 0.1 1000 100 10 1 0.1 Field Induction (Gauss) 1.5 0 5 10 15 20 Distance
b a Magnet Illumination Coverslips MPs Objective 2575 µm 1875 µm 1575 µm 1075 µm 875 µm 545 µm 20µm 2 3 0.5 0.3mm 1 1000 100 10 1 0.1 1000 100 10 1 0.1 Field Induction (Gauss) 1.5 0 5 10 15 20 Distance
Supplemental Figure 1. (A) The localization of Cre DNA recombinase in the testis of Cyp19a1-Cre mice was detected by immunohistchemical analyses
 The localization of Cre DNA recombinase in the testis of Cyp19a1-Cre mice was detected by immunohistchemical analyses") Supplemental Figure 1. (A) The localization of Cre DNA recombinase in the testis of Cyp19a1-Cre mice was detected by immunohistchemical analyses using an anti-cre antibody; testes at 1 week (left panel),
Supplemental Figure 1. (A) The localization of Cre DNA recombinase in the testis of Cyp19a1-Cre mice was detected by immunohistchemical analyses using an anti-cre antibody; testes at 1 week (left panel),
Raw BP and Eight Hemodynamic Measurements Displayed in Real Time
 APPLICATION NOTE 42 Aero Camino, Goleta, CA 93117 Tel (805) 685-0066 Fax (805) 685-0067 info@biopac.com www.biopac.com Updated 01.11.2016 Application Note 115: Hemodynamic Measurements Raw BP and Eight
Evaluation of Breast Specimens Removed by Needle Localization Technique
 Evaluation of Breast Specimens Removed by Needle Localization Technique Specimen Handling: The breast specimen when received should be measured and grossly inspected for any orientation designated by the
The North Carolina Health Data Explorer
 The North Carolina Health Data Explorer The Health Data Explorer provides access to health data for North Carolina counties in an interactive, user-friendly atlas of maps, tables, and charts. It allows
Fibrinogen-induced perivascular microglial clustering is required for the. development of axonal damage in neuroinflammation
 SUPPLEMENTARY INFORMATION Fibrinogen-induced perivascular microglial clustering is required for the development of axonal damage in neuroinflammation Dimitrios Davalos, Jae Kyu Ryu, Mario Merlini, Kim
Mako Partial Knee Patellofemoral
 Mako Partial Knee Patellofemoral Mako Robotic-Arm Assisted Surgery Surgical reference guide Table of contents Implant compatibility.... 3 Pre-operative implant planning... 4 Intra-operative planning....
Modeling of human knee joint and finite element analysis of landing impact motion
 ISSN 1746-7659, England, UK Journal of Information and Computing Science Vol. 13, No. 1, 2018, pp.044-048 Modeling of human knee joint and finite element analysis of landing impact motion Bao Chunyu 1,3,Meng
Sleep Apnea Therapy Software Clinician Manual
 Sleep Apnea Therapy Software Clinician Manual Page ii Sleep Apnea Therapy Software Clinician Manual Notices Revised Notice Trademark Copyright Sleep Apnea Therapy Software Clinician Manual 103391 Rev A
Nodule Detection process: 1. Click on the patient study to be loaded 2. Click the drop down arrow next to the analysis button and select LNA
 Application Guide Lung Nodule Assessment Post Processing Portal version 2.5 This is an application guide for Lung Nodule Post Processing on version 2.5. For more detailed information, please refer to the
Nature Immunology: doi: /ni eee Supplementary Figure 1
 eee Supplementary Figure 1 Hyphae induce NET release, but yeast do not. (a) NET release by human peripheral neutrophils stimulated with a hgc1 yeast-locked C. albicans mutant (yeast) or pre-formed WT C.
SUPPLEMENTARY INFORMATION
 doi: 10.1038/nature06310 SUPPLEMENTARY INFORMATION www.nature.com/nature 1 www.nature.com/nature 2 www.nature.com/nature 3 Supplementary Figure S1 Spontaneous duration of wake, SWS and REM sleep (expressed
Supplementary Materials for
 www.sciencesignaling.org/cgi/content/full/8/375/ra41/dc1 Supplementary Materials for Actin cytoskeletal remodeling with protrusion formation is essential for heart regeneration in Hippo-deficient mice
Nature Neuroscience: doi: /nn Supplementary Figure 1
 Supplementary Figure 1 Reward rate affects the decision to begin work. (a) Latency distributions are bimodal, and depend on reward rate. Very short latencies (early peak) preferentially occur when a greater
Definiens. Tissue Studio 4.2. Tutorial 8: Cell Simulation and Classification
 Definiens Tissue Studio 4.2 Tutorial 8: Cell Simulation and Classification Tutorial 8: Cell Simulation and Classification Imprint and Version Copyright 2015 Definiens AG. All rights reserved. This document
PCL GraftLink Surgical Technique
 PCL GraftLink Surgical Technique PCL GraftLink GraftLink Minimally Invasive PCL Reconstruction The GraftLink technique provides the ultimate in anatomic, minimally invasive, and reproducible PCL reconstruction
Change in Femur Shape during Postnatal Development and Growth of C57BL/6 Mice
 Change in Femur Shape during Postnatal Development and Growth of C57BL/6 Mice Introduction: Disorders of skeletal development, including hip dysplasia, slipped capital femoral epiphysis, and Legg-Calve-Perthes
Supplementary Figure 1. EC-specific Deletion of Snail1 Does Not Affect EC Apoptosis. (a,b) Cryo-sections of WT (a) and Snail1 LOF (b) embryos at
 Cryo-sections of WT (a) and Snail1 LOF (b) embryos at") Supplementary Figure 1. EC-specific Deletion of Snail1 Does Not Affect EC Apoptosis. (a,b) Cryo-sections of WT (a) and Snail1 LOF (b) embryos at E10.5 were double-stained for TUNEL (red) and PECAM-1 (green).
Supplementary Figure 1. EC-specific Deletion of Snail1 Does Not Affect EC Apoptosis. (a,b) Cryo-sections of WT (a) and Snail1 LOF (b) embryos at E10.5 were double-stained for TUNEL (red) and PECAM-1 (green).
Supplementary Figure S1: Histological analysis of kainate-treated animals
 Supplementary Figure S1: Histological analysis of kainate-treated animals Nissl stained coronal or horizontal sections were made from kainate injected (right) and saline injected (left) animals at different
(a) Significant biological processes (upper panel) and disease biomarkers (lower panel)
 Significant biological processes (upper panel) and disease biomarkers (lower panel)") Supplementary Figure 1. Functional enrichment analyses of secretomic proteins. (a) Significant biological processes (upper panel) and disease biomarkers (lower panel) 2 involved by hrab37-mediated secretory
Supplementary Figure 1. Functional enrichment analyses of secretomic proteins. (a) Significant biological processes (upper panel) and disease biomarkers (lower panel) 2 involved by hrab37-mediated secretory
The Gaze Cueing Paradigm with Eye Tracking Background Set-up Lab
 iworx Physiology Lab Experiment Experiment HP-17 The Gaze Cueing Paradigm with Eye Tracking Background Set-up Lab Note: The lab presented here is intended for evaluation purposes only. iworx users should
SUPPLEMENTARY INFORMATION
 b 350 300 250 200 150 100 50 0 E0 E10 E50 E0 E10 E50 E0 E10 E50 E0 E10 E50 Number of organoids per well 350 300 250 200 150 100 50 0 R0 R50 R100 R500 1st 2nd 3rd Noggin 100 ng/ml Noggin 10 ng/ml Noggin
Journal of Biomechanical Science and Engineering
 0123456789 Bulletin of the JSME Vol.9, No.2, 2014 Journal of Biomechanical Science and Engineering Finite element analysis of hip joint cartilage reproduced from real bone surface geometry based on 3D-CT
<20 <20 <20 < <20 <20 <20 <20. Mock
 Cross-Lineage Neutralization PRNT 80 Titers Asian Asian West African Indian Ocean Group NHP Strain 181/25 Strain 99659 Strain 37997 Strain LR 142590 80 80 20 40 EILV/CHIKV 150844 640 640 160 320 Mock 150849
Influenza virus exploits tunneling nanotubes for cell-to-cell spread
 Supplementary Information Influenza virus exploits tunneling nanotubes for cell-to-cell spread Amrita Kumar 1, Jin Hyang Kim 1, Priya Ranjan 1, Maureen G. Metcalfe 2, Weiping Cao 1, Margarita Mishina 1,
Why the dog? Analogy of the anatomy
 Why the dog? Analogy of the anatomy Surgically Induced canine OA models: Anterior (cranial) cruciate ligament transection model Pond MJ, Nuki G. Ann Rheum Dis 1973 (and > 100 others) Meniscal disruption
Blue Sky Plan USER MANUAL
 USER MANUAL **Manual Revision 9** 1 Contents 1 Introduction... 5 2 Installing Blue Sky Plan... 7 2.1 Installation process (Windows)... 7 2.2 Installation process (Mac OS X)... 9 2.3 Hardware requirements...