Supplementary Figure 1 (Related with Figure 4). Molecular consequences of Eed deletion. (a) ChIP analysis identifies 3925 genes that are associated
|
|
|
- Meghan Holmes
- 5 years ago
- Views:
Transcription
 ChIP analysis identifies 3925 genes that are associated with the H3K27me3 mark in chondrocytes (see Table S1, Experiment 2).")
1 Supplementary Figure 1 (Related with Figure 4). Molecular consequences of Eed deletion. (a) ChIP analysis identifies 3925 genes that are associated with the H3K27me3 mark in chondrocytes (see Table S1, Experiment 2). Microarray analysis (see Table S2) identified 1817 upregulated genes that were upregulated more than 1.25 fold upon Eed deletion. Only 433 genes (12.4%) marked with H3K27me3 were upregulated in Eed-deficient chondrocytes. (b) Read mapping of indicated genomic loci.

2 Supplementary Figure 2 (Related with Figures 1,4,5 and 6). (a) Immunostaining for H3K27me3 on tibial growth plate sections of wild type (Ctrl) and Eed cko (cko) mice. The red bar indicates the proliferating chondrocyte zone and the blue bar indicates the hypertrophic chondrocyte zone. Scale bar, 20 µm. (b) Immunoblot analysis using protein lysates of primary rib chondrocytes cultured overnight shows aberrant activation of multiple signaling pathways in Eed cko chondrocytes. (c) TGF- inhibitors (TGF -i; LY364947, 1 ug/g BW), a p38 inhibitor (p38-i; SB203580, 25 ug/g BW), or a MEK inhibitor (MEK-i; U0126, 5 ug/g BW) was intraperitoneally injected daily to pregnant and nursing mothers from E 14.5 through P5.5, and then directly to the pups until P9.5. Mice were sacrificed at P9.5 for evaluation. The dosage of U0126 was determined according to previous reports in which U0126 injection successfully rescued skeletal abnormalities caused by ERK overactivation 1,2. Likewise, p38 inhibitor injection protocol was determined according to the study that demonstrated that SB injection rescued skin and skeletal phenotypes caused by a Fgfr2 overactivation mutation in mice 3. The dosage of the TGF- receptor inhibitor, Ly364947, was determined according to a previous study 4.
 or C59 Wnt inhibitor (Wnt-i). Asterisks indicate the first rib.")
3 Supplementary Figure 3 (Related with Figure 6). Wnt inhibition ameliorates kyphosis of Eed cko mice. (a) Frontal views of cervical spine of P7.5 old mice with indicated genotypes treated with vehicle (Veh) or C59 Wnt inhibitor (Wnt-i). Asterisks indicate the first rib. Arrows show cartilage between the vertebral body and transverse processes, which is prematurely replaced by mineralized bone in vehicle-treated cko mice. Wnt inhibitor treatment restores this cartilage. (b) Wnt inhibitor treatment rescues premature hypertrophic differentiation in the prospective secondary ossification center of the Eed-deficient tibial epiphysis (arrow). (c) Wnt inhibitor treatment was not able to significantly improve animal growth. n = 6 each group. * p < 0.05 vs Ctrl treated with vehicle, ** p < 0.05 vs Ctrl treated with vehicle or C59 (Wnt-i). (d) Chondrocyte proliferation in the spinal primordium assessed by EdU incorporation at E15.5 after injection of C59 Wnt inhibitor for two days. Wnt inhibition did not rescue the proliferation defect of vertebral chondrocytes of Eed cko embryos. Thick white lines indicate the contour of the spinal primordium at the level of C4-C5. Thin lines indicate the notochord. n = 3; * p < vs Ctrl.
 or TGF- 1 treatment reduces Hif1a expression in control (Ctrl) cells, inhibition of indicated signaling pathways fails to restore Hif1a expression in primary rib")
4 Supplementary Figure 4 (Related with Figures 3 and 5). (a) Effects of signaling manipulation on Hif1a expression. Although retinoic acid (RA) or TGF- 1 treatment reduces Hif1a expression in control (Ctrl) cells, inhibition of indicated signaling pathways fails to restore Hif1a expression in primary rib chondrocytes. Hif1a expression was determined by qrt-pcr upon treatment with indicated ligands or inhibitors for 24 hrs. Cells were treated with TGF- 1 ( 50 ng/ml), RA (12.5 um), EGF (5 ng/ml), MEK inhibitor (MEK-i; U0126, 10 nmol/ml), p38 inhibitor (p38-i; SB203580, 5 mm), PI3K inhibitor (PI3K-i; LY294002, 50 mm), RA inhibitor (RA-i; AGN uM and BMS um), Wnt inhibitor (Wnt-i; C nm), Tgfbr2 inhibitor (TGF -i; Ly um), and TGF- lignad neutralizing antibody ( TGF; 10 ug/ml). n = 4; * p < 0.05 vs vehicle treated sample of each genotype (veh). (b) Immunostaining for Hif1a protein in Ctrl and cko tibial growth plate sections of P7.5-old mice. Magnified views of boxed regions are shown in lower panels. (c) Quantification of cells with strong nuclear Hif1a staining in Ctrl and cko (n=3). * p < Staining is assessed by setting a threshold using the ImageJ software. The number of stained cells above a given intensity threshold is considered positive and the proportion of the positive cells to the total number of cells in each section presented as percentage of positive cells. Samples preparation, processing, sectioning, staining and measurement settings are all identical in both Ctrl and cko groups. *p<0.001 vs. Ctrl. (d) Tibial growth plate sections from Ctrl and cko mice treated with vehicle (Veh) or TGF- receptor inhibitor (TGF -i; Ly ug/g BW, ip) were stained for p-smad2 (n=3). Mice were sacrificed two hours after TGF -i treatment.
 Three different Tgfbr2 shrna and GFP-shRNA retroviral constructs were tested for knockdown efficiency.")
5 Supplementary Figure 5 (Related with Figures 5). Upregulation of Tgfbr2 is responsible for the proliferation defect of Eed deficient chondrocytes. (a) Three different Tgfbr2 shrna and GFP-shRNA retroviral constructs were tested for knockdown efficiency. Two days after viral infection to primary rib chondrocytes, Tgfbr2 mrna (left panel) and protein (right panel) levels were assessed. With the condition in which the maximal infection efficiency (60%, assessed by GFP), % reduction in Tgfbr2 expression was achieved by Tgfbr2 sh2 and sh3 viruses. (b) Two different Cdkn2a shrna constructs were similarly generated. With the infection efficiency of 60%, 50% reduction in Cdkn2a expression level achieved in primary rib chondrocytes. (c) MTS cell proliferation assay on control (Ctrl) and Eed cko (cko) chondrocytes infected with Tgfbr2 sh2 (Tgfbr2 sh), Cdkn2a sh2 (Cdkn2a sh), or GFP retroviruses. Cdkn2a knockdown had little effect in chondrocyte proliferation while Tgfbr2 knockdown showed a significant increase in chondrocyte proliferation in vitro. Cell proliferation assay was performed at day 0 and day 4 after infection. Values were normalized by those at day 0. (d) Tgfbr2 heterozygosity (cko-tgfbr2 het) significantly improved animal growth and growth plate chondrocyte proliferation of Eed cko mice. EdU staining of the tibial growth plate of mice with indicated genotypes. n 5 in each group. p< 0.05 cko-tgfbr2 het vs. cko. Scale bar, 200 µm. (e) The effect of the TGF-β inhibitor (TGF -i; Ly364947) at indicated concentrations on chondrocytes proliferation assessed by MTS assay in vitro. TGF -i treatment increases chondrocyte proliferation at lower concentrations, whereas it decreases proliferation at higher concentrations (> 50uM). n = 6, *p < 0.05.
6
7


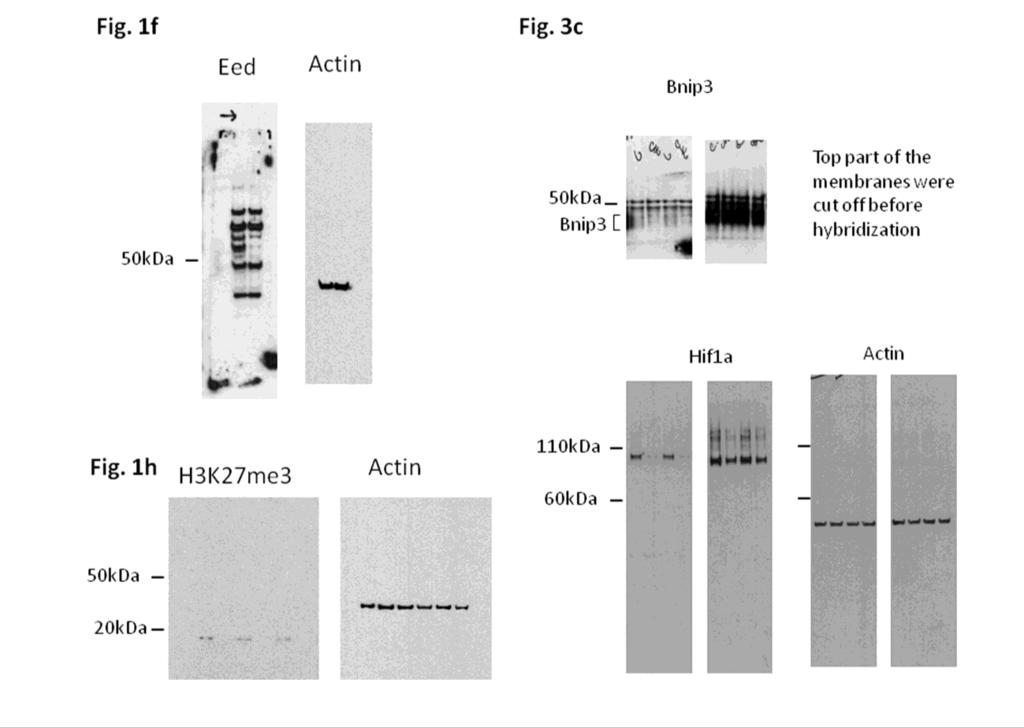
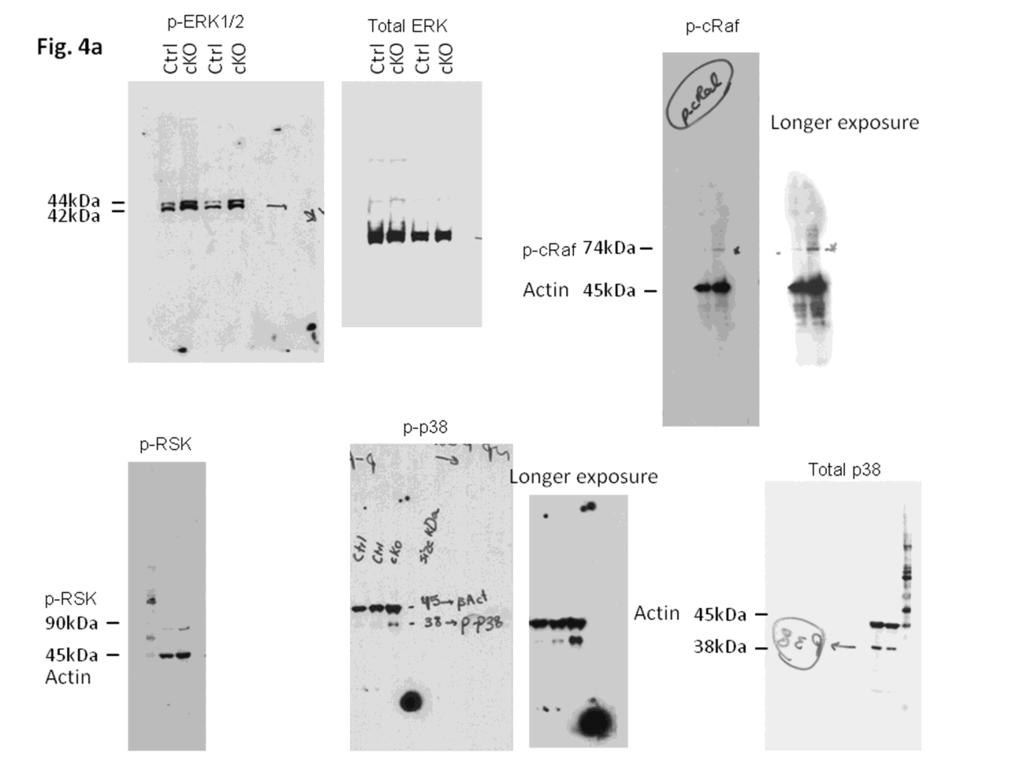
8 Supplementary Figure 6. The uncropped blot result images. Related to the Figure 1, 3, 4 and 5.
9 Supplementary Methods Chromatin immunoprecipitation (ChIP) and sequencing (ChIP-seq) Primary rib chondrocytes isolated from P2.5 CD-1 mice were subjected to ChIP-seq analysis using the SimpleChIP Enzymatic Chromatin IP kit (#9003, Cell Signaling Technology) and anti-h3k27me3 antibody (#9733, Cell Signaling Technology. ChIP ed DNA and input DNA were sequenced by the Illumina Hi-Seq 2500 sequencer at Otogenetics (GA). Reads were mapped to the mouse genome (Build 38/mm10) using the Bowtie2. MACS2 was used for peak calling with the q value smaller than Peak regions were annotated using PAVIS 5. A called peak was associated with a gene when the peak was located within the region of 5kb-upstream and 1kb-downstream 1kb of a gene. Microarray Analysis and quantitative reverse transcription polymerase chain reaction (qrt-pcr) analysis RNA was extracted from primary rib chondrocytes from newborn mice. Chondrocytes were cultured in DMEM containing 10% fetal calf serum over night. RNA was extracted using Direct-zol RNA mini-prep kit (Zymo Research). Gene expression profiling was performed using the Affymetrix Mouse Gene 1.0 ST. Immunostaining. Immunohistochemistry was performed on paraffin sections using Perkin Elmer Tyramide signal amplification kit (# NEL700A001KT) according to manufacture s instruction. Anti-Hif1a antibody (# NB , Novus; 1:000) and anti- H3K27me3 antibody (# GTX121184, Gen Tex; 1:1000) were purchased. Retrovirus generation. Retroviruses expressing shrna for Tgrbr2, Cdkn2a, and egfp were constructed using a modified pmscv vector (Clontech) 6. For shrna constructs for Tgfbr2 (Tgfbr2-sh1, -sh2, and -sh3) and Cdkn2a (Cdkn2a-sh1, and -sh2), the following sequences were synthesized and subcloned into pmscv-egfp: Cdkn2a-sh1,5 -GATGATGATGGGCAACGTTCACTCGAGTGAACGTTGCCCATCATCATC -3 ; Cdkn2a-sh2, 5 - CTAGCGATGCTAGCGTGTCTACTCGAGTAGACACGCTAGCATCGCTAG-3 ; Tgfbr2-sh1, 5 - TGGCAGAAATTACAAGTGCATATTTCTCGAGAAATATGCACTTGTAATTTCTGCCA-3 ; Tgfbr2-sh2, 5 - GTGTAAATACGAATAGCTATGTTCTCGAGAACATAGCTATTCGTATTTACACAC-3 Tgfbr2- sh3, 5 -GTGGAGGAAGAACGACAAGAACATTCTCGAGAATGTTCTTGTCGTTCTTCCTCCAC- 3
10 Supplementary References 1. Shukla, V., Coumoul, X., Wang, R.H., Kim, H.S. & Deng, C.X. RNA interference and inhibition of MEK-ERK signaling prevent abnormal skeletal phenotypes in a mouse model of craniosynostosis. Nat Genet 39, (2007). 2. Nakamura, T., Gulick, J., Pratt, R. & Robbins, J. Noonan syndrome is associated with enhanced perk activity, the repression of which can prevent craniofacial malformations. Proc Natl Acad Sci U S A 106, (2009). 3. Wang, Y., et al. p38 Inhibition ameliorates skin and skull abnormalities in Fgfr2 Beare-Stevenson mice. J Clin Invest 122, (2012). 4. Oka, M., et al. Inhibition of endogenous TGF-beta signaling enhances lymphangiogenesis. Blood 111, (2008). 5. Huang, W., Loganantharaj, R., Schroeder, B., Fargo, D. & Li, L. PAVIS: a tool for Peak Annotation and Visualization. Bioinformatics 29, (2013). 6. Papaioannou, G., Inloes, J.B., Nakamura, Y., Paltrinieri, E. & Kobayashi, T. let-7 and mir-140 micrornas coordinately regulate skeletal development. Proc Natl Acad Sci U S A 110, E (2013).
SUPPLEMENTARY INFORMATION
 doi:10.1038/nature12652 Supplementary Figure 1. PRDM16 interacts with endogenous EHMT1 in brown adipocytes. Immunoprecipitation of PRDM16 complex by flag antibody (M2) followed by Western blot analysis
EPIGENETIC RE-EXPRESSION OF HIF-2α SUPPRESSES SOFT TISSUE SARCOMA GROWTH
 EPIGENETIC RE-EXPRESSION OF HIF-2α SUPPRESSES SOFT TISSUE SARCOMA GROWTH Supplementary Figure 1. Supplementary Figure 1. Characterization of KP and KPH2 autochthonous UPS tumors. a) Genotyping of KPH2
Nature Neuroscience: doi: /nn Supplementary Figure 1
 Supplementary Figure 1 EGFR inhibition activates signaling pathways (a-b) EGFR inhibition activates signaling pathways (a) U251EGFR cells were treated with erlotinib (1µM) for the indicated times followed
Comparison of open chromatin regions between dentate granule cells and other tissues and neural cell types.
 Supplementary Figure 1 Comparison of open chromatin regions between dentate granule cells and other tissues and neural cell types. (a) Pearson correlation heatmap among open chromatin profiles of different
Supplementary Figure 1 IL-27 IL
 Tim-3 Supplementary Figure 1 Tc0 49.5 0.6 Tc1 63.5 0.84 Un 49.8 0.16 35.5 0.16 10 4 61.2 5.53 10 3 64.5 5.66 10 2 10 1 10 0 31 2.22 10 0 10 1 10 2 10 3 10 4 IL-10 28.2 1.69 IL-27 Supplementary Figure 1.
Supplementary Figure 1. Basal level EGFR across a panel of ESCC lines. Immunoblots demonstrate the expression of phosphorylated and total EGFR as
 Supplementary Figure 1. Basal level EGFR across a panel of ESCC lines. Immunoblots demonstrate the expression of phosphorylated and total EGFR as well as their downstream effectors across a panel of ESCC
Supplementary Figure 1.TRIM33 binds β-catenin in the nucleus. a & b, Co-IP of endogenous TRIM33 with β-catenin in HT-29 cells (a) and HEK 293T cells
 and HEK 293T cells") Supplementary Figure 1.TRIM33 binds β-catenin in the nucleus. a & b, Co-IP of endogenous TRIM33 with β-catenin in HT-29 cells (a) and HEK 293T cells (b). TRIM33 was immunoprecipitated, and the amount of
Supplementary Figure 1.TRIM33 binds β-catenin in the nucleus. a & b, Co-IP of endogenous TRIM33 with β-catenin in HT-29 cells (a) and HEK 293T cells (b). TRIM33 was immunoprecipitated, and the amount of
Supplementary Information Titles Journal: Nature Medicine
 Supplementary Information Titles Journal: Nature Medicine Article Title: Corresponding Author: Supplementary Item & Number Supplementary Fig.1 Fig.2 Fig.3 Fig.4 Fig.5 Fig.6 Fig.7 Fig.8 Fig.9 Fig. Fig.11
Supplementary Figure 1: si-craf but not si-braf sensitizes tumor cells to radiation.
 Supplementary Figure 1: si-craf but not si-braf sensitizes tumor cells to radiation. (a) Embryonic fibroblasts isolated from wildtype (WT), BRAF -/-, or CRAF -/- mice were irradiated (6 Gy) and DNA damage
Supplementary Figure 1. A. Bar graph representing the expression levels of the 19 indicated genes in the microarrays analyses comparing human lung
 Supplementary Figure 1. A. Bar graph representing the expression levels of the 19 indicated genes in the microarrays analyses comparing human lung immortalized broncho-epithelial cells (AALE cells) expressing
Nature Immunology: doi: /ni Supplementary Figure 1. Huwe1 has high expression in HSCs and is necessary for quiescence.
 Supplementary Figure 1 Huwe1 has high expression in HSCs and is necessary for quiescence. (a) Heat map visualizing expression of genes with a known function in ubiquitin-mediated proteolysis (KEGG: Ubiquitin
Supplementary. presence of the. (c) mrna expression. Error. in naive or
 mrna expression. Error. in naive or") Figure 1. (a) Naive CD4 + T cells were activated in the presence of the indicated cytokines for 3 days. Enpp2 mrna expression was measured by qrt-pcrhr, infected with (b, c) Naive CD4 + T cells were activated
Figure 1. (a) Naive CD4 + T cells were activated in the presence of the indicated cytokines for 3 days. Enpp2 mrna expression was measured by qrt-pcrhr, infected with (b, c) Naive CD4 + T cells were activated
(a) Schematic diagram of the FS mutation of UVRAG in exon 8 containing the highly instable
 Schematic diagram of the FS mutation of UVRAG in exon 8 containing the highly instable") Supplementary Figure 1. Frameshift (FS) mutation in UVRAG. (a) Schematic diagram of the FS mutation of UVRAG in exon 8 containing the highly instable A 10 DNA repeat, generating a premature stop codon
Supplementary Figure 1. Frameshift (FS) mutation in UVRAG. (a) Schematic diagram of the FS mutation of UVRAG in exon 8 containing the highly instable A 10 DNA repeat, generating a premature stop codon
Supplementary information. MARCH8 inhibits HIV-1 infection by reducing virion incorporation of envelope glycoproteins
 Supplementary information inhibits HIV-1 infection by reducing virion incorporation of envelope glycoproteins Takuya Tada, Yanzhao Zhang, Takayoshi Koyama, Minoru Tobiume, Yasuko Tsunetsugu-Yokota, Shoji
SUPPLEMENTARY FIGURES AND TABLE
 SUPPLEMENTARY FIGURES AND TABLE Supplementary Figure S1: Characterization of IRE1α mutants. A. U87-LUC cells were transduced with the lentiviral vector containing the GFP sequence (U87-LUC Tet-ON GFP).
Supplementary Figure 1: STAT3 suppresses Kras-induced lung tumorigenesis
 Supplementary Figure 1: STAT3 suppresses Kras-induced lung tumorigenesis (a) Immunohistochemical (IHC) analysis of tyrosine 705 phosphorylation status of STAT3 (P- STAT3) in tumors and stroma (all-time
Supplementary Figure 1. Repression of hepcidin expression in the liver of mice treated with
 Supplementary Figure 1. Repression of hepcidin expression in the liver of mice treated with DMN Immunohistochemistry for hepcidin and H&E staining (left). qrt-pcr assays for hepcidin in the liver (right).
SUPPLEMENTARY FIGURES
 SUPPLEMENTARY FIGURES 1 Supplementary Figure 1, Adult hippocampal QNPs and TAPs uniformly express REST a-b) Confocal images of adult hippocampal mouse sections showing GFAP (green), Sox2 (red), and REST
7SK ChIRP-seq is specifically RNA dependent and conserved between mice and humans.
 Supplementary Figure 1 7SK ChIRP-seq is specifically RNA dependent and conserved between mice and humans. Regions targeted by the Even and Odd ChIRP probes mapped to a secondary structure model 56 of the
Neocortex Zbtb20 / NFIA / Sox9
 Neocortex / NFIA / Sox9 Supplementary Figure 1. Expression of, NFIA, and Sox9 in the mouse neocortex at. The lower panels are higher magnification views of the oxed area. Arrowheads indicate triple-positive
SUPPLEMENTARY INFORMATION
 doi:10.1038/nature12215 Supplementary Figure 1. The effects of full and dissociated GR agonists in supporting BFU-E self-renewal divisions. BFU-Es were cultured in self-renewal medium with indicated GR
a) List of KMTs targeted in the shrna screen. The official symbol, KMT designation,
 List of KMTs targeted in the shrna screen. The official symbol, KMT designation,") Supplementary Information Supplementary Figures Supplementary Figure 1. a) List of KMTs targeted in the shrna screen. The official symbol, KMT designation, gene ID and specifities are provided. Those highlighted
Supplementary Information Supplementary Figures Supplementary Figure 1. a) List of KMTs targeted in the shrna screen. The official symbol, KMT designation, gene ID and specifities are provided. Those highlighted
Supplementary Materials for
 www.sciencesignaling.org/cgi/content/full/8/375/ra41/dc1 Supplementary Materials for Actin cytoskeletal remodeling with protrusion formation is essential for heart regeneration in Hippo-deficient mice
Supplementary Figure 1. Expression of phospho-sik3 in normal and osteoarthritic articular cartilage in the knee. (a) Semiserial histological sections
 Semiserial histological sections") Supplementary Figure 1. Expression of phospho-sik3 in normal and osteoarthritic articular cartilage in the knee. (a) Semiserial histological sections of normal cartilage were stained with safranin O-fast
Supplementary Figure 1. Expression of phospho-sik3 in normal and osteoarthritic articular cartilage in the knee. (a) Semiserial histological sections of normal cartilage were stained with safranin O-fast
Supplementary Figure 1 IMQ-Induced Mouse Model of Psoriasis. IMQ cream was
 Supplementary Figure 1 IMQ-Induced Mouse Model of Psoriasis. IMQ cream was painted on the shaved back skin of CBL/J and BALB/c mice for consecutive days. (a, b) Phenotypic presentation of mouse back skin
Pharmacologic inhibition of histone demethylation as a therapy for pediatric brainstem glioma
 Supplementary information for: Pharmacologic inhibition of histone demethylation as a therapy for pediatric brainstem glioma Rintaro Hashizume 1, Noemi Andor 2, Yuichiro Ihara 2, Robin Lerner 2, Haiyun
Nature Structural & Molecular Biology: doi: /nsmb Supplementary Figure 1
 Supplementary Figure 1 Effect of HSP90 inhibition on expression of endogenous retroviruses. (a) Inducible shrna-mediated Hsp90 silencing in mouse ESCs. Immunoblots of total cell extract expressing the
SUPPLEMENTARY INFORMATION
 SUPPLEMENTARY INFORMATION Supplementary Figure 1. Generation of a conditional allele of the Kindlin-2 gene. (A) A restriction map of the relevant genomic region of Kindlin-2 (top), the targeting construct
Supplementary Figure 1. Deletion of Smad3 prevents B16F10 melanoma invasion and metastasis in a mouse s.c. tumor model.
 A B16F1 s.c. Lung LN Distant lymph nodes Colon B B16F1 s.c. Supplementary Figure 1. Deletion of Smad3 prevents B16F1 melanoma invasion and metastasis in a mouse s.c. tumor model. Highly invasive growth
Nature Medicine: doi: /nm.4324
 1 2 3 4 5 6 7 8 9 10 11 12 13 14 15 16 17 18 19 20 21 22 23 24 25 Supplementary Figure 1. Kinetics of SnCs development in surgically-induced OA and effect of GCV-induced SnC clearance on OA disease progression
Supplementary Figure S1: Defective heterochromatin repair in HGPS progeroid cells
 Supplementary Figure S1: Defective heterochromatin repair in HGPS progeroid cells Immunofluorescence staining of H3K9me3 and 53BP1 in PH and HGADFN003 (HG003) cells at 24 h after γ-irradiation. Scale bar,
SUPPLEMENTARY FIGURES
 SUPPLEMENTARY FIGURES Supplementary Figure S1: Fibroblast-induced elongation of cancer cells requires direct contact with living fibroblasts. A. Representative images of HT29-GFP cultured in the presence
Effects of UBL5 knockdown on cell cycle distribution and sister chromatid cohesion
 Supplementary Figure S1. Effects of UBL5 knockdown on cell cycle distribution and sister chromatid cohesion A. Representative examples of flow cytometry profiles of HeLa cells transfected with indicated
Sirt1 Hmg20b Gm (0.17) 24 (17.3) 877 (857)
 24 (17.3) 877 (857)") 3 (0.17) 24 (17.3) Sirt1 Hmg20 Gm4763 877 (857) c d Suppl. Figure 1. Screen validation for top candidate antagonists of Dot1L (a) Numer of genes with one (gray), two (cyan) or three (red) shrna scored
3 (0.17) 24 (17.3) Sirt1 Hmg20 Gm4763 877 (857) c d Suppl. Figure 1. Screen validation for top candidate antagonists of Dot1L (a) Numer of genes with one (gray), two (cyan) or three (red) shrna scored
Supplementary Figure 1. Supernatants electrophoresis from CD14+ and dendritic cells. Supernatants were resolved by SDS-PAGE and stained with
 Supplementary Figure 1. Supernatants electrophoresis from CD14+ and dendritic cells. Supernatants were resolved by SDS-PAGE and stained with Coomassie brilliant blue. One µg/ml recombinant human (rh) apo-e
Lecture 3: Skeletogenesis and diseases
 Jilin University School of Stomatology Skeletogenesis Lecture 3: Skeletogenesis and diseases Aug. 21, 2015 Yuji Mishina, Ph.D. mishina@umich.edu Bone Development Mouse embryo, E14.5 Mouse embryo, E18.0
SUPPLEMENTARY INFORMATION
 DOI: 10.1038/ncb2566 Figure S1 CDKL5 protein expression pattern and localization in mouse brain. (a) Multiple-tissue western blot from a postnatal day (P) 21 mouse probed with an antibody against CDKL5.
p.r623c p.p976l p.d2847fs p.t2671 p.d2847fs p.r2922w p.r2370h p.c1201y p.a868v p.s952* RING_C BP PHD Cbp HAT_KAT11
 ARID2 p.r623c KMT2D p.v650fs p.p976l p.r2922w p.l1212r p.d1400h DNA binding RFX DNA binding Zinc finger KMT2C p.a51s p.d372v p.c1103* p.d2847fs p.t2671 p.d2847fs p.r4586h PHD/ RING DHHC/ PHD PHD FYR N
Supplementary Figure 1. EC-specific Deletion of Snail1 Does Not Affect EC Apoptosis. (a,b) Cryo-sections of WT (a) and Snail1 LOF (b) embryos at
 Cryo-sections of WT (a) and Snail1 LOF (b) embryos at") Supplementary Figure 1. EC-specific Deletion of Snail1 Does Not Affect EC Apoptosis. (a,b) Cryo-sections of WT (a) and Snail1 LOF (b) embryos at E10.5 were double-stained for TUNEL (red) and PECAM-1 (green).
Supplementary Figure 1. EC-specific Deletion of Snail1 Does Not Affect EC Apoptosis. (a,b) Cryo-sections of WT (a) and Snail1 LOF (b) embryos at E10.5 were double-stained for TUNEL (red) and PECAM-1 (green).
Nature Structural and Molecular Biology: doi: /nsmb Supplementary Figure 1
 Supplementary Figure 1 Mutational analysis of the SA2-Scc1 interaction in vitro and in human cells. (a) Autoradiograph (top) and Coomassie stained gel (bottom) of 35 S-labeled Myc-SA2 proteins (input)
Supplemental Information
 Supplemental Information Tobacco-specific Carcinogen Induces DNA Methyltransferases 1 Accumulation through AKT/GSK3β/βTrCP/hnRNP-U in Mice and Lung Cancer patients Ruo-Kai Lin, 1 Yi-Shuan Hsieh, 2 Pinpin
Not IN Our Genes - A Different Kind of Inheritance.! Christopher Phiel, Ph.D. University of Colorado Denver Mini-STEM School February 4, 2014
 Not IN Our Genes - A Different Kind of Inheritance! Christopher Phiel, Ph.D. University of Colorado Denver Mini-STEM School February 4, 2014 Epigenetics in Mainstream Media Epigenetics *Current definition:
Supplementary methods:
 Supplementary methods: Primers sequences used in real-time PCR analyses: β-actin F: GACCTCTATGCCAACACAGT β-actin [11] R: AGTACTTGCGCTCAGGAGGA MMP13 F: TTCTGGTCTTCTGGCACACGCTTT MMP13 R: CCAAGCTCATGGGCAGCAACAATA
underlying metastasis and recurrence in HNSCC, we analyzed two groups of patients. The
 Supplementary Figures Figure S1. Patient cohorts and study design. To define and interrogate the genetic alterations underlying metastasis and recurrence in HNSCC, we analyzed two groups of patients. The
Postn MCM Smad2 fl/fl Postn MCM Smad3 fl/fl Postn MCM Smad2/3 fl/fl. Postn MCM. Tgfbr1/2 fl/fl TAC
 A Smad2 fl/fl Smad3 fl/fl Smad2/3 fl/fl Tgfbr1/2 fl/fl 1. mm B Tcf21 MCM Tcf21 MCM Smad3 fl/fl Tcf21 MCM Smad2/3 fl/fl Tcf21 MCM Tgfbr1/2 fl/fl αmhc MCM C 1. mm 1. mm D Smad2 fl/fl Smad3 fl/fl Smad2/3
Supplementary Figure 1. Characterization of NMuMG-ErbB2 and NIC breast cancer cells expressing shrnas targeting LPP. NMuMG-ErbB2 cells (a) and NIC
 and NIC") Supplementary Figure 1. Characterization of NMuMG-ErbB2 and NIC breast cancer cells expressing shrnas targeting LPP. NMuMG-ErbB2 cells (a) and NIC cells (b) were engineered to stably express either a LucA-shRNA
Supplementary Figure 1. Characterization of NMuMG-ErbB2 and NIC breast cancer cells expressing shrnas targeting LPP. NMuMG-ErbB2 cells (a) and NIC cells (b) were engineered to stably express either a LucA-shRNA
Figure S1. Reduction in glomerular mir-146a levels correlate with progression to higher albuminuria in diabetic patients.
 Supplementary Materials Supplementary Figures Figure S1. Reduction in glomerular mir-146a levels correlate with progression to higher albuminuria in diabetic patients. Figure S2. Expression level of podocyte
Supplementary Figure 1
 Supplementary Figure 1 Constitutive EGFR signaling does not activate canonical EGFR signals (a) U251EGFRInd cells with or without tetracycline exposure (24h, 1µg/ml) were treated with EGF for 15 minutes
Supplementary material. Supplementary Figure legends
 Supplementary material Supplementary Figure legends Supplementary Figure 1: Senescence-associated proliferation stop in response to oncogenic N-RAS expression Proliferation of NHEM cells without (ctrl.)
Supplemental Figure 1
 Supplemental Figure 1 1a 1c PD-1 MFI fold change 6 5 4 3 2 1 IL-1α IL-2 IL-4 IL-6 IL-1 IL-12 IL-13 IL-15 IL-17 IL-18 IL-21 IL-23 IFN-α Mut Human PD-1 promoter SBE-D 5 -GTCTG- -1.2kb SBE-P -CAGAC- -1.kb
fl/+ KRas;Atg5 fl/+ KRas;Atg5 fl/fl KRas;Atg5 fl/fl KRas;Atg5 Supplementary Figure 1. Gene set enrichment analyses. (a) (b)
 (b)") KRas;At KRas;At KRas;At KRas;At a b Supplementary Figure 1. Gene set enrichment analyses. (a) GO gene sets (MSigDB v3. c5) enriched in KRas;Atg5 fl/+ as compared to KRas;Atg5 fl/fl tumors using gene set
KRas;At KRas;At KRas;At KRas;At a b Supplementary Figure 1. Gene set enrichment analyses. (a) GO gene sets (MSigDB v3. c5) enriched in KRas;Atg5 fl/+ as compared to KRas;Atg5 fl/fl tumors using gene set
(a) Significant biological processes (upper panel) and disease biomarkers (lower panel)
 Significant biological processes (upper panel) and disease biomarkers (lower panel)") Supplementary Figure 1. Functional enrichment analyses of secretomic proteins. (a) Significant biological processes (upper panel) and disease biomarkers (lower panel) 2 involved by hrab37-mediated secretory
Supplementary Figure 1. Functional enrichment analyses of secretomic proteins. (a) Significant biological processes (upper panel) and disease biomarkers (lower panel) 2 involved by hrab37-mediated secretory
Supplemental Figure 1. Western blot analysis indicated that MIF was detected in the fractions of
 Supplemental Figure Legends Supplemental Figure 1. Western blot analysis indicated that was detected in the fractions of plasma membrane and cytosol but not in nuclear fraction isolated from Pkd1 null
A Hepatocyte Growth Factor Receptor (Met) Insulin Receptor hybrid governs hepatic glucose metabolism SUPPLEMENTARY FIGURES, LEGENDS AND METHODS
 Insulin Receptor hybrid governs hepatic glucose metabolism SUPPLEMENTARY FIGURES, LEGENDS AND METHODS") A Hepatocyte Growth Factor Receptor (Met) Insulin Receptor hybrid governs hepatic glucose metabolism Arlee Fafalios, Jihong Ma, Xinping Tan, John Stoops, Jianhua Luo, Marie C. DeFrances and Reza Zarnegar
A Hepatocyte Growth Factor Receptor (Met) Insulin Receptor hybrid governs hepatic glucose metabolism Arlee Fafalios, Jihong Ma, Xinping Tan, John Stoops, Jianhua Luo, Marie C. DeFrances and Reza Zarnegar
SUPPLEMENTARY INFORMATION
 DOI: 10.1038/ncb2988 Supplementary Figure 1 Kif7 L130P encodes a stable protein that does not localize to cilia tips. (a) Immunoblot with KIF7 antibody in cell lysates of wild-type, Kif7 L130P and Kif7
Supplementary Figure 1
 A B D Relative TAp73 mrna p73 Supplementary Figure 1 25 2 15 1 5 p63 _-tub. MDA-468 HCC1143 HCC38 SUM149 MDA-468 HCC1143 HCC38 SUM149 HCC-1937 MDA-MB-468 ΔNp63_ TAp73_ TAp73β E C Relative ΔNp63 mrna TAp73
Supplementary Fig. 1 eif6 +/- mice show a reduction in white adipose tissue, blood lipids and normal glycogen synthesis. The cohort of the original
 Supplementary Fig. 1 eif6 +/- mice show a reduction in white adipose tissue, blood lipids and normal glycogen synthesis. The cohort of the original phenotypic screening was n=40. For specific tests, the
p = formed with HCI-001 p = Relative # of blood vessels that formed with HCI-002 Control Bevacizumab + 17AAG Bevacizumab 17AAG
 A.. Relative # of ECs associated with HCI-001 1.4 1.2 1.0 0.8 0.6 0.4 0.2 0.0 ol b p < 0.001 Relative # of blood vessels that formed with HCI-001 1.4 1.2 1.0 0.8 0.6 0.4 0.2 0.0 l b p = 0.002 Control IHC:
Supplementary Materials for
 www.sciencesignaling.org/cgi/content/full/7/308/ra4/dc1 Supplementary Materials for Antipsychotics Activate mtorc1-dependent Translation to Enhance Neuronal Morphological Complexity Heather Bowling, Guoan
Supplemental Tables and Figures. The metalloproteinase-proteoglycans ADAMTS7 and ADAMTS12 provide an innate,
 Supplemental Tables and Figures The metalloproteinase-proteoglycans ADAMTS7 and ADAMTS12 provide an innate, tendon-specific protective mechanism against heterotopic ossification Timothy Mead et al Supplemental
Fig. S1. Weight of embryos during development. Embryos are collected at different time points (E12.5, E14.5, E16.5 and E18.5) from matings between
 from matings between") Fig. S1. Weight of embryos during development. Embryos are collected at different time points (E12.5, E14.5, E16.5 and E18.5) from matings between Myod +/ or Myod / females and Myod +/ ;Igf2 +/ males and
Fig. S1. Weight of embryos during development. Embryos are collected at different time points (E12.5, E14.5, E16.5 and E18.5) from matings between Myod +/ or Myod / females and Myod +/ ;Igf2 +/ males and
Supplementary Figure 1. Spatial distribution of LRP5 and β-catenin in intact cardiomyocytes. (a) and (b) Immunofluorescence staining of endogenous
 and (b) Immunofluorescence staining of endogenous") Supplementary Figure 1. Spatial distribution of LRP5 and β-catenin in intact cardiomyocytes. (a) and (b) Immunofluorescence staining of endogenous LRP5 in intact adult mouse ventricular myocytes (AMVMs)
Supplementary Figure 1. Spatial distribution of LRP5 and β-catenin in intact cardiomyocytes. (a) and (b) Immunofluorescence staining of endogenous LRP5 in intact adult mouse ventricular myocytes (AMVMs)
Soft Agar Assay. For each cell pool, 100,000 cells were resuspended in 0.35% (w/v)
") SUPPLEMENTARY MATERIAL AND METHODS Soft Agar Assay. For each cell pool, 100,000 cells were resuspended in 0.35% (w/v) top agar (LONZA, SeaKem LE Agarose cat.5004) and plated onto 0.5% (w/v) basal agar.
SUPPLEMENTARY MATERIAL AND METHODS Soft Agar Assay. For each cell pool, 100,000 cells were resuspended in 0.35% (w/v) top agar (LONZA, SeaKem LE Agarose cat.5004) and plated onto 0.5% (w/v) basal agar.
Title: Smooth muscle cell-specific Tgfbr1 deficiency promotes aortic aneurysm formation by stimulating multiple signaling events
 Title: Smooth muscle cell-specific Tgfbr1 deficiency promotes aortic aneurysm formation by stimulating multiple signaling events Pu Yang 1, 3, radley M. Schmit 1, Chunhua Fu 1, Kenneth DeSart 1, S. Paul
supplementary information
 DOI: 10.1038/ncb2153 Figure S1 Ectopic expression of HAUSP up-regulates REST protein. (a) Immunoblotting showed that ectopic expression of HAUSP increased REST protein levels in ENStemA NPCs. (b) Immunofluorescent
Lentiviral Delivery of Combinatorial mirna Expression Constructs Provides Efficient Target Gene Repression.
 Supplementary Figure 1 Lentiviral Delivery of Combinatorial mirna Expression Constructs Provides Efficient Target Gene Repression. a, Design for lentiviral combinatorial mirna expression and sensor constructs.
Supplementary Figures
 Supplementary Figures Supplementary Figure 1 Characterization of stable expression of GlucB and sshbira in the CT26 cell line (a) Live cell imaging of stable CT26 cells expressing green fluorescent protein
SUPPLEMENTARY INFORMATION
 DOI: 10.1038/ncb2607 Figure S1 Elf5 loss promotes EMT in mammary epithelium while Elf5 overexpression inhibits TGFβ induced EMT. (a, c) Different confocal slices through the Z stack image. (b, d) 3D rendering
Cell isolation. Spleen and lymph nodes (axillary, inguinal) were removed from mice
 were removed from mice") Supplementary Methods: Cell isolation. Spleen and lymph nodes (axillary, inguinal) were removed from mice and gently meshed in DMEM containing 10% FBS to prepare for single cell suspensions. CD4 + CD25
Supplementary Methods: Cell isolation. Spleen and lymph nodes (axillary, inguinal) were removed from mice and gently meshed in DMEM containing 10% FBS to prepare for single cell suspensions. CD4 + CD25
Supplementary Figure S1 Expression of mir-181b in EOC (A) Kaplan-Meier
 Kaplan-Meier") Supplementary Figure S1 Expression of mir-181b in EOC (A) Kaplan-Meier curves for progression-free survival (PFS) and overall survival (OS) in a cohort of patients (N=52) with stage III primary ovarian
Supplementary Figure S1 Expression of mir-181b in EOC (A) Kaplan-Meier curves for progression-free survival (PFS) and overall survival (OS) in a cohort of patients (N=52) with stage III primary ovarian
Figure S1A. Blood glucose levels in mice after glucose injection
 ## Figure S1A. Blood glucose levels in mice after glucose injection Blood glucose (mm/l) 25 2 15 1 5 # 15 3 6 3+3 Time after glucose injection (min) # Figure S1B. α-kg levels in mouse livers after glucose
SUPPLEMENTARY INFORMATION
 DOI: 10.1038/ncb2535 Figure S1 SOX10 is expressed in human giant congenital nevi and its expression in human melanoma samples suggests that SOX10 functions in a MITF-independent manner. a, b, Representative
Supplementary Figure 1. Normal T lymphocyte populations in Dapk -/- mice. (a) Normal thymic development in Dapk -/- mice. Thymocytes from WT and Dapk
 Normal thymic development in Dapk -/- mice. Thymocytes from WT and Dapk") Supplementary Figure 1. Normal T lymphocyte populations in Dapk -/- mice. (a) Normal thymic development in Dapk -/- mice. Thymocytes from WT and Dapk -/- mice were stained for expression of CD4 and CD8.
Supplementary Figure 1. Normal T lymphocyte populations in Dapk -/- mice. (a) Normal thymic development in Dapk -/- mice. Thymocytes from WT and Dapk -/- mice were stained for expression of CD4 and CD8.
Nature Structural & Molecular Biology: doi: /nsmb Supplementary Figure 1. Differential expression of mirnas from the pri-mir-17-92a locus.
 Supplementary Figure 1 Differential expression of mirnas from the pri-mir-17-92a locus. (a) The mir-17-92a expression unit in the third intron of the host mir-17hg transcript. (b,c) Impact of knockdown
hexahistidine tagged GRP78 devoid of the KDEL motif (GRP78-His) on SDS-PAGE. This
 on SDS-PAGE. This") SUPPLEMENTAL FIGURE LEGEND Fig. S1. Generation and characterization of. (A) Coomassie staining of soluble hexahistidine tagged GRP78 devoid of the KDEL motif (GRP78-His) on SDS-PAGE. This protein was expressed
SUPPLEMENTAL FIGURE LEGEND Fig. S1. Generation and characterization of. (A) Coomassie staining of soluble hexahistidine tagged GRP78 devoid of the KDEL motif (GRP78-His) on SDS-PAGE. This protein was expressed
Type of file: PDF Size of file: 0 KB Title of file for HTML: Supplementary Information Description: Supplementary Figures
 Type of file: PDF Size of file: 0 KB Title of file for HTML: Supplementary Information Description: Supplementary Figures Supplementary Figure 1 mir-128-3p is highly expressed in chemoresistant, metastatic
Figure S1, Beyer et al.
 Figure S1, eyer et al. Pax7 Myogenin si sitrl Hoechst T = 72h 14 1.8.6.4.2 12 1 8 6 4 2 24h 48h 96h diff. sitrl siset1 212 72h diff. b1 td r t Se km MyH Vinculin Myogenin β-ctin Vinculin MW b1 ka td r
Supplemental Figure 1. Intracranial transduction of a modified ptomo lentiviral vector in the mouse
 Supplemental figure legends Supplemental Figure 1. Intracranial transduction of a modified ptomo lentiviral vector in the mouse hippocampus targets GFAP-positive but not NeuN-positive cells. (A) Stereotaxic
Supplementary Figure 1. Efficiency of Mll4 deletion and its effect on T cell populations in the periphery. Nature Immunology: doi: /ni.
 Supplementary Figure 1 Efficiency of Mll4 deletion and its effect on T cell populations in the periphery. Expression of Mll4 floxed alleles (16-19) in naive CD4 + T cells isolated from lymph nodes and
HEK293FT cells were transiently transfected with reporters, N3-ICD construct and
 Supplementary Information Luciferase reporter assay HEK293FT cells were transiently transfected with reporters, N3-ICD construct and increased amounts of wild type or kinase inactive EGFR. Transfections
SUPPLEMENTARY INFORMATION
 DOI: 10.1038/ncb3311 A B TSC2 -/- MEFs C Rapa Hours WCL 0 6 12 24 36 pakt.s473 AKT ps6k S6K CM IGF-1 Recipient WCL - + - + - + pigf-1r IGF-1R pakt ps6 AKT D 1 st SILAC 2 nd SILAC E GAPDH FGF21 ALKPGVIQILGVK
SUPPLEMENTARY INFORMATION
 -. -. SUPPLEMENTARY INFORMATION DOI: 1.1/ncb86 a WAT-1 WAT- BAT-1 BAT- sk-muscle-1 sk-muscle- mir-133b mir-133a mir-6 mir-378 mir-1 mir-85 mir-378 mir-6a mir-18 mir-133a mir- mir- mir-341 mir-196a mir-17
Supplementary Figure 1: Expression of NFAT proteins in Nfat2-deleted B cells (a+b) Protein expression of NFAT2 (a) and NFAT1 (b) in isolated splenic
 Protein expression of NFAT2 (a) and NFAT1 (b) in isolated splenic") Supplementary Figure 1: Expression of NFAT proteins in Nfat2-deleted B cells (a+b) Protein expression of NFAT2 (a) and NFAT1 (b) in isolated splenic B cells from WT Nfat2 +/+, TCL1 Nfat2 +/+ and TCL1 Nfat2
Supplementary Figure 1: Expression of NFAT proteins in Nfat2-deleted B cells (a+b) Protein expression of NFAT2 (a) and NFAT1 (b) in isolated splenic B cells from WT Nfat2 +/+, TCL1 Nfat2 +/+ and TCL1 Nfat2
(A) SW480, DLD1, RKO and HCT116 cells were treated with DMSO or XAV939 (5 µm)
 SW480, DLD1, RKO and HCT116 cells were treated with DMSO or XAV939 (5 µm)") Supplementary Figure Legends Figure S1. Tankyrase inhibition suppresses cell proliferation in an axin/β-catenin independent manner. (A) SW480, DLD1, RKO and HCT116 cells were treated with DMSO or XAV939
Supplementary Figure Legends Figure S1. Tankyrase inhibition suppresses cell proliferation in an axin/β-catenin independent manner. (A) SW480, DLD1, RKO and HCT116 cells were treated with DMSO or XAV939
Supplementary Figure S1. Monolayer differentiation of mouse ESCs into telencephalic neural precursors. (a) Schematic representation of the protocols
 Schematic representation of the protocols") Supplementary Figure S1. Monolayer differentiation of mouse ESCs into telencephalic neural precursors. (a) Schematic representation of the protocols used to differentiate mouse ESCs. (b) Representative
Supplementary Figure S1. Monolayer differentiation of mouse ESCs into telencephalic neural precursors. (a) Schematic representation of the protocols used to differentiate mouse ESCs. (b) Representative
SUPPLEMENTARY FIGURE LEGENDS
 SUPPLEMENTARY FIGURE LEGENDS Supplementary Figure 1. Hippocampal sections from new-born Pten+/+ and PtenFV/FV pups were stained with haematoxylin and eosin (H&E) and were imaged at (a) low and (b) high
Supplementary Fig. 1. GPRC5A post-transcriptionally down-regulates EGFR expression. (a) Plot of the changes in steady state mrna levels versus
 Plot of the changes in steady state mrna levels versus") Supplementary Fig. 1. GPRC5A post-transcriptionally down-regulates EGFR expression. (a) Plot of the changes in steady state mrna levels versus changes in corresponding proteins between wild type and Gprc5a-/-
Supplementary Fig. 1. GPRC5A post-transcriptionally down-regulates EGFR expression. (a) Plot of the changes in steady state mrna levels versus changes in corresponding proteins between wild type and Gprc5a-/-
Zhu et al, page 1. Supplementary Figures
 Zhu et al, page 1 Supplementary Figures Supplementary Figure 1: Visual behavior and avoidance behavioral response in EPM trials. (a) Measures of visual behavior that performed the light avoidance behavior
Supplementary Figure 1. Blood glucose and insulin levels in mice during 4-day infusion.
 Supplementary Figure 1. Blood glucose and insulin levels in mice during 4-day infusion. (A-B) WT and HT mice infused with saline or glucose had overlapping achieved blood glucose and insulin levels, necessitating
Supplementary Figures
 Supplementary Figures Supplementary Figure 1 DOT1L regulates the expression of epithelial and mesenchymal markers. (a) The expression levels and cellular localizations of EMT markers were confirmed by
Supplementary Table S1. Tumor samples used for analysis Tumor size (cm) BNG (grade) ERα PR. pn-
 BNG (grade) ERα PR. pn-") Supplementary Table S1. Tumor samples used for analysis Sample# Age Tumor size (cm) pn- Stage Stage BNG (grade) ERα PR HER2 (FISH) Triple negative T1 46 3 N1a III 2 Pos Neg N T2 58 1 N(i-) I 3 Pos Neg
Supplementary Table S1. Tumor samples used for analysis Sample# Age Tumor size (cm) pn- Stage Stage BNG (grade) ERα PR HER2 (FISH) Triple negative T1 46 3 N1a III 2 Pos Neg N T2 58 1 N(i-) I 3 Pos Neg
Supplementary Figure S1. Generation of LSL-EZH2 conditional transgenic mice.
 Downstream Col1A locus S P P P EP Genotyping with P1, P2 frt PGKneopA + frt hygro-pa Targeting vector Genotyping with P3, P4 P1 pcag-flpe P2 P3 P4 frt SApA CAG LSL PGKATG frt hygro-pa C. D. E. ormal KRAS
Supplementary Figure S1. Gene expression analysis of epidermal marker genes and TP63.
 Supplementary Figure Legends Supplementary Figure S1. Gene expression analysis of epidermal marker genes and TP63. A. Screenshot of the UCSC genome browser from normalized RNAPII and RNA-seq ChIP-seq data
SUPPLEMENTARY INFORMATION
 DOI:.38/ncb3399 a b c d FSP DAPI 5mm mm 5mm 5mm e Correspond to melanoma in-situ Figure a DCT FSP- f MITF mm mm MlanaA melanoma in-situ DCT 5mm FSP- mm mm mm mm mm g melanoma in-situ MITF MlanaA mm mm
Supplemental Table S1
 Supplemental Table S. Tumorigenicity and metastatic potential of 44SQ cell subpopulations a Tumorigenicity b Average tumor volume (mm ) c Lung metastasis d CD high /4 8. 8/ CD low /4 6./ a Mice were injected
Nature Immunology: doi: /ni Supplementary Figure 1 33,312. Aire rep 1. Aire rep 2 # 44,325 # 44,055. Aire rep 1. Aire rep 2.
 a 33,312 b rep 1 rep 1 # 44,325 rep 2 # 44,055 [0-84] rep 2 [0-84] 1810043G02Rik Pfkl Dnmt3l Icosl rep 1 [0-165] rep 2 [0-165] Rps14 Cd74 Mir5107 Tcof1 rep 1 [0-69] rep 2 [0-68] Id3 E2f2 Asap3 rep 1 [0-141]
TGF-β Signaling Regulates Neuronal C1q Expression and Developmental Synaptic Refinement
 Supplementary Information Title: TGF-β Signaling Regulates Neuronal C1q Expression and Developmental Synaptic Refinement Authors: Allison R. Bialas and Beth Stevens Supplemental Figure 1. In vitro characterization
SUPPLEMENTARY LEGENDS...
 TABLE OF CONTENTS SUPPLEMENTARY LEGENDS... 2 11 MOVIE S1... 2 FIGURE S1 LEGEND... 3 FIGURE S2 LEGEND... 4 FIGURE S3 LEGEND... 5 FIGURE S4 LEGEND... 6 FIGURE S5 LEGEND... 7 FIGURE S6 LEGEND... 8 FIGURE
SUPPLEMENTARY FIGURES
 SUPPLEMENTARY FIGURES Figure S1. Clinical significance of ZNF322A overexpression in Caucasian lung cancer patients. (A) Representative immunohistochemistry images of ZNF322A protein expression in tissue
Infect MCF-7 cells carrying dcas9-vp64 + psm2-p65-hsf1 with SAM library or vector. Introduce AKT reporter
 Infect MCF-7 cells carrying dcas9-vp64 + psm2-p65-hsf1 with SM library or vector Introduce reporter Grow cells in presence of puromycin for 5 days Vector control SM library fewer surviving cells More surviving