Social stress induces neurovascular pathology promoting depression
|
|
|
- Brett Caldwell
- 6 years ago
- Views:
Transcription
1 SUPPLEMENTARY INFORMATION Articles In the format provided by the authors and unedited. Social stress induces neurovascular pathology promoting depression Caroline Menard 1,8, Madeline L. Pfau 1, Georgia E. Hodes 1, Veronika Kana 2, Victoria X. Wang 3, Sylvain Bouchard 1, Aki Takahashi 1,4, Meghan E. Flanigan 1, Hossein Aleyasin 1, Katherine B. LeClair 1, William G. Janssen 1, Benoit Labonté 1, Eric M. Parise 1, Zachary S. Lorsch 1, Sam A. Golden 1, Mitra Heshmati 1, Carol Tamminga 5, Gustavo Turecki 6, Matthew Campbell 7, Zahi A. Fayad 3, Cheuk Ying Tang 3, Miriam Merad 2 and Scott J. Russo 1 * 1 Fishberg Department of Neuroscience and the Friedman Brain Institute, Icahn School of Medicine at Mount Sinai, New York, NY, USA. 2 Department of Oncological Sciences, Tisch Cancer Institute and Immunology Institute, Icahn School of Medicine at Mount Sinai, New York, NY, USA. 3 Department of Radiology, Translational and Molecular Imaging Institute at Mount Sinai, New York, NY, USA. 4 University of Tsukuba, Tsukuba, Japan. 5 Department of Psychiatry, University of Texas Southwestern Medical Center, Dallas, TX, USA. 6 Douglas Mental Health University Institute and McGill University, Montreal, QC, Canada. 7 Smurfit Institute of Genetics, Trinity College Dublin, Dublin 2, Ireland. Present address: 8 Département de psychiatrie et neurosciences, Faculté de médecine and CERVO Brain Research Centre, Université Laval, Quebec City, QC, Canada. * scott.russo@mssm.edu Nature Neuroscience Nature America Inc., part of Springer Nature. All rights reserved.
2 Supplementary Figure 1 Behavioral phenotype of quantitative PCR (qpcr) experiments and Cldn5 expression in other brain regions or animal model of stress.
3 Stress-susceptible (SS) mice spent less time in the interaction zone (***p < ) (A) and more time in the corners (***p < ) (B) when the social target (aggressor, AGG) was present compared to unstressed control (CTRL) and resilient (RES). However no significant difference was observed when the social target was absent. C) Stressed mice traveled less distance than CTRL when the social target was either present (***p = ) or absent (***p = ) but no difference was observed between SS and RES groups. D) Heat maps of gene expression related to endothelial cells and tight junctions normalized to blood vessel marker pecam1. E) Normalization to pecam1 confirmed specific reduction of cldn5 expression in the nucleus accumbens (NAc) of SS mice (***p = ). Cldn5 mrna expression was reduced in the hippocampus (G) of both SS and RES mice after 10-day chronic social defeat stress (CSDS) while no change was measured in the prefrontal cortex (PFC) (F) or hypothalamus (H). Gapdh was used as housekeeping gene for hippocampus (HIPP), prefrontal cortex (PFC) and hypothalamus studies. I) Six days of chronic variable stress (CVS) did not modify cldn5 mrna expression however, after 28 days of CVS, cldn5 mrna level was significantly reduced in the NAc of male C57Bl/6 mice (J). Gapdh was used as housekeeping gene for CVS studies. Data represent mean ± SEM, number of animal (n) is indicated on graphs. Unpaired t-test for CUS-related qpcr experiments and oneway ANOVA for other graphs followed by Bonferroni s multiple comparison test, *p < 0.05; **p < 0.01; ***p <
4
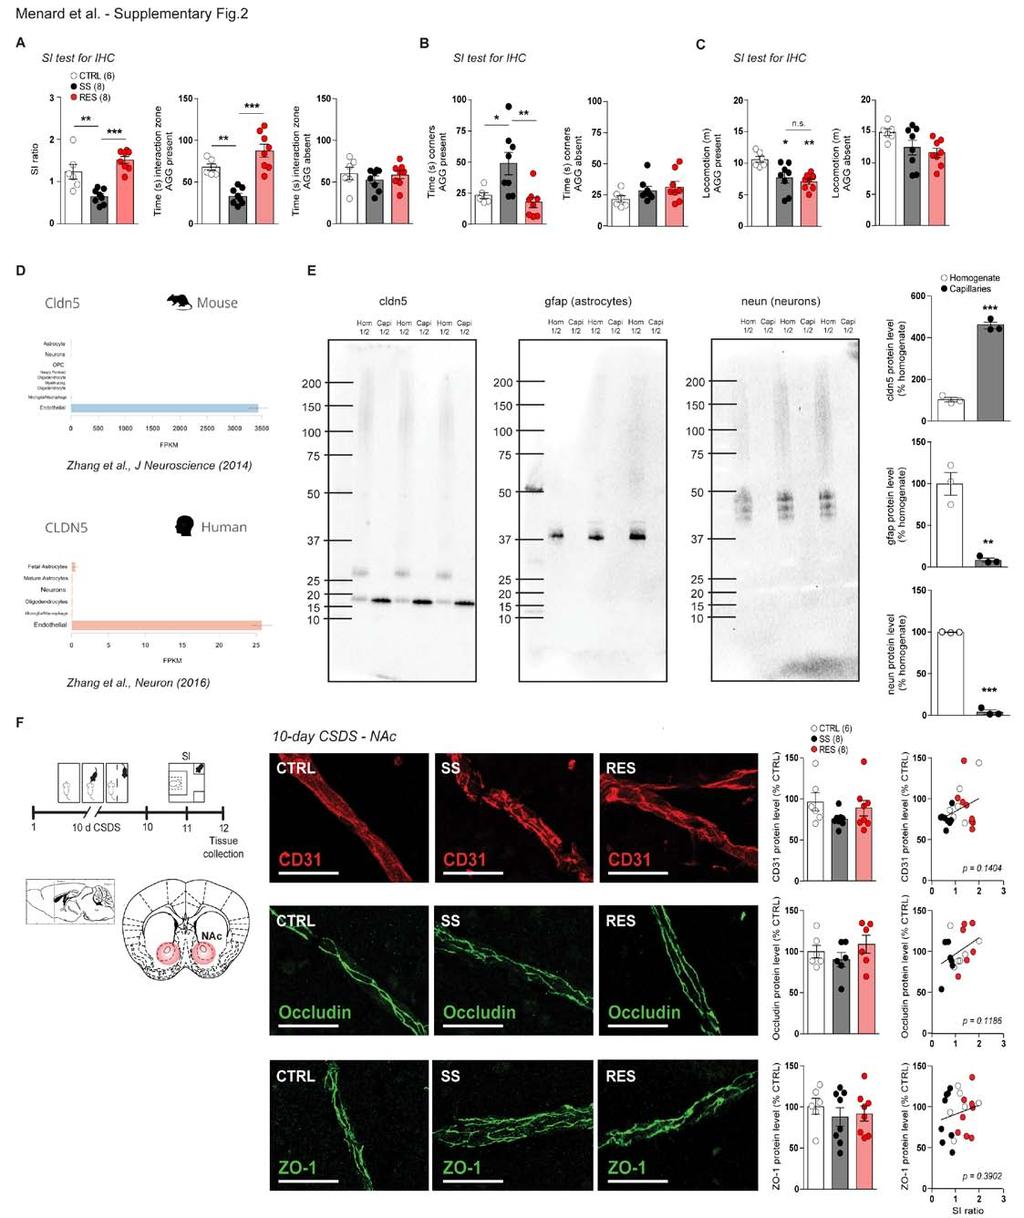
5 Supplementary Figure 2 Behavioral phenotype of immunohistochemistry (IHC) experiments and assessment of Cldn5 endothelial cell specificity and stress-induced loss. SS mice spent less time in the interaction zone (**p = ) (A) and more time in the corners (**p = ) (B) when the social target (AGG) was present compared to unstressed CTRL and RES mice. SS mice spent more time in the interaction zone when the social target was absent (*p = ) (A) but no significant difference was observed for time spent in corners. C) Stressed mice traveled less distance than CTRL when the social target was either present (**p = ) or absent (*p = ) but no difference was observed between SS and RES groups. D) Cldn5 mrna expression is selectively expressed in endothelial cells in the adult mouse and human brain according to RNA-sequencing transcriptome databases 29,30. E) Cldn5 protein level was enriched five-fold in half-brain capillary extraction when compared to whole cell homogenates (***p < ). Purity of the extraction was validated with astrocyte (glial fibrillary acidic protein, gfap) and neuronal (neun) markers. Representative blots in triplicate are shown. F) Following 10-day CSDS, no difference was observed in CD31, occluding or ZO-1 protein levels in the NAc of SS or RES mice. Data represent mean ± SEM, number of animals (n) is indicated on graphs. Unpaired t-test for Western Blot analyses, Pearson s correlation for tight junction protein level vs social interaction (SI) ratio and one-way ANOVA for other graphs followed by Bonferroni s multiple comparison test, *p < 0.05; **p < 0.01; ***p <
6
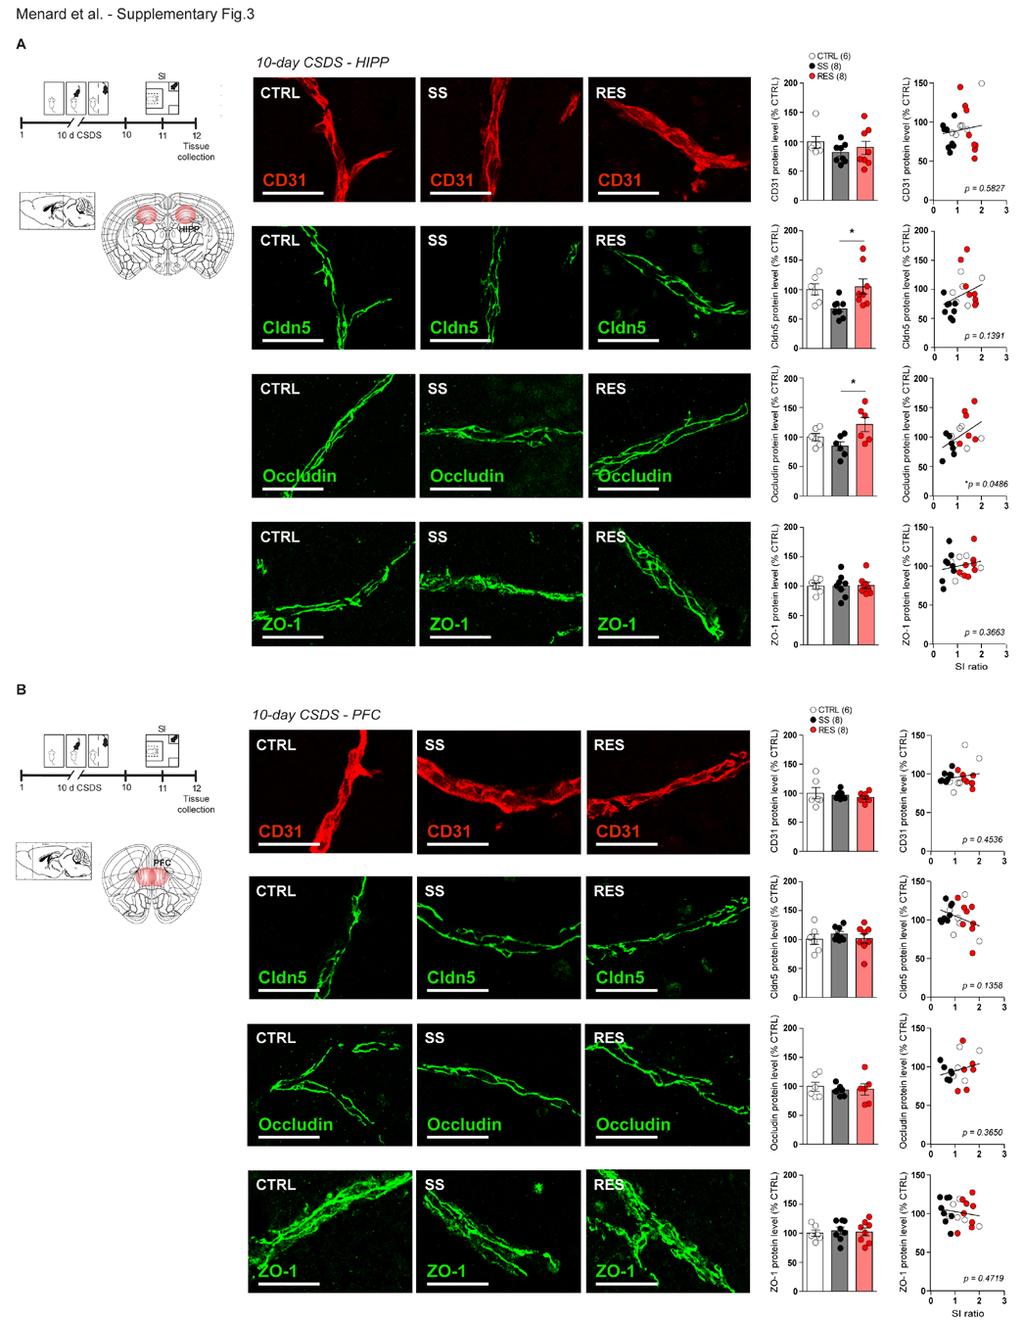
7 Supplementary Figure 3 Tight junction protein levels in the hippocampus (HIPP) and prefrontal cortex (PFC) following 10-d CSDS. A) Cldn5 (*p = ) and occludin (*p = ) protein levels were significantly higher in RES mice when compared to SS, but not unstressed control mice. Occludin protein level was positively correlated with SI ratio (*p = ). No difference was observed for ZO-1 or the endothelial cell marker CD31. B) 10-day CSDS had no effect on tight junction protein levels or CD31 in the PFC. Scale bar at 200 µm. Images corresponded to flattened 1-µm-thick z-stacks at 40x magnification. Data represent mean ± SEM, number of animals (n) is indicated on graphs. One-way ANOVA followed by Bonferroni s multiple comparison test and Pearson s correlation for tight junction protein level vs SI ratio, *p < 0.05.
8
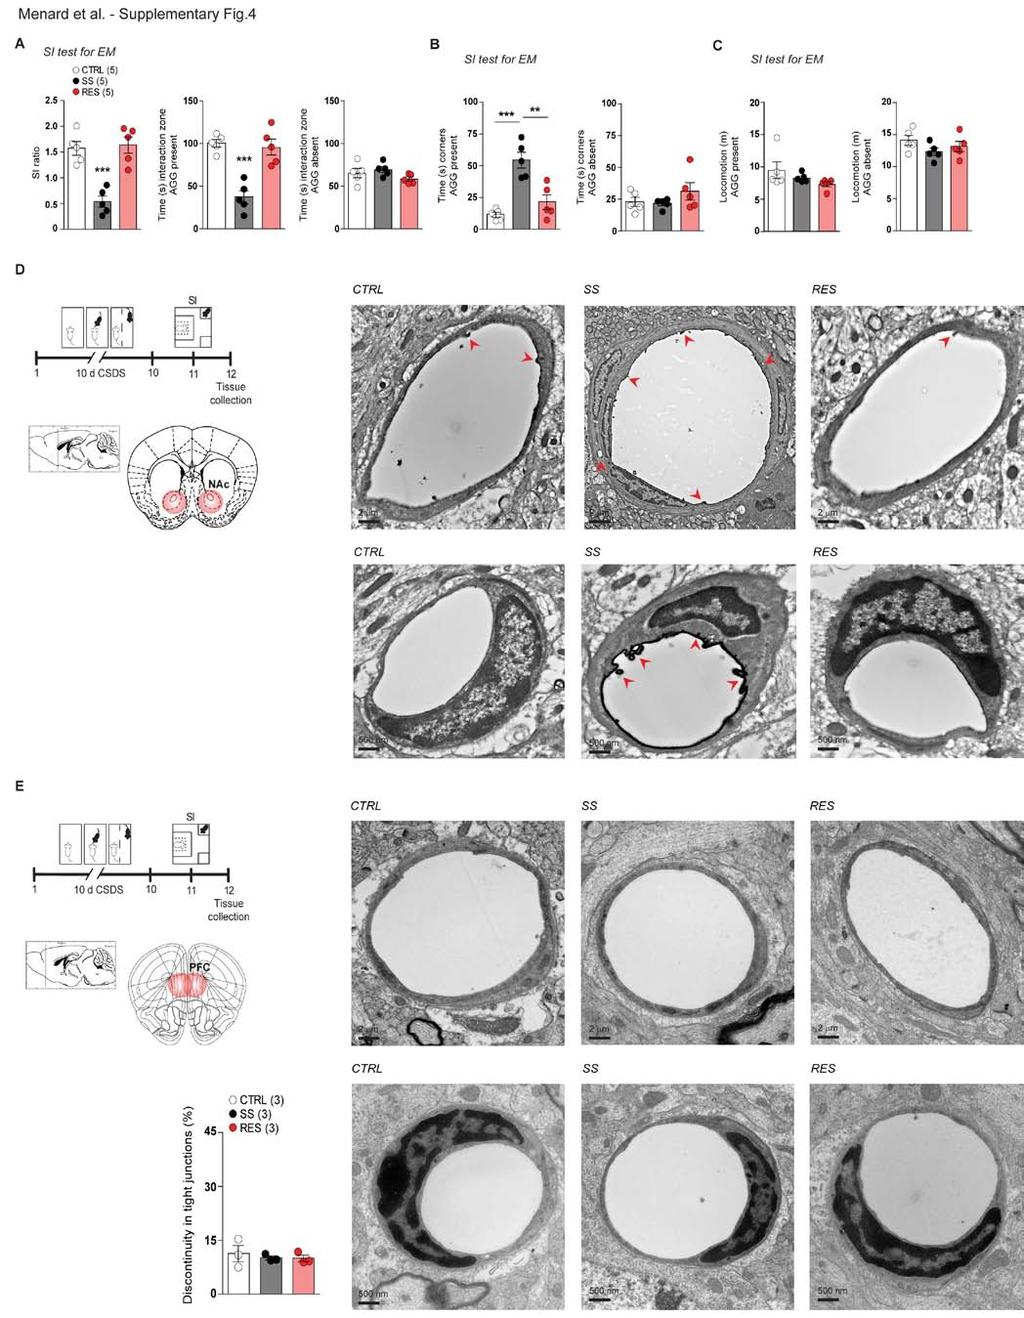
9 Supplementary Figure 4 Blood vessel and capillary morphology in the NAc and PFC of CTRL, SS and RES mice. A) Detailed behavioral phenotyping of the mice imaged with transmission electron microscopy 48 hours after the last defeat. SS mice SI ratio was lower than CTRL and RES mice (***p = ) as they spent less time in the interaction zone (***p < ) (A) and more time in the corners (***p = ) (B) when the social target (AGG) was present. C) No difference was observed between groups for distance traveled. D) Representative pictures of large blood vessels and capillaries in the NAc of CTRL, SS and RES mice. Mice were injected with horseradish peroxidase (HRP) that was allowed to circulate for 2 hours before 20-min perfusion and fixation. Scale bar is set at 2 µm or 500 nm. E) No significant difference was measured for tight junction discontinuity in the PFC of SS or RES mice when compared to CTRL mice. Scale bar is set at 2 µm or 500 nm, tight junctions/mouse for three mice/group. Data represent mean ± SEM, number of animals (n) is indicated on graphs. One-way ANOVA followed by Bonferroni s multiple comparison test, **p < 0.01, ***p <
10 Supplementary Figure 5 Behavioral phenotype of SS mice treated chronically with vehicle or the antidepressant imipramine and CLDN5 expression in MDD patients and cocaine users.
11 A) Timeline showing mice were exposed to 10-day CSDS then screened for behavioral phenotype 24 hours later. Vehicle-treated SS mice spent less time in the interaction zone (B) and more time in the corners (C) when the social target (AGG) was present when compared to the other groups, including imipramine-treated SS mice. No difference was observed when the social target was absent. D) Locomotion was similar between all groups despite the presence or absence of the social target. E) Acute treatment with the antidepressant imipramine is not sufficient to rescue cldn5 loss after 10-day CSDS. F) No significant difference was measured for GAPDH in NAc postmortem tissue from healthy controls (CTRL) or MDD patients with (MDD, AD+) or without (MDD, AD-) antidepressant treatment at the time of death. G) CLDN5 expression in the HIPP and PFC (normalized to GAPDH housekeeping gene) was not significantly different in MDD patients treated or untreated with antidepressants when compared to healthy controls. H) CLDN5 expression is unchanged in cocaine users when compared to healthy controls (normalized to GAPDH housekeeping gene). Data represent mean ± SEM, number of animals or subjects (n) is indicated on graphs. Unpaired t-test for acute treatment and cocaine users, one-way ANOVA for MDD cohorts and two-way ANOVA for other graphs followed by Bonferroni s multiple comparison test, *p < 0.05.
12
13 Supplementary Figure 6 Gene expression in NAc of AAV-shRNA-Cldn5-injected mice, supplementary SI behaviors and anxiety test results. A) No significant change was observed at mrna level in the NAc of AAV-shRNA versus AAV-shRNA-cldn5 for other claudins (cdn1, cldn3, cdn12), cytoskeletal regulators (rac1) or markers of endothelial cells (pecam1), pericytes (pdgfrβ), astrocytes (gfap, s100β) and microglia (iba1) when normalized to the housekeeping gene gapdh. B) CD31 protein level was similar in the NAc of AAV-shRNA-cldn5 and AAV-shRNA-injected mice. C) Stressed AAV-shRNA-injected mice spent less time in the interaction zone and more time in the corners when the social target (AGG) was present. No difference was observed between mice groups for time spent in the interaction zone or corners when the social target was absent or for overall locomotion. D) No significant difference was measured between groups for latency to eat in the novelty-suppressed feeding test (left) or home cage (right). Virus injection in the NAc had no effect on anxiety as measured with the elevated plus maze (E) and open field (F) tests. Data represent mean ± SEM, number of animals (n) is indicated on graphs. Unpaired t-test for virus validation and two-way ANOVA followed by Bonferroni s multiple comparison test for behavioral experiments, *p < 0.05, ***p <
14
15 Supplementary Figure 7 Experimental timeline for virally mediated HIPP injections and rescue experiment, virus validation and behaviors. Experimental timeline (A) and virus validation (qpcrs, **p = , Western Blots, ***p = ) (B) for AAV-shRNA and AAVshRNA-cldn5 injections in the HIPP. Full-length blots are included in Supplementary Fig. 12. Downregulation of cldn5 expression had no effect in the splash (C) and sucrose preference tests (D). However mice injected with AAV-shRNA-cldn5 spent more time immobile in the forced swim test (E) and stressed AAV-shRNA-cldn5 mice displayed social avoidance (F). Representative heat maps are shown on the right. G) Experimental timeline of the control cohort for rescue experiment. H) Removal of Dox from the water allowed recovery of cldn5 expression at both mrna (p = ) and protein (p = ) levels in the rescue cohort. Fulllength blots are included in Supplementary Fig. 12. I) Conversely, downregulation of cldn5 mrna (**p = ) and protein (*p = ) levels was confirmed in the cohort remaining on Dox. Full-length blots are included in Supplementary Fig. 12. G) Stressed AAV-shRNA-cldn5 mice that remained on dox treatment displayed depression-like behaviors in forced swim (**p = ) and sucrose preference (**p = ) tests before (J) and after 5-day rest as measured with sucrose preference (***p = ) and social interaction tests (**p = ) (K). Representative heat maps are shown on the left. Data represent mean ± SEM, number of animals (n) is indicated on graphs. Two-way ANOVA followed by Bonferroni s multiple comparison test, *p < 0.05, **p < 0.01, ***p <
16 Supplementary Figure 8 Gd-DTPA and cadaverine Alexa Fluor-555 experiments. A cohort of mice was first behaviorally characterized for MRI studies. SS mice spent less time in the interaction zone (A) and more time in the corners (B) when the social target (AGG) was present when compared to CTRL and RES mice. No difference was
17 observed when the social target was absent. Locomotion was similar in SS and RES mice (C). D) Higher Gd-DTPA signal was detected in different brain regions, including the NAc, in SS mice and negatively correlated with SI ratio. E) Gd-DTPA level was higher in the hippocampus of SS mice versus RES mice and significantly correlated with social avoidance. F) Conversely, no difference was measured between groups for the PFC. A second cohort of mice was behaviorally characterized to assess BBB permeability to cadaverine Alexa Fluor-555. After 10-day CSDS, SS mice spent less time in the interaction zone (G) and more time in the corners (H) versus CTRL and RES groups when the social target was present (AGG). No difference was observed when the social target was absent. I) Stressed mice traveled less distance compared to CTRL when the social target was either present or absent but no significant difference was measured between SS and RES groups. Cadaverine level is significantly correlated with social avoidance in the nucleus accumbens (NAc) (J) and hippocampus (K). L) No difference was measured between groups for the PFC. Data are presented as mean ± SEM, number of animals (n) is indicated on graphs. Correlations were evaluated with Pearson s correlation coefficient, one-way ANOVA followed by Bonferroni s multiple comparison test for other graphs, *p < 0.05; **p < 0.01; ***p <
18
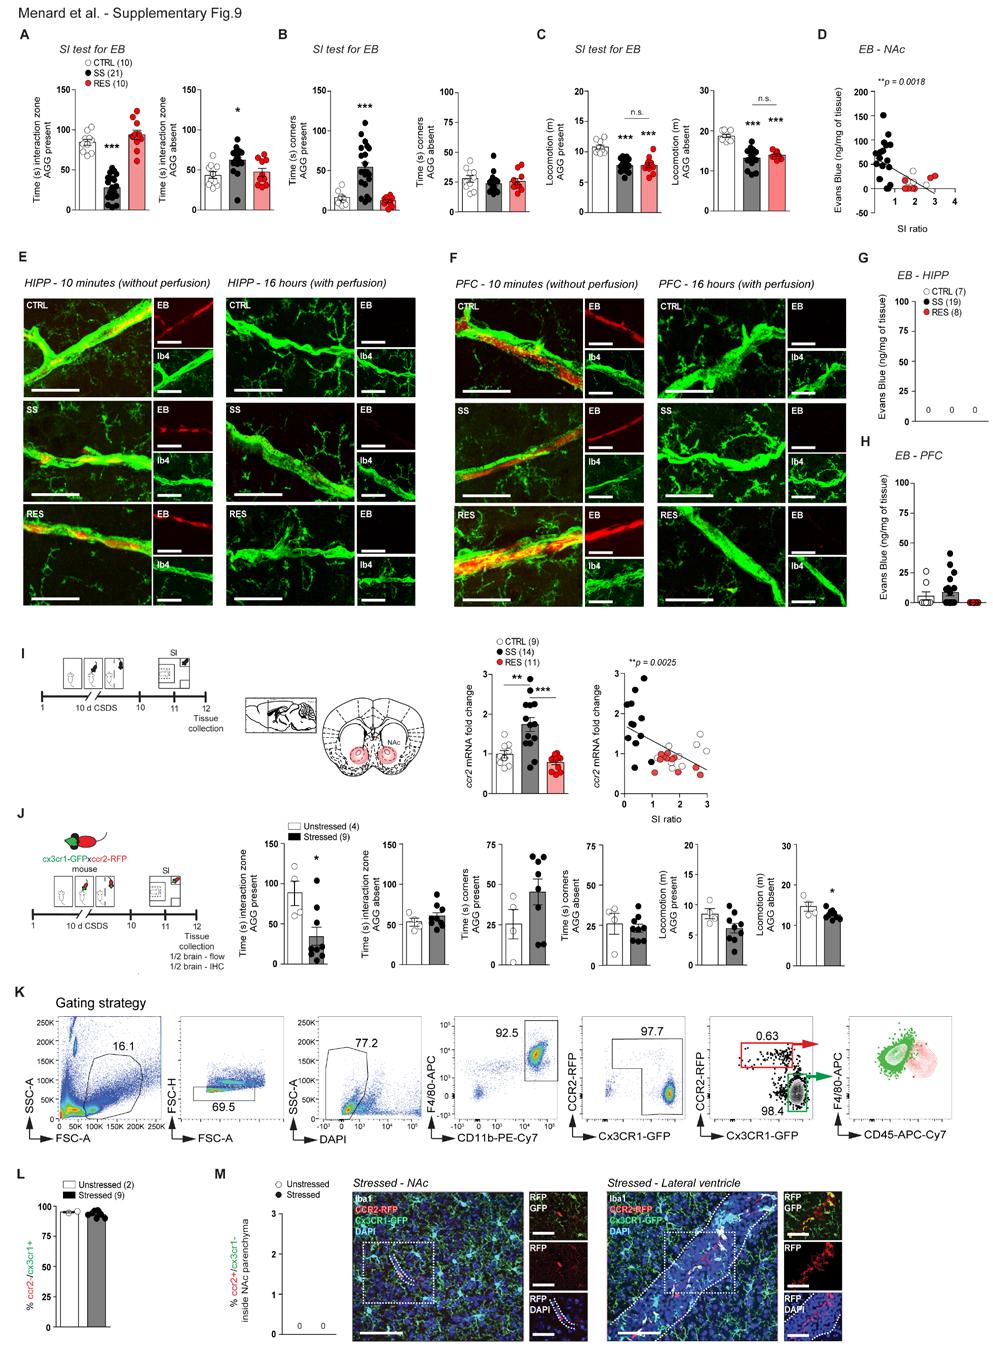
19 Supplementary Figure 9 Supplementary behavioral data for Evans blue (EB) extravasation and Ccr2 RFP ::Cx3cr1 GFP mice after CSDS. A cohort of mice was behaviorally characterized to assess BBB permeability to circulating EB. SS mice spent less time in the interaction zone (A) and more time in the corners (B) when the social target (AGG) was present when compared to CTRL and RES mice. SS mice spent more time in the interaction zone when the social target was absent (A) but no difference was observed for the corners (B). C) Stressed mice displayed less locomotion versus unstressed CTRL when the social target was either present or absent. However no significant difference was measured between SS and RES groups. D) EB level in the NAc was significantly correlated with social avoidance. E) EB could be detected in hippocampus blood vessels 10 min after the retro-orbital injection was performed (left). No EB extravasation was observed after 16-h circulation followed by 5-min perfusion in the hippocampus (right). F) Similarly, EB was detectable in PFC blood vessels 10-min after the injection but not after 16-h circulation and 5-min perfusion. No difference was measured for the hippocampus (G) or PFC (H) after EB extraction. I) C-C chemokine receptor 2 (ccr2) mrna expression is specifically elevated in the NAc of SS mice after 10-day CSDS and correlated with social avoidance. J) Stressed ccr2 RFP :: cx3cr1 GFP mice spent less time in the interaction zone when the social target (AGG) was present. Lower overall locomotion was also observed in stressed ccr2 RFP :: cx3cr1 GFP mice when compared to unstressed controls when the AGG was absent. K) Flow cytometry gating strategy for ccr2 RFP monocytes and cx3cr1 GFP microglia. L) No difference was measured between groups for percentage (%) of ccr2 - /cx3cr1 + cells (microglia). M) Immunohistochemical analysis of ccr2 RFP+ monocytes shows that they accumulate within blood vessels of the NAc (left) and lateral ventricle (right), but not in the parenchyma. Scale bar at 100 µm (50 µm for the insets). Data represent mean ± SEM, number of animals (n) is indicated on graphs. Correlations were evaluated with Pearson s correlation coefficient, unpaired t-test for ccr2 RFP :: cx3cr1 GFP mice and oneway ANOVA followed by Bonferroni s multiple comparison test for other graphs, *p < 0.05; **p < 0.01, ***p <
20
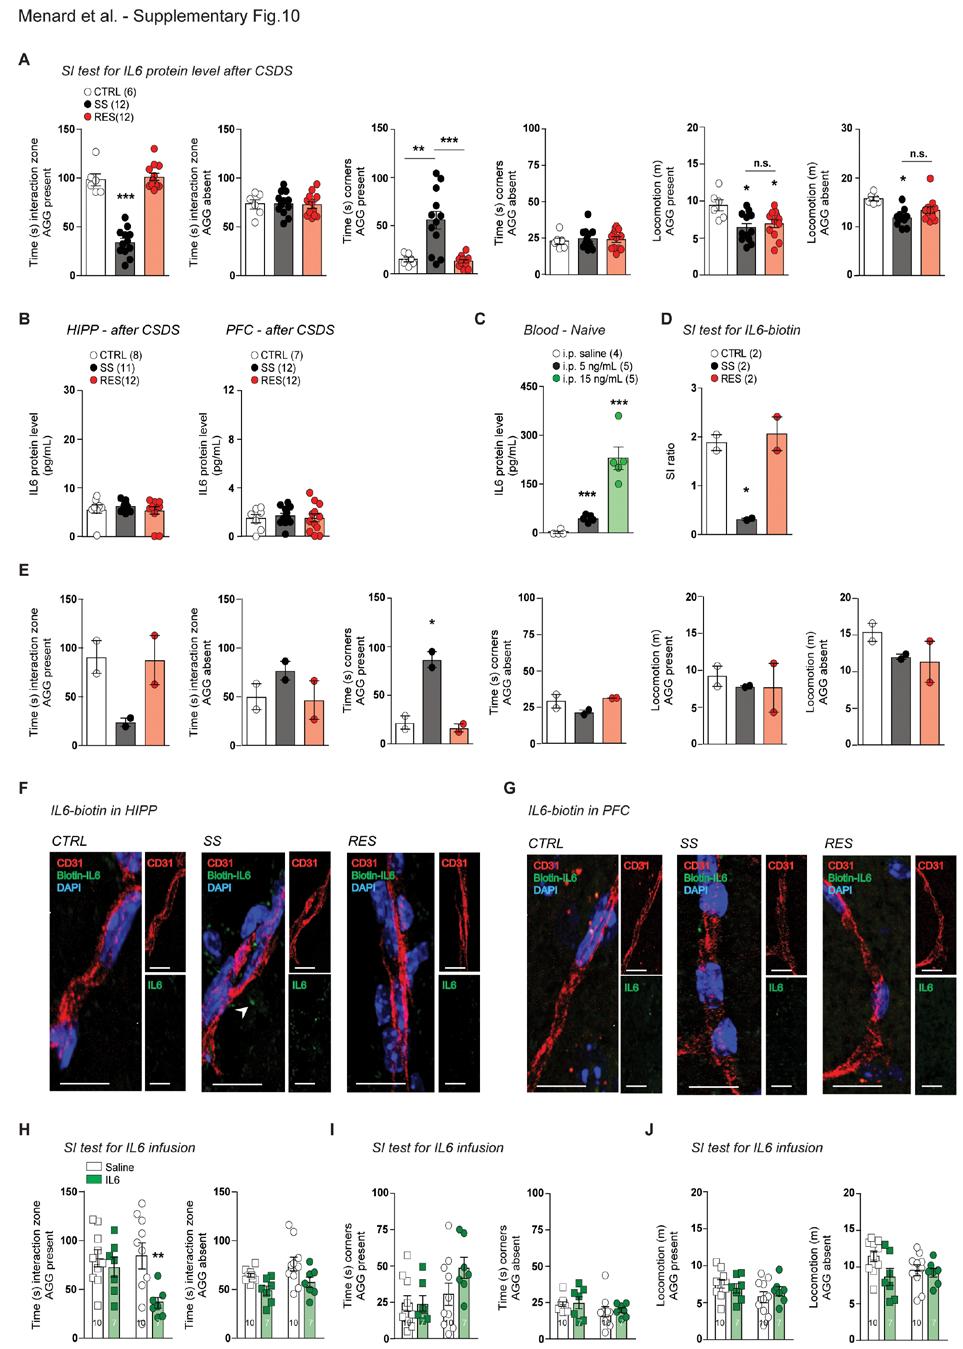
21 Supplementary Figure 10 Behavioral data for IL-6 ELISA, IL-6 biotin passage into the parenchyma and NAc IL-6 versus saline infusion. A) Following 10-day CSDS, blood serum and NAc, HIPP and PFC punches were collected to assess IL-6 protein level 48 h after the last defeat. SS mice spent less time in the interaction zone (***p < ) and more time in the corners (***p < ) when the aggressor (AGG) was present, No difference was observed when the AGG was absent or between SS and RES mice for overall locomotion. B) IL-6 protein was barely detectable in the HIPP and PFC of CTRL, SS and RES mice. C) Circulating IL-6 level is increased 20 min after recombinant IL-6 i.p. injections. D) SI ratio of mice retro-orbitally injected with biotinylated IL-6 (IL6- biotin) 24h after the SI test (48h after the last defeat or 10-day CSDS). E) SS mice spent less time in the interaction zone, and more time in the corners when the social target was present compared to CTRL and RES animals. No difference was observed for locomotion. F) Minute amount of IL6-biotin-Neutravidin-Oregon488 was detectable in the HIPP of SS mice. None was detectable in the PFC (G). H) Mice administered direct infusion of IL-6 into the NAc spent less time in the interaction zone when the social target AGG was present, but not absent, when compared to the saline group. No difference was observed for the time spent in corners (I) or locomotion (J). Data represent mean ± SEM, number of animals (n) is indicated on graphs. One-way ANOVA followed by Bonferroni s multiple comparison test for (A-D) and two-way ANOVA followed by Bonferroni s multiple comparison test for other graphs, *p < 0.05; **p < 0.01.
 induces loss of Cldn5 expression at mrna and protein levels, leading to abnormalities in blood vessel morphology and increased BBB permeability in")
22 Supplementary Figure 11 Social stress induces neurovascular pathology and BBB leakiness promoting depression-like behaviors. 10-day chronic social defeat stress (CSDS) induces loss of Cldn5 expression at mrna and protein levels, leading to abnormalities in blood vessel morphology and increased BBB permeability in stress-susceptible (SS) mice. These molecular and cellular changes are associated with depression-like behavior such as social avoidance, anhedonia, despair and lack of self-care. Conversely, mice resilient (RES) to CSDS display normal social and stress coping behaviors and neurovascular features similar to unstressed controls (CTRL).
 Full-length Western blot for cldn5 (top) and actin (bottom) after AAV-shRNA-cldn5 viral injection in the hippocampus (HIPP).")
23 Supplementary Figure 12 Full-length blots of cropped blots in Supplementary Fig. 7. A) Full-length Western blot for cldn5 (top) and actin (bottom) after AAV-shRNA-cldn5 viral injection in the hippocampus (HIPP). B) Full-length Western blot for cldn5 (top) and actin (bottom) after doxycycline (Dox) was removed from the drinking water (Rescue no Dox) in mice injected with AAV-shRNA-cldn5 in the nucleus accumbens (NAc). C) Full-length Western Blot for cldn5 (top) and actin (bottom) in the NAc of AAV-shRNA-cldn5-injected mice remaining on Dox for the entire experiment.
SUPPLEMENTARY INFORMATION
 Supplementary Figure 1. Behavioural effects of ketamine in non-stressed and stressed mice. Naive C57BL/6 adult male mice (n=10/group) were given a single dose of saline vehicle or ketamine (3.0 mg/kg,
Supplementary Fig. 1: TBR2+ cells in different brain regions.
 Hip SVZ OB Cere Hypo Supplementary Fig. 1: TBR2 + cells in different brain regions. Three weeks after the last tamoxifen injection, TBR2 immunostaining images reveal a large reduction of TBR2 + cells in
Neurobiology of Resilience
 Neurobiology of Resilience Scott J. Russo Laboratory of Neural and Immune Mechanisms of Depression Fishberg Dept. of Neuroscience and Friedman Brain Institute, Icahn School of Medicine at Mount Sinai Artwork
Supplementary Figure 1
 Supplementary Figure 1 AAV-GFP injection in the MEC of the mouse brain C57Bl/6 mice at 4 months of age were injected with AAV-GFP into the MEC and sacrificed at 7 days post injection (dpi). (a) Brains
Supplementary Information Epigenetic modulation of inflammation and synaptic plasticity promotes resilience against stress in mice
 Supplementary Information Epigenetic modulation of inflammation and synaptic plasticity promotes resilience against stress in mice Wang et. al. IL-6 in plasma (pg/ml) Rac1/HPRT (% of control) PSD9/HPRT
Social deficits in Shank3-deficient mouse models of autism are rescued by histone deacetylase (HDAC) inhibition
 inhibition") SUPPLEMENTARY INFORMATION Articles https://doi.org/10.1038/s41593-018-0110-8 In the format provided by the authors and unedited. Social deficits in Shank3-deficient mouse models of autism are rescued by
SUPPLEMENTARY INFORMATION Articles https://doi.org/10.1038/s41593-018-0110-8 In the format provided by the authors and unedited. Social deficits in Shank3-deficient mouse models of autism are rescued by
Supplemental Information. Menin Deficiency Leads to Depressive-like. Behaviors in Mice by Modulating. Astrocyte-Mediated Neuroinflammation
 Neuron, Volume 100 Supplemental Information Menin Deficiency Leads to Depressive-like Behaviors in Mice by Modulating Astrocyte-Mediated Neuroinflammation Lige Leng, Kai Zhuang, Zeyue Liu, Changquan Huang,
Nature Biotechnology: doi: /nbt Supplementary Figure 1. Diagram of BBB and brain chips.
 Supplementary Figure 1 Diagram of BBB and brain chips. (a) Schematic of the BBB Chip demonstrates the 3 parts of the chip, Top PDMS channel, membrane and Bottom PDMS channel; (b) Image of 2 BBB Chips,
(a) Significant biological processes (upper panel) and disease biomarkers (lower panel)
 Significant biological processes (upper panel) and disease biomarkers (lower panel)") Supplementary Figure 1. Functional enrichment analyses of secretomic proteins. (a) Significant biological processes (upper panel) and disease biomarkers (lower panel) 2 involved by hrab37-mediated secretory
Supplementary Figure 1. Functional enrichment analyses of secretomic proteins. (a) Significant biological processes (upper panel) and disease biomarkers (lower panel) 2 involved by hrab37-mediated secretory
GFP/Iba1/GFAP. Brain. Liver. Kidney. Lung. Hoechst/Iba1/TLR9!
 Supplementary information a +KA Relative expression d! Tlr9 5!! 5! NSC Neuron Astrocyte Microglia! 5! Tlr7!!!! NSC Neuron Astrocyte! GFP/Sβ/! Iba/Hoechst Microglia e Hoechst/Iba/TLR9! GFP/Iba/GFAP f Brain
Supplementary Figure 1. Nature Neuroscience: doi: /nn.4547
 Supplementary Figure 1 Characterization of the Microfetti mouse model. (a) Gating strategy for 8-color flow analysis of peripheral Ly-6C + monocytes from Microfetti mice 5-7 days after TAM treatment. Living
Supplementary Materials
 Supplementary Materials Fig. S1. Weights of full-dose treatment groups comparing 1 st, 2 nd, and 3 rd generation gene replacement therapy. Mice were treated at p1 with 4x10 11 GC of the three different
Supplementary Figure S1: Tanycytes are restricted to the central/posterior hypothalamus
 Supplementary Figure S1: Tanycytes are restricted to the central/posterior hypothalamus a: Expression of Vimentin, GFAP, Sox2 and Nestin in anterior, central and posterior hypothalamus. In the anterior
TGF-β Signaling Regulates Neuronal C1q Expression and Developmental Synaptic Refinement
 Supplementary Information Title: TGF-β Signaling Regulates Neuronal C1q Expression and Developmental Synaptic Refinement Authors: Allison R. Bialas and Beth Stevens Supplemental Figure 1. In vitro characterization
Embargoed until Nov. 11, 12:30 p.m. PST Contacts: Kat Snodgrass, (202) Press Room, Nov. 9 13: (619) Anne Nicholas, (202)
 Press Room, Nov. 9 13: (619) Anne Nicholas, (202)") Embargoed until Nov. 11, 12:30 p.m. PST Contacts: Kat Snodgrass, (202) 962-4090 Press Room, Nov. 9 13: (619) 525-6260 Anne Nicholas, (202) 962-4060 STUDIES PINPOINT SPECIFIC BRAIN AREAS AND MECHANISMS
Embargoed until Nov. 11, 12:30 p.m. PST Contacts: Kat Snodgrass, (202) 962-4090 Press Room, Nov. 9 13: (619) 525-6260 Anne Nicholas, (202) 962-4060 STUDIES PINPOINT SPECIFIC BRAIN AREAS AND MECHANISMS
Nature Neuroscience: doi: /nn Supplementary Figure 1. Diverse anorexigenic signals induce c-fos expression in CEl PKC-δ + neurons
 Supplementary Figure 1 Diverse anorexigenic signals induce c-fos expression in CEl PKC-δ + neurons a-c. Quantification of CEl c-fos expression in mice intraperitoneal injected with anorexigenic drugs (a),
Bone marrow-derived mesenchymal stem cells improve diabetes-induced cognitive impairment by
 Nakano et al. Supplementary information 1. Supplementary Figure 2. Methods 3. References Bone marrow-derived mesenchymal stem cells improve diabetes-induced cognitive impairment by exosome transfer into
Supplementary Table 1 Gene clone ID for ShRNA-mediated gene silencing TNFα downstream signals in in vitro Symbol Gene ID RefSeqID Clone ID
 1 2 3 4 5 6 7 8 9 10 11 12 13 14 15 16 17 18 19 20 21 22 23 24 25 26 27 28 29 30 31 32 33 34 35 36 37 38 39 40 41 42 43 44 Supplementary Table 1 Gene clone ID for ShRNA-mediated gene silencing TNFα downstream
Nature Neuroscience: doi: /nn Supplementary Figure 1. PICALM expression in brain capillary endothelium in human brain and in mouse brain.
 Supplementary Figure 1 PICALM expression in brain capillary endothelium in human brain and in mouse brain. a, Double immunostaining for PICALM (red, left) and lectin positive endothelial profiles (blue,
Supplementary Figure 1
 Supplementary Figure 1 The average sigmoid parametric curves of capillary dilation time courses and average time to 50% peak capillary diameter dilation computed from individual capillary responses averaged
Supplementary Figure 1. Characterization of NMuMG-ErbB2 and NIC breast cancer cells expressing shrnas targeting LPP. NMuMG-ErbB2 cells (a) and NIC
 and NIC") Supplementary Figure 1. Characterization of NMuMG-ErbB2 and NIC breast cancer cells expressing shrnas targeting LPP. NMuMG-ErbB2 cells (a) and NIC cells (b) were engineered to stably express either a LucA-shRNA
Supplementary Figure 1. Characterization of NMuMG-ErbB2 and NIC breast cancer cells expressing shrnas targeting LPP. NMuMG-ErbB2 cells (a) and NIC cells (b) were engineered to stably express either a LucA-shRNA
Suppl Video: Tumor cells (green) and monocytes (white) are seeded on a confluent endothelial
 and monocytes (white) are seeded on a confluent endothelial") Supplementary Information Häuselmann et al. Monocyte induction of E-selectin-mediated endothelial activation releases VE-cadherin junctions to promote tumor cell extravasation in the metastasis cascade
Supplementary Information Häuselmann et al. Monocyte induction of E-selectin-mediated endothelial activation releases VE-cadherin junctions to promote tumor cell extravasation in the metastasis cascade
Programmed necrosis, not apoptosis, is a key mediator of cell loss and DAMP-mediated inflammation in dsrna-induced retinal degeneration
 Programmed necrosis, not apoptosis, is a key mediator of cell loss and DAMP-mediated inflammation in dsrna-induced retinal degeneration The Harvard community has made this article openly available. Please
Supplementary fig. 1. Crystals induce necroptosis does not involve caspases, TNF receptor or NLRP3. A. Mouse tubular epithelial cells were pretreated
 Supplementary fig. 1. Crystals induce necroptosis does not involve caspases, TNF receptor or NLRP3. A. Mouse tubular epithelial cells were pretreated with zvad-fmk (10µM) and exposed to calcium oxalate
Hypothalamic TLR2 triggers sickness behavior via a microglia-neuronal axis
 Hypothalamic TLR triggers sickness behavior via a microglia-neuronal axis Sungho Jin, *, Jae Geun Kim,, *, Jeong Woo Park, Marco Koch,, Tamas L. Horvath and Byung Ju Lee Department of Biological Sciences,
Comparison of open chromatin regions between dentate granule cells and other tissues and neural cell types.
 Supplementary Figure 1 Comparison of open chromatin regions between dentate granule cells and other tissues and neural cell types. (a) Pearson correlation heatmap among open chromatin profiles of different
Supplementary Figure 1. Validation of astrocytes. Primary astrocytes were
 Supplementary Figure 1. Validation of astrocytes. Primary astrocytes were separated from the glial cultures using a mild trypsinization protocol. Anti-glial fibrillary acidic protein (GFAP) immunofluorescent
Zhu et al, page 1. Supplementary Figures
 Zhu et al, page 1 Supplementary Figures Supplementary Figure 1: Visual behavior and avoidance behavioral response in EPM trials. (a) Measures of visual behavior that performed the light avoidance behavior
Supplementary Materials for
 www.sciencetranslationalmedicine.org/cgi/content/full/4/117/117ra8/dc1 Supplementary Materials for Notch4 Normalization Reduces Blood Vessel Size in Arteriovenous Malformations Patrick A. Murphy, Tyson
Supplementary Figure 1 IMQ-Induced Mouse Model of Psoriasis. IMQ cream was
 Supplementary Figure 1 IMQ-Induced Mouse Model of Psoriasis. IMQ cream was painted on the shaved back skin of CBL/J and BALB/c mice for consecutive days. (a, b) Phenotypic presentation of mouse back skin
Endogenous TNFα orchestrates the trafficking of neutrophils into and within lymphatic vessels during acute inflammation
 SUPPLEMENTARY INFORMATION Endogenous TNFα orchestrates the trafficking of neutrophils into and within lymphatic vessels during acute inflammation Samantha Arokiasamy 1,2, Christian Zakian 1, Jessica Dilliway
marker. DAPI labels nuclei. Flies were 20 days old. Scale bar is 5 µm. Ctrl is
 Supplementary Figure 1. (a) Nos is detected in glial cells in both control and GFAP R79H transgenic flies (arrows), but not in deletion mutant Nos Δ15 animals. Repo is a glial cell marker. DAPI labels
SUPPLEMENTARY FIGURES
 SUPPLEMENTARY FIGURES 1 Supplementary Figure 1, Adult hippocampal QNPs and TAPs uniformly express REST a-b) Confocal images of adult hippocampal mouse sections showing GFAP (green), Sox2 (red), and REST
AAV-TBGp-Cre treatment resulted in hepatocyte-specific GH receptor gene recombination
 AAV-TBGp-Cre treatment resulted in hepatocyte-specific GH receptor gene recombination Supplementary Figure 1. Generation of the adult-onset, liver-specific GH receptor knock-down (alivghrkd, Kd) mouse
Neocortex Zbtb20 / NFIA / Sox9
 Neocortex / NFIA / Sox9 Supplementary Figure 1. Expression of, NFIA, and Sox9 in the mouse neocortex at. The lower panels are higher magnification views of the oxed area. Arrowheads indicate triple-positive
In vivo effect of anti-inflammatory compounds on HIV-1 gp120 -mediated brain inflammation
 In vivo effect of anti-inflammatory compounds on HIV-1 gp120 -mediated brain inflammation Tamima Ashraf, PhD candidate Supervisor: Dr. Reina Bendayan University of Toronto, Leslie Dan Faculty of Pharmacy,
Supplementary Figures
 Supplementary Figures Supplementary Figure 1 Characterization of stable expression of GlucB and sshbira in the CT26 cell line (a) Live cell imaging of stable CT26 cells expressing green fluorescent protein
Influenza virus exploits tunneling nanotubes for cell-to-cell spread
 Supplementary Information Influenza virus exploits tunneling nanotubes for cell-to-cell spread Amrita Kumar 1, Jin Hyang Kim 1, Priya Ranjan 1, Maureen G. Metcalfe 2, Weiping Cao 1, Margarita Mishina 1,
Supplemental Figures:
 Supplemental Figures: Figure 1: Intracellular distribution of VWF by electron microscopy in human endothelial cells. a) Immunogold labeling of LC3 demonstrating an LC3-positive autophagosome (white arrow)
Supplementary Figure 1. Microglia do not show signs of classical immune activation following MD a-b. Images showing immunoreactivity for MHCII (a)
") 1 Supplementary Figure 1. Microglia do not show signs of classical immune activation following MD a-b. Images showing immunoreactivity for MHCII (a) and CD45 (b) in fixed sections of binocular visual cortex
1 Supplementary Figure 1. Microglia do not show signs of classical immune activation following MD a-b. Images showing immunoreactivity for MHCII (a) and CD45 (b) in fixed sections of binocular visual cortex
Supplementary Figure 1: Uncropped western blots for Figure 1B. Uncropped blots shown in Figure 1B, showing that NOTCH intracellular domain (NICD) is
 is") Supplementary Figure 1: Uncropped western blots for Figure 1B. Uncropped blots shown in Figure 1B, showing that NOTCH intracellular domain (NICD) is increased with exposure of HUVEC to 1h FSS, and that
Supplementary Figure 1: Uncropped western blots for Figure 1B. Uncropped blots shown in Figure 1B, showing that NOTCH intracellular domain (NICD) is increased with exposure of HUVEC to 1h FSS, and that
Supplementary Figure 1
 Supplementary Figure 1 3 3 3 1 1 Bregma -1.6mm 3 : Bregma Ref) Http://www.mbl.org/atlas165/atlas165_start.html Bregma -.18mm Supplementary Figure 1 Schematic representation of the utilized brain slice
Supplementary Table 1. The primers used for quantitative RT-PCR. Gene name Forward (5 > 3 ) Reverse (5 > 3 )
 Reverse (5 > 3 )") 770 771 Supplementary Table 1. The primers used for quantitative RT-PCR. Gene name Forward (5 > 3 ) Reverse (5 > 3 ) Human CXCL1 GCGCCCAAACCGAAGTCATA ATGGGGGATGCAGGATTGAG PF4 CCCCACTGCCCAACTGATAG TTCTTGTACAGCGGGGCTTG
770 771 Supplementary Table 1. The primers used for quantitative RT-PCR. Gene name Forward (5 > 3 ) Reverse (5 > 3 ) Human CXCL1 GCGCCCAAACCGAAGTCATA ATGGGGGATGCAGGATTGAG PF4 CCCCACTGCCCAACTGATAG TTCTTGTACAGCGGGGCTTG
Electron micrograph of phosphotungstanic acid-stained exosomes derived from murine
 1 SUPPLEMENTARY INFORMATION SUPPLEMENTARY FIGURES Supplementary Figure 1. Physical properties of murine DC-derived exosomes. a, Electron micrograph of phosphotungstanic acid-stained exosomes derived from
Supplementary Information
 Supplementary Information Title Degeneration and impaired regeneration of gray matter oligodendrocytes in amyotrophic lateral sclerosis Authors Shin H. Kang, Ying Li, Masahiro Fukaya, Ileana Lorenzini,
Supplementary Figure 1 Expression of Crb3 in mouse sciatic nerve: biochemical analysis (a) Schematic of Crb3 isoforms, ERLI and CLPI, indicating the
 Schematic of Crb3 isoforms, ERLI and CLPI, indicating the") Supplementary Figure 1 Expression of Crb3 in mouse sciatic nerve: biochemical analysis (a) Schematic of Crb3 isoforms, ERLI and CLPI, indicating the location of the transmembrane (TM), FRM binding (FB)
Supplementary Figure 1 Expression of Crb3 in mouse sciatic nerve: biochemical analysis (a) Schematic of Crb3 isoforms, ERLI and CLPI, indicating the location of the transmembrane (TM), FRM binding (FB)
Terminology. Terminology. Terminology. Terminology. Terminology. Bromodeoxyuridine
 Kateřina Náměstková, Zuzana Šimonová, Eva Syková Behavioural Brain Research Bromodeoxyuridine : Doublecortin : DCX Glial Fibrillary Acidic Protein : GFAP Trace eye blink conditioning 1 Volume 163 : pp.
label the basement membrane). Different fixation methods of EB-perfused P8 mice to optimize the combination
. Different fixation methods of EB-perfused P8 mice to optimize the combination") Supplementary Figure 1 Optimization of the tissue fixation protocol to combine EB perfusion and IB4 endothelial tip cell staining in the postnatal mouse brain. a-l Labeling of EB-perfused P8 mice with
Supplementary Figure 1 Optimization of the tissue fixation protocol to combine EB perfusion and IB4 endothelial tip cell staining in the postnatal mouse brain. a-l Labeling of EB-perfused P8 mice with
Supplementary Fig. 1
 PDK1-dependent quenching of TACE shedding activity in prion and Alzheimer s diseases Mathéa Pietri, Caroline Dakowski, Samia Hannaoui, Aurélie Alleaume-Butaux, Julia Hernandez-Rapp, Audrey Ragagnin, Sophie
SHREE ET AL, SUPPLEMENTAL MATERIALS. (A) Workflow for tumor cell line derivation and orthotopic implantation.
 Workflow for tumor cell line derivation and orthotopic implantation.") SHREE ET AL, SUPPLEMENTAL MATERIALS SUPPLEMENTAL FIGURE AND TABLE LEGENDS Supplemental Figure 1. Derivation and characterization of TS1-TGL and TS2-TGL PyMT cell lines and development of an orthotopic
SHREE ET AL, SUPPLEMENTAL MATERIALS SUPPLEMENTAL FIGURE AND TABLE LEGENDS Supplemental Figure 1. Derivation and characterization of TS1-TGL and TS2-TGL PyMT cell lines and development of an orthotopic
Supplementary Figure S1. Effect of stress during withdrawal on expression of sensitization to repeated cocaine exposure in WT and D2R / mice.
 Supplementary Figure S1. Effect of stress during withdrawal on expression of sensitization to repeated cocaine exposure in WT and D2R / mice. The time course of locomotor activity for WT (a, b) or D2R
mm Distance (mm)
") b a Magnet Illumination Coverslips MPs Objective 2575 µm 1875 µm 1575 µm 1075 µm 875 µm 545 µm 20µm 2 3 0.5 0.3mm 1 1000 100 10 1 0.1 1000 100 10 1 0.1 Field Induction (Gauss) 1.5 0 5 10 15 20 Distance
b a Magnet Illumination Coverslips MPs Objective 2575 µm 1875 µm 1575 µm 1075 µm 875 µm 545 µm 20µm 2 3 0.5 0.3mm 1 1000 100 10 1 0.1 1000 100 10 1 0.1 Field Induction (Gauss) 1.5 0 5 10 15 20 Distance
(A) RT-PCR for components of the Shh/Gli pathway in normal fetus cell (MRC-5) and a
 RT-PCR for components of the Shh/Gli pathway in normal fetus cell (MRC-5) and a") Supplementary figure legends Supplementary Figure 1. Expression of Shh signaling components in a panel of gastric cancer. (A) RT-PCR for components of the Shh/Gli pathway in normal fetus cell (MRC-5) and
Supplementary figure legends Supplementary Figure 1. Expression of Shh signaling components in a panel of gastric cancer. (A) RT-PCR for components of the Shh/Gli pathway in normal fetus cell (MRC-5) and
Supplementary Figure 1: STAT3 suppresses Kras-induced lung tumorigenesis
 Supplementary Figure 1: STAT3 suppresses Kras-induced lung tumorigenesis (a) Immunohistochemical (IHC) analysis of tyrosine 705 phosphorylation status of STAT3 (P- STAT3) in tumors and stroma (all-time
Nature Neuroscience: doi: /nn Supplementary Figure 1
 Supplementary Figure 1 Drd1a-Cre driven ChR2 expression in the SCN. (a) Low-magnification image of a representative Drd1a-ChR2 coronal brain section (n = 2) showing endogenous tdtomato fluorescence (magenta).
Supplementary Figure 1) GABAergic enhancement by leptin hyperpolarizes POMC neurons A) Representative recording samples showing the membrane
 GABAergic enhancement by leptin hyperpolarizes POMC neurons A) Representative recording samples showing the membrane") Supplementary Figure 1) GABAergic enhancement by leptin hyperpolarizes POMC neurons A) Representative recording samples showing the membrane potential recorded from POMC neurons following treatment with
Supplementary Figure 1) GABAergic enhancement by leptin hyperpolarizes POMC neurons A) Representative recording samples showing the membrane potential recorded from POMC neurons following treatment with
SUPPLEMENTARY FIGURE LEGENDS. atypical adenomatous hyperplasias (AAH); Grade II: adenomas; Grade III: adenocarcinomas;
; Grade II: adenomas; Grade III: adenocarcinomas;") SUPPLEMENTARY FIGURE LEGENDS Supplementary Figure S1: Tumor grades in Ras G12D ; p53 / lung tumors. Representative histology (H&E) of K-Ras G12D ; p53 / lung tumors 13 weeks after tumor initiation. Grade
SUPPLEMENTARY FIGURE LEGENDS Supplementary Figure S1: Tumor grades in Ras G12D ; p53 / lung tumors. Representative histology (H&E) of K-Ras G12D ; p53 / lung tumors 13 weeks after tumor initiation. Grade
Supplementary Figure 1: Hsp60 / IEC mice are embryonically lethal (A) Light microscopic pictures show mouse embryos at developmental stage E12.
 Light microscopic pictures show mouse embryos at developmental stage E12.") Supplementary Figure 1: Hsp60 / IEC mice are embryonically lethal (A) Light microscopic pictures show mouse embryos at developmental stage E12.5 and E13.5 prepared from uteri of dams and subsequently genotyped.
Supplementary Figure 1: Hsp60 / IEC mice are embryonically lethal (A) Light microscopic pictures show mouse embryos at developmental stage E12.5 and E13.5 prepared from uteri of dams and subsequently genotyped.
Nature Immunology: doi: /ni Supplementary Figure 1. Production of cytokines and chemokines after vaginal HSV-2 infection.
 Supplementary Figure 1 Production of cytokines and chemokines after vaginal HSV-2 infection. C57BL/6 mice were (a) treated intravaginally with 20 µl of PBS or infected with 6.7x10 4 pfu of HSV-2 in the
Supplementary Figure 1. Spatial distribution of LRP5 and β-catenin in intact cardiomyocytes. (a) and (b) Immunofluorescence staining of endogenous
 and (b) Immunofluorescence staining of endogenous") Supplementary Figure 1. Spatial distribution of LRP5 and β-catenin in intact cardiomyocytes. (a) and (b) Immunofluorescence staining of endogenous LRP5 in intact adult mouse ventricular myocytes (AMVMs)
Supplementary Figure 1. Spatial distribution of LRP5 and β-catenin in intact cardiomyocytes. (a) and (b) Immunofluorescence staining of endogenous LRP5 in intact adult mouse ventricular myocytes (AMVMs)
Supplementary Figure 1. Repression of hepcidin expression in the liver of mice treated with
 Supplementary Figure 1. Repression of hepcidin expression in the liver of mice treated with DMN Immunohistochemistry for hepcidin and H&E staining (left). qrt-pcr assays for hepcidin in the liver (right).
SUPPLEMENTARY INFORMATION
 DOI: 1.138/ncb3355 a S1A8 + cells/ total.1.8.6.4.2 b S1A8/?-Actin c % T-cell proliferation 3 25 2 15 1 5 T cells Supplementary Figure 1 Inter-tumoral heterogeneity of MDSC accumulation in mammary tumor
TEB. Id4 p63 DAPI Merge. Id4 CK8 DAPI Merge
 a Duct TEB b Id4 p63 DAPI Merge Id4 CK8 DAPI Merge c d e Supplementary Figure 1. Identification of Id4-positive MECs and characterization of the Comma-D model. (a) IHC analysis of ID4 expression in the
Supplementary Figure 1. A. Bar graph representing the expression levels of the 19 indicated genes in the microarrays analyses comparing human lung
 Supplementary Figure 1. A. Bar graph representing the expression levels of the 19 indicated genes in the microarrays analyses comparing human lung immortalized broncho-epithelial cells (AALE cells) expressing
Effects of UBL5 knockdown on cell cycle distribution and sister chromatid cohesion
 Supplementary Figure S1. Effects of UBL5 knockdown on cell cycle distribution and sister chromatid cohesion A. Representative examples of flow cytometry profiles of HeLa cells transfected with indicated
Supplementary Figure 1. Deletion of Smad3 prevents B16F10 melanoma invasion and metastasis in a mouse s.c. tumor model.
 A B16F1 s.c. Lung LN Distant lymph nodes Colon B B16F1 s.c. Supplementary Figure 1. Deletion of Smad3 prevents B16F1 melanoma invasion and metastasis in a mouse s.c. tumor model. Highly invasive growth
Primary Mouse Cerebral Cortex Neurons V: 80% TE: 70%
 Primary Mouse Cerebral Cortex Neurons V: 80% TE: 70% Pictures: 9 days after electroporation Red: MAP2 Blue: GFAP Green: GFP The cells were from Embryonic Day 14 Mouse Cerebral Cortex Primary Mouse Hippocampal
Supplementary Figure 1
 Supplementary Figure 1 Localization of virus injections. (a) Schematic showing the approximate center of AAV-DIO-ChR2-YFP injection sites in the NAc of Dyn-cre mice (n=8 mice, 16 injections; caudate/putamen,
Supplementary Information
 Nature Immunology doi:1.138/ni.2477 Supplementary Information Capillary and arteriolar pericytes attract innate leukocytes exiting through venules and instruct them with pattern recognition and motility
Supplementary Figure 1.
 Supplementary Figure 1. Female Pro-ins2 -/- mice at 5-6 weeks of age were either inoculated i.p. with a single dose of CVB4 (1x10 5 PFU/mouse) or PBS and treated with αgalcer or control vehicle. On day
CHAPTER 5 RESULTS Previous study: cell culture and organotypical slices
 45 CHAPTER 5 RESULTS 5.1. Previous study: cell culture and organotypical slices Initial experiments have been conducted to ensure that the tet-on system works. A neuronal cell culture from mice expressing
Type of file: PDF Title of file for HTML: Supplementary Information Description: Supplementary Figures
 Type of file: PDF Title of file for HTML: Supplementary Information Description: Supplementary Figures Type of file: MOV Title of file for HTML: Supplementary Movie 1 Description: NLRP3 is moving along
EPIGENETIC RE-EXPRESSION OF HIF-2α SUPPRESSES SOFT TISSUE SARCOMA GROWTH
 EPIGENETIC RE-EXPRESSION OF HIF-2α SUPPRESSES SOFT TISSUE SARCOMA GROWTH Supplementary Figure 1. Supplementary Figure 1. Characterization of KP and KPH2 autochthonous UPS tumors. a) Genotyping of KPH2
B220 CD4 CD8. Figure 1. Confocal Image of Sensitized HLN. Representative image of a sensitized HLN
 B220 CD4 CD8 Natarajan et al., unpublished data Figure 1. Confocal Image of Sensitized HLN. Representative image of a sensitized HLN showing B cell follicles and T cell areas. 20 µm thick. Image of magnification
SUPPLEMENTARY INFORMATION
 DOI: 10.1038/ncb2566 Figure S1 CDKL5 protein expression pattern and localization in mouse brain. (a) Multiple-tissue western blot from a postnatal day (P) 21 mouse probed with an antibody against CDKL5.
Supplementary Information Titles Journal: Nature Medicine
 Supplementary Information Titles Journal: Nature Medicine Article Title: Corresponding Author: Supplementary Item & Number Supplementary Fig.1 Fig.2 Fig.3 Fig.4 Fig.5 Fig.6 Fig.7 Fig.8 Fig.9 Fig. Fig.11
Conserved properties of dentate gyrus neurogenesis across postnatal development revealed by single-cell RNA sequencing
 SUPPLEMENTARY INFORMATION Resource https://doi.org/10.1038/s41593-017-0056-2 In the format provided by the authors and unedited. Conserved properties of dentate gyrus neurogenesis across postnatal development
Cell-type-specific role of ΔFosB in nucleus accumbens in modulating inter-male aggression
 This Accepted Manuscript has not been copyedited and formatted. The final version may differ from this version. Research Articles: Behavioral/Cognitive Cell-type-specific role of ΔFosB in nucleus accumbens
SUPPLEMENTARY INFORMATION
 doi:10.1038/nature12215 Supplementary Figure 1. The effects of full and dissociated GR agonists in supporting BFU-E self-renewal divisions. BFU-Es were cultured in self-renewal medium with indicated GR
Figure S1. Reduction in glomerular mir-146a levels correlate with progression to higher albuminuria in diabetic patients.
 Supplementary Materials Supplementary Figures Figure S1. Reduction in glomerular mir-146a levels correlate with progression to higher albuminuria in diabetic patients. Figure S2. Expression level of podocyte
Pharmacologic inhibition of histone demethylation as a therapy for pediatric brainstem glioma
 Supplementary information for: Pharmacologic inhibition of histone demethylation as a therapy for pediatric brainstem glioma Rintaro Hashizume 1, Noemi Andor 2, Yuichiro Ihara 2, Robin Lerner 2, Haiyun
Name/Institution: Fernanda Neutzling Kaufmann, PhD student at Post Graduate Program in Biochemistry, Federal University of Santa Catarina, Brazil
 PROGRESS REPORT Committee for Aid and Education in Neurochemistry (CAEN) CATEGORY 1A: Visit by the applicant to another laboratory July, 2018 Name/Institution: Fernanda Neutzling Kaufmann, PhD student
Rescue of mutant rhodopsin traffic by metformin-induced AMPK activation accelerates photoreceptor degeneration Athanasiou et al
 Supplementary Material Rescue of mutant rhodopsin traffic by metformin-induced AMPK activation accelerates photoreceptor degeneration Athanasiou et al Supplementary Figure 1. AICAR improves P23H rod opsin
Supplementary Information
 Supplementary Information TABLE S1. SUBJECT CHARACTERISTICS* Normal Control Subjects Subjects with Asthma p Value Number 23 48 Age (years) 35±10 35±10 0.75 Sex, M:F (% F) 9:12 (57) 17:26 (60) 0.76 FEV1
Supplementary Figure 1 Validation of Per2 deletion in neuronal cells in N Per2 -/- mice. (a) Western blot from liver extracts of mice held under ad
 Western blot from liver extracts of mice held under ad") Supplementary Figure 1 Validation of Per2 deletion in neuronal cells in N Per2 -/- mice. (a) Western blot from liver extracts of mice held under ad libitum conditions detecting PER2 protein in brain and
Supplementary Figure 1 Validation of Per2 deletion in neuronal cells in N Per2 -/- mice. (a) Western blot from liver extracts of mice held under ad libitum conditions detecting PER2 protein in brain and
Nature Biotechnology: doi: /nbt Supplementary Figure 1. Analysis of hair bundle morphology in Ush1c c.216g>a mice at P18 by SEM.
 Supplementary Figure 1 Analysis of hair bundle morphology in Ush1c c.216g>a mice at P18 by SEM. (a-c) Heterozygous c.216ga mice displayed normal hair bundle morphology at P18. (d-i) Disorganized hair bundles
Supplemental Figure 1. Intracranial transduction of a modified ptomo lentiviral vector in the mouse
 Supplemental figure legends Supplemental Figure 1. Intracranial transduction of a modified ptomo lentiviral vector in the mouse hippocampus targets GFAP-positive but not NeuN-positive cells. (A) Stereotaxic
Lack of GPR88 enhances medium spiny neuron activity and alters. motor- and cue- dependent behaviors
 Lack of GPR88 enhances medium spiny neuron activity and alters motor- and cue- dependent behaviors Albert Quintana, Elisenda Sanz, Wengang Wang, Granville P. Storey, Ali D. Güler Matthew J. Wanat, Bryan
Social transmission and buffering of synaptic changes after stress
 SUPPLEMENTARY INFORMATION Articles https://doi.org/10.1038/s41593-017-0044-6 In the format provided by the authors and unedited. Social transmission and buffering of synaptic changes after stress Toni-Lee
Paeoniflorin ameliorates interferon-alpha-induced neuroinflammation and depressive-like behaviors in mice
 /, 2017, Vol. 8, (No. 5), pp: 8264-8282 Paeoniflorin ameliorates interferon-alpha-induced neuroinflammation and depressive-like behaviors in mice Jianwei Li 1,*, Shaohui Huang 1,*, Weiliang Huang 1,*,
Nature Neuroscience: doi: /nn Supplementary Figure 1
 Supplementary Figure 1 Quantification of myelin fragments in the aging brain (a) Electron microscopy on corpus callosum is shown for a 18-month-old wild type mice. Myelin fragments (arrows) were detected
Supplementary Figure 1.
 Supplementary Figure 1. Transduction of adipocytes after intra-ewat administration of AAV vectors. A: Immunostaining against GFP (green) in sections of ewat two weeks after the intra-ewat administration
SUPPLEMENTARY LEGENDS...
 TABLE OF CONTENTS SUPPLEMENTARY LEGENDS... 2 11 MOVIE S1... 2 FIGURE S1 LEGEND... 3 FIGURE S2 LEGEND... 4 FIGURE S3 LEGEND... 5 FIGURE S4 LEGEND... 6 FIGURE S5 LEGEND... 7 FIGURE S6 LEGEND... 8 FIGURE
Disrupting GluA2-GAPDH Interaction Affects Axon and Dendrite Development
 Disrupting GluA2-GAPDH Interaction Affects Axon and Dendrite Development 1 Frankie Hang Fung Lee, 1 Ping Su, 1 Yu Feng Xie, 1 Kyle Ethan Wang, 2 Qi Wan and 1,3 Fang Liu 1 Campbell Research Institute, Centre
Supplementary Materials for. c-abl Activation Plays a Role in α-synucleinopathy Induced Neurodegeneration
 Supplementary Materials for c-abl Activation Plays a Role in α-synucleinopathy Induced Neurodegeneration Saurav Brahmachari, Preston Ge, Su Hyun Lee, Donghoon Kim, Senthilkumar S. Karuppagounder, Manoj
a surface permeabilized
 a surface permeabilized RAW 64.7 P388D1 J774 b CD11b + Ly-6G - Blood Monocytes WT Supplementary Figure 1. Cell surface expression on macrophages and DCs. (a) RAW64.7, P388D1, and J774 cells were subjected
Supplementary Fig. 1. GPRC5A post-transcriptionally down-regulates EGFR expression. (a) Plot of the changes in steady state mrna levels versus
 Plot of the changes in steady state mrna levels versus") Supplementary Fig. 1. GPRC5A post-transcriptionally down-regulates EGFR expression. (a) Plot of the changes in steady state mrna levels versus changes in corresponding proteins between wild type and Gprc5a-/-
Supplementary Fig. 1. GPRC5A post-transcriptionally down-regulates EGFR expression. (a) Plot of the changes in steady state mrna levels versus changes in corresponding proteins between wild type and Gprc5a-/-
L1 on PyMT tumor cells but Py117 cells are more responsive to IFN-γ. (A) Flow
 Flow") A MHCI B PD-L1 Fold expression 8 6 4 2 Fold expression 3 2 1 No tx 1Gy 2Gy IFN Py117 Py117 Supplementary Figure 1. Radiation and IFN-γ enhance MHCI expression and PD- L1 on PyMT tumor cells but Py117 cells
A MHCI B PD-L1 Fold expression 8 6 4 2 Fold expression 3 2 1 No tx 1Gy 2Gy IFN Py117 Py117 Supplementary Figure 1. Radiation and IFN-γ enhance MHCI expression and PD- L1 on PyMT tumor cells but Py117 cells
Pathologic Stage. Lymph node Stage
 ASC ASC a c Patient ID BMI Age Gleason score Non-obese PBMC 1 22.1 81 6 (3+3) PBMC 2 21.9 6 6 (3+3) PBMC 3 22 84 8 (4+4) PBMC 4 24.6 68 7 (3+4) PBMC 24. 6 (3+3) PBMC 6 24.7 73 7 (3+4) PBMC 7 23. 67 7 (3+4)
Supplementary Information
 Supplementary Information Supplementary s Supplementary 1 All three types of foods suppress subsequent feeding in both sexes when the same food is used in the pre-feeding test feeding. (a) Adjusted pre-feeding