Nature Neuroscience: doi: /nn Supplementary Figure 1. PICALM expression in brain capillary endothelium in human brain and in mouse brain.
|
|
|
- Maude Norman
- 5 years ago
- Views:
Transcription
 and lectin positive endothelial profiles (blue, right) in the prefrontal cortex (Brodmann 9/10; pink merged, right) of an age matched control Braak I")
 and microvessel depleted brains (d) in 15 month old APPsw/0 and age matched littermate control mice. Mean + s.e.m., n=6 mice per group.")
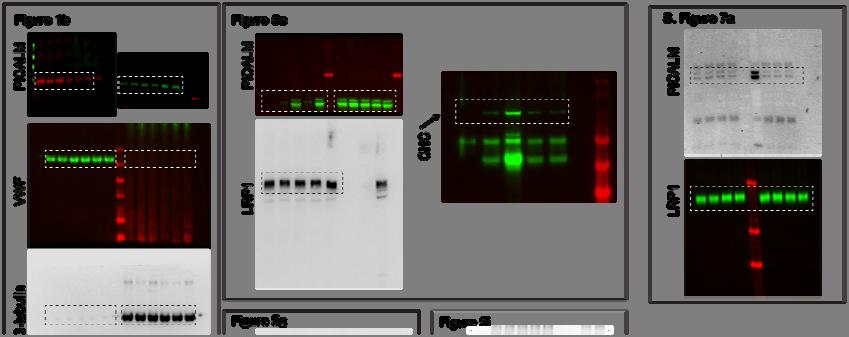
1 Supplementary Figure 1 PICALM expression in brain capillary endothelium in human brain and in mouse brain. a, Double immunostaining for PICALM (red, left) and lectin positive endothelial profiles (blue, right) in the prefrontal cortex (Brodmann 9/10; pink merged, right) of an age matched control Braak I and AD individual Braak VI. Bar=20 µm. b, Immunoblotting for PICALM relative to tubulin in brain microvessels and microvessel depleted brains in 2 3 month old control mice. c d, Immunoblotting for PICALM relative to β actin in brain microvessels (c) and microvessel depleted brains (d) in 15 month old APPsw/0 and age matched littermate control mice. Mean + s.e.m., n=6 mice per group. e, Immunoblotting for PICALM relative to β actin in primary mouse brain endothelial cells (BEC) cultured with or without Aβ40 (1 µm) for 72 hr. Mean ± s.e.m. from 3 independent primary isolates in triplicate. P<0.05 by Student s t test; NS, non significant.

 Glucose; (c) Serum alkaline phosphatase; (d) Serum alanine aminotransferase (ALT); (e) Serum aspartate aminotransferase (AST); (f) Creatine phosphokinase (CPK); (g) Albumin;")
2 Supplementary Figure 2 Generation of Picalm +/ mouse, biochemistry and behavioral characterization. Generation of Picalm +/ mouse: a, A diagram showing the targeting strategy for generating the Picalm knockout mouse. See additional Methods for more detailed information. Biochemistry: b m, Picalm +/ mice show no changes in blood glucose, liver and renal tests and serum electrolytes compared to wild type littermate controls. The tests include: (b) Glucose; (c) Serum alkaline phosphatase; (d) Serum alanine aminotransferase (ALT); (e) Serum aspartate aminotransferase (AST); (f) Creatine phosphokinase (CPK); (g) Albumin; (h) Total protein; (i) Total bilirubin; (j) Blood urea nitrogen; (k) Creatinine level; (l) Calcium level; (m) Phosphorous level. Mean + s.e.m., n=5 mice per group. Behavioral tests: n q, Nest construction (n), burrowing (o), novel object recognition (NOR) (p) and location (NOL) (q) tests showing no cognitive difference in 9 month old Picalm +/ mice compared to age matched Picalm +/+ littermates. Means + s.e.m. n=12 mice per group. Statistical significance by Student s t test.
 and microvessel depleted brain homogenate (b) in 3 month old APP sw/0 Picalm +/ mice and age matched")

3 Supplementary Figure 3 Additional characterization of APP sw/0 Picalm +/ mice. a b, Representative western blots and densitometry analysis of PICALM in brain microvessels (a) and microvessel depleted brain homogenate (b) in 3 month old APP sw/0 Picalm +/ mice and age matched APP sw/0 Picalm +/+ littermate controls. Mean + s.e.m., n=3 4 mice per group. Statistical significance by Student s t test. β actin was used as a loading control. c, Representative images of brain tissue sections stained with human Aβ specific antibodies show accelerated Aβ deposition in the hippocampus and cortex and development of early cerebral amyloid angiopathy () in 6 month old APP sw/0 ; Picalm +/ mice compared to age matched APP sw/0 ; Picalm +/+ littermate controls. d, Increased Aβ load in the hippocampus and cortex in 6 month old APP sw/0 ; Picalm +/ mice compared to age matched APP sw/0 ; Picalm +/+ littermate controls. Mean + s.e.m., n=5 6 mice per group. Statistical significance by Student s t test.


4 Supplementary Figure 4 Endothelial-specific expression of Tdtomato after injection of the AAV-Flex-Tdtomato into the hippocampus of APP sw/0 ; Picalm +/ ; Tie2-Cre mice, and Aβ clearance from the hippocampus in APP sw/0 ; Picalm +/ ; Tie2-Cre mice after injection of the AAV-Flex-Picalm into the hippocampus and endothelial-specific rescue of PICALM. a, Representative confocal images in 5 month old APP sw/0 ; Picalm +/ ; Tie2 Cre mice show Tie2 Cre dependent expression of Tdtomato (red) in >50% of lectin positive endothelial vascular profiles after injection of the AAV Flex Tdtomato into the hippocampus. Co injection of AAV Synapsin GFP shows that ~3% of hippocampal neurons express Tdtomato indicating minimal leakage. b, Coronal brain section of a 6 month old APP sw/0 ; Picalm +/ ; Tie2 Cre mouse injected into the hippocampus with AAV Flex (control, left) or AAV Flex Picalm (right) show clearance of Aβ from the hippocampus after endothelial specific re expression of PICALM (right; see also main Fig. 4b). Aβ immunoststaing green; Dapi blue. Data are representative from 3 5 independent experiments.
, β secretase activity (b) sappβ levels (c) and γ secretase activity determined by the production of Notch intracellular domain")
, LRP1 by immunoblottting of microvessels (f) and")
 (j).")

5 Supplementary Figure 5 Characterization of Picalm +/ mice and APP sw/0 Picalm +/ mice. a d, APP abundance relative to β actin (a), β secretase activity (b) sappβ levels (c) and γ secretase activity determined by the production of Notch intracellular domain (NICD) fragment from Notch protein (d) were studied in the forebrain lysates from 3 month old Picalm +/ and age matched littermate controls. e j, Picalm +/ mice show no changes in the expression of major Aβ transporters in the brain microvessels, including Pgp (e), LRP1 by immunoblottting of microvessels (f) and double staining for LRP1 and endothelial specific lectin (g) and RAGE (h), and no change in the levels of Aβ degrading enzymes in the brain including neprilysin (i) and insulin degrading enzyme (IDE) (j). k n, APP abundance relative to β actin (k), β secretase activity (l) sappβ levels (m) and γ secretase activity (n) were studied in the forebrain lysates from 3 month old APP sw/0 Picalm +/ and age matched littermate APP sw/0 Picalm +/+ controls. o s, APP sw/0 Picalm +/ mice show no changes in the expression of major Aβ transporters in the brain microvessels, including Pgp (o), LRP1 (p) and RAGE (q), and no change in expression of Aβ degrading enzymes in the brain including neprilysin (r) and IDE (s). Mean + s.e.m., from 3 4 mice per group. Statistical significance was determined by Student s t test. NS, non significant.
 showing binding of Aβ40 (1 nm) to LRP1 on the cell surface of brain endothelial cells (BEC) at 4 o C for 30 min.")
 for 30 s. Dapi, nuclear staining (blue). Insets: high magnification depicting colocalizations.")
6 Supplementary Figure 6 Binding of Aβ to LRP1 and interactions of Aβ-LRP1 complexes with AP-2 and PICALM. a, Proximity ligation assay (PLA) showing binding of Aβ40 (1 nm) to LRP1 on the cell surface of brain endothelial cells (BEC) at 4 o C for 30 min. b, LRP1 Aβ40 complexes colocalize with AP 2 30 s after treatment of BEC with FAM Aβ40 (250 nm). c, LRP1 Aβ42 complexes colocalize with PICALM 30 s after treatment of BEC with FAM Aβ42 (250 nm) for 30 s. Dapi, nuclear staining (blue). Insets: high magnification depicting colocalizations. Bar=10 µm. d, Minimal internalization and lack of colocalization of scramble FAM Aβ42 (green) with LRP1 (red). Bar=10 µm. Representative findings are from 3 independent primary isolates determined in triplicates (i.e., 3 different cell cultures per isolate; >20 cells in each replicate). e, Control assay for Fig. 5g shows no binding between GST and recombinant human PICALM.
, apoe4 (40 nm) or activated α2 Macroglobulin (α2 M*, activated with methylamine, 0.25 nm) (left).")
 within 1 min of BEC exposure to different LRP1 ligands using assay conditions as in main Fig.")
7 Supplementary Figure 7 Apolipoprotein E and activated α2-macroglobulin do not initiate PICALM binding to LRP1. a, PICALM does not bind to LRP1 in BEC treated with lipidated apoe3 (40 nm), apoe4 (40 nm) or activated α2 Macroglobulin (α2 M*, activated with methylamine, 0.25 nm) (left). Binding of PICALM to LRP1 in BEC treated with Aβ40 (1 nm, positive control), and loss of PICALM binding to LRP1 in BEC treated with pre formed complexes between Aβ40 and apoe3, apoe4 or α2 M* (right). In these experiments co immunoprecipitation of PICALM was performed by LRP1 specific antibody (IP: LRP1) within 1 min of BEC exposure to different LRP1 ligands using assay conditions as in main Fig. 5e and described in Supplementary Methods b, Control LRP1 internalization assay with Aβ. BEC were incubated with Aβ40 (230 nm) at 4 o C for 15 min and then transferred to 37 o C for 1 min for LRP1 internalization assay. The cell surface LRP1 was immunodetected with the N terminus specific LRP1 antibody (N 20). c, LRP1 internalization is not triggered by apoe3, apoe4 or α2m*. BEC were incubated with Aβ40 (230 nm, control) or pre formed complexes between Aβ40 and apoe3, apoe4 or α2m* at 4 o C for 15 min and then transferred to 37 o C for 1 min for LRP1 internalization assay. Values are means + s.d. from 3 independent BEC isolates from 3 different donors using 3 replicate cultures. The number of cells counted for each culture was 20. The total number of cells in each group was 180. Statistical significance by ANOVA followed by Tukey s posthoc test.
 and LRP1 immunodetection in capillary endothelium (red) in a control human brain. Merged: purple.")
 and RAGE immunodetection in capillary endothelium (red) in a control human brain. Merged: purple.")
 and polarized expression of RAGE (red) and LRP1 (green) to the apical and basolateral side of the monolayer (right), respectively.")
 and anti LRP1 specific antibody, but")
8 Supplementary Figure 8 Endothelial cell polarity of LRP1 and RAGE in brain capillaries in human brain in situ and in an in vitro blood-brain barrier model. a, A representative confocal scanning analysis of lectin positive endothelium (blue) and LRP1 immunodetection in capillary endothelium (red) in a control human brain. Merged: purple. Bar represents 5 μm. Chart: LRP1 relative signal intensity (red) plotted over the endothelial specific lectin signal intensity (blue). b, A representative confocal scanning analysis of lectin positive endothelium (blue) and RAGE immunodetection in capillary endothelium (red) in a control human brain. Merged: purple. Bar represents 5 μm. Chart: RAGE relative signal intensity (red) plotted over the endothelial specific lectin signal intensity (blue). c, Expression of RAGE and LRP1 in the endothelial monolayer (left) and polarized expression of RAGE (red) and LRP1 (green) to the apical and basolateral side of the monolayer (right), respectively. Representative findings are from 3 independent primary isolates determined triplicates (3 different cultures per isolate; >20 cells in each replicate). d, Inhibition of synthetic human Aβ40 basolateral to apical transendothelial transport across an in vitro BBB monolayer by RAP (the receptor associated protein) and anti LRP1 specific antibody, but not by anti LRP2, anti VLDLR and anti LDLR antibodies, and in monolayers after BEC transfection with si.lrp1 but not control si.scarmble. Aβ40 transcellular transport was determined by ELISA within 30 min and was corrected for the paracellular diffusion of simultaneously measured 14 C inulin basolateral to apical transport as described in detail in the Supplementary Methods. Aβ40 transport in the absence of potential inhibitors or competitors was arbitrarily taken as 100%. Mean + s.e.m., from 3 independent isolates determined in triplicate.
 showing colocalization of Aβ LRP1 complexes (green) near the apical membrane of the endothelial monolayer within 5 min of Aβ40 (1 nm) application to")
 transendothelial transport across an in vitro BBB monolayer expressed as the percentage of dose (%) of Aβ transported from the basoalateral to apical chamber.")
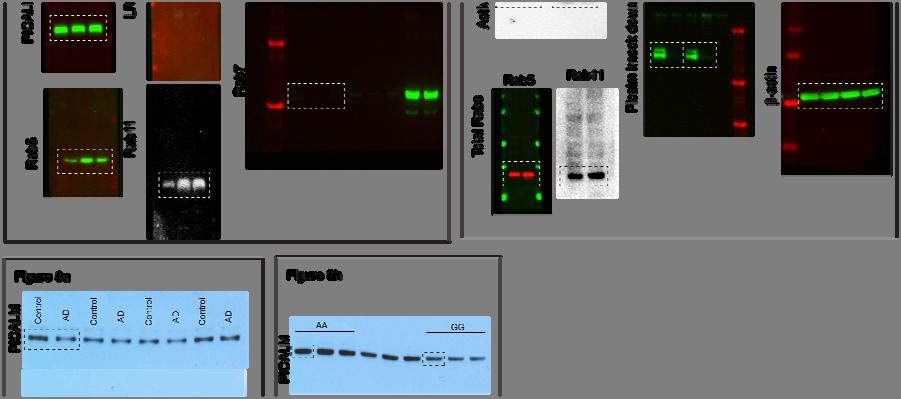
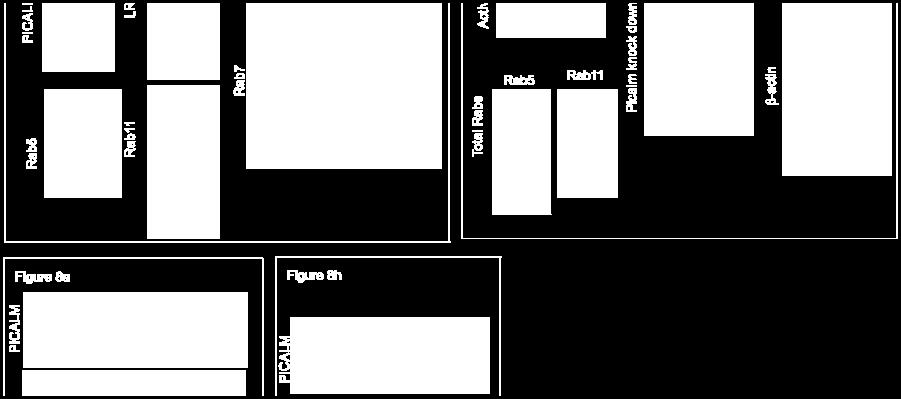
9 Supplementary Figure 9 PICALM regulates Aβ transcytosis in brain endothelial monolayers. a, A representative proximity ligation assay (PLA) showing colocalization of Aβ LRP1 complexes (green) near the apical membrane of the endothelial monolayer within 5 min of Aβ40 (1 nm) application to the basolateral side. Bar=20 µm. b, Aβ40 (1 nm) transendothelial transport across an in vitro BBB monolayer expressed as the percentage of dose (%) of Aβ transported from the basoalateral to apical chamber. Primary human brain endothelial cells have been transfected with scramble si.rna (si.scramble), or si.rna targeting RAB11a or RAB11b, respectively. Mean + s.e.m., from 3 independent primary isolates determined in triplicate (3 different cultures per isolate; >20 cells in each replicate). c, Immunoblotting of different Rab proteins in Madin Darby canine kidney (MDCK) epithelial cells and human brain endothelial cells (BEC), showing that Rab11b is mainly expressed in BEC, while Rab11a is mainly expressed in MDCK cells. Immunoblot is representative of 3 independent experiments. For each experiment we used at least 3 different samples for each condition. d, Left panel: HPLC elution profile of 125 I Aβ40 in the apical chamber after 30 min transport from the basolateral to apical chamber shows a single peak corresponding to the elution profile of Aβ40 standard indicating no degradation. Right panel: SDS PAGE analysis showing intact 125 I Aβ40 in the apical chamber after 30 min of transendothelial transport across an in vitro BBB monolayer.
 and EEA1 (green) in BEC cultured with and without FAM Aβ40 (250 nm) for 2 min. Dapi, nuclear staining (blue).")
 (green) and Rab5 (red) in cultures incubated with FAM Aβ40 (250 nm) for 2 min.")
10 Supplementary Figure 10 PICALM and LRP1-Aβ complexes associate with EEA1, Rab5 and Rab11, but not Rab7 or LAMP1 (a lysosomal marker), in human brain endothelial cells cultured with Aβ. a, Colocalization between PICALM (red) and EEA1 (green) in BEC cultured with and without FAM Aβ40 (250 nm) for 2 min. Dapi, nuclear staining (blue). Insets: high magnification depicting colocalization. Bar=10 µm. Graph (on the left) quantification of colocalized PICALM and EEA1 puncta. b, Colocalization between Aβ LRP1 complexes visualized by the proximity ligation assay (PLA) (green) and Rab5 (red) in cultures incubated with FAM Aβ40 (250 nm) for 2 min. c, Lack of association between PICALM (red) and a lysosomal marker LAMP1 (green) in BEC cultured without and with FAM Aβ40 (250 nm) for 5 min. Dapi, nuclear staining (blue). Insets: high magnification. Bar=10 µm. Graph (on the left) quantification of colocalized PICALM and LAMP1 puncta. Mean + s.d., from 3 independent primary isolates determined in triplicates (3 different cultures per each isolate; >20 cells in each replicate). Statistical significance by Student s t test. NS, non significant.
 and Rab 11 (b) in brain endothelial cells cultured with FAM Aβ42 (250 nm) for 90 s and 5 min, respectively. Dapi, nuclear staining (blue).")
 and Rab5 (green) (c), Rab7 (d) and Rab11 (e) in primary human brain endothelial cells cultured with vehicle (")
11 Supplementary Figure 11 Association of Aβ42 with Rab5 and Rab11 and low colocalization between PICALM and Rab GTPases in the absence of Aβ in primary human endothelial cell cultures. a b, Association of Aβ42 with Rab 5 (a) and Rab 11 (b) in brain endothelial cells cultured with FAM Aβ42 (250 nm) for 90 s and 5 min, respectively. Dapi, nuclear staining (blue). Insets: high magnification depicting colocalization. c e, Control experiment showing barely detectable colocalizations between PICALM (red) and Rab5 (green) (c), Rab7 (d) and Rab11 (e) in primary human brain endothelial cells cultured with vehicle ( Aβ) for 2 and 5 min, respectively. Dapi, nuclear staining (blue). Insets: high magnification depicting colocalization. Bar: 10 µm. Mean + s.d., from 3 independent primary isolates determined in triplicate (3 different cultures per isolate; >20 cells analyzed in each replicate).
 and reduced expression of PICALM (red).")
 showing normal TEER values in in vitro BBB monolayers from AD patients compared to controls. Mean + s.e.m. for 8 isolates per group studied in triplicate.")
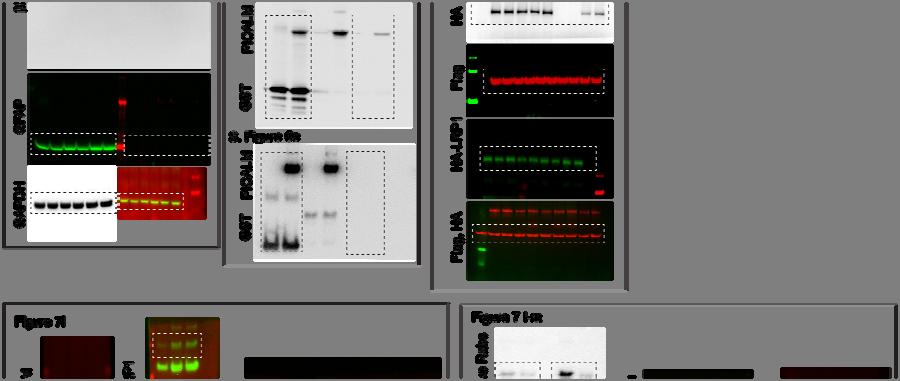
12 Supplementary Figure 12 Reduced PICALM expression in brain endothelial monolayers derived from Alzheimer s disease patients. a, A primary AD brain endothelial monolayer showing ZO 1 tight junction protein (green) and reduced expression of PICALM (red). A representative image was taken from 6 independent primary isolates determined in triplicate (3 different cultures for each isolate; >20 cells in each replicate). b, Transendothelial electrical resistance (TEER) showing normal TEER values in in vitro BBB monolayers from AD patients compared to controls. Mean + s.e.m. for 8 isolates per group studied in triplicate. c, Permeability of an in vitro BBB model derived from AD cells compared to controls to 40 kda and 2,000 kda FITC Dextran. Mean + s.e.m. from 3 isolates per group in triplicate. d, A representative western blot analysis showing the expression of Flag PICLAM, LRP1 minigene (mlrp1), and Flag PICLAM+mLRP1 in the BBB AD monolayers after adenoviral expression of PICALM and mlrp1. Tubulin is used as loading control. Immunoblot is representative of 3 independent experiments. For each experiment we used at least 3 different samples for each condition.


13 Supplementary Figure 13 Diagram The diagram showing PICALM regulates PICALM/clathrin dependent internalization of Aβ LRP1 complex and guides Aβ trafficking to Rab5 and Rab11 leading to Aβ endothelial transcytosis and clearance across the BBB.

14 Supplementary Figure 14 Original western blots.
15 Supplementary Table 1. Clinical and neuropathological characteristics of controls and Alzheimer s disease (AD) patients participating in this study. 1a. Patients participating in histological analysis. Patient Number Diagnosis Age Gender PMI (hr) Vascular Risk Factors Braak CERAD CDR MMSE Disease Duration Source A load (%) SD (%) PICALM/ lectin (%) SD (%) 845 Control 90 F 5 Hypertension; Atherosclerosis I Negative 0 30 N/A USC ADRC Control 95 F 9 Hypertension II Negative 1 Unknown N/A USC ADRC Control 87 F 7 Hypertension 0 Negative 0 30 N/A USC ADRC Control 74 F 10 None I Negative 0 18 N/A USC ADRC Control 84 M 3 None I II Negative 0 28 N/A USC ADRC Control 82 M 9 None 0 Negative 0 28 N/A USC ADRC Control 93 M 3.75 None I Sparse Unknown 18 N/A USC ADRC Control 70 M 10.5 Atherosclerosis I Negative 0 Unknown N/A USC ADRC Control 63 M 3.5 Hypertension 0 Negative 0 Unknown N/A USC ADRC Control 84 M 5 Hypertension III Negative Unknown 26 N/A Rush ADRC Control 85 F 6 Hypertension III Sparse Unknown 26 N/A Rush ADRC Control 83 F 1 None I Negative Unknown 26 N/A Rush ADRC Control 88 M 8.5 Hypertension II Negative Unknown 27 N/A Rush ADRC Control 77 M 8 Hypertension III Negative Unknown 28 N/A Rush ADRC Control 90 M 2.5 None II Negative Unknown 29 N/A Rush ADRC Control 77 M 4.5 None II Negative Unknown 27 N/A Rush ADRC Control 88 F 5 Hypertension I Negative Unknown 27 N/A Rush ADRC Control 82 M 8.5 None I Negative Unknown 28 N/A Rush ADRC Control 78 M 9.75 None I Sparse Unknown 29 N/A Rush ADRC Control 85 F 5.75 None II Negative Unknown 30 N/A Rush ADRC AD 99 F 12.3 Atherosclerosis III Moderate 2 Unknown 7 years USC ADRC AD 83 F AD 96 F 5 V VI Moderate years USC ADRC V Frequent 3 Unknown 9 years USC ADRC AD 78 F 7 None V Moderate 2 Unknown 8 years USC ADRC AD 92 F 4.25 V VI Frequent 2 Unknown 10 years USC ADRC
16 Patient Number Diagnosis Age Gender PMI (hr) 728 AD 86 M 10 Vascular Risk Factors Braak CERAD CDR MMSE Disease Duration Source A load (%) SD (%) PICALM/ lectin (%) IV Moderate 1 Unknown Unknown USC ADRC AD 81 M 8 Atherosclerosis III Moderate years USC ADRC AD 71 M 5.5 None V VI Moderate years USC ADRC AD 76 M 5 V Moderate years USC ADRC AD 68 F 9.75 Hypertension III Moderate years USC ADRC AD 91 F 3.25 Atherosclerosis V VI Frequent years USC ADRC AD 87 M 5.5 V VI Frequent 2 19 Unknown USC ADRC AD 95 F 6 Atherosclerosis V Frequent 2 Unknown 17 years USC ADRC AD 87 F 5.5 V Moderate years USC ADRC AD 51 F 6 None V VI Frequent Unknown Unknown 1 month USC ADRC AD 74 M 9 V Frequent 3 Unknown 15 years USC ADRC AD 87 F 4.75 Atherosclerosis V Frequent months USC ADRC AD 98 M 6 Hypertension, V VI Frequent years USC ADRC AD 100 F 4.75 Atherosclerosis IV Moderate 1 11 Unknown USC ADRC AD 88 M 7 Atherosclerosis III Moderate 1 19 Unknown USC ADRC AD 86 F 7.5 V Frequent 3 Unknown Unknown USC ADRC AD 94 F 5 Hypertension IV Moderate Unknown 11 2 years RUSH ADRC AD 88 M 18 Hypertension III Moderate Unknown 12 2 years RUSH ADRC AD 98 M 4 Hypertension III Moderate Unknown 18 1 years RUSH ADRC AD 86 F 21 Hypertension III Frequent Unknown 15 3 years RUSH ADRC AD 101 F 8.75 Hypertension IV Moderate Unknown 19 2 years RUSH ADRC AD 94 M 6 Hypertension IV Moderate Unknown 24 2 years RUSH ADRC AD 84 F 13 Hypertension III Moderate Unknown 22 6 months RUSH ADRC AD 92 F 4.25 None III Moderate Unknown Unknown 2 years RUSH ADRC AD 95 M 3.25 Hypertension IV Moderate Unknown 20 3 years RUSH ADRC SD (%)
17 1b. Patients participating in a rapid brain autopsy study to establish brain endothelial cell (BEC) cultures. Patient Number Diagnosis Age Gender PMI (hr) Vascular Risk Factors Braak CERAD CDR Source 17 Control 59 F 4.5 None 0 Negative 0 Rochester ADRC 29 Control 96 F 6 None 0 Negative 0 Rochester ADRC 38 Control 58 F 5.5 None 0 Negative 0 Rochester ADRC 39 Control 72 M 4.3 Atherosclerosis Myocardial Infarction 0 I Sparse 0 Rochester ADRC 40 Control 73 M 4.7 Atherosclerosis I II Negative 0 Rochester ADRC 804 Control 82 M 9 None 0 None 0 USC ADRC 845 Control 90 F 5 Hypertension Atherosclerosis I Sparse 0 USC ADRC 877 Control 93 M 3.75 None I Sparse Unknown USC ADRC 37 AD 80 F 3.0 Atherosclerosis V VI Frequent 3 Rochester ADRC 41 AD 80 F 3.1 None V VI Frequent 2 Rochester ADRC 42 AD 80 F 5.2 None III V Moderate 2 Rochester ADRC 43 AD 77 M 2.8 None V VI Frequent 2 Rochester ADRC 49 AD 78 M 5.0 Atherosclerosis V VI Frequent 2 Rochester ADRC 799 AD 95 F 6 Atherosclerosis V Frequent 2 USC ADRC 854 AD 87 F 5.5 Atherosclerosis V Moderate 2 USC ADRC 888 AD 51 F 6 None V VI Frequent Unknown USC ADRC
Supplementary Figure 1. Western blot of hippocampal lysates from WT and Adcy1 KO mice demonstrates the specificity of the ADCY1 antibody.
 ADCY1 13 kda β-actin 45 kda Supplementary Figure 1. Western blot of hippocampal lysates from and mice demonstrates the specificity of the ADCY1 antibody. a DHPG perk1/2 ERK1/2 Relative level min 1.6 *
Supplementary Figure 1.TRIM33 binds β-catenin in the nucleus. a & b, Co-IP of endogenous TRIM33 with β-catenin in HT-29 cells (a) and HEK 293T cells
 and HEK 293T cells") Supplementary Figure 1.TRIM33 binds β-catenin in the nucleus. a & b, Co-IP of endogenous TRIM33 with β-catenin in HT-29 cells (a) and HEK 293T cells (b). TRIM33 was immunoprecipitated, and the amount of
Supplementary Figure 1.TRIM33 binds β-catenin in the nucleus. a & b, Co-IP of endogenous TRIM33 with β-catenin in HT-29 cells (a) and HEK 293T cells (b). TRIM33 was immunoprecipitated, and the amount of
Supplementary Materials for
 www.sciencetranslationalmedicine.org/cgi/content/full/4/117/117ra8/dc1 Supplementary Materials for Notch4 Normalization Reduces Blood Vessel Size in Arteriovenous Malformations Patrick A. Murphy, Tyson
Supplementary Figure 1. Spatial distribution of LRP5 and β-catenin in intact cardiomyocytes. (a) and (b) Immunofluorescence staining of endogenous
 and (b) Immunofluorescence staining of endogenous") Supplementary Figure 1. Spatial distribution of LRP5 and β-catenin in intact cardiomyocytes. (a) and (b) Immunofluorescence staining of endogenous LRP5 in intact adult mouse ventricular myocytes (AMVMs)
Supplementary Figure 1. Spatial distribution of LRP5 and β-catenin in intact cardiomyocytes. (a) and (b) Immunofluorescence staining of endogenous LRP5 in intact adult mouse ventricular myocytes (AMVMs)
293T cells were transfected with indicated expression vectors and the whole-cell extracts were subjected
 SUPPLEMENTARY INFORMATION Supplementary Figure 1. Formation of a complex between Slo1 and CRL4A CRBN E3 ligase. (a) HEK 293T cells were transfected with indicated expression vectors and the whole-cell
Supplementary Figure 1. Normal T lymphocyte populations in Dapk -/- mice. (a) Normal thymic development in Dapk -/- mice. Thymocytes from WT and Dapk
 Normal thymic development in Dapk -/- mice. Thymocytes from WT and Dapk") Supplementary Figure 1. Normal T lymphocyte populations in Dapk -/- mice. (a) Normal thymic development in Dapk -/- mice. Thymocytes from WT and Dapk -/- mice were stained for expression of CD4 and CD8.
Supplementary Figure 1. Normal T lymphocyte populations in Dapk -/- mice. (a) Normal thymic development in Dapk -/- mice. Thymocytes from WT and Dapk -/- mice were stained for expression of CD4 and CD8.
Nature Neuroscience: doi: /nn Supplementary Figure 1
 Supplementary Figure 1 Quantification of myelin fragments in the aging brain (a) Electron microscopy on corpus callosum is shown for a 18-month-old wild type mice. Myelin fragments (arrows) were detected
Supplementary fig. 1. Crystals induce necroptosis does not involve caspases, TNF receptor or NLRP3. A. Mouse tubular epithelial cells were pretreated
 Supplementary fig. 1. Crystals induce necroptosis does not involve caspases, TNF receptor or NLRP3. A. Mouse tubular epithelial cells were pretreated with zvad-fmk (10µM) and exposed to calcium oxalate
Supplementary Figure 1
 Supplementary Figure 1 AAV-GFP injection in the MEC of the mouse brain C57Bl/6 mice at 4 months of age were injected with AAV-GFP into the MEC and sacrificed at 7 days post injection (dpi). (a) Brains
(a) Significant biological processes (upper panel) and disease biomarkers (lower panel)
 Significant biological processes (upper panel) and disease biomarkers (lower panel)") Supplementary Figure 1. Functional enrichment analyses of secretomic proteins. (a) Significant biological processes (upper panel) and disease biomarkers (lower panel) 2 involved by hrab37-mediated secretory
Supplementary Figure 1. Functional enrichment analyses of secretomic proteins. (a) Significant biological processes (upper panel) and disease biomarkers (lower panel) 2 involved by hrab37-mediated secretory
Downregulation of the small GTPase SAR1A: a key event underlying alcohol-induced Golgi fragmentation in hepatocytes
 Downregulation of the small GTPase SAR1A: a key event underlying alcohol-induced Golgi fragmentation in hepatocytes Armen Petrosyan 1*, Pi-Wan Cheng 1,3, Dahn L. Clemens 2,3 & Carol A. Casey 2,3 1 Department
Figure S1. Reduction in glomerular mir-146a levels correlate with progression to higher albuminuria in diabetic patients.
 Supplementary Materials Supplementary Figures Figure S1. Reduction in glomerular mir-146a levels correlate with progression to higher albuminuria in diabetic patients. Figure S2. Expression level of podocyte
Rescue of mutant rhodopsin traffic by metformin-induced AMPK activation accelerates photoreceptor degeneration Athanasiou et al
 Supplementary Material Rescue of mutant rhodopsin traffic by metformin-induced AMPK activation accelerates photoreceptor degeneration Athanasiou et al Supplementary Figure 1. AICAR improves P23H rod opsin
SUPPLEMENTARY INFORMATION
 DOI: 10.1038/ncb2566 Figure S1 CDKL5 protein expression pattern and localization in mouse brain. (a) Multiple-tissue western blot from a postnatal day (P) 21 mouse probed with an antibody against CDKL5.
Supplementary Figure 1: Co-localization of reconstituted L-PTC and dendritic cells
 a CD11c Na + K + ATPase Na + K + ATPase CD11c x-y CD11c Na + K + ATPase Na + K + ATPase CD11c x-z c b x-y view BoNT NAPs CD11c BoNT CD11c NAPs BoNT NAPs CD11c 90 x-z view Apical Basolateral Supplementary
Supplementary Figure 1. Confocal immunofluorescence showing mitochondrial translocation of Drp1. Cardiomyocytes treated with H 2 O 2 were prestained
 Supplementary Figure 1. Confocal immunofluorescence showing mitochondrial translocation of Drp1. Cardiomyocytes treated with H 2 O 2 were prestained with MitoTracker (red), then were immunostained with
IP: anti-gfp VPS29-GFP. IP: anti-vps26. IP: anti-gfp - + +
 FAM21 Strump. WASH1 IP: anti- 1 2 3 4 5 6 FAM21 Strump. FKBP IP: anti-gfp VPS29- GFP GFP-FAM21 tail H H/P P H H/P P c FAM21 FKBP Strump. VPS29-GFP IP: anti-gfp 1 2 3 FKBP VPS VPS VPS VPS29 1 = VPS29-GFP
Nature Structural and Molecular Biology: doi: /nsmb Supplementary Figure 1
 Supplementary Figure 1 Mutational analysis of the SA2-Scc1 interaction in vitro and in human cells. (a) Autoradiograph (top) and Coomassie stained gel (bottom) of 35 S-labeled Myc-SA2 proteins (input)
SUPPLEMENTARY INFORMATION
 DOI: 10.1038/ncb2988 Supplementary Figure 1 Kif7 L130P encodes a stable protein that does not localize to cilia tips. (a) Immunoblot with KIF7 antibody in cell lysates of wild-type, Kif7 L130P and Kif7
Project report October 2012 March 2013 CRF fellow: Principal Investigator: Project title:
 Project report October 2012 March 2013 CRF fellow: Gennaro Napolitano Principal Investigator: Sergio Daniel Catz Project title: Small molecule regulators of vesicular trafficking to enhance lysosomal exocytosis
LDLR-related protein 10 (LRP10) regulates amyloid precursor protein (APP) trafficking and processing: evidence for a role in Alzheimer s disease
 regulates amyloid precursor protein (APP) trafficking and processing: evidence for a role in Alzheimer s disease") Brodeur et al. Molecular Neurodegeneration 2012, 7:31 RESEARCH ARTICLE Open Access LDLR-related protein 10 (LRP10) regulates amyloid precursor protein (APP) trafficking and processing: evidence for a role
Brodeur et al. Molecular Neurodegeneration 2012, 7:31 RESEARCH ARTICLE Open Access LDLR-related protein 10 (LRP10) regulates amyloid precursor protein (APP) trafficking and processing: evidence for a role
(a-r) Whole mount X-gal staining on a developmental time-course of hearts from
 Whole mount X-gal staining on a developmental time-course of hearts from") 1 2 3 4 5 6 7 8 9 10 11 12 13 14 15 16 Supplementary Figure 1 (a-r) Whole mount X-gal staining on a developmental time-course of hearts from Sema3d +/- ;Ephb4 LacZ/+ and Sema3d -/- ;Ephb4 LacZ/+ embryos.
1 2 3 4 5 6 7 8 9 10 11 12 13 14 15 16 Supplementary Figure 1 (a-r) Whole mount X-gal staining on a developmental time-course of hearts from Sema3d +/- ;Ephb4 LacZ/+ and Sema3d -/- ;Ephb4 LacZ/+ embryos.
Supplementary Fig. 1
 PDK1-dependent quenching of TACE shedding activity in prion and Alzheimer s diseases Mathéa Pietri, Caroline Dakowski, Samia Hannaoui, Aurélie Alleaume-Butaux, Julia Hernandez-Rapp, Audrey Ragagnin, Sophie
Supplementary Figure 1. Characterization of human carotid plaques. (a) Flash-frozen human plaques were separated into vulnerable (V) and stable (S),
 Flash-frozen human plaques were separated into vulnerable (V) and stable (S),") Supplementary Figure 1. Characterization of human carotid plaques. (a) Flash-frozen human plaques were separated into vulnerable (V) and stable (S), regions which were then quantified for mean fluorescence
Supplementary Figure 1. Characterization of human carotid plaques. (a) Flash-frozen human plaques were separated into vulnerable (V) and stable (S), regions which were then quantified for mean fluorescence
Supplementary Figure 1. mir124 does not change neuron morphology and synaptic
 Supplementary Figure 1. mir124 does not change neuron morphology and synaptic density. Hippocampal neurons were transfected with mir124 (containing DsRed) or DsRed as a control. 2 d after transfection,
Control GST GST-RAP. α2-mg. 170 kda. b-actin. 42 kda LRP-1
 % of max Supplementary Figure 1 Control GST GST-RP 17 kda α2-mg 42 kda b-actin Gate: CD11c+ (DCs) Gate: F4/8+ (Mfs) IgG Cd11cCre + Lrp1 fl/fl LRP-1 Supplementary figure 1. () MDCs were pretreated with
SUPPLEMENTARY INFORMATION
 doi:10.1038/nature12652 Supplementary Figure 1. PRDM16 interacts with endogenous EHMT1 in brown adipocytes. Immunoprecipitation of PRDM16 complex by flag antibody (M2) followed by Western blot analysis
SUPPLEMENTARY INFORMATION
 Supplementary Figure 1. Behavioural effects of ketamine in non-stressed and stressed mice. Naive C57BL/6 adult male mice (n=10/group) were given a single dose of saline vehicle or ketamine (3.0 mg/kg,
SUPPLEMENTARY INFORMATION
 DOI:.38/ncb3399 a b c d FSP DAPI 5mm mm 5mm 5mm e Correspond to melanoma in-situ Figure a DCT FSP- f MITF mm mm MlanaA melanoma in-situ DCT 5mm FSP- mm mm mm mm mm g melanoma in-situ MITF MlanaA mm mm
(a) Schematic diagram of the FS mutation of UVRAG in exon 8 containing the highly instable
 Schematic diagram of the FS mutation of UVRAG in exon 8 containing the highly instable") Supplementary Figure 1. Frameshift (FS) mutation in UVRAG. (a) Schematic diagram of the FS mutation of UVRAG in exon 8 containing the highly instable A 10 DNA repeat, generating a premature stop codon
Supplementary Figure 1. Frameshift (FS) mutation in UVRAG. (a) Schematic diagram of the FS mutation of UVRAG in exon 8 containing the highly instable A 10 DNA repeat, generating a premature stop codon
SUPPLEMENTARY FIGURES
 SUPPLEMENTARY FIGURES Supplementary Figure 1. (A) Left, western blot analysis of ISGylated proteins in Jurkat T cells treated with 1000U ml -1 IFN for 16h (IFN) or left untreated (CONT); right, western
Figure S1. (A) SDS-PAGE separation of GST-fusion proteins purified from E.coli BL21 strain is shown. An equal amount of GST-tag control, LRRK2 LRR
 SDS-PAGE separation of GST-fusion proteins purified from E.coli BL21 strain is shown. An equal amount of GST-tag control, LRRK2 LRR") Figure S1. (A) SDS-PAGE separation of GST-fusion proteins purified from E.coli BL21 strain is shown. An equal amount of GST-tag control, LRRK2 LRR and LRRK2 WD40 GST fusion proteins (5 µg) were loaded
Figure S1. (A) SDS-PAGE separation of GST-fusion proteins purified from E.coli BL21 strain is shown. An equal amount of GST-tag control, LRRK2 LRR and LRRK2 WD40 GST fusion proteins (5 µg) were loaded
Figure S1. Western blot analysis of clathrin RNA interference in human DCs Human immature DCs were transfected with 100 nm Clathrin SMARTpool or
 Figure S1. Western blot analysis of clathrin RNA interference in human DCs Human immature DCs were transfected with 100 nm Clathrin SMARTpool or control nontargeting sirnas. At 90 hr after transfection,
Supplementary information. The Light Intermediate Chain 2 Subpopulation of Dynein Regulates Mitotic. Spindle Orientation
 Supplementary information The Light Intermediate Chain 2 Subpopulation of Dynein Regulates Mitotic Spindle Orientation Running title: Dynein LICs distribute mitotic functions. Sagar Mahale a, d, *, Megha
Supplemental Figure 1. Intracranial transduction of a modified ptomo lentiviral vector in the mouse
 Supplemental figure legends Supplemental Figure 1. Intracranial transduction of a modified ptomo lentiviral vector in the mouse hippocampus targets GFAP-positive but not NeuN-positive cells. (A) Stereotaxic
Supplementary Figure 1. Characterization of NMuMG-ErbB2 and NIC breast cancer cells expressing shrnas targeting LPP. NMuMG-ErbB2 cells (a) and NIC
 and NIC") Supplementary Figure 1. Characterization of NMuMG-ErbB2 and NIC breast cancer cells expressing shrnas targeting LPP. NMuMG-ErbB2 cells (a) and NIC cells (b) were engineered to stably express either a LucA-shRNA
Supplementary Figure 1. Characterization of NMuMG-ErbB2 and NIC breast cancer cells expressing shrnas targeting LPP. NMuMG-ErbB2 cells (a) and NIC cells (b) were engineered to stably express either a LucA-shRNA
* * A3027. A4623 e A3507 A3507 A3507
 a c L A327 d e A37 A37 A37 Supplementary Figure 1. Clinical manifestations of individuals with mutations. (a) Renal ultrasound of right kidney in A327 reveals small renal cysts, loss of corticomedullary
Supplementary Figure 1
 Supplementary Figure 1 a γ-h2ax MDC1 RNF8 FK2 BRCA1 U2OS Cells sgrna-1 ** 60 sgrna 40 20 0 % positive Cells (>5 foci per cell) b ** 80 sgrna sgrna γ-h2ax MDC1 γ-h2ax RNF8 FK2 MDC1 BRCA1 RNF8 FK2 BRCA1
F-actin VWF Vinculin. F-actin. Vinculin VWF
 a F-actin VWF Vinculin b F-actin VWF Vinculin Supplementary Fig. 1. WPBs in HUVECs are located along stress fibers and at focal adhesions. (a) Immunofluorescence images of f-actin (cyan), VWF (yellow),
Supplemental Figure 1. Western blot analysis indicated that MIF was detected in the fractions of
 Supplemental Figure Legends Supplemental Figure 1. Western blot analysis indicated that was detected in the fractions of plasma membrane and cytosol but not in nuclear fraction isolated from Pkd1 null
SUPPLEMENTARY FIGURE LEGENDS
 SUPPLEMENTARY FIGURE LEGENDS Supplemental FIG. 1. Localization of myosin Vb in cultured neurons varies with maturation stage. A and B, localization of myosin Vb in cultured hippocampal neurons. A, in DIV
Supplementary Figure 1
 Supplementary Figure 1 Supplementary Figure 1 Schematic depiction of the tandem Fc GDF15. Supplementary Figure 2 Supplementary Figure 2 Gfral mrna levels in the brains of both wild-type and knockout Gfral
Supplementary Table 1. List of primers used in this study
 Supplementary Table 1. List of primers used in this study Gene Forward primer Reverse primer Rat Met 5 -aggtcgcttcatgcaggt-3 5 -tccggagacacaggatgg-3 Rat Runx1 5 -cctccttgaaccactccact-3 5 -ctggatctgcctggcatc-3
Zhu et al, page 1. Supplementary Figures
 Zhu et al, page 1 Supplementary Figures Supplementary Figure 1: Visual behavior and avoidance behavioral response in EPM trials. (a) Measures of visual behavior that performed the light avoidance behavior
Type of file: PDF Title of file for HTML: Supplementary Information Description: Supplementary Figures
 Type of file: PDF Title of file for HTML: Supplementary Information Description: Supplementary Figures Type of file: MOV Title of file for HTML: Supplementary Movie 1 Description: NLRP3 is moving along
Nature Neuroscience: doi: /nn Supplementary Figure 1. Large-scale calcium imaging in vivo.
 Supplementary Figure 1 Large-scale calcium imaging in vivo. (a) Schematic illustration of the in vivo camera imaging set-up for large-scale calcium imaging. (b) High-magnification two-photon image from
Supplementary Figure S1: Defective heterochromatin repair in HGPS progeroid cells
 Supplementary Figure S1: Defective heterochromatin repair in HGPS progeroid cells Immunofluorescence staining of H3K9me3 and 53BP1 in PH and HGADFN003 (HG003) cells at 24 h after γ-irradiation. Scale bar,
a. b. c. d. e. f. g. h. i. j. k. l. m. n. o. p.
 a. b. c. d. e. f. g. h. i. j. k. l. 2.5 2 1.5 1.5 IL-1β 12 8 6 4 2 IL-1β 9 8 7 6 4 3 3 2.9 IL-1β m. n. o. p. 1.8 1.6 1.4 1.2 1.8.6.4.2 6h LPS 2 15 1 5 6h LPS 2 6h LPS 6 4 3 6h LPS Supplementary Figure
Nature Immunology: doi: /ni.3866
 Nature Immunology: doi:10.1038/ni.3866 Supplementary Figure 1 The effect of TIPE2 on chemotaxis. a, The expression of TIPE2 in dhl-60c, dhl-60t, TIPE2-expressing and 15/16Q-expressing dhl-60t neutrophils
Supplementary Figure S1 Supplementary Figure S2
 Supplementary Figure S A) The blots shown in Figure B were qualified by using Gel-Pro analyzer software (Rockville, MD, USA). The ratio of LC3II/LC3I to actin was then calculated. The data are represented
Supplementary Figure 1. PAQR3 knockdown inhibits SREBP-2 processing in CHO-7 cells CHO-7 cells were transfected with control sirna or a sirna
 Supplementary Figure 1. PAQR3 knockdown inhibits SREBP-2 processing in CHO-7 cells CHO-7 cells were transfected with control sirna or a sirna targeted for hamster PAQR3. At 24 h after the transfection,
Supplemental Materials. STK16 regulates actin dynamics to control Golgi organization and cell cycle
 Supplemental Materials STK16 regulates actin dynamics to control Golgi organization and cell cycle Juanjuan Liu 1,2,3, Xingxing Yang 1,3, Binhua Li 1, Junjun Wang 1,2, Wenchao Wang 1, Jing Liu 1, Qingsong
Supplementary Materials for. c-abl Activation Plays a Role in α-synucleinopathy Induced Neurodegeneration
 Supplementary Materials for c-abl Activation Plays a Role in α-synucleinopathy Induced Neurodegeneration Saurav Brahmachari, Preston Ge, Su Hyun Lee, Donghoon Kim, Senthilkumar S. Karuppagounder, Manoj
Supplementary Figure 1 Maschalidi et al.
 a 1% 5% % 1% 5% % OVAb βgal activity A.U. (x1 4 ) 2 1 5 βgal activity A.U. (x1 4 ) 2 1 BSAb 2 hours 4 hours OVAb BSAb OVAb BSAb,1 1 1 1 SIINFEKL (ng/ml) CFSE b Beads Alexa488 (%) 8 6 4 2 ** ** 1:1 5:1
Swedish mutant APP-based BACE1 binding site peptide reduces APP β-cleavage and cerebral Aβ levels in Alzheimer s mice
 Supplementary Information Swedish mutant APP-based binding site peptide reduces APP β-cleavage and cerebral Aβ levels in Alzheimer s mice Song Li 1,2, *, Huayan Hou 1, *, Takashi Mori 3, Darrell Sawmiller
Boucher et al NCOMMS B
 1 Supplementary Figure 1 (linked to Figure 1). mvegfr1 constitutively internalizes in endothelial cells. (a) Immunoblot of mflt1 from undifferentiated mouse embryonic stem (ES) cells with indicated genotypes;
Supplemental Figure 1. (A) Western blot for the expression of RIPK1 in HK-2 cells treated with or without LPS (1 µg/ml) for indicated times.
 Western blot for the expression of RIPK1 in HK-2 cells treated with or without LPS (1 µg/ml) for indicated times.") Supplemental Figure 1. (A) Western blot for the expression of RIPK1 in HK-2 cells treated with or without LPS (1 µg/ml) for indicated times. Western blots shown are representative results from 3 independent
Supplemental Figure 1. (A) Western blot for the expression of RIPK1 in HK-2 cells treated with or without LPS (1 µg/ml) for indicated times. Western blots shown are representative results from 3 independent
SUPPLEMENTARY INFORMATION
 DOI:.38/ncb2822 a MTC02 FAO cells EEA1 b +/+ MEFs /DAPI -/- MEFs /DAPI -/- MEFs //DAPI c HEK 293 cells WCE N M C P AKT TBC1D7 Lamin A/C EEA1 VDAC d HeLa cells WCE N M C P AKT Lamin A/C EEA1 VDAC Figure
SUPPLEMENTARY LEGENDS...
 TABLE OF CONTENTS SUPPLEMENTARY LEGENDS... 2 11 MOVIE S1... 2 FIGURE S1 LEGEND... 3 FIGURE S2 LEGEND... 4 FIGURE S3 LEGEND... 5 FIGURE S4 LEGEND... 6 FIGURE S5 LEGEND... 7 FIGURE S6 LEGEND... 8 FIGURE
Supplementary Fig. S1. Schematic diagram of minigenome segments.
 open reading frame 1565 (segment 5) 47 (-) 3 5 (+) 76 101 125 149 173 197 221 246 287 open reading frame 890 (segment 8) 60 (-) 3 5 (+) 172 Supplementary Fig. S1. Schematic diagram of minigenome segments.
Figure S1. Sorting nexin 9 (SNX9) specifically binds psmad3 and not psmad 1/5/8. Lysates from AKR-2B cells untreated (-) or stimulated (+) for 45 min
 specifically binds psmad3 and not psmad 1/5/8. Lysates from AKR-2B cells untreated (-) or stimulated (+) for 45 min") Figure S1. Sorting nexin 9 (SNX9) specifically binds psmad3 and not psmad 1/5/8. Lysates from AKR2B cells untreated () or stimulated () for 45 min with 5 ng/ml TGFβ or 10 ng/ml BMP4 were incubated with
Figure S1. Sorting nexin 9 (SNX9) specifically binds psmad3 and not psmad 1/5/8. Lysates from AKR2B cells untreated () or stimulated () for 45 min with 5 ng/ml TGFβ or 10 ng/ml BMP4 were incubated with
Supplementary Figure 1. Prevalence of U539C and G540A nucleotide and E172K amino acid substitutions among H9N2 viruses. Full-length H9N2 NS
 Supplementary Figure 1. Prevalence of U539C and G540A nucleotide and E172K amino acid substitutions among H9N2 viruses. Full-length H9N2 NS nucleotide sequences (a, b) or amino acid sequences (c) from
Supplementary Figure 1. EC-specific Deletion of Snail1 Does Not Affect EC Apoptosis. (a,b) Cryo-sections of WT (a) and Snail1 LOF (b) embryos at
 Cryo-sections of WT (a) and Snail1 LOF (b) embryos at") Supplementary Figure 1. EC-specific Deletion of Snail1 Does Not Affect EC Apoptosis. (a,b) Cryo-sections of WT (a) and Snail1 LOF (b) embryos at E10.5 were double-stained for TUNEL (red) and PECAM-1 (green).
Supplementary Figure 1. EC-specific Deletion of Snail1 Does Not Affect EC Apoptosis. (a,b) Cryo-sections of WT (a) and Snail1 LOF (b) embryos at E10.5 were double-stained for TUNEL (red) and PECAM-1 (green).
Supplementary Fig. 1. GPRC5A post-transcriptionally down-regulates EGFR expression. (a) Plot of the changes in steady state mrna levels versus
 Plot of the changes in steady state mrna levels versus") Supplementary Fig. 1. GPRC5A post-transcriptionally down-regulates EGFR expression. (a) Plot of the changes in steady state mrna levels versus changes in corresponding proteins between wild type and Gprc5a-/-
Supplementary Fig. 1. GPRC5A post-transcriptionally down-regulates EGFR expression. (a) Plot of the changes in steady state mrna levels versus changes in corresponding proteins between wild type and Gprc5a-/-
Supplementary Figure 1. The CagA-dependent wound healing or transwell migration of gastric cancer cell. AGS cells transfected with vector control or
 Supplementary Figure 1. The CagA-dependent wound healing or transwell migration of gastric cancer cell. AGS cells transfected with vector control or 3xflag-CagA expression vector were wounded using a pipette
Supplementary Materials for
 www.sciencesignaling.org/cgi/content/full/8/385/ra70/dc1 Supplementary Materials for The interaction of heparan sulfate proteoglycans with endothelial transglutaminase-2 limits VEGF 165 -induced angiogenesis
Nature Neuroscience: doi: /nn Supplementary Figure 1. Diverse anorexigenic signals induce c-fos expression in CEl PKC-δ + neurons
 Supplementary Figure 1 Diverse anorexigenic signals induce c-fos expression in CEl PKC-δ + neurons a-c. Quantification of CEl c-fos expression in mice intraperitoneal injected with anorexigenic drugs (a),
SUPPLEMENTARY INFORMATION
 doi: 10.1038/nature06994 A phosphatase cascade by which rewarding stimuli control nucleosomal response A. Stipanovich*, E. Valjent*, M. Matamales*, A. Nishi, J.H. Ahn, M. Maroteaux, J. Bertran-Gonzalez,
Supplementary Figure 1 Induction of cellular senescence and isolation of exosome. a to c, Pre-senescent primary normal human diploid fibroblasts
 Supplementary Figure 1 Induction of cellular senescence and isolation of exosome. a to c, Pre-senescent primary normal human diploid fibroblasts (TIG-3 cells) were rendered senescent by either serial passage
Supplemental Information. Menin Deficiency Leads to Depressive-like. Behaviors in Mice by Modulating. Astrocyte-Mediated Neuroinflammation
 Neuron, Volume 100 Supplemental Information Menin Deficiency Leads to Depressive-like Behaviors in Mice by Modulating Astrocyte-Mediated Neuroinflammation Lige Leng, Kai Zhuang, Zeyue Liu, Changquan Huang,
Supplementary figure 1
 Supplementary figure 1 (A) Quantitative analysis of F-actin signal intensity in NIH3T3 cells treated with PTD4-myc- RBD. NIH3T3 cells were treated with PTD4-myc-RBD as described. Please note the increase
Supplementary Materials for
 www.sciencesignaling.org/cgi/content/full/6/283/ra57/dc1 Supplementary Materials for JNK3 Couples the Neuronal Stress Response to Inhibition of Secretory Trafficking Guang Yang,* Xun Zhou, Jingyan Zhu,
Nature Immunology doi: /ni.3268
 Supplementary Figure 1 Loss of Mst1 and Mst2 increases susceptibility to bacterial sepsis. (a) H&E staining of colon and kidney sections from wild type and Mst1 -/- Mst2 fl/fl Vav-Cre mice. Scale bar,
Supplementary Figure 1 Expression of Crb3 in mouse sciatic nerve: biochemical analysis (a) Schematic of Crb3 isoforms, ERLI and CLPI, indicating the
 Schematic of Crb3 isoforms, ERLI and CLPI, indicating the") Supplementary Figure 1 Expression of Crb3 in mouse sciatic nerve: biochemical analysis (a) Schematic of Crb3 isoforms, ERLI and CLPI, indicating the location of the transmembrane (TM), FRM binding (FB)
Supplementary Figure 1 Expression of Crb3 in mouse sciatic nerve: biochemical analysis (a) Schematic of Crb3 isoforms, ERLI and CLPI, indicating the location of the transmembrane (TM), FRM binding (FB)
Supplementary Figures
 Supplementary Figures Supplementary Figure 1 Characterization of stable expression of GlucB and sshbira in the CT26 cell line (a) Live cell imaging of stable CT26 cells expressing green fluorescent protein
SUPPLEMENTARY FIGURES
 SUPPLEMENTARY FIGURES Supplementary Figure 1: immunoprecipitation with anti-casr antibody The Casr protein was expressed in transiently transfected HEK cells. Cell lysates from HEK cells were subjected
Supplementary Material
 Supplementary Material accompanying the manuscript Interleukin 37 is a fundamental inhibitor of innate immunity Marcel F Nold, Claudia A Nold-Petry, Jarod A Zepp, Brent E Palmer, Philip Bufler & Charles
04_polarity. The formation of synaptic vesicles
 Brefeldin prevents assembly of the coats required for budding Nocodazole disrupts microtubules Constitutive: coatomer-coated Selected: clathrin-coated The formation of synaptic vesicles Nerve cells (and
Nature Neuroscience: doi: /nn Supplementary Figure 1. Splenic atrophy and leucopenia caused by T3 SCI.
 Supplementary Figure 1 Splenic atrophy and leucopenia caused by T3 SCI. (a) Gross anatomy of representative spleens from control and T3 SCI mice at 28 days post-injury. (b and c) Hematoxylin and eosin
A Normal Exencephaly Craniora- Spina bifida Microcephaly chischisis. Midbrain Forebrain/ Forebrain/ Hindbrain Spinal cord Hindbrain Hindbrain
 A Normal Exencephaly Craniora- Spina bifida Microcephaly chischisis NTD Number of embryos % among NTD Embryos Exencephaly 52 74.3% Craniorachischisis 6 8.6% Spina bifida 5 7.1% Microcephaly 7 1% B Normal
SUPPLEMENTARY INFORMATION
 DOI: 1.138/ncb222 / b. WB anti- WB anti- ulin Mitotic index (%) 14 1 6 2 T (h) 32 48-1 1 2 3 4 6-1 4 16 22 28 3 33 e. 6 4 2 Time (min) 1-6- 11-1 > 1 % cells Figure S1 depletion leads to mitotic defects
SUPPLEMENTARY FIGURE LEGENDS
 SUPPLEMENTARY FIGURE LEGENDS Supplementary Figure 1. Hippocampal sections from new-born Pten+/+ and PtenFV/FV pups were stained with haematoxylin and eosin (H&E) and were imaged at (a) low and (b) high
Live cell imaging of trafficking of the chaperone complex vaccine to the ER. BMDCs were incubated with ER-Tracker Red (1 M) in staining solution for
 in staining solution for") Live cell imaging of trafficking of the chaperone complex vaccine to the ER. BMDCs were incubated with ER-Tracker Red (1 M) in staining solution for 15 min at 37 C and replaced with fresh complete medium.
Live cell imaging of trafficking of the chaperone complex vaccine to the ER. BMDCs were incubated with ER-Tracker Red (1 M) in staining solution for 15 min at 37 C and replaced with fresh complete medium.
Supplemental Figure 1. Quantification of proliferation in thyroid of WT, Ctns -/- and grafted
 Supplemental Figure 1. Quantification of proliferation in thyroid of WT, Ctns -/- and grafted Ctns -/- mice. Cells immunolabeled for the proliferation marker (Ki-67) were counted in sections (n=3 WT, n=4
Supplementary Table 1. Criteria for selection of normal control individuals among healthy volunteers
 Supplementary Table 1. Criteria for selection of normal control individuals among healthy volunteers Medical parameters Cut-off values BMI (kg/m 2 ) 25.0 Waist (cm) (Men and Women) (Men) 85, (Women) 90
Supplementary Materials for
 www.sciencesignaling.org/cgi/content/full/6/278/rs11/dc1 Supplementary Materials for In Vivo Phosphoproteomics Analysis Reveals the Cardiac Targets of β-adrenergic Receptor Signaling Alicia Lundby,* Martin
Pericyte loss influences Alzheimer-like neurodegeneration in mice
 Received 12 Sep 213 Accepted 13 Nov 213 Published 13 Dec 213 DOI: 1.138/ncomms3932 Pericyte loss influences Alzheimer-like neurodegeneration in mice OPEN Abhay P. Sagare 1, *, Robert D. Bell 2, *, Zhen
hexahistidine tagged GRP78 devoid of the KDEL motif (GRP78-His) on SDS-PAGE. This
 on SDS-PAGE. This") SUPPLEMENTAL FIGURE LEGEND Fig. S1. Generation and characterization of. (A) Coomassie staining of soluble hexahistidine tagged GRP78 devoid of the KDEL motif (GRP78-His) on SDS-PAGE. This protein was expressed
SUPPLEMENTAL FIGURE LEGEND Fig. S1. Generation and characterization of. (A) Coomassie staining of soluble hexahistidine tagged GRP78 devoid of the KDEL motif (GRP78-His) on SDS-PAGE. This protein was expressed
Supplementary Figure 1. Microglia do not show signs of classical immune activation following MD a-b. Images showing immunoreactivity for MHCII (a)
") 1 Supplementary Figure 1. Microglia do not show signs of classical immune activation following MD a-b. Images showing immunoreactivity for MHCII (a) and CD45 (b) in fixed sections of binocular visual cortex
1 Supplementary Figure 1. Microglia do not show signs of classical immune activation following MD a-b. Images showing immunoreactivity for MHCII (a) and CD45 (b) in fixed sections of binocular visual cortex
Tumor suppressor Spred2 interaction with LC3 promotes autophagosome maturation and induces autophagy-dependent cell death
 www.impactjournals.com/oncotarget/ Oncotarget, Supplementary Materials 2016 Tumor suppressor Spred2 interaction with LC3 promotes autophagosome maturation and induces autophagy-dependent cell death Supplementary
Schwarz et al. Activity-Dependent Ubiquitination of GluA1 Mediates a Distinct AMPAR Endocytosis
 Schwarz et al Activity-Dependent Ubiquitination of GluA1 Mediates a Distinct AMPAR Endocytosis and Sorting Pathway Supplemental Data Supplemental Fie 1: AMPARs undergo activity-mediated ubiquitination
Expanded View Figures
 PEX13 functions in selective autophagy Ming Y Lee et al Expanded View Figures Figure EV1. PEX13 is required for Sindbis virophagy. A, B Quantification of mcherry-capsid puncta per cell (A) and GFP-LC3
Supplementary Figure 1: si-craf but not si-braf sensitizes tumor cells to radiation.
 Supplementary Figure 1: si-craf but not si-braf sensitizes tumor cells to radiation. (a) Embryonic fibroblasts isolated from wildtype (WT), BRAF -/-, or CRAF -/- mice were irradiated (6 Gy) and DNA damage
Supplementary Figure 1 Binding of PAR1-RIP to (A) anionic liposomes consisting of phosphatidylserine and (B) zwitterionic liposomes composed of
 anionic liposomes consisting of phosphatidylserine and (B) zwitterionic liposomes composed of") Supplementary Figure 1 Binding of PAR1-RIP to (A) anionic liposomes consisting of phosphatidylserine and (B) zwitterionic liposomes composed of phosphatidylserine and phosphatidylcholine. The instrinsic
Supplementary Figure 1 Binding of PAR1-RIP to (A) anionic liposomes consisting of phosphatidylserine and (B) zwitterionic liposomes composed of phosphatidylserine and phosphatidylcholine. The instrinsic
supplementary information
 DOI: 10.1038/ncb2133 Figure S1 Actomyosin organisation in human squamous cell carcinoma. (a) Three examples of actomyosin organisation around the edges of squamous cell carcinoma biopsies are shown. Myosin
Phosphoinositides Regulate Ciliary Protein Trafficking to Modulate Hedgehog Signaling
 Developmental Cell Supplemental Information Phosphoinositides Regulate Ciliary Protein Trafficking to Modulate Hedgehog Signaling Francesc R. Garcia-Gonzalo, Siew Cheng Phua, Elle C. Roberson, Galo Garcia
Supplementary Figure 1. Repression of hepcidin expression in the liver of mice treated with
 Supplementary Figure 1. Repression of hepcidin expression in the liver of mice treated with DMN Immunohistochemistry for hepcidin and H&E staining (left). qrt-pcr assays for hepcidin in the liver (right).
Supplementary Figure 1
 Supplementary Figure 1 The average sigmoid parametric curves of capillary dilation time courses and average time to 50% peak capillary diameter dilation computed from individual capillary responses averaged
Supplementary Figure 1. Validation of astrocytes. Primary astrocytes were
 Supplementary Figure 1. Validation of astrocytes. Primary astrocytes were separated from the glial cultures using a mild trypsinization protocol. Anti-glial fibrillary acidic protein (GFAP) immunofluorescent
Diabetes Mellitus and Dementia. Andrea Shelton & Adena Zadourian
 Diabetes Mellitus and Dementia Andrea Shelton & Adena Zadourian Abstract Diabetes mellitus increases the risk for developing dementia...but there is inconsistency with the subtypes of dementia Diabetes