MODULATION OF EXOCYTOSIS BY ESTROGEN, ALTERED MEMBRANE COMPOSITION, AND OSMOLARITY
|
|
|
- Lynne Fields
- 5 years ago
- Views:
Transcription
1 The Pennsylvania State University The Graduate School The Huck Institutes of the Life Sciences MODULATION OF EXOCYTOSIS BY ESTROGEN, ALTERED MEMBRANE COMPOSITION, AND OSMOLARITY A Thesis in Integrative Biosciences by Marc M. Maxson 2007 Marc M. Maxson Submitted in Partial Fulfillment of the Requirements for the Degree of Doctor of Philosophy May 2007
2 ii COMMITTEE PAGE The thesis of Marc M. Maxson was reviewed and approved* by the following: Andrew G. Ewing Professor of Chemistry J. Lloyd Huck Chair in Natural Sciences Thesis Adviser Chair of Committee Kyung-An Han Associate Professor of Biology Gong Chen Assistant Professor of Biology Nandini Vasudevan Assistant Professor of Biology *Signatures are on file in the Graduate School.
3 iii ABSTRACT The human brain is essentially a composite of billions of parallel information processing units. Each neuron in the brain is a unique entity defined by its local environment and the connections it makes with neighboring neurons. In turn, each of those neighboring neurons is somewhat different from each other due to variation in their connections, intracellular millieu, and local environments. While the notion of a billion unique processors operating in parallel sounds too daunting to fathom, much less describe scientifically, there are certain shared phenomena common to most (and possibly all) neurons. This thesis is concerned with just one of these phenomena: exocytotic plasticity. Plasticity, or the ability of a cell to change in a manner associated with more effective functioning, is part of what makes the brain a powerful learning and memory tool. While plasticity can take many forms, this thesis is just concerned with changes in the exocytosis process, or exocytotic plasticity. Exocytosis is the process by which cells secrete molecules that affect nearby cells and transmit information in the form of chemical messages. These messengers, or neurotransmitters, are packed in small spherical membrane enclosures called vesicles that fuse with the cell membrane to release neurotransmitters in packets. In general, the exocytotic process is quite uniform between various cell types, but certain treatments can cause this process to occur with slower or faster kinetics, and many neuromodulators can cause the number of exocytotic events per unit time to change in frequency. Constant potential amperometry is one method to monitor exocytosis from single cells in culture with sub millisecond time resolution. By placing a carbon fiber against the surface of an excitable cell, electroactive neuromotransmitters released by the cell (such as dopamine) can be quantitatively oxidized to produce a small current that is proportional to the amount secreted.
4 iv Thus amperometry can produce a great deal of information pertinent to questions about exocytosis. It has been used to study regulated exocytosis both in vivo and in isolated cultures. It has revealed fine details about exocytosis before, during, and immediately following vesicle fusion. It can reveal net changes in release as a form of toxological assay or intracellular signal screen. In addition, the amount released from a single fusion event or quantal size can be manipulated by treatments. These manipulations have provided evidence that cells could also manipulate the exocytosis process as a form of exocytotic plasticity. One such manipulation, a collaboration with Yoshiko Niimura, demonstrates the effects of increasing various types of phospholipids on exocytosis. When cells are incubated with phosphatidylcholine (PC), phosphatidylethanolamine (PE), or sphingomyelin (SM), changes in the quantal size and/or vesicle fusion kinetics are observed. PC slowed and PE accelerated the expulsion of neurotransmitter from vesicles. Phosphatidylserine (PS) increased the number of stimulated amperometric peaks. Electron micrographs of PS-treated cells indicated a larger fraction of vesicles docked to the plasma membrane might underlie the enhanced rate of secretion. Together these data suggest that differences in membrane composition affect exocytosis and might be involved in cell function related to plasticity. Plasma membrane tension also appears to affect exocytosis. In collaboration with Leslie Sombers, we examined how reducing tension in the plasma membrane by incubating PC12 cells in hypertonic saline caused the vesicle-to-plasma membrane fusion pore to stabilize, yielding amperometric peaks with a longer and larger foot portion. This foot amplification was more pronounced when cells were loaded with the dopamine precursor, L-(3,4)- dihydroxyphenylalanine (L-DOPA), a treatment that caused vesicular volume and vesicular membrane tension to increase. These data lend support to the hypothesis that differences in
5 v membrane tension between the vesicle and plasma membrane induce a more stable fusion pore conformation. Leslie and I also examined the effect of L-DOPA incubation using amperometry and electron microscopy. Electron microscopic measurements of L-DOPA-treated cells revealed the halo of large dense core vesicles (LDCVs) contained most of the newly loaded DA. Likewise, when exocytosis was measured following treatment in hyperosmotic solutions, most of the loaded DA that leaked through the stabilized fusion pore appeared to derive from the halo. A third, unexpected effect of combining L-DOPA incubation with hyperosmotic saline was to convert a substantial portion (15.3%) of LDCVs in PC12 cells into multicored vesicles. Electron microscopy images of cells treated with an electron-dense endocytosis tracer, cationized ferritin, suggested that the multicored vesicles are formed from the fusion of LCDVs prior to exocytosis. Amperometric measurements supported this conclusion as the distribution of quantal sizes included a bimodal distribution, possibly arising from two pools of vesicles (single and multicore LDCVs). This phenomenon provides evidence that exchange of membranes between LDCVs is possible under some conditions, and this lipid exchange might be involved in regulating vesicle size and composition. Many neuromodulators affect ion channels and regulatory proteins whose action affects the rate of exocytosis. One of these is the hormone estrogen. Estrogen has been identified in the brain at higher concentrations than even the amounts found in reproductive organs. In addition, several estrogen receptors are expressed in brain areas such as the hypothalamus (controls the reproductive system) and the hippocampus (involved in learning and memory) and it seems likely that estrogen acts as both a hormone in the body and a neuromodulator in the brain. Using PC12 and GT1-7 cell cultures to model what might happen when neurons are exposed to
6 vi estrogen, it appears that estrogen (specifically 17-β-estradiol) can suppress exocytosis by blocking voltage-gated calcium ion channels, inhibiting calcium release from ryanodinereceptor-regulated intracellular calcium stores, and even promote exocytosis by opening voltagegated calcium ion channels. The timing of the exposure to estrogen and subsequent observation period seems to be important in determining whether the effect of estrogen appears as an increase or decrease exocytosis. Estrogen consistently prevents other stimuli from promoting exocytosis, but at the same time causes exocytosis during and shortly after it is applied to cells. While this dual action complicates interpretation of the results, it has been confirmed using changes in cytosolic calcium as an alternate measurement. Additional work is ongoing to explain how estrogen is modulating exocytosis and ultimately understand what purpose this dual action might serve in the brain.
7 vii TABLE OF CONTENTS List of Figures... xii List of Tables... xiv Acknowledgments...xv Dedication... xvii Chapter 1. Use of amperometry to study neuron-like behavior in model Systems...1 Introduction...1 Cell types...3 PC12 cells and large dense core vesicles...4 Primary neuronal cultures and small clear synaptic vesicles...4 Peptide detection...5 In vivo neuronal data...6 Performing the experiment...6 Electrodes...6 Loading messenger into vesicles...11 An overview of secretogogues...12 Detection of low-current signals...13 Quantitative analysis of exocytosis events...14 Running the experiment...17 Interpretation of amperometry data...18 Quantal size...18 Correlation of amperometric feet and release via the fusion pore...24 Vesicle pools...27 Research goals...28 Nontranscriptional, neuromodulatory effects of estrogen...29 Exocytotic plasticity mediated by membrane phospholipids...34 Vesicle Fusion kinetics altered by high osmolarity and L-DOPA treatment...34 References...35 Chapter 2. Estradiol inhibition of exocytosis in PC12 cells: decoupling of ryanodine receptors from membrane ion channels...42 Introduction...42
8 viii Materials and methods...44 Solutions...44 Cell culture...45 Carbon fiber amperometry...45 Data acquisition and analysis...47 Intracellular calcium imaging...48 Results...49 Estradiol inhibits depolarization-evoked exocytosis...49 Estradiol inhibits calcium-induced calcium release (CICR)...53 Estradiol inhibits store-operated calcium entry (SOCE)...57 Discussion...62 Acknowledgements... References...66 Chapter 3. GPR30 And ER-β: Analysis of estrogen-dependent calcium flux in PC12 and GT1-7 and its coupling to secretion...70 Introduction...70 Materials and methods...73 Materials...73 Cell culture...74 Calcium imaging...74 Amperometry...75 Real-time PCR...77 Statistics...77 Results...77 E2-evoked exocytosis is coupled to cytosolic calcium in PC12 cells...77 E2-induced calcium rise varies with different ER agonist drugs and cell types...81 Estrogen receptor mrna levels in PC12 and GT1-7 cells...86 VGCCs are required for the E2-induced calcium flux observed in both PC12 and GT1-7 cells...87 Discussion...91 Acknowledgements...93 References...94
9 ix Chapter 4. Consolidating the inhibitory and excitatory effects of estrogen: A synchronization hypothesis...97 Introduction...97 Methods...98 Results...98 Similarities in the dose-dependent effects of E Correlation between amperometric burst/calcium mobilization response and subsequent inhibition...99 Discussion Evidence for E2 as neuromodulator Acknowledgements References Chapter 5. Phospholipid mediated plasticity in exocytosis observed in PC12 cells Introduction Materials and methods Cell culture Amperometry experiments Data acquision and analysis Transmission electron microscopy Statistical analysis Results PS increases the frequency of vesicle fusion events PE, SM, and PC affect the kinetics of exocytosis PC reduces quantal size and slows vesicle fusion Discussion Added PS might increase exocytosis frequency by protein-lipid interactions Added PC decreases quantal size while increasing vesicular volume Adding PE leads to faster individual release events Added SM appears to slow vesicle opening Implications Acknowledgements References...128
10 x Chapter 6. High osmolarity and L-DOPA augment fusion pore release in PC12 cells..131 Introduction Methods Cell culture Reagents and solutions Electrode preparation and experimental setup Data acquisition and data analysis Amperometry experiments Statistical analysis Results Amperometric release via the fusion pore under hypertonic conditions Foot frequency as a function of osmolarity Foot flux as a function of osmolarity Hypertonic treatment increases percent of contents released in the foot Discussion Effects of osmolarity on neurotransmitter release through the fusion pore Mechanisms regulating release via the fusion pore under high osmolarity conditions Acknowledgements References Chapter 7. L-DOPA is preferentially stored in the halo of portion of PC12 large dense core vesicles Introduction Methods Cell culture Electrode preparation and experimental setup Data acquisition and analysis Amperometry experiments Electron microscopic analysis Reagents and solutions Statistical analysis Results Experimental protocol and example amperometric traces The effects of extracellular osmotic changes and L-DOPA on vesicular
11 xi catecholamine release The effects of extracellular osmotic changes and L-DOPA on vesicular volume Estimating vesicular catecholamine concentration Discussion Acknowledgements References Chapter 8. Multicore vesicles: hyperosmolarity and L-DOPA induce fusion of vesicles with each other Introduction Methods Results Discussion Acknowledgements References Chapter 9. Conclusions and future directions Conclusions Future Directions Direct endoplasmic reticulum calcium imaging with cameleons Mitochondrial calcium imaging References Appendix. MathCad programs used in rapid parallel calculations Fluorescence tool: Background subtraction and normalization Amperometric peak alignment tool Max Power: A program to identify peaks within two windows and calculate differences in peak height Vesicular volume corrections...211
12 xii LIST OF FIGURES Figure 1.1. Preparation and use of carbon fiber electrodes for amperometric detection of catecholamines...8 Figure 1.2. A generic amperometric trace showing spike characteristics...15 Figure 1.3. Quantal sizes differ in different cell types...20 Figure 1.4. Demonstration of simple (top trace) and complex (bottom trace) amperometric events...23 Figure 2.1. Dose-dependency of estradiol-mediated inhibition of exocytosis...50 Figure 2.2. Comparisons of the change in exocytosis under conditions of varied E2 and inhibitors of calcium entry/release...52 Figure 2.3. E2 does not block calcium influx via N-type VGCCs...56 Figure 2.4. E2 does not suppress caffeine-evoked calcium store release...59 Figure 2.5. A biphasic response is observed in the inhibition of SOCE by E Figure 3.1. Structures of selected estrogen receptor agonists...73 Figure 3.2. E2-evoked exocytosis in PC12 cells...80 Figure 3.3. Calcium responses to ER agonists...85 Figure 3.4. Relative mrna levels of ER-α, ER-β, and GPR30 vary between GT1-7 and PC12 cells, as measured by RT-PCR...88 Figure 3.5. Effect of inhibitors for VGCCs and the removal of extracellular calcium on E2- evoked calcium rise...90 Figure 4.1. Biphasic responses to E2 observed for both inhibition of stimulated exocytosis and direct-e2-evoked exocytosis...99 Figure 4.2. Examples of K + -stimulated and E2-evoked exocytosis from four cells treated with 10 nm E Figure 4.3. Calcium responses to K + -stimulation in PC12 and GT1-7 cells Figure 4.4. Schematic of how peak differences in Figure 4.5 were calculated...104
13 xiii Figure 4.5. Percent difference in calcium peak amplitudes for E2 treated and control (untreated) PC12 and GT1-7 cells Figure 5.1. Representative amperometric traces from (a) untreated control and (b) PStreated cells show that PS treatment results in greater spike frequency Figure 5.2. The fraction of morphologically docked vesicles increases after depolarization in PS-treated cells (PS-stim), but not in unstimulated (PS) cells Figure 5.3. Representative amperometric current transients from same-day control (light gray traces) and phospholipid treated (black traces) cells following treatment with five different phospholipids Figure 5.4. Incubation with PE, SM, or PC changes the kinetics of invidual exocytosis events Figure 5.5. Electron micrographs of vesicles in (a) control and (b) PC enriched cells..121 Figure 6.1. Representative amperometric data from individual PC12 cells Figure 6.2. Summary of amperometric foot characteristics Figure 6.3. Model of exocytotic vesicle fusion occurring from PC12 cells stimulated in either isotonic or hypertonic extracellular saline Figure 7.1. General experimental protocol for the amperometric monitoring of exocytosis from single PC12 cells in either isotonic (335 mosm) or hypertonic (700 mosm) saline Figure 7.2. Summary of amperometric data Figure 7.3. Representative TEM images Figure 7.4. Summary of mean volume changes in PC12 dense cores, vesicle halos, and overall vesicular volumes Figure 7.5. The concentration of dopamine added to PC12 dense core vesicles is not significantly different from that estimated to be released from the vesicle after L-DOPA incubation Figure 8.1. A portion of dense core vesicles in PC12 cells exhibits multiple cores Figure 8.2. Histogram of quantal sizes after treatment is comprised of two populations of vesicles Figure 9.1. Examples of mitochondrial calcium rise evoked by E
14 xiv LISTS OF TABLES Table 2.1. E2 inhibition of exocytosis depends on N-type but not L-type VGCCs in PC12 cells...54 Table 3.1. Dissociation constants (K d ) for selected agonists to various estrogen receptors Table 3.2. Cytosolic calcium levels rapidly increased upon exposure to E2 or related compounds in both PC12 and GT1-7 cells...86 Table 5.1. Summary of lipid-induced effects on exocytosis, as manifested in changes in amperometric peak characteristics Table 5.2. Summary of the biophysical properties of each phospholipid species Table 7.1. Incubation in L-DOPA increases amperometric event area and halfwidth to a similar extent when cells are stimulated in isotonic and hypertonic extracellular saline Table 8.1. Percent of multicores increases with high osmolarity and L-DOPA treatment...184
15 xv ACKNOWLEDGEMENTS I would like to thank all those who helped me over the last six years. There are too many to thank every person who played a role, but you probably know who you are, especially if you are one of the few people who will actually read my thesis. Thanks to my family and thesis committee for direction. Graduate school has been a useful exercise in honing my communication skills and I hope it will help me, whatever I end up doing in the future. Andy has been a good mentor. He is always open-minded to new ideas I have and has exercised patience as I tried to implement them. I also want to especially thank Leslie Sombers for training me in electrochemistry methods, and for giving me the opportunity to assist her on projects that led to three chapters in my thesis. Kelly Adams has also been a very helpful editor. I promise to read and edit your papers & thesis Kelly! Kelly read most of these chapters and edited for clarity, sometimes more than once; however, I assume responsibility for all remaining errors. I also worked with Yoshiko Niimura, who always had ambitious goals but seemed to lack something in the follow-through department. I m happy to see her work finally make it into a journal (Brain Research 2007) and hope my own unpublished work will escape the academic purgatory of ambition tainted by lack of thoroughness. Sarah Luber joined our lab as a freshman two years ago. Since then she has done great work as my lab assistant, learning to manage cells, cell viability assays, and calcium imaging. I would never have tackled this many experiments without her help. I m sure she ll make a good doctor (or sister/roommate relationship therapist?) someday.
16 xvi Dan Eves has also been a lot of fun to share an office with. He is always pleasant and has even learned to tolerate my mostly unintentional double entendres. I hope that his hanging around the lab for six years hasn t ruined him to where he can t ever return to Utah. Of course a big thanks goes to everyone else in the Ewing Lab. Special thanks to Heather for hugs, and to Slick Rick, Fedora Eric, The Kromholminator, and Uncle Adog for keeping me in good spirits. Thanks to Abdulai for reminding me what s important, the UU s for warmth & games, and all the RPCVs for keeping in touch. I want to thank RadioParadise.com and Radio de la Mer for providing me with a soundtrack during experiments and writing. I probably wouldn t have enjoyed work very much if I had done it in silence. There is also a pathetic little stick-plant in the corner of our lab. It always looks a little greener when someone is about to write a thesis, so thanks Mr. Perpetually Dying Plant for giving me a hopeful feeling. I want to give a shout-out to the golden calf idol that sits on top of the electrophysiology equipment and keeps everything from breaking. Oh, I suppose I m descending into the mundane now, so that s all.
17 xvii DEDICATION There are six billion people in the world. Most of them will never own a book, much less write one. Among the 2.5 billion people who live on a few dollars a day, without electricity or running water, there are probably thousands if not millions of Einsteins and Newtons, Ghandis and Jim Hensons. But for the accident of my birth I would probably be fetching water from a well right now. Accident or no, the avalance of wealth that surrounds me and threatens to bury me in triffles is the true aberration on the planet. We in the United States spend more on ice cream, dog food, and make-up each year than it would take to end AIDS, to educate the world, or to weed the fertile ground of poverty that breeds war and death. My research has been no bargain, and I have tried my best to find meaningful cures to disease and improve our understanding of the brain so that others might find cures. I still have much to learn, and I dedicate this work to several of the brilliant Africans whom I ve met that would make brilliant scientists, if only they had the opportunities afforded me by birth. But much of what I have left to learn cannot be taught by people in America. Our priorities veil the wonders in our world. When brilliant stars against a pitch black sky define your nightscape, when bread and water taste full of flavor, when you can smell the Earth and not our mark on it, then will you see this world of great mystery and uncertainty. For there is much wisdom in seeing things as they are and not as we are: a people full of answers but still struggling with solutions. We owe it to the world s people to make this aberration of modern science count for something in their lives, so that the geniuses among them can lead our recalcitrant advanced civilization in America away from a collision course with ourselves.
18 1 CHAPTER 1 USE OF AMPEROMETRY TO STUDY NEURON-LIKE BEHAVIOR IN MODEL SYSTEMS 1. Introduction The last decade has been witness to an explosion of new techniques for studying the brain. However, despite recent advances, it is often necessary to recreate a model of brain microenvironments in a culture dish in order to conduct controlled experiments capable of testing theories about mechanisms of exocytosis, neurotoxicology, and neuroplasticity. Experiments involving whole intact brains are often unable to eliminate confounding variables, leading to results that only weakly support a conclusion. On the other hand, experiments performed on isolated, immortalized cell lines in a dish risk carefully describing phenomena which are artifacts of their artificial environment, and irrelevant in vivo. Recent advances in understanding the science of the brain often involves a synthesis of both approaches: In vitro experiments generate results which form the basis for subsequent, more difficult experimentalogs performed in vivo. This chapter provides instruction on the experimental aspects of one analytical technique that has been applied both in vitro and in vivo to better understand the brain, amperometry. Carbon fiber amperometry is used to analyze the amount of an oxidizable substance near the electrode with sub-millisecond time resolution. The carbon fiber is held at a constant potential exceeding the redox potential of the desired analyte. As the analyte comes into contact with the carbon fiber surface it is oxidized, releasing electrons, and generating a current. The current carried by the carbon electrode is directly proportional to the amount of analyte persent based on Faraday's Law (Q=nNF), making amperometry a very sensitive (Wightman et al., 1991;
19 2 Chow et al., 1992; Bruns and Jahn, 1995; Pothos et al., 2002) (detection limits of 3000 molecules (Pothos et al., 1998)) quantitative technique (Cahill et al., 1996). In addition to its utility as a single technique, amperometry can be combined with complementary techniques such as voltammetry, electrophysiology, and fluorescence imaging to provide new insights into the biology of neuronal models. Cyclic voltammetry is a comparable technique that provides information about chemical identity and concentration with temporal resolution, but at lower sensitivity (for a review, see (Troyer et al., 2002)). Electrophysiology uses a glass pipet sealed to the surface of a cell to measure changes in conductance, indicative of the opening of various ion channels in the membrane. Cell membrane capacitance can also be monitored with this technique. Since capacitance is proportional to total membrane area, which changes during exocytosis as vesicle membranes fuse with the cell membrane (Alvarez de Toledo et al., 1993), capacitance changes identify the moment of vesicle fusion and the size of the vesicle undergoing fusion. Traditionally, electrophysiological techniques have been applied to study post-synaptic responses (except for capacitance measurements), while amperometry has been used to study pre-synaptic effects on release. Imaging of florescent dyes taken up during endocytosis (i.e. FM1-43) or genetic markers of synaptic vesicles (Bozza et al., 2004) offers another technique to study cell-to-cell communication. Quantitative ratiometric dyes have generated much interest recently because they provide a reasonably fast, quantitative, and noninvasive way to monitor groups of cells in culture (Bouchelouche, 1993); however, amperometry is 2 to 5 orders of magnitude faster than capacitance, post-synaptic quantal analysis, or fluorescence imaging (Staal et al., 2004). For a review of these comparative techniques, refer to (Angleson and Betz, 1997).
20 3 2. Cell types Amperometry has been used to study exocytosis in primary cultures (Wightman et al., 1991; Chow et al., 1992; Hochstetler et al., 2000; Pothos, 2002), immortalized cell lines (Chen et al., 1994; Colliver et al., 2000), brain slices (Schmitz et al., 2001), and at intact neurons in vivo (Chen et al., 1995; Chen et al., 1996; Benoit-Marand et al., 2001; Schonfuss et al., 2001). In general, candidate cell systems have been limited to those that release an oxidizable substance, usually a catecholamine, serotonin, or tyrosine/tryptophan containing peptide. Immortalized cultures allow for single, isolated cells to be studied, while primary cultures offer the advantage of modeling cells that can be studied in the context of belonging to a network, continuing to receive information from adjacent cells. Since amperometry can also be used within an intact brain, the technique can potentially be applied in a setting where cell communication remains relatively undisturbed. However, difficulty in production and placement of ultrasmall electrodes limits in vivo amperometry to measurements of the extracellular "overflow" catecholamine flux, not intrasynaptic concentrations. Ultrasmall electrodes have not yet been constructed to fit into a synapse. The choice of cell system depends on several considerations. Ideally, the cell culture should be identical to the cell types about which one wishes to formulate a conclusion - such as with the use of primary neuronal cultures extracted from specific brain areas. However, other restraints have limited the widespread use of primary cultures: (a) Primary neuronal cultures are often heterogeneous mixtures of cell types which must be distinguished from each other (b) true neurons mostly release chemical messengers from small, clear vesicles, which contain less transmitter, thus approaching the current limit of detection. However, these considerations have been addressed by use of animals expressing cell-specific labels such as green fluorescent
21 4 protein (GFP) (Sawamoto et al., 2001; Sawamoto et al., 2001; Zhao et al., 2004) and by loading cells with neurotransmitter before experiments (Kim et al., 2000). PC12 cells and large dense core vesicles The adrenal pheochromocytoma (PC12) cell line was originally isolated from a tumor in the adrenal medulla of a rat in 1976 (Greene and Tischler, 1976). They resemble the phenotype of sympathetic ganglion neurons upon differentiation (with NGF) and can be subcultured indefinitely. They possess slightly smaller large dense-cored vesicles (LDCVs) ( nm radius compared to 170 nm (Greene and Tischler, 1976; Schubert et al., 1980; Travis and Wightman, 1998) for chromaffin cells and generally contain dopamine which gives rise to spikes similar to those of isolated chromaffin cells following stimulation to exocytosis (Clark and Ewing, 1997). Primary neuronal cultures and small clear synaptic vesicles Neurons used to study exocytosis with amperometry have been isolated from the midbrain, hippocampus, retina, primary sensory ganglia, neostriatum, nucleus accumbens, and substantia nigra (Jaffe et al., 1998; Pothos et al., 1998; Pothos et al., 1998; Hochstetler et al., 2000; Phillips et al., 2002; Pothos, 2002; Iturriaga et al., 2003; Staal et al., 2004). Unlike immortalized cell lines, which can be used within a few days of plating, primary neuronal cultures require several weeks of recovery after plating (Pothos et al., 1998). In addition, primary cultures are a heterogenous phenotype requiring post-experiment immunohistochemistry to confirm the presence of critical enzymes (i.e. tyrosine hydroxylase) for phenotype identification. The many brain areas thus far examined in this way share one characteristic: they are known to
22 5 have a high density of catecholamine releasing cells. In the future, greater use of mice expressing GFP in catecholaminergic cells will allow amperometry to be applied to areas where such cells are diffuse. However, the small size of synaptic vesicles (20 nm diameter) compared to large dense core vesicles (150 nm diameter) will require more sensitive detection schemes to permit widespread use. Peptide detection Although most experiments apply amperometry to catecholaminergic cells, it is not limited to them. Kennedy's group has shown that amperometry can also be used to monitor the release of certain neuropeptides. Highly sensitive detection (limit of 100 nm) of insulin (peptide with 51 amino acids) from human pancreatic beta-cells required coating the electrode with a ruthenium oxide / cyanoruthenate film to reduce the dicysteine bridge in te peptide (Kennedy et al., 1993). Smaller tyrosine/tryptophan-containing peptides (8-15 amino acids) have been detected with uncoated carbon fibers (Paras and Kennedy, 1995; Lieste et al., 1998; Ishizaki and Oka, 2001), albeit at higher limits of detection. It is believed that peptides are released by LDCVs, while classical neurotransmitters are sequestered in small synaptic vesicles (SSVs) in the brain - making peptide detection potentially more feasible. Larger vesicles give rise to larger and more easily detected peaks. However, those neuropeptides lacking oxidizable amino acid residues in their composition would not be detected. In vivo neuronal data
23 6 Experiments conducted under the least perturbed conditions must be carried out in vivo. Electrodes can be positioned into brain areas known to have a high percentage of dopaminergic neurons such as the striatum (Kuhr et al., 1987), ventral tegmental area (Suaud-Chagny et al., 1992), and amygdala (Garris and Wightman, 1994), or noradrenergic neurons (thalamus (Capella et al., 1993)), or serotonergic neurons (raphe nucleus (Conley et al., 2002)). An area known to send afferents to the area where the electrode is placed is then stimulated chemically or electrically. This typically produces a large, broad peak indicative of dopamine overflowing from nearby synapses (Ewing et al., 1983; Schmitz et al., 2003). Individual events cannot be distinguished because the electrode is not near enough to the release site (Michael and Wightman, 1999). Nevertheless, in vivo amperometry has been used to study both D2 (autoreceptors) and DAT (reuptake) knock-out mice (Benoit-Marand et al., 2000; Benoit-Marand et al., 2001). Most experiments employ fast-scan cyclic voltammetry instead of amperometry in vivo because measured brain areas contain several cell phenotypes, making chemical identity less certain (Michael and Wightman, 1999). 3. Performing the experiment Electrodes Carbon fiber microelectrodes were developed in several laboratories in the late 1970s. Leaders among these were the Wightman (Wightman et al., 1976; Wightman et al., 1978) and Gonon (Gonon et al., 1978; Ponchon et al., 1979) groups, who later applied this tool to neuroscience (Gonon et al., 1980; Dayton et al., 1981; Gonon F, 1981; Ewing et al., 1982). The method was a breakthrough for several reasons. First, the conductive carbon fiber could carry a current while maintaining sensitivity to reductants, thus increasing the working lifetime of an
24 7 electrode. Second, carbon fibers as small as 5 µm were resistant to strain, allowing them to be placed snugly against cell surfaces, allowing greater sensitivity and reproducibility (Kennedy et al., 1993). For a good discussion of the factors affecting electrode sensitivity, selectivity, and temporal response, see (Cahill et al., 1996). Electrodes used for studying single cells are usually prepared by aspirating a single fiber through a glass pipet. Then the pipet is pulled on a commercial puller (i.e. Sutter P-97) to produce a long tapered fiber-containing end that is later cut at a cross sectional diameter of 8 to 10 µm on a microscope using a fine razor blade. Cut electrodes are immersed in freshly prepared high quality epoxy (EpoTek-301, Billerica, MA) to create a seal between the glass tip and carbon fiber. Finally, no more than a few hours before experiments, electrodes are beveled to 45 degrees on a rotary micro grinder to produce a fine-angled tip (Kawagoe et al., 1993; Pothos et al., 1998) (Figure 1.1a). It is my experience that "bad batches" of prepared electrodes can most often be traced to old epoxy. Additionally, higher oven temperatures appear to adversely affect the curing of epoxy for electrodes.
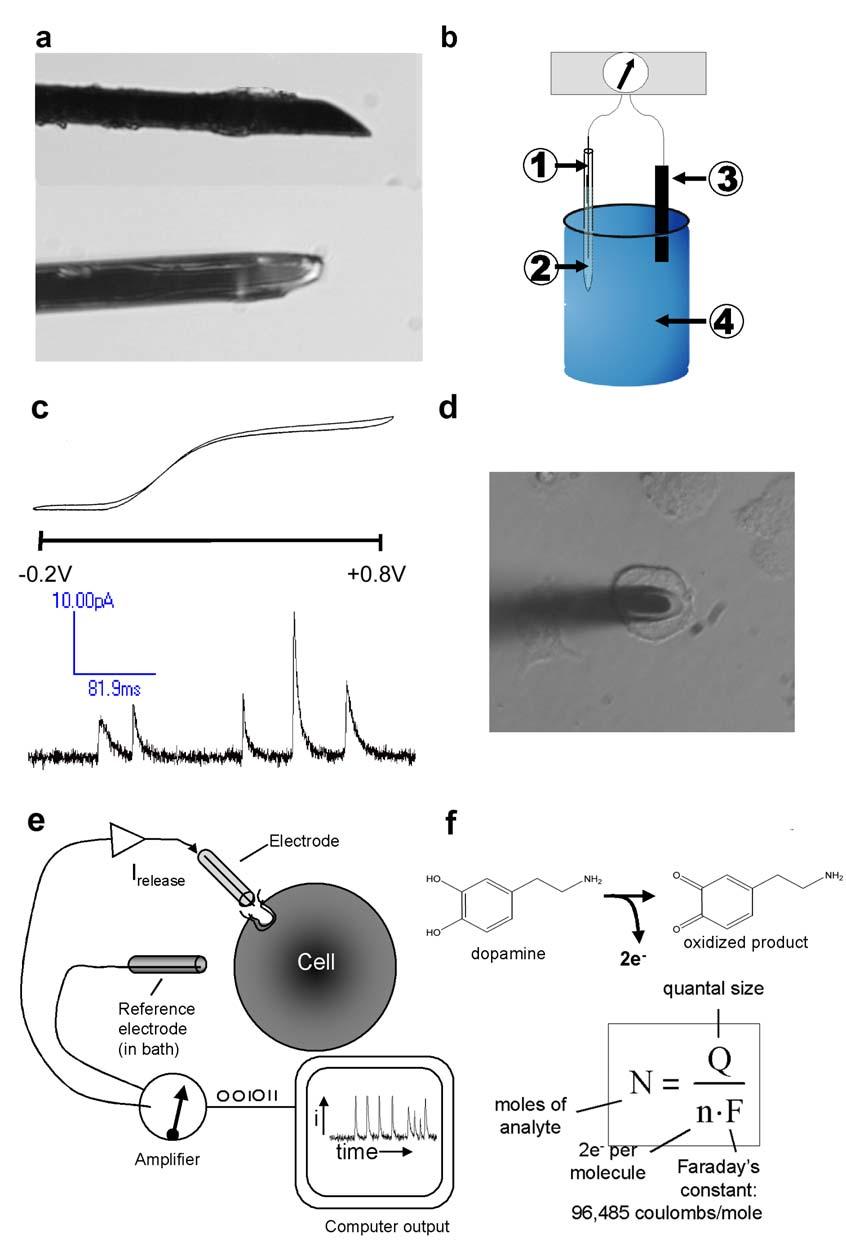
25 Figure 1.1. Preparation and use of carbon fiber electrodes for amperometric detection of catecholamines. (a) Profile and top views of a 5-µm beveled electrode, demonstrating an appropriate degree angle for positioning on cells. (b) Setup for sweep-voltammetry testing of electrodes. Silver wire (1) is inserted into a back-filled 3M KCl solution in a CF electrode (2) and tested against a reference electrode (3) in 100 µm DA (4) using a potentiostat. (c) Top trace is a current-voltage curve for a responsive electrode in DA test solution and the bottom trace is an amperometric current of DA released from multiple vesicles in a stimulated PC12 cell detected by a CF electrode. (d) CF electrode placed on a cell. (e) Schematic of CF electrode used to detect catecholamines released from a cell. (f) Equation for the oxidation of DA yielding 2 electrons per molecule, which can be used to quantify the amount of DA by Faraday s equation. 8
26 9
27 10 Working electrodes are generally prepared from 5 to 10 µm diameter carbon fibers. The signal-to-noise ratio improves as the electrode size approaches the size of vesicles, but larger electrodes can detect a greater number of events (Cahill et al., 1996; Travis and Wightman, 1998). Electrode sensitivity requires that the surface be free of adsorbed molecules, such as proteins and oxidized products (Gerhardt et al., 1984; Cahill et al., 1996). This is often achieved by frequent testing and rebeveling between experiments. Alternatively, electrode response can be maintained by diping electrodes into a solution of 5.0 % Nafion (Solution Technology, Inc, Mendenhall, PA) (Gerhardt et al., 1984). The Nafion coats the surface with a perfluorosolfonated anionic polymer that allows small cations to reach the surface, but prevents small anions and larger proteins from binding irreversibly to the surface (Gerhardt et al., 1984). In addition to selectivity for detection of cations, Nafion coating reduces fouling from proteins adsorbing to the electrode surface. Electrodes can be tested in standard solutions of the analyte using single sweep voltammetry. Typically, electrodes are back-filled with 3 M KCl and a silver wire inserted. The wire is connected to a current amplifier, and a AgCl reference electrode is placed into the analyte-containing solution (Figure 1.1b). For catecholamines, the voltage is swept from -0.2 to +0.8 V to generate a voltammogram (Figure 1.1c). The shape of the curve indicates various characteristics of the electrode. Generally the sharper the rise, the greater the sensitivity; the narrower the width of the curve, the better the signal-to-noise ratio. Correct positioning of the electrode on the surface of a single cell is generally done with a micropositioner with a piezoelectric drive. Beveled electrodes are oriented so that the exposed carbon surface faces down, maximizing the potential area in contact with the cell surface. Properly oriented and beveled electrodes have a transparent glass "halo" around the fiber tip of
28 11 uniform thickness (Figure 1.1d). The electrode is gently lowered onto the cell surface until the tip comes into contact and displaces the cell volume slightly (Figure 1.1d). When held at a potential of +700 mv, catecholamines released by the cell in the volume directly under the electrode will be oxidized and generate a current (Figure 1.1f). Shallow and broad peaks are often an indication that the electrode is not in close contact with the cell surface. During single cell amperometric experiments, it is important to consider and control potential variables. It has been demonstrated that peak amplitude, peak area, and the total number of events differ at 21 C and 37 C (Pihel et al., 1996; Colliver et al., 2001). Additionally, repeated stimulation can deplete the available vesicle pool or cause acidification of vesicles, altering the amount of release (Gil et al., 2000; Pothos, 2002). Therefore, it is important to maintain a healthy cell environment by limiting exposure to secretagogues, controlling temperature (typically at 37 C), and using cells within a reasonable length of time after removal from an incubator. Because it is often necessary to deprive cells of media, whose serum component can affect the electrode response, most experiments are completed within 90 minutes. Loading messenger into vesicles One major limitation to the widespread application of amperometry is the requirement that the cells studied release an electroactive substance. Generally, this substance is dopamine (DA), norepinephrine (NE), epinephrine (E), histamine (HIS), or serotonin (5-HT). However, peptides containing tyrosine or tryptophan have also been detected (Paras and Kennedy, 1995; Ishizaki and Oka, 2001). Recently, it was shown that a variety of cell lines will take up DA and release it upon stimulation, but that the loading process is dependent upon time, concentration, and ph (Kim et al., 2000). In theory, this loading occurs because a small fraction (0.4 %) of the
29 12 dopamine, a weak base with a pka of 8.9, is neutral at ph 7.4 and passes through the cell and vesicle membranes. When this DA encounters the lower ph (5.5) of the vesicle lumen, the neutral fraction is mostly deprotinated and remains trapped. However, a drawback to loading by this mechanism is that a small fraction is still neutral and membrane leakage reduces the quantal size over time if a dopamine gradient is not maintained (Kim et al., 2000). Thus, concern over the reproducibility of this loading method, as well as potential neurotoxic effects of the large DA gradient necessary to load the cells (Song et al., 2004) have limited wider applicability of the technique. Despite potential artifacts, some groups do incubate their cells with a catecholamine before experiments to increase quantal size and facilitate detection. Incubation with 1 mm DA and 1 mm ascorbate for one hour (Fisher and Burgoyne, 1999) and 1.5 mm NE and 0.5 mm ascorbate for one day (Wang et al., 2001) have been used. Norepinephrine (NE) and the metabolic precursors L-DOPA (DA, NE) and 5-HTP (5-HT) have been substituted for dopamine to reduce neurotoxicity (Wang et al., 2001; Staal et al., 2004). Over 50 % of cells die after 24 h exposure to 100 µm dopamine (Song et al., 2004). An overview of secretogogues Secretegogues promote the release of neurotransmitter from vesicles. They can be divalent cations (that probably mimic the effects of Ca 2+ ) or pharmocologically active substances, such as nicotine or acetylcholine. High concentrations of ( mm) K + are most often used to stimulate release from single cells, but electrical stimulation also has the same effect. Both approaches depolarize the membrane to open calcium channels and initiate exocytosis. Stimulation with 0.1 mm Ca 2+ (Neco et al., 2003) and 0.1 mm ATP (Hollins and
30 13 Ikeda, 1997) can also be used directly if the cells have been permeabilized. When it is advantageous to induce exocytosis without affecting membrane ion channels, a permeablizing agent can be used. Ionomycin, digitonin, and A ionophores promote calcium entry across membranes, allowing external bath media to dictate internal ion concentrations (Bennett et al., 1979; Yoneda et al., 2000). Similarly, Ba 2+ can be substituted for Ca 2+ as a secretogogue. Ba 2+ stimulated release is initially retarded and continues for longer periods than ordinary release (Jankowski et al., 1994; Kishimoto et al., 2001). Detection of low-current signals Low-noise signal amplifiers are essential for measuring the current from microelectrodes. Currently, the Axopatch 200B tends to be the low-noise device of choice in many laboratories (Axon Instruments, Foster City, CA). Amperometric recordings are performed in the whole cell β=1 configuration, with the voltage clamp engaged and set to a positive voltage. Setting the device display to RMS noise should verify that the unloaded noise is around 0.5 pa. Output is filtered by a four-pole lowpass Bessel filter built into the amplifier and stored on a computer using a program, such as AxoScope or AxoClamp, for offline analysis. While filtering can reduce the apparent noise, it can also lead to artifacts. During amperometric recordings of dopaminergic amacrine retinal neurons, decreasing the low-pass filter frequency cut off from 1 khz to 40 Hz led to a 40 % increase in the number of detectable events, a 40-fold increase in the duration of each peak, and a 20 % increase in apparent quantal size (Hochstetler et al., 2000). When the maximum rising slope of a spike is greater than the filtering frequency, a pre-spike artifact called the Gibbs phenomenon can result (Gomez et al., 2002), leading to incorrect data interpretation. The Ewing lab typically filters at 2 khz and
31 14 sample every 200 µs, which is fast enough to have minimal effects on peak shape in PC12 cells. However, when attempting to record events from small clear synaptic vesicles, it is necessary to increase the filter cut-off frequency and increase the sampling rate. Quantal events from midbrain dopamine neurons have been detected using a 20 µs sampling time and filtering output at 10 khz (Pothos et al., 1998; Staal et al., 2004). Quantitative analysis of exocytosis events Several programs (Igor, MiniAnalysis) and labview scripts (Gomez et al., 2002) have been written to specifically identify amperometric peaks from exocytosis. In general, the detection algorhythms employed analyze a trace for perturbations that exceed some multiple (i.e. 5x) of the RMS noise. At 2 khz filtering (good enough for LDCV detection), typical RMS noise is 0.4 to 0.7 pa (Wiedemann et al., 1991; Colliver et al., 2000); at 10 khz (required for SSV detection), typical RMS noise is 1.4 pa (Pothos et al., 1998). Spike characteristics offer a means for identifying specific stages of exocytosis events (Figure 1.2). The area under the peak is related to the amount of moles of neurotransmitter oxidized (N) by Faraday's law (N=Q/nF), where Q is the total charge measured, n is the number of electrons transferred during the oxidation, and F is Faraday's constant (96,485 coulombs/mole of electrons) (Wightman et al., 1991). Time resolution is usually sufficient to resolve individual peaks, and each peak corresponds to the amount of neurotransmitter released from a single vesicle (Wightman et al., 1991). Both the average amount per vesicle (the "quantal size") and the total amount of neurotransmitter released are interesting because they have been shown to be regulated by the cell (Anderova et al., 1998; Pothos et al., 1998; Pothos et al., 1998; Colliver et al., 2000; Sulzer and Pothos, 2000; Pothos, 2002).
32 15 Figure 1.2. A generic amperometric trace showing spike characteristics: (Q) quantal size, or area under the trace; (t 1/2 ) half width; (foot) pre-spike feature present in some events; (I-max) peak amplitude; (m) rise slope. Adopted with permission from Colliver et al., t 1/2 foot Q I-max m
33 16 Pre-spike features, termed the "foot", appear in a fraction of events. Their frequency and size can be modulated (Sombers et al., 2004) and they are believed to be the result of neurotransmitter leakage through the fusion pore of a vesicle in the early stages of exocytosis (Chow et al., 1992; Troyer et al., 2002). In addition to feet, differences in the rising slope of peaks suggest an alteration in the vesicle fusion kinetics. Vesicles retarded during fusion pore formation and dilation would be expected to exhibit shallower rise slopes (Graham et al., 2004). Other spike characteristics, such as peak amplitude (also called maximum current or I max ), half-width, and decay time, have been measured. Changes in peak amplitude appear to reflect changes in several underlying processes, including changes in the quantal size and in the rate of degranulation/extrusion of vesicle contents (Wightman et al., 1995; Colliver et al., 2000). Half-width and decay time are proportional to the duration of exocytosis and the rate of diffusion from the release site, respectively (Wightman et al., 1991). Statistical methods for comparing treatment groups must ensure that subsets of cells analysed are not overrepresented in the summary statistic. An analysis of spike differences between normal and coloboma mouse chromaffin cells by Colliver and coworkers demonstrated that inconsistent results can be obtained from some experiments where a few cells with many events can shape the character of group means (Colliver et al., 2000). Statistical tests often assume that independent samples are drawn from the population - a stipulation that one measurement not affect the next. This assumption does not apply when spikes from groups of cells are pooled together and tested against other pooled groups. In single cell experiments, because of the large degree of inherent cell-to-cell variability, groups of events from the same cell often correlate to each other more than to the population mean and thus become a weighted sample. Because these differences likely result from unavoidable differences in the overall
34 17 activity of cells, it is more appropriate to statistically test means generated from the cells' mean parameters, which ensures equal representation of all cells in the group regardless of differences in the number of events per cell (Colliver et al., 2000). This important result has occasionally been ignored by investigators in this field and may have lead to erroneous conclusions. 4. Running the experiment With the elements of an experiment in place (cell type, electrodes, analysis), the experimental paradigm can be considered. Clearly, the design and analysis of amperometric experiments can affect the reliability of the conclusions reached. Differences in detected release can result from differences between electrodes, electrode-cell positioning (Travis and Wightman, 1998), cell-to-cell activity, day of culture (Colliver et al., 2001), temperature (Pihel et al., 1996; Colliver et al., 2001), osmolarity (Holz and Senter, 1986; Borges et al., 1997), intravesicular ph (Pothos et al., 2002), as well as differences due to the intended experimental variables. The Ewing lab employs a same-cell paradigm whenever possible to minimize the effect of cell-to-cell variability on conclusions drawn. Isolated cell preparations can be stimulated before and after a treatment, and the results discussed as a comparison of single cells before and after treatment. When it is not possible to use a same-cell paradigm, a larger number of experiments must be conducted in order to have sufficient power to observe statistical differences above the "noise" of cell-to-cell variability. Several recent between-cell experiments involving gene transfections have published results with experiments per group (Graham and Burgoyne, 2000; Wang et al., 2001; Archer et al., 2002; Graham et al., 2002; Graham et al., 2004). In contrast, experiments designed around a same cell paradigm can often demonstrate
35 18 differences with as few as six cells per treatment group (Pothos et al., 1998; Colliver et al., 2000; Pothos, 2002; Sombers et al., 2004). 5. Interpretation of amperometry data The following themes (quantal size, feet and the fusion pore, vesicle pools) are presented as a synthesis of ways that amperometric data have been analyzed and interpreted in order to form conclusions about the mechanisms regulating exocytosis from neuron-like model cell systems. Quantal size Many of the earliest amperometric experiments on neuronal cell types sought to ascertain whether the amount of neurotransmitter released per vesicle was constant in various cell types under various conditions. This was based on the earlier work of Del Castillo and Katz that suggested quantal size was invariant (Burgoyne and Barclay, 2002). Now it is accepted that quantal size can be altered by pharmacological (Kozminski et al., 1998; Pothos et al., 1998; Colliver et al., 2000; Pothos et al., 2000), genetic (Graham et al., 2004), and even osmotic treatment (Borges et al., 1997), and can even be a form of biologically relevant neuroplasticity (Liu, 2003). Amperometry has been used to compare the distribution of quantal sizes in rat mast cells, human pancreatic beta-cells, and rat PC12 cells and this is shown in Figure 1.3 (Finnegan et al., 1996). Note that because the distributions of peak areas are skewed to the right, a normal distribution must be generated by cube root transforming peak areas in the distributions. This transform is valid because there is a near Gaussian distribution of radii and vesicular volume is
36 19 proportional to the cube root radius, making the cube root of the amount detected per vesicle (Quantal size 1/3 ) a normal distribution.
37 Figure 1.3: Quantal sizes differ in different cell types. (Dark) PC12; (grey) human β cells; (white) rat mast cells. Plotting the histograms as frequency vs. the cube root of the amount detected per event results in near Gaussian shapes. Reproduced with permission from Finnegan et al.,
38 21 Adding the dopamine precursor L-DOPA to cell environments was shown to affect quantal size in many cell systems (Kozminski et al., 1998; Colliver et al., 2000; Pothos, 2002; Gong et al., 2003; Staal et al., 2004). L-DOPA is currently used to treat Parkinson's disease, apparently by increasing the amount of DA released by neurons. Treating with L-DOPA leads to larger amounts of transmitter detected per vesicle by amperometry and increases vesicular volume (Colliver et al., 2000). Reserpine, an ancient anti-hypertensive drug once used in India until doctors became aware of its depression-causing side effects, has the opposite effect. Reserpine blocks the VMAT (vesicular monoamine transporter) and depletes vesicles of neurotransmitter. Thus, quantal size is reduced, and a proportionate decrease is seen in vesicle size in EM micrographs (Colliver et al., 2000; Gong et al., 2003). L-DOPA is now frequently employed as a positive control to increase quantal size when examining novel effects on quantal size (Pothos et al., 1998; Pothos et al., 1998; Pothos, 2002; Gong et al., 2003; Staal et al., 2004). In neurons, Pothos has shown that quantal size can be altered through D2 blockade (sulpiride), by treating with a PKA activator (8-Br-Sp-cAMPS), or by VMAT2 overexpression (Pothos et al., 1998; Pothos et al., 2000; Pothos, 2002). In these studies quantal size was increased by increasing DA synthesis, activating a PKA dependent pathway, or by increasing uptake of DA into the vesicles, respectively. Treating PC12 cells with a D2 agonist (quinpirole) had the opposite effect of reducing quantal size (Pothos et al., 1998). Long term (>1 week) exposure of neurons to glial-derived neurotropic factor (GDNF) appeared to increase quantal size by increasing tyrosine hydroxylase (TH) expression, thus increasing the amount of dopamine in the cell biosynthetically (Pothos et al., 1998). In these cases amperometry was used to detect a more than two-fold increase in quantal size at physiological doses of a drug.
39 22 Another mechanism for the modulation of quantal size in neurons might involve SSVs releasing some of their contents by repeated opening and closing of the fusion pore "flickers" during a single docking session at the plasma membrane. Modulation of this flickering might represent a form of synaptic plasticity. Recent experiments support this hypothesis, showing that quantal sizes differ between simple and complex (exhibiting multiple peaks; Figure 1.4) exocytotic events (Staal et al., 2004). Furthermore, the frequency of complex events and the latency between different flickers within an event could be modulated by staurosporine (a nonspecific kinase inhibitor) and PDBU (a protein kinase C activator) when K + /alpha-latrotoxin (black widow spider venom) was used to stimulate the cells. In their analysis, Sulzer's group expanded the conventional interpretation of amperometric data and attempted to show that single peaks exhibiting multiple maxima represent multiple openings and closings of the fusion pore because (a) they appear with greater probability than models predict for random overlaping events and (b) the frequency and latency (pore-opening kinetics) can be modulated pharamacologically. Additionally, they ruled out the possibility that the "flickers" were the result of two SSVs fusing prior to release or that a cluster of SSVs could release simultaneously by noting that the amplitude and half widths of events would differ from that observed. In complex events they observe the second and subsequent peak amplitudes (Imax) and halfwidths decrease sequentially, while inter-flicker intervals remain constant (Staal et al., 2004). Therefore, amperometric data can also arguably be used to differentiate between various modes of complex exocytosis, such as "flickering" pore-openings, intracellular fusion prior to release, and networks of docked vesicles.
40 23 Figure 1.4. Demonstration of simple (top trace) and complex (bottom trace) amperometric events with multiple flickers, suggesting that some fusion pores open and close rapidly in neurons. Reproduced by permission from Macmillan Publishers Ltd: Nature Neuroscience (Staal et al., 7: ), copyright µs
41 24 Correlation of amperometric feet and release via the fusion pore It has been suggested that docked vesicles undergoing exocytosis transcend an intermediate state when a small fusion pore is open but cannot immediately expand (for a discourse on the forces stabilizing this fusion pore see (Amatore et al., 2000)), and that this pore allows a small but measureable amount of neurotransmitter to leak out (Alvarez de Toledo et al., 1993). Transport of chemical messengers through the constricted pore manifests itself as a prespike feature or "foot" in the amperometric trace as these messengers are oxidixed at the electrode. Fusion pore formation appears to be highly regulated, as numerous proteins have been implicated in this step in exocytosis (Chen et al., 2001; Chen and Scheller, 2001). Therefore it is of interest as a mechanism by which the cell could regulate release of neurotransmiter and be involved in synaptic plasticity. A combination of patch clamp capacitance measurements with carbon fiber amperometry was used to correlate the fusion of individual vesicles with the release of neurotransmitter (Alvarez de Toledo et al., 1993). Alvarez de Toledo and coworkers showed that membrane capacitance appeared to transiently increase and decrease prior to the detection of amperometric events. They attributed this phenomenon to transient, reversible vesicle fusion prior to subsequent full fusion. Furthermore, they showed that the duration of the foot correlates with vesicle radius, and that the percentage of neurotransmitter released in the foot increases with decreasing vesicle size (Alvarez de Toledo et al., 1993). Amperometric methods were used to quantify the amount of neurotransmitter released at various points during each capacitance trace, on a sub-millisecond time scale.
42 25 Foot-like events were also elicited under hypertonic conditions in chromaffin cells by Wightman's group (Borges, 1997; Troyer and Wightman, 2002). During vesicle fusion, the dense core degranulates and releases a large volume of bound neurotransmitter, producing a spike in the amperometric trace. However, under hyperosmotic (~730 mosm compared to 330 mosm normally) conditions, the core remains intact and only a small amount of uncomplexed neurotransmitter in the halo is released, producing flat, broad peaks about 1 % of normal peak amplitude, as measured by cyclic voltammetry. These events resemble feet without associated peaks (Troyer and Wightman, 2002). Although stimulation elicits a few small foot-like events, momentarily restoring isotonic conditions produces the massive release expected for full exocytosis from many vesicles. This is purportedly because vesicles are stalled in mid-fusion until the osmotic gradient is restored. Isotonic restoration-induced release is not accompanied by a calcium rise, supporting the idea that vesicles have already fused but cannot expel their contents. Like the patch-clamp and amperometry measurements of Alvarez de Toledo et al, the amperometric feet observed under hyperosmotic conditions appear to result from traces of neurotransmitter diffusing through the fusion pore prior to full fusion. Osmolarity is thus presented as a tool for separating initial vesicle fusion from full fusion (Troyer and Wightman, 2002). In a follow-up to Alvarez de Toledo's conclusion that foot duration varies inversely with vesicle size, Sombers et al presented evidence that pharmacologically altered vesicle sizes exhibit different sized feet in PC12 cells (Sombers et al., 2004). Decreasing the amount of DA and the vesicular volume by treating with reserpine results in a greater portion of vesicle contents released through the constricted fusion pore, which manifests itself as a foot in the amperometric trace. Conversely, loading vesicles with L-DOPA to increase the DA content and their volumes
43 26 leads to a smaller fraction of total vesicular contents released through the fusion pore (Sombers et al., 2004). Evidence that a greater fraction of vesicle contents is released through a constricted fusion pore as vesicular volume decreases is consistent with recent reports that a significant portion of neurotransmitter released at synapses is through a kiss-and-run mechanism (Ales et al., 1999; Staal et al., 2004). Kiss-and-run exocytosis involves the expulsion of neurotransmitter through a transient, constricted fusion pore without full fusion, similar to the foot portion of amperometric events; however, this is hypothesized to take place under physiological conditions and without full exocytosis ocurring. In addition to the foot, the rising portion of a current spike has been correlated to the opening of the fusion pore. Based on models that predict steeper rise times for current spikes than observed experimentally, Amatore s and Wightman's groups conclude that the rise time is "due to a separate kinetic step that is temporally located between the initially formed fusion pore, where the majority of catecholamines are tightly associated with the matrix, and the final stage, where the matrix is dissociated and release of catecholamines has fully developed." (Schroeder et al., 1996) Using this interpretation of the rising portion of the spike, it is therefore feasible that some manipulation of the fusion pore and/or rate-of-catecholamine-core-dissociation may result in changes to spike rise time. In this context, recent discoveries by Burgoyne and coworkers can be intrepreted in relation to modulation of an expanding fusion pore. Burgoyne's group has recently examined the effects of the SNARE-complex constituent syntaxin on exocytosis. While transient overexpression of wild-type syntaxin 1A had no effect, expression of two syntaxin mutants had a modest increase on quantal size, rise time, half-width, and decay time, suggesting that this mutant, rendered unregulatable by Munc-20, was able to increase the amount released per vesicle
44 27 by altering the fusion-pore expansion in such as way as to increase the total amount released. In contrast, foot characteristics were not altered, suggesting that mutant syntaxin had no effect on the initial stages of pore formation, prior to pore expansion. Their observation that mutant syntaxin, a protein often associated with formation of the fusion pore, increased quantal size is consistent with other reports that quantal size can be increased by promoting greater dissociation of neurotransmiter from the matrix (Jankowski et al., 1994; Schroeder et al., 1996). Nevertheless, the direct mechanism by which mutant syntaxin alters the fusion pore leading to increased dissociation of neurotransmitter remains nebulous and controversial. Vesicle pools Some evidence supports a hypothesis that actin filaments segregate active, readily releasable vesicles near the surface from those deeper, and that stimulation can cause a transient depolymerization of actin within seconds (Cheek and Burgoyne, 1986; Gil et al., 2000). This actin barrier can be either stabilized or removed by drugs (calyculin-a, latrunculin-a, PMA, phalliodin) in a dose-dependent fashion through intracellular signaling cascades. This lends credence to suggestions that actin regulation can be a mechanism of presynaptic plasticity. Furthermore, actin stabilization consumes nearly 50 % of total cell ATP, second only to the demands of ion pumps (Bernstein and Bamburg, 2003). The steep ATP dependency of actin stabilization could provide a rational for the presence of concentrated ATP in chromogranincatecholamine complexes (Williams, 1979). Cumulative histograms of release during repeated 10-second stimulations in the presence of drugs that regulate actin polymerization demonstrate enhanced recruitment from reserve pools of vesicles (Gil et al., 2000). While untreated cells appear to release fewer and fewer quanta with
45 28 each successive stimulation, treatment with a protein kinase C activator (PMA) or a phosphatase inhibitor (CL-A) maintains high levels of release, presumably avoiding vesicle depletion because additional vesicles are able to dock as a result of actin depolymerization. While depletion of the actin barrier by PMA or CL-A leads to an increase in docked vesicles (as seen in EM), a corresponding increase in the number of early events was not observed with either drug. This enforces the view that actin is involved in controlling access to reserve pools during prolonged release, but does not regulate short-term release. 6. Research Goals The goals of my research since 2001 have been two-fold. My primary goal is to examine exocytosis in neuron-like cell cultures and advance our understanding of mechanisms that regulate exocytosis. Phenomena that lead to changes in the frequency of vesicle fusion or the shape of amperometric peaks indicative of differences in how vesicles fuse with membranes during the process of exocytosis are the subject of this work and are included under the blanket term exocytotic plasticity. My other goal is to look for possible connections between these phenomena and neurodegerative diseases. This work was funded by NIH grants concerned with understanding aspects of neuronal communication that might relate to Parkinson s Disease, and I have kept this in mind when designing experiments. The bulk of my work (Chapters 3 through 5) is concerned with examining how the neurohormone estrogen acts on fast second-to-minute time scale to shape intercellular communication. The goal for these experiments was to describe new forms estrogen-mediated exocytotic plasticity that I have observed in PC12 and GT1-7 cells. Because most of these
46 29 experiments were conducted using concentrations of estrogen that would be similar to what neurons might experience, these results might have direct physiological correlates. The manipulations described in the subsequent four chapters deal with the effects of altering cell membrane phospholipid composition and manipulating membrane properties with high osmolarity solutions. As these treatments are artificial, the results do not necessary describe forms of plasticity that would be expected to occur in vivo. Instead, they serve to illustrate how the fundamental properties of biomembranes affect exocytosis, and thus have merit in this context. The following sections are a brief summary of what this thesis contains, along with some essential background information. Nontranscriptional, neuromodulatory effects of estrogen Estrogen, a hormone with a plethora of purported effects, appears to act in the brain as a fast neuromodulator. Understanding how estrogen mediates these effects could illuminate the poorly understood mechanisms behind estrogen s neuroprotective and neuromodulatory properties, aiding in the development of estrogen-like drugs as treatments for neurological disorders. In this thesis I characterize some the rapid effects of estrogen on dopamine release in PC12 cells using amperometry and calcium imaging. These measurements provide insights into the dose-responsive range and molecular targets inplicated in estrogen s effect on dopamine release. Estrogen is one of a class of hormones that regulate reproductive and homeostatic functions in the body. Although usually considered to act by binding nuclear estrogen receptors (ERs), which then bind to estrogen response elements (ERE) to regulate gene transcription,
47 30 estrogen has recently become a subject of vociferous research due to mounting evidence that it can also act non-genomically to alter cellular regulation (Falkenstein, Norman et al. 2000). This form of regulation is much faster than modulating gene transcription, and coupled with the observation that estrogen is synthesized in the axons of some neurons in the brain, it presents the exciting prospect that estrogen, indeed many hormones, may act as neuromodulators (Towart, Alves et al. 2003). Estrogen generates a barrage of genomic effects on a broad spectrum of cell types in many parts of the brain through cytosolic estrogen receptors (ERs). It is a critical signal in neural development and sexual differentiation in the brain. It acts as a neuroprotectant and has been proposed as a potential adjunct treatment to reduce the symptoms or delay the onset of several diseases, such as Parkinsons, Alzheimers, schizophrenia, and HIV dementia (Toran-Allerand, Singh et al. 1999; Brooke and Sapolsky 2000; Hoff, Kremen et al. 2001; Kulkarni, Riedel et al. 2001; Kajta and Beyer 2003; MacLusky, Chalmers-Redman et al. 2003). It has also been suggested that estrogen can modulate neuronal plasticity related to psychostimulant abuse and learning and memory (Zhou, Cunningham et al. 2002), and changes in neurotransmitter (NT) synthesis and receptor expression (Kritzer and Kohoma 1998; Zhou, Cunningham et al. 2002). My working hypothesis is that some of these effects might depend on estrogen's role as a neuromodulator. Estrogen rapidly acts on a variety of cell-signaling pathways in an ERindependent fashion (Toran-Allerand, Singh et al. 1999). The nature of which nontranscriptional pathway is activated depends on the brain region studied, the type of neurotransmitter modulated, and the concentration range of estrogen used. Estrogen appears to activate the phosphoinositol-3-kinase (PI3K) pathway in GABAergic cells, phosphorylate Akt, a Ser/Thr kinase, in hippocampal cells (Znamensky, Akama et al. 2003), activate the mitogen-activated
48 31 protein kinase (MAPK) pathway in astrocytes (Beyer, Ivanova et al. 2002), and increase camp in dopaminergic cells, although multiple pathways are likely activated in all cells. In PC12 cells, estrogen has been reported to act as an inhibitor of ATP-induced calcium rise (Liu, Hsieh et al. 2001), and to stimulate camp (Machado, Alonso et al. 2002), cgmp (Chen, Yu et al. 1998), and inositol triphosphate (IP3) production (Liu, Hsieh et al. 2001). It is unclear why so many pathways are under control of the same modulator, and might reflect the multitude of ERs available to bind the steroid. Understanding the role of these signaling systems may offer insight into new ways to exploit hormones to treat mental and neurodegenerative diseases. The recent discovery of a new family of hormone-stimulated G-protein coupled receptors (GCPRs), as well as subpopulations of membrane-tethered ERs, provides the necessary machinery for estrogen to act as a fast neuromodulator of plasma membrane targets, such as ion channels (Falkenstein, Heck et al. 1999; Falkenstein, Tillmann et al. 2000; Falkenstein and Wehling 2000; Razandi, Oh et al. 2002; Singh, Shaul et al. 2002; Zhu, Rice et al. 2003). These membrane receptors also explain how membrane-impermeable estrogen derivatives such as BSA- or dendrimer-conjugated-e2 reproduce estrogen's effects on cell signaling. Nevertheless, some of these fast effects remain dependent on classical ERs because the effects can be blocked with a pure ER antagonist (ICI182,780). I believe the following experiments provide some preliminary evidence for my estrogenneuromodulator hypothesis. Wetzel and coworkers have demonstrated that the time interval between neurotransmitter exposure and estrogen exposure alters the kinetics of the cell s resulting ion channel currents (Wetzel, Hermann et al. 1998). When the cell is pre-exposed to estrogen, serotonin induces a much weaker current response than when the two are applied simultaneously. Pre-incubation with equine estrogens has a similar potentiating effect on 25 µm
49 32 glutamate-induced cell calcium changes in neurons, but has an inhibitory effect on the effects of 200 µm glutamate (Nilsen et al., 2002). Previously, Machado and coworkers measured quantal release of catecholamines from adrenal chromaffin cells with amperometry in the presence of estrogen. Their experiments show that estrogen alters the shapes of amperometric peaks in adrenal chromaffin cells. Furthermore, nanomolar quantities of estrogen raise intracellular camp and slow vesicle fusion during exocytosis (Machado, Alonso et al. 2002). Others have suggested that estrogen might supress secretion by inhibiting L and N-type calcium channels in PC12 cells (Kim, Hur et al. 2000). Together, these data suggest that modulation of presynaptic firing or secretion patterns may be one mechanism of estrogen-mediated neural signal processing. The findings of these groups underscore the need to study the effects of estrogen using sensitive analytical and precise temporal methods. To this end, I have applied the electrochemical and imaging methods described in Chapter 1. Chapter 2 of this thesis outlines the inhibitory effects of 17-β-estradiol (E2) on stimulated exocytosis in PC12 cells. E2 appears to inhibit stimulated catecholamine secretion with an unusual biphasic dose-response curve, effective at 10 nm and 50 µm, but ineffective at 1 µm. Through a variety of manipulations related to limiting various sources of calcium needed to drive exocytosis, I demonstrate that E2 inhibits exocytosis by blocking calcium that is normally released from intracellular stores when voltage-gated channels are activated (a phenomenon called calcium-induced calcium release or CICR). However, when exocytosis is initiated by selective recruitment of these internal ryanodine-sensitive calcium stores without the availability of extracellular calcium, E2 does not inhibit exocytosis. Taken together, it would seem that E2 has inconsistent effects, but when considered in light of additional experiments described, the most parsimonious explanation is that E2 does not directly block release of calcium at any one
50 33 source but rather decouples the machinery responsible for coupling membrane ion channels and intracellular, ryanodine-sensitive stores. I also observed estrogen directly evoking cytosolic calcium changes on a fast time scale at physiological picomolar-to-nanomolar levels. These calcium changes were coupled to catecholamine secretion in PC12 cells with the exact same biphasic dose-response profile observed for the inhibitory effects of E2. Specifically, exocytotic bursts of secretion occurred during the application of E2 primarily at 10 nm and 50 µm, and rarely at 1 µm. Similar, but nonidentical effects were also observed with the hypothalamic-derived immortalized GnRHsecreting cell line, GT1-7 (Mellon et al., 1990). Both cell lines provide substantially different phenotypes and genetic expression patterns, making direct comparisons an efficient means of screening for commonly shared aspects of the effects of E2 on presynaptic plasticity. GT1-7 and PC12 cells differ in that the GnRH-secreting line spontaineously oscillates and periodically synchronizes within networks (Vazquez-Martinez et al., 2001). Moreover, synchronization in this cell line and the corresponding primary culture (pituitary gonadotropes) is even enhanced by E2 (Goodman et al., 2002; Temple et al., 2004), making it an ideal model system on which to study the neuromodulatory effects of E2. In contrast, PC12 cells are easily stimulated but do not form synapses, much less display concerted oscillatory activity. They also express a different complement of estrogen receptors and voltage-gated calcium channels. Details on the E2- induced calcium fluxes are provided in Chapter 3. Evidence that the same concentration of E2 (10 nm) can both initiate secretion and inhibit stimulated secretion would seem to imply that these effects negate one another. However, there is a crucial difference in the timing of the initiating and inhibiting responses. When E2 directly initiates a calcium (or exocytosis) response, subsequent stimuli (depolarizing 100 mm
51 34 K + or caffeine) are ineffective at evoking a response. It would appear the the net effect of both the activating and suppressing actions of E2 is to change the timing of the secretion. Therefore, I propose that the purpose of both effects of E2 might be to synchronize networks of cells and summarize the supporting evidence in Chapter 4. Exocytotic plasticity mediated by membrane phospholipids The phopholipid bilayer encasing cells is a complex mixture of proteins, lipids, cholesterol, and signaling molecule precursors. As such, the cell membrane is the most important communication organelle in a cell, although most textbooks merely ascribe it homeostatic functions. The lipid composition of cell membranes is tightly regulated, and incubation with any one of a variety of its component phospholipids appears to substantially alter exocytosis. In a series of experiments conducted in collaboration with Yoshiko Niimura in the Ewing Lab, we have demonstrated that incubation with a variety of phospholipids leads to increases in the frequency or kinetics of exocytosis, depending on the lipid species examined. When analogous treatments are performed on cells examined with electron microscopy, changes in vesicle size and distribution within the cell are apparent. One species in particular, phosphatidylserine, leads to a 1.8-fold increase in exocytotic frequency and activity-dependent changes in vesicle distribution within the cell. These observations might be explained by increasing the probability any of many protein-vesicle interactions that depend on phosphatidylserine, and is discussed in Chapter 5. Vesicle Fusion kinetics altered by high osmolarity and L-DOPA treatment Just as phopholipid membrane composition effects exocytotic plasticity, so does changing the properties of membranes comprising vesicles. In a series of experiments carried out
52 35 by Leslie Sombers in the Ewing Lab, whom I assisted, we examine the effects of manipulating vesicular membranes in two ways. First, we showed that incubating cells in hypertonic saline to decrease membrane tension as water was leached from cells resulted in slower vesicle fusion kinetics. This was evident in changes to the shape of amperometric peaks. Second, we treated cells with the dopamine biosynthetic precursor L-DOPA. L-DOPA is known to be transported by the vesicular monoamine transporter (VMAT) into vesicles and converted to dopamine. This vesicle augmentation has been shown to be manifested as a change in vesicular volume, and the vesicles appear to swell in electron micrographs (Colliver et al., 2000; Gong et al., 2003). At the same time the treatment appears to increase membrane tension, leading to changes in the kinetics of vesicle fusion. These experiments are described in detail in Chapters 6, and 7. One unexpected phenomenon resulting from the dual treatment of PC12 cells with L- DOPA in hypertonic saline is a significant increase in the number of vesicles exhibiting multiple cores (about 16% of the population). These vesicles appear to be the product of homotypic fusion (vesicle-to-vesicle fusion within the cytosol) and might participate in exocytosis, as the distribution of quantal sizes detected by amperometry appears to include a subpopulation of large peaks similar in prevalence to the fraction of multicore vesicles observed with electron microscopy. I present experiments supporting this interpretation in Chapter References Ales E, Tabares L, Poyato JM, Valero V, Lindau M, Alvarez de Toledo G (1999) High calcium concentrations shift the mode of exocytosis to the kiss-and-run mechanism. Nat Cell Biol 1: Alvarez de Toledo G, Fernandez-Chacon R, Fernandez JM (1993) Release of secretory products during transient vesicle fusion [see comments]. Nature 363:
53 Amatore C, Bouret Y, Travis ER, Wightman RM (2000) Interplay between membrane dynamics, diffusion and swelling pressure governs individual vesicular exocytotic events during release of adrenaline by chromaffin cells. Biochimie 82: Anderova M, Duchene AD, Barbara JG, Takeda K (1998) Vasoactive intestinal peptide potentiates and directly stimulates catecholamine secretion from rat adrenal chromaffin cells. Brain Res 809: Angleson JK, Betz WJ (1997) Monitoring secretion in real time: capacitance, amperometry and fluorescence compared. Trends Neurosci 20: Archer DA, Graham ME, Burgoyne RD (2002) Complexin regulates the closure of the fusion pore during regulated vesicle exocytosis. J Biol Chem 277: Bennett JP, Cockcroft S, Gomperts BD (1979) Ionomycin stimulates mast cell histamine secretion by forming a lipid-soluble calcium complex. Nature 282: Benoit-Marand M, Jaber M, Gonon F (2000) Release and elimination of dopamine in vivo in mice lacking the dopamine transporter: functional consequences. Eur J Neurosci 12: Benoit-Marand M, Borrelli E, Gonon F (2001) Inhibition of dopamine release via presynaptic D2 receptors: time course and functional characteristics in vivo. J Neurosci 21: Bernstein BW, Bamburg JR (2003) Actin-ATP hydrolysis is a major energy drain for neurons. J Neurosci 23:1-6. Borges R (1997) The rat adrenal gland in the study of the control of catecholamine secretion. Semin Cell Dev Biol 8: Borges R, Travis ER, Hochstetler SE, Wightman RM (1997) Effects of external osmotic pressure on vesicular secretion from bovine adrenal medullary cells. J Biol Chem 272: Bouchelouche PN (1993) Dynamic, real time imaging of ion activities in single living cells using fluorescence video microscopy and image analysis. Scand J Clin Lab Invest Suppl 214: Bozza T, McGann JP, Mombaerts P, Wachowiak M (2004) In vivo imaging of neuronal activity by targeted expression of a genetically encoded probe in the mouse. Neuron 42:9-21. Bruns D, Jahn R (1995) Real-time measurement of transmitter release from single synaptic vesicles. Nature 377: Burgoyne RD, Barclay JW (2002) Splitting the quantum: regulation of quantal release during vesicle fusion. Trends Neurosci 25: Cahill PS, Walker QD, Finnegan JM, Mickelson GE, Travis ER, Wightman RM (1996) Microelectrodes for the measurement of catecholamines in biological systems. Anal Chem 68: Capella P, Ghasemzadeh MB, Adams RN, Wiedemann DJ, Wightman RM (1993) Real-time monitoring of electrically stimulated norepinephrine release in rat thalamus: II. Modeling of release and reuptake characteristics of stimulated norepinephrine overflow. J Neurochem 60: Cheek TR, Burgoyne RD (1986) Nicotine-evoked disassembly of cortical actin filaments in adrenal chromaffin cells. FEBS Lett 207: Chen G, Gavin PF, Luo G, Ewing AG (1995) Observation and quantitation of exocytosis from the cell body of a fully developed neuron in Planorbis corneus. J Neurosci 15: Chen G, Gutman DA, Zerby SE, Ewing AG (1996) Electrochemical monitoring of bursting exocytotic events from the giant dopamine neuron of Planorbis corneus. Brain Res 733:
54 Chen TK, Luo G, Ewing AG (1994) Amperometric monitoring of stimulated catecholamine release from rat pheochromocytoma (PC12) cells at the zeptomole level. Anal Chem 66: Chen YA, Scheller RH (2001) SNARE-mediated membrane fusion. Nat Rev Mol Cell Biol 2: Chen YA, Scales SJ, Scheller RH (2001) Sequential SNARE assembly underlies priming and triggering of exocytosis. Neuron 30: Chow RH, von Ruden L, Neher E (1992) Delay in vesicle fusion revealed by electrochemical monitoring of single secretory events in adrenal chromaffin cells. Nature 356: Clark RA, Ewing AG (1997) Quantitative measurements of released amines from individual exocytosis events. Mol Neurobiol 15:1-16. Colliver TL, Hess EJ, Ewing AG (2001) Amperometric analysis of exocytosis at chromaffin cells from genetically distinct mice. J Neurosci Methods 105: Colliver TL, Pyott SJ, Achalabun M, Ewing AG (2000) VMAT-Mediated changes in quantal size and vesicular volume. J Neurosci 20: Colliver TL, Hess EJ, Pothos EN, Sulzer D, Ewing AG (2000) Quantitative and statistical analysis of the shape of amperometric spikes recorded from two populations of cells. J Neurochem 74: Conley RK, Cumberbatch MJ, Mason GS, Williamson DJ, Harrison T, Locker K, Swain C, Maubach K, O'Donnell R, Rigby M, Hewson L, Smith D, Rupniak NM (2002) Substance P (neurokinin 1) receptor antagonists enhance dorsal raphe neuronal activity. J Neurosci 22: Dayton MA, Ewing AG, Wightman RM (1981) Evaluation of amphetamine-induced in vivo electrochemical response. Eur J Pharmacol 75: Ewing AG, Wightman RM, Dayton MA (1982) In vivo voltammetry with electrodes that discriminate between dopamine and ascorbate. Brain Res 249: Ewing AG, Bigelow JC, Wightman RM (1983) Direct in vivo monitoring of dopamine released from two striatal compartments in the rat. Science 221: Finnegan JM, Pihel K, Cahill PS, Huang L, Zerby SE, Ewing AG, Kennedy RT, Wightman RM (1996) Vesicular quantal size measured by amperometry at chromaffin, mast, pheochromocytoma, and pancreatic beta-cells. J Neurochem 66: Fisher RJ, Burgoyne RD (1999) The effect of transfection with Botulinum neurotoxin C1 light chain on exocytosis measured in cell populations and by single-cell amperometry in PC12 cells. Pflugers Arch 437: Garris PA, Wightman RM (1994) In vivo voltammetric measurement of evoked extracellular dopamine in the rat basolateral amygdaloid nucleus. J Physiol 478 (Pt 2): Gerhardt GA, Oke AF, Nagy G, Moghaddam B, Adams RN (1984) Nafion-coated electrodes with high selectivity for CNS electrochemistry. Brain Res 290: Gil A, Rueda J, Viniegra S, Gutierrez LM (2000) The F-actin cytoskeleton modulates slow secretory components rather than readily releasable vesicle pools in bovine chromaffin cells. Neuroscience 98: Gomez JF, Brioso MA, Machado JD, Sanchez JL, Borges R (2002) New Approaches for Analysis of Amperometrical Recordings. Ann NY Acad Sci 971: Gong LW, Hafez I, Alvarez de Toledo G, Lindau M (2003) Secretory vesicles membrane area is regulated in tandem with quantal size in chromaffin cells. J Neurosci 23: Gonon F, Buda M, Cespuglio R, Jouvet M, Pujol JF (1980) Nature 286:
55 Gonon F, Cespuglio R, Ponchon JL, Buda M, Jouvet M, Adams RN, Pujol JF (1978) [In vivo continuous electrochemical determination of dopamine release in rat neostriatum]. C R Acad Sci Hebd Seances Acad Sci D 286: Gonon F BM, Cespuglio R, Jouvet M, Pujol JF (1981) Brain Res 223: Goodman RL, Gibson M, Skinner DC, Lehman MN (2002) Neuroendocrine control of pulsatile GnRH secretion during the ovarian cycle: evidence from the ewe. Reprod Suppl 59: Graham ME, Burgoyne RD (2000) Comparison of cysteine string protein (Csp) and mutant alpha-snap overexpression reveals a role for csp in late steps of membrane fusion in dense-core granule exocytosis in adrenal chromaffin cells. J Neurosci 20: Graham ME, Barclay JW, Burgoyne RD (2004) Syntaxin/Munc18 interactions in the late events during vesicle fusion and release in exocytosis. J Biol Chem. Graham ME, Washbourne P, Wilson MC, Burgoyne RD (2002) Molecular Analysis of SNAP-25 Function in Exocytosis. Ann NY Acad Sci 971: Greene LA, Tischler AS (1976) Establishment of a noradrenergic clonal line of rat adrenal pheochromocytoma cells which respond to nerve growth factor. Proc Natl Acad Sci U S A 73: Hochstetler SE, Puopolo M, Gustincich S, Raviola E, Wightman RM (2000) Real-time amperometric measurements of zeptomole quantities of dopamine released from neurons. Anal Chem 72: Hollins B, Ikeda SR (1997) Heterologous expression of a P2x-purinoceptor in rat chromaffin cells detects vesicular ATP release. J Neurophysiol 78: Holz RW, Senter RA (1986) Effects of osmolality and ionic strength on secretion from adrenal chromaffin cells permeabilized with digitonin. J Neurochem 46: Ishizaki M, Oka Y (2001) Amperometric recording of gonadotropin-releasing hormone release activity in the pituitary of the dwarf gourami (teleost) [correction of (teleosat)] brainpituitary slices. Neurosci Lett 299: Iturriaga R, Cerpa V, Zapata P, Alcayaga J (2003) Catecholamine release from isolated sensory neurons of cat petrosal ganglia in tissue culture. Brain Res 984: Jaffe EH, Marty A, Schulte A, Chow RH (1998) Extrasynaptic vesicular transmitter release from the somata of substantia nigra neurons in rat midbrain slices. J Neurosci 18: Jankowski JA, Finnegan JM, Wightman RM (1994) Extracellular ionic composition alters kinetics of vesicular release of catecholamines and quantal size during exocytosis at adrenal medullary cells. J Neurochem 63: Kawagoe KT, Zimmerman JB, Wightman RM (1993) Principles of voltammetry and microelectrode surface states. J Neurosci Methods 48: Kennedy RT, Huang L, Atkinson MA, Dush P (1993) Amperometric monitoring of chemical secretions from individual pancreatic beta-cells. Anal Chem 65: Kim KT, Koh DS, Hille B (2000) Loading of oxidizable transmitters into secretory vesicles permits carbon-fiber amperometry. J Neurosci 20:RC101. Kishimoto T, Liu TT, Ninomiya Y, Takagi H, Yoshioka T, Ellis-Davies GC, Miyashita Y, Kasai H (2001) Ion selectivities of the Ca(2+) sensors for exocytosis in rat phaeochromocytoma cells. J Physiol 533: Kozminski KD, Gutman DA, Davila V, Sulzer D, Ewing AG (1998) Voltammetric and Pharmacological Characterization of Dopamine Release from Single Exocytotic Events at Rat Pheochromocytoma (PC12) Cells. Analytical Chemistry 70:
56 Kuhr WG, Wightman RM, Rebec GV (1987) Dopaminergic neurons: simultaneous measurements of dopamine release and single-unit activity during stimulation of the medial forebrain bundle. Brain Res 418: Lieste JR, Scheenen WJ, Jenks BG, Roubos EW (1998) Single cell secretion measurements by amperometry in Xenopus melanotropes. Ann N Y Acad Sci 839: Liu G (2003) Presynaptic control of quantal size: kinetic mechanisms and implications for synaptic transmission and plasticity. Curr Opin Neurobiol 13: Mellon PL, Windle JJ, Goldsmith PC, Padula CA, Roberts JL, Weiner RI (1990) Immortalization of hypothalamic GnRH neurons by genetically targeted tumorigenesis. Neuron 5:1-10. Michael DJ, Wightman RM (1999) Electrochemical monitoring of biogenic amine neurotransmission in real time. J Pharm Biomed Anal 19: Neco P, Rossetto O, Gil A, Montecucco C, Gutierrez LM (2003) Taipoxin induces F-actin fragmentation and enhances release of catecholamines in bovine chromaffin cells. J Neurochem 85: Nilsen J, Chen S, Brinton RD (2002) Dual action of estrogen on glutamate-induced calcium signaling: mechanisms requiring interaction between estrogen receptors and src/mitogen activated protein kinase pathway. Brain Res 930: Paras CD, Kennedy RT (1995) Electrochemical detection of exocytosis at single rat melanotrophs. Anal Chem 67: Phillips PE, Hancock PJ, Stamford JA (2002) Time window of autoreceptor-mediated inhibition of limbic and striatal dopamine release. Synapse 44: Pihel K, Travis ER, Borges R, Wightman RM (1996) Exocytotic release from individual granules exhibits similar properties at mast and chromaffin cells. Biophys J 71: Ponchon JL, Cespuglio R, Gonon F, Jouvet M, Pujol JF (1979) Normal pulse polarography with carbon fiber electrodes for in vitro and in vivo determination of catecholamines. Anal Chem 51: Pothos EN (2002) Regulation of dopamine quantal size in midbrain and hippocampal neurons. Behav Brain Res 130: Pothos EN, Davila V, Sulzer D (1998) Presynaptic recording of quanta from midbrain dopamine neurons and modulation of the quantal size. J Neurosci 18: Pothos EN, Sulzer D, Hoebel BG (1998) Plasticity of quantal size in ventral midbrain dopamine neurons: possible implications for the neurochemistry of feeding and reward. Appetite 31:405. Pothos EN, Przedborski S, Davila V, Schmitz Y, Sulzer D (1998) D2-Like dopamine autoreceptor activation reduces quantal size in PC12 cells. J Neurosci 18: Pothos EN, Larsen KE, Krantz DE, Liu Y, Haycock JW, Setlik W, Gershon MD, Edwards RH, Sulzer D (2000) Synaptic vesicle transporter expression regulates vesicle phenotype and quantal size. J Neurosci 20: Pothos EN, Mosharov E, Liu KP, Setlik W, Haburcak M, Baldini G, Gershon MD, Tamir H, Sulzer D (2002) Stimulation-dependent regulation of the ph, volume and quantal size of bovine and rodent secretory vesicles. J Physiol 542: Sawamoto K, Nakao N, Kakishita K, Ogawa Y, Toyama Y, Yamamoto A, Yamaguchi M, Mori K, Goldman SA, Itakura T, Okano H (2001) Generation of dopaminergic neurons in the adult brain from mesencephalic precursor cells labeled with a nestin-gfp transgene. J Neurosci 21:
57 Sawamoto K, Nakao N, Kobayashi K, Matsushita N, Takahashi H, Kakishita K, Yamamoto A, Yoshizaki T, Terashima T, Murakami F, Itakura T, Okano H (2001) Visualization, direct isolation, and transplantation of midbrain dopaminergic neurons. Proc Natl Acad Sci U S A 98: Schmitz Y, Benoit-Marand M, Gonon F, Sulzer D (2003) Presynaptic regulation of dopaminergic neurotransmission. J Neurochem 87: Schmitz Y, Lee CJ, Schmauss C, Gonon F, Sulzer D (2001) Amphetamine distorts stimulationdependent dopamine overflow: effects on D2 autoreceptors, transporters, and synaptic vesicle stores. J Neurosci 21: Schonfuss D, Reum T, Olshausen P, Fischer T, Morgenstern R (2001) Modelling constant potential amperometry for investigations of dopaminergic neurotransmission kinetics in vivo. J Neurosci Methods 112: Schroeder TJ, Borges R, Finnegan JM, Pihel K, Amatore C, Wightman RM (1996) Temporally resolved, independent stages of individual exocytotic secretion events. Biophys J 70: Schubert D, LaCorbiere M, Klier FG, Steinbach JH (1980) The modulation of neurotransmitter synthesis by steroid hormones and insulin. Brain Res 190: Sombers LA, Hanchar HJ, Colliver TL, Wittenberg N, Cans A, Arbault S, Amatore C, Ewing AG (2004) The effects of vesicular volume on secretion through the fusion pore in exocytotic release from PC12 cells. J Neurosci 24: Song JH, Slot AJ, Ryan RW, Ross GM (2004) Dopamine-induced death of PC12 cells is prevented by a substituted tetrahydronaphthalene. Neuropharmacology 46: Staal RG, Mosharov EV, Sulzer D (2004) Dopamine neurons release transmitter via a flickering fusion pore. Nat Neurosci 7: Suaud-Chagny MF, Chergui K, Chouvet G, Gonon F (1992) Relationship between dopamine release in the rat nucleus accumbens and the discharge activity of dopaminergic neurons during local in vivo application of amino acids in the ventral tegmental area. Neuroscience 49: Sulzer D, Pothos EN (2000) Regulation of quantal size by presynaptic mechanisms. Rev Neurosci 11: Temple JL, Laing E, Sunder A, Wray S (2004) Direct action of estradiol on gonadotropinreleasing hormone-1 neuronal activity via a transcription-dependent mechanism. J Neurosci 24: Travis ER, Wightman RM (1998) Spatio-temporal resolution of exocytosis from individual cells. Annu Rev Biophys Biomol Struct 27: Troyer KP, Wightman RM (2002) Temporal separation of vesicle release from vesicle fusion during exocytosis. J Biol Chem 277: Troyer KP, Heien ML, Venton BJ, Wightman RM (2002) Neurochemistry and electroanalytical probes. Curr Opin Chem Biol 6: Vazquez-Martinez R, Shorte SL, Boockfor FR, Frawley LS (2001) Synchronized exocytotic bursts from gonadotropin-releasing hormone-expressing cells: dual control by intrinsic cellular pulsatility and gap junctional communication. Endocrinology 142: Wang CT, Grishanin R, Earles CA, Chang PY, Martin TF, Chapman ER, Jackson MB (2001) Synaptotagmin modulation of fusion pore kinetics in regulated exocytosis of dense-core vesicles. Science 294:
58 Wiedemann DJ, Kawagoe KT, Kennedy RT, Ciolkowski EL, Wightman RM (1991) Strategies for low detection limit measurements with cyclic voltammetry. Anal Chem 63: Wightman RM, Strope E, Plotsky PM, Adams RN (1976) Monitoring of transmitter metabolites by voltammetry in cerebrospinal fluid following neural pathway stimulation. Nature 262: Wightman RM, Strope E, Plotsky P, Adams RN (1978) In vivo voltammetry: monitoring of dopamine metabolites in CSF following release by electrical stimulation. Brain Res 159: Wightman RM, Schroeder TJ, Finnegan JM, Ciolkowski EL, Pihel K (1995) Time course of release of catecholamines from individual vesicles during exocytosis at adrenal medullary cells. Biophys J 68: Wightman RM, Jankowski JA, Kennedy RT, Kawagoe KT, Schroeder TJ, Leszczyszyn DJ, Near JA, Diliberto EJ, Jr., Viveros OH (1991) Temporally resolved catecholamine spikes correspond to single vesicle release from individual chromaffin cells. Proc Natl Acad Sci U S A 88: Williams RJ (1979) The conformation properties of proteins in solution. Biol Rev Camb Philos Soc 54: Yoneda M, Nishizaki T, Tasaka K, Kurachi H, Miyake A, Murata Y (2000) Changes in actin network during calcium-induced exocytosis in permeabilized GH3 cells: calcium directly regulates F-actin disassembly. J Endocrinol 166: Zhao S, Maxwell S, Jimenez-Beristain A, Vives J, Kuehner E, Zhao J, O'Brien C, de Felipe C, Semina E, Li M (2004) Generation of embryonic stem cells and transgenic mice expressing green fluorescence protein in midbrain dopaminergic neurons. Eur J Neurosci 19:
59 42 CHAPTER 2 ESTRADIOL INHIBITION OF EXOCYTOSIS IN PC12 CELLS: DECOUPLING OF RYANODINE RECEPTORS FROM MEMBRANE ION CHANNELS 1. Introduction The molecular process for neurotransmitter secretion, exocytosis, is highly regulated and common to all secretory cells (Burgoyne and Morgan, 2003). In general, exocytosis results from the fusion of vesicles with the plasma membrane by a process that is initiated by elevated cytosolic calcium. The calcium necessary to drive exocytosis can come from the extracellular medium, intracellular calcium stores, the mitochondria, and even secretory vesicles (Mitchell et al., 2001). When a membrane is depolarized (by applying K +, for example), the primary source of calcium driving exocytosis comes from the extracellular medium via voltage-gated calcium channels (VGCCs) (Taylor and Peers, 1999). However, intracellular calcium stores can also contribute to changes in cytosolic calcium following the activation of VGCCs in a coordinated process called calcium-induced calcium release (CICR) (Verkhratsky and Shmigol, 1996). CICR amplifies the total calcium signal generated by depolarization, and also alters subcellular calcium gradients, producing elevated calcium further away from the plasma membrane, where a different class of calcium-regulated proteins or vesicle pools may be targeted (Ginty, 1997; Niggli, 1999; Hongpaisan et al., 2001). These non-uniform local calcium concentrations may play an important regulatory function for cell signaling and secretion. The frequency of exocytosis has been shown to depend on subcellular calcium microdomains (Becherer et al., 2003), and the coordinated regulation of calcium flux from multiple reserves may be involved in permitting some calcium-dependent processes to occur separately from others.
60 43 Calcium stores are also coupled to membrane calcium channels by another process: storeoperated calcium entry (SOCE). SOCE replenishes calcium stores after release by opening calcium release-activated calcium channels in the plasma membrane (Spassova et al., 2004). SOCE can also promote exocytosis independent of VGCC activation (Koizumi and Inoue, 1998; Taylor and Peers, 1999). The precipitating event leading to SOCE and CICR occurs in a different subcellular region for each phenomenon; membrane VGCCs trigger release from intracellular stores in the case of CICR, whereas release from intracellular calcium stores release triggers SOCE. The two phenomena share the same intracellular calcium stores in PC12 cells (e.g. ryanodine-sensitive calcium stores with CICR (Tully and Treistman, 2004) and SOCE (Bennett et al., 1998; Koizumi and Inoue, 1998)), but are believed to be activated by separate membrane ion channels in each case. 17-beta-estradiol (E2) is a neuromodulator known to affect calcium fluxes and intracellular signaling on a fast time scale through a membrane receptor (Mermelstein et al., 1996; Lee et al., 2002; Machado et al., 2002; Morales et al., 2003; Ronnekleiv and Kelly, 2005). The mechanism by which E2 influences calcium and exocytosis is not well understood, although understanding this may lend insight into the role of E2 in processes such as synaptic plasticity, neuroprotection, and synaptogenesis. All of these phenomena are affected by E2 (Toran-Allerand et al., 1999; Green and Simpkins, 2000; Kim et al., 2000; McEwen, 2001) and modulation of exocytosis underlies many of these adaptive processes in neurons. PC12 cells have been used frequently as a model to study presynaptic exocytosis machinery because they secrete dopamine from large dense-core vesicles, permitting detection of individual vesicle release events with carbon fiber amperometry (Chen et al., 1994). In addition, they possess regulated calcium stores, and have been used as model systems to study both CICR
61 44 and SOCE (Bennett et al., 1998; Tully and Treistman, 2004). PC12 cells also express estrogen receptors (Nilsen et al., 1998) and the effects of E2 on secretion have been demonstrated previously for this cell type (Kim et al., 2000). In this chapter, I have examined the effects of E2 on cytosolic calcium and exocytosis evoked by two different stimuli: depolarization with high extracellular K + and calcium-store release with caffeine. These stimuli provide different insights into how E2 affects the membrane and internal store components of CICR and SOCE, respectively. Herein, I provide evidence that E2 appears to suppress exocytosis initiated by either stimulus with an unusual bimodal dose dependence. Furthermore, E2 blocks CICR and SOCE, but does not inhibit the intracellular calcium stores common to CICR and SOCE. Careful pharmacological manipulation of the membrane and intracellular store components involved with CICR and SOCE leads to an extended explanation how E2 may regulate calcium flux following activation of a membranebound receptor: by decoupling calcium stores from membrane ion channels. 2. Materials and Methods Solutions The experimental bath solution was HEPES-buffered saline, comprised of 140 mm NaCl, 5 mm KCl, 2.2 mm CaCl 2, 2 mm MgCl 2, 10 mm HEPES, and 5 mm glucose. The ph was adjusted to The high K + depolarizing solution had the same composition as the saline only with KCl raised to 100 mm and NaCl lowered to 40 mm to maintain osmotic balance. All other treatments (e.g. E2, conotoxin, etc.) were dissolved into the HEPES-buffered saline. The ethanol used to dissolve E2 and other drugs was 0.2 % for all treatments. This concentration of ethanol had no effect on exocytosis or intracellular calcium in control experiments. For the digitonin
62 45 experiments, 10 µm digitonin was dissolved in saline with 0.2 % ethanol with 6 mm calcium and applied instead of K +. Nominally calcium free saline was prepared by omitting calcium from the HEPES-buffered saline recipe, without the addition of EGTA. E2-BSA was filtered by centrifugation through a 3 KDa cut-off filter (Microcon YM-3, Bedford, MA) prior to use to eliminate any residual free E2 from solutions. Cell culture PC12 cells were purchased from the American Type Culture Collection ( and maintained in RPMI 1640 (Mediatech/VWR: West Chester, PA) supplemented with 10 % equine serum (Hyclone: Logan, UT), 5 % fetal bovine serum (Hyclone: Logan, UT), and 100 units/ml Penicillin/Streptomycin (Gibco-Invitrogen: Carlsbad, CA) (Greene and Tischler, 1976). Cells were grown in collagen IV coated flasks without NGF, incubated at 5 % CO 2 and 37 C, and subcultured every 7-9 days or when confluency was reached. Experiments were performed on cells 4 to 7 days after subculturing. Carbon fiber amperometry Electrodes were prepared as described previously (Kozminski et al., 1998). Briefly, 5 µm carbon fibers were threaded into glass pipettes via aspiration and pulled using a commercial puller (P-97, Sutter Instruments, Novato, CA) to create a seal around the tip of the fiber. Electrode tips were cut to a uniform diameter of 8 µm (larger than the fiber diameter because of the encasing glass) with a razor blade on a microscope and dipped for 5 minutes in epoxy (Epotek-301, Billerica, MA) prior to heating for 24 to 72 hours at 100 C. On the day of experiments, electrode tips were beveled at 45 to produce a smooth electroactive disk surface
63 46 using a commercial micropipette beveler (BV-10, Sutter Instruments, Novato, CA). Beveled electrode tips were maneuvered to the surface of individual cells and lowered until the surface made contact with the cell, indicated by a slight deformation of the cell surface. Detection of catecholamines released from the cell was performed using an electrode held at a potential of +700 mv versus an Ag/AgCl reference electrode placed in the bath. Electrodes were tested immediately before and after each experiment in 100 µm DA to ensure sensitivity was maintained. Results were discarded from experiments where sensitivity was lost, which constituted < 10 % of the total. Cells were plated on 60 mm collagen IV coated dishes and tested at 37 C using an Olympus IX-70 inverted microscope. Micropipettes were pulled using a commercial puller and filled with secretogogue solutions (e.g. high K + depolarizing solution or E2 in saline) using microsyringes. These pipettes were positioned 100 µm from the experimental cell and solutions were ejected onto the cell (Picospritzer II, General Valve Corp) during experiments. For K + - evoked exocytosis, 3 successive 5 s pulses of 100 mm K + were applied at 40-second intervals. After, recording was suspended and the electrode raised for 10 minutes to allow the cell to recover. This period was intended to limit the effects of desensitization to the stimulus during the experiment. Ten minutes later a 45 s pulse of E2 or other drugs was applied immediately before the cell received 3 more successive 5 s pulses of K +. In situations where the objective was to eliminate the involvement of ion channels or calcium pools throughout the experiment, cells were exposed to drugs mixed into the K + stimulating and E2 solutions applied. During the 10- minute recovery period these drugs were washed out. In experiments where 30 mm caffeine was employed in the place of K +, only a single 5 s application of caffeine was used because significant store depletion occurred in preliminary tests employing 3 pulses of caffeine at 40 s
64 47 intervals. Similar to the K + experiments, the electrode was raised and recording suspended for 10 minutes to allow the cell to recover. Subsequently, E2 was applied simultaneously with a second 5 s application of caffeine. Stimulus desensitization was generally negligible under these conditions, as only minor changes in exocytosis were observed in control experiments where no drug was applied between the first and second sets of K + or caffeine pulses, as demonstrated in Figure 2.1. Data acquisition and analysis Amperometric data were recorded with an Axon 200B (Molecular Devices: Sunnyvale, CA) digitized at 5 khz and filtered at 2 khz and analyzed without subsequent filtering. Peaks were counted and characterized with the MiniAnalysis software detection algorithm (Synaptosoft, Decatur, GA). Peaks were detected if both the amplitude of local maxima and the area under the curve exceeded a threshold of five times the root-mean-squared noise for a flat, 2 s recording acquired prior to each experiment (Colliver et al., 2000). Peaks were visually inspected to confirm that electrical noise was not included and to manually include peaks that were not detected due to their proximity in the current trace. Overlapping events were discarded if the baseline for each peak could not be extrapolated using a built-in software algorithm. In cases where peaks appeared to rise above a broader background current, the detection algorithm assigned a baseline for the peak to the level of the background current. On average, 190 ± 11 and 43 ± 6 events were detected for the three K + and the one initial caffeine stimulation, respectively. For each single-cell experiment, the number of amperometric peaks after drug treatment was divided by the number before treatment to calculate the change in exocytosis. Thus, a decrease in stimulus-evoked peaks following the application of a drug was interpreted to mean
65 48 that the drug reduces the frequency of stimulated exocytosis. Because the number of peaks evoked by the same stimulus can vary greatly from cell to cell, a quotient of the number of stimulated peaks after treatment over the number before was calculated for each cell prior to averaging. This approach leads to less sampling bias than pooling peaks from all cells prior to averaging because each cell is represented equally in the mean (Colliver et al., 2000). The mean of cell quotients was multiplied by 100 percent and reported as the percent change in exocytosis in figures. All statistical comparisons between groups employed a critical value of p < Two-tailed T-tests were used to compare treatment groups to control. The Dunnett test was used when multiple concentrations of E2 were compared to effects observed in control, untreated cells. All data with error bars are reported as mean ± SEM. Intracellular calcium imaging Fluo-4 AM (Molecular Probes: Eugene, OR) was loaded into cells using standard methods (Gee et al., 2000; Perret et al., 2001). Briefly, cells were incubated with 8 µm fluo-4 dye dissolved in 0.1% DMSO in phosphate buffered saline in the dark at 37 ºC for 40 min to allow the dye to access the cytosol and become trapped by deesterification, then washed and placed on an Olympus IX-70 inverted scope in HEPES-buffered saline. Image Pro Plus (Media Cybernetics) was used to acquire images at Hz and ImageJ (NIH) was used to measure intensities. Image data was normalized to the pre-stimulus intensity and background corrected for fluctuations in light-source using a Mathcad program generated in-house. Only cells that responded to a control stimulus (30 mm caffeine or 100 mm K + ) with greater than a 5 % increase were included in the analysis, as not all cells concentrated the dye.
66 49 3. Results Estradiol inhibits depolarization-evoked exocytosis E2 inhibited K + -stimulated exocytosis in a biphasic manner with a maximum inhibition of 67 ± 7 % at 100 µm, the highest concentration of E2 tested (Figure 2.1b, triangles). Application of E2 also resulted in a 42 ± 9 % inhibition when administered at physiologically relevant levels (10 nm), although intermediate doses (1 µm to 5 µm) were not effective. The size and shape of individual amperometric peaks were unaffected by E2, indicating that E2 did not have any direct effects on the exocytosis machinery (data not shown), but the number of K+stimulated events decreased (Figure 2.1a). Inhibition of quantal release by E2 was immediate. Co-application of E2 and K + together resulted in the same amount of inhibition as treatment with E2 90 s prior to K + at the concentrations of E2 tested (10 and 100 µm, data not shown).
67 Figure 2.1. Dose-dependency of estradiol-mediated inhibition of exocytosis. (a): Typical amperometric trace of exocytosis events from a PC12 cell. In this experiment, one cell is stimulated three times for 5 s with 100 mm K + and allowed to recover to 10 min (denoted by break in trace). Afterwards, the cell is exposed to a 45 s pulse of 10 nm E2 and stimulated three more times with K +. Note that fewer peaks are observed following exposure to E2, whereas the same number is observed, on average, when no E2 is applied. Peak amplitude, rise time, decay time, and quantal size were invariant at all E2 concentrations. (b): The average ratio of the number of peaks after divided by the number before for each treatment, converted to a percent. Similar dose-response curves are observed for estrogen-mediated inhibition of exocytosis when either K + (triangles) or caffeine (circles) are used to stimulate PC12 cells. Y-axis: Values less than 100 % denote a decrease in exocytosis following treatment. X-axis: concentration of E2 applied. Data for K + are the average of n = 16 (control), 11 (10 pm), 14 (2.5 nm), 16 (10 nm), 12 (1 µm), 6 (5 µm), 8 (10 µm), and 12 (50 µm) experiments. Data for caffeine are the average of n = 9 (control), 17 (100 pm), 11 (10 nm), 15 (100 nm) 15 (1 µm), 17 (5 µm), and 6 (50 µm) experiments. * The reduction in exocytosis following application of 10 nm, 10 µm, 50 µm, and 100 µm E2 is significantly different from the K + -evoked exocytosis control group by the Dunnett test (p < 0.05). Similarly, 10 nm and 50 µm E2 are significantly different from the caffeineevoked exocytosis control group by the Dunnett test (p < 0.05). 50
68 51 I also examined cells pre-treated for 24 hours with 10 nm E2, a concentration known to activate genomic pathways through nuclear estrogen receptors. Following this 24 h pre-treatment with 10 nm E2, K + -evoked exocytosis decreased by 55 ± 8 % after a brief exposure to 50 µm E2 (T-test, p < versus control, n = 9; data not shown). This decrease was not significantly different (T-test, p = 0.87) from the inhibition observed after exposure to the same concentration of E2 in naïve cells, which was 62 ± 6 %. Inhibition appeared to require membrane integrity and/or regulated calcium entry, as E2 did not significantly reduce exocytosis in digitonin-permeabilized cells compared to untreated digitonin-permeabilized control cells (data not shown). E2 inhibited K + -evoked exocytosis by 41 ± 23 % in permeabilized cells compared to naïve permeabilized cells (n = 12 for E2; n = 16 for control). However, this difference was not significant, due in part to the more variable exocytic response observed in permeabilized cells (T-test, p = 0.18). Membrane impermeant E2-BSA applied at either 10 nm (n = 13) or 50 µm (n = 9) also inhibited K + -evoked exocytosis by 39 ± 13 % percent and 38 ± 11 %, respectively. The decrease in exocytosis was significantly lower than control (T-test, p < 0.05), and not different from the inhibition seen with membrane permeable E2 at the same concentrations (T-test, p = 0.12 for 50 µm E2, p = 0.69 for 10 nm E2) (Figure 2.2).
69 Figure 2.2. Comparisons of the change in exocytosis under conditions of varied E2 and inhibitors of calcium entry/release. Treatment with inhibitors of N-type VGCCs or RyRs eliminates the inhibitory effects of E2 on exocytosis. Top: sample trace illustrates procedure for introducing inhibitors both during test stimulations and during E2 exposure. Data are shown at both 10 nm and 50 µm E2, concentrations that significantly reduced exocytosis when compared to control cells. Exocytosis following exposure to E2 was not significantly different from control when dantrolene (75 µm) or ω-conotoxin GVIA (500 nm) were added to cells with the K + - stimulating solution prior to E2 exposure. Membrane impermeable E2-BSA also inhibited both K + and caffeine-evoked exocytosis similar to E2. Each bar represents average of 8 to 16 cells as noted. *, **, and *** denote a significant difference from control by T-test with p values of < 0.05, < 0.01, and < 0.001, respectively. 52
70 53 Estradiol inhibits calcium-induced calcium release (CICR) Exocytosis initiated by depolarization with K + depends primarily on L and N-type VGCCs in PC12 cells (Taylor and Peers, 1999). I used the N-type VGCC antagonist, ω- conotoxin GVIA (Hirning et al., 1988), and the L-type VGCC antagonist, nimodipine, to test whether these channels were involved in the secretion inhibited by E2. Following application of 500 nm ω-conotoxin, a decrease in K + -evoked exocytosis of 60 ± 11 % was observed, similar to that observed for 50 µm E2 alone (62 ± 6 %). Application of both E2 and ω-conotoxin resulted in 56 ± 6 % inhibition; this effect was not different from that observed when either agent was applied alone (T-test, p = 0.79 versus ω-conotoxin and p = 0.79 vs E2; Table 2.1). Application of 10 µm nimodipine decreased secretion by 27 ± 9 %, an amount that was statistically different from control (T-test, p < 0.05). However, application of both 10 µm nimodipine and 50 µm E2 decreased secretion by 60 ± 9 % (T-test: p < 0.05 vs. nimodipine alone; p < vs. control), an amount greater than the inhibition observed with nimodipine alone (Table 2.1). The additional inhibition seen following co-application of both E2 and nimodipine suggests that E2 does not inhibit exocytosis via L-type VGCCs (Table 2.1). 53
71 54 Table 2.1. E2 inhibition of exocytosis depends on N-type but not L-type VGCCs in PC12 cells. A sample trace illustrates when the VGCC inhibitors were applied. In these experiments, VGCC antagonists were applied simultaneously with or without E2. Percent inhibition is reported as the difference from 100 percent and was calculated as the ratio of the number of K + -stimulated amperometric peaks after treatment divided by the number before treatment, multiplied by 100 percent. Concentrations used were 50 µm for E2, 500 nm for ω-conotoxin (an N-type VGCC blocker), and 10 µm for nimodipine (an L-type VGCC blocker). *,**, and *** denote a difference from control using a T-test with p values of < 0.05, < 0.01, and < 0.001, respectively. Denotes a difference from nimodipine group (T-test, p < 0.05). Treatment Inhibition (%) N (cells tested) E2 62 ± 6 ** 12 ω-conotoxin 60 ± 11 ** 7 ω-conotoxin + E2 56 ± 6 *** 8 nimodipine 27 ± 9 * 13 nimodipine + E2 60 ± 9 ***, 11 To test whether the action of E2 on N-type VGCCs was sufficient to account for its inhibition of exocytosis, I pretreated cells with 500 nm ω-conotoxin and compared the frequency of K + -evoked exocytosis before and after exposure to E2 in these cells. The inhibition of stimulated exocytosis by E2 was fully abolished in cells when N-type VGCC involvement was eliminated (Figure 2.2). Inhibition by E2 was abolished at both 50 µm and 10 nm by the presence of ω-conotoxin, suggesting that E2 affected stimulated exocytosis in a manner that involved N-type VGCCs at both concentrations. This result was surprising, as E2 does not inhibit stimulated exocytosis at intervening concentrations (1 µm and 5 µm, Figure 2.1) and therefore could have employed different inhibitory mechanisms at the two concentrations. Although N- type VGCCs appear to be required, this experiment alone does not imply that E2 acts directly on 54
72 55 N-type VGCCs to inhibit exocytosis because calcium flux via N-type VGCCs has been reported to trigger CICR in PC12 cells under these conditions (Tully and Treistman, 2004). In cells pretreated with 75 µm dantrolene to block ryanodine receptors (RyRs), the calcium store release channel activated by N-type VGCCs in PC12 cells (Tully and Treistman, 2004), E2 failed to inhibit K + -initiated exocytosis (Figure 2.2). Moreover, the effects of E2 on exocytosis were absent at both 10 nm and 50 µm. Thus it appears that the inhibitory effects of E2 on K + -induced exocytosis were absent when either N-type VGCCs or RyRs were blocked. Because CICR follows N-type VGCC activation, it was necessary to discern whether E2 could inhibit exocytosis by directly blocking calcium flux from N-type VGCCs, or whether E2 s inhibitory effects were limited to CICR. I employed fluo-4 calcium imaging and applied K + in the presence of dantrolene and nifedipine to pharmacologically isolate N-type VGCCs. The K + - induced calcium rise was expected to reflect calcium entry primarily through N-type VGCCs, as RyRs and L-type VGCCs were blocked by danrolene and nifedipine, respectively. Under these conditions, cells responded to three successive 5 s applications of K + with transient fluorescence increases that gradually declined in amplitude (Figure 2.3a). Ten minutes later, application of K + to the same cells produced similar peaks. This K + response was similar in cells whether or not 10 nm E2 was applied prior to the K + stimulations (Figure 2.3b). In contrast, adding ω-conotoxin to the K + -stimulation solution blocked the evoked calcium rise by 89 % (Figure 2.3c). Although the peaks declined in amplitude with repeated stimulation, this decline was not accelerated by E2, as peaks were about 30 % smaller following E2, but 60 % reduced under control conditions. Therefore, E2 did not appear to inhibit exocytosis by blocking the calcium rise resulting from N- type VGCC activation. 55
73 56 Figure 2.3. E2 does not block calcium influx via N-type VGCCs. (a): nifedipine (10 µm) and dantrolene (75 µm) were applied simultaneously with the K + -stimulating solution to block L- type VGCCs and RyRs respectively. Cells were exposed to this solution three times, resulting in three peaks. Ten minutes later, K + and the channel blockers were reapplied three more times. (b): The experiment was repeated under the same conditions as in part (a), but 10 nm E2 was applied immediately prior to the second set of stimulations. Note that E2 does not block the subsequent relative calcium rise largely dependent on N-type VGCC current. (c): For comparison, a 5-s pulse of 100 mm K + was applied at the time point indicated by the first arrow, followed by three additional pulses of K + combined with nifedipine (10 µm ), dantrolene (75 µm), and ω- conotoxin GVIA (500 nm). The residual peaks likely reflect P/Q and R type calcium currents, which comprise about 11 % of the total. Note that K + leads to a significantly smaller calcium rise under conditions where N-type VGCCs are blocked compared with E2-treated cells. Y-axis: Fluorescence values were background subtracted and normalized to the initial pre-stimulus intensity, which was set at 100 %. Traces in (a), (b), and (c) are averages from 10, 56, and 15 cells, respectively. At least three experiments for each condition were performed with similar results. 56
74 57 Estradiol inhibits store-operated calcium entry (SOCE) Caffeine at concentrations above 1 mm releases calcium from ryanodine-sensitive stores by altering the calcium sensitivity of RyRs (Nieman and Eisner, 1985; Bennett et al., 1998), thus rendering them susceptible to being triggered open by basal calcium levels (Koizumi and Inoue, 1998). If caffeine is used to drain stores in the absence of extracellular calcium, subsequent restoration of bath calcium elicits a second cytosolic calcium increase as membrane calcium channels open to allow the stores to refill (SOCE). The particular ion channel dependence of SOCE is unclear, but it does not depend on VGCCs since it occurs in non-excitable cells, which lack VGCCs (Bode and Netter, 1996; Putney et al., 2001). Several groups report that exocytosis and SOCE are coupled in PC12 cells, and that caffeine-stimulated exocytosis requires SOCE (Koizumi and Inoue, 1998; Taylor and Peers, 1999). Therefore, an alternative method for probing the effects of E2 on ryanodine-sensitive calcium stores and SOCE is to examine whether E2 inhibits caffeine-evoked exocytosis. Estradiol appeared to inhibit caffeine-stimulated exocytosis over the range of concentrations tested (100 pm to 50 µm) with a similar biphasic concentration dependence to that observed with K + (Figure 2.1b, circles). When caffeine was used to evoke exocytosis, the maximum amount of inhibition observed with E2 occurred at 50 µm (86 ± 9 %), but physiological 10 nm E2 also inhibited exocytosis by 71 ± 14 %. Other concentrations (100 pm, 100 nm, 1 µm, 5 µm) were not significantly different from control (Figure 2.1b, circles). Membrane impermeant E2-BSA also mimicked the effects of E2 on caffeine-evoked exocytosis at 10 nm (Figure 2.2), but had an inconsistent effect at 50 µm, ranging from complete inhibition to a 2-fold increase in exocytosis (n=13; data not shown). 57
75 58 I observed caffeine-initiated exocytosis occurring in the absence of extracellular calcium in contrast to previous reports (Koizumi and Inoue, 1998; Taylor and Peers, 1999). However, fewer events were observed when extracellular calcium was absent and only 20 % of cells responded in calcium-free saline (data not shown). Estradiol did not block store-dependent exocytosis in calcium free saline, as I detected 76 events from 7 of 34 cells responding to caffeine, compared to 71 events from 4 of 21 cells responding to co-application of caffeine and 50 µm E2. When caffeine was applied twice to calcium-dye loaded cells in the absence of extracellular calcium, the rise in intracellular calcium resulting from the second application of caffeine was smaller than the first, due to depletion of the stores without refilling (Figure 2.4, first trace). Therefore, the amplitude ratio of the two caffeine-evoked peaks is proportional to the rate of calcium store drainage when extracellular calcium is removed from the matrix. When a 15-s pulse of E2 was applied before the second caffeine stimulus, the amplitude of the resulting peaks decreased in a manner similar to control (Figure 2.4). Simultaneous application of E2 with the second caffeine stimulus did not decrease the amplitude of the second caffeine-induced peak any greater than control over a range of E2 concentrations (10 nm to 50 µm, Figure 2.4, bottom plots). Although slight variation in the amplitude of the second caffeine-evoked peak was observed following exposure to E2, caffeine-evoked release was not abolished at any concentration. Therefore, release of intracellular calcium stores via ryanodine receptor activation did not appear to be inhibited by E2. 58

76 59 Figure 2.4. E2 does not suppress caffeine-evoked calcium store release. Top traces: Application of caffeine (30 mm) increases intracellular calcium in a calcium-free bath solution. A second application of caffeine 90 s later results in a reduced-amplitude calcium increase. Addition of E2 at various concentrations before the second caffeine peak does not suppress the caffeine-evoked calcium release. Ratio values of the average amplitude of the second peak to the first peak are indicated above the traces. Y-axis: Fluorescence values were background subtracted and normalized to the initial pre-stimulus intensity. Scale bar represents an increase of 50 %. X-axis: elapsed time in seconds. Bottom plot: Ratios of amplitudes (2 nd peak divided by 1 st peak) for cells treated with E2 either prior to or during the second application of caffeine are shown. Calcium release was not abolished at any concentration of E2 applied. Ratios differ between the top trace and bottom plots because the plots only include cells exceeding a 25 % increase in fluorescence, whereas traces include cells exceeding a 5 % increase. 59
77 60 Because E2 appeared to inhibit caffeine-stimulated exocytosis only when extracellular calcium was present (Figure 2.1), I examined the effects of E2 on cytosolic calcium following restoration of bath calcium to caffeine-treated cells, a paradigm used to examine SOCE (Taylor and Peers, 1999). If E2 was included with the calcium-containing saline that was reintroduced after caffeine application, SOCE was inhibited (Figure 2.5). The bimodal E2 dose-response profile for blocking SOCE mirrored the inhibition observed with E2 and caffeine-evoked exocytosis. In particular, 10 nm and 50 µm E2 inhibited SOCE by 87 and 90 %, compared to 71 and 86 % inhibition of exocytosis. In contrast, 1 µm E2 inhibited neither SOCE nor exocytosis. Taken together, these data suggest that E2 inhibits calcium-store-initiated exocytosis by inhibiting SOCE with little effect on the initial release of calcium from stores. 60
78 61 Figure 2.5. A biphasic response is observed in the inhibition of SOCE by E2. Top traces: SOCE, indicated by an increase in intracellular calcium fluorescence, is promoted when calcium is restored to the extracellular bath following exposure to caffeine in a calcium-free solution. The presence of 10 nm, 100 nm, or 50 µm E2 inhibits this SOCE. For clarity, only the fluorescence during restoration of extracellular calcium (SOCE) is shown and not the initial caffeine exposure. Bars: The maximum calcium increase during SOCE is plotted versus concentration of E2, as indicated along the bottom (N = 33 to 49 cells per condition). SOCE is significantly blocked by E2 at 10 nm, 100 nm, and 50 µm E2, whereas it is less inhibited by 100 pm or 1 µm E2, similar to the biphasic inhibition of E2 on exocytosis shown in Figure 2.1. The Dunnet test was used to compare treatments to control. *** indicates a difference from control cells at the p < significance level. Fluorescence values were background subtracted and normalized to the initial pre-stimulus intensity, which was set at 100 %. 61
79 62 4. Discussion The primary finding of this work is that the application of E2 immediately inhibits exocytosis in a biphasic dose-dependent manner, and that this fast inhibition seems to occur via a membrane receptor regardless of whether exocytosis is initiated by membrane calcium channels or intracellular calcium stores. Several mechanisms for this inhibition are considered below. Voltage-gated calcium influx in PC12 cells predominantly depends on two types of VGCCs, the L and N types (Taylor and Peers, 1999). I observed that E2 primarily inhibits exocytosis dependent on N-type VGCCs. However, it is unlikely that E2 directly blocks N-type VGCC flux, because pharmacologically isolated N-type VGCC calcium flux is not blocked by E2 (Figure 2.3). Calcium entering via N-type VGCCs has been shown to be amplified by CICR through RyRs in PC12 cells (Tully and Treistman, 2004), and I demonstrated that the inhibition of exocytosis by E2 is eliminated with antagonists for either N-type VGCCs or the RyRs responsible for CICR (Figure 2.2). These data suggest that E2 inhibits exocytosis primarily by inhibiting CICR (e.g. blocking calcium release through RyRs). To examine the possibility that E2 acts solely on RyRs, I also examined calcium release from ryanodine-sensitive stores with caffeine. Although E2 inhibits caffeine-evoked exocytosis with the same dose-dependence that it does K + -evoked exocytosis, E2 did not inhibit direct release from calcium stores (Figure 2.4); instead, E2 inhibits SOCE, and does so with a similar bimodal dose-dependence pattern to that observed with E2-mediated inhibition of stimulated exocytosis (Figure 2.5). The evidence that the machinery primarily affected by E2 is intracellular in one case (CICR) and membrane-localized in another (SOCE) can be explained by one of several possibilities. One possibility is that the membrane receptor might generate a diffusible signal that acts on both CICR and SOCE. However, the short latency of this effect (occurring within 62
80 63 seconds) seems to exclude extensive involvement of signal transduction cascades. Another explanation is that estrogen receptors, which are typically found in the cytosol, could dynamically regulate cytosolic calcium by interacting with other calcium-regulatory proteins. This alternative is not supported by the evidence that E2-BSA mimics the effects of E2 while not passing through the cell membrane. However, although E2-BSA might not cross the membrane, the membrane estrogen receptor might act on intracellular targets. ERβ, the form of the estrogen receptor found in PC12 cells (Nilsen et al., 1998), has been localized to both the membrane and cytosolic fractions in cells (Nishio et al., 2004; Moro et al., 2005). Thus, I cannot rule out the possibility that membrane ERβ binds E2 (or E2-BSA), becomes activated/phosphorylated, and then enters the cytosol where it dynamically regulates cytosolic calcium or RyRs. Demonstrating such a phenomenon would require many additional experiments and is beyond the scope of this work. A third, more likely possibility is that the putative membrane receptor for E2 couples directly to VGCCs and SOCE channels in a manner that can prevent coupling of these channels to RyRs. Functional coupling has been observed between TRPC channels and IP 3 receptors (Kiselyov et al., 2000; Putney and Ribeiro, 2000; Feske et al., 2006). RyRs appear to functionally couple with multiple channels in an analogous fashion, including VGCCs (Tully and Treistman, 2004), TRPC3 (Kiselyov et al., 2000), TRPC1 (Sampieri et al., 2005), the calcium release-activated calcium current (I CRAC ) (Kiselyov et al., 2001), and SCaMPER, a sphingolipidmodulated calcium channel (Cavalli et al., 2003). Moreover, additional evidence excludes the possibility RyRs are regulated by membrane channels solely via cytosolic calcium levels. In one experiment, the addition of cytosolic calcium buffers did not block the functional coupling between VGCCs and RyRs (Sham et al., 1995). Conversely, subcellularly localized calcium rises 63
81 64 (termed sparks ), generated by VGCCs triggering the opening of nearby RyRs, could not be triggered by the release of caged calcium (Lipp and Niggli, 1996). Similarly, if changes in cytosolic calcium alone were sufficient to propagate signals between VGCCs and RyRs and induce CICR, then both calcium flux via either L or N-type VGCCs would participate. The evidence contradicts this. In several cell types, CICR amplification is specific to either L or N- type VGCCs despite the presence of both channel types (Balkowiec and Katz, 2002; Tully and Treistman, 2004). In one preparation, even when both L and N-type VGCCs could elicit CICR, only CICR via N-type VGCCs altered cell excitability (Cordoba-Rodriguez et al., 1999). Consistent with this model, our data suggest that the effects of E2 involve N-type, but not L-type VGCCs, and can not be explained by a direct effect on N-type calcium flux by E2. Together, this suggests that a protein or messenger may coordinate signaling between intracellular stores and membrane ion channels, rather than calcium itself, and that E2 or E2 receptors affects whatever regulates coupling between RyRs, VGCCs, and SOCE channels. Importantly, this coupling may be a major regulatory site for secretion, as the majority of K + -stimulated exocytosis, up to 67 %, can be blocked by E2. Striking similarities in the dose-dependence of the inhibition by E2 suggests that E2 may suppress K + and caffeine-evoked exocytosis by a common mechanism (Figure 2.1). Inverted-U shaped dose-response curves, where higher concentrations have diminished effects, have been reported for E2 and other hormones (Lupien and McEwen, 1997; Rozovsky et al., 2002), but here I demonstrate that at even higher doses the efficacy of E2 to modulate exocytosis returns producing a complex S-shaped dose-response curve. It is possible that in previous experiments a wide-enough range of concentrations was not examined to observe the full range of efficacy. Nevertheless, the unusual response consistently observed here evades explanation. It is possible 64
82 65 that two or more competing processes produce an in-between concentration range where their effects negate each other. If this is correct, then our data suggest that both processes seem to employ a membrane E2 receptor, at least for the modulation of K + -evoked exocytosis. In addition to its role in regulating exocytosis described here, CICR might play a role in other phenomena. CICR can amplify other calcium signals (Verkhratsky and Shmigol, 1996), generate spatial variation in local cytosolic calcium concentrations (Niggli, 1999; Belmeguenai et al., 2002), and has been implicated in neuronal and synaptic plasticity (Alford et al., 1993; Frenguelli and Malinow, 1996; Rose and Konnerth, 2001; Solovyova et al., 2002), calcium oscillations (Maruyama et al., 1993), and neuroprotection (Frandsen and Schousboe, 1991). E2 has also been shown to modulate these same forms of plasticity (Cordoba Montoya and Carrer, 1997; Nilsen et al., 2002), calcium oscillations (Temple et al., 2004), and neuroprotection (Frandsen and Schousboe, 1991; Linford and Dorsa, 2002; Bhavnani et al., 2003) dependent on CICR. Despite similarities in the aforementioned phenomena affected by E2 that all involve CICR, reports of E2 directly affecting CICR are sparse in the literature. The only example to date is that of FKBP12.6 -/- knockout mice, which have augmented CICR leading to calcium overload and cardiac hypertrophy. In female KO mice, endogenous E2 appears to suppress CICR and prevent cardiac hypertrophy, as taxomifen (an estrogen-receptor antagonist) treated females display the same defects as males (Xin et al., 2002). The relationship between E2 and CICR warrants further attention, as it may lead to a better understanding of role that neurohormones play in regulating neuronal excitability and exocytosis in vivo. 65
83 66 5. References Alford S, Frenguelli BG, Schofield JG, Collingridge GL (1993) Characterization of Ca2+ signals induced in hippocampal CA1 neurones by the synaptic activation of NMDA receptors. J Physiol 469: Balkowiec A, Katz DM (2002) Cellular mechanisms regulating activity-dependent release of native brain-derived neurotrophic factor from hippocampal neurons. J Neurosci 22: Becherer U, Moser T, Stuhmer W, Oheim M (2003) Calcium regulates exocytosis at the level of single vesicles. Nat Neurosci 6: Belmeguenai A, Leprince J, Tonon MC, Vaudry H, Louiset E (2002) Neurotensin modulates the amplitude and frequency of voltage-activated Ca2+ currents in frog pituitary melanotrophs: implication of the inositol triphosphate/protein kinase C pathway. Eur J Neurosci 16: Bennett DL, Bootman MD, Berridge MJ, Cheek TR (1998) Ca2+ entry into PC12 cells initiated by ryanodine receptors or inositol 1,4,5-trisphosphate receptors. Biochem J 329 (Pt 2): Bhavnani BR, Berco M, Binkley J (2003) Equine estrogens differentially prevent neuronal cell death induced by glutamate. J Soc Gynecol Investig 10: Bode HP, Netter KJ (1996) Agonist-releasable intracellular calcium stores and the phenomenon of store-dependent calcium entry. A novel hypothesis based on calcium stores in organelles of the endo- and exocytotic apparatus. Biochem Pharmacol 51: Burgoyne RD, Morgan A (2003) Secretory granule exocytosis. Physiol Rev 83: Cavalli AL, O'Brien NW, Barlow SB, Betto R, Glembotski CC, Palade PT, Sabbadini RA (2003) Expression and functional characterization of SCaMPER: a sphingolipid-modulated calcium channel of cardiomyocytes. Am J Physiol Cell Physiol 284:C Chen TK, Luo G, Ewing AG (1994) Amperometric monitoring of stimulated catecholamine release from rat pheochromocytoma (PC12) cells at the zeptomole level. Anal Chem 66: Colliver TL, Hess EJ, Pothos EN, Sulzer D, Ewing AG (2000) Quantitative and statistical analysis of the shape of amperometric spikes recorded from two populations of cells. J Neurochem 74: Cordoba-Rodriguez R, Moore KA, Kao JP, Weinreich D (1999) Calcium regulation of a slow post-spike hyperpolarization in vagal afferent neurons. Proc Natl Acad Sci U S A 96: Cordoba Montoya DA, Carrer HF (1997) Estrogen facilitates induction of long term potentiation in the hippocampus of awake rats. Brain Res 778: Feske S, Gwack Y, Prakriya M, Srikanth S, Puppel SH, Tanasa B, Hogan PG, Lewis RS, Daly M, Rao A (2006) A mutation in Orai1 causes immune deficiency by abrogating CRAC channel function. Nature 441: Frandsen A, Schousboe A (1991) Dantrolene prevents glutamate cytotoxicity and Ca2+ release from intracellular stores in cultured cerebral cortical neurons. J Neurochem 56: Frenguelli BG, Malinow R (1996) Fluctuations in intracellular calcium responses to action potentials in single en passage presynaptic boutons of layer V neurons in neocortical slices. Learn Mem 3:
84 67 Gee KR, Brown KA, Chen WN, Bishop-Stewart J, Gray D, Johnson I (2000) Chemical and physiological characterization of fluo-4 Ca(2+)-indicator dyes. Cell Calcium 27: Ginty DD (1997) Calcium regulation of gene expression: isn't that spatial? Neuron 18: Green PS, Simpkins JW (2000) Neuroprotective effects of estrogens: potential mechanisms of action. Int J Dev Neurosci 18: Greene LA, Tischler AS (1976) Establishment of a noradrenergic clonal line of rat adrenal pheochromocytoma cells which respond to nerve growth factor. Proc Natl Acad Sci U S A 73: Hirning LD, Fox AP, McCleskey EW, Olivera BM, Thayer SA, Miller RJ, Tsien RW (1988) Dominant role of N-type Ca2+ channels in evoked release of norepinephrine from sympathetic neurons. Science 239: Hongpaisan J, Pivovarova NB, Colegrove SL, Leapman RD, Friel DD, Andrews SB (2001) Multiple modes of calcium-induced calcium release in sympathetic neurons II: a [Ca2+](i)- and location-dependent transition from endoplasmic reticulum Ca accumulation to net Ca release. J Gen Physiol 118: Kim YJ, Hur EM, Park TJ, Kim KT (2000) Nongenomic inhibition of catecholamine secretion by 17beta-estradiol in PC12 cells. J Neurochem 74: Kiselyov K, Shin DM, Shcheynikov N, Kurosaki T, Muallem S (2001) Regulation of Ca2+release-activated Ca2+ current (Icrac) by ryanodine receptors in inositol 1,4,5- trisphosphate-receptor-deficient DT40 cells. Biochem J 360: Kiselyov KI, Shin DM, Wang Y, Pessah IN, Allen PD, Muallem S (2000) Gating of storeoperated channels by conformational coupling to ryanodine receptors. Mol Cell 6: Koizumi S, Inoue K (1998) Functional coupling of secretion and capacitative calcium entry in PC12 cells. Biochem Biophys Res Commun 244: Kozminski KD, Gutman DA, Davila V, Sulzer D, Ewing AG (1998) Voltammetric and pharmacological characterization of dopamine release from single exocytotic events at rat pheochromocytoma (PC12) cells. Anal Chem 70: Lee DY, Chai YG, Lee EB, Kim KW, Nah SY, Oh TH, Rhim H (2002) 17Beta-estradiol inhibits high-voltage-activated calcium channel currents in rat sensory neurons via a non-genomic mechanism. Life Sci 70: Linford NJ, Dorsa DM (2002) 17beta-Estradiol and the phytoestrogen genistein attenuate neuronal apoptosis induced by the endoplasmic reticulum calcium-atpase inhibitor thapsigargin. Steroids 67: Lipp P, Niggli E (1996) Submicroscopic calcium signals as fundamental events of excitation-- contraction coupling in guinea-pig cardiac myocytes. J Physiol 492 (Pt 1): Lupien SJ, McEwen BS (1997) The acute effects of corticosteroids on cognition: integration of animal and human model studies. Brain Res Brain Res Rev 24:1-27. Machado JD, Alonso C, Morales A, Gomez JF, Borges R (2002) Nongenomic regulation of the kinetics of exocytosis by estrogens. J Pharmacol Exp Ther 301: Maruyama Y, Inooka G, Li YX, Miyashita Y, Kasai H (1993) Agonist-induced localized Ca2+ spikes directly triggering exocytotic secretion in exocrine pancreas. Embo J 12: McEwen BS (2001) Invited review: Estrogens effects on the brain: multiple sites and molecular mechanisms. J Appl Physiol 91:
85 68 Mermelstein PG, Becker JB, Surmeier DJ (1996) Estradiol reduces calcium currents in rat neostriatal neurons via a membrane receptor. J Neurosci 16: Mitchell KJ, Pinton P, Varadi A, Tacchetti C, Ainscow EK, Pozzan T, Rizzuto R, Rutter GA (2001) Dense core secretory vesicles revealed as a dynamic Ca(2+) store in neuroendocrine cells with a vesicle-associated membrane protein aequorin chimaera. J Cell Biol 155: Morales A, Diaz M, Ropero AB, Nadal A, Alonso R (2003) Estradiol modulates acetylcholineinduced Ca2+ signals in LHRH-releasing GT1-7 cells through a membrane binding site. Eur J Neurosci 18: Moro L, Reineri S, Piranda D, Pietrapiana D, Lova P, Bertoni A, Graziani A, Defilippi P, Canobbio I, Torti M, Sinigaglia F (2005) Nongenomic effects of 17beta-estradiol in human platelets: potentiation of thrombin-induced aggregation through estrogen receptor beta and Src kinase. Blood 105: Nieman CJ, Eisner DA (1985) Effects of caffeine, tetracaine, and ryanodine on calciumdependent oscillations in sheep cardiac Purkinje fibers. J Gen Physiol 86: Niggli E (1999) Localized intracellular calcium signaling in muscle: calcium sparks and calcium quarks. Annu Rev Physiol 61: Nilsen J, Mor G, Naftolin F (1998) Raloxifene induces neurite outgrowth in estrogen receptor positive PC12 cells. Menopause 5: Nilsen J, Chen S, Brinton RD (2002) Dual action of estrogen on glutamate-induced calcium signaling: mechanisms requiring interaction between estrogen receptors and src/mitogen activated protein kinase pathway. Brain Res 930: Nishio M, Kuroki Y, Watanabe Y (2004) Subcellular localization of estrogen receptor beta in mouse hippocampus. Neurosci Lett 355: Perret S, Dockery P, Harvey BJ (2001) 17beta-oestradiol stimulates capacitative Ca2+ entry in human endometrial cells. Mol Cell Endocrinol 176: Putney JW, Jr., Ribeiro CM (2000) Signaling pathways between the plasma membrane and endoplasmic reticulum calcium stores. Cell Mol Life Sci 57: Putney JW, Jr., Broad LM, Braun FJ, Lievremont JP, Bird GS (2001) Mechanisms of capacitative calcium entry. J Cell Sci 114: Ronnekleiv OK, Kelly MJ (2005) Diversity of ovarian steroid signaling in the hypothalamus. Front Neuroendocrinol 26: Rose CR, Konnerth A (2001) Stores not just for storage. intracellular calcium release and synaptic plasticity. Neuron 31: Rozovsky I, Hoving S, Anderson CP, O'Callaghan J, Finch CE (2002) Equine estrogens induce apolipoprotein E and glial fibrillary acidic protein in mixed glial cultures. Neurosci Lett 323: Sampieri A, Diaz-Munoz M, Antaramian A, Vaca L (2005) The foot structure from the type 1 ryanodine receptor is required for functional coupling to store-operated channels. J Biol Chem 280: Sham JS, Cleemann L, Morad M (1995) Functional coupling of Ca2+ channels and ryanodine receptors in cardiac myocytes. Proc Natl Acad Sci U S A 92: Solovyova N, Veselovsky N, Toescu EC, Verkhratsky A (2002) Ca(2+) dynamics in the lumen of the endoplasmic reticulum in sensory neurons: direct visualization of Ca(2+)-induced Ca(2+) release triggered by physiological Ca(2+) entry. Embo J 21:
86 69 Spassova MA, Soboloff J, He LP, Hewavitharana T, Xu W, Venkatachalam K, van Rossum DB, Patterson RL, Gill DL (2004) Calcium entry mediated by SOCs and TRP channels: variations and enigma. Biochim Biophys Acta 1742:9-20. Taylor SC, Peers C (1999) Store-operated Ca2+ influx and voltage-gated Ca2+ channels coupled to exocytosis in pheochromocytoma (PC12) cells. J Neurochem 73: Temple JL, Laing E, Sunder A, Wray S (2004) Direct action of estradiol on gonadotropinreleasing hormone-1 neuronal activity via a transcription-dependent mechanism. J Neurosci 24: Toran-Allerand CD, Singh M, Setalo G, Jr. (1999) Novel mechanisms of estrogen action in the brain: new players in an old story. Front Neuroendocrinol 20: Tully K, Treistman SN (2004) Distinct intracellular calcium profiles following influx through N- versus L-type calcium channels: role of Ca2+-induced Ca2+ release. J Neurophysiol 92: Verkhratsky A, Shmigol A (1996) Calcium-induced calcium release in neurones. Cell Calcium 19:1-14. Xin HB, Senbonmatsu T, Cheng DS, Wang YX, Copello JA, Ji GJ, Collier ML, Deng KY, Jeyakumar LH, Magnuson MA, Inagami T, Kotlikoff MI, Fleischer S (2002) Oestrogen protects FKBP12.6 null mice from cardiac hypertrophy. Nature 416:
87 70 CHAPTER 3 GPR30 AND ER-β: ANALYSIS OF ESTROGEN-DEPENDENT CALCIUM FLUX IN PC12 AND GT1-7 AND ITS COUPLING TO SECRETION 1. Introduction Calcium is a ubiquitous regulator of many cell processes. It controls cell communication, viability, and excitability. Recently, estradiol (E2) has been observed to affect calcium (Beyer and Raab, 1998; Nilsen et al., 2002; Wozniak et al., 2005). The near immediate effects of treatment with E2 to elevate or reduce calcium in cell culture have received a lot of attention not only because of the importance of this ion, but also because E2 has been primarily regarded as a hormone that acts via a nuclear receptor to promote gene transcription (Ronnekleiv and Kelly, 2005). Understanding the fast effects of E2 on calcium might help unravel other elusive mysteries about the function of E2 in the brain and its protective effects against several neurodegenerative diseases (Dhandapani and Brann, 2002). The potential role of E2 as a fast neuromodulator is further supported by the recent characterization of several membrane estrogen receptors (ERs) (Singh et al., 2002; Li et al., 2003; Thomas et al., 2004; Toran-Allerand, 2004; Funakoshi et al., 2006). The various subtypes vary in binding affinity (Zhu et al., 2006) and subcellular localization (Levin, 2001; Govind and Thampan, 2003). ER-α is present in the highest amounts in reproductive tissue and regulates the reproductive system (Koehler et al., 2005). The role of ER-α as a transcription factor is well established, but a fraction of the ER-α receptor pool might also act as a membrane receptor (Evinger and Levin, 2005). A second isoform, ER-β, is expressed with a different pattern to that of ER-α and is particularly enriched in some non-reproductive tissues, such as parts of the brain
88 71 (Milner et al., 2005). ER-β is expressed in the mitochondria, present in some plasma membranes, and in the nucleus (Milner et al., 2005). At present, the role of ER-β in neuroplasticity is unclear, although E2-dependent synaptic plasticity has been demonstrated in ER-β-positive hippocampal neurons (Nilsen et al., 2002; Milner et al., 2005). A third ER, GPR30, has also recently been found to bind E2 and is expressed in the brain (Funakoshi et al., 2006). It is fundamentally different from the others in that it is a G-protein coupled membrane receptor rather than a nuclear/cytosolic steroid receptor. GPR30 is localized to the membrane of the endoplasmic reticulum, golgi apparatus (Revankar et al., 2005), and the plasma membrane (Funakoshi et al., 2006). While it has been demonstrated to promote translocation of transcription factors to the nucleus like the steroid receptors, its subcellular localization and ability to mobilize intracellular calcium suggests it plays another role as well (Revankar et al., 2005). Recently, the availability of agonists selective for a specific subtype of ER has allowed us to examine the roles of these subtypes independently. The dissociation constants of selected compounds to ER-α, ER-β, and GPR30 are listed in Table 3.1 and their structures are presented in Figure 3.1. Unfortunately, a degree of cross-reactivity is inherent for all ER-α and ER-β agonists. However, employing multiple cell lines expressing different ER subtypes is one approach to elucidate commonalities in the responses as well as subtype-specific effects. By combining these data, I have examined the relevance of each receptor subtype to intracellular calcium dynamics and secretion. This will hopefully help clarify conflicting data in the literature. Previously, several groups have demonstrated that each receptor can affect cytosolic calcium, but the responses and downstream coupling to second messengers vary with cell-type. In addition, many of these experiments have been conducted in cell types that express different levels of GPR30, although the specific involvement of GPR30 was not examined, confounding results.
89 72 By coupling measurements of calcium response to measurements of catecholamine secretion in the PC12 neuroendocrine cell line using carbon fiber amperometry, I hope to examine one effect of estrogen-dependent calcium mobilization in greater detail. This work adds to our understanding of the many ways estrogen can affect cell activity via modulation of cytosolic calcium.
90 73 Table 3.1: Dissociation constants (K d ) for selected agonists to various estrogen receptors. Compound ER-α (nm) ER-β (nm) GPR30 (nm) E , 17.8 DPN n.d. ERB n.d. (R,R)-THC * n.d. G1 >1000 > BPA 108,000 25, E2-BSA n.d. EDC 6 n.d. n.d. References: E2 and ER- α\β (Zhu et al., 2006); E2 and GPR30 (Thomas et al., 2004; Revankar et al., 2005; Thomas and Dong, 2006); DPN (Meyers et al., 2001); ERB041 (Malamas et al., 2004); (R,R)-THC (Meyers et al., 1999); G1 (Bologa et al., 2006); BPA and ER α\β (Takemura et al., 2005) BPA and GPR30 (Thomas et al., 2004). E2-BSA (Ramirez et al., 1996); EDC (Harrington et al., 2006). Note that the K d reported for EDC assumes 20 E2 equivalents per dendrimer. * denotes antagonist at this receptor. n.d. indicates no data available. Figure 3.1 Structures of selected estrogen receptor agonists. 2. Materials and methods Materials The estrogen dendrimer conjugate (EDC) and its vehicle were a gift from John Katzenellenbogen s lab (University of Illinios). ERB041 was donated by GSK. The estrogen receptor subtype selective agonists DPN (cat#1494) and (R,R)-THC (cat#1990) were purchased from Tocris (Ellisville, MO). The GPR30 agonist G1 (cat#371705) was purchased from Calbiochem (San Diego, CA). All other materials were purchased from Sigma (St. Louis, MO).
91 74 Cell culture PC12 cells were purchased from the American Type Culture Collection ( and maintained in RPMI 1640 (Mediatech/VWR: West Chester, PA) supplemented with 10 % equine serum (Hyclone: Logan, UT), 5 % fetal bovine serum (Hyclone: Logan, UT), and 100 units/ml Penicillin/Streptomycin (Gibco-Invitrogen: Carlsbad, CA) (Greene and Tischler, 1976). Cells were grown in collagen IV coated flasks without NGF, incubated at 5 % CO 2 at 37 C, and subcultured every 7-9 days or when confluency was reached. Experiments were performed on cells 4 to 7 days after subculturing. Where cells were treated with NGF as noted in the text, exposure was to 50 µg/ml NGF for 5 days without replenishment of media and cells were used to collect data on day 5. GT1-7 cells were donated by Pam Mellon s lab (University of California, Berkeley) and were grown in DMEM (Mediatech cat# cm) supplemented with 10% fetal bovine serum and 100 units/ml Penicillin/Streptomycin (Mellon et al., 1990). Uncoated flasks and dishes were used and culture conditions were 7 % CO 2, 37 C. Cells were subcultured every 7 days or when 80 % confluency was reached. Calcium imaging Cells, between day 3 and day 7 after subculturing, were incubated in Fluo-4 AM (Molecular Probes, Eugene, OR). The amide ester (AM) form of the Fluo-4 dye passes through the cell membrane where it can be cleaved by endogenous cytosolic esterases to yield a soluble fluorescent calcium indicator. Fluorescence is proportional to cytosolic calcium concentration. The dye was dissolved in 0.1% DMSO in PBS to a final concentration of 8 µm and added to cells in the dark at 37ºC (Gee et al., 2000; Perret et al., 2001). After 40 minutes, the Fluo-4 was
92 75 washed out and replaced with the HEPES buffered saline described in the amperometry section. Prior to the application of E2 or its structural analogues, 3 5-s pulses of high 100 mm K + were applied to cells as a positive control to confirm cells were viable and that the dye was loaded and responsive. Then a 5-s pulse of either E2 or similar compound was applied to the cells and calcium changes were measured for 4 minutes. The fluorescent light source was subsequently turned off for 6 minutes. Recording was resumed and another 3 5-s pulses of 100 mm K + were applied to examine how the estrogens affected stimulated release. Images were recorded with a CCD camera on an Olympus IX-70 inverted microscope, normalized to the pre-stimulus intensity, and background substracted using a MathCad program. Only cells that responded to a control stimulus (100 mm K + ) with greater than a 10 % increase were included in the analysis. Amperometry Electrodes were prepared as described previously (Kozminski et al., 1998). Briefly, 5 µm carbon fibers were threaded into glass pipettes via aspiration and pulled using a commercial puller (P-97, Sutter Instruments, Novato, CA) to create a seal around the tip of the fiber. Electrode tips were cut to a uniform diameter of 8 µm (larger than the fiber diameter because of the encasing glass) with a razor blade on a microscope and dipped for 5 minutes in epoxy (Epotek-301, Billerica, MA) prior to heating in an oven for 24 to 72 hours at 100 C. On the day of experiments, electrode tips were beveled at 45 using a commercial micropipette beveler (BV- 10, Sutter Instruments, Novato, CA) to produce a smooth electroactive disk surface. Beveled electrode tips were maneuvered to the surface of individual cells and lowered until the electrode surface made contact with the cell, indicated by a slight deformation of the cell surface. Detection of catecholamines released from the cell was performed using an electrode held at a
93 76 potential of +700 mv versus an Ag/AgCl reference electrode placed in the bath. Electrodes were tested immediately before and after each experiment in 100 µm DA to ensure sensitivity was maintained. Results were discarded from experiments where sensitivity was lost. PC12 cells were plated on 60 mm collagen IV coated dishes and tested at 37 C using an Olympus IX-70 inverted microscope. Micropipettes were pulled using a commercial puller (Sutter P-97) and filled with secretogogue solutions (e.g. high K + depolarizing solution or E2 in saline) using microsyringes. These pipettes were positioned 100 µm from the experimental cell and solutions were ejected onto the cell (Picospritzer II, General Valve Corp) with continuous flow for preset durations during recordings. Amperometric data were recorded with an Axon 200B (Molecular Devices, Sunnyvale, CA) digitized at 5 khz and filtered at 2 khz then analyzed without subsequent filtering. Peaks were counted and characterized with the MiniAnalysis software detection algorithm (Synaptosoft, Decatur, GA). Peaks were detected if both the amplitude of local maxima and the area under the curve exceeded a threshold of five times the root-mean-squared noise for a flat, 2 s recording acquired prior to each experiment (Colliver et al., 2000). Peaks were visually inspected to confirm electrical noise was not included and to manually include peaks that were not detected due to their proximity to each other in the current trace. Overlapping events were discarded if the baseline for each peak could not be extrapolated using a built-in software algorithm in MiniAnalysis for double-peak detection. In cases where peaks appeared to rise above a broader background current, the detection algorithm assigned a baseline for the peak to the level of the background current.
94 77 Real-time PCR Relative mrna levels for ER-α, ER-β, and GPR30 were attained by a quantitative realtime polymerase chain reaction (PCR) experiment. Cell lysates were mixed with a specific primer for each receptor and amplification of native complementary mrnas were detected by an increase in fluorescence after each cycle. Relative abundances were estimated by differences in the number of PCR cycles required before fluorescence was detected (e.g. the threshold cycle, or C t ). All data were normalized using express levels of the housekeeping gene cyclophillin as a positive control (Livak and Schmittgen, 2001). Statistics All statistical comparisons between groups employed a critical value of p < In experiments where multiple treatments are compared to control, a one-way ANOVA with posthoc Dunnett t-test was employed. For direct comparisons between two groups, a two-tailed Student t-tests was used to compare the treatment group to control. All data with error bars are reported as mean ± SEM. 3. Results E2-evoked exocytosis is coupled to cytosolic calcium in PC12 cells Application of estradiol to PC12 cells promoted exocytosis in 75 % of cells examined at physiological levels (10 nm; n=16 cells) Exposure to the vehicle without E2 for the same duration produced only a few peaks in 10 control cells (data not shown). The latency to the onset of the E2 response varied from cell to cell and was manifested as short high frequency bursts of vesicle fusion events. Despite this variable delay, simultaneous measurement of cytosolic
95 78 calcium with amperometry revealed that the calcium response matched the onset of the amperometric bursts. Examples of both immediate and delayed responses to E2 are shown in Figure 3.2a and 3.2b. Repeating this experiment over a wide range of concentrations revealed a biphasic doseresponse curve for E2-induced exocytotic bursts. A significant amount of E2-evoked neurotransmitter secretion occurred with 10 nm E2 treatment, but also with 10 µm, 50 µm, and 100 µm E2 (Figure 3.2c). Picomolar and low micromolar concentations of E2 did not appear to evoke secretion in PC12 cells. The fraction of tested cells that exhibited bursts in response to E2 at each concentration also varied in a biphasic manner, similar to the magnitude of E2-evoked secretion observed from responsive cells (data not shown). 1 µm E2 evoked a small secretion response in only 10 % of cells tested, in contrast to the larger secretion response observed in 75 % and 60 % of cells treated with 10 nm and 50 µm E2, respectively. Thus, both the probability and magnitude of E2 exocytotic bursts varied in a biphasic manner and were correlated at the concentrations tested. Whereas the moles of DA detected from an E2-evoked exocytotic burst varied (Figure 3.2c), the quantal sizes of individual E2-evoked peaks were relatively constant at all E2 concentrations except 50 µm, which were slightly smaller than control peaks (p 0.05 vs. control, Dunnett t-test) (not shown). Peaks evoked by K + -stimulation before and after treatment with E2 did not change in quantal size or other peak parameters (rise, amplitude, decay, halfwidth) between groups of cells (compared using a one-way ANOVA with Tukey HSD, p > 0.05; data not shown). When viewed as a whole, these amperometric data suggest that of the concentrations tested 10 nm E2 is most effective at eliciting the greatest amount of immediate secretion (sum of areas of amperometric peaks) in the highest percentage of cells, and does not
96 79 directly influence vesicle fusion kinetics (because amperometric peak characteristics did not change).
97 Figure 3.2. E2-evoked exocytosis in PC12 cells. Simultaneous measurements of dopamine secretion (lower trace) and cytosolic calcium (overlay) from two individual PC12 cells are shown in (b) and (c). 10 nm E2 evoked exocytosis in 12 of 16 cells but the onset of the response varied between immediate (panel a; 7 of 16 cells) and delayed (panel b; 5 of 16 cells) responses. In both cases, the rise in intracellular calcium (measured simultaneously with Fluo-4) correlated with the onset of the exocytotic bursts. (c) Dotted lines and points indicate the total amount of DA (in attomoles (atto = ) detected following E2 treatment. Amounts are averaged from all cells that responded to E2 with at least 3 amperometric events, grouped by concentration of E2 applied. Attomoles of DA were obtained by summing the area under detected amperometric peaks and converting to moles by Faraday s equation, assuming 2 electrons are oxidized per molecule of DA. N = 8 to 16 cells per condition. 80
98 81 E2-induced calcium rise varies with different ER agonist drugs and cell types Estradiol elicited an immediate calcium response in both PC12 and GT1-7 cells when applied briefly at 10 nm via a stimulating pipet positioned adjacent to the cells imaged. As a control, cells were exposed to 3 5-s pulses of 100 mm K + to depolarize the cells. These pulses confirmed the cells included in the analysis were healthy and properly loaded with the fluorescent calcium indicator, Fluo-4. Cells that failed to increase in fluorescence by at least 10 percent in response to the control depolarization were excluded. While not all cells responded to E2, the fraction of cells that responded to both K + and E2 was similar between experiments. Application of saline or the vehicle with a pipette in control experiments failed to reproduce the response observed with E2 (not shown). Cells remained viable, as subsequent depolarization with K + 10 minutes later produced additional calcium peaks (not shown). Prior application of K + did not appear to alter the effects of E2, as the responses also occurred in experiments where only a post-stimulation was used (not shown). The response of PC12 and GT1-7 cells to E2 is compared in Figures 3.3a and 3.3b, respectively. The data for PC12 cells are shown as examples of responses to K + and either E2 or E2 receptor agonists, and these are representative of cells observed in at least 3 replicate experiments. The data for GT1-7 cells are shown as averages of all E2 responsive cells from one of at least 3 replicate experiments performed. Table 3.2 provides more detailed statistical information on the intensity and comprehensiveness of the calcium response to E2 or mimetic drugs. The most significant difference between the effects of E2 in PC12 and GT1-7 cells was in the timing of individual cell responses. GT1-7 cells consistently responded to E2 with an immediate large amplitude peak, such that averaging responses from groups of cells revealed a
99 82 synchronous calcium rise that began during E2 exposure and returned to baseline within a few seconds of termination of exposure to E2, as shown in Figure 3.3b (panels with n =?? in upper right corner are averaged traces). In contrast, most PC12 cells responded to E2 but the responses varied in timing. Some cells responded immediately while others responded at delayed times during the 4-minute post E2 observation period, after cessation of the pulse of E2. Multiple peaks were observed in many of the cells and basal calcium rose steadily in 24 % of PC12 cells and 29 % of GT1-7 cells. An average of 2.6 calcium peaks were observed in the 4-minute period following application of 10 pm E2, 10 nm E2, and the GPR30 agonist G1 in PC12 cells. Fewer peaks (between 1.3 and 1.5 peaks per cell on average) were observed for the other treatments during the same time interval. Several drugs known to selectively activate one form of estrogen receptor were applied in a manner similar to E2. ERB041, a potent ER-β agonist with 200-fold selectivity over ER-α, was the most effective estrogen mimetic of those examined in both cell types. Application of ERB041 produced a rapid 1.5- to 2-fold increase in calcium indicator fluorescence in over 90 percent of cells from both cell types, and unexpectedly, responses to ERB041 were synchronized in both cell types. The duration of the calcium rise matched closely the duration of the exposure to ERB041, and subsequent responses were rarely observed. ERB041 produced the most consistent results between cell types for any of the drugs tested. I then tested a second ER-β selective agonist, DPN, with 70-fold selectively for ER-β. In contrast to the effects of ERB041, DPN failed to produce a significant response in either cell type. As noted above, synchronized responses were not observed in naïve PC12 cells exposed to E2. In contrast, two significant changes were observed when PC12 cells were differentiated with a 5-day treatment of NGF. First, the response rate significantly decreased from 71 % to 19
100 83 % with smaller amplitude peaks, and second, the few peaks that were observed were synchronized, similar to what was observed in GT1-7 cells. In differentiated cells, 10 nm E2 also produced fewer calcium peaks (1.3 on average compared to 2.6 for E2 and naïve cells), and no changes in basal calcium were observed. The GPR30 agonist G1 also produced qualitatively different calcium responses in PC12 and GT1-7 cells. In PC12 cells, the effects of G1 were similar to E2 with multiple calcium transients that were not synchronized. In GT1-7 cells, G1 caused a slow rise in basal calcium in 74 % of G1-responsive cells with small unsynchronized peaks observed in 15 % of G1- responsive cells. Only one other drug tested produced significantly increased basal calcium, the industrial endocrine disruptor BPA; however, BPA was tested at a much higher concentration (50 µm), similar to concentrations of this drug examined previously (Yoneda et al., 2003). At this elevated concentration, BPA might have non-specific effects leading to the altered basal calcium levels observed in 83 % of BPA-responsive cells. In GT1-7 cells exhibiting BPAinduced peaks, individual peaks were not synchronized, unlike the effects of all other E2 agonist drugs tested on this cell type. The ER-α selective agonist, ER-β antagonist (R,R)-THC was moderately effective in eliciting calcium peaks in both cell types. Only 40 % and 41 % of K + -responsive cells responded to (R,R)-THC in PC12 and GT1-7 cells, respectively. Because of differences in the spontaineous activity of the two cell lines, the fraction of (R,R)-THC-responsive cells was significantly greater than control in PC12 cells (p < 0.001), but not in GT1-7 cells (p = 0.10). Two forms of membrane impermeable E2 were employed to examine whether the E2- induced calcium flux could act via a plasma membrane receptor. Freshly filtered BSAconjugated E2 (10 nm) produced a modest but significant increase in 38 % and 80 % of K + -
101 84 responsive PC12 and GT1-7 cells, respectively. This increase was manifested as a rise in basal calcium in GT1-7 cells, similar to the effects of G1. However, the dendrimer-conjugated-e2 (EDC; 100 nm) failed to increase cytosolic calcium in GT1-7 cells and only affected 20 % of PC12 cells. The inconsistency between the effects of E2-BSA and EDC could be due to several factors, including differences in binding affinity to membrane ERs, presence of traces of free E2 in the E2-BSA despite filtration (Taguchi et al., 2004), or due to differences in the site of the linkage between E2 and the membrane impermeable substituent.
102 85 Figure 3.3. Calcium responses to ER agonists in PC12 and GT1-7 cells. Y-axes: percent change from baseline fluorescence (set at 100 %). X-axes: Elapsed time (s). The first 3 peaks in each panel are responses to 5 s 100 mm K + contol stimulations. The responses following these control stimulations were evoked by the agonists listed above each trace. Under conditions where responses were not synchronized, or where the agonist only affected calcium in a minority of cells, individual responses are displayed. Otherwise, the number of cells represented in each averaged trace is listed in the the corner each panel. Individual traces are typical of positive responses to a drug, observed in at least 3 replicate experiments. Repeating these experiments without 100 mm K + stimulations preceding E2 exposure did not influence results (not shown). (a) PC12 (b) GT1-7
103 86 Table 3.2. Cytosolic calcium levels rapidly increased upon exposure to E2 or related compounds in both PC12 and GT1-7 cells. % Response is the percentage of K + responsive cells that displayed a response to the drug during the four-minute observation period. Values for control (non-exposed) cells reflect the rate of spontaneous activity during the same period. This was determined by dividing the number of drug-responsive cells by all cells that responded to the K + control stimulation and multiplying by 100. Peak Amp is the maximum peak amplitude, averaged for all responsive cells in a treatment. The number is a percent increase over the initial fluorescence intensity prior to treatment. Peak Amp reflects the largest relative change in cytosolic calcium following application of ER agonists. Values in bold indicate a significant difference from control using a One-Way ANOVA and the Dunnett test (p < 0.05). All values are averaged from a minimum of 3 replicate experiments, with an average combined total of 87 ± 46 cells per condition. PC12 GT1-7 Treatment % Response Peak Amp Treatment % Response Peak Amp Control 12% 141 Control 27% 118 E2 10 nm 71% 151 E2 10 nm 82% 148 E2 10 pm 71% 137 E2 10 pm 100% 123 BPA 39% 139 BPA 98% 161 ERB041 90% 200 ERB041 96% 155 DPN 20% 135 DPN 37% 127 E2-BSA 38% 148 E2-BSA 80% 127 R,R-THC 40% 142 R,R-THC 41% 143 G1 75% 155 G1 92% 127 NV-1 20% 137 NV-1 0% n.d. E2 10nM (PC12 NGF) 19% 130
104 87 Estrogen receptor mrna levels in PC12 and GT1-7 cells In order to confirm or exclude the involvement of various E2 receptor subtypes, real-time reverse transcriptase PCR of GT1-7 and PC12 cells was performed to measure relative amounts of mrna in these cell types (Figure 3.4.). Similar to a previous report (Roy et al., 1999), GT1-7 cells primarily express ER-α with small amounts of ER-β also present. Trace amounts of GPR30 were also identified. In PC12 cells ER-α mrna was completely absent but small amounts of ER-β and GPR30 were present. Upon differentiation with NGF, PC12 cells expressed more than 10-fold higher amounts of ER-β and GPR30, similar to previous reports (Gollapudi and Oblinger, 2001). In most cases, the effects of ER-selective agonists matched the E2 receptors present. One notable exception was the ER-α agonist R,R-THC, which produced a modest but significant increase in cytosolic calcium in PC12 cells despite the lack of detectable ER-α mrna. Despite the absence of ER-α in NGF-differentiated PC12 cells, E2-evoked calcium responses coincided with test pulses of E2 like the responses observed in ER-α-positive GT1-7 cells, and unlike the effects observed in naïve PC12 cells.
105 Figure 3.4. Relative mrna levels of ER-α, ER-β, and GPR30 vary between GT1-7, naïve PC12, and NGF-differentiated PC12 cells, measured by RT-PCR. No ER-α was detected in naïve or differentiated PC12 cells, but low levels of GPR30 were detected in GT1-7 cells. mrna levels were standardized to the housekeeping gene cyclophilin A by the C t method, and represent the average of 3 replicate measurements (Livak and Schmittgen, 2001). 88
106 89 VGCCs are required for the E2-induced calcium flux observed in both PC12 and GT1-7 cells Several pharmacological manipulations were performed to ascertain the source of the cytosolic calcium increases observed with E2 and ER agonist drugs. In calcium imaging experiments analogous to those described earlier, we first stimulated Fluo-4 dye loaded cells with 100 mm K + to identify healthy and properly loaded cells. The cells were subsequently incubated with inhibitors for various subtypes of voltage-gated calcium channels (VGCCs), the non-specific calcium channel blocker cadmium (200 µm), or extracellular calcium was removed. Following treatment with inhibitors, cells were treated with 10 nm E2 and the percent of E2 responsive cells was examined. As shown in Figure 3.5, differences in the fraction of cells that responded when one VGCC subtype was inhibited were observed. 71 % of PC12 cells responded to E2 in the absence of VGCC inhibitors. The fraction decreased slightly when the L-type VGCC antagonist nifedipine (10 µm) was added to the solution and was almost completely blocked by the N-type VGCC antagonist ω-conotoxin GVIA (500 nm), or by removal of extracellular calcium. Application of E2 also increased calcium in 82 % of GT1-7 cells in a synchronous manner. This calcium rise was mostly blocked by the R-type VGCC antagonist SNX-482 (200 nm), but only slightly blocked by conotoxin. Removal of extracellular calcium or addition of cadmium (200 µm Cd 2+ ) also blocked E2-evoked calcium responses. The degree to which E2- induced calcium flux was inhibited occurred in direct proportion to the relative amounts of these VGCC subtypes in both cell types (PC12s primarily express the N-type VGCC, GT1-7s the R- type) (Taylor and Peers, 1999; Watanabe et al., 2004). Therefore, it would appear that the major source of calcium regulated by E2 enters the cytoplasm externally via VGCCs, but that the mechanism does not select one subtype over another.
 is an L-type VGCC antagonist. SNX-482 (200 nm) is an R-type VGCC antagonist.")
107 Figure 3.5. Percent of cells that respond to E2 changes with the addition of inhibitors for VGCCs or the removal of extracellular calcium. ω-conotoxin-gvia (500 nm) is an N-type VGCC antagonist. Nifedipine (10 µm) is an L-type VGCC antagonist. SNX-482 (200 nm) is an R-type VGCC antagonist. The abundance of VGCCs in PC12 cells in decreasing order is N, L, P/Q, and R, with P,Q, and R comprising about 11 %. The abundance of VGCCs in GT1-7 cells in decreasing order is R, T, L, N, with R accounting for 75 % of the total peak calcium current (Watanabe et al., 2004). Response to 10 nm E2 (%) was determined from an average of 44 cells per condition. *,**, and *** denote difference from E2 response by ANOVA and Dunnett T-test at p < 0.05, 0.01, and levels, respectively. 90
108 91 4. Discussion The data reported here show E2 and several ER agonists increase cytosolic calcium in both PC12 and GT1-7 cells. Application of E2 leads to a rapid rise in calcium that is coupled to exocytosis in PC12 cells, but similar calcium flux does not necessarily promote exocytosis in GT1-7 cells. Multiple forms of the estrogen receptor appear capable of promoting a cytosolic calcium rise, as both ER-α and ER-β agonists increased cytosolic calcium to varying degrees, but calcium response to various ER agonists was qualitatively different in amplitude, synchrony, frequency, and in the fraction of cells that responded. The ER-β selective agonist ERB041 and the GPR30 agonist G1 produced the strongest and most consistent responses in both cell types (Table 3.1), but the role that various ER subtypes play in mediating calcium dynamics is still unclear. Another ER-β agonist, DPN, had little to no effect on calcium in these experiments. Recent reports suggest many compounds that bind to estrogen receptors have properties that vary in a manner that could be explained by differences in the conformational changes induced by ligand binding. In particular, proteases appear to digest the ligand-er complexes for receptor agonists and antagonists differently, and different estrogen-like drugs recruit different coregulator proteins (Kraichely et al., 2000). Similarly, ER-α-estradiol complexes are not functionally equivalent to other ER-α-agonist complexes in that the two recruit various gene promoter complexes with different efficacy (Harrington et al., 2003). These data are consistent with the formation of ligand-er complexes that are sensitive to slight variations in ligand structure resulting in large differences in calcium mobilization. DPN and ERB041 are both ER agonists, although ERB041 is 200 times more selective for ER-β over ER-α compared to just 30 times more for DPN (Harrington et al., 2003; Malamas et al., 2004). Differences in the efficacy of ERB041 and DPN in promoting calcium flux could stem from
109 92 differences in binding affinity or from differences in the conformational change induced by binding to ER-β. A similar explanation might apply to R,R-THC. R,R-THC is an ER-α agonist and weak ER-β antagonist at 10 nm, the concentration employed (Harrington et al., 2003). However, this compound activated calcium flux in PC12 cells despite an apparent lack of ER-α mrna in these cells. Given this result, R,R-THC could promote calcium flux by antagonizing ER-β or by activating a different receptor altogether, such as GPR30 or an as of yet unknown receptor. Previously, others reported that ER-antagonists appear to behave like agonists for certain calcium dependent processes, and R,R-THC may be acting via ER-β in this manner (Filardo and Thomas, 2005). Unfortunately, the affinity of R,R-THC for GPR30 has not yet been tested, and thus an R,R-THC-GPR30 interaction cannot be ruled out. G1 appears to promote a gradual rise in calcium in GT1-7 cells despite mere traces of detectable mrna for GPR30 in these cells. Given the qualitative difference in the effect of G1 in GT1-7 from PC12 cells (baseline calcium rise versus transient peaks), it is possible that GPR30 is coupled to different effectors in the two cell types. My attempts to reproduce the effects of E2 with the membrane impermeable conjugates E2-6-carboxymethyloxime-BSA (E2-BSA) and the E2-17-dendrimer conjugates (EDC) provided inconsistent results. E2-BSA was not as effective at promoting calcium mobilization as E2 and the dendrimer-conjugated E2 (EDC) failed to promote calcium flux in most cells. Previously, others have identified a membrane E2 binding site in PC12 cells with a K d of nm (Alexaki et al., 2004). Despite the presence of a membrane E2-binding site in PC12 cells, it is possible that EDC and E2-BSA do not bind this target in an identical fashion to E2. Different forms of membrane impermeable E2 have been reported to have different effects on calcium (Temple and Wray, 2005), and the point of conjugation differs for these two membrane impermeable species.
110 93 The findings reported here are potentially significant to two important areas of active research. First, the role of E2 in initiating calcium flux is consistent with the rapid actions of E2 observed in many cell types (Falkenstein et al., 2000; Beyer et al., 2002; Filardo, 2002; Levin, 2002). Second, the direct control of secretion via calcium mobilization is implicated in one mechanism of the spread of breast cancer spreads to neighboring tissues. Some forms of breast cancer cells secrete endothelial growth factor (EGF) in response to E2 and this growth factor causes normal tissue to grow via EGF receptor activation. This secretion correlates to expression levels of GPR30 and activation of GPR30 leads to calcium mobilization (Filardo and Thomas, 2005). Thus PC12 cells may be a potential model for the study of xenoestrogens and their effects on GPR30-mediated secretion. The coupling of GPR30 activation to calcium flux and secretion may not be a trivial relationship. It has been reported that ER antagonists (for gene transcription effects) appear to behave as ER agonists capable of triggering EGF release from breast cancer cells when GPR30 is present (Filardo, 2002; Filardo and Thomas, 2005). Consistent with this paradoxical finding, one ER-β antagonist (R,R-THC) evoked a calcium response in PC12 cells. Examining the pro-secretory effects of other anti-estrogens used to treat breast cancer might provide new insights into the mechanism of ERs in promoting and preventing cell proliferation. 5. Acknowledgements Sarah Luber contributed significantly to this work by collecting most of the calcium imaging data from GT1-7 cells and some of the PC12 data. I would like to acknowledge Nandini Vasuduvan for consulting on the project, Glaxo-Smith-Klein for the gift of ERB041, the Mellon lab for the gift of GT1-7 cells, and John Katzenellenbogen s lab for the gift of the EDC. This work was funded by the National Institutes of Health.
111 94 6. References Alexaki VI, Charalampopoulos I, Kampa M, Vassalou H, Theodoropoulos P, Stathopoulos EN, Hatzoglou A, Gravanis A, Castanas E (2004) Estrogen exerts neuroprotective effects via membrane estrogen receptors and rapid Akt/NOS activation. Faseb J 18: Beyer C, Raab H (1998) Nongenomic effects of oestrogen: embryonic mouse midbrain neurones respond with a rapid release of calcium from intracellular stores. Eur J Neurosci 10: Beyer C, Ivanova T, Karolczak M, Kuppers E (2002) Cell type-specificity of nonclassical estrogen signaling in the developing midbrain. J Steroid Biochem Mol Biol 81: Bologa CG, Revankar CM, Young SM, Edwards BS, Arterburn JB, Kiselyov AS, Parker MA, Tkachenko SE, Savchuck NP, Sklar LA, Oprea TI, Prossnitz ER (2006) Virtual and biomolecular screening converge on a selective agonist for GPR30. Nat Chem Biol 2: Colliver TL, Hess EJ, Pothos EN, Sulzer D, Ewing AG (2000) Quantitative and statistical analysis of the shape of amperometric spikes recorded from two populations of cells. J Neurochem 74: Dhandapani KM, Brann DW (2002) Protective effects of estrogen and selective estrogen receptor modulators in the brain. Biol Reprod 67: Evinger AJ, 3rd, Levin ER (2005) Requirements for estrogen receptor alpha membrane localization and function. Steroids 70: Falkenstein E, Tillmann HC, Christ M, Feuring M, Wehling M (2000) Multiple actions of steroid hormones--a focus on rapid, nongenomic effects. Pharmacol Rev 52: Filardo EJ (2002) Epidermal growth factor receptor (EGFR) transactivation by estrogen via the G-protein-coupled receptor, GPR30: a novel signaling pathway with potential significance for breast cancer. J Steroid Biochem Mol Biol 80: Filardo EJ, Thomas P (2005) GPR30: a seven-transmembrane-spanning estrogen receptor that triggers EGF release. Trends Endocrinol Metab 16: Funakoshi T, Yanai A, Shinoda K, Kawano MM, Mizukami Y (2006) G protein-coupled receptor 30 is an estrogen receptor in the plasma membrane. Biochem Biophys Res Commun 346: Gee KR, Brown KA, Chen WN, Bishop-Stewart J, Gray D, Johnson I (2000) Chemical and physiological characterization of fluo-4 Ca(2+)-indicator dyes. Cell Calcium 27: Gollapudi L, Oblinger MM (2001) Estrogen effects on neurite outgrowth and cytoskeletal gene expression in ERalpha-transfected PC12 cell lines. Exp Neurol 171: Govind AP, Thampan RV (2003) Membrane associated estrogen receptors and related proteins: localization at the plasma membrane and the endoplasmic reticulum. Mol Cell Biochem 253: Greene LA, Tischler AS (1976) Establishment of a noradrenergic clonal line of rat adrenal pheochromocytoma cells which respond to nerve growth factor. Proc Natl Acad Sci U S A 73: Harrington WR, Sheng S, Barnett DH, Petz LN, Katzenellenbogen JA, Katzenellenbogen BS (2003) Activities of estrogen receptor alpha- and beta-selective ligands at diverse estrogen responsive gene sites mediating transactivation or transrepression. Mol Cell Endocrinol 206:13-22.
112 Harrington WR, Kim SH, Funk CC, Madak-Erdogan Z, Schiff R, Katzenellenbogen JA, Katzenellenbogen BS (2006) Estrogen dendrimer conjugates that preferentially activate extranuclear, nongenomic versus genomic pathways of estrogen action. Mol Endocrinol 20: Koehler KF, Helguero LA, Haldosen LA, Warner M, Gustafsson JA (2005) Reflections on the discovery and significance of estrogen receptor beta. Endocr Rev 26: Kozminski KD, Gutman DA, Davila V, Sulzer D, Ewing AG (1998) Voltammetric and Pharmacological Characterization of Dopamine Release from Single Exocytotic Events at Rat Pheochromocytoma (PC12) Cells. Analytical Chemistry 70: Kraichely DM, Sun J, Katzenellenbogen JA, Katzenellenbogen BS (2000) Conformational changes and coactivator recruitment by novel ligands for estrogen receptor-alpha and estrogen receptor-beta: correlations with biological character and distinct differences among SRC coactivator family members. Endocrinology 141: Levin ER (2001) Cell localization, physiology, and nongenomic actions of estrogen receptors. J Appl Physiol 91: Levin ER (2002) Cellular functions of plasma membrane estrogen receptors. Steroids 67: Li L, Haynes MP, Bender JR (2003) Plasma membrane localization and function of the estrogen receptor alpha variant (ER46) in human endothelial cells. Proc Natl Acad Sci U S A 100: Livak KJ, Schmittgen TD (2001) Analysis of relative gene expression data using real-time quantitative PCR and the 2(-Delta Delta C(T)) Method. Methods 25: Malamas MS, Manas ES, McDevitt RE, Gunawan I, Xu ZB, Collini MD, Miller CP, Dinh T, Henderson RA, Keith JC, Jr., Harris HA (2004) Design and synthesis of aryl diphenolic azoles as potent and selective estrogen receptor-beta ligands. J Med Chem 47: Mellon PL, Windle JJ, Goldsmith PC, Padula CA, Roberts JL, Weiner RI (1990) Immortalization of hypothalamic GnRH neurons by genetically targeted tumorigenesis. Neuron 5:1-10. Meyers MJ, Sun J, Carlson KE, Katzenellenbogen BS, Katzenellenbogen JA (1999) Estrogen receptor subtype-selective ligands: asymmetric synthesis and biological evaluation of cisand trans-5,11-dialkyl- 5,6,11, 12-tetrahydrochrysenes. J Med Chem 42: Meyers MJ, Sun J, Carlson KE, Marriner GA, Katzenellenbogen BS, Katzenellenbogen JA (2001) Estrogen receptor-beta potency-selective ligands: structure-activity relationship studies of diarylpropionitriles and their acetylene and polar analogues. J Med Chem 44: Milner TA, Ayoola K, Drake CT, Herrick SP, Tabori NE, McEwen BS, Warrier S, Alves SE (2005) Ultrastructural localization of estrogen receptor beta immunoreactivity in the rat hippocampal formation. J Comp Neurol 491: Nilsen J, Chen S, Brinton RD (2002) Dual action of estrogen on glutamate-induced calcium signaling: mechanisms requiring interaction between estrogen receptors and src/mitogen activated protein kinase pathway. Brain Res 930: Perret S, Dockery P, Harvey BJ (2001) 17beta-oestradiol stimulates capacitative Ca2+ entry in human endometrial cells. Mol Cell Endocrinol 176: Ramirez VD, Zheng J, Siddique KM (1996) Membrane receptors for estrogen, progesterone, and testosterone in the rat brain: fantasy or reality. Cell Mol Neurobiol 16: Revankar CM, Cimino DF, Sklar LA, Arterburn JB, Prossnitz ER (2005) A transmembrane intracellular estrogen receptor mediates rapid cell signaling. Science 307:
113 Ronnekleiv OK, Kelly MJ (2005) Diversity of ovarian steroid signaling in the hypothalamus. Front Neuroendocrinol 26: Roy D, Angelini NL, Belsham DD (1999) Estrogen directly respresses gonadotropin-releasing hormone (GnRH) gene expression in estrogen receptor-alpha (ERalpha)- and ERbetaexpressing GT1-7 GnRH neurons. Endocrinology 140: Singh S, Shaul PW, Gupta PD (2002) Conventional estrogen receptors are found in the plasma membrane of vaginal epithelial cells of the rat. Steroids 67: Taguchi Y, Koslowski M, Bodenner DL (2004) Binding of estrogen receptor with estrogen conjugated to bovine serum albumin (BSA). Nucl Recept 2:5. Takemura H, Ma J, Sayama K, Terao Y, Zhu BT, Shimoi K (2005) In vitro and in vivo estrogenic activity of chlorinated derivatives of bisphenol A. Toxicology 207: Taylor SC, Peers C (1999) Store-operated Ca2+ influx and voltage-gated Ca2+ channels coupled to exocytosis in pheochromocytoma (PC12) cells. J Neurochem 73: Temple JL, Wray S (2005) Bovine serum albumin-estrogen compounds differentially alter gonadotropin-releasing hormone-1 neuronal activity. Endocrinology 146: Thomas P, Dong J (2006) Binding and activation of the seven-transmembrane estrogen receptor GPR30 by environmental estrogens: a potential novel mechanism of endocrine disruption. J Steroid Biochem Mol Biol 102: Thomas P, Pang Y, Filardo EJ, Dong J (2004) Identity of an Estrogen Membrane Receptor Coupled to a G-protein in Human Breast Cancer Cells. Endocrinology. Toran-Allerand CD (2004) Minireview: A plethora of estrogen receptors in the brain: where will it end? Endocrinology 145: Watanabe M, Sakuma Y, Kato M (2004) High expression of the R-type voltage-gated Ca2+ channel and its involvement in Ca2+-dependent gonadotropin-releasing hormone release in GT1-7 cells. Endocrinology 145: Wozniak AL, Bulayeva NN, Watson CS (2005) Xenoestrogens at picomolar to nanomolar concentrations trigger membrane estrogen receptor-alpha-mediated Ca2+ fluxes and prolactin release in GH3/B6 pituitary tumor cells. Environ Health Perspect 113: Yoneda T, Hiroi T, Osada M, Asada A, Funae Y (2003) Non-genomic modulation of dopamine release by bisphenol-a in PC12 cells. J Neurochem 87: Zhu BT, Han GZ, Shim JY, Wen Y, Jiang XR (2006) Quantitative structure-activity relationship of various endogenous estrogen metabolites for human estrogen receptor alpha and beta subtypes: Insights into the structural determinants favoring a differential subtype binding. Endocrinology 147:
114 97 CHAPTER 4 CONSOLIDATING THE INHIBITORY AND EXCITATORY EFFECTS OF ESTROGEN: A SYNCHRONIZATION HYPOTHESIS In this chapter I will explain how data from the previous two chapters fit together. My early experiments with 17-β-Estradiol (E2) addressed the ability of E2 to inhibit exocytosis, possibly by decoupling ryanodine receptors from membrane ion channels. However, further experiments revealed an opposite phenomenon whereby a calcium influx requiring VGCCs resulted in a transient burst of fusion events. The critical difference between these two events appeared to be in the time scale of the response. Two criteria must be met for an agent to promote synchronization of network activity: First, application of the agent must produce a response in the majority of cells over the same time scale. Second, the agent must suppress other forms of competing activity for a short period thereafter, thus strengthening connections within the network according to Hebb s hypothesis. Hebb s rule states that the timing of two overlapping signals can determine the outcome of the combined effect (Margulis and Tang, 1998). A greater degree of overlap in the signals lowers the barrier to subsequent firing for both signals in the future. In contrast, out of phase firing reduces the probability of coincident firing in the future. The following analysis will demonstrate how the initial excitatory effects of E2 are transient and consistenly lead to suppression of exocytosis when examined over a longer time scale, thus satisfying both criteria for enhancing synchronization. After a cell is exposed to E2, stimulation by a competing stimulus shortly thereafter fails to produce a strong response, compared to responses evoked by the same stimulus prior to the
115 98 application of E2. Such a dual-mode modulation of cell excitability, where excitation is immediately followed by inhibition of competing stimuli, could provide a mechanism for synchronizing groups of cells to secrete other neuromodulators. Such a phenomenon has been observed in vivo, where E2 amplifies and synchronizes secretion of the GnRH regulatory neuropeptide from the hypothalamus (Temple et al., 2004; Abe and Terasawa, 2005; Temple and Wray, 2005). In turn, GnRH regulates the reproductive system. Methods These experiments consist solely of data collected as part of the experiments described in Chapter 2 and Chapter 3. Refer to pages and for details on how the experiments were performed. Analysis of the calcium data involved the use of an original MathCad program to automate rapid parallel analysis of peaks from many data sets. Copies and explanations of this and other MathCad analysis programs can be found in the Appendix. Results Similarities in the dose-dependent effects of E2 In the preceding chapters, E2 both evoked and suppressed exocytosis with a biphasic dose-dependency. When results from Fig 2.1b and 3.1d are compared, the shape of the bimodal plots match. Both the ability of E2 to suppress K + - and caffeine-evoked exocytosis and the ability of E2 to promote exocytosis are effective at the low nm and
116 99 >10 µm range. While this overlap in efficacy could be coincidental, it might also imply that the two phenomena are linked in some way. Figure 4.1 reprints the relevant figures from previous chapters so they can be directly examined. Figure 4.1. Biphasic responses to E2 observed for both inhibition of stimulated exocytosis and direct-e2-evoked exocytosis. Upper panel (from Figure 2.1b): dose response of E2-mediated inhibition of stimulated exocytosis. * indicates a difference from control using ANOVA and Dunnett s t-test (p < 0.05). Lower panel (from Figure 3.2c): average amount of DA detected per cell (in attomoles) during E2 application. Correlation between amperometric burst/calcium mobilization response and subsequent inhibition The first possible confound that must be ruled out concerning these data is the presence of some systematic error in analysis. For example, could these E2 bursts of exocytosis simply be caused by some other means of stimulation, such as mechanical
117 100 stimulation? Occasionally, seriously disturbing a cell while positioning the electrode could result in exocytosis. However, this is unlikely to create the artifact since the exocytosis occurs both during movement of the pipet and after the pipet and electrode have been positioned. Figure 4.2 provides several examples of bursts that coincide with the application of 10 nm E2. The traces illustrate the response can be immediate, delayed, or not observed. Another important clue is that following an exocyototic burst evoked by 10 nm E2, K + stimulation evoked diminshed amounts of secretion whereas robust K + responses were observed in cells just seconds prior to the onset of the burst. As expected, the number of burst events are inversely correlated with the number of K + - evoked events (K + events from the second part of the experiment) in these cells (r = ).
118 Figure 4.2. Examples of K + -stimulated and E2-evoked exocytosis from four cells treated with 10 nm E2. The duration is indicated by the solid bar under each trace. Arrows indicate time of 5 s K + stimulations before and after E2. Dotted line indicates when the ejection pipet filled with E2 solution was first maneuvered adjacent to the cell (to a distance of about 100 µm). E2 burst effects were absent in 4 of 16 cells (a), immediately evoked by leakage from the pipet in 7 of 16 cells (presumably in the picomolar range) (b), evoked within seconds of pressure ejection in 3 of 16 cells (presumably at 10 nm) (c), or delayed several minutes in 2 of 16 cells (d). None of the cells examined exhibited bursts prior to when the pipet containing E2 was positioned near the cell (except coinciding with K + -stimulations). 101
119 102 In Chapter 3, calcium imaging experiments were performed with essentially the same experimental design as the amperometry experiments in Figure 4.2. In the calcium imaging experiments shown in Figure 3.2, calcium responses to ER agonists were displayed with only the pre-k + -stimulated calcium peaks shown for simplicity. However, cells were exposed to 3 pulses of 100 mm K + both before and after exposure to the drug. The calcium responses to 100 mm K + prior to ER agonist exposure were used to calculate the fraction of cells that responded to each agonist. Now, I present both the preand post-e2-exposure K + -stimulated peaks in Figure 4.3. Measuring the difference in amplitudes of the calcium peaks before and after exposure to E2 provides an additional means of estimating the inhibitory effects of E2 on subsequent K + -evoked calcium changes. To quantify the amount of inhibition apparent in the calcium image data, the peak amplitudes for all pre-e2 and post-e2 K + stimulations were measured using a MathCad program. Then, the difference in amplitude between the pre and post peaks was then calculated for each cell as illustrated in Figure 4.4 and averaged. Results for mean differences in K + -stimulated peak amplitudes following E2 treatment are provided in Figure 4.5. In untreated cells, calcium peaks resulting from the 3 initial K + -stimulations were larger in amplitude than peaks for the 3 subsequent K + -stimulations by 17 ± 1 % for PC12 cells and 11 ± 3 % for GT1-7 cells. Note that in both cell types, the decrease in peak amplitudes was greater for 10 nm E2-treated cells than for control. Treatment with 10 pm E2 led to a smaller difference than for 10 nm E2 in PC12 cells. Peak amplitudes for 10 pm E2 treatment appeared to be nearly unchanged in GT1-7 cells. 10 nm E2-BSA exposure did not significantly decrease the height of stimulated calcium peaks in either
120 103 cell type, contrary to the observed inhibition of stimulated exocytosis. To summarize the imaging experiments, E2 caused a calcium response in 71 % of PC12 cells followed by K + -stimulated calcium peaks that were diminshed in amplitude. This result was in agreement with amperometry results, where treatment with 10 nm E2 caused bursts in 75 % of PC12 cells and inhibited K + -stimulated exocytosis by 45 %. Figure 4.3. Calcium responses to K + -stimulation in PC12 and GT1-7 cells. These data are similar to Figure 3.2a and 3.2b but with the post-k + -stimulation included. Each trace is the average of about 25 cells from one of at least three replicate experiments. The three peaks at the beginning and the three peaks at the end of each trace correspond to 5 s pulses of K +. The amplitude of the post-k + peaks appears to vary with agonist type and with concentration of E2. Breaks in some traces are an artifact where recording was suspended to move pipets. PC12 GT1-7

121 104 Figure 4.4. Schematic of how peak differences in Figure 4.5 were calculated. Differences were obtained by subtracting the amplitude of the final three K + -stimulated peak amplitudes from the initial three peak amplitudes for each cell, as indicated by the lines connecting pairs of peaks (e.g. forth peak minus first peak, etc.). These differences were then calculated and averaged per treatment using the formula below. Figure 4.5. Percent difference in calcium peak amplitudes for E2 treated and control (untreated) PC12 and GT1-7 cells. Each cell is represented by three measurements, and each group contains an average of 66 PC12 and 20 GT1-7 cells. The error bars denote SEM, calculated using n equal to the number of cells, not the number of peaks. *,**, and *** denote significant difference from control using a one-factor ANOVA with repeated measuments and Dunnett s T-test at p < 0.05, 0.01, and levels, respectively.
122 105 Discussion The analysis in this chapter supplements the primary themes of Chapters 2 and 3 by providing evidence that the apparent inhibitory and excitatory effects of E2 do not necessarily cancel each other. In contrast, they may be parts of a more complicated mechanism involved in synchronizing neuronal responses. A complex response similar to what I present here for E2 has been observed with at least one other neuromodulator. Atrial natruiretic peptide (ANP) appears to both promote and suppress cellular calcium activity in a time-dependent fashion (Kanwal et al., 1997). In addition, the bimodal effects of E2 have also been observed by Kevin Catt s group in GT1-7 cells, where picomolar levels of E2 inhibit camp production but nanomolar levels of E2 enhance camp production (Navarro et al., 2003). In the past decade, the effect of E2 on cytosolic calcium has been chronicled in dozens of reports. These results seem to vary from either inhibition to excitation depending on cell type examined and observation parameters, yet no group has proposed a definitive explanation to account for this variation. Wide variation in the range of responses could result from examining E2 at vastly different concentrations over different time scales. To address this, others are now employing complex multi-phase exposure paradigms to mimic the dynamic concentration E2 changes believed to occur in vivo, and this E2 exposure paradigm appears to enhance GnRH secretion (Navarro et al., 2003). Another source of variability is the lack of consideration for the recently identified GPR30 subtype. Cells expressing different levels of GPR30 and other as-of-yet unidentified estrogen receptors will likely respond to E2 with different calcium responses. Given the evidence described in this chapter of both excitation and inhibition
123 106 occuring on a fast time scale via one or more E2 receptors, there is sufficient data to at least hypothesize E2 might act to synchronize neuronal network activity by a mechanism that involves a combination of activation and inhibition. If estrogen acts as a neuromodulator, then regulating the timing of responses and promoting synchronization is a potentially powerful means of strengthening network connections. Given the fast, transient nature of synaptic transmission, timing of two overlapping signals can determine the outcome of the combined effect (Margulis and Tang, 1998). Hebb s hypothesis is often employed in learning and memory mechanisms when explaining the significance of temporal overlap for two axons depolarizing the same target cell, and Hebb s learning rule would equally apply to networks synchronized by E2. Within this context, a brief summary of current information in the literature supporting the ability of E2 to act as a neuromodulator in vivo is applicable here. Evidence for E2 as neuromodulator Estrogen is a viable neuromodulator in vivo when considered the context of recent findings. Estrogen has greater bioavailability in certain brain areas than in most peripheral endocrine organs, as E2 is rapidly synthesized in axons (Balthazart et al., 2001, 2001). Aromatase, the estrogen synthesis enzyme, has been localized to presynaptic terminals associated with subpopulations of vesicles (Towart et al, 2003). E2 is also produced in neurons by an alternate p450 pathway in neurons (Mukai et al., 2006). Basal levels of E2 in the hippocampus have been measured to be 1 nm (Mukai et al., 2006), well within the concentration ranges of the effects examined in these experiments. Estrogen has demonstrated the ability to quickly modulate aromatase activity through a
124 107 calcium-dependent protein phosphorylation mechanism (Balthazart et al, 2001). ER-α and ER-β have been localized to axons (Blaustein et al., 1992), and GPR30 has been found on the surface of hippocampal neurons, although axonal/dendritic localization could not be determined (Funakoshi et al., 2006). Given the distance between presynaptic terminals and the nucleus, it seems unlikely that these estrogen receptors operate by a classical transcriptional mechanism. In addition to the hippocampus, another brain area where E2 likely acts as a neuromodulator is the hypothalamus. E2 could mobilize cytosolic calcium and modulate exocytosis as part of synchronizing the GnRH pulse generator in the hypothalamus (O'Byrne and Knobil, 1993), and thus regulate the menstrual/estrus cycle in mammals. This phenomenon has been extensively studied using GT1-7 cells as a model system, where E2 increases the frequency of synchronous activity at pico- to nanomolar levels (Nunemaker et al., 2001; Navarro et al., 2003; Temple et al., 2004). This analysis suggests the concentration of E2 applied and the timing of the observations fundamentally affect whether the response appears excitatory or inhibitory in PC12 cells. When responses are examined during or within seconds of E2 exposure, E2 appears to promote exocytosis and cytosolic calcium mobilization. However, even during this period, the effect of exposing a cell to a second stimulus, such as 100 mm K + or 30 mm caffeine, is that the second stimulus does not further increase exocytosis. When examined several minutes later with calcium imaging, the cytosolic calcium rise caused by K + -stimulation is still suppressed by E2. Understanding the mechanism of this bimodal regulation of exocytosis and intracellularcellular calcium dynamics will still require additional experiments, but the preliminary data thus far reveal that the bimodal
125 108 regulation of exocytosis by E2 has the potential to synchronize responses for groups of cells. Acknowledgements I would like to thank Sarah Luber for help with some of the imaging experiments used in this analysis. This work was funded by the NIH. References Abe H, Terasawa E (2005) Firing pattern and rapid modulation of activity by estrogen in primate luteinizing hormone releasing hormone-1 neurons. Endocrinology 146: Balthazart J, Baillien M, Ball GF (2001) Rapid and reversible inhibition of brain aromatase activity. J Neuroendocrinol 13: Balthazart J, Baillien M, Ball GF (2001) Phosphorylation processes mediate rapid changes of brain aromatase activity. J Steroid Biochem Mol Biol 79: Blaustein JD, Lehman MN, Turcotte JC, Greene G (1992) Estrogen receptors in dendrites and axon terminals in the guinea pig hypothalamus. Endocrinology 131: Funakoshi T, Yanai A, Shinoda K, Kawano MM, Mizukami Y (2006) G protein-coupled receptor 30 is an estrogen receptor in the plasma membrane. Biochem Biophys Res Commun 346: Kanwal S, Elmquist BJ, Trachte GJ (1997) Atrial natriuretic peptide inhibits evoked catecholamine release by altering sensitivity to calcium. J Pharmacol Exp Ther 283: Mukai H, Tsurugizawa T, Ogiue-Ikeda M, Murakami G, Hojo Y, Ishii H, Kimoto T, Kawato S (2006) Local Neurosteroid Production in the Hippocampus: Influence on Synaptic Plasticity of Memory. Neuroendocrinology. Navarro CE, Saeed SA, Murdock C, Martinez-Fuentes AJ, Arora KK, Krsmanovic LZ, Catt KJ (2003) Regulation of cyclic adenosine 3',5'- monophosphate signaling and pulsatile neurosecretion by Gi-coupled plasma membrane estrogen receptors in immortalized gonadotrophin-releasing hormone neurons. Mol Endocrinol 17: Nunemaker CS, DeFazio RA, Geusz ME, Herzog ED, Pitts GR, Moenter SM (2001) Long-term recordings of networks of immortalized GnRH neurons reveal episodic patterns of electrical activity. J Neurophysiol 86: O'Byrne KT, Knobil E (1993) Electrophysiological approaches to gonadotrophin releasing hormone pulse generator activity in the rhesus monkey. Hum Reprod 8 Suppl 2: Temple JL, Wray S (2005) Bovine serum albumin-estrogen compounds differentially alter gonadotropin-releasing hormone-1 neuronal activity. Endocrinology 146: Temple JL, Laing E, Sunder A, Wray S (2004) Direct action of estradiol on gonadotropinreleasing hormone-1 neuronal activity via a transcription-dependent mechanism. J Neurosci 24:
126 109 CHAPTER 5 PHOSPHOLIPID MEDIATED PLASTICITY IN EXOCYTOSIS OBSERVED IN PC12 CELLS 1. Introduction Exocytosis is a fundamental cellular mechanism for the expulsion of signal molecules from vesicles, such as catecholamines and peptides. Minor changes in the kinetics of exocytosis have a dramatic impact on the function of synapses (Choi et al., 2000). Such changes may underlie the altered neuronal activity associated with phenomena like learning and memory, or could reflect deficits associated with neurodegenerative diseases, such as Parkinson s disease (Pothos, 2002). While many of the proteins involved in exocytosis have been characterized and the role each plays in regulating exocytosis is becoming more clear, it is possible that membrane phospholipids also play a role in changing the exocytosis process. Exo/endocytosis proteins have been shown to interact with phospholipids, and the strength of the interaction is headgroup specific (Kohler et al., 1997; Popoli et al., 1997; Quetglas et al., 2002; Wenk and De Camilli, 2004; Hui et al., 2005). Furthermore, the activity of many important exo/endocytosis proteins is impaired in vitro when specific lipid species are absent from the preparation. Membrane composition depends on cell type and organelle (Devaux, 1991) and membrane lipid composition is actively regulated. Membrane compartments have different amounts of phospholipid species and exhibit an asymmetrical distribution between the inner and outer leaflets. In general, the majority of the aminophospholipids, phosphatidylethanolamine and phosphatidylserine, preferentially segregate to the inner leaflet while the cholinephospholipids,
127 110 phosphatidylcholine and sphingomyelin, segregate to the outer leaflet (Devaux, 1991; Devaux and Morris, 2004). Exocytosis quickly redistributes phospholipids between the inner and outer leaflets (Demo et al., 1999; Lee et al., 2000) and the amount of secretion is related to the amount of membrane lipid redistribution (Demo et al., 1999). The asymetric distribution of lipids with respect to the inner and outer leaflets is essential for exocytosis, as this process is inhibited in scrambled membranes (Kato et al., 2002). Therefore, it would seem that membrane composition is an important point of regulation for exocytosis and such observations lend credence to the view that lipids, the major component of membranes, may play some kind of regulatory role in exocytosis. One hypothesis of how phospholipid species influence exocytosis is that the concentration of cone-shaped-lipids (as determined by the size of the headgroup relative to the tails) facilitates a transition of the membrane from a planar orientation to the highly curved one necessary to initiate fusion of the plasma membrane with the vesicle membrane. In support of this, the cone-shaped lipid 2-AEP appears to preferentially segregate to the conjugation fusion zone of mating Tetrahymena (Ostrowski et al., 2004). This conjugation zone is comprised of many dense lipidic fusion pores, microstructures whose formation would be facilitated by lipids that promote spontaineous curvature, like 2-AEP. Therefore, I sought to test whether variously shaped species could alter the kinetics of vesicle fusion during stimulated exocytosis in a manner predicted by lipid structures. I have employed amperometry to monitor exocytosis in the neuron-like immortalized PC12 cell line (Greene and Tischler, 1976) supplemented with various phospholipid species. Stimulated PC12 cells release the easily oxidized neurotransmitter dopamine, which is detected as current peaks by a carbon fiber electrode placed on the cell surface (Chen et al., 1994). Each peak corresponds to the amount of dopamine from a single fusing vesicle and the amount can be quantified by Faraday s Law (Wightman et
128 111 al., 1991). The shape of the current peak provides information about the rate of fusion pore expansion. With cells supplemented with different phospholipid species, I find that PC, PE and SM affect the kinetics of fusion pore expansion, PS increases the frequency of exocytosis, and PC reduces quantal size but increases vesicle volume. Thus PC, PE, and SM might play a role in changing the rates of formation and expansion of the fusion pore. It appears that PS participates in recruitment of vesicles to the membrane surface and may interact with proteins that govern the probability of a successful release event. The effects of PC might be considered useful in pharmacological treatment of the efficacy of dopamine release. 2. Materials and Methods Cell culture PC12 cells were obtained from the American Type Culture Collection (Manassas, VA) and maintained as described previously (Kozminski et al., 1998). PC12 cells were grown on mouse collagen-iv-coated dishes (Becton Dickinson, Bedford, MA) in RPMI-1640 medium supplemented with 10% equine and 5% fetal bovine serum in a 7% CO 2 atmosphere, 37 C. Cells were subcultured approximately every 7-9 days or when confluency was reached. Except where noted (Figure 5.1c), cells were incubated with 100 µm of each phospholipid ((Avanti Polar Lipids, Alabaster, AL) PS #830032, brain; PI #840044, soybean; PE #831118, egg; SM , egg; PC #840054, soybean) in 0.1% DMSO for 3 days before amperometry measurements, starting at 3 days after subculturing. Control sister cultures were plated and maintained separately under identical conditions for the same duration with media supplemented with vehicle (0.1% DMSO (Sigma, St. Louis, MO) starting 3 days after subculturing.
129 112 Amperometry Experiments Carbon fiber microelectrodes (5 µm diameter) were constructed as described previously (Pothos et al., 1998) and back-filled with 3 M KCl. Electrode tips were polished at a 45 angle on a diamond dust-embedded micropipette beveling wheel (Model BV-10; Sutter Instrument Co., Novato, CA). Cyclic voltammograms were generated for each electrode in a nitrogensaturated 0.1 mm dopamine solution (in 0.1M Na 2 HPO 4, ph 7.4), and only electrodes with stable I-E curves were used. Cells were bathed in saline (150 mm NaCl, 5 mm KCl, 1.2 mm MgCl 2, 2 mm CaCl 2, 5 mm glucose, 10 mm HEPES) during amperometry recordings. The elevated 100 mm K + saline used to depolarize cells was osmotically balanced by reducing the NaCl concentration to 55 mm. Electrodes were held at +700 mv vs. a locally constructed sodium-saturated calomel reference electrode using a commercially available patch-clamp instrument (Axopatch 200B; Axon Instruments, Foster City, CA) configured as described previously (Borges et al., 1997). Cells were prepared for experiments as described previously (Colliver et al., 2000). Measurements from single, isolated cells were collected on day 6 after subculturing. Control and phospholipid-treated cells were assayed alternately on the same day of experimentation. Typically 2-4 cells per culture dish were used until measurements from at least 25 cells were collected for each condition. When possible, the same electrode was used to measure exocytosis from alternating control and phospholipid treated PC12 cells. This approach minimizes variability between measurements. Each cell was stimulated three times (5 s, 20 psi pulses (Picospritzer II; General Valve Instruments, Fairfield, NJ)) with 100 mm K + at 30 s intervals on an inverted microscope stage heated to 37 ± 1 C (Bionomic System, 20/20 Technology, Inc., Wilmington, NC). Cells responding with fewer than 6 events per stimulation were excluded.
130 113 Data acquisition and analysis The output was digitized at 5 khz and filtered at 2 khz using an internal four-pole lowpass Bessel filter. Data were displayed in real time (Axoscope ; Axon Instruments, Foster City, CA) and stored to the computer with no subsequent filtering. Amperometric peaks were measured using Mini Analysis software (Synaptosoft, Decatur, GA) and the peak characteristics of area (Q, pc), half-width (t 1/2, ms), peak amplitude (I max, pa), 10-90% peak rise time (rise, ms), and decay time (from I max to 0.33% of max, ms) were determined. Signals were designated as spikes if their I max values exceeded five times the RMS noise of a 1 s portion of stable baseline recorded prior to the beginning of each experiment. All peaks identified by the program were inspected visually, and poorly fit peaks were either manually re-calculated or excluded from data sets due to the presence of complex traits (exhibiting multiple peak maxima) or noise interference. Transmission Electron Microscopy PC12 cells were rinsed with PBS, ph 7.4, and treated with Ca 2+ - and Mg 2+ -free 0.05% trypsin-edta (Invitrogen, Gaithersburg, MD) for 30 s. The trypsin-edta solution was removed and the cells were dispersed into solution by flushing them off the culturing substrate with PBS. Single-cell suspensions were transferred to microfuge tubes and pelleted at 100 X g for 10 min. Some cell pellets were exposed to 100 mm K + (identical to that used for amperometry experiments) for 5 s immediately prior to the addition of Karnovsky s fixative, overnight at 4 o C (Karnovsky, 1968). Finally, the pellets were prepared for transmission electron
131 114 microscopy (TEM) as described previously (Colliver et al., 2000a) and viewed on a transmission electron microscope (1200EXII; JEOL, Peabody, MA) at 80 kv. Vesicle diameters in TEM images were performed using ImagePro Plus (ver , Media Cybernetics, Inc. Silver Spring, MD). Mean vesicle diameters were determined for 6 groups: control, PS, and PC with and without brief K + -stimulation immediately prior to fixing. Only vesicles in which a dense core could be clearly identified were measured, and images were not corrected for effect of plane of section on vesicle sizes (Coupland, 1968). Therefore, measured changes in diameter reflect relative changes in vesicle morphology. Statistical analysis To ensure that cells with a large number of events would not be overrepresented within a treatment group, treatment group means derived from mean parameters of each cell were compared (e.g. each cell contributes one average data point rather than n individual data points) (Colliver et al., 2000). Data were tested for significant differences using an ANOVA with the Tukey-test at p 0.05 (SPSS, Ver 10.1, SPSS, Inc., Chicago, Il). All values are reported as the mean ± SEM. 2. Results PS increases the frequency of vesicle fusion events I observe a 70% increase in the number of K + -stimulated amperometric peaks following 3-day incubation with PS (Figure 5.1a, b, c). Incubation with any other phospholipid did not alter the frequency of events compared to untreated cells tested the same day (data not shown). This increase is somewhat related to the concentration of PS that cells were incubated with, as the
132 115 increase to 170 % of control at 100 µm PS was reduced to an increase to only 150 % for cells incubated with only 10 µm PS (Figure 5.1c). The increase in frequency of peaks was observed with each of three successive stimulations. I then employed electron microscopy to ascertain whether the increased frequency of vesicle fusion events could be explained by changes in the number or localization of vesicles within PS-treated cells. Although the number of vesicles per cell was not different from control, I did observe changes related to where the vesicles were found within the cell (Figure 5.2). I counted morphologically docked vesicles that appeared adjacent to the membrane in PStreated cells and concluded that the fraction of the total vesicles that were morphologically docked was significantly lower than that observed in control cells. However, in cells that were examined after being treated with PS, stimulated with 100 mm K + solution to depolarize cells, and immediately fixed, I found that the number of vesicles residing adjacent to the membrane was dramatically increased. The initial decrease in docked, unstimulated vesicles in the PS group closely matches the fractions observed with unstimulated PC (Figure 5.2) and 100 µm L-DOPA treated vesicles (our unpublished observations), and thus may be a result of enlarged vesicle size (Figure 5.5c). In contrast, when cells were fixed during K + stimulation, the fraction of docked vesicles in the PS-treated group nearly doubles (from 0.17 to 0.32), whereas no significant increase was observed with untreated or PC-treated cells. This suggests that PS may play a role in translocating or retaining cytosolic vesicles to or near the membrane during stimulation (i.e. vesicle docking).
133 Figure 5.1. Representative amperometric traces from (a) untreated control and (b) PS-treated cells show that PS treatment results in greater spike frequency. Inset: representative peak shape of individual spikes. (c) This difference is observed following inclubation with 10 um or 100 um PS. Gray bars: untreated; Black Bars: PS-treated cells. 116
 increases after depolarization in PS-treated cells (PS-stim), but not in unstimulated (PS) cells (n = 12 to")
134 117 Figure 5.2. The fraction of morphologically docked vesicles (observed to be adjacent to the membrane) increases after depolarization in PS-treated cells (PS-stim), but not in unstimulated (PS) cells (n = 12 to 23 cells per condition; * denotes p 0.05). Unstimulated PC-treated cells are not significantly different from control (Con; p 0.07) and do not appear to increase upon stimulation (PC stim). Figure 5.3. Representative amperometric current transients from same-day control (light gray traces) and phospholipid treated (black traces) cells following treatment with five different phospholipids.
135 118 PE, SM, and PC affect the kinetics of exocytosis Exocytosis measurements were performed on cells incubated for 3 days with PE, SM, PC, and PI. Unlike PS, no significant changes in the frequency of excytosis were observed. However, I did observe changes in peak shape following PE, SM, and PC treatment, indicative of altered vesicle fusion kinetics. Figure 5.3 displays typical peaks for each treatment and peaks from control cells tested on the same day. Figure 5.4 presents amplitude-normalized traces averaged from all cells per treatment that exhibited altered peak shape. While PS and PI did not affect vesicle fusion kinetics, treatment with PE decreased the half-width and decay times while increasing the amplitude of release. Treatment with SM appeared to affect the initial stages of vesicle fusion, evident by longer rise times and shallower rise slopes of the peak, but half-width also increased slightly. The effect of treatment with PC contrasted that of PE, decreasing the amplitude and rise time of release, while lengthening decay times and half-widths. Figure 5.4 provides a comparative summary of changes in peak parameters for all groups. PC reduces quantal size and slows vesicle fusion The wider, flatter peaks resulting from PC supplementation can be interpreted as the result of a slower rate of vesicle fusion during exocytosis. In addition, I observed a 26% decrease in mean area of amperometric peaks, suggesting that fewer molecules of neurotransmitter were released with each vesicle fusion event. Treatment with the other phosholipids discussed here did not have a statistically significant effect on quantal size. The smaller quantal size (amount of neurotransmitter release detected per exocytosis) after PC treatment could result from a decreased concentration of dopamine in the vesicles, an incomplete kiss and run type flux, or from smaller vesicles. Therefore, I analyzed PC-treated vesicles with electon microscopy (Figure
136 ). Unexpectedly, I observed a small but statistically significant 15% increase in vesicle diameter (50% increase in volume) in PC-treated cells vs. control (Figure 5.5c). I then asked whether a subset of vesicles had increased, or whether all vesicles appeared to increase. The former would indicate that only active, recycling vesicles were able to incorporate excess lipid, while the later would indicate that PC swells the population of vesicles through a slower generative or lipid-exchange process with intracellular membranes. A histogram of vesicle sizes (Figure 5.5d) suggests that the change in vesicle size is uniform, as no subset of enlarged vesicles among the population is observed. For comparison, I also examined PS-treated cells with TEM. I found a similar, although not statistically significant, 8% increase in vesicle diameter (27% increase in volume) for PStreated cells (data not shown). It is possible that phospholipid treatment might enlarge vesicles by general incorporation of excess lipid. Because I did not observe a change in quantal size from PS-treated cells despite larger vesicles, these observations suggest that the concentration within vesicles may decrease to compensate for increases in volume. Because dramatic changes in the fraction of docked vesicles were observed for PS-treated cells following stimulation (Figure 5.2), I asked whether vesicle sizes change upon stimulation. For all groups examined (control-stim, PS-stim, and PC-stim), I observed slight but statistically significant decreases in vesicle diameter following K + stimulation (Figure 5.5c). Again, these decreases appear to affect the distribution of vesicle sizes as a whole as no bimodal distributions were observed in histograms of vesicle size.
137 Figure 5.4. Incubation with PE, SM, or PC changes the kinetics of invidual exocytosis events. (a) Amplitude-normalized mean traces from PE, SM, and PC events demonstrate respective changes in rising and falling portion of peaks. Dotted traces are from phospholipid-treated cells; solid lines are from control cells. Peaks from each cell were averaged, and the means of these averages were temporally aligned to the point of maximum amplitude to generate the normalized mean trace. (b) Summary plots of changes in Amplitude (I max ), half-width (t 1/2 ), 10-90% rise slope, and decay time (ms) for all treatment groups and their same-day respective controls (n = cells per group; * p 0.05; ** p 0.01; *** p vs. same-day-tested untreated control group by t-test). 120

138 Figure 5.5. Electron micrographs of vesicles in (a) control and (b) PC enriched cells; magnification (scale bar = 1 µm). (c) Mean vesicle sizes for control (Con) and PC enriched cells (PC cell). Con Stim and PC Stim cells were treated with a 5-s stimulation of 100 mm K+ prior to fixation. Following stimulation, vesicles in control and PC cells decrease slightly; n = 780, 580, 911, and 609 vesicles from cells per conditon were examined; *** indicates that all groups are different at p < by Tukey-HSD. (d) Histogram of vesicle diameters illustrates a uniform shift to larger diameters with PC treatment (lines) versus control (solid). 121
139 122 Discussion A summary of the effects on exocytosis reported here is presented in Table 5.1. The most dramatic effects of phospholipid treatment are (a) the PS-induced increase in exocytotic frequency, (b) the PC-induced decrease in quantal size and increase in mean vesicular volume and concomitant increase in time needed for vesicle fusion, (c) the PE-induced increase in the kinetics of vesicle fusion, which can be explained by the hypothesis that cone-shaped lipids facilitate the fusion process, and (d) the slowed vesicle fusion by SM. Possible explanations and implications of each will be examined in turn. PI did not appear to affect exocytosis, possibly due to limited incoporation of this species into cells or regulated removal of PI from the plasma membrane. Added PS might increase exocytosis frequency by protein-lipid interactions The observed increase in the number of depolarization-induced exocytosis events following PS treatment indicates that PS may be a limiting factor in vesicle recruitment or fusion. PS binds several calcium-sensitive proteins implicated in exocytosis, including synaptotagmin (SYT) (Popoli et al., 1997), VAMP (Quetglas et al., 2002; Duman et al., 2004), t-
140 123 SNAREs [syntaxin1a and SNAP-25] (Wagner and Tamm, 2001), annexin (Kohler et al., 1997), the dynamins (Burger et al., 2000; Accola et al., 2002) and amphiphysin (Wenk and De Camilli, 2004). The activity of any one of these proteins may be enhanced in the presence of excess PS, increasing the probability of fusion. Enhanced recruitment of vesicles from the non-releasable reserve pool to the readily releasable pool following stimulation could also partly explain the observed increase in stimulated events, as electron micrographs reveal a stimulus-dependent increase in the fraction of morphologically docked vesicles (Figure 5.2). This stimulusdependent increase in fraction of docked vesicles was not observed in control or PC-treated cells, further suggesting that PS may act in part by facilitating vesicle recruitment via a specific protein-headgroup interaction. However, recruitment alone cannot explain the increase. The increased frequency of events is observed during the first and during each subsequent stimulation, indicating that PS treatment increases the probability of exocytosis in a stimulusindependent manner (Figure 5.1d). This further implicates some form of underlying interaction between PS and a protein that plays a critical, rate-determining role in initiating exocytosis. Among the many candidate proteins, two deserve special note. The SNARE protein VAMP binds PS. This binding is crucial for proper function, as tetrodotoxin prevents exocytosis by specifically cleaving the PS binding site from VAMP (Quetglas et al., 2002). Interactions between VAMP (on the vesicle surface) and anionic phospholipids on the inner leaflet of the membrane (PS) may serve to pull the vesicular and cellular membranes together, facilitating fusion (Quetglas et al., 2002; Duman et al., 2004). The calcium sensor protein SYT, which binds to the SNARE complex, also binds PS in the presence of elevated calcium (Brose et al., 1992; Popoli et al., 1997). The PS-binding region of this protein is functionally conserved in humans, rats, and drosophila and homologous to the C2 binding domain of protein kinase C, suggesting
141 124 that PS plays a role in SYT-mediated calcium sensing (Perin et al., 1991). Moreover, PS might affect vesicle docking through SYT, as the exocytosis-promoting α-latrotoxin binds a receptor that phosphorylates SYT and leads to increased vesicle docking (Petrenko et al., 1991). Our observation that the fraction of morphologically docked vesicles increases upon stimulation in PS-treated cells is consistent with PS playing a role in a protein cascade involving SYT and the α-latrotoxin receptor. An alternative explanation to the recruitment hypothesisis is that PS increases the frequency of exocytosis by altering the kinetics of vesicle recycling. Sudhof reports that vesicles can undergo exocytosis and recycle to form a new functional vesicle within 30 s and Farge reports that PS concentrated in the plasma membrane can increase the rate-limiting step of vesicle endocytosis (Farge, 1995; Sudhof, 2004). Furthermore, fast endocytosis is dynamindependent and dynamins have been shown to bind PS (Burger et al., 2000; Holroyd et al., 2002). Fast vesicle cycling is reported to occur in ~30% of exocytosis events (Holroyd et al., 2002), thus the possibility that PS acts in part by promoting fast vesicle recycling can not be eliminated. Added PC decreases quantal size while increasing vesicular volume Table 5.2 provides more detail on the phyisical differences between the phospholipids studied. The acyl chain composition of our PC was identical to that of PI, which had no effect on exocytosis. Therefore, the properties of the headgroup appear to govern the effects observed, assuming similar amounts of PC and PI were incorporated into plasma membranes. The PC headgroup is very strongly hydrated compared to the other headgroups, which could explain why the kinetics of fusion are slower in PC-treated cells. Protein-PC interactions could also play a role, although few proteins involved in exocytosis show an affinity for PC over PS in vitro, as

142 125 PC is found predominantly on the exoplasmic membrane. While I cannot yet attribute the effects observed following PC treatment to a definitive mechanism, these effects may be important to the pathology of one or more neurodegenerative diseases. Lee and coworkers report that MPP+ and S-adenosyl-L-methionine facilitate the conversion of PE to PC and lysophosphatidylcholine (lysopc) in rodent models of Parkinson s disease (Lee and Charlton, 2001; Lee et al., 2005; Lee et al., 2005). Nitsch and coworkers report a significant decrease in the amount of PC and PE in post-mortem brain extracts from Alzheimer disease patients. Here I report that addition of PC decreases quantal size and increases vesicle volume while significantly reducing the rate of neurotransmitter extrusion from vesicles. It is interesting to speculate that these effects of PC on vesicle and quantal size might have specific impact on development of treatments and prevention of Parkinson's Disease. Oxidative stress has been implicated in the events leading to cell death in this disease (Jenner, 2003). L-DOPA treatment increases dopaminergic activity by increasing quantal size (Kozminski et al., 1998). Increased DA is thought to lead to oxidative stress and, in the presence of fewer cells to actively remove DA, this might increase the progression of the disease. Reduction of quantal size in synaptic terminals following treatment with PC should limit oxidative stress. A simultaneous increase in vesicle volume following PC treatment should lead to a larger release volume of transmitter during each quantal event. As DA receptors are saturated at micromolar
143 126 concentrations, a larger volume released into the synapse at lower but still millimolar concentration should act to increase DA transmission by impacting a larger number of active zones. Thus, increasing vesicle size without increasing DA levels might serve as an effective treatment to increase dopaminergic activity and alleviate the disease symptoms while not increasing the oxidative stress on the surrounding cells. This could be especially important in prevention of Parkinson's disease where limiting dopamine quantal size with PC should reduce cell loss owing to normal dopamine-related oxidative stress. It is possible that the phenomena reported here are related to a recent report that a phospholipid-based drug formulation can reduce neurodegeneration and abrogate oxidative stress in the 6-OHDA rat model of Parkinson s disease leading to functional recovery in vivo (Fitzgerald et al., 2005). Adding PE leads to faster individual release events The structure of PE consists of two fatty acids attached to the relatively small head group ethanolamine. As the tails occupy more space than the head group, PE has a conical shape with the head group at the vertex. Cone-shaped lipids induce inward curvature of membranes when concentrated in the inner surface of lipid bilayers, where they are predominantly found in cells (Devaux and Morris, 2004). Inward curvature reduces the energy required for membrane-tovesicle fusion, and therefore would likely increase the rate of fusion pore formation, expansion, and neurotransmitter extrusion. Indeed, this model explains our observations quite well, as incubation with the one cone-shaped lipid increased the kinetics of release while this effect was not observed for the four cylindrical lipids tested. It seems possible that previously observed changes in enzymatic pathways can be attributed to PE effects in the membrane. The observed abbreviated fusion events following PE treatment closely resemble those induced by treatment with PMA, a PKC activator (Burgoyne et al., 2001; Graham et al., 2002).
144 127 Recently, Deli and Kiss reported that PKC-α directly regulates PE hydrolyzation via a novel PE-specific phospholipase-d (Deli and Kiss, 2000). Lipids commonly serve as the substrate for regulatory enzymes to produce signaling molecules. It is possible that exocytosis could be biophysically modulated during the process of rapid lipid-to-signal molecule interconversion by bulk removal or addition of PE. Added SM appears to slow vesicle opening I observe that SM specifically affects the rising portion of peaks, indicative of slower fusion pore opening and expansion (Graham and Burgoyne, 2000). SM and cholesterol apparently form regions of reduced fluidity within membranes (lipid rafts), but the function of these microdomains remains unclear (Salaun et al., 2004). Recently Salaun and others have shown that SNARE complexes associate with lipid rafts in membranes to reduce exocytosis (Salaun et al., 2005, 2005). Although incubation with SM does not alter the number of stimulated events, changes in the kinetics of exocytosis have been observed that could be explained by interference from lipid rafts. Implications An important implication of the results presented here is that changes in membrane PC and PS content might contribute to presynaptic plasticity, possibly through lipid-protein interactions. Two other lipids tested, PE and SM, appear to influence the kinetics of neurotransmitter extrusion from vesicles, by currently unknown mechanisms. PI did not appear to affect exocytosis. These preliminary observations provide new evidence for a critical role of membrane mechanics based on phospholipid diversity in modulating release via exocytosis. Thus phosholipid composition in active zones could affect exocytotic plasticity in synapses.
145 128 Acknowledgements Yoshiko Niimura developed the ideas behind the experiments in this chapter and carried out the amperometry measurements. My contribution was to train Yoshi in eletrochemical methods and advise her on sensible approaches to addressing the question of whether altering membrane phospholipid composition would lead to changes in exocytosis. In addition, I performed the TEM measurements and related data analysis. Because Yoshi had a limited background in molecular biology (she was more of a biophisicist I think) and poor English vocabulary, I researched the literature and wrote a substantial portion of the Brain Research paper, providing a context for these data. Exceptions include the part in the discussion about fast vesicle cycling (Yoshi s contribution) and the relationship between PC, DA quanta, and Parkinson s Disease (Andy s idea) This work was supported, in part, by a grant from the National Institutes of Health. References Accola MA, Huang B, Al Masri A, McNiven MA (2002) The antiviral dynamin family member, MxA, tubulates lipids and localizes to the smooth endoplasmic reticulum. J Biol Chem 277: Borges R, Travis ER, Hochstetler SE, Wightman RM (1997) Effects of external osmotic pressure on vesicular secretion from bovine adrenal medullary cells. J Biol Chem 272: Brose N, Petrenko AG, Sudhof TC, Jahn R (1992) Synaptotagmin: a calcium sensor on the synaptic vesicle surface. Science 256: Burger KN, Demel RA, Schmid SL, de Kruijff B (2000) Dynamin is membrane-active: lipid insertion is induced by phosphoinositides and phosphatidic acid. Biochemistry 39: Burgoyne RD, Fisher RJ, Graham ME, Haynes LP, Morgan A (2001) Control of membrane fusion dynamics during regulated exocytosis. Biochem Soc Trans 29: Chen TK, Luo G, Ewing AG (1994) Amperometric monitoring of stimulated catecholamine release from rat pheochromocytoma (PC12) cells at the zeptomole level. Anal Chem 66: Choi S, Klingauf J, Tsien RW (2000) Postfusional regulation of cleft glutamate concentration during LTP at 'silent synapses'. Nat Neurosci 3: Colliver TL, Pyott SJ, Achalabun M, Ewing AG (2000) VMAT-Mediated changes in quantal size and vesicular volume. J Neurosci 20:
146 Colliver TL, Hess EJ, Pothos EN, Sulzer D, Ewing AG (2000) Quantitative and statistical analysis of the shape of amperometric spikes recorded from two populations of cells. J Neurochem 74: Coupland RE (1968) Determining sizes and distribution of sizes of spherical bodies such as chromaffin granules in tissue sections. Nature 217: Deli E, Kiss Z (2000) Protein kinase C-stimulated formation of ethanolamine from phosphatidylethanolamine involves a protein phosphorylation mechanism: negative regulation by p21 Ras protein. Arch Biochem Biophys 377: Demo SD, Masuda E, Rossi AB, Throndset BT, Gerard AL, Chan EH, Armstrong RJ, Fox BP, Lorens JB, Payan DG, Scheller RH, Fisher JM (1999) Quantitative measurement of mast cell degranulation using a novel flow cytometric annexin-v binding assay. Cytometry 36: Devaux PF (1991) Static and dynamic lipid asymmetry in cell membranes. Biochemistry 30: Devaux PF, Morris R (2004) Transmembrane asymmetry and lateral domains in biological membranes. Traffic 5: Duman JG, Lee E, Lee GY, Singh G, Forte JG (2004) Membrane fusion correlates with surface charge in exocytic vesicles. Biochemistry 43: Farge E (1995) Increased vesicle endocytosis due to an increase in the plasma membrane phosphatidylserine concentration. Biophys J 69: Fitzgerald P, Harris D, Crotty S, Harkin A, Mandel A, Bolton AE, Sullivan AM, Nolan Y (2005) TREATMENT WITH A NOVEL PHOSPHOLIPID-BASED DRUG FORMULATION INHIBITS 6- HYDROXYDOPAMINE-INDUCED P38 ACTIVATION IN RAT SUBSTANTIA NIGRA. In: Society for Neuroscience Annual Meeting. Washington, D. C. Graham ME, Burgoyne RD (2000) Comparison of cysteine string protein (Csp) and mutant alpha-snap overexpression reveals a role for csp in late steps of membrane fusion in dense-core granule exocytosis in adrenal chromaffin cells. J Neurosci 20: Graham ME, O'Callaghan DW, McMahon HT, Burgoyne RD (2002) Dynamin-dependent and dynaminindependent processes contribute to the regulation of single vesicle release kinetics and quantal size. Proc Natl Acad Sci U S A 99: Greene LA, Tischler AS (1976) Establishment of a noradrenergic clonal line of rat adrenal pheochromocytoma cells which respond to nerve growth factor. Proc Natl Acad Sci U S A 73: Holroyd P, Lang T, Wenzel D, De Camilli P, Jahn R (2002) Imaging direct, dynamin-dependent recapture of fusing secretory granules on plasma membrane lawns from PC12 cells. Proc Natl Acad Sci U S A 99: Hui E, Bai J, Wang P, Sugimori M, Llinas RR, Chapman ER (2005) Three distinct kinetic groupings of the synaptotagmin family: candidate sensors for rapid and delayed exocytosis. Proc Natl Acad Sci U S A 102: Jenner P (2003) Oxidative stress in Parkinson's disease. Ann Neurol 53 Suppl 3:S26-36; discussion S Karnovsky M (1968) A formaldehyde-glutaraldehyde fixative of high osmolality for use in electron microscopy. J Cell Biol 27:137A-138A. Kato N, Nakanishi M, Hirashima N (2002) Transbilayer asymmetry of phospholipids in the plasma membrane regulates exocytotic release in mast cells. Biochemistry 41: Kohler G, Hering U, Zschornig O, Arnold K (1997) Annexin V interaction with phosphatidylserinecontaining vesicles at low and neutral ph. Biochemistry 36: Kozminski KD, Gutman DA, Davila V, Sulzer D, Ewing AG (1998) Voltammetric and pharmacological characterization of dopamine release from single exocytotic events at rat pheochromocytoma (PC12) cells. Anal Chem 70: Lee D, Hirashima N, Kirino Y (2000) Rapid transbilayer phospholipid redistribution associated with exocytotic release of neurotransmitters from cholinergic nerve terminals isolated from electric ray Narke japonica. Neurosci Lett 291:
147 Lee ES, Charlton CG (2001) 1-Methyl-4-phenyl-pyridinium increases S-adenosyl-L-methionine dependent phospholipid methylation. Pharmacol Biochem Behav 70: Lee ES, Soliman KF, Charlton CG (2005) Lysophosphatidylcholine decreases locomotor activities and dopamine turnover rate in rats. Neurotoxicology 26: Lee ES, Chen H, Charlton CG, Soliman KF (2005) The Role of Phospholipid Methylation in 1-Methyl-4- Phenyl-Pyridinium Ion (MPP(+))-Induced Neurotoxicity in PC12 Cells. Neurotoxicology. Ostrowski SG, Van Bell CT, Winograd N, Ewing AG (2004) Mass spectrometric imaging of highly curved membranes during Tetrahymena mating. Science 305: Perin MS, Johnston PA, Ozcelik T, Jahn R, Francke U, Sudhof TC (1991) Structural and functional conservation of synaptotagmin (p65) in Drosophila and humans. J Biol Chem 266: Petrenko AG, Perin MS, Davletov BA, Ushkaryov YA, Geppert M, Sudhof TC (1991) Binding of synaptotagmin to the alpha-latrotoxin receptor implicates both in synaptic vesicle exocytosis. Nature 353: Popoli M, Venegoni A, Buffa L, Racagni G (1997) Ca2+/phospholipid-binding and syntaxin-binding of native synaptotagmin I. Life Sci 61: Pothos EN (2002) Regulation of dopamine quantal size in midbrain and hippocampal neurons. Behav Brain Res 130: Pothos EN, Przedborski S, Davila V, Schmitz Y, Sulzer D (1998) D2-Like dopamine autoreceptor activation reduces quantal size in PC12 cells. J Neurosci 18: Quetglas S, Iborra C, Sasakawa N, De Haro L, Kumakura K, Sato K, Leveque C, Seagar M (2002) Calmodulin and lipid binding to synaptobrevin regulates calcium-dependent exocytosis. Embo J 21: Salaun C, James DJ, Chamberlain LH (2004) Lipid rafts and the regulation of exocytosis. Traffic 5: Salaun C, Gould GW, Chamberlain LH (2005) Lipid raft association of SNARE proteins regulates exocytosis in PC12 cells. J Biol Chem 280: Salaun C, Gould GW, Chamberlain LH (2005) The SNARE proteins SNAP-25 and SNAP-23 display different affinities for lipid rafts in PC12 cells. Regulation by distinct cysteine-rich domains. J Biol Chem 280: Sudhof TC (2004) The synaptic vesicle cycle. Annu Rev Neurosci 27: Wagner ML, Tamm LK (2001) Reconstituted syntaxin1a/snap25 interacts with negatively charged lipids as measured by lateral diffusion in planar supported bilayers. Biophys J 81: Wenk MR, De Camilli P (2004) Protein-lipid interactions and phosphoinositide metabolism in membrane traffic: insights from vesicle recycling in nerve terminals. Proc Natl Acad Sci U S A 101: White LR, Petrovitch H, Ross GW, Masaki K, Hardman J, Nelson J, Davis D, Markesbery W (2000) Brain aging and midlife tofu consumption. J Am Coll Nutr 19: Wightman RM, Jankowski JA, Kennedy RT, Kawagoe KT, Schroeder TJ, Leszczyszyn DJ, Near JA, Diliberto EJ, Jr., Viveros OH (1991) Temporally resolved catecholamine spikes correspond to single vesicle release from individual chromaffin cells. Proc Natl Acad Sci U S A 88:
148 131 CHAPTER 6 HIGH OSMOLARITY AND L-DOPA AUGMENT FUSION PORE RELEASE IN PC12 CELLS 1. Introduction A large body of biochemical and genetic studies of secretory granule exocytosis have confirmed exocytosis is highly regulated, involving a core set of fusion proteins that play a role in the docking, priming and fusion of secretory vesicles (Burgoyne and Morgan, 2003). Less is known, however, about the role of membrane properties in controlling the kinetics of the vesicular release event. A recent study from the Ewing laboratory suggests differences between the membrane tension in the vesicle and associated cell membrane during the fusion pore transition state of exocytosis can stabilize this pore (Sombers et al., 2004). The present study aims to further investigate the mechanisms by which membrane biophysics affect neurotransmitter release through the use of hyperosmotic solutions and treatment with L-DOPA. Hyperosmotic saline causes cells to shed water, and, in the process, causes membranes to lose tension. Mark Wightman s group has previously demonstrated that this membrane configuration allows vesicles to initiate fusion with membranes but remain fixed in a transition state where significant release of neurotransmitter is prevented. Upon restoration of isotonic saline, significant exocytosis is observed (Troyer and Wightman, 2002). Unlike chromaffin cells, vesicle fusion is not completely stalled by hypertonic saline in PC12 cells, but merely slowed. This difference could be related to differences in the size of the halo surrounding dense cores in the secretory vesicles found in these two cell types. One can quantitatively measure differences is the rate of exocytotic release using amperometry. When release through a stable fusion pore precedes full vesicular fusion, it is
149 132 distinguished in amperometric records of exocytosis as a pre-spike plateau, commonly termed a foot (Chow et al., 1992; Alvarez de Toledo et al., 1993). The integrated area under the foot portion of the spike is representative of the number of molecules released through the fusion pore prior to full fusion. The duration of release during the foot is indicative of the lifetime, or stability, of the fusion pore structure (Sombers et al., 2004). Another useful quantity is foot flux, which is the area under the foot portion of a spike divided by the duration of the foot to yield the amount of neurotransmitter released per unit time (fc/ms). A larger foot flux indicates the presence of either a larger or more rapidly expanding fusion pore. Finally, the frequency with which amperometric feet are observed is a direct measure of the frequency with which vesicles release neurotransmitter through a long-lived, stable exocytotic fusion pore as opposed to an explosive vesicular fusion event. Release through the fusion pore that occurs without full fusion, termed kiss and run exocytosis, has also been measured with amperometry (Staal et al., 2004). In this case, vesicles transiently fuse with the plasma membrane and release a portion of their contents before rapidly pinching off one or more times in succession. Transmitters are released through the transient pore, allowing one or more smaller messages to be sent without refilling. These types of analyses are particularly interesting in light of recent studies suggesting that the kinetics of vesicular fusion may contribute to the expression of long-term potentiation and thus affect synaptic plasticity (Choi et al., 2000, 2003). In this chapter, results are presented following application of a high osmolarity saline solution to create a tension differential across the fusion pore. This treatment decreases the plasma membrane tension, and thus decreases the total transpore membrane tension for PC12 cells. The key finding is that the percentage of fusion events that exhibit a foot is increased in hypertonic saline as compared to stimulation in isotonic extracellular conditions. In addition this
150 133 treatment increases the duration and magnitude of fusion pore release. These results lead to the proposal that one part of the mechanism of fusion pore stabilization is plausibly based on membrane biophysics. 2. Methods Cell Culture Stock PC12 cells were purchased from the American Type Culture Collection (Manassas, VA) and maintained as described previously (Kozminski et al., 1998). In brief, PC12 cells were grown on mouse collagen IV coated culture dishes (Becton Dickinson, Bedford, MA) in supplemented RPMI-1640 medium. Cells were kept in a 7% CO 2 atmosphere at 37 C and were subcultured approximately every 7 to 9 days or when confluency was reached. Cells were used for all experiments between days 7 and 12 of subculturing. Reagents and Solutions All reagents were obtained from Sigma and used as received. Isotonic (335 mosm) physiological saline was prepared with 150 mm NaCl, 5 mm KCl, 1.2 mm MgCl 2, 5 mm glucose, 10 mm HEPES, and 2 mm CaCl 2. Hypertonic saline (700 mosm) was prepared by raising the NaCl concentration to 332 mm. For all solutions, ph was adjusted to 7.40 with concentrated NaOH. Solution osmolarities were confirmed with a vapor pressure osmometer (Vapro, Wescor, Inc., Logan, UT).
151 134 Electrode preparation and experimental setup Carbon fiber microelectrodes (5-µm diameter) were constructed as described previously (Pothos et al., 1998) and back-filled with 3 M KCl. Electrode tips were polished at a 45 angle on a diamond dust-embedded micropipette beveling wheel (Model BV-10, Sutter Instrument Co., Novato, CA). Cyclic voltammograms were generated for each electrode in a nitrogen-saturated 0.1 mm dopamine solution (in 0.1 M phosphate buffered saline, ph 7.4), and only electrodes with stable I-E curves were used. The working electrode was gently lowered onto a single cell using a piezomicropositioner (PCS-750/1000, Burleigh Instruments, Fishers, NY). The close proximity of the electrode to the cell surface was confirmed by a slight deformation in the outline of the cell. Exocytosis was stimulated at approximately 1-min intervals with a 5-s, 20-psi pulse (Picospritzer II, General Valve, Fairfield, NJ) of saline containing 100 mm K +. This stimulation saline was of the same osmolarity as the saline used in the cell bath. All experiments were performed at 37 ± 1 C. Culture dishes were warmed using a solid state Peltier heating device (Bionomic System, 20/20 Technology, Inc., Wilmington, NC). Data acquisition and data analysis Electrodes were held at V vs. a silver/silver chloride reference electrode (World Precision Instruments, Inc., Sarasota, FL) using a commercially available patch-clamp instrument (Axopatch 200B; Axon Instruments, Inc., Foster City, CA) configured as described previously (Borges et al., 1997). The output was digitized at 5 khz and filtered at 2 khz using an internal 4-pole lowpass Bessel filter. Data were displayed in real time (Axoscope , Axon Instruments, Inc.) and stored digitally with no subsequent filtering.
152 135 Exocytotic spikes were identified and the spike characteristics area (fc), t ½ (ms), and i max (pa), as well as foot area (fc) and foot duration (ms) were determined using MiniAnalysis software (Synaptosoft, Inc.). Signals were designated as spikes if their i max values were 5 times the RMS noise of a 1-s portion of stable baseline recorded prior to the first stimulation. The onset of the foot was defined as the time when the signal exceeded the peak-to-peak noise of a 5 ms time segment, and the end of the foot was defined by the inflection point between the foot and the main event. This threshold value was determined by mathematically taking the second derivative of the trace. Averaged signals were generated using MiniAnalysis by aligning individual events at their peaks. All peaks identified by the program were visually inspected and unfit peaks were manually excluded from the data sets. Double peaks, those with more than one peak (jagged tops), and those without a smooth decline to baseline were removed. Additionally stand-alone foot signals were removed, as these could not be definitively characterized. Amperometry experiments Cells were prepared for an experiment by removing culture medium, washing, adding fresh saline, and placing the cells onto the heated (37 ± 1 o C) stage of an inverted microscope (IM-35, Carl Zeiss, Thornwood, NY) for 60-min. This saline contained 100 µm L-DOPA in half of the experiments. After, the media was replaced with either isotonic (335 mosm) or hypertonic (700 mosm) saline. Cells were allowed to re-equilibrate for 10-min before stimulation using 100 mm K + -saline of the same osmolarity as the bath, adjusted by changing the amount of NaCL. Amperometric data were recorded during during the stimulation.
153 136 Statistical analysis Both pooled data sets and sets of mean values for foot characteristics were used to draw conclusions (Colliver et al., 2000). Data sets were tested for significant differences from isotonic or hypertonic control using Student t-tests (SigmaPlot, Version 8.0, SPSS, Inc.) Results for all tests were considered significant if associated p values were < All values are reported as the mean ± SEM and all plots were created using SigmaPlot. 3. Results Amperometric release via the fusion pore under hypertonic conditions Amperometric data from individual PC12 cells stimulated in isotonic or hyperotonic extracellular saline are shown in Figure 6.1a and 6.1b, resecptively. Amperometric spikes collected under isotonic and hypertonic conditions either contained or did not contain a foot. Examples are shown in Figure 6.1c and 6.1d for isotonic and hypertonic conditions, respectively. The spikes collected under hypertonic conditions were temporally broadened relative to those collected under isotonic conditions, particularly in the foot portion. Moreover, variability in foot shape was evident (Figure 6.1e) and the combined treatment of hypertonic saline and 100 µm L- DOPA augmented this foot signal considerably. Averaged current spikes collected in hypertonic saline were broader and somewhat larger (34 ± 3 fc versus 39 ± 5 fc), indicating that stimulation in hypertonic extracellular solution results in slower expulsion of transmitter during exocytotic release, similar to previous reports (Troyer and Wightman, 2002). However, the number of spikes per stimulation was not different for the groups. L-DOPA treatment did increase quantal size, consistent with previous studies (Pothos et al., 1996).
154 Figure 6.1. Representative amperometric data from individual PC12 cells. Cells were stimulated under (a) isotonic (335 mosm) or (b) hypertonic (700 mosm) conditions. The arrow under the trace represents the time that a 5-s pulse of 100 mm K + was applied. Examples of individual amperometric current transients collected under (c) isotonic or (d) hypertonic conditions are shown below. In (c) and (d) the trace on the left has no discernable foot signal, whereas the trace on the right is preceded by a foot. (e) Examples of extensive foot flux from amperometric peaks with collected in hypertonic extracellular saline following a 60-min exposure to 100 µm L- DOPA. 137
155 138 Foot frequency as a function of osmolarity The percentage of amperometric events exhibiting feet in cells stimulated in either isotonic or hypertonic saline are compared in Figure 6.2a. Exposure of PC12 cells to hypertonic saline for 10 min resulted in an increase in the number of events with a foot. The percentage of exocytotic events displaying a detectable foot was 44 ± 2 % under isotonic (control) conditions, and 57 ± 3 % under hypertonic conditions (p < 0.01). After a 60-min exposure to 100 µm L- DOPA, the percentage of events with a foot observed in either isotonic or hypertonic saline changed to 34 ± 3% and 44 ± 6%, respectively. The difference in the percent of events with a foot in L-DOPA-lodaed cells was not statistically significant at the 95 % confidence level (p = 0.09). Foot flux as a function of osmolarity Foot flux, or the ratio of the foot area divided by the foot duration, increases under hypertonic conditions. Figures 6.2b and 6.2c present foot area and foot duration data for release events stimulated in both isotonic and hypertonic conditions. The mean foot area collected under isotonic conditions was 2.2 ± 0.6 fc. This value increased to 6.0 ± 1.0 fc under hypertonic conditions, indicating that 3 times as many molecules were released through the fusion pore (p < 0.01). This increase in foot area is even more pronounced when means of foot area are calculated with each cell in the sample represented equally, rather than pooling all data within a treatment. When analyzed using cell means, foot duration in isotonic saline was 1.6 ± 0.4 fc and increased 4-fold to 6.2 ± 1.5 fc in hypertonic saline. When 100 µm isotonic L-DOPA was added, mean foot area was larger than control (p < when pooling data and p < 0.05 using cell means approach).
156 139 In experiments performed on cells incubated for 60-min in 100 µm isotonic L-DOPA, mean foot duration was longer under hypertonic conditions (3.9 ± 0.5 ms for hypertonic vs. 1.8 ± 0.2 ms for control; p < 0.001; Figure 6.2c). When mean values foot of duration were calculated for each cell, averaged, and then compared instead of pooling all event data within each treatment group, the same trend was evident; however, the differences between groups were not statistically significant. Thus, both hypertonic conditions and pre-treatment with L-DOPA serve, at least in part, to increase the number of molecules released through the fusion pore. Hypertonic treatment increases percent of contents released in the foot The area under the foot portion of the amperometric peak was compared to the area of the whole peak. The area of the foot divided by the total peak area provides a quantitative metric of the fraction of the total neurotransmitter released during the expansion of the fusion pore. The values for percent released in the foot from cells stimulated in either isotonic or hypertonic saline after they were incubated for 60 min in isotonic saline or in isotonic saline containing 100 µm L- DOPA are compared in Figure 6.2d. Note that L-DOPA does not increase the percent released in the foot, whereas similar increases are observed in both hypertonic saline-treated groups (p < 0.001).
157 Figure 6.2. Summary of amperometric foot characteristics. (a) The percentage of the events that exhibited a foot are presented for PC12 cells stimulated under four conditions: isotonic saline after a 60-min exposure to isotonic saline (IC) (n = 6), hypertonic saline after a 60-min exposure to isotonic saline (HC) (n = 6), isotonic saline after a 60-min exposure to isotonic L-DOPA (ID) (n = 5), and hypertonic saline after a 60-min exposure to isotonic L-DOPA (HD) (n = 5). An average of 110 ± 14 amperometric spikes comprise the data sets for each group. Error bars represent the mean ± SEM of the mean cellular values. Although stand-alone foot events were observed, they were not included in this analysis as they could not be definitively characterized. (b) Foot area, (c) foot duration and (d) the % of the vesicular content released in the foot portion of the event for the same experimental groups. Error bars represent the mean ± SEM of the pooled data. Values marked with * and ** and *** are statistically different with p < 0.05 and p < 0.01 and p < vs. isotonic control, respectively (Student t-test). &&& signifies that the hypertonic L-DOPA data set is significantly different from isotonic L-DOPA with p < (ttest). 140

158 Figure
159 Discussion Effects of osmolarity on neurotransmitter release through the fusion pore The PC12 cell data presented here indicate the part of the amperometric spike that displays the largest relative alteration when exocytosis is elicited in high osmolarity saline is the amperometric foot, which is thought to represent detection of neurotransmitter release through the fusion pore. Understanding the effect of a high osmolarity solution on exocytosis is important because it allows postulation of a mechanism for fusion pore stabilization. The frequency of amperometric events that exhibit feet is increased when cells are bathed in high osmolarity saline (Figure 6.2). This indicates that, for PC12 cells, exocytosis through a fusion pore intermediate state (vs. exocytosis that rapidly proceeds to full fusion) occurs more frequently under hypertonic relative to isotonic conditions. The amount of neurotransmitter released through the pore and the time course of the extrusion through the pore are increased as osmolarity is increased, as shown in Figure 6.3a. Additionally, the percentage of the total vesicular contents released in the foot portion of the amperometric event is increased (Figure 6.3c). Thus, the fusion pore intermediate state appears to be stabilized by hypertonic conditions. This finding is consistent with a study of cortical granule exocytosis in sea urchin eggs (Merkle and Chandler, 1989). In that system, hypertonic extracellular saline has been shown to arrest the widening of the fusion pore in granules that fuse with the plasma membrane. PC12 cell dense core vesicles (Greene and Tischler, 1976) have a structure and composition similar to vesicles in adrenal chromaffin cells (Tischler and Greene, 1978; Wagner, 1985; Fischer-Colbrie and Schober, 1987); however, the dense core appears to occupy less of the overall vesicle volume in PC12 cells (Sombers et al., 2004; Amatore et al., 2005). This may explain the differences between the results presented here and results reported for release from
160 143 bovine chromaffin cells in high osmolarity saline. Previous work on chromaffin and mast cells using cyclic voltammetry has indicated vesicle fusion occurs under high osmolarity conditions; however, vesicles are frozen in an intermediate state between the opening of the fusion pore and extrusion of vesicle contents (Troyer and Wightman, 2002). In fact, the results of these prior studies indicate all but a small amount of secretion is prevented until isotonic conditions are restored. The secretion that does occur under hypertonic conditions in these cell types is thought to arise from components not associated with the dense core matrix, because the hypertonic extracellular saline prevents dissociation of the dense core and thus release of the transmitter bound within (Troyer and Wightman, 2002). The data presented here indicate that when PC12 cells are stimulated in high osmolarity saline, full vesicular fusion is not prevented. Rather, vesicles fuse with the plasma membrane and, after a delay, the fusion pore is destabilized enough to initiate complete release. It is possible that a more complete oxidation of catecholamines by amperometry (relative to voltammetry) may contribute to dissociation and swelling of the dense core and thus promote complete release in this system. Nevertheless, this finding underscores the possibility that the perturbation of release kinetics in different types of dense core granules of different cell types can have subtle or dramatic differences. It is also interesting to note when release via the pore (the foot) is evident in amperometric records from PC12 cells stimulated in hypertonic saline and pre-treated with L-DOPA, these feet are often very large in area and long in duration as compared to the area and halfwidth of the subsequent amperometric spike (Figure 6.1e). This result is consistent with recent data showing newly loaded dopamine is preferentially stored in the halo portion of the vesicle (Sombers et al., 2005). Under hypertonic conditions, dense core dissolution is prevented or significantly slowed, allowing for preferential release of dopamine
161 144 that is not directly associated with the dense core (Troyer and Wightman, 2002). Release of catecholamine from the halo could then lead to core expansion. This provides further evidence that dense core expansion is an important biophysical factor regulating release via the fusion pore under typical, isotonic conditions. Mechanisms regulating release via the fusion pore under high osmolarity conditions Evans and Yeung have experimentally shown that a lipid nanotube connected to a vesicle constricts when the tension on the vesicle is increased (Evans and Yeung, 1994). During the time frame of a stable fusion pore a small vesicle will undergo Brownian motion. If this motion is away from the membrane, it will result in a short nanotube structure. The Ewing group has suggested that a nanotube transition state is part of some release events (Sombers et al., 2004). If the fusion pore is, at some stage, considered to be a short lipidic nanotube connecting the vesicle to the cell membrane, then an increased differential tension across the fusion pore should lead to constriction of the pore. This would initially stall the opening of the fused vesicle to full distension of the membrane. Previous work has supported this hypothesis by demonstrating that under isotonic conditions smaller vesicles in PC12 cells, which demonstrate an increased dense core to halo volume ratio, exhibit amperometric feet with an increased frequency as compared to larger vesicles with dense cores occupying less of the total vesicular volume (Sombers et al., 2004). In that work it was hypothesized that as exocytosis is initiated, an expanding dense core increases tension on the vesicular membrane leading to its constriction and stalling full vesicular fusion. The isotonic data presented here are in agreement with the data from this previous study in that the percentage of amperometric events exhibiting feet is higher for saline treated cells than it is for L-DOPA treated cells (Figure 6.2a).
162 145 When PC12 cells are bathed in hypertonic saline a tension differential is initiated across the fusion pore, but in contrast to the earlier experiments this differential is achieved by decreasing, rather than increasing, the total tension across the fusion pore. In hypertonic extracellular saline the tension on the plasma membrane is reduced, as evidenced by a wrinkled appearance of the cells (data not shown). This has also been documented for adrenal chromaffin cells (Borges et al., 1997) and for sea urchin eggs (Merkle and Chandler, 1989). In this condition the tension on the plasma membrane should be significantly less than that of the membrane of a connected vesicle, decreasing the total tension across the fusion pore structure and creating a tension differential that should constrict and stabilize the fusion pore. The data collected from cells bathed in hypertonic saline (Figures 6.2) are consistent with this idea, indicating that a decreased total tension on the plasma membrane-fusion pore-vesicular membrane system may slow the destabilization of the pore and the onset of full vesicular fusion in PC12 cells. These results are also consistent with theoretical results indicating that the total tension across a lipidic pore determines the rate of pore expansion during fusion (Chizmadzhev et al., 2000). This explanation for the trends evident in these data is shown in the schematic presented in Figure 6.3. This model assumes a stable lipidic nanotube structure (Chizmadzhev et al., 1995; Chizmadzhev et al., 1999; Chizmadzhev et al., 2000; Cans et al., 2003), rather than simply a torroidal lipidic structure (Lollike et al., 1995; Albillos et al., 1997). Under isotonic conditions a tension differential exists across the fusion pore because the vesicular membrane tension is greater than that of the plasma membrane (Figure 6.3a). This tension differential is due, in part, to the expansion of the dense core exerting a mechanical pressure on the vesicle membrane, and thus is dependent on the ratio of the dense core to total vesicle volume. In contrast when
163 146 exocytosis is initiated in hypertonic extracellular saline, dissociation of the dense core matrix is largely inhibited (Figure 6.3b). Thus, core expansion does not serve to increase the tension on the vesicle membrane. A tension differential between the vesicle and plasma membranes does exist; however, because the tension on the plasma membrane is decreased (as compared to the tension on the more highly curved vesicle membrane) and, thus, release kinetics are altered accordingly.
164 Figure 6.3. Model of exocytotic vesicle fusion occurring from PC12 cells stimulated in either isotonic or hypertonic extracellular saline. (a) Model of exocytotic vesicle fusion occurring from PC12 cells stimulated in isotonic saline. A tension differential between the vesicular and plasma membranes is rapidly generated. Upon opening of the exocytotic fusion pore, the swelling of the dense core matrix produces a fluidic pressure on the intravesicular wall, which increases tension on the vesicular membrane as compared to that on the plasma membrane. If the fusion pore goes through an intermediate state involving a short lipid nanotube, this will lead to a transient constriction of the fusion pore, as shown. Subsequently, the increase in the difference in membrane tension between the vesicular and plasma membranes should result in increased lipid flow through the fusion pore, equilibrating the membrane tension on either side of the pore and thus diminishing its overall stability. This results in an abrupt opening of the pore. (b) The model of exocytosis from PC12 cells in hypertonic saline is physically different from that in isotonic saline in two distinct ways. Upon opening of the fusion pore, dissociation of the dense core matrix is largely inhibited and thus core expansion does not rapidly increase the tension on the vesicle membrane. A tension differential between the vesicle and plasma membranes exists because tension in the plasma membrane is decreased when cells are exposed to hypertonic saline. The tension differential along the fusion pore likely leads to constriction and stabilization of the pore until lipid flow through the pore equilibrates the tensions and results in full vesicular fusion. 147
165 148 It is important to note that this model only addresses the biophysical consequences of the lipidic nature of the fusion pore, and does not consider the effects of proteins that may contribute to the early stages of vesicular fusion (Lollike et al., 1995; Albillos et al., 1997). Thus the model presented in Figure 6.3 reflects forces involved in the expansion of the pore and not the initial pore formation. Fusion pore formation itself is not energetically favorable and requires SNARE proteins to facilitate the kinetics in in vitro experiments (Liu et al., 2005). However, fusion pores must expand at some point in order to fully integrate into the plasma membrane, and the effects of altering vesicle size with L-DOPA and membrane tension with hyperosmotic solutions provides valuable clues that can used to build a more complete model of the fusion pore expansion stage of exocytosis. The evidence presented in this chapter indicates that during this latter stage, membrane mechanics may, in part, be involved in determining the stability of the fusion pore, and these data will lead to refined overall models for vesicle fusion and any role that altered release via the pore might play in plasticity. 5. Acknowledgements Leslie Sombers designed and carried out the experiments described in this chapter and appears as the first author in the paper submitted to The Biophyisical Journal. My contribution was to perform data analysis and help rewrite some of the drafts of the manuscript. Nate Wittenberg also helped in discussions and in rewriting. Shakir-Botteri assisted with cell culture. Thanks to Dr. Gong Chen for use of the osmometer. This work was supported by the National Institutes of Health.
166 References Albillos A, Dernick G, Horstmann H, Almers W, Alvarez de Toledo G, Lindau M (1997) The exocytotic event in chromaffin cells revealed by patch amperometry. Nature 389: Alvarez de Toledo G, Fernandez-Chacon R, Fernandez JM (1993) Release of secretory products during transient vesicle fusion [see comments]. Nature 363: Amatore C, Arbault S, Bonifas I, Bouret Y, Erard M, Ewing AG, Sombers LA (2005) Correlation between vesicle quantal size and fusion pore release in chromaffin cell exocytosis. Biophys J 88: Borges R, Travis ER, Hochstetler SE, Wightman RM (1997) Effects of external osmotic pressure on vesicular secretion from bovine adrenal medullary cells. J Biol Chem 272: Burgoyne RD, Morgan A (2003) Secretory granule exocytosis. Physiol Rev 83: Cans AS, Wittenberg N, Karlsson R, Sombers L, Karlsson M, Orwar O, Ewing A (2003) Artificial cells: Unique insights into exocytosis using liposomes and lipid nanotubes. Proc Natl Acad Sci U S A 100: Chizmadzhev YA, Cohen FS, Shcherbakov A, Zimmerberg J (1995) Membrane mechanics can account for fusion pore dilation in stages. Biophys J 69: Chizmadzhev YA, Kuzmin PI, Kumenko DA, Zimmerberg J, Cohen FS (2000) Dynamics of fusion pores connecting membranes of different tensions. Biophys J 78: Chizmadzhev YA, Kumenko DA, Kuzmin PI, Chernomordik LV, Zimmerberg J, Cohen FS (1999) Lipid flow through fusion pores connecting membranes of different tensions. Biophys J 76: Choi S, Klingauf J, Tsien RW (2000) Postfusional regulation of cleft glutamate concentration during LTP at 'silent synapses'. Nat Neurosci 3: Choi S, Klingauf J, Tsien RW (2003) Fusion pore modulation as a presynaptic mechanism contributing to expression of long-term potentiation. Philos Trans R Soc Lond B Biol Sci 358: Chow RH, von Ruden L, Neher E (1992) Delay in vesicle fusion revealed by electrochemical monitoring of single secretory events in adrenal chromaffin cells. Nature 356: Colliver TL, Hess EJ, Pothos EN, Sulzer D, Ewing AG (2000) Quantitative and statistical analysis of the shape of amperometric spikes recorded from two populations of cells. J Neurochem 74: Evans E, Yeung A (1994) Hidden dynamics in rapid changes of bilayer shape. Chemistry and Physics of Lipids 73: Fischer-Colbrie R, Schober M (1987) Isolation and characterization of chromogranins A, B, and C from bovine chromaffin granules and a rat pheochromocytoma. J Neurochem 48: Greene LA, Tischler AS (1976) Establishment of a noradrenergic clonal line of rat adrenal pheochromocytoma cells which respond to nerve growth factor. Proc Natl Acad Sci U S A 73: Kozminski KD, Gutman DA, Davila V, Sulzer D, Ewing AG (1998) Voltammetric and Pharmacological Characterization of Dopamine Release from Single Exocytotic Events at Rat Pheochromocytoma (PC12) Cells. Analytical Chemistry 70: Liu T, Tucker WC, Bhalla A, Chapman ER, Weisshaar JC (2005) SNARE-driven, 25- millisecond vesicle fusion in vitro. Biophys J 89:
167 Lollike K, Borregaard N, Lindau M (1995) The exocytotic fusion pore of small granules has a conductance similar to an ion channel. J Cell Biol 129: Merkle CJ, Chandler DE (1989) Hyperosmolality inhibits exocytosis in sea urchin eggs by formation of a granule-free zone and arrest of pore widening. J Membr Biol 112: Pothos E, Desmond M, Sulzer D (1996) L-3,4-dihydroxyphenylalanine increases the quantal size of exocytotic dopamine release in vitro. J Neurochem 66: Pothos EN, Przedborski S, Davila V, Schmitz Y, Sulzer D (1998) D2-Like dopamine autoreceptor activation reduces quantal size in PC12 cells. J Neurosci 18: Sombers LA, Maxson MM, Ewing AG (2005) Loaded Dopamine is Preferentially Stored in the Halo Portion of PC12 Cell Dense Core Vesicles. J Neurochem 93: Sombers LA, Hanchar HJ, Colliver TL, Wittenberg N, Cans A, Arbault S, Amatore C, Ewing AG (2004) The effects of vesicular volume on secretion through the fusion pore in exocytotic release from PC12 cells. J Neurosci 24: Staal RG, Mosharov EV, Sulzer D (2004) Dopamine neurons release transmitter via a flickering fusion pore. Nat Neurosci 7: Tischler AS, Greene LA (1978) Morphologic and cytochemical properties of a clonal line of rat adrenal pheochromocytoma cells which respond to nerve growth factor. Lab Invest 39: Troyer KP, Wightman RM (2002) Temporal separation of vesicle release from vesicle fusion during exocytosis. J Biol Chem 277: Wagner JA (1985) Structure of catecholamine secretory vesicles from PC12 cells. J Neurochem 45:
168 151 CHAPTER 7 LOADED DOPAMINE IS PREFERENTIALLY STORED IN THE HALO PORTION OF PC12 CELL DENSE CORE VESICLES 1. Introduction Dense-core vesicles in secretory cells stably store their contents at high (mm) concentrations. These high concentrations are partially maintained by ionic interactions between the small cationic catecholamine molecules stored in the vesicles and the acidic proteins (i.e. chromagranin A, a polyanion) that comprise the vesicle matrix (dense core) (Kopell and Westhead, 1982; Yoo and Albanesi, 1991; Videen et al., 1992), thus allowing the interior of the vesicle to be iso-osmotic with the cell cytoplasm (Holz, 1986). Previous studies on adrenal chromaffin and mast cells have demonstrated that upon exposure to the extracellular (isotonic) solution through the fusion pore, an exchange occurs between the vesicular interior and the extracellular fluid such that catecholamine molecules associated with the core begin to be exchanged with hydrated extracellular ions, inducing swelling of the dense core matrix (Breckenridge and Almers, 1987; Zimmerberg et al., 1987). Interestingly, recent work has shown that high osmolarity solutions can be used to inhibit dissociation of the matrix constituents and thus prevent extrusion of vesicle contents that are directly associated with the matrix(troyer and Wightman, 2002). This allows temporal isolation of an intermediate state in which only a small amount of secretion occurs, most likely due to the release of vesicular components stored in the halo (space between the dense core and the vesicular membrane of a vesicle) which are not readily associated with the dense core.
169 152 Using carbon fiber amperometry, secretion is resolved as a series of current spikes that represent the electrooxidation of released substances, providing considerable information on the release process. The frequency at which the current spikes are collected is a direct measure of the frequency with which vesicles are fusing with the plasma membrane directly beneath the electrode. The area under each spike is proportional to the number of molecules released from each vesicle, and the halfwidth, or width at half height, of each spike reflects on the kinetics of individual release events from single cells. It has been suggested that neurotransmitter dissolved in the liquid or halo fraction of PC12 1 cell(sombers et al., 2004), adrenal chromaffin(borges et al., 1997; Troyer and Wightman, 2002) or beige mouse mast cell(alvarez de Toledo et al., 1993; Troyer and Wightman, 2002) vesicles is not readily associated with the dense core and thus that it is able to freely flow through the fusion pore into the extracellular space. In high osmolarity saline, exocytosis is halted in an intermediate state providing access to the vesicle interior without dissociation of the vesicle matrix, such that only components that are not directly associated with the dense core, or that are freed due to small amount of matrix dissociation that occurs near the fusion pore, are released(troyer and Wightman, 2002). This allows for selective release of transmitter stored in the halo region of the vesicle. I have used this concept as the basis for the present work, which investigates where dopamine is stored as it is loaded into PC12 vesicles. PC12 cells were treated with L-DOPA, a dopamine precursor that affects VMAT-mediated transport of catecholamines into PC12 cell vesicles by increasing(pothos et al., 1996; Pothos et al., 1998) the total amount of electroactive transmitter(s) released from dense core vesicles and, importantly, by increasing vesicular volume(colliver et al., 2000). Cells were stimulated before and after treatment with L-DOPA in either isotonic or hypertonic saline, individual vesicular release events were monitored using amperometry, and
170 153 cells were imaged using transmission electron microscopy. The data indicate that upon treatment with L-DOPA the majority of the added dopamine is preferentially stored in the halo portion of PC12 dense core vesicles. This finding is significant because it suggests that the vesicular halo plays a significant role as a storage compartment for neurotransmitter, and provides a more complete understanding of the complex interaction of molecules within dense core vesicles. 2. Methods Cell Culture This was carried out as described previously (Sombers et al., Submitted September 2004). Stock PC12 cells were purchased from the American Type Culture Collection (Manassas, VA, USA) and maintained as described previously (Kozminski et al. 1998). In brief, PC12 cells were grown on mouse collagen IV coated culture dishes (Becton Dickinson, Bedford, MA, USA) in supplemented RPMI-1640 medium. Cells were kept in a 7% CO2 atmosphere at 37 C and were subcultured approximately every 7 9 days or when con.uency was reached. Cells were used for all experiments between days 7 and 12 of subculturing. Electrode Preparation and Experimental Setup Carbon fiber microelectrodes (5-µm diameter) were constructed as described previously(pothos et al., 1998) and back-filled with 3 M KCl. Electrode tips were polished and tested for stability as described previously(sombers et al., Submitted September 2004). Electrochemistry experiments were setup as described previously(sombers et al., Submitted September 2004).
171 154 Data Acquisition and Analysis Electrodes were held at V vs. a silver/silver chloride reference electrode (World Precision Instruments, Inc., Sarasota, FL, USA) using a commercially available patch-clamp instrument (Axopatch 200B; Axon Instruments, Inc., Foster City, CA, USA) configured as described previously (Borges et al., 1997). The output was digitized at 5 khz and filtered at 2 khz using an internal 4-pole lowpass Bessel flter. Data were displayed in real time (Axoscope , Axon Instruments, Inc.) and stored digitally with no subsequent filtering. Exocytotic spikes were identifed and the spike characteristics area (fc), t ½ (ms), and i max (pa), as well as foot area (fc) and foot duration (ms) were determined using MiniAnalysis software (Synaptosoft, Inc.). Signals were designated as spikes if their i max values were 5 times the standard deviation of a 1-s portion of stable baseline recorded prior to the first stimulation. The onset of the foot was determined as the time when the signal exceeded the peak-to-peak noise of a 5 ms time segment, and the end of the foot was defined by the inflection point between the foot and the main event. This threshold value was determined by mathematically taking the second derivative of the trace. Averaged signals were generated using Mini Analysis by aligning individual events at their peaks. All peaks identified by the program were visually inspected and unfit peaks were manually excluded from the data sets. Double peaks, those with more than one peak (jagged tops), and those without a smooth decline to baseline were removed. Additionally standalone foot signals were removed, as these could not be definitively characterized. On average, those removed constituted approximately 5% of the well-resolved spikes.
172 155 Amperometry Experiments A same-cell paradigm for the amperometry experiments has been applied, as described previously(colliver et al., 2000). In brief, the same electrode was used to measure release from a cell before and after drug treatment, thus minimizing cell-to-cell and electrode variability. Cell culture medium was removed, cells were rinsed in isotonic saline and then bathed in either isotonic (335 mosm) or hypertonic (700 mosm) saline for 10-min. Each cell was stimulated at least twice and the position of the electrode and injector relative to the cell were recorded. Both were then lifted above the cell and out of solution. A pipet was used to rapidly remove saline from the dish. The cells were subsequently exposed to either isotonic saline or isotonic saline containing 100 µm L-DOPA for 60-min. The cells were again gently rinsed and the bath replaced with a saline solution of the same osmolarity as was used in the first part of the experiment. This was allowed to re-warm to 37 o C, and post-drug measurements were usually obtained min. after rinsing by repositioning the working electrode and injector to their original location. Only cells that maintained their morphology during the incubation period were used. Data for the spike characteristics area and t ½, are reported as ratio values created from the same PC12 cell before and after it was treated with drug. As histograms of raw spike area values are heavily skewed to the right, I have log transformed the values (Pothos et al., 1998; Colliver et al., 2000). Ratios for each characteristic were then created by dividing the mean of the values after the incubation period by the mean of the values before treatment (i.e. mean post/mean pre).
173 156 Electron Microscopic Analysis PC12 cells were rinsed with physiological isotonic saline, exposed for 10-min. at 37 C to either isotonic (control) or hypertonic saline, then exposed for 60-min. at 37 C to isotonic saline alone or to isotonic saline containing 100 µm L-DOPA, and were finally washed for 10- min. with saline of the original osmolarity, held at 37 C. Next, cells were dispersed into solution by flushing them off the culturing substrate. Single-cell suspensions were transferred to microfuge tubes and pelleted at 100 g for 10-min. Cell pellets were incubated overnight at 4 C in Karnovsky s fixative (Karnovsky, 1965). Finally, the pellets were prepared for TEM as described previously(colliver et al., 2000) and were viewed on a transmission electron microscope (1200EXII; JEOL, Peabody, MA) at 80 kv. Images were acquired using a TEM high resolution camera (F224, Tietz, Gauting, Germany). Quantitative analysis of vesicle structures was performed using Image-Pro Plus (Version 4.1, Media Cybernetics, Inc., Silver Springs, MD) as described previously(sombers et al., 2004). TEM images were imported into this software and the limiting membrane of each vesicle, as well as the perimeter of its dense core, were traced. Once each object was inscribed, Image-Pro determined its diameter. Diameter was defined as the average of the distance of the major and minor axes on the initial trace. The major axis was defined as the distance between the two most distal points on the initial trace, and the minor axis was defined as that which crossed the major axis perpendicularly. Only vesicles in which a dense core could be clearly identified were measured. Volume values were calculated based on the simplified assumption that the vesicle structures were spherical. No corrections for factors such as plane of section were made(coupland, 1968). As a result, the measured changes in volume reflect relative changes in vesicle morphology.
174 157 Reagents and Solutions Solutions were prepared as described previously(sombers et al., Submitted September 2004). Stimulation was performed with saline of the same osmolarity as the cell bath, with the K + concentration raised to 100 mm and the NaCl concentration decreased accordingly to maintain osmolarity. For all solutions, ph was adjusted to 7.4 with concentrated NaOH. Solution osmolarities were confirmed with a vapor pressure osmometer (Vapro, Wescor, Inc., Logan, UT). Statistical Analysis For the TEM analysis, both pooled data samples and mean cellular values for vesicle sizes were compared statistically. Mean cellular values were included in the analysis to ensure that cells with a large number of vesicles would not be over-represented within a treatment group (Colliver et al., 2000). Data sets were tested for significant differences using the t-test (SigmaPlot, Version 8.0, SPSS, Inc.). Results for all tests were considered significant if associated p values were < All values are reported as the mean ± SEM and all plots were created using SigmaPlot.
175 Results Experimental Protocol and Example Amperometric Traces The electrochemistry experiments were performed as depicted in Figure 7.1. PC12 cells were bathed in either isotonic (335 mosm) or hypertonic (700 mosm) physiological saline and stimulated with a 100 mm K + saline solution (NaCl levels were balanced accordingly to maintain osmolarity). This solution was removed and cells were exposed to isotonic saline or isotonic saline containing 100 µm L-DOPA for 60-min. Isotonic saline was chosen for all L-DOPA incubations to eliminate any effect that hypertonic saline may have on the VMAT. Cells were gently rinsed, the bath solution was replaced with fresh saline of the same osmolarity as the original bath, and a final stimulation was performed. Representative amperometric current transients are shown in the inset. The spike on the left does not exhibit a pre-spike foot; that on the right does. A complete characterization of events exhibiting feet is presented in an accompanying manuscript(sombers et al., Submitted September 2004). The area of an individual amperometric signal is directly proportional to the number of molecules released by the relationship Q = nnf, where Q is the charge of each current transient, N is the number of moles detected, F is Faraday s constant (96,485 C/equiv), and n is the number of electrons transferred per oxidized molecule (2 for catecholamines)(wightman et al., 1991).
176 159 Figure 7.1. General experimental protocol for the amperometric monitoring of exocytosis from single PC12 cells in either isotonic (335 mosm) or hypertonic (700 mosm) saline. Cells were initially stimulated in either isotonic or hypertonic saline. The arrows represent the time of stimulus (100 mm K + ) application. Cells were gently rinsed and then bathed for 60-min. in either isotonic saline or isotonic saline containing L-DOPA. Cells were again rinsed and a final stimulation was conducted in saline of the original osmolarity. The traces depicted were collected in isotonic saline. An expanded view of two amperometric events is presented in the inset; that on the left does not exhibit a pre-spike foot, that on the right does. 8.0 pa 40.9 ms 10.0 pa 10.0 pa 1,310 ms Isotonic Saline (335 mosm) or Hypertonic Saline (700 mosm) 60 min 100 µm L-DOPA or Isotonic Saline 1,310 ms Isotonic Saline (335 mosm) or Hypertonic Saline (700 mosm) Stimulation 1 Stimulation 2
177 160 The Effects of Extracellular Osmotic Changes and L-DOPA on Vesicular Catecholamine Release A same-cell paradigm for amperometry experiments was used in which the same electrode was used to measure release from a cell before and after drug exposure. This approach sets each cell as its own control and thus minimizes cell-to-cell and electrode variability and, as a result, is more sensitive to changes in spike characteristics as compared to measuring release from separate groups of cells (Pothos et al., 1998; Colliver et al., 2000). Ratios for spike area were created for each cell by dividing the mean of log area values after the incubation period by the mean of log area values before treatment (see Methods), thus allowing each cell to serve as its own control. Peak area is defined as the time integral of each current transient. Under isotonic conditions (control) a 60-min. exposure of PC12 cells to isotonic saline did not significantly alter the amount of catecholamine released when the solution was replaced with fresh isotonic saline and cells were stimulated again (Figure 7.2a). This demonstrates the stability of the carbon fiber electrode over the incubation time period. Consistent with previous reports(pothos et al., 1996), when cells were stimulated in isotonic saline, allowed to rest for 60- min. in an isotonic saline spiked with 100 µm L-DOPA, then re-stimulated in a fresh isotonic saline, the amount of catecholamine released increased by 26 ± 6% (p < vs. isotonic control). Similarly, when PC12 cells were stimulated under hypertonic conditions, exposed to isotonic saline containing 100 µm L-DOPA for 60-min., then restimulated in hypertonic saline, the amount of catecholamine released increased by 36 ± 5% (p < 0.05 vs. hypertonic control, Figure 2a). Summarized in Table 7.1, these increases, relative to their individual controls, are not significantly different from one another (p = 0.25).
178 161 Table 7.1. Incubation in L-DOPA increases amperometric event area and halfwidth to a similar extent when cells are stimulated in isotonic and hypertonic extracellular saline. Area (% Increase) Halfwidth (% Increase) Isotonic L-DOPA Hypertonic L-DOPA 26 ± 6 % 88 ± 22 % 36 ± 5 % 107 ± 32 %
179 162 Figure 7.2. Summary of amperometric data. (a) Mean area ratio values and (b) halfwidth ratio values (see Methods) created at individual PC12 cells upon stimulation under four conditions: isotonic saline (IC) before and after a 60-min. exposure to isotonic saline (n = 6), isotonic saline before and after a 60-min. exposure to isotonic L-DOPA (ID) (n = 5), hypertonic saline (HC) before and after a 60-min. exposure to isotonic saline (n = 6), and hypertonic saline before and after a 60-min. exposure to isotonic L-DOPA (HD) (n = 5). For the ratios presented, an average of 79 ± 12 and 47 ± 7 amperometric values were used to determine pre and post means, respectively. Bars represent the mean ± SEM of ratio values for the different experimental conditions. As the mean ratio values approximate one for isotonic control cells, it is clear that the incubation time itself did not have a significant effect on spike characteristics. Values marked with *** are statistically different with p < 0.001, and * indicates a significant difference with p < 0.05 vs. isotonic control (t-test). The values marked with & are significantly different from hypertonic control with p < The values marked with X are not significantly different from one another. A. Number of Molecules Released Ratio Value X *** * X & IC ID HC HD B. t 1/2 Ratio Value X *** * X & IC ID HC HD
180 163 Similar trends hold for the halfwidths (t ½ ) of the amperometric spikes collected (Figure 2b). These data are also summarized in Table 7.1. Halfwidth is defined as the width of each peak at half its height, and does not include the foot measurement. This value has been shown to be dependent on the degranulation and extrusion of transmitter from the vesicle in adrenal chromaffin cells(wightman et al., 1995; Pihel et al., 1996; Borges et al., 1997). Ratios for t ½ were created from a cell by dividing the mean of the halfwidth values after the incubation period by the mean of the halfwidth values before treatment (see Methods), again allowing each cell to serve as its own control. Under isotonic conditions, exposure of PC12 cells to isotonic saline alone did not significantly alter the halfwidth values (Figure 2b). However, a 60-min. incubation in 100 µm L-DOPA increased the halfwidth of the amperometric spikes by 88 ± 22% (p < vs. isotonic control). Similarly, cells that were stimulated under hypertonic conditions, exposed for 60-min. to an isotonic 100 µm L-DOPA saline, then re-equilibrated in hypertonic saline produced spikes with halfwidths that were increased by 107 ± 32% (p < 0.05 vs. hypertonic control). These increases, relative to their own controls, are not significantly different from one another (p = 0.62). Interestingly cells that were stimulated under hypertonic conditions, exposed to plain isotonic saline for 60-min., and restimulated in hypertonic saline showed a slight increase in halfwidth (p < 0.05). The Effects of Extracellular Osmotic Changes and L-DOPA on Vesicular Volume Transmission electron micrographs were taken of PC12 cells which were exposed for 10- min. at 37 C to either isotonic (control) or hypertonic saline, then exposed for 60-min. at 37 C to isotonic saline alone or to isotonic saline containing 100 µm L-DOPA, and that were finally washed for 10-min. with saline of the original osmolarity, also held at 37 C. This protocol is
181 164 identical to that used in corresponding amperometry experiments. Representative TEM images from single PC12 cells are shown in Figure 7.3. For all cells examined, dense core vesicles could be readily observed throughout the cytoplasm. Additionally, for all vesicles analyzed a limiting membrane could be clearly discerned from the dense core. The mean diameter of the outer limiting membrane for dense core vesicles from cells treated with only isotonic saline throughout the protocol was 129 ± 5 nm. This value increased by 44% to 186 ± 12 nm when PC12 cells in isotonic saline were treated with 100 µm L-DOPA for 60-min., and then rinsed for 10-min. in isotonic saline (p < vs. isotonic control, data not shown). Similarly, the mean dense core vesicle diameter from cells treated with hypertonic saline, then incubated in isotonic saline for 60-min., and rinsed for 10-min. in hypertonic saline was 136 ± 12 nm. This value increased by 30 % to 177 ± 11 nm when PC12 cells in hypertonic saline were incubated in isotonic saline containing 100 µm L-DOPA for 60-min., then rinsed for 10-min. in hypertonic saline (p < 0.05 vs. hypertonic control, data not shown). These data were used to calculate vesicular volumes using the simple assumption that the vesicles were of a spherical geometry, and are presented in Figure 7.4. To independently investigate changes in the volume of the dense core and the volume of the vesicle halo for the data presented above, similar measurements were taken of the diameter of the dense cores, and the corresponding core volumes were calculated assuming that the cores were of a spherical geometry. Halo volumes were calculated by subtracting the volume of the dense core from that of the entire vesicle. The results are presented in Figure 7.4. The mean core diameter for cells treated with only isotonic saline was 72 ± 2 nm, and this value increased by 19 % to 86 ± 3 nm for dense cores from cells that had been incubated for 60-min. in isotonic saline containing L-DOPA, then re-equilibrated in isotonic saline. This corresponds to a 74%
182 165 larger volume for cores from cells that had been exposed to L-DOPA versus those from cells treated with isotonic saline alone (p < 0.01). In stark contrast, the volume of the vesicular halo is 316 % greater from cells that had been exposed to isotonic L-DOPA than halos from isotonic control cells (p < 0.001). As shown in Figure 7.4, similar trends hold for hypertonic conditions. The mean core diameter for cells treated with only hypertonic saline was 79 ± 8 nm, and this value increased by 9 % to 86 ± 3 nm for dense cores from cells that had been incubated for 60- min. in isotonic saline containing L-DOPA and then re-equilibrated in hypertonic saline (p < 0.05). However, the vesicular halo volume is 223 % greater (than hypertonic control) from cells that were exposed to hypertonic saline, incubated for 60 minutes in isotonic L-DOPA, and reequilibrated for 10-min. in hypertonic saline (p < 0.01). Thus, the morphological data suggest that the majority of the volume increase in these vesicles is in the halo and therefore that dopamine is being added to the vesicular halo, rather than the dense core, upon treatment with L- DOPA.
183 166 Figure 7.3. Representative TEM images. Images were taken of single PC12 cells following (a) 10-min. exposure to isotonic saline, rinse, 60-min. exposure to isotonic saline, rinse, 10-min. exposure to isotonic saline (b) 10-min. exposure to isotonic saline, rinse, 60-min. exposure to isotonic L-DOPA, rinse, 10-min. exposure to isotonic saline (c) 10-min. exposure to hypertonic saline, rinse, 60-min. exposure to isotonic saline, rinse, 10-min. exposure to hypertonic saline, and (d) 10-min. exposure to hypertonic saline, rinse, 60-min. exposure to isotonic L-DOPA, rinse, 10-min. exposure to hypertonic saline. A portion of the nucleus can be seen in each image. Scale bars represent 500 nm. A. C. 0.5 µm B. 0.5 µm D. 0.5 µm 0.5 µm
184 167 Estimating Vesicular Catecholamine Concentration In order to investigate whether the dopamine associated with the dense core is a significant contributor to the amperometric signal, I have calculated both the concentration of dopamine added to single PC12 cell dense core vesicles and the concentration of catecholamine released per vesicle after treatment with L-DOPA. These values are compared in Figure 7.5. The calculations were done as follows. First, the mean number of moles of dopamine detected per amperometric release event was calculated for each cell before and after a 60-min. treatment with 100 µm L-DOPA. Subtracting the value corresponding to measurements before L-DOPA incubation from that calculated from data collected after the incubation, a value was obtained describing the change in the number of moles of catecholamine electrochemically detected for each cell. # moles detected = (# moles detected after - # moles detected before) To calculate the concentration of dopamine added this value was then divided by the difference between the mean vesicular halo volumes before and after incubation in L-DOPA (here it was assumed that all dopamine was added to the vesicular halo). Using the transmission electron micrographs, the mean vesicular halo volume pre incubation was subtracted from the corresponding mean vesicular halo volume post incubation with L-DOPA.
185 168 Figure 7.4. Summary of mean volume changes in PC12 dense cores, vesicle halos, and overall vesicular volumes. Bars represent mean ± SEM of mean volume values from all isotonic control cells (n = 10), isotonic cells exposed to isotonic L-DOPA (n = 8), hypertonic control cells (n = 9), or hypertonic cells exposed to isotonic L-DOPA (n = 11). An average of 43 ± 4 vesicles was measured per cell. Values marked with *** are statistically different with p < 0.001, and ** indicates a significant difference with p < 0.01 vs. isotonic control (t-test). Those values marked with && and & are significantly different from hypertonic control with p < 0.01 and p < 0.05, respectively. Values marked with X are not significantly different from the corresponding measurement done in saline of differing osmolarity. Because mean values are plotted, the dense core volume and halo volume do not in all cases add exactly to the mean total volume. The same statistical trends were observed when the data were pooled from each group and statistically compared. Volume (al) 6 4 X X *** *** Core Volume Halo Volume Total Vesicle Volume X && X && 2 X ** X & Iso Control Iso DOPA Hyper Control Hyper DOPA
186 169 # moles detected [DA] added to vesicles = halo volume As described in the Methods, no corrections for factors such as plane of section were made (Coupland, 1968). As a result, the measured changes in volumes reflect relative changes in vesicle morphology. Thus, a concentration for dopamine added to PC12 dense core vesicles was calculated, assuming that all added catecholamine was stored in the vesicular halo. The value for the concentration of dopamine added to the vesicles was then compared to the concentration of catecholamine released from entire vesicles after the L-DOPA incubation. This concentration was calculated in one of two ways for comparison: by dividing the cellular mean number of moles of catecholamine released per vesicle by the mean vesicular volume mean # moles detected after incubation [CA] in vesicles after incubation = mean vesicle volume after incubation or by dividing the mean number of moles of catecholamine detected by the mean vesicular halo volume. mean # moles detected after incubation [CA] in vesicles after incubation = mean vesicular halo volume after incubation All vesicular volumes were obtained from the corresponding transmission electron micrographs.
187 170 The mean concentration of dopamine added to single PC12 cell dense core vesicle halos was calculated to be 45 ± 8 mm under isotonic conditions, and 187 ± 48 mm under hypertonic conditions. These values correlate nicely with the corresponding concentrations of catecholamine released per vesicle after treatment with L-DOPA. When these values are calculated using the mean vesicle volume in the denominator, they are 57 ± 5 mm and 158 ± 32 mm under isotonic and hypertonic conditions, respectively. When the vesicular concentration of dopamine released is calculated using the vesicular halo volume in the denominator, they are 62 ± 5 mm and 179 ± 36 mm under isotonic and hypertonic conditions, respectively. All calculated catecholamine concentrations are significantly higher under hypertonic conditions.
188 171 Figure 7.5. The concentration of dopamine added to PC12 dense core vesicles is not significantly different from that estimated to be released from the vesicle after L-DOPA incubation. The concentration of dopamine added was calculated by amperometrically measuring the difference between the number of molecules released (per cell) before and after a 60 min. incubation in 100 µm L-DOPA (isotonic before: n = 5 cells, 415 events; isotonic after: n = 5 cells, 375 events; hypertonic before: n = 5 cells, 456 events; hypertonic after: n = 5 cells, 295 events) and dividing this value by the change in the mean volume of the vesicular halo before and after incubation (isotonic before: n = 10 cells, 454 vesicles; isotonic after: n = 8 cells, 268 vesicles; hypertonic before: n = 9 cells, 589 vesicles; hypertonic after: n = 11 cells; 353 vesicles). The estimated concentration of dopamine released from the vesicles after the incubation was calculated by dividing the mean number of moles of dopamine released (per cell) by either the mean vesicular volume or the mean vesicular halo volume for the corresponding condition. Under isotonic conditions the calculated concentration of dopamine added to the vesicles corresponds best with the estimated concentration of dopamine released from vesicles after the L-DOPA incubation when this value is calculated using the whole vesicle volume in the denominator. In contrast, under hypertonic conditions the calculated concentration of dopamine added to the vesicle corresponds best with the estimated concentration of dopamine released from vesicles after the L-DOPA incubation when this value is calculated using the vesicular halo volume in the denominator. Hypertonic values marked with * are statistically different with p < 0.05 vs. the corresponding measurement done in the isotonic condition. [DA] added, calculated using V HALO 300 [DA] released, calculated using V HALO [DA] released, calculated using V TOTAL Concentration (mm) * * * Isotonic Hypertonic
189 Discussion In this work, the roles of the vesicular dense core and the vesicular halo are deconvoluted in an effort to investigate how each is involved in the storage of loaded catecholamine, and how this can modulate the exocytotic release event. The data presented here suggest that upon pharmacological treatment with L-DOPA the majority of the dopamine taken up by PC12 cells is preferentially stored in the halo portion of dense core vesicles. This finding is significant as release during the opening of the fusion pore in PC12(Sombers et al., 2004), adrenal chromaffin(borges et al., 1997; Troyer and Wightman, 2002) and beige mouse mast cells(alvarez de Toledo et al., 1993; Troyer and Wightman, 2002) is likely a result of leakage through the pore of transmitter stored in the halo region of the vesicle. Several investigations have indicated that release through the exocytotic fusion pore may be involved in a certain kind of plasticity(choi et al., 2000, 2003). As L-DOPA selectively increases the halo of vesicles, this could be important in defining plasticity across individual synapses. Thus, these data suggest that the function of the dense core might be other than merely storage of neurotransmitter and associated molecules. I have used two distinct pharmacological manipulations to investigate where added dopamine is stored upon treatment with L-DOPA. I have treated the cells with a hypertonic solution in order to alter the osmotic gradient across the fusion pore and thus dramatically alter secretion by stalling the vesicles at the vesicle membrane in an intermediate state that has been previously termed kiss-and-hold (Troyer and Wightman, 2002). This intermediate state consists of a docked vesicle with a fusion pore open to the external media, thus selectively allowing for release of transmitter that is not directly associated with the dense core, owing to inhibition of dense core dissociation(borges et al., 1997; Troyer and Wightman, 2002). In
190 173 combination with this I have utilized L-DOPA to increase(pothos et al., 1996; Pothos et al., 1998) the total amount of electroactive transmitter(s) released from dense core vesicles and, importantly, to increase vesicular volume(colliver et al., 2000). L-DOPA has also been shown to increase the size of amperometric pre-spike features (feet) in records of exocytosis from PC12 cells(sombers et al., 2004). Because secretion events can vary from cell to cell, each cell served as its own control. PC12 cells were loaded with L-DOPA in isotonic saline and exocytotic release was monitored in both isotonic (335 mosm) and hypertonic (700 mosm) solutions. In prior amperometric studies of secretion of catecholamines from bovine adrenal chromaffin cells under hypertonic conditions (630 mosm), release events temporally broadened relative to those observed under isotonic conditions(jankowski et al., 1994; Borges et al., 1997). The present work is consistent with these studies in that hypertonic treatment slows the kinetics of the release event (data not shown). They are also consistent with a recent model for exocytotic release through the fusion pore, which indicates that the hydration and swelling of the vesicle matrix causes a pressurized flow of neurotransmitter through the fusion pore, constriction of the pore and an increased lipid flow (from the plasma membrane to the vesicular membrane) leading to its destabilization(sombers et al., 2004). In agreement with previous work, exposure of PC12 cells to 100 µm L-DOPA significantly increased spike area and t ½ values when cells were stimulated in isotonic saline (Figure 7.2) (Pothos et al., 1996). Interestingly, when similar measurements were taken from PC12 cells stimulated under hypertonic conditions before and after a 60-min. incubation in isotonic saline containing L-DOPA, spike areas and t ½ values were increased to a similar extent (Figure 7.2). It has been hypothesized and experimentally supported that the presence of an osmotic gradient is required across the cellular membrane for exocytosis of neurotransmitter that
191 174 is strongly associated with a dense core matrix(troyer and Wightman, 2002). The increase in both the amount of catecholamine released and the time course of release following treatment with L-DOPA under hypertonic conditions is not significantly different from the increase in these characteristics upon treatment with L-DOPA in control cells (stimulated to release in isotonic saline). Thus, these data suggest that the bulk of release in both isotonic and hypertonic conditions originates from the halo rather than the core, and that treatment of PC12 cells with L- DOPA serves to preferentially load dopamine into the halo portion of dense core vesicles, where is it not directly associated with the vesicular dense core. These findings were further substantiated using transmission electron microscopy. Detailed images of PC12 cells were taken in both isotonic and hypertonic solutions, before and after treatment with L-DOPA. Although previous studies have demonstrated that both chromaffin and mast cell vesicles contract in response to hypertonic stress without disruption of their stored contents(brodwick et al., 1992), the results of this study indicate that PC12 cell vesicles do not significantly contract upon treatment with hypertonic saline (Figure 7.4). This may be due to morphological differences between PC12 cell, chromaffin cell and mast cell vesicles. In both chromaffin and mast cells the dense core is thought to largely fill the interior of the vesicle(amatore et al., 2000); however, in PC12 cells electron micrographs indicate that the dense core generally fills only a portion of the vesicle (Figure 7.3)(Sombers et al., 2004). In agreement with previous studies(colliver et al., 2000), treatment with L-DOPA significantly increased PC12 dense core vesicle volume (Figures 7.3 and 7.4). The mechanisms behind this vesicular volume increase are currently unknown; however, a recent report has discussed several possibilities that may contribute to vesicle membrane area regulation in chromaffin cells(gong et al., 2003). As discussed by Gong et al., the area of a phospholipid bilayer can only expand 2-4
192 175 % before rupture(evans et al., 1976). Thus, vesicle membrane area could be regulated through the fusion of small vesicles to, or the budding of small vesicles from, dense core vesicles. Alternatively cytosolic phospholipid transport proteins such as phosphatidylinositol transfer protein, which has been shown to be involved in secretory vesicle formation, may contribute to changes in vesicle membrane area. Furthermore, vesicle membrane area may be directly regulated by changes in osmotic pressure. It has been shown in molluscan neurons that high plasma membrane tensions favor recruitment of membrane to the cell surface (net exocytosis), whereas low plasma membrane tensions promote net endocytosis(dai et al., 1998). Interestingly when the volumetric increases in the dense cores were calculated after L-DOPA treatment, it was evident that the dense core volume increased to a greater extent (74%) in isotonic vs. hypertonic (9%) saline. This finding is in agreement with previous reports suggesting that upon opening of the fusion pore in hypertonic saline dense core dissociation is largely inhibited(troyer and Wightman, 2002). Additionally, it is strikingly evident that the vesicular halo volume increased to a much greater extent than did the core volume under both isotonic and hypertonic conditions (Figure 7.4). These morphological data are consistent with the electrochemical data in that they indicate that the bulk of the dopamine taken up by PC12 cells is preferentially stored in the vesicular halo. Another aspect of these experiments examines the effect of hypertonic conditions on the concentration of neurotransmitter stored in PC12 cell dense core vesicles. Treatment with hypertonic solutions has been shown to increase miniature end-plate potentials at the frog neuromuscular junction(van der Kloot, 1987). Additionally, it is widely agreed that vesicular neurotransmitter concentration is tightly regulated and that it remains relatively constant as neurotransmitter is loaded into vesicles(colliver et al., 2000). The data presented here suggest
193 176 that PC12 cell vesicles under hypertonic conditions contain more catecholamine than under isotonic conditions, and that they are an exception to the constant concentration rule. Both the calculated concentration of dopamine added to the vesicular halo and the estimated concentration of catecholamine released from the vesicle after incubation in L-DOPA are greater under hypertonic conditions than under isotonic (control) conditions (Figure 7.5). Such a situation could arise if more dopamine is loaded into the vesicles after exposure to hypertonic conditions, or if the PC12 vesicle volume does indeed decrease in hypertonic saline without an obvious decrease in the mean vesicle diameter, i.e., if the vesicles become less round. Under both isotonic and hypertonic conditions the calculated concentration of dopamine added to the vesicular halos corresponds well with the estimated concentration of catecholamine released from the vesicles post-incubation when this value is calculated using the whole vesicle volume in the denominator (Figure 7.5). Interestingly, under hypertonic conditions the calculated concentration of dopamine added to the vesicles corresponds best with the estimated concentration of catecholamine released from vesicles after the L-DOPA incubation when this value is calculated using the vesicular halo volume in the denominator. This is not surprising because under hypertonic conditions the vesicular dense core should be tightly bound and thus most of the dopamine should be added to and released from the halo. Under isotonic conditions the calculated concentration of dopamine added corresponds best to the estimated concentration of catecholamine released from the vesicles after the L-DOPA incubation when this value is calculated using the whole vesicle volume in the denominator. These data are in agreement with the previous reports suggesting that hypertonic treatment prevents the full extrusion of vesicle contents as a consequence of the inhibition of dense core dissociation(troyer and Wightman, 2002), and they suggest that under both isotonic and hypertonic conditions dopamine is
194 177 preferentially loaded into the halo compartment of vesicles. In addition, these data agree with recently published experiments demonstrating that amperometric foot size increases with L- DOPA treatment(sombers et al., 2004), as they indicate that L-DOPA leads to the packaging of transmitter in a more accessible pool (the halo). Release of transmitter from the halo should not be directly regulated by dissociation of the core matrix; however, the expanding core might serve to pressurize the vesicular compartment, forcing transmitter located in the halo through the fusion pore early in exocytosis. This work should be of particular interest to those studying the dynamics of neurotransmitter release, as a deconvolution of the effects of neurotransmitter released from the core and the halo can help elucidate the role that each compartment plays in governing aspects of exocytosis ranging from the kinetics of exocytotic release to the driving force for release via the fusion pore. Although the work here focuses on drug-treated cells in vitro, TEM data of vesicles clearly demonstrate that a significant halo is present under isotonic control conditions (Figure 7.3), suggesting that the halo may serve as an important transmitter storage site in vivo. 5. Acknowledgements Leslie Sombers was the primary contributor to this project and appears as first author on the J. Neurochem version of this chapter published in My contribution was in data analysis and discussion, and I appear as second author. Other contributors included former group member Tom Colliver who provided helpful ideas and suggestions via , undergraduate student Nicole Shakir-Botteri who assisted with cell culture, Missy Hazen who advised with the TEM methods, Dr. Gong Chen who provided use of an osmometer, and Paula Powell who helped with software expertise. This work was supported by the National Institutes of Health.
195 References Alvarez de Toledo G, Fernandez-Chacon R, Fernandez JM (1993) Release of secretory products during transient vesicle fusion [see comments]. Nature 363: Amatore C, Bouret Y, Travis ER, Wightman RM (2000) Interplay between membrane dynamics, diffusion and swelling pressure governs individual vesicular exocytotic events during release of adrenaline by chromaffin cells. Biochimie 82: Borges R, Travis ER, Hochstetler SE, Wightman RM (1997) Effects of external osmotic pressure on vesicular secretion from bovine adrenal medullary cells. J Biol Chem 272: Breckenridge LJ, Almers W (1987) Final steps in exocytosis observed in a cell with giant secretory granules. Proc Natl Acad Sci U S A 84: Brodwick MS, Curran M, Edwards C (1992) Effects of osmotic stress on mast cell vesicles of the beige mouse. J Membr Biol 126: Choi S, Klingauf J, Tsien RW (2000) Postfusional regulation of cleft glutamate concentration during LTP at 'silent synapses'. Nat Neurosci 3: Choi S, Klingauf J, Tsien RW (2003) Fusion pore modulation as a presynaptic mechanism contributing to expression of long-term potentiation. Philos Trans R Soc Lond B Biol Sci 358: Colliver TL, Pyott SJ, Achalabun M, Ewing AG (2000) VMAT-Mediated changes in quantal size and vesicular volume [In Process Citation]. J Neurosci 20: Colliver TL, Hess EJ, Pothos EN, Sulzer D, Ewing AG (2000) Quantitative and statistical analysis of the shape of amperometric spikes recorded from two populations of cells. J Neurochem 74: Coupland RE (1968) Determining sizes and distribution of sizes of spherical bodies such as chromaffin granules in tissue sections. Nature 217: Dai J, Sheetz MP, Wan X, Morris CE (1998) Membrane tension in swelling and shrinking molluscan neurons. J Neurosci 18: Evans EA, Waugh R, Melnik L (1976) Elastic area compressibility modulus of red cell membrane. Biophys J 16: Gong LW, Hafez I, Alvarez de Toledo G, Lindau M (2003) Secretory vesicles membrane area is regulated in tandem with quantal size in chromaffin cells. J Neurosci 23: Holz RW (1986) The role of osmotic forces in exocytosis from adrenal chromaffin cells. Annu Rev Physiol 48: Jankowski JA, Finnegan JM, Wightman RM (1994) Extracellular ionic composition alters kinetics of vesicular release of catecholamines and quantal size during exocytosis at adrenal medullary cells. J Neurochem 63: Karnovsky M (1965) A Formaldehyde-Glutaraldehyde Fixative of High Osmolality for Use in Electron Microscopy. J Cell Biol 27:137A-138A. Kopell WN, Westhead EW (1982) Osmotic pressures of solutions of ATP and catecholamines relating to storage in chromaffin granules. J Biol Chem 257: Pihel K, Travis ER, Borges R, Wightman RM (1996) Exocytotic release from individual granules exhibits similar properties at mast and chromaffin cells. Biophys J 71: Pothos E, Desmond M, Sulzer D (1996) L-3,4-dihydroxyphenylalanine increases the quantal size of exocytotic dopamine release in vitro. J Neurochem 66:
196 Pothos EN, Davila V, Sulzer D (1998) Presynaptic recording of quanta from midbrain dopamine neurons and modulation of the quantal size. J Neurosci 18: Pothos EN, Przedborski S, Davila V, Schmitz Y, Sulzer D (1998) D2-Like dopamine autoreceptor activation reduces quantal size in PC12 cells. J Neurosci 18: Sombers LA, Maxson MM, Wittenberg NJ, Ewing AG (Submitted September 2004) Secretion via the Fusion Pore in PC12 Cells: Mechanism of Regulation in High Osmolarity Solutions. J Neurochem. Sombers LA, Hanchar HJ, Colliver TL, Wittenberg N, Cans A, Arbault S, Amatore C, Ewing AG (2004) The effects of vesicular volume on secretion through the fusion pore in exocytotic release from PC12 cells. J Neurosci 24: Troyer KP, Wightman RM (2002) Temporal separation of vesicle release from vesicle fusion during exocytosis. J Biol Chem 277: Van der Kloot W (1987) Pretreatment with hypertonic solutions increases quantal size at the frog neuromuscular junction. J Neurophysiol 57: Videen JS, Mezger MS, Chang YM, O'Connor DT (1992) Calcium and catecholamine interactions with adrenal chromogranins. Comparison of driving forces in binding and aggregation. J Biol Chem 267: Wightman RM, Schroeder TJ, Finnegan JM, Ciolkowski EL, Pihel K (1995) Time course of release of catecholamines from individual vesicles during exocytosis at adrenal medullary cells. Biophys J 68: Wightman RM, Jankowski JA, Kennedy RT, Kawagoe KT, Schroeder TJ, Leszczyszyn DJ, Near JA, Diliberto EJ, Jr., Viveros OH (1991) Temporally resolved catecholamine spikes correspond to single vesicle release from individual chromaffin cells. Proc Natl Acad Sci U S A 88: Yoo SH, Albanesi JP (1991) High capacity, low affinity Ca2+ binding of chromogranin A. Relationship between the ph-induced conformational change and Ca2+ binding property. J Biol Chem 266: Zimmerberg J, Curran M, Cohen FS, Brodwick M (1987) Simultaneous electrical and optical measurements show that membrane fusion precedes secretory granule swelling during exocytosis of beige mouse mast cells. Proc Natl Acad Sci U S A 84:
197 180 CHAPTER 8 MULTICORE VESICLES: HYPEROSMOLARITY AND L-DOPA INDUCE FUSION OF VESICLES WITH EACH OTHER 1. Introduction Previously, the Ewing Lab has shown that the size of vesicles in PC12 cells can be altered pharmacologically with L-DOPA, and that secretion is correspondingly altered (Colliver et al., 2000). The dopamine precursor L-DOPA is taken up by the vesicular monoamine transporter (VMAT) and converted to dopamine, leading to larger quantal release per vesicle (Pothos et al., 1996). Quantal size can be manipulated by other means, such as activation of second messenger systems, autoreceptors, or the use of VMAT inhibitors (Pothos, 2002), and these manipulations have the potential to influence synaptic plasticity. Based on predictions that receptors in synapses are generally not saturated by the contents released by a single vesicle, modulation of quantal size can affect the strength of synapses (Choi et al., 2003). Indeed, induction of LTP at hippocampal synapses leads to an increase in the peak glutamate concentration in the cleft (Choi et al., 2003). Thus quantal size is plastic, and understanding parameters that affect the amount of neurotransmitter stored in each vesicle may be helpful in understanding how quantal size is modulated by cells in vivo. Electron microscopy (EM) images of secretory cells show that the pool of secretory vesicles within a cell consists solely of vesicles with exactly one electron-dense core per vesicle. However, under the unusual circumstances described in this report, hyperosmotic conditions appear to increase the frequency of premature fusion of large dense-core vesicles (LDCVs). Moreover, incubation with L-DOPA augments this effect. As both changes in osmolarity and vesicle swelling with L-DOPA disrupt cell and vesicular membranes, these treatments, although
198 181 not physiological, provide insights into the vesicle maturation and sequesteration process. One noteworthy observation is that these multicore vesicles can probably join the readily releasable pool, as the quantal size distrubtion of peaks detected by amperometry from treated cells contains a bimodal distribution similar to the fraction of vesicles that contain multiple cores observed with EM. However, these multicore vesicles are probably not generated by recapture of multiple dense cores during endocytosis, as none of the multicore vesicles colocalized with a label for endocytosed vesicles. 2. Methods PC12 cells were maintained in RPMI-1640 media supplemented with 10% equine serum, 5% fetal bovine serum, and 100 units/ml penn/strep at 37ºC, 7% CO 2. Flasks (Collagen IV coated) were subcultured every 7-9 days, or when confluency was reached (Kozminski et al., 1998). Effects of osmolarity were tested with a 10 min incubation in either isotonic (335 mosm), hypertonic (700 mosm), or very hypertonic (955 mosm) saline (5 mm KCl, 10 mm HEPES, 5 mm glucose, 2 mm CaCl 2, 1.2 mm MgCl 2, and 150/332/460 mm NaCl, depending on desired osmolarity, adjusted to ph 7.4 with NaOH), followed by 60 min in isotonic saline. In some experiments, the saline used after hyperosmotic treatment included 100 µm L-DOPA, mg/ml cationized ferritin (Sigma-Aldrich Chemical Company, St. Louis, MO), or both reagents. The cationized ferritin binds to anionic sites on the plasma membrane (Danon et al., 1972) and is internalized during endocytosis, leaving detectable puncta in electron micrographs (Farquhar, 1978; Thyberg, 1980; Van Deurs et al., 1981; Storrie et al., 1984; Dvorak et al., 1985; Livne and Oliver, 1986; Burdett, 1993). Next, cells were rinsed 10 min in saline of an osmolarity
199 182 corresponding to the first incubation condition, detached from the substrate, pelleted, fixed with ice-cold Karnovsky s recipe (Karnovsky, 1965), and prepared for electron microscopy by conventional methods (Colliver et al., 2000). Pellets were viewed on a transmission electron microscope (1200EXII; JEOL, Peabody, MA) at 80 kv and imaged with a high-resolution camera (F224, Tietz, Gauting, Germany). Vesicle diameters were counted with Image-Pro Plus (Version 4.1, Media Cybernetics, Inc., Silver Springs, MD). Only vesicles in which a dense core could be clearly identified were measured. Vesicular diameters were measured from electron micrographs and corrected for the sampling bias inherent in random transections of vesicles (Aherne and Dunnill, 1982) Typically, the apparent mean underestimates the true mean because the plane of section rarely bisects a vesicle at the equator. Corrections were performed using the methods of DeHoff, Geiger, and Riedwyl that assume vesicle sizes vary and that the distribution is normal. As a result, reported vesicular volumes should reflect reasonably close estimates based on second order correction terms that take into account the full range of vesicle diameters. See Appendix I for details. Constant potential amperometry was performed using a 5 µm carbon fiber beveled at 45º and applying a +700mV holding current to oxidize released catecholamine, placed on the surface of a cell. Data were viewed in real time while filtering at 2 khz (Axon 200B) and digitizing at 5 khz without subsequent filtering. Peaks were detected using the MiniAnalysis algorithm ( with a threshold of five times the RMS noise of a stable, 2-second portion of baseline recorded prior to each experiment. Detected peaks were later inspected manually to remove noise (e.g. peaks with almost no area under the curve, and with rise slopes and aplitudes that were 10 to 100 times greater than all other peaks). Quantal sizes were
200 183 calculated from peak areas by Faraday s Law (Q = nnf) and a cube-root transformation was used to correct for the skewed distribution of peak areas. Data sets were tested for significant differences using the t-test and deviation from a normal distribution was tested using the Kolmogorov-Smirnov test (SigmaPlot, Version 7.00 and SPSS Version 10.1, SPSS, Inc.). Results for all tests were considered significant if p < All values are reported as the mean ± SEM. 3. Results A substantial portion of vesicles contained multiple cores when the osmolarity was increased (Table 8.1). No multicore vesicles were found in control cells incubated in isotonic (335 mosm) saline (data not shown), but 3.5% and 8.6% of vesicles had multiple cores at 700 mosm and 965 mosm, respectively (Figure 8.1 a). Addition of 100 µm L-DOPA to the 700 mosm hypertonic saline increased the percentage of multicore vesicles from 3.5% to 15.3% (p < 0.05; Figure 8.1 b), whereas the same treatment increased the portion of multicore vesicles under isotonic conditions to a modest 0.3%. Vesicular volume increased by 292 % to 6.0 ± 2.0 al for multicore vesicles from cells incubated in 700 mosm saline compared to 2.1 ± 0.2 al for single-cored vesicles in the same cells (p < 0.05). In cells treated with hypertonic saline (700 mosm) and L-DOPA, vesicular volume increased by 237% to 14.0 ± 2 al for the multicore vesicles versus 5.9 ± 0.9 al for single-cores (p < 0.05).
201 184 Table 8.1: Percent of multicores increases with high osmolarity and L-DOPA treatment. Osmolarity Multicore Vesicles (%) (mosm) No L-DOPA L-DOPA In order to ascertain whether multicore vesicles reflected a population of recyled protein cores captured during endocytosis or the product of vesicles fusing with each other independent of exocytosis, I employed a marker for endocytosis. Incubation with 500 µg/ml cationized ferritin produced optimal endocytic labeling of LDCVs in iso-osmotic control cells (Figure 8.1 c). However, in hypertonic saline, endocytosed particles were only observed when the concentration of cationized ferritin was 50 µg/ml (Figure 8.1 d; unsuccessful experiments employed a range of µg/ml). At higher concentrations, the ferritin label usually formed large extracellular clumps and did not evenly distribute on the plasma membrane in hypertonic saline. Unexpectedly, incorporating ferritin into the isotonic saline increased the percentage of multiple dense cored vesicles observed (from 0% to 1.4%).
202 Figure 8.1. A portion of dense core vesicles in PC12 cells exhibits multiple cores. Two examples of each treatment are provided. (a) Cells bathed in hyperosmotic (700 mosm) saline. (b) Cells bathed in hyperosmotic saline and loaded with L-DOPA. (c) Control cells labeled with ferritin. (d) Hyperosmotic, L-DOPA-treated cells labeled with ferritin. Arrows with stems indicate examples of multicore vesicles. Arrowheads indicate vesicles that incorporated the ferritin label (about 11% of cells). Images were collected from 10 to 12 cells per condition, with similar results. The data in this figure were obtained in collaboration with Leslie Sombers. 185
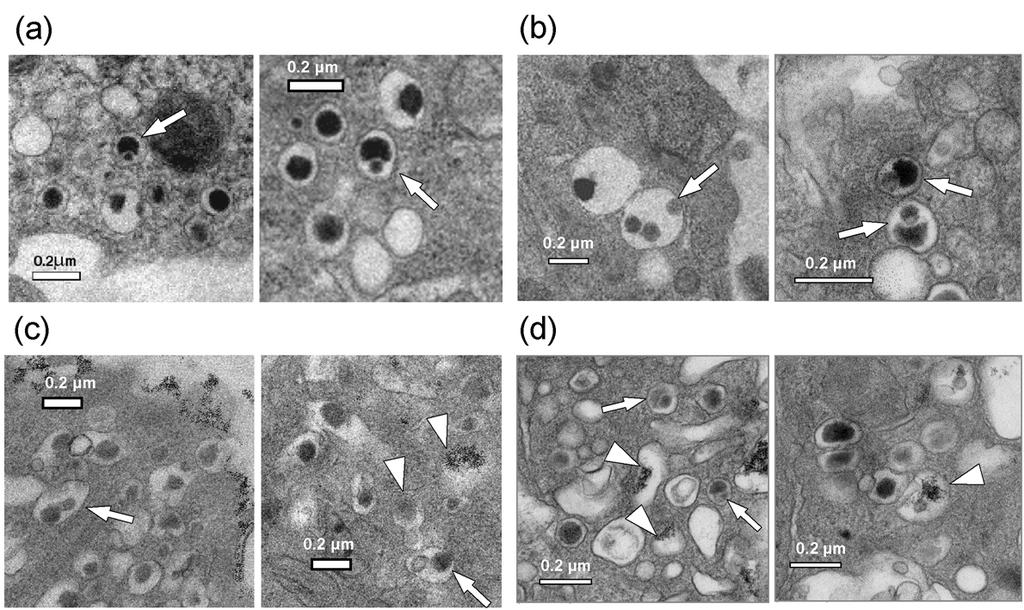
203 186
Differing mechanisms of exocytosis for large dense core vesicles in chromaffin cells and small synaptic vesicles in dopamine neurons.
 Differing mechanisms of exocytosis for large dense core vesicles in chromaffin cells and small synaptic vesicles in dopamine neurons. Roland G.W. Staal a, Eugene Mosharov a, Anthonia Hananiya a and David
Neurotransmitter Systems I Identification and Distribution. Reading: BCP Chapter 6
 Neurotransmitter Systems I Identification and Distribution Reading: BCP Chapter 6 Neurotransmitter Systems Normal function of the human brain requires an orderly set of chemical reactions. Some of the
Dania Ahmad. Tamer Barakat + Dania Ahmad. Faisal I. Mohammed
 16 Dania Ahmad Tamer Barakat + Dania Ahmad Faisal I. Mohammed Revision: What are the basic types of neurons? sensory (afferent), motor (efferent) and interneuron (equaled association neurons). We classified
Chapter 3 Neurotransmitter release
 NEUROPHYSIOLOGIE CELLULAIRE CONSTANCE HAMMOND Chapter 3 Neurotransmitter release In chapter 3, we proose 3 videos: Observation Calcium Channel, Ca 2+ Unitary and Total Currents Ca 2+ and Neurotransmitter
Portions from Chapter 6 CHAPTER 7. The Nervous System: Neurons and Synapses. Chapter 7 Outline. and Supporting Cells
 CHAPTER 7 The Nervous System: Neurons and Synapses Chapter 7 Outline Neurons and Supporting Cells Activity in Axons The Synapse Acetylcholine as a Neurotransmitter Monoamines as Neurotransmitters Other
NEURONS COMMUNICATE WITH OTHER CELLS AT SYNAPSES 34.3
 NEURONS COMMUNICATE WITH OTHER CELLS AT SYNAPSES 34.3 NEURONS COMMUNICATE WITH OTHER CELLS AT SYNAPSES Neurons communicate with other neurons or target cells at synapses. Chemical synapse: a very narrow
Chapter 11 Introduction to the Nervous System and Nervous Tissue Chapter Outline
 Chapter 11 Introduction to the Nervous System and Nervous Tissue Chapter Outline Module 11.1 Overview of the Nervous System (Figures 11.1-11.3) A. The nervous system controls our perception and experience
Chapter 2: Cellular Mechanisms and Cognition
 Chapter 2: Cellular Mechanisms and Cognition MULTIPLE CHOICE 1. Two principles about neurons were defined by Ramón y Cajal. The principle of connectional specificity states that, whereas the principle
Ch. 45 Continues (Have You Read Ch. 45 yet?) u Central Nervous System Synapses - Synaptic functions of neurons - Information transmission via nerve
 u Central Nervous System Synapses - Synaptic functions of neurons - Information transmission via nerve") Ch. 45 Continues (Have You Read Ch. 45 yet?) u Central Nervous System Synapses - Synaptic functions of neurons - Information transmission via nerve impulses - Impulse may be blocked in its transmission
Ch. 45 Continues (Have You Read Ch. 45 yet?) u Central Nervous System Synapses - Synaptic functions of neurons - Information transmission via nerve impulses - Impulse may be blocked in its transmission
Chapter 3 subtitles Action potentials
 CELLULAR NEUROPHYSIOLOGY CONSTANCE HAMMOND Chapter 3 subtitles Action potentials Introduction (3:15) This third chapter explains the calcium current triggered by the arrival of the action potential in
STEIN IN-TERM EXAM -- BIOLOGY FEBRUARY 16, PAGE
 STEIN IN-TERM EXAM -- BIOLOGY 3058 -- FEBRUARY 16, 2017 -- PAGE 1 of 9 There are 25 questions in this Biology 3058 exam. All questions are "A, B, C, D, E, F, G, H" questions worth one point each. There
Section: Chapter 5: Multiple Choice. 1. The structure of synapses is best viewed with a(n):
:") Section: Chapter 5: Multiple Choice 1. The structure of synapses is best viewed with a(n): p.155 electron microscope. light microscope. confocal microscope. nissle-stained microscopic procedure. 2. Electron
Section: Chapter 5: Multiple Choice 1. The structure of synapses is best viewed with a(n): p.155 electron microscope. light microscope. confocal microscope. nissle-stained microscopic procedure. 2. Electron
Sample Lab Report 1 from 1. Measuring and Manipulating Passive Membrane Properties
 Sample Lab Report 1 from http://www.bio365l.net 1 Abstract Measuring and Manipulating Passive Membrane Properties Biological membranes exhibit the properties of capacitance and resistance, which allow
- Neurotransmitters Of The Brain -
 - Neurotransmitters Of The Brain - INTRODUCTION Synapsis: a specialized connection between two neurons that permits the transmission of signals in a one-way fashion (presynaptic postsynaptic). Types of
Autonomic Nervous System. Lanny Shulman, O.D., Ph.D. University of Houston College of Optometry
 Autonomic Nervous System Lanny Shulman, O.D., Ph.D. University of Houston College of Optometry Peripheral Nervous System A. Sensory Somatic Nervous System B. Autonomic Nervous System 1. Sympathetic Nervous
Neurotransmitters acting on G-protein coupled receptors
 Neurotransmitters acting on G-protein coupled receptors Part 1: Dopamine and Norepinephrine BIOGENIC AMINES Monoamines Diamine Overview of Neurotransmitters and Their Receptors Criteria for defining a
Drugs, Drug Targets and You: Patch Clamping
 Drugs, Drug Targets and You: Patch Clamping Introduction To elucidate how an ion channel operates, one needs to examine the factors that influence its opening and closing as well as measure the resulting
Cocaine and Dopamine. Script for the Virtual Cocaine Lab Tutorial. Page 1. Introduction
 Page 1 Script for the Virtual Cocaine Lab Tutorial Cocaine and Dopamine http://www.mind.ilstu.edu Introduction This tutorial is for The Virtual Neuroscience Lab #1: Cocaine Study, a free virtual lab available
Nervous System. Nervous system cells. Transmission of a signal 2/27/2015. Neuron
 Nervous System 2007-2008 signal direction Neuron a nerve cell Nervous system cells dendrites axon cell body Structure fits function many entry points for signal one path out transmits signal signal direction
Chapter 17. Nervous System Nervous systems receive sensory input, interpret it, and send out appropriate commands. !
 Chapter 17 Sensory receptor Sensory input Integration Nervous System Motor output Brain and spinal cord Effector cells Peripheral nervous system (PNS) Central nervous system (CNS) 28.1 Nervous systems
Neurochemistry 2. Loewi s experiment
 Neurochemistry 2 Loewi s experiment Cengage Learning 2016 AP reaches the axon terminal and activates voltage-gated Ca++ channels (3 major classes). Ca++ influx results in exocytosis of neurotransmitters
Chapter 2. The Cellular and Molecular Basis of Cognition Cognitive Neuroscience: The Biology of the Mind, 2 nd Ed.,
 Chapter 2. The Cellular and Molecular Basis of Cognition Cognitive Neuroscience: The Biology of the Mind, 2 nd Ed., M. S. Gazzaniga, R. B. Ivry, and G. R. Mangun, Norton, 2002. Summarized by B.-W. Ku,
Neurotransmitter Systems III Neurochemistry. Reading: BCP Chapter 6
 Neurotransmitter Systems III Neurochemistry Reading: BCP Chapter 6 Neurotransmitter Systems Normal function of the human brain requires an orderly set of chemical reactions. Some of the most important
Na + K + pump. The beauty of the Na + K + pump. Cotransport. The setup Cotransport the result. Found along the plasma membrane of all cells.
 The beauty of the Na + K + pump Na + K + pump Found along the plasma membrane of all cells. Establishes gradients, controls osmotic effects, allows for cotransport Nerve cells have a Na + K + pump and
QUIZ/TEST REVIEW NOTES SECTION 7 NEUROPHYSIOLOGY [THE SYNAPSE AND PHARMACOLOGY]
![QUIZ/TEST REVIEW NOTES SECTION 7 NEUROPHYSIOLOGY [THE SYNAPSE AND PHARMACOLOGY]](/thumbs/86/94924826.jpg "QUIZ/TEST REVIEW NOTES SECTION 7 NEUROPHYSIOLOGY [THE SYNAPSE AND PHARMACOLOGY]") QUIZ/TEST REVIEW NOTES SECTION 7 NEUROPHYSIOLOGY [THE SYNAPSE AND PHARMACOLOGY] Learning Objectives: Explain how neurons communicate stimulus intensity Explain how action potentials are conducted along
QUIZ/TEST REVIEW NOTES SECTION 7 NEUROPHYSIOLOGY [THE SYNAPSE AND PHARMACOLOGY] Learning Objectives: Explain how neurons communicate stimulus intensity Explain how action potentials are conducted along
Neurons: Structure and communication
 Neurons: Structure and communication http://faculty.washington.edu/chudler/gall1.html Common Components of a Neuron Dendrites Input, receives neurotransmitters Soma Processing, decision Axon Transmits
Division Ave. High School AP Biology. cell body. signal direction
 signal direction Nervous system cells Neuron a nerve cell dendrites myelin sheath axon cell body dendrite cell body axon Structure fits function many entry points for signal one path out transmits signal
Axon Nerve impulse. Axoplasm Receptor. Axomembrane Stimuli. Schwann cell Effector. Myelin Cell body
 Nervous System Review 1. Explain a reflex arc. 2. Know the structure, function and location of a sensory neuron, interneuron, and motor neuron 3. What is (a) Neuron Axon Nerve impulse Axoplasm Receptor
The Nervous System. Nervous System Functions 1. gather sensory input 2. integration- process and interpret sensory input 3. cause motor output
 The Nervous System Nervous System Functions 1. gather sensory input 2. integration- process and interpret sensory input 3. cause motor output The Nervous System 2 Parts of the Nervous System 1. central
Communication Between
 Communication Between Neurons Bởi: OpenStaxCollege The electrical changes taking place within a neuron, as described in the previous section, are similar to a light switch being turned on. A stimulus starts
Homeostasis. Endocrine System Nervous System
 Homeostasis Endocrine System Nervous System 2004-2005 Regulation Why are hormones needed? chemical messages from one body part to another communication needed to coordinate whole body homeostasis & regulation
Psych 181: Dr. Anagnostaras
 Psych 181: Dr. Anagnostaras Lecture 5 Synaptic Transmission Introduction to synaptic transmission Synapses (Gk., to clasp or join) Site of action of most psychoactive drugs 6.5 1 Synapses Know basic terminology:
Introduction to Neurobiology
 Biology 240 General Zoology Introduction to Neurobiology Nervous System functions: communication of information via nerve signals integration and processing of information control of physiological and
Mohammad Tarek. Wahab Al-tekreeti Tamer Barakat. Faisal Mohammad
 15 Mohammad Tarek Wahab Al-tekreeti Tamer Barakat Faisal Mohammad Things to remember Types of synapse: Neuron types and neurotransmitters When it happens between an axon and dendrites it is called axodendritic
7.06 Spring of PROBLEM SET #6
 7.6 Spring 23 1 of 6 7.6 PROBLEM SET #6 1. You are studying a mouse model of hypercholesterolemia, a disease characterized by high levels of cholesterol in the blood. In normal cells, LDL particles in
Synaptic Transmission: Ionic and Metabotropic
 Synaptic Transmission: Ionic and Metabotropic D. Purves et al. Neuroscience (Sinauer Assoc.) Chapters 5, 6, 7. C. Koch. Biophysics of Computation (Oxford) Chapter 4. J.G. Nicholls et al. From Neuron to
BIPN100 F15 Human Physiology 1 Lecture 3. Synaptic Transmission p. 1
 BIPN100 F15 Human Physiology 1 Lecture 3. Synaptic Transmission p. 1 Terms you should know: synapse, neuromuscular junction (NMJ), pre-synaptic, post-synaptic, synaptic cleft, acetylcholine (ACh), acetylcholine
NERVOUS SYSTEM 1 CHAPTER 10 BIO 211: ANATOMY & PHYSIOLOGY I
 BIO 211: ANATOMY & PHYSIOLOGY I 1 Ch 10 A Ch 10 B This set CHAPTER 10 NERVOUS SYSTEM 1 BASIC STRUCTURE and FUNCTION Dr. Lawrence G. Altman www.lawrencegaltman.com Some illustrations are courtesy of McGraw-Hill.
BIPN140 Lecture 8: Synaptic Transmission II
 BIPN140 Lecture 8: Synaptic Transmission II 1. Postsynaptic Receptors: Metabotropic & Ionotropic 2. Postsynaptic Responses (Postsynaptic Potentials, PSPs) 3. Neurotransmitters Su (FA16) Chemical Synapse:
Ameen Alsaras. Ameen Alsaras. Mohd.Khatatbeh
 9 Ameen Alsaras Ameen Alsaras Mohd.Khatatbeh Nerve Cells (Neurons) *Remember: The neural cell consists of: 1-Cell body 2-Dendrites 3-Axon which ends as axon terminals. The conduction of impulse through
Summarized by B.-W. Ku, E. S. Lee, and B.-T. Zhang Biointelligence Laboratory, Seoul National University.
 Chapter 2. The Cellular l and Molecular Basis of Cognition Cognitive Neuroscience: The Biology of the Mind, 3 rd Ed., M. S. Gazzaniga, R. B. Ivry, and G. R. Mangun, Norton, 2008. Summarized by B.-W. Ku,
Neuron types and Neurotransmitters
 Neuron types and Neurotransmitters Faisal I. Mohammed. PhD, MD University of Jordan 1 Transmission of Receptor Information to the Brain the larger the nerve fiber diameter the faster the rate of transmission
Synaptic transmission
 Outline Synaptic transmission Sompol Tapechum M.D., Ph.D. Department of Physiology Faculty of Medicine Siriraj Hospital, Bangkok, Thailand. sisth@mahidol.ac.th 2 Structure of synapse Modes of synaptic
Omar Ismail. Dana Almanzalji. Faisal Mohammad
 11 Omar Ismail Dana Almanzalji Faisal Mohammad Neuronal classification: Neurons are responsible for transmitting the action potential to the brain. The speed at which the action potential is transmitted
MOLECULAR AND CELLULAR NEUROSCIENCE
 MOLECULAR AND CELLULAR NEUROSCIENCE BMP-218 November 4, 2014 DIVISIONS OF THE NERVOUS SYSTEM The nervous system is composed of two primary divisions: 1. CNS - Central Nervous System (Brain + Spinal Cord)
Neurophysiology of Nerve Impulses
 M52_MARI0000_00_SE_EX03.qxd 8/22/11 2:47 PM Page 358 3 E X E R C I S E Neurophysiology of Nerve Impulses Advance Preparation/Comments Consider doing a short introductory presentation with the following
Neural Communication. Central Nervous System Peripheral Nervous System. Communication in the Nervous System. 4 Common Components of a Neuron
 Neural Communication Overview of CNS / PNS Electrical Signaling Chemical Signaling Central Nervous System Peripheral Nervous System Somatic = sensory & motor Autonomic = arousal state Parasympathetic =
Applied Neuroscience. Conclusion of Science Honors Program Spring 2017
 Applied Neuroscience Conclusion of Science Honors Program Spring 2017 Review Circle whichever is greater, A or B. If A = B, circle both: I. A. permeability of a neuronal membrane to Na + during the rise
SYNAPTIC COMMUNICATION
 BASICS OF NEUROBIOLOGY SYNAPTIC COMMUNICATION ZSOLT LIPOSITS 1 NERVE ENDINGS II. Interneuronal communication 2 INTERNEURONAL COMMUNICATION I. ELECTRONIC SYNAPSE GAP JUNCTION II. CHEMICAL SYNAPSE SYNAPSES
Chapter 2. The Cellular and Molecular Basis of Cognition
 Chapter 2. The Cellular and Molecular Basis of Cognition Cognitive Neuroscience: The Biology of the Mind, 2 nd Ed., M. S. Gazzaniga,, R. B. Ivry,, and G. R. Mangun,, Norton, 2002. Summarized by B.-W. Ku,
Chapter 45: Synapses Transmission of Nerve Impulses Between Neurons. Chad Smurthwaite & Jordan Shellmire
 Chapter 45: Synapses Transmission of Nerve Impulses Between Neurons Chad Smurthwaite & Jordan Shellmire The Chemical Synapse The most common type of synapse used for signal transmission in the central
By the name of Allah
 By the name of Allah Receptors function and signal transduction ( Hormones and receptors Types) We were talking about receptors of the neurotransmitters; we have 2 types of receptors: 1- Ionotropic receptors
Lecture 22: A little Neurobiology
 BIO 5099: Molecular Biology for Computer Scientists (et al) Lecture 22: A little Neurobiology http://compbio.uchsc.edu/hunter/bio5099 Larry.Hunter@uchsc.edu Nervous system development Part of the ectoderm
Review of Neurochemistry What are neurotransmitters?
 Review of Neurochemistry What are neurotransmitters? In molecular terms, neurotransmitters are molecules that ( ) and of neurons by, for example, increasing or decreasing enzymatic activity or altering
The mammalian cochlea possesses two classes of afferent neurons and two classes of efferent neurons.
 1 2 The mammalian cochlea possesses two classes of afferent neurons and two classes of efferent neurons. Type I afferents contact single inner hair cells to provide acoustic analysis as we know it. Type
STEIN IN-TERM EXAM -- BIOLOGY FEBRUARY 15, PAGE
 STEIN IN-TERM EXAM -- BIOLOGY 3058 -- FEBRUARY 15, 2018 -- PAGE 1 of 8 There are 25 questions in this Biology 3058 exam. All questions are "A, B, C, D, E, F, G, H" questions worth one point each. There
What effect would an AChE inhibitor have at the neuromuscular junction?
 CASE 4 A 32-year-old woman presents to her primary care physician s office with difficulty chewing food. She states that when she eats certain foods that require a significant amount of chewing (meat),
Skeletal Muscle Contraction 4/11/2018 Dr. Hiwa Shafiq
 Skeletal Muscle Contraction 4/11/2018 Dr. Hiwa Shafiq Skeletal Muscle Fiber About 40 per cent of the body is skeletal muscle, and 10 per cent is smooth and cardiac muscle. Skeletal muscles are composed
Fundamentals of the Nervous System and Nervous Tissue: Part C
 PowerPoint Lecture Slides prepared by Janice Meeking, Mount Royal College C H A P T E R 11 Fundamentals of the Nervous System and Nervous Tissue: Part C Warm Up What is a neurotransmitter? What is the
3) Most of the organelles in a neuron are located in the A) dendritic region. B) axon hillock. C) axon. D) cell body. E) axon terminals.
 Most of the organelles in a neuron are located in the A) dendritic region. B) axon hillock. C) axon. D) cell body. E) axon terminals.") Chapter 48 Neurons, Synapses, and Signaling Multiple-Choice Questions 1) A simple nervous system A) must include chemical senses, mechanoreception, and vision. B) includes a minimum of 12 ganglia. C) has
Chapter 48 Neurons, Synapses, and Signaling Multiple-Choice Questions 1) A simple nervous system A) must include chemical senses, mechanoreception, and vision. B) includes a minimum of 12 ganglia. C) has
ANATOMY & PHYSIOLOGY - CLUTCH CH. 6 - CELL COMMUNICATION.
 !! www.clutchprep.com CONCEPT: CELL-TO-CELL CONNECTIONS AND SIGNALING Gap and Tight Junctions: Adjacent cells communicate and hold on to each other via junctions. Two important kinds: Gap Junctions are
Lipids and Membranes
 Lipids and Membranes Presented by Dr. Mohammad Saadeh The requirements for the Pharmaceutical Biochemistry I Philadelphia University Faculty of pharmacy Membrane transport D. Endocytosis and Exocytosis
Neurobiology: The nerve cell. Principle and task To use a nerve function model to study the following aspects of a nerve cell:
 Principle and task To use a nerve function model to study the following aspects of a nerve cell: INTRACELLULAR POTENTIAL AND ACTION POTENTIAL Comparison between low and high threshold levels Comparison
Chapter 4 Neuronal Physiology
 Chapter 4 Neuronal Physiology V edit. Pg. 99-131 VI edit. Pg. 85-113 VII edit. Pg. 87-113 Input Zone Dendrites and Cell body Nucleus Trigger Zone Axon hillock Conducting Zone Axon (may be from 1mm to more
Neurons, Synapses, and Signaling
 Overview: Lines of Communication Chapter 8 Neurons, Synapses, and Signaling Fig. 8- The cone snail kills prey with venom that disables neurons Neurons are nerve s that transfer information within the body
Notes: Synapse. Overview. PSYC Summer Professor Claffey PDF. Conversion from an signal to a signal - electrical signal is the
 PSYC 170 - Summer 2013 - Professor Claffey Notes: Synapse PDF Overview Conversion from an signal to a signal - electrical signal is the - chemical signal is the Presynaptic - refers to that sends/receives
Biol 219 Lec 12 Fall 2016
 Cell-to-Cell: Neurons Communicate at Synapses Electrical synapses pass electrical signals through gap junctions Signal can be bi-directional Synchronizes the activity of a network of cells Primarily in
Warm-up. Warm-up. Warm-up. Chapter 48. Why do animals need a nervous system? 3/9/2012. Nervous System
 Warm-up Objective: Explain how membrane potentials arise from differences in ion concentrations between cells' content and the extracellular fluid. Warm-up: Cells from this structure migrate to other parts
To understand AD, it is important to
 To understand AD, it is important to know a bit about the brain. This part of Unraveling the Mystery gives an inside view of the normal brain, how it works, and what happens during aging. The brain is
Cogs 107b Systems Neuroscience lec9_ neuromodulators and drugs of abuse principle of the week: functional anatomy
 Cogs 107b Systems Neuroscience www.dnitz.com lec9_02042010 neuromodulators and drugs of abuse principle of the week: functional anatomy Professor Nitz circa 1986 neurotransmitters: mediating information
LESSON 3.2 WORKBOOK How do our neurons communicate with each other?
 LESSON 3.2 WORKBOOK How do our neurons communicate with each other? This lesson introduces you to how one neuron communicates with another neuron during the process of synaptic transmission. In this lesson
Notes are online at The Neuron
 Notes are online at http://cogsci.ucsd.edu/~clovett/neuronotescogs17.pdf A. What is a neuron? The Neuron 1. A neuron is a type of cell that receives and transmits information in the Central Nervous System
Skeletal Muscle Contraction 5/11/2017 Dr. Hiwa Shafiq
 Skeletal Muscle Contraction 5/11/2017 Dr. Hiwa Shafiq Skeletal Muscle Fiber About 40 per cent of the body is skeletal muscle, and 10 per cent is smooth and cardiac muscle. Skeletal muscles are composed
Chapter 11: Functional Organization of Nervous Tissue
 Chapter 11: Functional Organization of Nervous Tissue I. Functions of the Nervous System A. List and describe the five major nervous system functions: 1. 2. 3. 4. 5. II. Divisions of the Nervous System
SUPPLEMENTARY INFORMATION
 Supplementary Figure 1. Normal AMPAR-mediated fepsp input-output curve in CA3-Psen cdko mice. Input-output curves, which are plotted initial slopes of the evoked fepsp as function of the amplitude of the
9/28/2016. Neuron. Multipolar Neuron. Astrocytes Exchange Materials With Neurons. Glia or Glial Cells ( supporting cells of the nervous system)
") Neuron Multipolar Neuron https://www.youtube.com/watch?v=lw-psbnu5xago to :38 Glia or Glial Cells ( supporting cells of the nervous system) 10X more numerous than neurons but one-tenth the size make up
Neuron Multipolar Neuron https://www.youtube.com/watch?v=lw-psbnu5xago to :38 Glia or Glial Cells ( supporting cells of the nervous system) 10X more numerous than neurons but one-tenth the size make up
How we study the brain: a survey of methods used in neuroscience
 How we study the brain: a survey of methods used in neuroscience Preparing living neurons for recording Large identifiable neurons in a leech Rohon-Beard neurons in a frog spinal cord Living slice of a
Chapter 5 subtitles GABAergic synaptic transmission
 CELLULAR NEUROPHYSIOLOGY CONSTANCE HAMMOND Chapter 5 subtitles GABAergic synaptic transmission INTRODUCTION (2:57) In this fifth chapter, you will learn how the binding of the GABA neurotransmitter to
Exam 2 PSYC Fall (2 points) Match a brain structure that is located closest to the following portions of the ventricular system
 Match a brain structure that is located closest to the following portions of the ventricular system") Exam 2 PSYC 2022 Fall 1998 (2 points) What 2 nuclei are collectively called the striatum? (2 points) Match a brain structure that is located closest to the following portions of the ventricular system
Exam 2 PSYC 2022 Fall 1998 (2 points) What 2 nuclei are collectively called the striatum? (2 points) Match a brain structure that is located closest to the following portions of the ventricular system
Communication within a Neuron
 Neuronal Communication, Ph.D. Communication within a Neuron Measuring Electrical Potentials of Axons The Membrane Potential The Action Potential Conduction of the Action Potential 1 The withdrawal reflex
Supplementary Information
 Hyperpolarization-activated cation channels inhibit EPSPs by interactions with M-type K + channels Meena S. George, L.F. Abbott, Steven A. Siegelbaum Supplementary Information Part 1: Supplementary Figures
THE NERVOUS SYSTEM. Neurons & Impulses
 THE NERVOUS SYSTEM Neurons & Impulses Organization of the Nervous System: Two Major Portions: The central nervous system (CNS) and the peripheral nervous system (PNS). CNS = Brain/Spinal Cord PNS = Nerves-provide
NS200: In vitro electrophysiology section September 11th, 2013
 NS200: In vitro electrophysiology section September 11th, 2013 Quynh Anh Nguyen, 4 th Year Nicoll Lab quynhanh.nguyen@ucsf.edu N276 Genentech Hall, Mission Bay Outline Part I: Theory Review of circuit
Problem Set 3 - Answers. -70mV TBOA
 Harvard-MIT Division of Health Sciences and Technology HST.131: Introduction to Neuroscience Course Director: Dr. David Corey HST 131/ Neuro 200 18 September 05 Explanation in text below graphs. Problem
Synaptic Communication. Steven McLoon Department of Neuroscience University of Minnesota
 Synaptic Communication Steven McLoon Department of Neuroscience University of Minnesota 1 Course News The first exam is next week on Friday! Be sure to checkout the sample exam on the course website. 2
Lecture 14. Insect nerve system (II)
") Lecture 14. Insect nerve system (II) Structures (Anatomy) Cells Anatomy How NS functions Signal transduction Signal transmission Overview More on neurons: ions, ion channel, ligand receptor Signal transduction:
Lecture 14. Insect nerve system (II) Structures (Anatomy) Cells Anatomy How NS functions Signal transduction Signal transmission Overview More on neurons: ions, ion channel, ligand receptor Signal transduction:
BIOLOGICAL PROCESSES
 BIOLOGICAL PROCESSES CHAPTER 3 1 LEARNING GOALS Discuss how the nervous system communicates internally. Describe the structure and function of neurons Describe how the neuron transmits information Describe
Book 3: Lab Procedures Book 3: Ch. 1: The Hypothesis and Overview
 Book 3: Lab Procedures Book 3: Ch. 1: The Hypothesis and Overview 13 Introduction This experiment will investigate how cocaine acts on dopamine neurons in the brain. Cocaine is a drug of abuse that increases
Organization of the nervous system. [See Fig. 48.1]
![Organization of the nervous system. [See Fig. 48.1]](/thumbs/90/103926552.jpg "Organization of the nervous system. [See Fig. 48.1]") Nervous System [Note: This is the text version of this lecture file. To make the lecture notes downloadable over a slow connection (e.g. modem) the figures have been replaced with figure numbers as found
Nervous System [Note: This is the text version of this lecture file. To make the lecture notes downloadable over a slow connection (e.g. modem) the figures have been replaced with figure numbers as found
QUIZ YOURSELF COLOSSAL NEURON ACTIVITY
 QUIZ YOURSELF What are the factors that produce the resting potential? How is an action potential initiated and what is the subsequent flow of ions during the action potential? 1 COLOSSAL NEURON ACTIVITY
Membrane Transport. Anatomy 36 Unit 1
 Membrane Transport Anatomy 36 Unit 1 Membrane Transport Cell membranes are selectively permeable Some solutes can freely diffuse across the membrane Some solutes have to be selectively moved across the
What are the 6 types of neuroglia and their functions?!
 Warm Up! Take out your 11C Notes What are the 6 types of neuroglia and their functions?! Astrocytes Microglia Ependymal Cells Satellite Cells Schwann Cells Oligodendrocytes Support, brace, & nutrient transfer
Bioscience in the 21st century
 Bioscience in the 21st century Neurons, Synapses, and Signaling Dr. Michael Burger Outline: 1. Why neuroscience? 2. The neuron 3. Action potentials 4. Synapses 5. Organization of the nervous system 6.
Is action potential threshold lowest in the axon?
 Supplementary information to: Is action potential threshold lowest in the axon? Maarten H. P. Kole & Greg J. Stuart Supplementary Fig. 1 Analysis of action potential (AP) threshold criteria. (a) Example
Nervous System. Master controlling and communicating system of the body. Secrete chemicals called neurotransmitters
 Nervous System Master controlling and communicating system of the body Interacts with the endocrine system to control and coordinate the body s responses to changes in its environment, as well as growth,
The Nervous System. Dr. ZHANG Xiong Dept. of Physiology ZJU School of Medicine.
 The Nervous System Dr. ZHANG Xiong Dept. of Physiology ZJU School of Medicine Http://10.10.10.151 Part 1. Summary of the nervous system The Nervous System Central Nervous System Brain + Spinal Cord Peripheral
Parkinsonism or Parkinson s Disease I. Symptoms: Main disorder of movement. Named after, an English physician who described the then known, in 1817.
 Parkinsonism or Parkinson s Disease I. Symptoms: Main disorder of movement. Named after, an English physician who described the then known, in 1817. Four (4) hallmark clinical signs: 1) Tremor: (Note -
The axon and the nerve impulse, Generation and propagation of the nerve impulse, Ionic channels, Synaptic transmission.
 The axon and the nerve impulse, Generation and propagation of the nerve impulse, Ionic channels, Synaptic transmission Mitesh Shrestha Structure of the neuron the neuron consists of: the cell body, or
Alterations in Synaptic Strength Preceding Axon Withdrawal
 Alterations in Synaptic Strength Preceding Axon Withdrawal H. Colman, J. Nabekura, J.W. Lichtman presented by Ana Fiallos Synaptic Transmission at the Neuromuscular Junction Motor neurons with cell bodies
Chapter 2 The Brain or Bio Psychology
 Chapter 2 The Brain or Bio Psychology 1 2 3 1 Glial Cells Surround neurons and hold them in place Make Myelin (covering for neurons) Manufacture nutrient chemicals neurons need Absorb toxins and waste