A Role of T Cell Receptor Specificity in the Thymic Regulatory T Cell Development
|
|
|
- Clinton Peters
- 5 years ago
- Views:
Transcription
1 Washington University in St. Louis Washington University Open Scholarship All Theses and Dissertations (ETDs) A Role of T Cell Receptor Specificity in the Thymic Regulatory T Cell Development Hyang-Mi Lee Washington University in St. Louis Follow this and additional works at: Recommended Citation Lee, Hyang-Mi, "A Role of T Cell Receptor Specificity in the Thymic Regulatory T Cell Development" (2012). All Theses and Dissertations (ETDs) This Dissertation is brought to you for free and open access by Washington University Open Scholarship. It has been accepted for inclusion in All Theses and Dissertations (ETDs) by an authorized administrator of Washington University Open Scholarship. For more information, please contact digital@wumail.wustl.edu.
2 WASHINGTON UNIVERSITY IN ST. LOUIS Division of Biology and Biomedical Sciences Immunology Dissertation Examination Committee: Chyi-Song Hsieh, Chair Paul M. Allen Ted H. Hansen Yina H. Huang Kenneth M. Murphy Wojciech A. Swat A Role of T Cell Receptor Specificity in the Thymic Regulatory T Cell Development by Hyang-Mi Lee A dissertation presented to the Graduate School of Arts and Sciences of Washington University in partial fulfillment of the requirements for the degree of Doctor of Philosophy May 2012 Saint Louis, Missouri
3 Abstract The development of regulatory T (Treg) cells is essential for the maintenance of immune tolerance and homeostasis. In the thymus, TCR-specificity to self-antigen appears to be a primary determinant for Treg cell lineage commitment, imprinting both self and foreign antigens in the peripheral Treg cell population to provide dominant tolerance. The degree of T cell self-reactivity considered dangerous by the immune system, thereby requiring thymic education to prevent autoimmunity, is unknown. Here, I analyzed a panel of TCRs with a broad range of reactivity to ovalbumin (OVA ) in the RIP-mOVA self-antigen model for their ability to induce mechanisms of thymic tolerance. Thymic Treg cell generation in vivo was directly correlated with reactivity to OVA-peptide in a broad ~1,000-fold range, and its developmental niche size was unexpectedly dependent on TCR affinity. The threshold for Treg cell differentiation was almost 100-fold lower than that required for eliciting thymic negative selection and peripheral T cell responses. Thus, these data suggest that Treg cell differentiation is a default outcome of self-antigen encounter for CD4 + thymocytes, and that thymic tolerance mechanisms are tuned to limit the escape of self-reactive effectors without Treg cell chaperones into the periphery. In addition, in the study of developmental stage of Treg cells, I demonstrated that differentiation of most Treg cells occurs at immature CD4SP subset, suggesting that medullary APCs may facilitate maturation of thymocyte after positive selection for efficient induction of Foxp3. In summary, this study suggest that Treg cell development is driven by self-antigen encounter of CD4SP cells, and TCR reactivity for self-antigen plays an instructive role in Treg cell differentiation, thereby i
4 thymic tolerance mechanisms prevent autoimmunity by restraining the escape of selfreactive effector T cells into the periphery. ii
5 Acknowledgements It is my great pleasure to thank those who helped me complete my thesis works. They made my life and this thesis possible with their collaborations, advices and support. First, I am thankful to my advisor, Chyi-Song Hsieh for his understanding, guidance and support throughout my graduate study. Whenever I faced obstacles in my works, his advices helped me leap the huddles, and provided me directions. I also could learn valuable lessons from his enthusiasm and ways to address scientific questions, which will influence my attitude to future research. My thanks go to the past and present Hsieh lab people who supported me in various respects of science. Research themes and techniques that they have established formed the frameworks of the lab, and my works could be started and finished on the basis of them. My thesis work could not have been progressed without help from colleagues in Washington University. I would like to thank to Dr. Ted Hansen, a chair of my thesis committee, for his kind guidance throughout all the process for graduation. I would also like to thank to Dr. Paul Allen and Dr. Daved Fremont for their help for my trial to measure affinity. I am very grateful to David Donermeyer and William McCoy for their help for purification of tetramer and OVA specific TCRs, which I could not even try without their support and effort. I would like to thank to Dr. Kenneth Murphy and Dr. Wataru Ise for providing reagents that were essential for starting my thesis work. I am also grateful to my thesis committee members, Dr. Yina Huang and Dr. Wojciech Swat, for their constrictive advices throughout my thesis work. I would also like to thank to Dr. Takeshi Egawa for his advices for my career. iii
6 I am grateful to my friends for their friendship that supported me to go through long time of thesis work. Joey became my first friend that I made in this country, and her friendship supported my life in and out of the lab. I would like to thank to my old friend, Soo-Yoen, for her long lasting friendship and trust. My thanks also go to my college friend for the memories and friendship that have emotionally supported me over years. I am also thankful to my classmate for sharing good and bad days in St. Louis. Last, I would like to thank to my husband, Sang-Yong Hong, for his support for me even in his struggling graduate studies. I would like to express my deepest respect and love to my parents, sisters and brother for their support and dedication throughout my whole life. iv
7 Table of Contents Chapter 1. Background and Significance 1 Chapter 2. Tuning of thymic Treg cell selection to the self-reactive peripheral immune response Identification of OVA peptide-specific TCRs in a broad range of affinity A role of TCR affinity in thymic tolerance mechanisms and self-recative peripheral immune response 38 Chapter 3. Rare devleopment of thymic Treg cells at CD4 + CD8 + subset 61 Chapter 4. Concluding Remarks and Future Directions 89 References 96 v
8 List of Tables and Figures Figure 2.1. Hypothetical models on the relationship between thresholds for thymic Treg cell selection and peripheral tolerance and immunity 31 Figure 2.2. TCR sequencing of OVA peptide-specific T cells 32 Figure 2.3. Selection of possible OVA peptide-reactive TCRs using repertoire analysis 33 Figure 2.4. Confirmation of OVA peptide-reactivity 34 Figure 2.5. Screening of TRAJ21 containing TCRs 35 Figure 2.7. TCRs exhibits a broad range of reactivty OVA peptide. 36 Figure 2.7. In vitro and in vivo analysis of OVA-reactive TCRs 37 Table 2.1. Summary of assessments of TCR reactivity 49 Figure 2.8. Defining efficinecy of OVA recognition using hybridoma and primary T cells 50 Figure 2.9. Thymic Treg cell generation is instructed by the level of TCR reactivity to self-antigen. 51 Figure A role for TCR affinity in the thymic Treg cell selection niche 52 Figure Treg cell development coincident with negative selection by high affinity TCRs 53 vi
9 Figure High affinity TCR recognition of peripheral self-antigen is required to elicit peripheral T cell responses. 54 Table 3.1. Summary of CD4/8 distribution of Foxp3 + thymocytes 76 Figure 3.1. Contaminants in sorted Foxp3 + DP thymocytes 77 Figure 3.2. Most Foxp3 + DP events by flow cytometry appear to be doublets. 78 Figure 3.3. Most Foxp3 + DP events are composed of doublets. 79 Figure 3.4. Doublets in the Foxp3 + DP thymocyte subset 80 Figure 3.5. Increased cell concentration during staining enhances the frequency of Foxp3 gfp+ DP events. 81 Figure 3.6. Frequency of Foxp3 + DP cells increases with DNA content. 82 Figure 3.7. Doublet-discrimination gating decreases the frequency of Foxp3 gfp+ DP events. 83 Figure 3.8. Foxp3 + DP and CD4SP cells express similar cell surface markers. 84 Figure 3.9. Foxp3 + DP cells can be generated by MHC class I. 85 Figure Kinetics of thymic regulatory T cell development 86 vii
10 Chapter 1 Background and Significance It has become well established that the naturally occurring regulatory subset (Treg) of CD4 + T cells plays an important role in maintaining immune tolerance [1-3]. This is clearly illustrated by the observation that mutations in the forkhead transcription factor Foxp3, important for Treg cell function and development, results in lethal multi-organ autoimmunity. In humans, children are afflicted by the IPEX syndrome (immunodysregulation polyendocrinopathy and enteropathy) [4], whereas the murine equivalent is termed scurfy [5, 6]. Moreover, the acute depletion of Foxp3 + Treg cell from normal mice unleashes a rapid diffuse lymphoproliferative syndrome leading to death within 2 weeks [7, 8]. Treg cells have also been shown to prevent excessive responses to pathogens, participate in immune surveillance on tumor cells, and control a balance between host and microbial flora [9-11]. In order to understand how Treg cells impact on these multiple facets of immunity, it is important to determine how Treg cells are generated. Brief history of thymic Treg cell development In order to recognize a wide variety of pathogens, the adaptive immune system generates an enormously diverse repertoire of antigen receptors by somatic gene rearrangement. One consequence of this diversity, however, is that the repertoire includes receptors that recognize self-antigen with the potential to cause autoimmunity. For T cells, the immune system utilizes an intricate system of development in a specialized organ, the thymus, to educate the immature T cell population to self prior to their release into the 1
11 periphery. One mechanism of education is the elimination of immature self-reactive cells, a process also known as negative selection [12-14]. However, it has become clear that this culling is not sufficient to achieve tolerance, and some potentially pathogenic cells escape into the periphery [15, 16]. The notion that a specialized regulatory T cell population is required to inhibit the cells that escape negative selection was suggested by the classic thymectomy experiment, in which T cell dependent autoimmunity occurred if thymectomy occurred at day 3, but not day 7 [17], resulting from what is now thought to be a delay in thymic Treg cell export [18, 19]. Follow up studies showed that depletion of the CD25 subset revealed the autoimmune propensity in CD4 single-positive (SP) thymocytes [20]. Thus, it was suggested that another important educational function of the thymus is to select regulatory T (Treg) cells to prevent spontaneous autoimmunity [21]. TCR specificity: Self-reactivity of thymic Treg cells Since Foxp3 + Treg cells comprise only a small fraction of CD4 + T cells, an important question is whether there are defining features that determine selection into the Treg cell subset. Early studies inferred that Treg cells may be reactive to self antigens, as the presence of an organ was required for the maintenance or generation of peripheral T cells with the ability to suppress autoimmunity to that tissue [22-24]. Subsequent studies were more direct. For example, it was observed that superantigen increased the frequency of Treg cells with the appropriate TCRβ chain, suggesting that TCR stimulation was involved in thymic Treg cell development [25]. Moreover, TCR transgenic mice on a Rag-deficient background were not found to contain thymic Treg cells, whereas Rag- 2
12 sufficient mice, able to rearrange endogenous TCRα chains, could generate thymic Treg cells [20, 26]. These data therefore suggested that only certain TCR specificities could facilitate thymic Treg cell development. Studies of TCR and cognate antigen transgenic mice provided direct support for the hypothesis that self-antigen recognition in the thymus was important for directing thymic Treg cell selection. For example, hemagglutinin (HA) specific TCR transgenic cells were selected to become Treg cells only when HA was transgenically expressed in the thymus [27]. Other TCR transgenic models including ovalbumin (OVA) -specific DO11.10 yielded similar results [28, 29]. From these data, the notion arose that Treg cell development occurred in the avidity window for self-antigen between positive and negative selection [30]. However, subsequent data were conflicted regarding whether intrinsic properties of TCR, such as self-reactivity, specify Treg lineage commitment. In hen egg lysozyme (HEL)-specific 3A9 TCR transgenic mice, analyses of the absolute number of Treg cells revealed no significant increase in Treg cell generation when transgenic TCR was coexpressed with HEL [31]. Similarly, it was found that the proportion of Treg cells increased without an increase of the absolute numbers when pigeon cytochrome c (PCC) - reactive AND TCR encountered varying amount of antigen expressed under the control of tetracycline-dependent transgene system [32]. This observation suggested that agonist TCR interaction resulted in deletion, rather than Treg cell selection. However, TCR specificities induced by alternative TCRα chain usage could induce Treg cells and protect them from agonist mediated deletion, resulting in an overall increase in the frequency of 3
13 Treg cells with increasing agonist ligands. Thus, not all TCR transgenic studies supported an agonist model of Treg cell selection. Analyses of polyclonal TCR repertoire also reached conflicting conclusions. It was reported that Treg cells utilize a distinct, but overlapping, TCR repertoire from that of non-treg cells, in favor of a model in which Treg lineage commitment is instructed by TCR specificity [33-35]. Moreover, T cells transduced with Treg TCRs often rapidly expanded after adoptive transfer into either normal or lymphopenic hosts, suggesting that Treg-derived TCRs confer reactivity to self-antigens in vivo [33, 36]. In contrast, another study argued that self-reactivity is dispensable for Treg cell selection, based on the observations that TCR repertoire of Treg and non-treg cell subset were significantly overlapped, and hybridoma cells expressing Treg TCRs failed to respond to self-antigens presented by splenocytes or dendritic cells in vitro [37]. Finally, it was suggested that early thymic developmental events condition thymocytes for differentiation into Treg cell lineage before TCR rearrangement, implying that TCR specificity is not a specifying factor for thymic Treg cell induction, although post-differentiation selection based on antigen-specificity is possible [38]. Thus, there was considerable controversy regarding the role of TCR specificity in thymic Treg cell selection. Data from the past several years, however, have been in favor of TCR-mediated Treg cell selection. First, TCRs from natural Treg, but not naive, cells, are able to facilitate thymic Treg cell development in TCR transgenic models [39, 40]. Second, experimental attenuation of MHC II expression on mtecs resulted in preferential Treg development, rather than negative selection, in a TCR transgenic model involving an 4
14 Aire-promoter driven antigen [41]. Third, intravenous peptide could stimulate Treg cell development if given within certain dose ranges [42]. Finally, direct assessment of TCR activation using a new Nur77-GFP reporter revealed that thymic Treg cells were recently exposed to enhanced levels of TCR stimulation [43]. Thus, the preponderance of current evidence, discussed in greater detail below, supports an important role for TCR specificity in thymic Treg cell differentiation. TCR transgenic mice with natural Treg TCRs The aforementioned TCR transgenic studies utilized TCRs that were not known to be normally found in the natural Treg cell population. It was therefore possible that the experimental manipulation of expressing the cognate antigen using various promoters may not mimic natural Treg cell development. Recently, several groups independently reported their experiences with TCR transgenic mice expressing natural Treg TCRs. One group isolated the natural Treg TCR from OTII -TCR transgenic cells, and only observed negative selection after generating the Treg TCR transgenic line [44]. It is possible that this particular TCR was expressed as a secondary TCR chain at low levels in OTII cells, and therefore had higher affinity than usual for self antigens leading to negative selection when expressed in a normal context. Two other groups used TCRs isolated from polyclonal fixed TCR repertoires in which the skewing of the TCR to the Treg cell subset was known [39, 40]. Intriguingly, the frequency of Foxp3 + thymocytes was surprisingly low in the TCR transgenic mice on a Rag-deficient background, which would not have been predicted based on previous studies of TCR by cognate antigen 5
15 transgenic mice [27-29]. In fact, the initial interpretation by both groups was that this observation resulted from an experimental artifact of TCR transgenesis. Substantial thymic Treg cell development was eventually observed only when the clonal frequency of the TCR transgenic cells was diminished using either mixed bone marrow chimeras or intrathymic injection. In other words, the clonal frequency of TCR transgenic cells was inversely correlated with the frequency of Foxp3 + cells. Moreover, the number of Treg cells generated reached plateau at high clonal frequency, and was much smaller than the total number of CD4 + CD8 (CD4SP) cells that could be generated by positive selection. These observations led to the notion that thymocytes with a given TCR specificity undergo intraclonal competition for a small niche with limited microenvironmental factor(s) important for thymic Treg cell development. Although the factors defining the Treg cell selection niche are unclear, the most compelling hypothesis is that the niche represents a limited amount of antigen for which developing thymocytes must compete in order to undergo Treg cell differentiation. It is important to note, however, that the limitations imposed by niche size resulting in intra-(or inter) clonal competition may be more applicable to experimental immunology rather than normal T cell development in a fully polyclonal population, where the clonal frequency is likely to be extremely low on the order of a few to tens of cells per antigen specificity [45]. In addition to TCR transgenic mice, restricted TCR repertoires may be susceptible to niche size issues depending on the extent of the limitation [35], and may provide an explanation regarding the increased overlap between Treg and non-treg cell subsets in some studies [37] compared with others [33]. 6
16 The more physiologic implication from the observation of a small Treg cell developmental niche, at least based on the natural Treg TCRs reported to date, is that the antigens that drive thymic Treg cell development are likely to be uncommon and likely tissue-specific antigens, rather than ubiquitous antigens. Moreover, the size of the niche varies per TCR, suggesting that some Treg TCR ligands are more abundant than others. The notion of rare Treg cell-inducing ligands would be consistent with the notion that Aire-dependent tissue specific antigens presented by medullary thymic epithelial cells (mtecs) can facilitate thymic Treg cell development [46]. This is also supported by an observation of preferred Treg cell development compared to deletion in low amount of antigen expression [47]. Finally, uncommon self-ligands would explain why selfreactivity could not be easily detected by direct hybridoma assays [37], but required assessment of in vivo proliferation in lymphopenic hosts [33, 36]. Direct proof of this hypothesis will require isolation of natural Treg TCR ligands, which has not yet been reported to our knowledge. Thus, the preponderance of current data suggests that thymic Treg cell selection is driven by TCR encounter with rare self-antigens. Affinity and avidity As TCR specificity is a primary determinant for thymic Treg cell selection, an important question is to understand the parameters of TCR:ligand engagement required for this process. Initial experiments with TCR transgenic models suggested that a high affinity TCR interaction is required for thymic Treg cell selection. Comparison of two HA-specific TCR transgenic lines with 1000 fold differences in sensitivity to HA revealed that Treg cell development only occurred with the high affinity TCR [27]. 7
17 Increasing the amount of antigen, i.e. avidity, could not compensate for the difference in affinity, as levels of antigen sufficient to induce negative selection were still unable to generate Foxp3 + cells. A different study of Treg cell differentiation in thymic organ cultures used altered peptide ligands (APL) with varying affinities to the hemoglobinspecific N3.L2 TCR [48]. They observed that strong and weak agonist, but not antagonist, peptides could induce Treg cell differentiation. Thus, these data suggest that there may be an affinity threshold, akin to negative selection [13], for which TCR recognition of agonist ligands is required for thymic Treg cell differentiation. The role of the avidity in Treg cell differentiation has been also addressed using transgenic mice and in vitro thymic organ cultures. Using a panel of transgenic lines with different expression levels of HA in the thymus, it was observed that Treg cell number was enhanced at low expression levels, whereas high levels resulting predominantly in negative selection [47]. A similar monophasic response was observed in vitro using a titration of agonist peptides into fetal thymic organ cultures of NOD TCR transgenic cells, in which Treg cell numbers were positively related to peptide dose at low concentration, but diminished at high antigen concentration due to extensive negative selection [49]. This phenomenon was also replicated in vivo using intravenous peptide administration [42]. Finally, a recent study using transgenic mice in which the level of antigen presentation was decreased by the downmodulation of MHC class II expression in Aireexpressing mtec cells also showed a shift from negative selection to Treg cell development, which utilized a newly described transgenic of an Aire-promoter driven shrna against C2TA, a master regulator of MHC class II expression (C2TA kd ) [41]. 8
18 Thus, the experimental evidence favors a model by which Treg cell development is most efficient within an avidity window below that of negative selection. While the current data provide a framework for understanding the role of avidity and affinity in thymic Treg cell selection, a number of questions remain. One potential issue is the use of transgenic lines in which there is only a single TCR clonotype. As discussed above, the efficiency of Treg cell development can be heavily influenced by the clonal frequency of the T cell [39, 40]. This complicates the interpretation of experiments that increase the amount of antigen level as a means to understand avidity. The traditional interpretation is that the increased number of ligands per APC leads to enhanced TCR signaling and Treg cell selection. However, it may be possible that the increased amount of antigen results in more APCs with sufficient ligand, enhancing the frequency of Foxp3 + cells generated via an enlarged niche. Given that intraclonal competition also affects positive selection [50, 51], albeit to a lesser degree, it is reasonable to expect that negative selection is also affected by an antigenic niche. Thus, the analysis of Treg cell differentiation versus negative selection may be quite different at high versus low clonal frequencies. Another issue is the use of antigen-transgenic lines driven by ubiquitous promoters, peptide injection into mice, or addition of peptides to fetal thymic organ cultures (FTOC), which presumes that Treg cell selecting ligands are fairly ubiquitous and the APC environment of the thymus is monolithic. Experimental evidence suggests that Treg cell selection utilizes a limited antigen niche [39], making ubiquitous antigens less likely to model thymic Treg cell development. Moreover, the distribution of selecting ligand on the various thymic APC subsets may or may not represent that of natural Treg 9
19 cell ligands. For example, expression of antigen in the cortex might favor negative selection rather than Treg cell development. However, these data may still be relevant as the range of antigens that select thymic Treg cell development has yet to be fully explored. Thus, although the current data show that affinity and avidity play important roles in thymic Treg cell selection as proof of principle, future experiments will be required to understand in a quantitative fashion how reactivity to self-antigens dictates cell-fate choice between Treg cell differentiation, negative selection, and release from the thymus as an effector cell with autoimmune potential. A signaling threshold for thymic Treg cell development One reason that it has been difficult to address the role of self-antigen reactivity in Treg cell selection is the lack of effective in vivo assessment for TCR stimulation. While T cell activation markers such as CD69 and CD25 are associated with the process of Treg cell development [52], they did not provide compelling evidence due to their transient expression or their upregulation as a Treg cell marker, respectively. Recently, a new marker for TCR activation was reported using a Nur77 promoter driven GFP which revealed several interesting aspects of thymic Treg cell differentiation [43]. In a polyclonal population, they found that GFP expression was high on Foxp3 + compared with Foxp3 cells, confirming the notion that Treg cells underwent TCR mediated selection to agonist ligand. More instructive, however, was the analysis of Nur77-GFP in G113 Treg TCR transgenic cells that were known to be restricted by a small developmental niche [39]. One prediction was that intraclonal competition would result in a downward shift of a 10
20 monophasic TCR signal measured by Nur77-GFP, thereby decreasing the proportion in the "avidity" window of Treg cell development. However, what was observed was that G113 cells existed in a biphasic plot with distinguishable Nur77-GFP hi and lo populations, which shifted in proportion depending on the clonal frequency of G113 thymocytes. Assuming that the Treg cell differentiation program itself does not affect Nur77-GFP levels, these data suggest that intraclonal competition operates by limiting the number of T cells obtaining a high level TCR signal, rather than decreasing the probability that a lesser TCR signal leads to Foxp3 induction. Niche size would then reflect the number of APCs that have sufficient antigen in terms of both affinity and avidity to induce "high level" TCR signaling, which remains to be biophysically defined in the context of Nur77- GFP. Thus, this suggests that Treg cell differentiation is dependent on a certain threshold of TCR signaling, arguing for a "digital," rather than "analog" interpretation of TCR signals for thymic Treg cell development. Timing of thymic Treg cell differentiation: APC subsets The notion that self-antigen specificity selects the thymic Treg cell population engenders the question of which APCs are presenting what self-antigens. For example, it is known that ctec and mtec present different antigenic repertoires due to the use of distinct antigen processing enzymes [53]. Moreover, Aire expression in mtecs has been shown to induce the expression of tissue-specific antigens in the thymus [54]. Other differences between APCs such as co-stimulation may also affect thymic Treg cell differentiation. Thus, it is important to understand the contribution of the various thymic APC subsets in the generation of the thymic Treg cell population. 11
21 Initial studies suggested that a normal frequency of CD25 + Treg cells can be generated when MHC class II is exclusively expressed in the cortex of the thymus [55]. Consistent with cortical Treg cell development, some studies showed a considerable frequency of Treg cells at CD4 + CD8 + (DP) stage [56, 57]. However, other studies favor the notion that Treg cell differentiation mainly occurs at the CD4SP stage [58, 59]. The temporal analysis of Treg cell generation during the neonatal period as well as in young adults using neonatal bone marrow injection demonstrated that DP cells expressing Foxp3 are rare and the development of Foxp3 + cells mostly starts at immature CD4SP stage. Although a quantitative assessment of the relative contribution of cortical versus medullary APCs to thymic Treg cell differentiation is not established, it appears that most Treg cells are generated in the medulla. In this thesis, I examined intrinsic and extrinsic factors for Treg cell development in the thymus using TCR repertoire analysis, the affinity of TCR for self-antigen and APC environment determining the developmental stage of Treg cells respectively. First, in the study of TCR affinity, I demonstrated that thymic Treg cell development is directly correlated with TCR affinity to self-antigen in a broad range. Second, I observed that foreign antigen specific Treg cells can be generated by recognition of self-antigen via presumably promiscuous antigen presentation by thymic APCs. Third, it was suggested that high TCR affinity expands the number of APC delivering a Treg cell inducing signal. Last, I found that the threshold for peripheral T cell responses is well above that for thymic Treg cell development and correspond to that for negative selection, suggesting that thymic tolerance mechanisms are developed to accompany escaping self-reactive effectors with Treg cells to prevent autoimmune responses in the periphery. Also, in the 12
22 study of developmental period of Treg cells, I demonstrated that the frequency of Treg cells generated at DP stage is much smaller than previously suggested, and most Treg cells differentiate at immature CD4SP stage, implying an important role of medullary APC in facilitating efficient induction of Foxp3. Taken together, this dissertation study suggests that Treg cell development is a default outcome of self-antigen encounter of CD4 SP thymocytes, and TCR affinity for self-antigen instructs Treg cell development. 13
23 Chapter 2 Tuning of thymic Treg cell selection to the self-reactive peripheral immune response Introduction The adaptive immune system generates a diverse array of antigen receptors to allow recognition of a variety of pathogens. However, a consequence of this diversity is that some receptors will recognize self with the potential to cause autoimmunity. For T cells, the issue of self-reactivity is mitigated as development occurs in a specialized organ, the thymus, where the immature T cell population is educated to the self-antigenic repertoire prior to their release into the periphery as mature T cells with the ability to cause autoimmunity. One important mechanism of education is the deletion of selfreactive T cells, also known as negative selection [12, 13]. However, not all self-reactive thymocytes are eliminated, and some escape the thymus as effector cells with the potential to cause autoimmunity [15, 16]. A second mechanism of education to selfantigens is now recognized to be the differentiation of self-reactive thymocytes to become Treg cells that suppress, rather than induce, inflammatory responses. TCR specificity was initially thought to be important for thymic Treg cell development as it was observed that TCR transgenic mice on a Rag-deficient background do not have Treg cells [20, 60], implying that only certain TCRs can facilitate Treg cell differentiation. Subsequent studies of TCR and antigen double transgenic mice suggested that recognition of self-antigen was the pertinent requirement for thymic Treg cell induction [60, 61]. Other reports using fetal thymic organ cultures (FTOC) and in vivo 14
24 peptide injection have supported this model [42, 49]. Taken together with other studies[36, 39, 40], the preponderance of the data suggests that self-recognition is an important requirement for thymic Treg cell selection. While these studies provide proof of principle that self-reactivity is required to trigger thymic education via Treg cell differentiation and negative selection, a number of questions remain. First, many studies modeled interactions with ubiquitous antigens via transgenic expression or peptide administration in vivo or in vitro [42, 49]. However, recent data suggests that thymic Treg cell development utilizes a limited antigenic niche [39, 40], implying that ubiquitous antigen presentation may not be an appropriate model. Thus, the level of self-reactivity that elicits thymic education mechanisms for CD4 + T cells to tissue-specific antigens is unknown. Second, the study of TCR transgenic cells at high clonal frequencies may not represent what happens during normal thymic development, which occurs at very low clonal frequencies. For example, high clonal frequencies have recently been shown to markedly decrease the efficiency of thymic Treg cell development, presumably due to intraclonal competition [39, 40]. Thus, it may be possible that Treg cell development or negative selection may be different at high versus low clonal frequencies. Finally, while there have been studies of MHC class I restricted T cells regarding thresholds of negative selection [16, 62], the range of TCR self-reactivities that elicit thymic tolerance mechanisms in CD4 + T cells in vivo has not been examined. In some studies, the level of self-reactivity required to trigger thymic Treg cell differentiation has been suggested to be quite high [41, 61], being at or near the level of self-reactivity that induces negative selection. Moreover, thymic Treg cell differentiation may be dependent 15
25 on a certain threshold of TCR affinity for antigen, as Treg cell development was not observed with low affinity interactions, even if the antigen was expressed at high enough levels to induce negative selection [63]. On the other hand, it was reported that there was great overlap between the Treg and non-treg TCR repertoires [37], suggesting that a broad range of self-reactivity, perhaps including TCRs that recognize self at the level of positive selection, was sufficient for Treg cell development. Also, direct demonstration of natural Treg TCR recognition of self-antigens presented on thymic APCs has not been successful [37], suggesting that the antigen is rare or that the TCR affinity for antigen is low. Determining the self-reactivity thresholds for thymic Treg cell induction and negative selection would be useful for understanding how the immune system perceives the problem of self-recognition and utilizes thymic education to control it. Thus, the quantitative level of self-reactivity that triggers thymic education mechanisms, and how that relates to level of self-reactivity required for peripheral immune responses, are not known. To address this question, I decided to fix the level of self-antigen and vary the efficiency of TCR recognition. Since natural Treg ligands are currently unknown, I utilized as a well-characterized model of a tissue-specific antigen, the RIP-mOVA transgenic line, in which the rat insulin promoter drives the expression of membrane bound ovalbumin (OVA) [64]. The developmental effects of thymic encounter with a relatively rare "self-antigen" can then be assessed at low clonal frequencies of T cells expressing a panel of naturally occurring TCRs with varying reactivity to OVA identified from DO11 TCR transgenic mice. Remarkably, I observed a direct correlation between the degree of antigen-reactivity and thymic Treg cell generation over a broad 16
26 ~1,000-fold range. Negative selection was apparent with the more self-reactive TCRs. Finally, peripheral responses as measured by proliferation of naive T cells after transfer into irradiated RIP-mOVA mice required a degree of OVA-reactivity that induces both thymic negative selection and Treg cell development. Thus, these data demonstrate that the level of self-reactivity plays a crucial instructive role in thymic Treg cell differentiation, which is tuned to be substantially below the threshold for peripheral immune responses to self-antigen. 17
27 Materials and Methods 1. Mice Foxp3 gfp mice [65] were a kind gift from A. Rudensky (MSKCC). RIP-mOVA [64] mice Were obtained from Jackson Labs. DO11.10 TCRβ transgenic mouse line [66] was kindly provided by K. Murphy (Washington U.). All mice were backcrossed onto B6.C (B6 background congenic at the MHC locus with BALB/c) to facilitate breeding to mutant mice of B6 background, and were bred to generate DO11.10 TCRβ transgenic Foxp3 gfp TCRα +/ RIP-mOVA mice for TCR analysis. CD45.1 RIP-mOVA mice were also generated on the B6.C background. Mice were housed in a specific pathogen free animal facility and were used according to protocols approved by the Institutional Animal Care and Use Committee at Washington University. 2. Reagents The following monoclonal antibodies were from ebioscience, Biolegend and BD Pharmingen: antibody to CD4 (RM4-5), anti-cd8 (53-6.7), anti-cd45.1 (A20), anti- CD45.2 (104), anti-thy-1.1 (HIS51), anti-cd25 (PC61), anti-hsa (M1/69), and anti TCR Vβ8 (F23.1). Chicken ovalbumin (OVA ) peptide (ISQAVHAAHAEINEAGR) was purchased from GenScript Corp. CFSE, Cell-Trace Far-Red DDAO dye and Cell- Trace Violet Proliferation kit were purchased from Invitrogen. Recombinant mouse IL-3, recombinant human IL-6, and recombinant mouse stem cell factor for the bone marrow culture were obtained from Peprotech. 18
28 3. Culture of T cells and TCR sequencing Peripheral spleen and lymph node cells from DO11.10 TCRβ x Foxp3 gfp Tcra +/ RIP-mOVA or + mice were labeled with DDAO and cultured with 1μM of OVA for 5 days. DDAO low-vβ8 + CD4 T cells were purified from Foxp3 and Foxp3 + subsets by FACS (FACSAria, Becton Dickenson). Sequencing and analysis of TRAV14 TCRα (Vα2) chains was performed as previously described [33]. 4. Measurement of EC 50. For NFAT activation assay, T cell hybridomas expressing DO11 TCRβ, mcd4, and an NFAT-GFP reporter [66], were retrovirally transduced with TCRα. FACS sorted mcd4 + Vβ8 + Vα2 + cells were cultured with flt3 ligand-activated CD11 + APC and various concentrations of OVA GFP expression was measured by flow cytometry 40 hrs post stimulation. The NF-κB reporter cell line was generated by retroviral transduction of NF-κB-GFP construct [67] provided by B. Sleckman, Washington U., into DO11 TCRβ-mCD4 T cell hybridomas, and then transduced with TCRα chains. In these assays, the TA3 B cell hybridoma was used for APC to decrease background. To measure IL-2 production, 5KC T cell hybridomas expressing DO11β were transduced with a TCRα chain, and cultured with TA3 APCs. The supernatants were assessed for IL-2 using a CTLL-2 bioassay with Alamar blue (Arcus biologicals). Thymic and peripheral T cells expressing an individual OVA peptide-specific TCR were generated by retroviral bone marrow chimeras as described below. Thymocytes were separated into CD4SP and DP subsets by magnetic cell purification using biotinylated anti-cd8 antibody and anti-biotin microbeads (AutoMACS, Miltenyi Biotec). CD4SP Were cultured with irradiated splenic APC pulsed with OVA to 19
29 measure CD25 induction at 24 hours by flow cytometry. DP cells were also cultured with APCs to measure down regulation of CD4 and CD8 at 48hrs by flow cytometry. Pooled spleen and lymph node cells were labeled with CFSE and cultured with OVA Cell division of retrovirally transduced cells (CD CD45.1 TCRβ + Vα2 + CD4 + ) was assessed by flow cytometry after 72 hours. To generate the dose response curve of each TCR, the activation/expression level at each concentration of peptide was normalized to that of anti-cd3 antibody (1µg/ml) stimulation, and EC 50 was determined by nonlinear regression using GraphPad software. 5. Tetramer binding T cell hybridomas (2x10 5 ) expressing individual TCRs were stained with 20μg/ml of PE labeled tetramers of I-A d protein with linked DO11 OVA epitope [68] at 37 C for 90 min in round bottom 96-Well plates, and were further incubated with 2μg/ml of anti- TCRβ antibody at 4 C for 30 min. Tetramer binding to TCRs was measured by MFI of PE using flow cytometry. 3K:I-A b tetramer was used as a control. 6. Retroviral transduction of TCR into CD4 CD8 thymocytes Thymocytes from Foxp3 gfp Rag1 -/- mice were transduced with MigR1-derived retroviruses expressing TCRα-P2A-DO11 TCRβ IRES-Thy1.1 as described [69, 70]. One million cells in 10μl PBS was injected into the thymic lobe of sublethally irradiated (600 rads) wild-type and RIP-mOVA recipients. Development of Foxp3 + thymocytes was analyzed by flow cytometry 2 weeks later. 20
30 7. Retroviral bone marrow chimeras Generation of retroviral bone marrow chimeras have been previously described [39]. Here, I used Foxp3 gfp Rag1 / B6.C mice as bone marrow donors, which were at times mixed with bone marrow of CD45.1 Foxp3 gfp mice at ratios of 1:0, 1:1 or 1:4, prior to injection (5x10 6 total cells) into lethally irradiated (1,000 rads) CD45.1 wild-type or RIP-mOVA hosts. Thymic and peripheral T cells were used for experiments or analyzed by flow cytometry 6 weeks later. 8. Assessment of negative selection in vivo Thymocytes expressing individual TCRs were generated by retroviral bone marrow chimeras (not mixed) in wild-type hosts. CD4SP cells were FACS sorted, and mixed with Cell Trace Violet-labeled polyclonal thymocytes at a 1:1 ratio. CD4SP cells were injected into the thymus of either CD45.1 wild-type or RIP-mOVA recipients, and analyzed by flow cytometry on day 3 post transfer. 9. Assessment of peripheral responses to antigen in vivo Peripheral CD4 + T cells expressing individual TCRs were generated by retroviral bone marrow chimeras in wild-type hosts, and labeled with Cell Trace Violet as a CFSE analog to follow cell division. Foxp3 CD4 + T cells (10 5 ) were intravenously transferred into irradiated (500 rads) CD45.1 wild-type or RIP-mOVA recipients. Splenocytes were analyzed for proliferation and Treg cell conversion 14 days later by flow cytometry. 21
31 Chapter 2.1 Identification of OVA peptide-specific TCRs in a broad range of affinity Results Identification of naturally occurring OVA peptide-specific TCRs The degree of self-reactivity that triggers thymic Treg cell differentiation of CD4 + T cells is unknown, with studies favoring high [63] versus low [37] thresholds of selfreactivity. As different thresholds for thymic Treg cell development may be predicted to generate different models regarding how self-reactive Treg and effector cells participate in immune responses to self- and foreign antigens in the periphery (Figure 2.1A,B), I sought to define this threshold using a panel of TCRs with varying self-reactivity. Although mutagenesis has been used to generate TCRs with different affinity to antigen, I decided to identify naturally rearranged OVA-reactive TCRs from the peripheral CD4 + T cell population to avoid non-physiologic TCR interactions with peptide:mhc molecules. As the frequency of OVA-specific T cells in the normal T cell population is very low, I reasoned that using a TCR β-transgenic line from an OVA-specific TCR would increase the precursor frequency based on observations from the MHC class I restricted OT-I transgenic line [71]. Another advantage of fixing the TCR β-chain is that the physical framework for TCR recognition of peptide:mhc molecules will be similar between different TCR α-chains. I therefore obtained a TCR β transgenic line based on the DO11.10αβ TCR [66], which recognizes OVA peptide at agonist level affinities [72, 73]. To ensure that only one TCR α chain is expressed per cell, the mice were bred to be 22
32 Tcra +/. Thus, I used DO11β Foxp3 gfp B6.C (H-2 d ) Tcra +/ RIP-mOVA + or mice as a source of T cells to identify a panel of OVA-specific TCRs (Figure. 2.2A). To enrich for OVA-specific TCRs amongst the TCR β transgenic polyclonal repertoire, I identified T cells that proliferated after in vitro stimulation with OVA peptide using dilution of DDAO, a cellular dye similar to CFSE but compatible with GFP (Figure 2.2B). However, there appeared to be substantial OVA-independent proliferation. To identify OVA-specific TCRs, I looked for TCR sequences that were enriched in the OVA-stimulated versus un-stimulated T cell populations. I obtained 3,785 TCRα sequences from Foxp3 + and Foxp3 cells from RIP-mOVA + or mice stimulated in vitro with or without OVA-peptide (Figure 2.2C). I restricted the initial analysis to the TRAV14 (Vα2) repertoire to limit the possible structural configurations of TCR interaction with OVA peptide:mhc II molecules. As expected, there was substantial overlap between the OVA stimulated and un-stimulated repertoires (Figure 2.3). In particular, the 9 most frequent Foxp3 - TCRs on T cells from RIP-mOVA + mice were found at comparable frequencies irrespective of OVA-peptide stimulation, suggesting that the precursor frequency of OVA-specific cells is much lower in these mice due to negative selection. In order to confirm OVA-peptide specificity, I selected the most frequent TCRs found in the OVA but not control cultures (highlighted in grey, Figure 2.3) and expressed them on DO11β T cell hybridoma lines that contain GFP driven by NFAT as a reporter for TCR stimulation [66]. Since the parent line prior to retroviral transduction was the same, the hybridoma cells should differ only by the TCRα sequence, allowing direct comparison of antigen recognition regardless of the cellular source of the TCR. However, 23
33 only a subset of these TCRs showed reactivity to OVA peptide presented by Flt3L induced dendritic cells (Figure 2.4), suggesting that low frequencies and well to well variability limited the effectiveness of this subtraction approach. In these screening experiments, I noted that the only TCRs which exhibited OVAreactivity, regardless of T cell subset or RIP-mOVA status, utilize TRAJ21 (Jα21), which happens to be the same J-region utilized by the TRAV5D (Vα13) DO11αβ-chain. This suggests that Jα21 provides structural features that facilitate recognition of OVA-peptide in the context of DO11β. I therefore identified all naturally rearranged Jα21 containing TCRs in our data set irrespective of frequency, T cell subset, or genotype, and tested them for OVA-reactivity (Figure 2.5). Interestingly, only TCRs with a CDR3 length of 10 showed reactivity to OVA. Thus, I have identified a panel of 8 naturally arising TCRs all with Jα21 and the same CDR3 length that recognize OVA-peptide:MHC class II I-A d (Figure 2.6), suggesting that these TCRs all recognize in a very similar manner OVA bound to I-A d in a single register. The panel of TCRs exhibit a broad range of reactivity to OVA To calculate the efficiency of OVA recognition, I determined the effective concentration of OVA peptide that elicited half-maximal responses (EC 50 ) for each TCR using non-linear regression analysis (Figure 2.7A). As an inter-experiment control, the peptide responses were normalized to that of anti-cd3 antibody treated cells. Since the EC 50 is dependent on the functional characteristics of the assay, I decided to use DO11αβ as a reference TCR for a typical agonist level response to foreign antigen. Thus, the 24
34 relative efficiency by which a TCR recognizes OVA peptide in comparison with DO11 is denoted as Log(EC 50 ) = Log(EC 50 DO11) - Log(EC 50 TCR). The first quantification of the efficiency of OVA recognition utilized the NFAT- GFP reporter hybridoma cells generated for the initial functional screening above (Figure 2.6). I observed that our TCRs spanned over 3 logs in relative EC 50 to our reference TCR DO11, with TCRs N7 and N9 within 1 log of DO11, R1/R4 within the 2 nd log, and R2, N12, N13 and P1 with even lower reactivity to OVA. Note that changes in one or two amino acids greatly affected the recognition of OVA, such that P1 exhibits greater than a thousand fold-lower sensitivity to peptide antigen than DO11.10, although there may also be effects in the CDR1/2 regions for R2 and N9 (Figure 2.6A). Thus, I have identified a panel of 8 TCRs that recognize OVA with a broad range of efficiencies. Thymic Treg cell selection of TCRs with foreign antigen-reactivity I first wanted to establish that our panel of OVA-reactive TCRs does not facilitate thymic Treg cell development in the absence of OVA, which would preclude straightforward interpretation of OVA-dependent Treg cell generation. I utilized retroviral transduction of DN thymocytes followed by intrathymic transfer into congenically marked hosts [69, 70] to assess the development of Foxp3 + cells 2 weeks after transfer. I did not observe Treg cell development in T cells expressing the DO11 TCR, as well as five OVA-reactive TCRs (Figure 2.7B). Interestingly, there were three TCRs which facilitated thymic Treg cell development in the absence of OVA, suggesting that these TCRs may recognize unknown self-antigens for Treg cell selection. This is further supported by the observation of R1 and R2 in the Treg TCR repertoires from 25
35 wild-type mice (Figure 2.3). It appears that both TRAV14 subtype and CDR3 sequence affects this presumed self-reactivity, as R2 and N9 use the same TRAV14 subtype but different CDR3 sequence, whereas R1 and R2 utilize the same CDR3 sequence, but have different TRAV regions. Thus, these data demonstrate that it is possible to generate Treg cells in the thymus that also recognize foreign antigens, presumably due to the promiscuity of TCR recognition. 26
36 Figure Legends Figure 2.1. Hypothetical models on the relationship between thresholds for thymic Treg cell selection and peripheral tolerance and immunity. (A) High threshold of self-reactivity model for thymic Treg cell selection. Selfreactive TCRs above a high threshold are selected into Treg cells, which prevent autoimmunity elicited by lower affinity T cells. In this model, there is no selection of Treg cells to foreign antigens, allowing effector T cells to efficiently respond to foreign antigens. Blue circles represent self-reactivity at the level of positive selection, and maroon circles self-reactivity at varying levels as indicted by the darkness of the fill color. Treg cells are indicated in shades of green fill color. (B) Low threshold of self-reactivity model. In this model, a broad repertoire of Treg cells is generated with low correlation to self-reactivity. Tolerance to self occurs as Treg cells are generated to most antigenspecificities. However, Treg cells will also be generated to foreign antigens, and has been proposed to prevent excess immunopathology that can be occurred during immune responses to pathogens. (C) Our data suggest that thymic Treg cell generation is best represented by an intermediate model as it is directly driven by self-reactivity over a broad range, but is above the level of positive selection. In this model, foreign antigenreactive thymic Treg cells arise due to incidental self-reactivity of the TCR, presumably related to promiscuous antigen recognition. For negative selection, the shape of the curve is not known (indicated by dashed line and?). For positive selection, the range of affinities is not well established (indicated by dashed line). Int., intermediate. 27
37 Figure 2.2. TCR sequencing of OVA peptide-reactive T cells (A) Flow cytometry of the thymic and splenic CD4 + T cells from DO11β Foxp gfp Tcra +/ RIP-mOVA or + mice. (B) Gating scheme for sorting of proliferating cells after in vitro activation with OVA-peptide. DDAO is a dye analogous to CFSE that is used to determine cell division. The percentage of cells in each quadrant is indicated by the number. Boxes with dashed lines represent the gates used to sort proliferating Foxp3 or Foxp3 + cells. (C) Numbers of TCRs sequenced from the sorted cell populations indicated in (B). Each experiment represents pooled spleen and lymph nodes from 2 mice. TCR sequence database was generated by pooling sequences from all experiments. Figure 2.3. Selection of possible OVA peptide-reactive TCRs using repertoire analysis The 20 most frequent TCRs are shown for Foxp3 + and Foxp3 cell subsets from RIP-mOVA or + mice (numbers in blue). TCRs found only in the OVA peptide culture were presumed to be OVA reactive and cloned for functional screening using hybridoma cells (highlighted in grey). TRAJ21 TCRs are shown in red. Note that R1* and R2** TCRs of the same CDR amino acid sequence are distinguished by usage of polymorphic TRAV14-3*01 and TRAV14D-1*01, respectively. Numbers in the table represent the frequencies of the TCR in each subset. Figure 2.4. Confirmation of OVA peptide-reactivity 28
38 TCRs selected from the repertoire analysis in Figure 3 were retrovirally expressed on the NFAT-GFP reporter hybridoma line. TCRs selected from Foxp3 RIP-mOVA cells were also tested, but did not have any OVA-reactive TCRs not shown above. TCRs that contain TRAJ21 sequence in their CDR3 are shown in red as Supplementary Figure 3. One TRAJ21 TCR did not show reactivity to 1 mm OVA peptide in vitro ( ), and one did not express in vivo in the TCRα-P2A-DO11β vector for unknown reasons ( ). These two TCRs were therefore not studied further. Data are representative plots from two independent experiments. Figure 2.5. Screening of TRAJ21 containing TCRs (A) Summary of all TRAJ21 TCRs found in our TCR database. TCRs that induced NFAT-GFP expression are highlighted in grey with differences in amino acid sequence marked in red. (B) Flow cytometry of NFAT-GFP expression by TCRs in (A). Data are representative plots from two independent experiments. Figure 2.6. TCRs exhibit a broad range of reactivity to OVA peptide. (A) Summary of sensitivity to OVA-peptide for 9 TCRs including DO11. Sensitivity to OVA-peptide was determined using an NFAT-GFP hybridoma as discussed in Figure 7A. (B) Flow cytometric plots of NFAT-GFP expression by hybridoma cells expressing OVA-reactive TCRs in (A) after stimulation with Flt3L-induced DCs and 1 mm OVA peptide. (C) Expression levels of retrovirally transduced TCRs on hybridoma cells. Data are representative from three independent experiments. 29
39 Figure 2.7. In vitro and in vivo analysis of OVA-reactive TCRs (A) In vitro assessment of TCR sensitivity to OVA peptide. NFAT-GFP reporter hybridomas expressing each of 9 TCRs, including DO11 (red), was generated via retroviral transduction of TCRα chains, and tested against a range of OVA peptide concentrations presented by Flt3L induced dendritic cells. Data shown are the frequency of NFAT-GFP + cells normalized to that of αcd3 antibody treated cells for each hybridoma line. Data are representative of three independent experiments. (B) In vivo assessment of thymic Treg cell development. Double-negative (DN) thymocytes from Foxp3 gfp Rag1 / were retrovirally transduced with each OVA-specific TCR and transferred into the thymus of wild-type mice, and analyzed for Treg cell generation 14- days post transfer. Data are representative of 3-4 mice for each TCR from at 2 independent experiments. 30


40 Figure 2.1. Hypothetical models on the relationship between thresholds for thymic Treg cell selection and peripheral tolerance and immunity. 31

41 RIP-mOVA RIP-mOVA + no peptide OVA no peptide OVA Foxp3 Foxp3 + Foxp3 Foxp3 + Foxp3 Foxp3 + Foxp3 Foxp3 + Expt Expt Expt Expt Total No. Sequences Figure 2.2. TCR sequencing of OVA peptide-reactive T cells 32

42 Figure 2.3. Selection of possible OVA peptide-reactive TCRs using repertoire analysis 33

43 Figure 2.4. Confirmation of OVA peptide-reactivity 34

44 Vα2 Figure 2.5. Screening of TRAJ21 containing TCRs 35

45 Figure 2.6. TCRs exhibit a broad range of reactivity to OVA peptide. 36

46 Figure 2.7. In vitro and in vivo analysis of OVA-reactive TCRs 37
47 Chapter 2.2 A role of TCR affinity in thymic tolerance mechanisms and self-reactive peripheral immune response Results TCR affinity is a primary determinant for thymic Treg cell development To avoid the complication of OVA-independent Treg cell generation, I decided to focus on the 6 TCRs, including DO11, which did not facilitate thymic Treg cell development in wild-type mice. The differences between the 5 TCRs are only in the CDR3 amino acid sequence, as all of these TCRs use the same TRAV14-3*01 subtype. Because measurement of OVA reactivity so far was based a single readout using the NFAT-GFP reporter, I sought to expand the analysis of functional responses to TCR stimulation. I utilized another marker, NF-κB-GFP, which was introduced into the same parent hybridoma line used by NFAT-GFP [66]. Since this parent hybridoma line produced little IL-2, I tested IL-2 production after re-expressing these TCRs in a different TCR-deficient hybridoma line, 5KC [74]. Although the range of measured EC 50 s varied from ~50-5,000 fold depending on the assay, the ordering of TCRs in terms of efficiency of OVA recognition remained mostly constant (Figure 2.8A, Table 2.1). Since TCR signaling may differ between hybridoma cells and primary T cells, I also assessed peptide reactivity using thymocytes and peripheral T cells. T cells expressing individual OVA peptide-reactive TCRs were generated using retroviral bone marrow chimeras using Rag1 / donors. The EC 50 for each TCR was determined in vitro 38
48 by assessing down-regulation of co-receptors CD4 and CD8 on CD4 + CD8 + (double positive, DP) thymocytes, CD25 upregulation on CD4 + CD8 (CD4 single positive, CD4SP) thymocytes, and proliferation of peripheral CD4 + T cells (Figure 2.8B). Similar to the results obtained using hybridoma assays, the OVA-specific TCRs showed a broad range of sensitivity such that the least reactive TCR P1 was ~300-6,000 folds less efficient than DO11.10 at recognizing OVA (Table 2.1). Thus, the data from 6 different hybridoma and primary T cell assays agree that these 6 TCRs exhibit a broad range of sensitivity for OVA recognition. To estimate the TCR affinity for peptide:mhc, I measured the mean fluorescence intensity (MFI) of equilibrium tetramer binding, which provides a relative assessment of monomeric TCR:pMHC affinity [75-77]. Consistent with the functional assessment of OVA-reactivity, tetramer binding classified N7and R4 as higher affinity TCRs (Figure 2.8C) in comparison with N12, N13, and P1, which showed little to no binding. Although the latter 3 TCRs can elicit in vitro responses to OVA-peptide, these TCRs are below the affinity range that can be quantified using this tetramer binding assay. Thus, these tetramer data suggest that this panel of TCRs recognize OVA peptide:mhc with a broad range of affinities. I next assessed the ability of thymic OVA expression via RIP-mOVA to induce thymic Treg cell development using retroviral transduction of TCRs into Rag1 / thymocytes followed by intrathymic transfer as described above. As expected, DO11 facilitated thymic Treg cell development in the presence of RIP-mOVA [78]. Interestingly, all of the other TCRs except for P1, the lowest-affinity TCR, induced Treg cells to a degree that varied with the efficiency of OVA recognition (Figure 2.9 A,B). 39
49 Treg cell generation could even be detected in cells expressing the low affinity TCRs N12 and N13, which could not be reliably measured by equilibrium tetramer binding, and require ~1200 fold (average of responses in 6 assays between P1 and DO11 in Table 2.1) more antigen to achieve the same response in comparison to DO11. However, I was unable to observe Treg cells generated by P1, which is very close to N13 in its sensitivity to OVA. Although stochastic expression of RIP-mOVA in thymic mtec cells may contribute to mouse to mouse variability [79], differences between TCRs were readily observed. Thus, these data show that TCRs which are on average one hundred to one thousand fold less sensitive than DO11 can generate thymic Treg cells, demonstrating that Treg cell differentiation can occur within a broad range of self-reactivity. Linear regression analyses for all assays revealed that the ability of TCRs to facilitate Treg cell generation is directly proportion to their affinity for OVA peptide as provided by RIP-mOVA (Figure 2.9C). The efficiency of self-recognition was also directly correlated with the generation of Foxp3 CD25 + cells (Figure 2.9D,E), consistent with the proposal that the process of thymic Treg cell generation occurs via TCRdependent generation of Foxp3 Treg precursor cells [52]. Thus, these data demonstrate that the degree of self-recognition is the primary determinant for Treg cell differentiation in the thymus. Treg cell selection niche is dependent on TCR affinity for self-antigen Thymic Treg cell selection utilizes a small "niche" based on the observation of intraclonal competition in studies of transgenic mice using naturally arising Treg TCRs [39, 40]. Since the natural ligands for these Treg TCRs are unknown, the factors that 40
50 affect this developmental niche are unknown. I therefore asked whether affinity to selfantigen affects the size of the Treg cell developmental niche. Since the intrathymic transfer of retrovirally transduced thymocytes does not assess Treg cell generation at steady state, I decided to analyze retroviral bone marrow chimeras using the two highest affinity TCRs along with DO11. Various ratios of congenically marked wild-type bone marrow was added to achieve varying clonal frequencies. I confirmed that these OVAreactive TCRs did not facilitate Treg cell generation in wild-type mice, even at low clonal frequencies (Figure 2.10A). Consistent with previous reports [39, 40], I observed that Treg cell development with all 3 TCRs was inversely correlated with clonal frequency in the presence of OVA peptide presentation (Figure 2.4A). Moreover, the efficiency of Treg cell generation was directly correlated with affinity, as evidenced by the ability of higher affinity TCRs to generate a higher frequency of Treg cells at a given clonal frequency (Figure 2.10B). The affinity of the TCR also correlated with the absolute number of Treg cells that are generated in the thymus, implying that higher affinity TCRs have a larger niche size for thymic Treg cell development (Figure 2.10C,D). Since the amount of antigen generated by the RIP-mOVA transgene should be equal between different bone marrow chimeras, I hypothesize that niche size in this case represents the number of APCs that present sufficient antigen to trigger Treg cell selection for a given TCR affinity. Threshold for negative selection Some studies using TCR transgenic models have reported negative selection to be coincident with Treg cell generation [32, 61], whereas other studies have suggested that 41
51 Treg cell selection may occur without obvious negative selection [39]. Thus, the level of self-reactivity requwered to elicit Treg cell differentiation versus negative selection remains poorly defined. An interesting observation from our studies of clonal frequency and Treg cell development was that the frequency of Treg cells using the higher affinity TCRs, DO11 and N7, actually Int down again at clonal frequencies below 0.1% (red box, Figure 2.10A). This was not apparent for the intermediate affinity TCR R4, nor for other TCRs tested in previous reports [39], although it remains possible that this could be observed if loir clonal frequencies could be achieved experimentally. One possible explanation for this observation is that TCRs with high affinity to antigen can induce negative selection rather than Treg cell differentation at low clonal frequencies. In this case, the remaining Foxp3 CD4SP cells have presumably have not yet encountered antigen. To test the hypothesis that negative selection to RIP-mOVA occurs with T cells expressing TCRs N7 and DO11, but not R4, I assessed whether purified CD4SP thymocytes from retroviral bone marrow chimeras in wild-type hosts would be deleted after intrathymic transfer into RIP-mOVA + recipients. At day 3 post-transfer, I observed that the relative ratio of thymocytes expressing the higher affinity TCRs DO11 and N7, but not R4, to the co-injected polyclonal thymocytes Were decreased in RIP-mOVA hosts, indicative of negative selection (Figure 2.11). Consistent with previous reports [63], these data suggest that the propensity to induce Treg cell differentiation does not always rescue the cells from negative selection. Since R4 is approximately 15-fold (average of 6 assays, Table 2.1) less efficient at recognizing OVA than DO11, these data 42
52 suggest that detectable negative selection occurs at a substantially higher affinity threshold than Treg cell selection. Differential affinity thresholds for thymic Treg cell development and peripheral responses to self These studies in the thymus suggest that a broad range of TCR affinity can elicit Treg cell development, albeit at varying degrees. As the affinity for self-antigen decreases, the percentage of Foxp3 conventional T cells emigrating from the thymus increases. Thus, understanding the relationship between the range of affinities that facilitate thymic Treg cell generation versus peripheral responses is important for clarifying the how self-reactive Treg cells may mediate self-tolerance in the periphery. To address this question, I adoptively transferred peripheral Foxp3 CD4 T cells bearing OVA-reactive TCRs into sub-lethally irradiated RIP-mOVA recipients, as no proliferative responses were observed in non-irradiated mice. Intriguingly, the intermediate affinity TCR R4 or low affinity TCR N12 did not respond to OVA in vivo under these conditions (Figure 2.12 A, B). By contrast, the higher affinity TCRs DO11 and N7 induced peripheral expansion of Foxp3 cells as well as a small amount of Treg cell differentiation (Figure 2.12 A, B). Consistent with previous observations [80], peripheral Treg cell generation occurred on cells with less proliferation (Figure 2.12 C). Interestingly, the affinity threshold for response to this peripheral self-antigen is similar to that of thymic negative selection, whereas the threshold for thymic Treg cell development is almost 100 fold lower (average R4 versus P1 sensitivity to OVA, Table 2.1). Thus, these data suggest a model where thymic Treg cell differentiation is tuned 43
53 such that T cells with sufficient self-reactivity to elicit peripheral immune responses cannot wholly escape the thymus as effector cells, and will always be accompanied by thymically generated Treg cells (Figure 2.1C). 44
54 Figure Legends Figure 2.8. Defining efficiency of OVA recognition using hybridoma and primary T cells. (A) Hybridoma assays. Hybridoma cells expressing OVA-specific TCRs were assessed for NF-κB-GFP expression (left) and IL-2 production (right) in response to varying amounts of OVA peptide presented by TA3 APCs. (B) Assays of TCR reactivity using primary thymocytes and peripheral T cells. T cells were obtained from retroviral bone marrow chimeras using wild-type hosts. DP thymocytes were assessed for downregulation of CD4 and CD8 coreceptors in response to Flt3L DCs and varying concentrations of OVA peptide (left). CD4SP thymocytes were tested for CD25 upregulation (middle). Finally, peripheral CD4 + T cells were tested for in vitro proliferation (right). Non-linear regression analysis and calculation of EC 50 was performed as per Figure 7a, and summarized in Table 2.1 as EC 50. Graphs shown are representative of three independent experiments. (C) Binding of OVA:I-A d tetramer to hybridoma cells expressing OVA-reactive TCRs. Representative plots are shown on the left, and summarized on the right (mean ± s.d., n=3 independent experiments). 3K:I-A b tetramer was used as a control. Figure 2.9. Thymic Treg cell generation is instructed by the level of TCR reactivity to self-antigen. (A) Flow cytometry of Treg cell generation by OVA-reactive TCRs in the presence of RIP-mOVA. Retrovirally transduced Rag1 / DN cells were transferred into thymus of RIP-mOVA mice, and were analyzed at 2 weeks as in Figure 2.7 B. (B) Data 45
55 in (A) are summarized, with each dot representing the frequency (left) and absolute number (right) of Foxp3 + cells from an individual recipient. The plot in the middle shows the mean Foxp3 + percentage (± S.E.M.) correlated with the Log(EC 50 ) of the TCR for NFAT-GFP activation as compared with DO11. Foxp3 + cells were not detected (n.d.) with the P1 TCR. (C) Correlation of Treg cell generation with in vitro sensitivity to OVA. To determine whether TCR affinity is directly correlated with the efficiency of Treg cell selection in vivo, I plotted the in vivo efficiency of Treg cell generation versus the Log(EC 50 ) of the TCR as compared with DO11, and analyzed it by linear regression. For tetramer binding, I used the Log(MFI) as compared with DO11. Each symbol represents an individual TCR indicated in the legend. (D) The frequency of Foxp3 CD25 hi CD4SP cells in the experiments described in (A) are shown (mean ± s.d., 5 independent experiments). (E) Correlation of Foxp3 CD25 hi CD4SP cells with sensitivity of TCR to OVA peptide. Frequencies of Foxp3 - CD25 hi cells shown in (D) were plotted as per (C). Figure A role for TCR affinity in the thymic Treg cell selection niche (A) Inverse relationship between clonal frequency and thymic Treg cell development. Thymic Treg cell development was assessed in mixed bone marrow chimeras with varying ratios of wild-type to retrovirally transduced bone marrow. Data shown are the percentage of Foxp3 + CD4SP cells versus the clonal frequency in the CD4SP subset for the indicated TCR. Each symbol represents data from an individual recipient from 2-3 independent experiments for each TCR. Data points in the dashed red boxes fall outside of the previously described inverse relationship. (B) Data from the 46
56 experiment shown in (A) are plotted log-log to illustrate the similar slopes, with differences in the intercept. Note that the points in the red boxes are not shown in this plot. (C) Absolute numbers of Treg cells from the data shown in (B) are plotted versus clonal frequency. (D) Correlation of Treg cell selection niche size to TCR affinity. The number of Foxp3 + cells was analyzed by linear regression with OVA-reactivity measured by NFAT activation (left) and tetramer binding (right) as per Figure 2.9. Each symbol represents an individual TCR as indicated in the legend. Figure Treg cell development coincident with negative selection by high affinity TCRs (A) Assessment of negative selection of CD4SP thymocytes. OVA-reactive CD4SP thymocytes and Cell-tracker violet labeled WT cells were intrathymically injected into wild-type and RIP-mOVA mice. Flow cytometry was performed 3 days later. Representative FACS plots are shown discriminating the injected wild-type and OVA-specific CD4SP cells marked as blue numbers (left), and the TCR transduced population (right). No Treg cells were observed in wild-type recipients for all TCRs tested (not shown). (B) Negative selection as assessed by the ratio of OVA-specific CD4SP cells to WT cells added as an injection control. Each dot represents an individual recipient, with 2 independent experiments per TCR. Statistical differences were accessed by unpaired t test. (C) Summary of negative selection experiment in (B). The percent difference in the mean values from wild-type hosts compared with RIP-mOVA hosts is shown for each TCR. 47
57 Figure High affinity TCR recognition of peripheral self-antigen is required to elicit peripheral T cell responses. (A) Assessment of peripheral T cells responses. Naïve peripheral Foxp3 CD4 + T cells were intravenously transferred into sublethally irradiated RIP-mOVA hosts. Preliminary experiments did not reveal proliferation in non-irradiated hosts. Representative flow cytometry plots are shown of the transferred splenic T cells after 14 days to determine proliferation via dilution of cell-tracker violet dye. (B) Summaries of frequencies of proliferated (left) and Foxp3 + (right) cells see gating in (A). Each dot represents data from a single recipient, with 2 independent experiments per TCR. (C) Peripheral conversion is inversely correlated with proliferation. Dilution of cell-tracker violet is shown for Foxp3 + (dark line) and Foxp3 (grey shading) cells. 48
58 Clone CDR3 a.a Sequence NFAT NFκB IL-2 CD4/8 CD25 on CD4 T cell Tetramer binding activation activation production on DP CD4SP proliferation Thymic Selection DO AASPNYNVLY Neg./Treg N7 AACPNYNVLY -0.2± ± ± ± ± ± ±0.03 Neg./Treg R4 AAVPNYNVLY -1.2± ± ± ± ± ± ±0.04 Treg N12 ATTPNYNVLY -2.6± ± ± ± ± ± ±0.05 Treg N13 AASKNYNVLY -3.5± ± ± ± ± ± ±0.04 Treg P1 AAPPNYNVLY -3.7± ± ± ± ± ± ±0.05 Tconv The relative sensitivity of OVA recognition is shown as the difference of Log (EC 50 ) from that of DO11. The relative affinities of TCRs are shown as the difference of Log (MFI) from that of DO11. Data shown are mean ± s.e.m. (n=3). Thymic selection is based on in vivo assays presented throughout the paper. Neg., negative selection. Treg, Treg cell selection is observed. Table 2.1. Summary of assessments of TCR reactivity 49


59 Figure 2.8. Defining efficiency of OVA recognition using hybridoma and primary T cells 50


60 Figure 2.9. Thymic Treg cell generation is instructed by the level of TCR reactivity to self-antigen. 51


61 Figure A role for TCR affinity in the thymic Treg cell selection niche 52


62 Figure Treg cell development coincident with negative selection by high affinity TCRs 53


63 C Figure High affinity TCR recognition of peripheral self-antigen is required to elicit peripheral T cell responses. 54
64 Discussion Although previous studies provided proof of principle that self-reactivity is an important factor for thymic Treg cell differentiation and negative selection, there was little sense of how much self-reactivity is required at low clonal frequencies. Quantification of the relationship between self-reactivity and thymic Treg cell selection is important for understanding how thymic Treg cells may provide tolerance in the periphery. A high threshold of self-reactivity for Treg cell differentiation [63] would predict that many low-affinity self-reactive T cells would escape the thymus as effector cells, relying primarily on the presence of high affinity self-reactive Treg cells to provide tolerance. By contrast, a low threshold of self-reactivity for Treg cell differentiation would broaden the Treg cell repertoire such that it may almost approximate that of the effector cell repertoire [37], increasing the likelihood that thymic Treg cells will participate in not only immune responses to self, but also non-self antigens. Thus, understanding the relationship between self-reactivity and thymic education mechanisms would be useful to discriminate between these potential models for establishing selftolerance. I addressed this question by analyzing a panel of TCRs with different affinities for OVA peptide:mhc molecules for their in vivo response to the RIP-mOVA model antigen. While using a single antigen transgenic line has technical advantages as it should fix the amount and distribution of the antigen, another important consideration is that it models a tissue specific, rather than ubiquitous, antigen. Whereas T cell autoimmunity to ubiquitous antigens is not well described, tissue specific antigens are likely targets in a number of human autoimmune diseases such as Hashimoto s thyroiditis and type 1 55
65 diabetes. Thus, understanding tolerance to a model tissue specific antigen may be clinically relevant. These data suggests that tolerance mechanisms to tissue specific antigens expressed in the thymus are broad and robust. I was surprised to observe that Treg cell development to this model tissue-specific self-antigen still occurs with TCRs which are ~ 1000 fold less sensitive to OVA peptide in comparison with the reference TCR DO11, which represents a typical agonist interaction with foreign antigen. Although I did not perform a direct measurement of affinity, the steady state tetramer binding studies in conjunction with the broad range of functional assessments of TCR reactivity provide a clear estimate of relative affinity for this panel of TCRs compared with the DO11 TCR. It is interesting to contrast these results from analysis of negative selection of a CD8 + TCR, in which a narrow affinity range was observed [13]. Whether this is explained by differences in the assays used, or whether this reflects a fundamental difference between T cells at different stages of development or MHC restriction, will need to be clarified by future studies. None-the-less, in contrast with CD8 negative selection, the range of affinity that the immune system considers of sufficient self-reactivity to warrant thymic Treg cell generation is extremely broad. I also observed that the level of self-reactivity is directly correlated with the efficiency of thymic Treg cell generation. In fact, thymic Treg cell development appeared indistinguishable from any other in vitro or in vivo TCR-dependent process. These data therefore support the notion that one of the primary purposes of TCR activation this particular stage in development is Treg cell generation, which appears to 56
66 wane during T cell maturation [59, 81]. Thus, the TCR's autoimmune potential dictates its ability to generate thymic Treg cells. The relationship between TCR affinity and the efficiency of thymic Treg cell generation is also manifest in the apparent niche size, e.g. the number of Treg cells generated, even though the physical antigen niche is likely stable due to the use of single transgenic line to express OVA as self-antigen. This may arise via two possible mechanisms. One is that the stronger the TCR signal is interpreted in an analog manner increasing the likelihood that Foxp3 will be induced. Alternatively, the TCR signal is interpreted in a digital manner such that only APCs that present sufficient antigen can induce Foxp3 by exceeding a threshold of TCR signaling. Increased affinity would therefore expand the number of APCs that could generate sufficient TCR signals. Although direct evidences to test these hypotheses are required, the former model would predict that TCR affinity would affect the slope of Treg cell generation as clonal frequency decreases. Rather, I observed that TCR affinity shifted the entire curve with almost same slope, such that higher TCR affinities resulted in enhanced Treg cell generation at higher clonal frequencies, suggestive of a larger developmental niche. Moreover, a recent study of TCR activation using a Nur77-GFP reporter is consistent with a signaling threshold for Treg cell development [43]. Thus, I favor the interpretation that higher TCR affinity increases the number of APCs that can deliver a threshold level of TCR stimulation. Although the affinity of the TCR for self-antigen and the Treg cell niche size is directly correlated, this may only be true at higher clonal frequencies for TCRs with agonist level affinity for self-antigen. It appears that negative selection likely perturbs 57
67 this linear relationship at lower clonal frequencies, as T cells encountering self-antigen are often deleted instead of becoming Treg cells. While it has been difficult to quantify the role of intraclonal competition for negative selection, this may be expected based on studies of Treg cell development [39, 40] and positive selection [50]. The threshold of observable negative selection appears to be substantially higher than that of Treg cell differentiation. However, it must be noted that the sensitivity of detecting Foxp3 induction as determined by the induction of Foxp3 gfp is excellent, whereas measuring the loss of cells is comparatively insensitive. It may be possible that negative selection occurs at lower affinity, but cannot be measured. However, trace levels of negative selection is unlikely to have any impact on immune tolerance, as essentially the same number of self-reactive T cells escapes the thymus, whereas a small amount of Treg cell development may have a substantial impact due to the importance of Treg cells in dominant tolerance. Thymic Treg cell generation may be considered a window into how the immune system perceives the need to combat self-reactivity during development prior to the export of cells into the periphery. In comparison with thymic responses, I found that the TCR affinities requwered for peripheral T cell responses were much higher than that requwered for thymic Treg cell selection, and rather more similar to that requwered for negative selection. While these data wwell need to be validated for other model selfantigens, and if possible, true self-antigens if they can be genetically changed without affecting function, this suggests that the range of self-reactivity requwered for Treg cell selection is substantially below that requwered for peripheral T cell responses. 58
68 In summary, these data using a model tissue specific antigen suggest that the immune system utilizes straighforward rules for determining the thymic Treg cell population. Self-reactivity within a broad range, but above that for positive selection, selects for Treg cells in a graded manner depending on the extent of self-reactivity. Cognate, or agonist levels of self-reactivity also result in negative selection. In this manner, the immune system selects for a Treg cell population which is highly tuned towards high affinity self-antigen recognition while including some low affinity TCRs. Together with deletion of high affinity TCRs, these rules imprint the self-antigen repertoire on the Treg cell population. Interestingly, I found that incidental self-reactivity can also clearly generate Treg cells to foreign antigens, which is consistent with studies showing that a small fraction of cells binding to tetramers of foreign antigens are Treg cells [82]. Thus, self:non-self discrimination likely revolves around the quantitative bias of the TCRs amongst the Treg and naïve T cell population. These data clarify how self-reactivity in the CD4 + T cell subset is constrained by the immune system. Based on these data, I would predict that the bulk of the TCRs that cause autoimmune disease would be of higher affinity than R4, which is ~ 15 fold less sensitive than DO11. These TCRs are low enough affinity to avoid marked negative selection and incompletely drive thymic Treg cell selection, permiting the escape of selfreactive naïve T cells [16]. Under normal circumstances, it is difficult to imagine that these escaped self-reactive T cells could overcome the suppression by the thymic Treg cell population concomitantly generated in response to a broad range of self-reactivity. It seems that pro-inflammatory conditions that obviate or block Treg cell suppression would be requwered to release these potential autoimmune effector cells. Such an 59
69 inciting event is often not obvious in spontaneous human autoimmunity. One interesting future question is whether the B6 genotype studied here has an unusually low threshold for thymic Treg cell generation, as it is known to be resistant to spontaneous autoimmunity. Perhaps other autoimmune prone backgrounds wwell requwere a higher threshold of self-reactivity for thymic Treg cell generation. Alternatively, these robust thymic mechanisms may hint at the possibility that spontaneous autoimmunity may not result from a failure of central tolerance, but rather occurs to antigens that are poorly expressed in the thymus. For example, no indication was found in mixed bone marrow chimeras that the self-reactive TCR 2D2 induces thymic Treg cell generation even at low clonal frequencies (not shown), suggesting that the MOG-epitope is either not presented in the thymus or the affinity of the 2D2 TCR for MHC-MOG peptide complex is too low relative to the amount of thymic MOG-peptide. Future studies wwell be required to test the hypothesis that sponatneous autoimmunity is primarily a failure of peripheral tolerance. 60
70 Chapter 3 Rare development of thymic Treg cells at CD4 + CD8 + subset Introduction Natural CD4 + Foxp3 + Treg cells are essential for preventing autoimmunity [83]. Although peripheral generation of Treg cells has been demonstrated [84], recent studies suggest that the majority of peripheral Treg cells arise via thymic Treg cell development [33-35, 85]. One popular model for thymic Treg cell development is that Treg cells are selected based on TCR avidity for self-antigens at a level between positive and negative selection [61], which is supported by studies demonstrating that the thymic Treg and non- Treg TCR repertoires differ [33-35, 52]. Thus, TCR specificity for self-antigens appears to play an important role in Treg cell development. As the APCs encountered by thymocytes can differ substantially between certain steps in thymic development [86, 87], the stage at which self-reactive thymocytes become Treg cells may play an important role in determining the TCR repertoire of the natural Treg cell population. DP cells are typically found in the thymic cortex, in which the predominant APCs are cortical thymic epithelial cells (ctecs). By contrast, mature CD4SP cells are typically found in the medulla, where medullary thymic epithelial cells (mtecs) and bone marrow derived dendritic cells are commonly found. These different APC subsets appear to utilize different lysosomal proteases for antigen processing, as ctec use cathepsin L, whereas thymic dendritic cells and mtec dominantly use cathepsin S [53]. In addition, expression of the transcription factor Aire expands the array of tissue-specific antigens presented by mtecs [88], which may be important for 61
71 Treg cell selection [46]. These data therefore suggest that the antigenic environment likely differs for DP versus CD4SP cells. Several studies have demonstrated that Foxp3 + Treg cell lineage commitment can occur at the DP stage of thymic development. First, Foxp3 + DP cells can be found in TCR transgenic mice in which the T cells encounter their cognate antigen in the thymus [61, 89]. Second, ctec-restricted expression of MHC class II is sufficient to induce the generation of Foxp3 + T cells [55, 56]. Finally, analysis of Foxp3-knockin reporter mice revealed that Foxp3 + cells can be found in the DP subset [19, 57, 65, 90], which has been reported to represent precursors to Foxp3 + CD4SP cells [57]. The fraction of total Foxp3 + thymocytes in the DP stage ranges between ~5 30% depending on the gating scheme and report [57, 65]. Thus, a substantial fraction of Treg cells acquire Foxp3 expression at the DP stage of thymic development. I reasoned that the TCR repertoire of Foxp3 + DP cells would be different from that observed for Foxp3 + CD4SP cells [33-35] due to differences in antigen presentation at these stages of thymic development. However, highly purified populations of Foxp3 + DP cells could not be obtained by flow cytometric sorting. Here, I show that this difficulty arises primarily from Foxp3 + CD4SP:Foxp3 DP doublets being recognized as Foxp3 + DP cells. Thus, our data demonstrate that the proportion of Foxp3 + Treg cells in the DP stage is much lower than previously reported, and argue for a minor role for Foxp3-induction at the DP stage in the generation of the thymic Treg cell subset. 62
72 Materials and Methods 1. Mice Foxp3 gfp reporter mice was kindly provided by Dr. Alexander Rudensky [65]; MHC class II deficient mice [28] were purchased from the Jackson Laboratory (Bar Harbor, ME); and B6.SJL CD45.1 congenic mice were purchased from the National Cancer Institute (Frederick, MD). Mice were analyzed at 6-9 weeks of age, housed in specific pathogen-free facility at Washington University, and used under protocols approved by the Animals Studies Committee. 2. Flow cytometry and FACS cell sorting. Monoclonal antibodies were purchased from ebioscience (San Diego, CA) and Biolegend (San Diego, CA). Flow cytometric analysis and sorting were performed using a FACSAria (Becton Dickinson, San Jose, CA) and FlowJo software (Tree Star, Ashland, OR). For routine flow cytometry, thymocytes were stained at 40x10 6 /ml in Ca ++ /Mg ++ free DPBS supplemented with 2.5% FCS and 0.02% sodium azide for 20 minutes on ice. Free antibody was removed by washing after centrifugation. To reduce cell:cell interaction in certain experiments, I stained in the presence of 1mM EDTA at 4 C with constant rotation; and instead of washing after centrifugation, the cells were simply diluted 50 fold in PBS immediately prior to flow cytometry. To assess DNA content, thymocytes were stained with antibodies under the condition for routine flow cytometry, and fixed by 0.1% paraformaldehyde in DPBS for at least 2 hours. Fixed thymocytes were permeablized using 70% ethanol for propidium iodide staining. 63
73 3. Neonatal bone marrow chimera. Bone marrow cells from Foxp3 gfp mice were T-cell depleted using AutoMACS magnetic bead removal of CD4 and CD8 labeled cells (Miltenyi Biotech, Auburn, CA). Ten million bone marrow cells were intraperitoneally injected into 2-day old mice. 64
74 Results Flow cytometric analysis of Foxp3 + DP thymocytes Previous studies have demonstrated Foxp3 + DP cells in both TCR transgenic and polyclonal settings [55, 56, 65, 90], with up to ~30% of Foxp3 + thymocytes reported to be present in the DP subset [57]. I reasoned that Foxp3 + DP and CD4SP cells may represent Treg cells selected on different arrays of peptide:mhc class II complexes presented on cortical versus medullary APCs, which could be revealed by a comparison of the TCR repertoires between DP and CD4SP Foxp3 + cells. However, initial attempts to purify Foxp3 + DP cells by our usual flow cytometric sorting parameters were hampered by low purity in the 40-60% range (Figure 3.1). Even double FACS purification did not result in a high purity sort (data not shown). This did not appear to be a mechanical limitation of the sorter, as Foxp3 + CD8SP cells could be sorted with reasonable purity, even though they are at comparable frequency to Foxp3 + DP cells. Post-sort analysis of Foxp3 + DP cells showed that a large portion of the contaminants were Foxp3 DP cells (Figure 3.1). This was expected since Foxp3 DP cells are by far the most frequent cell-type in the thymus. Surprisingly, many of the contaminants were Foxp3 + CD4SP cells. Since these cells represent only ~0.3% of total thymocytes, this suggested that contamination was occurring in a non-random fashion. Because these contaminants Were present at a 1:1 ratio (Figure 3.1, bottom), this hinted at the possibility that many of the Foxp3 + DP cells recognized by flow cytometry may represent doublets of Foxp3 DP and Foxp3 + CD4SP cells. To test this hypothesis, I performed additional flow cytometric analysis of Foxp3 + DP cells. An appreciable frequency of Foxp3 + in the DP subset was only observed only 65
75 when generous forward scatter-area (FSC-A) and side scatter-area (SSC-A) gating parameters were used (Figure 3.2A, large gate). Area parameters are derived from the integration of height and width parameters (e.g. FSC-H and FSC-W) as the cell passes through the detector. However, I found that most Foxp3 + DP cells exhibited an exaggerated FSC-W compared to FSC-H. The same was true for SSC (data not shown). This traditionally implies that two cells serially passed the detector so close together that they could not be discriminated by the cytometer as individual cells. Rather, this event appears as a single large cell with increased FSC-A/SSC-A due to integration. Consistent with this interpretation, a smaller FSC/SSC gating scheme (small gate) decreased the frequency Foxp3 + cells in the DP subset by approximately 20 fold, and eliminated most of the doublets by FSC-H/FSC-W criteria (Figure 3.2A). Another interesting observation is that the MFI of CD4 is approximately two-fold greater on Foxp3 + DP cells compared with Foxp3 DP cells (Figure 3.3A). Taken together, these additional flow cytometric analyses support the notion that most Foxp3 + DP events are comprised of doublets. To assess whether doublet formation occurred in vitro during cell-surface labeling with fluorescent antibodies, I attempted to decrease cell-cell interactions by avoiding centrifugation and staining in the presence of 1mM EDTA. I found that the frequency of singlets in the large gate improved considerably, with a corresponding decrease in the frequency of DP cells in the Foxp3 + subset (Figure 3.3B, Figure 3.5B). Thus, these data suggest that the majority of doublets observed during routine cell staining and processing for flow cytometry occur ex vivo. To confirm the hypothesis that Foxp3 + DP events identified by routine flow cytometry are comprised of Foxp3 DP cells adhered with Foxp3 + CD4SP cells, I mixed 66
76 CD45.1 Foxp3 gfp thymocytes with CD45.2 Foxp3 WT thymocytes prior to staining and flow cytometry. While Foxp3 + CD4SP and Foxp3 + CD8SP cells appropriately expressed only CD45.1, CD45.2 staining was readily apparent on many Foxp3 + DP events (Figure 3.4A). Assuming that doublet formation was similar between CD45.1 and CD45.2 cells, this would imply that over 80% of Foxp3 + DP events identified under these conditions were comprised of doublets generated ex vivo. The efficiency of doublet formation in vitro was also dependent on cell concentration during staining (Figure 3.5). In addition, Foxp3 + flow cytometric events with high DNA content were preferentially found in the DP subset (Figure 3.6). Thus, these data directly demonstrate that doublets are formed ex vivo and are preferentially found in the Foxp3 + DP gate. Using this mixing assay to assess doublet formation, I then tested the efficiency of height by width parameters for doublet discrimination gating. I observed that the frequency of doublets markedly increased as the FSC-H size of the gate increases even if the FSC-W gating remains unchanged (Figure 3.4B, Figure 3.7). Furthermore, the increase in the frequency of Foxp3 + cells in the DP gate (Figure 3.4C) parallels the frequency of doublets associated with larger FSC-H gates (Figure 3.4B). Conversely, the frequency of Foxp3 + cells in the CD4SP subset decreases (Figure 3.4C). Thus, while doublet discrimination gating is useful to eliminate doublets which pass through the detector in series, it can be defeated by a generous FSC-H (and SSC-H) gate, thereby including doublets which pass through in parallel. Taken together, these data demonstrate that the frequency of DP cells in the Foxp3 + subset is substantially less than previously reported [57], representing approximately 1% of Foxp3 + thymocytes (Table 3.1). 67
77 Characterization of Foxp3 + DP thymocytes As it is unclear whether previous studies excluded doublets from the analysis of Foxp3 + DP events, I performed a flow cytometric characterization of Foxp3 + DP cells using a small gate. One observation was that the levels of CD4 and CD8 are lower than those found on typical Foxp3 DP cells (Figure 3.2, small gate), suggesting that Foxp3 + DP cells Were transitioning out of the DP stage after undergoing positive selection. This is consistent with the observation that Foxp3 + DP cells are TCR hi and express lower levels of HSA than Foxp3 DP cells (Figure 3.7). However, the HSA levels on Foxp3 + DP cells were higher than those on Foxp3 + CD4SP cells. In addition, Foxp3 + DP cells show higher level of CD69 expression than Foxp3 DP, indicating that Foxp3 + DP cells may have recently received a positively selecting TCR signal. In other respects, DP and CD4SP cells were similar, expressing Treg surface markers such as CD25, GITR, OX-40 and CD103 (Figure 3.8). Thus, these data suggest that Foxp3 + DP cells have undergone positive selection and express traditional Treg cell markers. Since most Foxp3 + thymocytes are presumably MHC class II restricted as most reside in the CD4SP subset, I asked whether Foxp3 + DP cells require MHC class II for their development. Consistent with a previous report [65], I observed a marked decrease in Foxp3 + CD4SP cells and a increase in Foxp3 + DP and CD8SP cells in Foxp3 gfp MHC class II deficient mice (Figure 3.9A). This was also reflected in an overall decrease in frequency of Foxp3 + thymocytes (Figure 3.9B). Curiously, many Foxp3 + DP cells in MHC class II-deficient mice in the large gate by FSC-A/SSC-A parameters show enhanced levels of CD8 compared to their counterpart in wild-type mice. Since these cells are not present when the small gate is used, they may represent doublets of Foxp3 + 68
78 DP or CD8SP cells with Foxp3 DP cells in MHC class II-deficient mice. Nonetheless, the presence of Foxp3 + CD4 lo CD8 lo DP cells in MHC class II-deficient mice suggest that Treg cell selection can occur on MHC class I. Developmental kinetics of Foxp3 + thymocytes A previous study of neonatal thymic development showed that Foxp3 + DP and CD4SP cells appeared coincidently [19]. Since this study examined development in a neonatal and potentially lymphopenic thymic setting, it was possible that the thymic medulla was not fully mature [91-93]. I therefore analyzed T cell development in lymphoreplete thymuses using neonatal bone marrow chimeras. It took approximately 2.5 weeks post transfer of congenically marked bone marrow cells to see appreciable numbers of developing donor thymocytes (Figure 3.10A). I did not observe a period in which DP cells contributed a substantial fraction to the total thymic Foxp3 + population (Figure 3.10B). Curiously, the frequency of Foxp3 + cells with the CD4SP subset increased over a period of approximately 1.5 weeks until it reached steady state, consistent with a delay in Foxp3 + cell development at the CD4SP stage (Figure 3.10C) observed in neonatal mice [19]. These data therefore illustrate that the temporal delay in the generation of Foxp3 + as compared with Foxp3 CD4SP cells does not result from conditions unique to the neonatal thymus. I also examined the kinetics of Foxp3 + Treg cell development in the CD4SP stage. Although this time course analysis cannot prove precursor:product relationships, it appears that Foxp3 + cells arise from the HSA hi CD4SP subset before downregulating HSA (Figure 3.10D). Furthermore, Foxp3 CD25 + CD4SP cells, which have been 69
79 suggested to be enriched in thymic Treg cell precursors [52], are found initially at much higher frequency than Foxp3 + cells, but decrease over time as the frequency of Foxp3 + correspondingly increases (Figure 3.10E). Although correlative, these data imply that Treg cell development occurs at the HSA hi CD4SP stage through a Foxp3 CD25 + intermediate. 70
80 Figure Legends Table 3.1. Summary of CD4/8 distribution of Foxp3 + thymocytes Data shown are the mean frequency of Foxp3 + thymocytes which fall into the DP, CD4SP, and CD8SP gates as per Figure 3.2. EDTA indicates whether 1mM EDTA and avoidance of centrifugation was used to diminish cell:cell interactions. Large and small gates represent those shown in Figure 3.2. Figure 3.1. Contaminants in sorted Foxp3 + DP thymocytes Foxp3 + DP thymocytes were sorted from Foxp3 gfp mice and analyzed by flow cytometry. Representative plots of two independent experiments are shown. Mean percentage (± S.D, n=2) of contaminants in sorted cells is derived from the post-sort gating scheme (%CD4SP x %Foxp3 + and %DP x %Foxp3 ). Figure 3.2. Most Foxp3 + DP events by flow cytometry appear to be doublets. (A) Flow cytometric analysis of Foxp3 + thymocytes. Thymocytes from Foxp3 gfp mice were stained using our normal protocol and analyzed by flow cytometry. The large (dotted line) and small (black line) gates use the area parameter, which is integrated based on the height and width of the signal from an individual event. FSC-H/FSC-W plots are shown on the right for the indicated Foxp3 + populations. Using these parameters, a doublet often appears to have a larger width than height, unless the doublet crosses the beam in tandem. Numbers in the FACS plots represents the frequency of the cells in the indicated gate. (B) Reduction in Foxp3 + DP events using EDTA and avoidance of 71
81 centrifugation. Thymocytes from Foxp3 gfp mouse were prepared as described in the Methods, and analyzed as above. Figure 3.3. Most Foxp3 + DP events are composed of doublets. (A) Foxp3 + DP events are two-fold brighter for CD4 than Foxp3 DP events. Thymocytes from Foxp3 gfp mouse were prepared as described in the Methods, and analyzed as per Figure 3.2. Mean fluorescence intensity (MFI) of CD4 is shown for events in the large gate above from 3 independent experiments (± S.D.). (B) Reduction in Foxp3 + DP events using EDTA and avoidance of centrifugation. Representative flow cytometric plots analogous to those in Figure 3.2 are shown. (C) Summary of singlet frequencies in Foxp3 + DP, CD4SP and CD8SP subsets using the large FSC-A/SSC-A gate above. Each dot represents data from an independent experiment. Figure 3.4. Doublets in the Foxp3 + DP thymocyte subset (A) Foxp3 + DP doublets are formed during staining. CD45.2 Foxp3 gfp thymocytes were mixed with CD45.1 Foxp3 WT thymocytes at 1:1 ratio, stained using the normal protocol, and analyzed by flow cytometry using a large FSC-A/SSC-A gate (see Figure 3.2). Data shown are gated on Foxp3 gfp+ cells and as indicated above the plots, and a representative of two independent experiments. The numbers represent the frequency of the cells in the quadrant. (B) Doublet discrimination gating is imperfect for eliminating doublets. Thymocytes in the large FSC-A/SSC-A gate as in (A) were further analyzed using gates with small FSC-W and different FSC-H for the frequency of CD CD doublets. Representative plots and quantification of doublets are shown 72
82 according to FSC-H value. (C) Frequency of Foxp3 + DP cells is proportional to doublet formation. The mean frequencies of DP and CD4SP in Foxp3 + thymocytes from each FSC-H gate are plotted. Figure 3.5. Increased cell concentration during staining enhances the frequency of Foxp3 gfp+ DP events. Thymocytes were stained as per Figure 3.4 at the indicated cell concentration and analyzed by flow cytometry. The mean percentages of Foxp3 gfp+ DP cells which are CD45.1 +, and the frequency of Foxp3 gfp+ cells which fall in the DP gate, are shown from 4 independent experiments (± S.D.). Figure 3.6. Frequency of Foxp3 + DP cells increases with DNA content. Thymocytes were fixed and stained for DNA content as described in the Material and Methods section. DNA content was assessed by flow cytometry of PI staining using a large FSC-A/SSC-A and Foxp3 + gate. Data shown are representative of 2 dependent experiments. Figure 3.7. Doublet-discrimination gating decreases the frequency of Foxp3 gfp+ DP events. Thymocytes were stained as per Figure 3.4 and analyzed by flow cytometry. The plot on the left was gated using a large FSC-A/SSC-A gate. On the right, the mean 73
83 percentages of CD CD doublets and DP subset in Foxp3 gfp+ cells in the indicated FSC-H/FSC-W gates are shown from 3 independent experiments (± S.D.). Figure 3.8. Foxp3 + DP and CD4SP cells express similar cell surface markers. Thymocytes from Foxp3 gfp mice were analyzed for cell surface expression of indicated markers on Foxp3 and Foxp3 + DP cells; and Foxp3 and Foxp3 + CD4SP cells as indicated using small FSC-A/SSC-A and doublet discrimination (width/height) gates as per Figure 3.2. Data are representative of 4 mice analyzed. Figure 3.9. Foxp3 + DP cells can be generated by MHC class I. (A) Development of Foxp3 + cells in MHC class II-deficient mice. Foxp3 + thymocytes from wild-type and MHC class II-deficient mice were analyzed using FSC- A/SSC-A large (dotted line) and small gates (black line). Plots shown are representative of three independent experiments. (B) Reduction of Foxp3 + thymocytes generation in the absence of MHC class II. The mean percentages of Foxp3 + in thymocytes from wild-type and MHC class II-deficient mice are shown. Figure Kinetics of thymic regulatory T cell development (A) Delay in generation of Foxp3 + cells in lymphoreplete thymuses. CD45.2 Foxp3 gfp T cell-depleted bone marrow cells were intraperitoneally injected into 2-day old CD45.1 neonates, and donor-derived thymocytes were analyzed by flow cytometry at the indicated age. Data shown are gated on DP or CD4SP cells, and are representative of 74
84 three independent experiments with at least two mice per time point. (B) Foxp3 + CD4SP and DP Treg cells are coincidentally observed. Mean percentage of cells in the various CD4/CD8 subsets amongst the Foxp3 + thymocyte population are plotted. At 2.5 weeks, too few Foxp3 + events were recorded to allow meaningful comparisons (N/A). (C) Summary of time course of Foxp3 + cell generation. The frequency of Foxp3 + cells within the DP or CD4SP subset is plotted with respect to time after bone marrow transfer. Data shown are mean ±S.D. (n = 3). (D) Appearance of HSA hi Foxp3 int cells during the initial wave of Treg cell development after bone marrow transfer. Data shown are representative flow cytometric plots gated on CD45.1 CD CD4SP cells. (E) Foxp3 CD25 + and Foxp3 + CD4SP cell frequencies are inversely correlated. Data shown are the mean ± S.D., n=3. 75
85 Large gate Small gate EDTA: + + CD8SP 3.1 ± ± ± ± 0.8 CD4SP 68.8 ± ± ± ± 1.2 DP 21.5 ± ± ± ± 0.2 Table 3.1. Summary of CD4/8 distribution of Foxp3 + thymocytes 76


86 Figure 3.1. Contaminants in sorted Foxp3 + DP thymocytes 77

87 Figure 3.2. Most Foxp3 + DP events by flow cytometry appear to be doublets. 78

88 Figure 3.3. Most Foxp3 + DP events are comprised of doublets. 79


89 Figure 3.4. Doublets in the Foxp3 + DP thymocyte subset 80

90 Figure 3.5. Increased cell concentration during staining enhances the frequency of Foxp3 gfp+ DP events. 81


91 Figure 3.6. Frequency of Foxp3 + DP cells increases with DNA content. 82


92 Figure 3.7. Doublet-discrimination gating decreases the frequency of Foxp3 gfp+ DP events. 83


93 Figure 3.8. Foxp3 + DP and CD4SP cells express similar cell surface markers. 84

94 Figure 3.9. Foxp3 + DP cells can be generated by MHC class I. 85


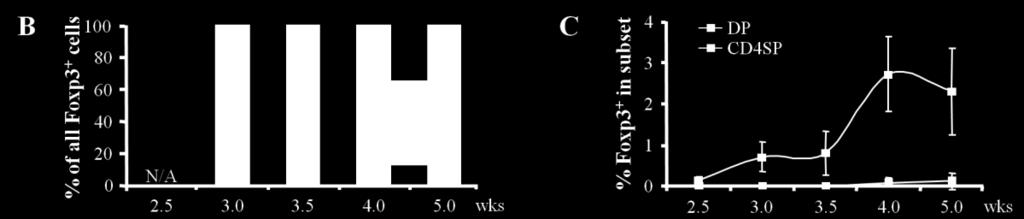


95 Figure Kinetics of thymic regulatory T cell development 86
T cell development October 28, Dan Stetson
 T cell development October 28, 2016 Dan Stetson stetson@uw.edu 441 Lecture #13 Slide 1 of 29 Three lectures on T cells (Chapters 8, 9) Part 1 (Today): T cell development in the thymus Chapter 8, pages
T Cell Development II: Positive and Negative Selection
 T Cell Development II: Positive and Negative Selection 8 88 The two phases of thymic development: - production of T cell receptors for antigen, by rearrangement of the TCR genes CD4 - selection of T cells
Antigen-specific peripheral shaping of the natural regulatory T cell population
 ARTICLE Antigen-specific peripheral shaping of the natural regulatory T cell population Stephanie K. Lathrop, 1 Nicole A. Santacruz, 1 Dominic Pham, 1 Jingqin Luo, 2 and Chyi-Song Hsieh 1 1 Department
CD4 + T cells recovered in Rag2 / recipient ( 10 5 ) Heart Lung Pancreas
 Heart Lung Pancreas") a CD4 + T cells recovered in Rag2 / recipient ( 1 5 ) Heart Lung Pancreas.5 1 2 4 6 2 4 6 Ctla4 +/+ Ctla4 / Ctla4 / Lung Ctla4 / Pancreas b Heart Lung Pancreas Ctla4 +/+ Ctla4 / Ctla4 / Lung Ctla4 / Pancreas
a CD4 + T cells recovered in Rag2 / recipient ( 1 5 ) Heart Lung Pancreas.5 1 2 4 6 2 4 6 Ctla4 +/+ Ctla4 / Ctla4 / Lung Ctla4 / Pancreas b Heart Lung Pancreas Ctla4 +/+ Ctla4 / Ctla4 / Lung Ctla4 / Pancreas
T Cell Differentiation
 T Cell Differentiation Ned Braunstein, MD MHC control of Immune Responsiveness: Concept Whether or not an individual makes an immune response to a particular antigen depends on what MHC alleles an individual
T Cell Development. Xuefang Cao, MD, PhD. November 3, 2015
 T Cell Development Xuefang Cao, MD, PhD November 3, 2015 Thymocytes in the cortex of the thymus Early thymocytes development Positive and negative selection Lineage commitment Exit from the thymus and
SUPPLEMENTARY INFORMATION
 Complete but curtailed T-cell response to very-low-affinity antigen Dietmar Zehn, Sarah Y. Lee & Michael J. Bevan Supp. Fig. 1: TCR chain usage among endogenous K b /Ova reactive T cells. C57BL/6 mice
SEVENTH EDITION CHAPTER
 Judy Owen Jenni Punt Sharon Stranford Kuby Immunology SEVENTH EDITION CHAPTER 16 Tolerance, Autoimmunity, and Transplantation Copyright 2013 by W. H. Freeman and Company Immune tolerance: history * Some
5/1/13. The proportion of thymus that produces T cells decreases with age. The cellular organization of the thymus
 T cell precursors migrate from the bone marrow via the blood to the thymus to mature 1 2 The cellular organization of the thymus The proportion of thymus that produces T cells decreases with age 3 4 1
MATERIALS AND METHODS. Neutralizing antibodies specific to mouse Dll1, Dll4, J1 and J2 were prepared as described. 1,2 All
 MATERIALS AND METHODS Antibodies (Abs), flow cytometry analysis and cell lines Neutralizing antibodies specific to mouse Dll1, Dll4, J1 and J2 were prepared as described. 1,2 All other antibodies used
The development of T cells in the thymus
 T cells rearrange their receptors in the thymus whereas B cells do so in the bone marrow. The development of T cells in the thymus The lobular/cellular organization of the thymus Immature cells are called
Attribution: University of Michigan Medical School, Department of Microbiology and Immunology
 Attribution: University of Michigan Medical School, Department of Microbiology and Immunology License: Unless otherwise noted, this material is made available under the terms of the Creative Commons Attribution
T cell maturation. T-cell Maturation. What allows T cell maturation?
 T-cell Maturation What allows T cell maturation? Direct contact with thymic epithelial cells Influence of thymic hormones Growth factors (cytokines, CSF) T cell maturation T cell progenitor DN DP SP 2ry
Supplementary Materials for
 www.sciencesignaling.org/cgi/content/full/3/114/ra23/dc1 Supplementary Materials for Regulation of Zap70 Expression During Thymocyte Development Enables Temporal Separation of CD4 and CD8 Repertoire Selection
Guarding the immune system: Suppression of autoimmunity by CD4 1 CD25 1 immunoregulatory T cells
 Immunology and Cell Biology (2006) 84, 487 501 doi:10.1111/j.1440-1711.2006.01471.x Review Article Guarding the immune system: Suppression of autoimmunity by CD4 1 CD25 1 immunoregulatory T cells TRICIA
Adaptive immune responses: T cell-mediated immunity
 MICR2209 Adaptive immune responses: T cell-mediated immunity Dr Allison Imrie allison.imrie@uwa.edu.au 1 Synopsis: In this lecture we will discuss the T-cell mediated immune response, how it is activated,
Supplementary Figure 1 Cytokine receptors on developing thymocytes that can potentially signal Runx3d expression.
 Supplementary Figure 1 Cytokine receptors on developing thymocytes that can potentially signal Runx3d expression. (a) Characterization of c-independent SP8 cells. Stainings for maturation markers (top)
Development of B and T lymphocytes
 Development of B and T lymphocytes What will we discuss today? B-cell development T-cell development B- cell development overview Stem cell In periphery Pro-B cell Pre-B cell Immature B cell Mature B cell
SUPPLEMENTARY INFORMATION
 Supplemental Figure 1. Furin is efficiently deleted in CD4 + and CD8 + T cells. a, Western blot for furin and actin proteins in CD4cre-fur f/f and fur f/f Th1 cells. Wild-type and furin-deficient CD4 +
Immunological Tolerance
 Immunological Tolerance Introduction Definition: Unresponsiveness to an antigen that is induced by exposure to that antigen Tolerogen = tolerogenic antigen = antigen that induces tolerance Important for
Lecture outline. Immunological tolerance and immune regulation. Central and peripheral tolerance. Inhibitory receptors of T cells. Regulatory T cells
 1 Immunological tolerance and immune regulation Abul K. Abbas UCSF 2 Lecture outline Central and peripheral tolerance Inhibitory receptors of T cells Regulatory T cells 1 The immunological equilibrium:
Central tolerance. Mechanisms of Immune Tolerance. Regulation of the T cell response
 Immunoregulation: A balance between activation and suppression that achieves an efficient immune response without damaging the host. Mechanisms of Immune Tolerance ACTIVATION (immunity) SUPPRESSION (tolerance)
Mechanisms of Immune Tolerance
 Immunoregulation: A balance between activation and suppression that achieves an efficient immune response without damaging the host. ACTIVATION (immunity) SUPPRESSION (tolerance) Autoimmunity Immunodeficiency
Introduction. Introduction. Lymphocyte development (maturation)
") Introduction Abbas Chapter 8: Lymphocyte Development and the Rearrangement and Expression of Antigen Receptor Genes Christina Ciaccio, MD Children s Mercy Hospital January 5, 2009 Lymphocyte development
Introduction Abbas Chapter 8: Lymphocyte Development and the Rearrangement and Expression of Antigen Receptor Genes Christina Ciaccio, MD Children s Mercy Hospital January 5, 2009 Lymphocyte development
Nature Immunology: doi: /ni Supplementary Figure 1. DNA-methylation machinery is essential for silencing of Cd4 in cytotoxic T cells.
 Supplementary Figure 1 DNA-methylation machinery is essential for silencing of Cd4 in cytotoxic T cells. (a) Scheme for the retroviral shrna screen. (b) Histogram showing CD4 expression (MFI) in WT cytotoxic
What determines the CD4:CD8 T cell ratio in the immune system?
 What determines the CD4:CD8 T cell ratio in the immune system? Insights from genetic and mathematical modelling of thymocyte development Benedict Seddon 1 Cell of the immune system 2 Maintaining homeostasis
Blocking antibodies and peptides. Rat anti-mouse PD-1 (29F.1A12, rat IgG2a, k), PD-
, PD-") Supplementary Methods Blocking antibodies and peptides. Rat anti-mouse PD-1 (29F.1A12, rat IgG2a, k), PD- L1 (10F.9G2, rat IgG2b, k), and PD-L2 (3.2, mouse IgG1) have been described (24). Anti-CTLA-4 (clone
Supplementary Methods Blocking antibodies and peptides. Rat anti-mouse PD-1 (29F.1A12, rat IgG2a, k), PD- L1 (10F.9G2, rat IgG2b, k), and PD-L2 (3.2, mouse IgG1) have been described (24). Anti-CTLA-4 (clone
Nuclear Export of Histone Deacetylase 7 During Thymic Selection is required for Immune Self-tolerance
 The EMBO Journal Peer Review Process File - EMBO-2012-80891 Manuscript EMBO-2012-80891 Nuclear Export of Histone Deacetylase 7 During Thymic Selection is required for Immune Self-tolerance Herbert G Kasler,
CHAPTER 9 BIOLOGY OF THE T LYMPHOCYTE
 CHAPTER 9 BIOLOGY OF THE T LYMPHOCYTE Coico, R., Sunshine, G., (2009) Immunology : a short course, 6 th Ed., Wiley-Blackwell 1 CHAPTER 9 : Biology of The T Lymphocytes 1. 2. 3. 4. 5. 6. 7. Introduction
Supplemental Figure 1
 Supplemental Figure 1 1a 1c PD-1 MFI fold change 6 5 4 3 2 1 IL-1α IL-2 IL-4 IL-6 IL-1 IL-12 IL-13 IL-15 IL-17 IL-18 IL-21 IL-23 IFN-α Mut Human PD-1 promoter SBE-D 5 -GTCTG- -1.2kb SBE-P -CAGAC- -1.kb
Canberra, Australia). CD11c-DTR-OVA-GFP (B6.CD11c-OVA), B6.luc + and. Cancer Research Center, Germany). B6 or BALB/c.FoxP3-DTR-GFP mice were
. CD11c-DTR-OVA-GFP (B6.CD11c-OVA), B6.luc + and. Cancer Research Center, Germany). B6 or BALB/c.FoxP3-DTR-GFP mice were") Supplemental Materials and Methods Mice Female C57BL/6 (B6, I-E null, H-2 b ), BALB/c (H-2 d ) + ), FVB/N (H-2 q, I-E null, CD45.1 + ), and B6D2F1 (H-2 b/d ) mice were purchased from the Animal Resources
Supplemental Materials and Methods Mice Female C57BL/6 (B6, I-E null, H-2 b ), BALB/c (H-2 d ) + ), FVB/N (H-2 q, I-E null, CD45.1 + ), and B6D2F1 (H-2 b/d ) mice were purchased from the Animal Resources
Immune tolerance and the prevention of autoimmune diseases
 The Journal of Immunology Deficiency of the Src Homology Region 2 Domain-Containing Phosphatase 1 (SHP-1) Causes Enrichment of CD4 CD25 Regulatory T Cells 1 Jennifer D. Carter,* Gina M. Calabrese,* Makoto
Mst1 regulates integrin-dependent thymocyte trafficking and antigen recognition in the thymus
 Mst1 regulates integrin-dependent thymocyte trafficking and antigen recognition in the thymus Yoshihiro Ueda, Koko Katagiri, Takashi Tomiyama, Kaneki Yasuda, Katsuyoshi Habiro, Tomoya Katakai, Susumu Ikehara,
The Thymus as The Primary Site of T-cell Production
 The Thymus as The Primary Site of T-cell Production Thymus Histology Lobulated organ with outer cortex and inner medulla C M Ordered Microenvironments Support T-cell Development CD4-CD8- precursors CD4+CD8+
Self Tolerance and MHC Restriction. Dr. Issa Abu-Dayyeh
 Self Tolerance and MHC Restriction Dr. Issa Abu-Dayyeh How do we teach B and T cells not to recognise self antigens as dangerous? How do we restrict T cells to recognise only Ags presented on a self MHC
T Cell Receptor & T Cell Development
 T Cell Receptor & T Cell Development Questions for the next 2 lectures: How do you generate a diverse T cell population with functional TCR rearrangements? How do you generate a T cell population that
Supplemental Figure 1. Protein L
 Supplemental Figure 1 Protein L m19delta T m1928z T Suppl. Fig 1. Expression of CAR: B6-derived T cells were transduced with m19delta (left) and m1928z (right) to generate CAR T cells and transduction
Tolerance 2. Regulatory T cells; why tolerance fails. FOCiS. Lecture outline. Regulatory T cells. Regulatory T cells: functions and clinical relevance
 1 Tolerance 2. Regulatory T cells; why tolerance fails Abul K. Abbas UCSF FOCiS 2 Lecture outline Regulatory T cells: functions and clinical relevance Pathogenesis of autoimmunity: why selftolerance fails
Principles of Adaptive Immunity
 Principles of Adaptive Immunity Chapter 3 Parham Hans de Haard 17 th of May 2010 Agenda Recognition molecules of adaptive immune system Features adaptive immune system Immunoglobulins and T-cell receptors
FOCiS. Lecture outline. The immunological equilibrium: balancing lymphocyte activation and control. Immunological tolerance and immune regulation -- 1
 1 Immunological tolerance and immune regulation -- 1 Abul K. Abbas UCSF FOCiS 2 Lecture outline Principles of immune regulation Self-tolerance; mechanisms of central and peripheral tolerance Inhibitory
T cell recognition. Statistics & Dynamics of Functional Sensitivity
 T cell recognition Statistics & Dynamics of Functional Sensitivity C Molina-París LEEDS APPLIED MATHEMATICS G Lythe LEEDS APPLIED MATHEMATICS A K Sewell CARDIFF MEDICAL BIOCHEMISTRY & IMMUNOLOGY L Wooldridge
Tolerance 2. Regulatory T cells; why tolerance fails. Abul K. Abbas UCSF. FOCiS
 1 Tolerance 2. Regulatory T cells; why tolerance fails Abul K. Abbas UCSF FOCiS 2 Lecture outline Regulatory T cells: functions and clinical relevance Pathogenesis of autoimmunity: why selftolerance fails
1. Overview of Adaptive Immunity
 Chapter 17A: Adaptive Immunity Part I 1. Overview of Adaptive Immunity 2. T and B Cell Production 3. Antigens & Antigen Presentation 4. Helper T cells 1. Overview of Adaptive Immunity The Nature of Adaptive
Autoimmunity. Autoimmunity arises because of defects in central or peripheral tolerance of lymphocytes to selfantigens
 Autoimmunity Autoimmunity arises because of defects in central or peripheral tolerance of lymphocytes to selfantigens Autoimmune disease can be caused to primary defects in B cells, T cells and possibly
Phenotypical and Functional Analysis of Peripheral T Cells in Foxn1 Transgenic Mice: Effects of Aging
 Loyola University Chicago Loyola ecommons Master's Theses Theses and Dissertations 2010 Phenotypical and Functional Analysis of Peripheral T Cells in Foxn1 Transgenic Mice: Effects of Aging Paulette Krishack
Cell isolation. Spleen and lymph nodes (axillary, inguinal) were removed from mice
 were removed from mice") Supplementary Methods: Cell isolation. Spleen and lymph nodes (axillary, inguinal) were removed from mice and gently meshed in DMEM containing 10% FBS to prepare for single cell suspensions. CD4 + CD25
Supplementary Methods: Cell isolation. Spleen and lymph nodes (axillary, inguinal) were removed from mice and gently meshed in DMEM containing 10% FBS to prepare for single cell suspensions. CD4 + CD25
Supplementary Figure S1. PTPN2 levels are not altered in proliferating CD8+ T cells. Lymph node (LN) CD8+ T cells from C57BL/6 mice were stained with
 CD8+ T cells from C57BL/6 mice were stained with") Supplementary Figure S1. PTPN2 levels are not altered in proliferating CD8+ T cells. Lymph node (LN) CD8+ T cells from C57BL/6 mice were stained with CFSE and stimulated with plate-bound α-cd3ε (10µg/ml)
Supplementary Figure S1. PTPN2 levels are not altered in proliferating CD8+ T cells. Lymph node (LN) CD8+ T cells from C57BL/6 mice were stained with CFSE and stimulated with plate-bound α-cd3ε (10µg/ml)
Recommended reading: Abbas et al. 5th edition, chapters 7 and 10; Janeway and Travers, 5th edition, chapter 7.
 Harvard-MIT Division of Health Sciences and Technology HST.176: Cellular and Molecular Immunology Course Director: Dr. Shiv Pillai 10/05/05; 11 AM Shiv Pillai T Lymphocyte Development Recommended reading:
Immune Regulation and Tolerance
 Immune Regulation and Tolerance Immunoregulation: A balance between activation and suppression of effector cells to achieve an efficient immune response without damaging the host. Activation (immunity)
Tolerance, autoimmunity and the pathogenesis of immunemediated inflammatory diseases. Abul K. Abbas UCSF
 Tolerance, autoimmunity and the pathogenesis of immunemediated inflammatory diseases Abul K. Abbas UCSF Balancing lymphocyte activation and control Activation Effector T cells Tolerance Regulatory T cells
Supplementary Figure 1. Characterization of basophils after reconstitution of SCID mice
 Supplementary figure legends Supplementary Figure 1. Characterization of after reconstitution of SCID mice with CD4 + CD62L + T cells. (A-C) SCID mice (n = 6 / group) were reconstituted with 2 x 1 6 CD4
Cover Page. The handle holds various files of this Leiden University dissertation.
 Cover Page The handle http://hdl.handle.net/1887/23854 holds various files of this Leiden University dissertation. Author: Marel, Sander van der Title: Gene and cell therapy based treatment strategies
NK cell flow cytometric assay In vivo DC viability and migration assay
 NK cell flow cytometric assay 6 NK cells were purified, by negative selection with the NK Cell Isolation Kit (Miltenyi iotec), from spleen and lymph nodes of 6 RAG1KO mice, injected the day before with
CD44
 MR1-5-OP-RU CD24 CD24 CD44 MAIT cells 2.78 11.2 WT RORγt- GFP reporter 1 5 1 4 1 3 2.28 1 5 1 4 1 3 4.8 1.6 8.1 1 5 1 4 1 3 1 5 1 4 1 3 3.7 3.21 8.5 61.7 1 2 1 3 1 4 1 5 TCRβ 2 1 1 3 1 4 1 5 CD44 1 2 GFP
Overview B cell development T cell development
 Topics Overview B cell development T cell development Lymphocyte development overview (Cont) Receptor diversity is produced by gene rearrangement and is random Includes specificities that will bind to
SUPPLEMENTARY INFORMATION
 doi:1.138/nature1554 a TNF-α + in CD4 + cells [%] 1 GF SPF 6 b IL-1 + in CD4 + cells [%] 5 4 3 2 1 Supplementary Figure 1. Effect of microbiota on cytokine profiles of T cells in GALT. Frequencies of TNF-α
The Adaptive Immune Response. T-cells
 The Adaptive Immune Response T-cells T Lymphocytes T lymphocytes develop from precursors in the thymus. Mature T cells are found in the blood, where they constitute 60% to 70% of lymphocytes, and in T-cell
Supplementary Figure 1 CD4 + T cells from PKC-θ null mice are defective in NF-κB activation during T cell receptor signaling. CD4 + T cells were
 Supplementary Figure 1 CD4 + T cells from PKC-θ null mice are defective in NF-κB activation during T cell receptor signaling. CD4 + T cells were isolated from wild type (PKC-θ- WT) or PKC-θ null (PKC-θ-KO)
Examples of questions for Cellular Immunology/Cellular Biology and Immunology
 Examples of questions for Cellular Immunology/Cellular Biology and Immunology Each student gets a set of 6 questions, so that each set contains different types of questions and that the set of questions
Peli1 negatively regulates T-cell activation and prevents autoimmunity
 Peli1 negatively regulates T-cell activation and prevents autoimmunity Mikyoung Chang 1,*, Wei Jin 1,5,*, Jae-Hoon Chang 1, Yi-chuan Xiao 1, George Brittain 1, Jiayi Yu 1, Xiaofei Zhou 1, Yi-Hong Wang
Nature Immunology: doi: /ni Supplementary Figure 1
 Supplementary Figure 1 A β-strand positions consistently places the residues at CDR3β P6 and P7 within human and mouse TCR-peptide-MHC interfaces. (a) E8 TCR containing V β 13*06 carrying with an 11mer
Effector mechanisms of cell-mediated immunity: Properties of effector, memory and regulatory T cells
 ICI Basic Immunology course Effector mechanisms of cell-mediated immunity: Properties of effector, memory and regulatory T cells Abul K. Abbas, MD UCSF Stages in the development of T cell responses: induction
activation with anti-cd3/cd28 beads and 3d following transduction. Supplemental Figure 2 shows
 Supplemental Data Supplemental Figure 1 compares CXCR4 expression in untreated CD8 + T cells, following activation with anti-cd3/cd28 beads and 3d following transduction. Supplemental Figure 2 shows the
COURSE: Medical Microbiology, MBIM 650/720 - Fall TOPIC: Antigen Processing, MHC Restriction, & Role of Thymus Lecture 12
 COURSE: Medical Microbiology, MBIM 650/720 - Fall 2008 TOPIC: Antigen Processing, MHC Restriction, & Role of Thymus Lecture 12 FACULTY: Dr. Mayer Office: Bldg. #1, Rm B32 Phone: 733-3281 Email: MAYER@MED.SC.EDU
Microbiology 204. Background Slides on T Cell Development For Preparation for Flipped Classroom setting. Art Weiss.
 Microbiology 204 Background Slides on T Cell Development For Preparation for Flipped Classroom setting Art Weiss October 23, 2015 Thymic Lobule Structure From: Immunobiology, Janeway, et al., 5th edition
Nature Medicine: doi: /nm.3922
 Title: Glucocorticoid-induced tumor necrosis factor receptor-related protein co-stimulation facilitates tumor regression by inducing IL-9-producing helper T cells Authors: Il-Kyu Kim, Byung-Seok Kim, Choong-Hyun
Supplementary Data 1. Alanine substitutions and position variants of APNCYGNIPL. Applied in
 Supplementary Data 1. Alanine substitutions and position variants of APNCYGNIPL. Applied in Supplementary Fig. 2 Substitution Sequence Position variant Sequence original APNCYGNIPL original APNCYGNIPL
Chapter 11. B cell generation, Activation, and Differentiation. Pro-B cells. - B cells mature in the bone marrow.
 Chapter B cell generation, Activation, and Differentiation - B cells mature in the bone marrow. - B cells proceed through a number of distinct maturational stages: ) Pro-B cell ) Pre-B cell ) Immature
TITLE: MODULATION OF T CELL TOLERANCE IN A MURINE MODEL FOR IMMUNOTHERAPY OF PROSTATIC ADENOCARCINOMA
 AD Award Number: DAMD17-01-1-0085 TITLE: MODULATION OF T CELL TOLERANCE IN A MURINE MODEL FOR IMMUNOTHERAPY OF PROSTATIC ADENOCARCINOMA PRINCIPAL INVESTIGATOR: ARTHUR A HURWITZ, Ph.d. CONTRACTING ORGANIZATION:
Supplementary information. Characterization of c-maf + Foxp3 - Regulatory T Cells Induced by. Repeated Stimulation of Antigen-Presenting B Cells
 Chien 1 Supplementary information Manuscript: SREP-16-42480A Characterization of c-maf + Foxp3 - Regulatory T Cells Induced by Repeated Stimulation of Antigen-Presenting B Cells Chien-Hui Chien 1, Hui-Chieh
D CD8 T cell number (x10 6 )
") IFNγ Supplemental Figure 1. CD T cell number (x1 6 ) 18 15 1 9 6 3 CD CD T cells CD6L C CD5 CD T cells CD6L D CD8 T cell number (x1 6 ) 1 8 6 E CD CD8 T cells CD6L F Log(1)CFU/g Feces 1 8 6 p
IFNγ Supplemental Figure 1. CD T cell number (x1 6 ) 18 15 1 9 6 3 CD CD T cells CD6L C CD5 CD T cells CD6L D CD8 T cell number (x1 6 ) 1 8 6 E CD CD8 T cells CD6L F Log(1)CFU/g Feces 1 8 6 p
B220 CD4 CD8. Figure 1. Confocal Image of Sensitized HLN. Representative image of a sensitized HLN
 B220 CD4 CD8 Natarajan et al., unpublished data Figure 1. Confocal Image of Sensitized HLN. Representative image of a sensitized HLN showing B cell follicles and T cell areas. 20 µm thick. Image of magnification
Antigen capture and presentation to T lymphocytes
 Antigen capture and presentation to T lymphocytes What T lymphocytes see Innate Immunity Immediately available or Very broad specificity rapidly recruited Adaptive Immunity Rare and naïve cells require
T-cell activation T cells migrate to secondary lymphoid tissues where they interact with antigen, antigen-presenting cells, and other lymphocytes:
 Interactions between innate immunity & adaptive immunity What happens to T cells after they leave the thymus? Naïve T cells exit the thymus and enter the bloodstream. If they remain in the bloodstream,
B6.SJL (Ly5.2) mice were obtained from Taconic Farms. Rag1-deficient mice were
 mice were obtained from Taconic Farms. Rag1-deficient mice were") Supplementary Methods Mice. B6.SJL (Ly5.2) mice were obtained from Taconic Farms. Rag1-deficient mice were purchased from The Jackson Laboratory. Real-time PCR Total cellular RNA was extracted from the
Supplementary Methods Mice. B6.SJL (Ly5.2) mice were obtained from Taconic Farms. Rag1-deficient mice were purchased from The Jackson Laboratory. Real-time PCR Total cellular RNA was extracted from the
Page 4: Antigens: Self-Antigens The body has a vast number of its own antigens called self-antigens. These normally do not trigger immune responses.
 Common Characteristics of B and T Lymphocytes Graphics are used with permission of Pearson Education Inc., publishing as Benjamin Cummings (http://www.aw-bc.com). Page 1: Introduction While B and T lymphocytes
Immunobiology 7. The Humoral Immune Response
 Janeway Murphy Travers Walport Immunobiology 7 Chapter 9 The Humoral Immune Response Copyright Garland Science 2008 Tim Worbs Institute of Immunology Hannover Medical School 1 The course of a typical antibody
Primer on Tumor Immunology. International Society for Biological Therapy of Cancer. C. H. June, M.D. November 10, 2005
 Primer on Tumor Immunology International Society for Biological Therapy of Cancer C. H. June, M.D. November 10, 2005 Outline: Primer on Tumor Immunology T Cell Receptors T Cell Biology Tumor immunology
This is a free sample of content from Immune Tolerance. Click here for more information or to buy the book.
 A ACPAs. See Antibodies to citrullinated peptide antigens Activation-induced cell death (AICD), 25 AICD. See Activation-induced cell death AIRE, 3, 18 19, 24, 88, 103 104 AKT, 35 Alefacept, 136 ALPS. See
The Journal of Experimental Medicine
 Are Major Histocompatibility Complex Molecules Involved in the Survival of Naive CD4 T Cells? Isabelle Grandjean, 1 Livine Duban, 1 Elizabeth A. Bonney, 2,3 Erwan Corcuff, 4 James P. Di Santo, 4 Polly
Supplementary Figure 1. Example of gating strategy
 Supplementary Figure 1. Example of gating strategy Legend Supplementary Figure 1: First, gating is performed to include only single cells (singlets) (A) and CD3+ cells (B). After gating on the lymphocyte
CD90 + Human Dermal Stromal Cells Are Potent Inducers of FoxP3 + Regulatory T Cells
 CD90 + Human Dermal Stromal Cells Are Potent Inducers of FoxP3 + Regulatory T Cells Karin Pfisterer, Karoline M Lipnik, Erhard Hofer and Adelheid Elbe-Bürger Journal of Investigative Dermatology (2015)
Objectives. Abbas Chapter 11: Immunological Tolerance. Question 1. Question 2. Question 3. Definitions
 Objectives Abbas Chapter 11: Immunological Tolerance Christina Ciaccio, MD Children s Mercy Hospitals and Clinics February 1, 2010 To introduce the concept of immunologic tolerance To understand what factors
Supplemental Materials
 Supplemental Materials Programmed death one homolog maintains the pool size of regulatory T cells by promoting their differentiation and stability Qi Wang 1, Jianwei He 1, Dallas B. Flies 2, Liqun Luo
and follicular helper T cells is Egr2-dependent. (a) Diagrammatic representation of the
 Diagrammatic representation of the") Supplementary Figure 1. LAG3 + Treg-mediated regulation of germinal center B cells and follicular helper T cells is Egr2-dependent. (a) Diagrammatic representation of the experimental protocol for the
Supplementary Figure 1. LAG3 + Treg-mediated regulation of germinal center B cells and follicular helper T cells is Egr2-dependent. (a) Diagrammatic representation of the experimental protocol for the
Supplementary Figure 1. Efficient DC depletion in CD11c.DOG transgenic mice
 Supplementary Figure 1. Efficient DC depletion in CD11c.DOG transgenic mice (a) CD11c.DOG transgenic mice (tg) were treated with 8 ng/g body weight (b.w.) diphtheria toxin (DT) i.p. on day -1 and every
White Blood Cells (WBCs)
") YOUR ACTIVE IMMUNE DEFENSES 1 ADAPTIVE IMMUNE RESPONSE 2! Innate Immunity - invariant (generalized) - early, limited specificity - the first line of defense 1. Barriers - skin, tears 2. Phagocytes - neutrophils,
YOUR ACTIVE IMMUNE DEFENSES 1 ADAPTIVE IMMUNE RESPONSE 2! Innate Immunity - invariant (generalized) - early, limited specificity - the first line of defense 1. Barriers - skin, tears 2. Phagocytes - neutrophils,
How T cells recognize antigen: The T Cell Receptor (TCR) Identifying the TCR: Why was it so hard to do? Monoclonal antibody approach
 Identifying the TCR: Why was it so hard to do? Monoclonal antibody approach") How T cells recognize antigen: The T Cell Receptor (TCR) Identifying the TCR: Why was it so hard to do By the early 1980s, much about T cell function was known, but the receptor genes had not been identified
How T cells recognize antigen: The T Cell Receptor (TCR) Identifying the TCR: Why was it so hard to do By the early 1980s, much about T cell function was known, but the receptor genes had not been identified
A second type of TCR TCR: An αβ heterodimer
 How s recognize antigen: The T Cell Receptor (TCR) Identifying the TCR: Why was it so hard to do By the early 1980s, much about function was known, but the receptor genes had not been identified Recall
Nature Immunology: doi: /ni Supplementary Figure 1. Characteristics of SEs in T reg and T conv cells.
 Supplementary Figure 1 Characteristics of SEs in T reg and T conv cells. (a) Patterns of indicated transcription factor-binding at SEs and surrounding regions in T reg and T conv cells. Average normalized
The Bcl-2 regulated apoptotic pathway is critical for the
 The Journal of Immunology Defects in the Bcl-2 Regulated Apoptotic Pathway Lead to Preferential Increase of CD25 low Foxp3 + Anergic CD4 + T Cells Yifan Zhan,*, Yuxia Zhang,* Daniel Gray,* Emma M. Carrington,*
Chapter 11. B cell generation, Activation, and Differentiation. Pro-B cells. - B cells mature in the bone marrow.
 Chapter B cell generation, Activation, and Differentiation - B cells mature in the bone marrow. - B cells proceed through a number of distinct maturational stages: ) Pro-B cell ) Pre-B cell ) Immature
Determinants of Immunogenicity and Tolerance. Abul K. Abbas, MD Department of Pathology University of California San Francisco
 Determinants of Immunogenicity and Tolerance Abul K. Abbas, MD Department of Pathology University of California San Francisco EIP Symposium Feb 2016 Why do some people respond to therapeutic proteins?
Introduction to Immunology Part 2 September 30, Dan Stetson
 Introduction to Immunology Part 2 September 30, 2016 Dan Stetson stetson@uw.edu 441 Lecture #2 Slide 1 of 26 CLASS ANNOUNCEMENT PLEASE NO TREE NUTS IN CLASS!!! (Peanuts, walnuts, almonds, cashews, etc)
THE ROLE OF THE IL-2R BETA-MEDIATED CYTOKINE SIGNALING IN NATURAL REGULATORY T CELL DEVELOPMENT
 THE ROLE OF THE IL-2R BETA-MEDIATED CYTOKINE SIGNALING IN NATURAL REGULATORY T CELL DEVELOPMENT A DISSERTATION SUBMITTED TO THE FACULTY OF THE GRADUATE SCHOOL OF THE UNIVERSITY OF MINNESOTA BY Jianying
Immunology Lecture 4. Clinical Relevance of the Immune System
 Immunology Lecture 4 The Well Patient: How innate and adaptive immune responses maintain health - 13, pg 169-181, 191-195. Immune Deficiency - 15 Autoimmunity - 16 Transplantation - 17, pg 260-270 Tumor
SUPPLEMENTARY FIGURES
 SUPPLEMENTARY FIGURES Supplementary Figure 1: Chemokine receptor expression profiles of CCR6 + and CCR6 - CD4 + IL-17A +/ex and Treg cells. Quantitative PCR analysis of chemokine receptor transcript abundance
Supplementary Figure Legends. group) and analyzed for Siglec-G expression utilizing a monoclonal antibody to Siglec-G (clone SH2.1).
 and analyzed for Siglec-G expression utilizing a monoclonal antibody to Siglec-G (clone SH2.1).") Supplementary Figure Legends Supplemental Figure : Naïve T cells express Siglec-G. Splenocytes were isolated from WT B or Siglec-G -/- animals that have not been transplanted (n= per group) and analyzed
Supplementary Figure Legends Supplemental Figure : Naïve T cells express Siglec-G. Splenocytes were isolated from WT B or Siglec-G -/- animals that have not been transplanted (n= per group) and analyzed
Supplemental Table I.
 Supplemental Table I Male / Mean ± SEM n Mean ± SEM n Body weight, g 29.2±0.4 17 29.7±0.5 17 Total cholesterol, mg/dl 534.0±30.8 17 561.6±26.1 17 HDL-cholesterol, mg/dl 9.6±0.8 17 10.1±0.7 17 Triglycerides,