INDEX. Kingston General Hospital May Introduction Page 2. Cardiac Conduction System Page 3. Introduction to Cardiac Monitoring Page 5
|
|
|
- Toby Bennett
- 6 years ago
- Views:
Transcription
1
2 Kingston General Hospital May 2008 INDEX Introduction Page 2 Cardiac Conduction System Page 3 Introduction to Cardiac Monitoring Page 5 Recording Electrical Events Page 9 Waves of the ECG Complex Page 10 Intervals and Segments Page 16 Rhythm Regularity Page 22 Measurement of Heart Rate Page 23 Systematic Analysis of Rhythm Strips Page 25 Describing Rhythms Page 26 Normal Sinus Rhythm Page 27 Arrhythmias- Patient Assessment Page 28 Arrhythmias originating in the sinus node Page 29 Junctional Rhythms Page 33 Ventricular Rhythms Page 37 Atrial Arrhythmias Page 42 Atrio-ventricular blocks Page 45 Practice Strip Answers Page 52 References Page 56
3 INTRODUCTION The electrocardiogram (ECG or EKG) is a recording of the electrical activity of the heart. The heart has it s own electrical or conduction system. Normally the electrical signals are initiated and travel through the heart s conduction system in a specific order. This is accomplished by a process known as depolarization. The pathway receiving the electrical stimulus is negatively charged (polarized). It must be made positive so that the impulse can be conducted. This process is called depolarization. These cells later recharge or repolarize in preparation for receiving the next electrical impulse. As depolarization and repolarization occur, certain electrical signals are seen on the ECG. This learning guide will help you identify those signals on the ECG. The patient will be hooked up to an ECG monitor that is at the bedside (hardwire), or a battery operated system (telemetry). Telemetry(softwire) is a portable box that is worn by the patient, and the rhythm is displayed centrally at the nursing desk.
 node and travels to the right and left atria the atria depolarize and generate the p wave on the electrocardiogram the")
4 The heart has both electrical and mechanical properties. The electrical event occurs first followed by the mechanical event. Normal electrical conduction: the cardiac impulse begins in the sinoatrial (SA) node and travels to the right and left atria the atria depolarize and generate the p wave on the electrocardiogram the conduction then travels to the atrioventricular (AV) node where the conduction speed is reduced conduction then speeds up and travels down the Bundles of His, and the right and left bundle branches to the Purkinje fibers the Purkinje fibers distribute the impulse rapidly and uniformly and ultimately depolarize the ventricular myocardium- this generates the QRS wave on the electrocardiogram Mechanical Events: after the P wave is generated the atria contract. This contraction contributes 20% of the blood flow to the ventricle. This is called atrial kick after the QRS wave is generated the ventricles contract the reduction in depolarization speed at the AV node allows time after the atrial mechanical contraction for the ventricles to fill before they contract.
5 CARDIAC CONDUCTION SYSTEM Escape rhythms Automatic Cardiac Tissues There are different conduction tissues in the heart that can act as pacemakers and initiate the electrical sequence. These are: SA node, atrial tissues, AV node, and the ventricles. These tissues each have their own intrinsic or pre-set rate. Normally the SA node initiates the electrical sequence because it has the highest intrinsic rate. If the SA node cannot sustain this rate for some reason, the pacemaker with the next highest rate would then take over as the pacemaker of the heart. This is called an escape rhythm and is the heart s emergency pacing system. It is very uncommon to see an atrial escape rhythm, even though they are the next pacemaker in line. The AV node (junction) is the pacemaker that most often escapes when the SA node fails.
 to the patient s skin. Wires attached to a cable are snapped on to the electrodes. The cable is attached to the monitor.")
6 INTRODUCTION TO CARDIAC MONITORING The ECG monitor: The patient must be attached to a heart monitor in order to see the electrical signals from the heart. This is done by applying electrodes (sticky sensors) to the patient s skin. Wires attached to a cable are snapped on to the electrodes. The cable is attached to the monitor. A signal will now appear on the monitor. Monitoring Guidelines: 1) Electrodes: prepare skin- shave if required, cleanse with alcohol and abrade skin with backing on electrode electrodes will dry out over time: change if monitor signal is poor or patient is complaining of itchiness underneath electrode use new unopened package of electrodes each time 2) Documentation: 6 second monitor strips are placed on the chart on each shift and when arrhythmias are detected evaluation of the rhythm strip by the nurse is documented with the strip *pt s name and CR number on strip *do not tape over important information- it will fade and disappear over time

7 INTRODUCTION TO CARDIAC MONITORING The electrodes detect the heart s electrical activity. There may be 3 or 5 electrodes attached to your patient. Placement of electrodes: RA-right arm-below right clavicle white LA-below left clavicle black 3 lead 5 lead LL-left leg-left lower rib cage or abdomen red RL-right lower rib cage or abdomen green C- 5 th ICS anterior axillary line brown 3 lead system: RA LA and LL electrodes these electrodes form a triangle around the heart you can choose to monitor leads I, II, or III with a 3 lead system-these are called limb leads 5 lead system: RA LA LL RL C electrodes the C electrode can be positioned in any one of 6 designated positions on the left anterior chest- these are called the V1-V6 positions and are called chest leads the RL electrode is a ground electrode and is not used as a recording electrode with a 5 lead system you can choose to monitor leads I,II,III,aVR,, avl, avf, V1-V6
8 INTRODUCTION TO CARDIAC MONITORING The electrical activity is picked up between 2 electrodes. A different pair is used to record each lead. One electrode is considered negative and one positive. It is the positive one that is recording the electrical activity. Lead 1- uses the RA (neg) and LA (positive) for electrical recording Lead 2 -uses the RA(neg) and LL(positive) for recording Lead 3-uses the LA(now neg) and LL (positive) for recording These limb leads record the electrical conduction of the heart from three different viewpoints. They are called bipolar leads because they use a pair of electrodes to record the activity Remember it is the positive electrode that records the heart s electrical activitythink of the positive electrode like a camera, watching the electrical activity of the heart. The electrical activity of the heart remains the same but each lead views this activity from a different angle.

9 INTRODUCTION TO CARDIAC MONITORING Recording the electrical waves: an upward deflection will be recorded on the monitoring paper if the conduction goes towards the positive electrode a downward deflection will be recorded on the monitoring paper if the conduction goes away from the positive electrode Lead 2- the positive electrode is the LL which is positioned just below the heart normal conduction in the heart is down and to the left, therefore Lead 2 will pick up the conduction (or depolarization) coming towards it -the waves will be recorded as upright on the monitoring paper Lead 2 is the limb lead usually used in monitoring
10 RECORDING ELECTRICAL EVENTS 1 mm.04 sec The recording paper is graph paper which records at a specific speed. The horizontal lines measure the amplitude of events in millimeters or millivolts One horizontal line measures 1 mm The vertical lines measure the duration in seconds of any events. Between 2 vertical lines the measure is.04 of a second. This is called a small box. You ll notice that every 5th vertical line is bolded. This is called a large box and measures.04x5=.20 of a second. The next section discusses what events will be seen on the recording paper.
11 WAVES OF THE ECG COMPLEX The P wave represents the depolarization of the atria. Atrial depolarization begins in the SA node and spreads through both atria. The p wave is small, rounded and usually upright. Atrial repolarization is usually not seen on the ECG because it is hidden in the subsequent QRS waveform and is of low voltage. WAVES OF THE ECG COMPLEX
12 The largest wave in the ECG is the QRS complex. The electrical impulses spreading through the ventricles produce the QRS complex. Therefore the QRS represents ventricular depolarization. Normal QRS duration (interventricular conduction time )is seconds Abnormal QRS duration is >.12 seconds. Indicates that conduction has been delayed in the ventricles Q wave the first downward wave of the QRS complex precedes the R wave often absent on the ECG R wave the first upward wave of the QRS complex an upward wave is always called an R wave a second upward wave is called an R prime ( R ) S wave the downward wave following the R wave An upward wave is always called an R wave The downward wave before the R is called the Q wave The downward wave after the R wave is called the S wave Ventricular contraction following the QRS creates the pulse.
13 WAVES OF THE ECG COMPLEX

14 2 small squares=.08 seconds NORMAL A B A 2 small squares=.08 seconds NORMAL B 3 ½ small squares=.14 seconds WIDE
15 WAVES OF THE ECG COMPLEX Even though we call this complex the QRS complex, not all QRS complexes have all three components. The examples above illustrate different QRS complexes and the names of all the components.
16 WAVES OF THE ECG COMPLEX The T wave represents ventricular repolarization or recovery. The T wave follows the QRS and is smooth and rounded. It is usually upright. Inverted T waves: If a T wave is upside down (inverted) this is usually an abnormal finding. It can indicate myocardial ischemia. Notched or pointed T waves: Heavily notched or sharply pointed T waves in adults may indicate MI or pericarditis. Tall T waves: Tall T waves suggest an MI or hyperkalemia If any of the above are new findings on the monitor a 12 lead ECG should be done


17 PRACTICE YOUR Ps and Qs! QRS QRS QRS QRS T T T T P P P P P QRS QRS QRS QRS QRS QRS T T T T T T P P P P P P
18 INTERVALS AND SEGMENTS This is the segment between the P wave and the QRS. This represents the time interval between when the atria depolarize and when the ventricles depolarize. The electrical impulse is spreading to the AV node, Bundle of His and Purkinje fibers. This is considered a baseline from which we measure changes in the ST segment.
19 INTERVALS AND SEGMENTS The PR interval is measured from the beginning of the P to the beginning of the QRS. If there is no Q wave then it is measured from the beginning of the P wave to the beginning of the R wave. It represents atrial and atrioventricular conduction time. This includes atrial depolarization, the normal conduction delay in the AV node, and the passage of the electrical impulse through the bundle of His and the bundle branches. If conduction is occurring normally then this will take between 0.12 and.20 of a second or 3 to 5 small boxes Short P-R interval: AV conduction time is shortened: could be due to: initial impulse in the junction (AVnode) or another (faster)conduction pathway betweeen atria and ventricles Long P-R interval: AV conduction time is longer than normal: could be due to: a conduction delay in the AV junction a conduction delay through the atria
20 INTERVALS AND SEGMENTS The ST segment is the segment after the QRS and before the T wave. This segment represents ventricular repolarization. Normal ST segment: horizontal and flat level with the PR segment or baseline J point: the junction between the ST segment and the QRS is called the J point If the ST segment is more than 1 mm (1 small square) above the baseline it is considered elevated If the ST segment is more than 1 mm below the baseline for.08 seconds (2 small squares) after the J point, it is considered depressed
 past the J point indicates myocardial ischemia ST elevation: The ST segment is above the baseline acute ST elevation indicates myocardial injury prolonged ST elevation may")
21 ST depression: The ST segment falls below the baseline for.08sec (2 small squares) past the J point indicates myocardial ischemia ST elevation: The ST segment is above the baseline acute ST elevation indicates myocardial injury prolonged ST elevation may indicate something other than myocardial injury: pericarditis, ventricular aneurysm or cardiac contusion If any of the above are new findings on the monitor a 12 lead ECG should be done
22 Intervals and Segments The QT interval is measured from the beginning of the QRS until the end of the T wave. The QT interval represents ventricular depolarization and repolarization. Normal QT interval: usually between 0.36 and 0.44 second varies greatly according to age, gender,heart rate, and whether the patient is asleep should be less than 1/2 the distance between two consecutive R waves (R-R interval) when the rhythm is regular Prolonged QT interval: Repolarization means that the muscle cell resets itself so it can depolarize again. Measured on an ECG, the time between the Q wave and the T wave is prolonged in this condition. This leads to a longer vulnerable period. If the next QRS begins before the end of repolarization, an arrhythmia or irregular heart beat could occur, such as ventricular fibrillation, or Torsades de Pointes which could be fatal. This condition is diagnosed on a 12 lead ECG. A 12 lead ECG should be done if the QT appears prolonged Cause:congenital, medications (Amiodarone, Haldol, Procainamide,Sotalol, some antibiotics ), hypokalemia and hypomagnesemia, intracranial or subarachnoid hemorrhage Intervals and Segments


23 PR ST QT J point PR=.16 sec NORMAL ST-depressed 1mm for.08 sec past the J point-abnormal QT- less than ½ the R-R NORMAL PR=.32 sec PROLONGED ST- slightly depressed, but not 1mm- baseline-normal QT- less than ½ the R-R NORMAL PR ST QT PR=.20 seconds NORMAL ST- baseline-normal QT- more than ½ the R-R PROLONGED PR ST QT


24 RHYTHM REGULARITY Rhythm Regularity: Refers to the regularity of the QRS complexes Measure the distance between the QRS complexes-this is referred to as the R-R interval There are three ways to describe regularity: Regular rhythms R-R intervals are all the same or vary slightly. In regular rhythms the QRSs usually look alike Regular but interrupted Most of the R-R intervals are constant Interrupted by premature beats or a pause Irregular R-R intervals vary Not due to premature beats or pauses, but because the actual rhythm is irregular

25 MEASUREMENT OF HEART RATE 6 seconds 3 seconds SECOND METHOD To determine HR: There are small line markers on the top of the graph paper These occur every 3 seconds Count # of QRS complexes in a 6 second strip. Multiply by 10. Above example: QRS s in 6 seconds = 6 6 X 10 = 60 beats/min
 There are 300 big boxes in one minute If")

26 MEASUREMENT OF HEART RATE How to calculate the heart rate on ECG paper big box BIG BOX METHOD Alternate method to determine HR (for regular rhythms only) There are 300 big boxes in one minute If there was one big box between each QRS the HR would be 300 / minute If there were 2 big boxes between each QRS the HR would be 300/2= 150/min Try to find a QRS on a bolded line Count the number of big boxes to the next QRS Divide into 300
27 SYSTEMATIC ANALYSIS OF RHYTHM STRIPS The key to identifying rhythms correctly is to systematically analyze the cardiac rhythm strip. 1. Determine the atrial and ventricular rate (HR) If these rates are different then you know to look more closely a the relationship between the p and the QRS 2. Measure R-R. a. Is the rhythm regular, regular but interrupted, or irregular? 3. P waves a. Are they present and do they all look the same? b. Is there a QRS after each one? 4. PR interval a. Normal is seconds (3-5 small boxes) b. Is each PR interval the same? 5. QRS duration a. Normal is <.12 seconds or 3 small boxes b. Are they all the same and point in the same direction? 6. Examine the ST segment a. Is it at baseline (even with the PR segment) b. Is there ST elevation or ST depression? 7. Examine the T waves a. Normal is upright and rounded b. Are they inverted or flattened 8. Measure the QT interval a. Normal is < ½ the R-R interval b. Is it changed from previously 9. Are there premature beats.
28 a. Is there a p in front of the QRS? b. Is the QRS normal or widened? 10. Analyze the rhythm. Rhythms are always described by the above format. The first part of the description tells us where the rhythm originates. The second part of the description tells us how fast the rhythm is. Examples: Sinus bradycardia: The rhythm originates in the sinus node and the rate is < 60 beats per minute Ventricular tachycardia: The rhythm originates in the ventricles and the rate is > 100 beats per minute

29 NORMAL SINUS RHYTHM Normal Sinus Rhythm Sinoatrial node Rhythm Regular Rate (per minute) P wave Upright PRI QRS Uniform The only rhythm that is considered normal is normal sinus rhythm. Mechanical events are optimal in normal sinus rhythm. An arrhythmia is any cardiac rhythm that is not normal sinus rhythm. Arrhythmias fall into the following categories: Arrhythmias originating in the sinus node Junctional rhythms Ventricular rhythms Atrial arrhythmias AV conduction disturbances
30 ARRYTHMIAS- PATIENT ASSESSMENT Arrhythmias can occur for a number of reasons. If the patient is symptomatic, then there must be immediate intervention Guide your nursing assessment with the following questions: 1. Is the patient oxygenating well? a. Check the O 2 saturation 2. Is there evidence of ischemia? b. Is the patient having chest pain? c. Check for high blood pressure. d. Assess for heart failure. 3. Are the electrolytes abnormal? a. Check the potassium, magnesium and calcium levels 4. What medications is the patient on? a. Check for medications that can cause bradycardia b. Check for medications that can cause prolonged QT intervals and may precipitate tachycardia
31 Arrhythmias Originating in the Sinus Node Sinus Tachycardia Sinus Bradycardia Sinus Arrhythmia Sinoatrial (SA) Block Sinus Arrest Sick Sinus Syndrome

32 Sinus Tachycardia Sinoatrial node Rhythm Rate P Wave PRI QRS (per minute) Regular Upright Uniform Causes Exercise, anxiety, fever, pain, hyperthyroidism, medications Nursing Implications Treat the cause

33 Sinus Bradycardia Sinoatrial node Rhythm Regular Rate (per minute) P Wave Upright Uniform PRI QRS Causes Sleep, athletic heart, increased vagal tone, beta-adrenergic blockade Nursing Implications Treat if there is hemodynamic compromise

34 Sinus Arrhythmia Sinoatrial node Rhythm Rate P Wave PR Interval QRS (per minute) Irregular Usually Upright Uniform irregular rhythm associated with respiratory cycles; HR á with inspiration & HR âwith expiration

35 Sinoatrial (SA) Block Rhythm Rate P Wave PRI QRS (per minute) Regular but interrupted Usually Upright, uniform but entire cycle missing <0.12 Causes Coronary artery disease, medications, carotid sinus sensitivity and increased vagal tone Nursing Implications Treat if the pauses are long and there is hemodynamic compromise
 Causes Coronary artery disease, medications, carotid sinus sensitivity and increased vagal tone Nursing Implications Treat if the pauses are long and")
36 Sinus Arrest Escape rhythm Rhythm Rate P Wave PRI QRS (per minute) Regular but interrupted Any rate No sinus P s N/A <0.12 (junctional) >0.12 (ventricular) Causes Coronary artery disease, medications, carotid sinus sensitivity and increased vagal tone Nursing Implications Treat if the pauses are long and there is hemodynamic compromise

37 Sick Sinus Syndrome A cluster of symptoms arising from a pathology in the sinus node. Results in dramatic changes in heart rate -bradycardia " tachycardia, interspersed with sinus arrests, pauses and blocks. Escape beats common after long sinus pauses. Rhythm Rate (per minute) P Wave PRI QRS Irregular Varies wildly Too fast too slow May or may not be present, shape varies If present, varies Varies See answers beginning on page 52 Causes Ischemic disease, medication, inflammatory disease, surgical injury, idiopathic Nursing Implications Treat underlying cause (digoxin, beta blockers), pacemaker
38
39 Junctional Rhythms Junctional Rhythm Premature Junctional Contraction Accelerated Junctional Rhythm Junctional Tachycardia Junctional Escape Rhythm Junctional Rhythm AV node 2 nd 1 st Simultaneous Atrium depolarized 1 st, then ventricles. Upside down P wave BEFORE QRS Atria & ventricles depolarized simultaneously. NO visible P wave, obscured by QRS Ventricles depolarized 1 st, then atria. Upside down P wave AFTER QRS

40 Premature Junctional Contractions (PJC) Rhythm Rate (per minute) P Wave PRI QRS Regular but interrupted Occurs at any rate Inverted before or after QRS or not visible <0.12 if P precedes QRS <0.12 Causes MI, Digoxin toxicity, hypoxia, stimulants Nursing Implications Remove the cause eg. Digoxin toxicity Junctional Rhythm AV node Rhythm Regular Rate (per minute) P Wave If visible, inverted (before or after QRS) PRI If able to measure <0.12 Causes MI, Digoxin toxicity, Hypoxia, vagal stimulation Nursing Implications If symptomatic- atropine. Treat the cause eg. Digoxin toxicity QRS <0.12


41 Accelerated Junctional AV node Rhythm Regular Rate (per minute) P Wave If visible, inverted (before or after QRS) Causes MI, stimulant drugs, caffeine, dig toxicity Nursing Implications Remove the cause PRI If able to measure <0.12 QRS <0.12 Junctional Tachycardia Rhythm Rate (per minute) P Wave PRI QRS Regular >100 If visible, inverted (before or after QRS) If able to measure <0.12 Causes Digoxin toxicity, heart disease, stimulants Nursing Implications Identify and treat the cause eg. Digoxin toxicity <0.12

42 Junctional Escape Rhythm Rhythm Regular Irregular Rate (per minute) P Wave If present inverted before or after QRS PRI Causes MI, Digoxin toxicity Nursing Implications Identify and treat the cause eg. Digoxin toxicity <0.12 QRS <0.12
43 See answers beginning on page 52
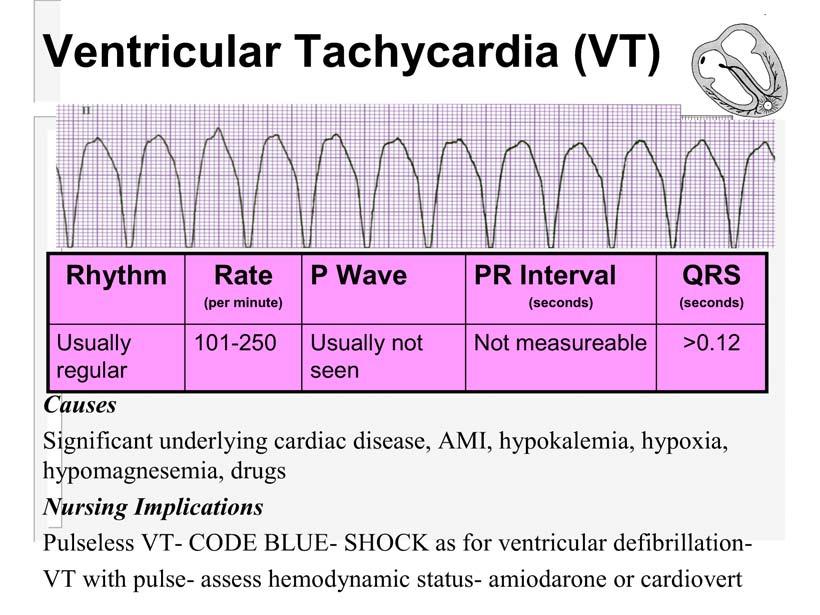
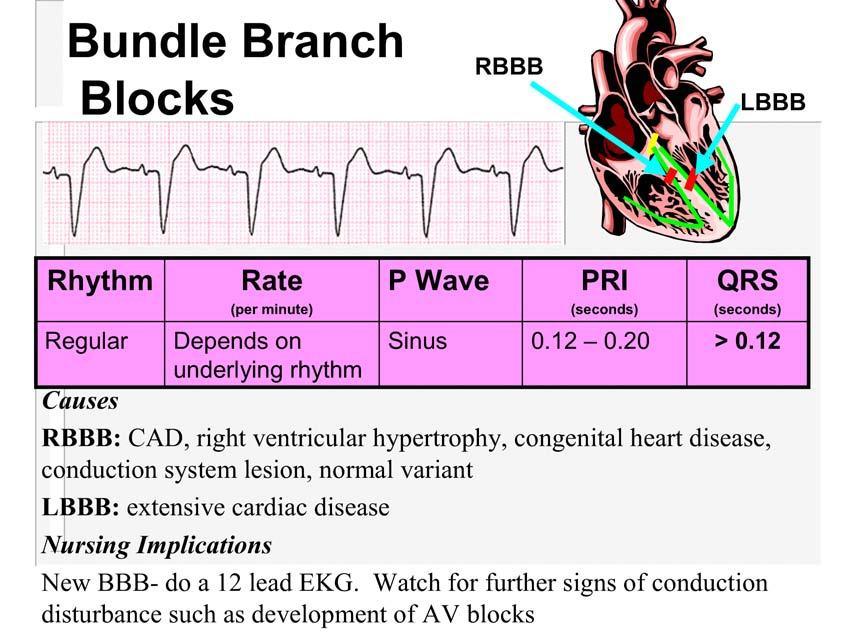
44 Ventricular Arrhythmias Premature Ventricular Contraction (PVC) Accelerated (Idio)ventricular rhythm Ventricular Tachycardia Ventricular Fibrillation Ventricular Escape Rhythm Bundle Branch Blocks

45 Premature Ventricular Contraction Rhythm Rate (per minute) P Wave PRI QRS T wave Regular but interrupted by PVC s Occurs at any rate Not seen on PVC s N/A >0.12 In opposite direction of QRS Causes Heart disease, hypokalemia, hypoxia, hypomagnesemia, stimulants, caffeine, stress, anxiety,digoxin, significant anemia Nursing Implications Assess frequency of PVC s and potential cause(s).


46 Bigeminy Multifocal PVC s Accelerated Ventricular Rhythm Rhythm Rate (per minute) P Wave PR Interval QRS Usually regular Causes Usually not seen Common after MI, administration of fibrinolytics Nursing Implications Not measureable Usually well tolerated. This is the patient s escape rhythm, so antiarrhythmics are not used >0.12
47

48 Ventricular Fibrillation (VF) Rhythm Rate (per minute) P Wave PR Interval QRS Not detectable Can t be counted None Causes Significant underlying cardiac disease, AMI, hypokalemia, hypoxia, hypomagnesemia, drugs Nursing Implications Code Blue- defibrillation Not detectable Not detectable

49 Ventricular Escape Rhythm Rhythm Rate P Wave PR Interval QRS (per minute) Usually regular Usually not seen Not measureable >0.12 Causes Massive MI, hypoxia Nursing Implications Usually pulseless- CODE BLUE, CPR
50
51
 Varies P Wave P of")

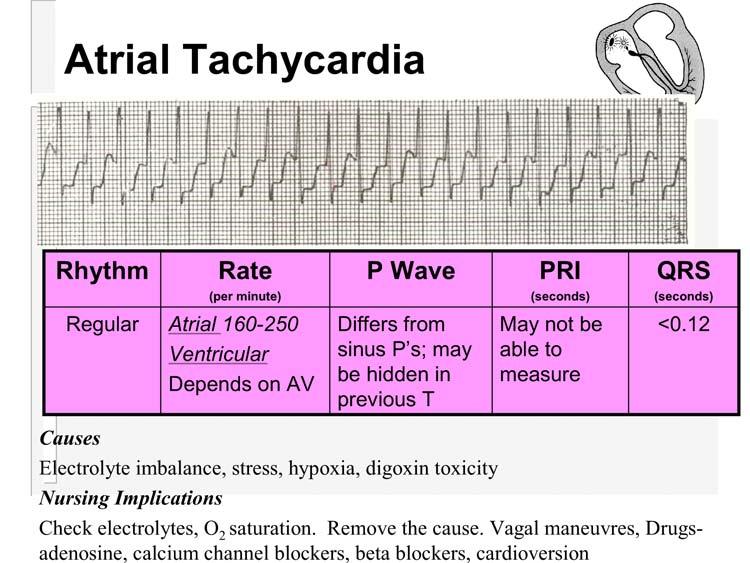
52 Atrial Arrhythmias Premature Atrial Contractions (PAC) Atrial Tachycardia Atrial Flutter Atrial Fibrillation Premature Atrial Contractions Rhythm Interrupted by PAC Rate (per minute) Varies P Wave P of PAC different from underlying rhythm P s PRI Differs from underlying rhythm Causes Electrolyte imbalance, stress, hypoxia, digoxin toxicity Nursing Implications Check electrolytes, O 2 saturation. Remove the cause. QRS <0.12
53


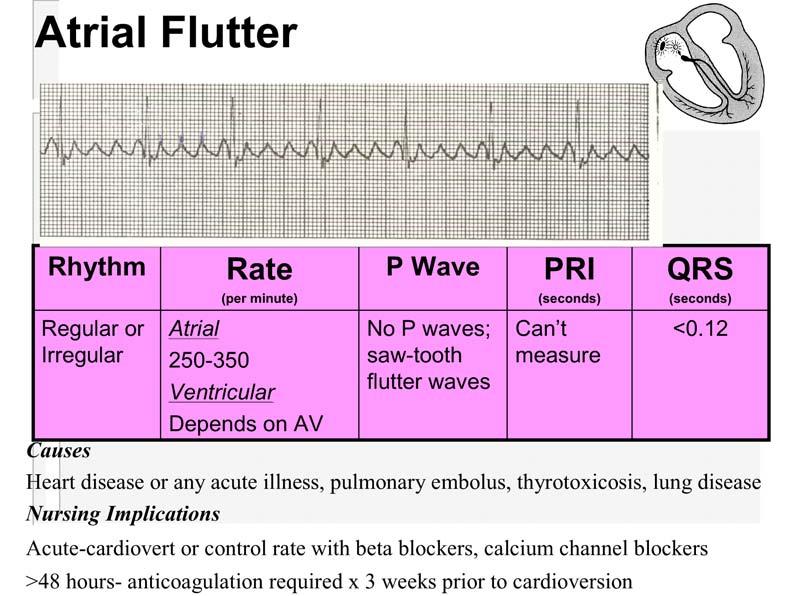
54 Atrial Fibrillation Rhythm Rate P Wave PRI QRS (per minute) Irregular A: V: slow to rapid Fibrillatory (fine to coarse) N/A <0.12 Causes- Valvular HD,MI, thyrotoxicosis, lung disease Nursing Implications Assess BP as patient has lost atrial kick. Lack of co-ordinated contraction in the atria predisposes patients to embolic events- anticoagulation required Acute-cardiovert or control rate with beta blockers, calcium channel blockers >48 hours- anticoagulation required x 3 weeks prior to cardioversion

55 See answers beginning on page 52

 or blocked altogether, so there is a p wave but no QRS.is triggered by the p wave.")
56 Heart Blocks 1. What is heart block? Heart block is an arrhythmia usually caused by ischemia or an MI. It can also be caused by drugs such as beta blockers, calcium channel blockers, digoxin or any drug trying to slow down a fast rhythm and overshoots the mark! 2. What is being blocked in a heart block? The signal from the SA node is trying to get through to the AV node (creating a p wave) and then to the ventricle (creating a QRS). In heart block the signal from the SA node through the AV node is either slowed down (causing a longer P-R interval) or blocked altogether, so there is a p wave but no QRS.is triggered by the p wave. The key to heart blocks: The signal is getting through: 1 all of the time (but taking longer than normal-.20 sec) 2 some of the time 3 none of the time These are called first degree (#1), second degree (#2)and third degree (#3) heart blocks.
57 3. What are the three types or degree of heart block? Look at a normal sinus rhythm: PR interval You can see the p waves and you can see where the QRS begins- the measurement from the beginning of the P to the beginning of the QRS is the PR interval. A normal P- R interval should be no longer than.20 seconds or one big box on the EKG paper. The PR interval represents the electrical depolarization from the SA node through the atria and the AV node. If the PR interval is normal then the signal is taking the normal amount of time to travel this far. The signal should then travel to the ventricles to create a QRS. 3.1 First degree heart block: Measure the PR interval. You will notice that it is longer than.20 seconds or one big block. It is taking longer than normal time to get from the SA node through the AV node to the ventricles. It does get to the ventricles all the time. This is SR with a first degree heart block. 3.2 Second degree heart blocks: By definition a second degree heart block has signals getting through some of the time. So you will see p s with QRS s after them and you will see p s without QRS s after them.
58 The SA node will fire at a constant rate- some of the time the signal gets through the AV node to the ventricle and sometimes it doesn t.. There are 2 kinds of second degree heart block: The first kind can be called one of two names: Type 1 second degree or Wenckebach Second degree type 1-Wenckebach You can see the p waves without a QRS. The signal is getting through the AV node some of the time. Look at the PR intervals before the dropped beat- the PR starts out normal, then gets longer with the next beat, longer with the subsequent beat and then doesn t get through. So the PRs leading up to the dropped beat get longer and longer then drop. The heart rate in this patient is still 70 bpm, so the patient probably has a good blood pressure. Usually this rhythm is benign and is transient due to a MI. However it still bears watching Second degree type 2
59 degree type 1- PRs- longer,longer, longer and drop degree type 2-PRs- all the same and then drop a QRS without warning Predictable Unpredictable You can see the p s without the QRS. The other Ps are followed by a QRS and all the PRs are the same. The signal is getting through to the AV node some of the time. therefore it is a second degree heart block. The PRs of the other beats are all the same. This heart block is much more serious and can progress to third degree heart block (complete heart block). This patient requires a pacemaker. 3.3 Third degree heart block (complete) Third Degree Heart Block In third degree heart block the SA node is firing a signal at a regular rate. The top arrows show where the p s are. However the signal is not getting through the AV node to create a QRS. When this happens either the AV node or the ventricle will generate a rate by themselves. If the AV node generates it the QRS will be narrow. If the ventricle generates it the QRS will be wide. The QRS is marked by the arrows at the bottom. If you measure the PR intervals, none of them are the same. There are p s in the middle of QRS s. This tells you that there is no connection between the p and the QRS. The SA node and the ventricle are depolarizing independently of each other. None of the p waves are conducted through the AV node to the ventricle. This heart block is serious as the ventricular rate can go as low as 20 or stop altogether. This patient requires a pacemaker.
60 AV Blocks 1 p for every QRS Constant Prolonged P-R Interval 1 0 AV block NO Regular R-R? More p s than QRS P-R constant? YES 2 0 type 2 AV block Includes 2:1 AV conduction YES NO Diagram: AV blocks 3 0 AV block (complete) 2 on 0 AV the block right type 1 side (Wenckebach) of the diagram are the most serious and equire a permanent pacemaker. AV blocks on the left side are less serious, QRS normal width? ransient, or the causes can be reversed. NO YES Ventricular escape Junctional escape Atrioventricular (AV) Conduction Disturbances First Degree AV Block Second Degree AV Block Type I (Wenckebach) Type II Third Degree (Complete) AV Block
, ablation Nursing Implications Remove the cause.")

61 First Degree AV Block Rhythm Rate P Wave PR Interval QRS (per minute) Depends on underlying rhythm Can occur at any rate upright Uniform Precede QRS Prolonged > 0.20 < 0.12 Causes AV node ischemia,dig toxicity,drugs (beta blockers, calcium channel blockers), ablation Nursing Implications Remove the cause. Treat the cause 2 nd Degree Heart Block Type I - Wenckebach Rhythm Rate P Wave PRI QRS (per minute) Usually irregular Atrial usually Ventricular < atrial Sinus P s Gradually # s until QRS dropped <0.12 if block at AV >0.12 if block at bundle branches Causes- Drugs, MI, chronic degenerative conduction disease. Nursing Implications Usually due to MI, is transient and only requires observation If symptomatic- atropine, pacemaker

62 2 nd Degree Heart Block Type II Rhythm Regular Or Irregular Rate (per minute) Atrial usually Ventricular < atrial P Wave Sinus P s 2 or > before each QRS PRI Constant for conducted beats QRS <0.12 if block at AV >0.12 if block at bundle branches Causes- Drugs, MI, chronic degenerative conduction disease, hypoxia Nursing Implications Definitive treatment is a pacemaker as this can progress to complete AV block or asystole.. Atropine can be tried for symptoms, but may paradoxically slow the heart rate. Third Degree AV Block Rhythm Rate (per minute) P Wave PRI QRS Regular Atrial Ventricular Block at AV Block at bundle branches Sinus P s with no relation to QRS varies Block at AV <0.12 Block at bundle branches >0.12 Causes- Drugs, MI, chronic degenerative conduction disease, hypoxia Nursing Implications Definitive treatment is a pacemaker. Atropine can be tried for symptoms, but may paradoxically slow the heart rate.

63 See answers beginning on page 52

64 Rate: Atrial 40 Ventricular 40 Regular? Yes P waves _Yes-all the same Followed by QRS? Yes PRI 0.16 QRS 0.08 ST segment baseline T wave upright QT Interval less than ½ the R-R interval PRACTICE STRIP ANSWERS Interpretation sinus bradycardia Practice Strips page 32 Rate: Atrial 70 Ventricular 70 Regular? No- slows down and speeds up P waves Yes-all the same Followed by QRS? Yes PRI 0.14 QRS_0.08 ST segment depressed T wave upright QT Interval 1/2 the R-R interval Interpretation Sinus arrhythmia
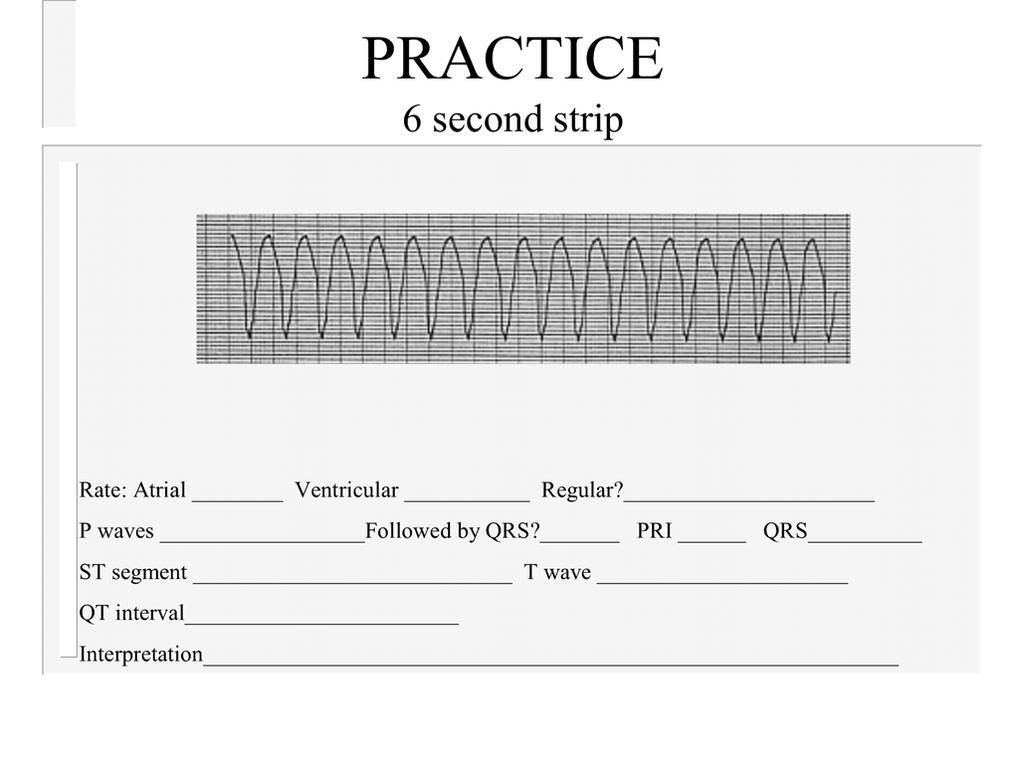
65 Rate: Rate: Atrial Atrial none none Ventricular Ventricular Regular? yes Regular? yes P waves P waves none Followed no Followed by QRS?_no by QRS? no_ PRI PRI _none none QRS 0.06 QRS 0.20_(wide)_ ST segment ST segment lightly can t depressed measure T wave upright T wave can see QT Interval QT Interval less can t than ½ measure the R-R interval Practice Strips Page 36 Iterpretation junctional Interpretation ventricular rhythm tachycardia Practice Strips page 41

66 Rate: Atrial 300 Ventricular 80 Regular? No P waves f waves Followed by QRS? sometimes PRI _not measured QRS 0.10 ST segment hard to tell T wave can t see Practice Strips page 44 QT Interval can t measure Interpretation atrial flutter with variable conduction from A to V 3 second arrows show f waves hidden in the QRS
67 Rate: Atrial no p Ventricular 90 Regular? irregular P waves _no Followed by QRS?_no PRI none QRS 0.08 ST segment hard to tell- could be depressed T wave _upright QT Interval 0.28 normal Interpretation atrial fibrillation with controlled ventricular response (less than 100/ minute) QT interval

68 Rate: Atrial 80 Ventricular 60 Regular? No P waves _yes-all the same Followed by QRS?_not all PRI _ prolonging QRS 0.06 ST segment baseline T wave upright Practice Strips page 51 QT Interval 0.36 normal Interpretation second degree type 1 AV block (Wenckeback) Arrows indicate p waves hidden in the complex REFERENCES Rate: Atrial 80 Ventricular 30 Regular? yes P waves upright Followed by QRS?_no PRI all different QRS 0.16_(wide) ST segment depressed T wave inverted QT Interval 0.28 normal Interpretation 3 rd degree AV block
69 References 1. Daly, S., Weinstein E., Ambrose, M., Charnow, J., (eds) et al. (1993) Deciphering Difficult ECG s. Pennsylvania: Springhouse Corporation. 2. Dubin, D. (2000) Rapid Interpretation of EKG s. 6th edition. Florida: COVER Publishing Company. 3. Ellis, Karen (2002) EKG Plain and Simple. New Jersey: Prentice Hall. 4. Hudak, C., Gallo B., Gonce Morton, P.,(1998) Critical Care Nursing: A Holistic Approach. 7th edition. New York: Lippincott. 4. Stein, E. (1997) Clinical Electrocardiography: A Self Study Course. Philadelphia: Lea & Febiger. 5. Vinsant, M., Spence, M. (1989) Commonsense Approach to Coronary Care: A Program: 5th edition. Toronto: The C.V Mosby Company. 6. Woods, S., Sivarajan Froeclicher,E., Underhill Motzer, S. (2000) Cardiac Nursing. 4th edition. New York: Lippincott.
70 TEST Please check with your CE to see which test is appropriate for you to complete Please evaluate the following strips in a systematic way. Describe the dysrhythmia by the predominant underlying rhythm and then any other rhythm or extra beats that are on the strip. e.g.- SR with PVC s or SR with first degree HB Filling out the test completely should lead you to an accurate interpretation Thank you
71 Marks 1. What is the ventricular rate? Is it regular? Are there any premature QRS s? Ask yourself- Are the premature QRS s wide or narrow? 2. P waves What is the rate? Are the each followed by a QRS? 3. What is the P-R interval? Is it constant? If not constant what is happening to the P-R? 4. What is the QRS duration? Is this a normal QRS duration? Ask yourself: Could there be a hidden p wave in the ST segment or T wave? Identify the conduction pathway for this rhythm on the following diagram 1 6. State the rhythm diagnosis 2 Mark /10

72 Marks 1. What is the ventricular rate? Is it regular? Are there any premature QRS s? Ask yourself -Are the premature QRSs wide or narrow? 2. P waves What is the rate? Are the each followed by a QRS? 3. What is the P-R interval? Is it constant? If not constant what is happening to the P-R? 4. What is the QRS duration? Is this a normal QRS duration? Ask yourself: Could there be a hidden p wave in the ST segment or T wave? Identify the conduction pathway for this rhythm on the following diagram 1 6. State the rhythm diagnosis 2

73 Mark /10 1. What is the ventricular rate? Is it regular? Are there any premature QRS s? Ask yourself- Are the premature QRS s wide or narrow? 2. P waves What is the rate? Are the each followed by a QRS? 3. What is the P-R interval? Is it constant? If not constant what is happening to the P-R? 4. What is the QRS duration? Is this a normal QRS duration? Ask yourself: Could there be a hidden p wave in the ST segment or T wave? Marks Identify the conduction pathway for this rhythm on the following diagram 1 6. State the rhythm diagnosis 2 Mark /10
74 1. What is the ventricular rate? Is it regular? Are there any premature QRS s? Ask yourself- Are the premature QRS s wide or narrow? 2. P waves What is the rate? Are the each followed by a QRS? 3. What is the P-R interval? Is it constant? If not constant what is happening to the P-R? 4. What is the QRS duration? Is this a normal QRS duration? Ask yourself: Could there be a hidden p wave in the ST segment or T wave? Marks Identify the conduction pathway for this rhythm on the following diagram 1 6. State the rhythm diagnosis 2 Mark /10
75 Marks 1. What is the ventricular rate? Is it regular? Are there any premature QRS s? Ask yourself- Are the premature QRS s wide or narrow? 2. P waves What is the rate? Are the each followed by a QRS? 3. What is the P-R interval? Is it constant? If not constant what is happening to the P-R? 4. What is the QRS duration? Is this a normal QRS duration? Ask yourself: Could there be a hidden p wave in the ST segment or T wave? Identify the conduction pathway for this rhythm on the following diagram 1 6. State the rhythm diagnosis 2 Mark /10
76 Marks 1. What is the ventricular rate? Is it regular? Are there any premature QRS s? Ask yourself- Are the premature QRS s wide or narrow? 2. P waves What is the rate? Are the each followed by a QRS? 3. What is the P-R interval? Is it constant? If not constant what is happening to the P-R? 4. What is the QRS duration? Is this a normal QRS duration? Ask yourself: Could there be a hidden p wave in the ST segment or T wave? Identify the conduction pathway for this rhythm on the following diagram 1 6. State the rhythm diagnosis 2 Mark /10
77 Marks 1. What is the ventricular rate? Is it regular? Are there any premature QRS s? Ask yourself- Are the premature QRS s wide or narrow? 2. P waves What is the rate? Are the each followed by a QRS? 3. What is the P-R interval? Is it constant? If not constant what is happening to the P-R? 4. What is the QRS duration? Is this a normal QRS duration? Ask yourself: Could there be a hidden p wave in the ST segment or T wave? Identify the conduction pathway for this rhythm on the following diagram 1 6. State the rhythm diagnosis 2 Mark /10
78 Marks 1. What is the ventricular rate? Is it regular? Are there any premature QRS s? Ask yourself- Are the premature QRS s wide or narrow? 2. P waves What is the rate? Are the each followed by a QRS? 3. What is the P-R interval? Is it constant? If not constant what is happening to the P-R? 4. What is the QRS duration? Is this a normal QRS duration? Ask yourself: Could there be a hidden p wave in the ST segment or T wave? Identify the conduction pathway for this rhythm on the following diagram 1 6. State the rhythm diagnosis 2 Mark /10
79 Marks 1. What is the ventricular rate? Is it regular? Are there any premature QRS s? Ask yourself- Are the premature QRS s wide or narrow? 2. P waves What is the rate? Are the each followed by a QRS? 3. What is the P-R interval? Is it constant? If not constant what is happening to the P-R? 4. What is the QRS duration? Is this a normal QRS duration? Ask yourself: Could there be a hidden p wave in the ST segment or T wave? Identify the conduction pathway for this rhythm on the following diagram 1 6. State the rhythm diagnosis 2 Mark /10
80 Marks 1. What is the ventricular rate? Is it regular? Are there any premature QRS s? Ask yourself- Are the premature QRS s wide or narrow? 2. P waves What is the rate? Are the each followed by a QRS? 3. What is the P-R interval? Is it constant? If not constant what is happening to the P-R? 4. What is the QRS duration? Is this a normal QRS duration? Ask yourself: Could there be a hidden p wave in the ST segment or T wave? Identify the conduction pathway for this rhythm on the following diagram 1 6. State the rhythm diagnosis 2 Mark /10

81 Marks 1. What is the ventricular rate? Is it regular? Are there any premature QRS s? Ask yourself- Are the premature QRS s wide or narrow? 2. P waves What is the rate? Are the each followed by a QRS? 3. What is the P-R interval? Is it constant? If not constant what is happening to the P-R? 4. What is the QRS duration? Is this a normal QRS duration? Ask yourself: Could there be a hidden p wave in the ST segment or T wave? Identify the conduction pathway for this rhythm on the following diagram 1 6. State the rhythm diagnosis 2 Mark /10
82 Test # 2 Please check with your CE to see which test is appropriate for you Please evaluate the following strips in a systematic way. Describe the dysrhythmia by the predominant underlying rhythm and then any other rhythm or extra beats that are on the strip. e.g.- Normal Sinus rhythm with Premature Ventricular Contractions (NSR with PVCs) or Normal Sinus Rhythm (NSR) with first degree Heart Block (HB) For test purposes each rhythm strip will be assumed to be a 6 second strip. as Identify the normal PR interval as and abnormal as > 0.20 in the learning guide Identify the normal QRS interval as and abnormal as > 0.10 as in the learning guide Filling out the test completely should lead you to an accurate interpretation. Each test strip will be marked out of 5 for a total score out of 25. Thank you
83 Strip #1 2. a) What is the ventricular rate? a) Is it regular? 2. P waves a) What is the rate? b) Is each P wave followed by a QRS? 3. a) What is the P-R interval? b) Is it constant? 7. a) What is the QRS duration? b) Is this a normal QRS duration? 8. State the rhythm diagnosis.
84 Strip #2 1. a) What is the ventricular rate? b) Is it regular? 3. P waves a) What is the rate? 3. a) What is the P-R interval? 7. a) What is the QRS duration? 8. State the rhythm diagnosis.
85 Strip #3 1. a) What is the ventricular rate? b) Is it regular? 2. P waves a) What is the rate? 3. a) What is the P-R interval? 7. a) What is the QRS duration? b) Is this a normal QRS duration? 8. State the rhythm diagnosis.
86 Strip #4 1. a) What is the ventricular rate? b) Is it regular? 2. P waves a) What is the rate? b) Are they each followed by a QRS? 3. a) What is the P-R interval? 7. a) What is the QRS duration? b) Is this a normal QRS duration? 8. State the rhythm diagnosis.
87 Strip #5 1. a) What is the ventricular rate? b) Is it regular? c) Are there any premature QRS s? P waves a) What is the rate? 3. a) What is the P-R interval? b) Is it constant? 7. a) What is the QRS duration? 8. State the rhythm diagnosis.
CORONARY ARTERIES. LAD Anterior wall of the left vent Lateral wall of left vent Anterior 2/3 of interventricluar septum R & L bundle branches
 CORONARY ARTERIES RCA Right atrium Right ventricle SA node 55% AV node 90% Posterior wall of left ventricle in 90% Posterior third of interventricular septum 90% LAD Anterior wall of the left vent Lateral
UNDERSTANDING YOUR ECG: A REVIEW
 UNDERSTANDING YOUR ECG: A REVIEW Health professionals use the electrocardiograph (ECG) rhythm strip to systematically analyse the cardiac rhythm. Before the systematic process of ECG analysis is described
Course Objectives. Proper Lead Placements. Review the ECG print paper. Review the mechanics of the Myocardium. Review basics of ECG Rhythms
 ECG Interpretations Course Objectives Proper Lead Placements Review the ECG print paper Review the mechanics of the Myocardium Review basics of ECG Rhythms How Leads Work The ECG Leads we use are Bipolar
TEST BANK FOR ECGS MADE EASY 5TH EDITION BY AEHLERT
 Link download full: http://testbankair.com/download/test-bank-for-ecgs-made-easy-5thedition-by-aehlert/ TEST BANK FOR ECGS MADE EASY 5TH EDITION BY AEHLERT Chapter 5 TRUE/FALSE 1. The AV junction consists
ECG Interpretation Cat Williams, DVM DACVIM (Cardiology)
") ECG Interpretation Cat Williams, DVM DACVIM (Cardiology) Providing the best quality care and service for the patient, the client, and the referring veterinarian. GOAL: Reduce Anxiety about ECGs Back to
ECG Interpretation Cat Williams, DVM DACVIM (Cardiology) Providing the best quality care and service for the patient, the client, and the referring veterinarian. GOAL: Reduce Anxiety about ECGs Back to
ABCs of ECGs. Shelby L. Durler
 ABCs of ECGs Shelby L. Durler Objectives Review the A&P of the cardiac conduction system Placement and obtaining 4-lead and 12-lead ECGs Overview of the basics of ECG rhythm interpretation Intrinsic
Lab Activity 24 EKG. Portland Community College BI 232
 Lab Activity 24 EKG Reference: Dubin, Dale. Rapid Interpretation of EKG s. 6 th edition. Tampa: Cover Publishing Company, 2000. Portland Community College BI 232 Graph Paper 1 second equals 25 little boxes
2017 BDKA Review. Regularity Rate P waves PRI QRS Interpretation. Regularity Rate P waves PRI QRS Interpretation 1/1/2017
 1. 2017 BDKA Review 2. 3. 4. Interpretation 5. QT 6. 7. 8. 9. 10. QT 11. 12. 13. 14. 15. 16. 17. 18. QT 19. 20. QT 21. 22. QT 23. 24. Where are pacer spikes? Before the P wave or before the QRS complex?
HTEC 91. Performing ECGs: Procedure. Normal Sinus Rhythm (NSR) Topic for Today: Sinus Rhythms. Characteristics of NSR. Conduction Pathway
 Topic for Today: Sinus Rhythms. Characteristics of NSR. Conduction Pathway") HTEC 91 Medical Office Diagnostic Tests Week 3 Performing ECGs: Procedure o ECG protocol: you may NOT do ECG if you have not signed up! If you are signed up and the room is occupied with people who did
HTEC 91 Medical Office Diagnostic Tests Week 3 Performing ECGs: Procedure o ECG protocol: you may NOT do ECG if you have not signed up! If you are signed up and the room is occupied with people who did
CRC 431 ECG Basics. Bill Pruitt, MBA, RRT, CPFT, AE-C
 CRC 431 ECG Basics Bill Pruitt, MBA, RRT, CPFT, AE-C Resources White s 5 th ed. Ch 6 Electrocardiography Einthoven s Triangle Chest leads and limb leads Egan s 10 th ed. Ch 17 Interpreting the Electrocardiogram
Review Packet EKG Competency This packet is a review of the information you will need to know for the proctored EKG competency test.
 Review Packet EKG Competency 2015 This packet is a review of the information you will need to know for the proctored EKG competency test. Normal Sinus Rhythm Rhythm: Regular Ventricular Rate: 60-100 bpm
ECG ABNORMALITIES D R. T AM A R A AL Q U D AH
 ECG ABNORMALITIES D R. T AM A R A AL Q U D AH When we interpret an ECG we compare it instantaneously with the normal ECG and normal variants stored in our memory; these memories are stored visually in
Arrhythmia Study Guide 3 Junctional and Ventricular Rhythms
 Arrhythmia Study Guide 3 Junctional and Ventricular Rhythms JUNCTIONAL RHYTHMS The AV Junction (Bundle of His and surrounding cells) only acts as pacemaker of the heart when the SA Node is not firing normally
CORONARY ARTERIES HEART
 CARDIAC/ECG MODULE THE HEART CORONARY ARTERIES FIBRILLATING HEART CORONARY ARTERIES HEART PRACTICE RHYTHMS PRACTICE RHYTHMS ELECTRICAL CONDUCTION SA Node (60 100) Primary pacemaker AV Node (40 60) ***Creates
Introduction to Electrocardiography
 Introduction to Electrocardiography Class Objectives: Introduction to ECG monitoring Discuss principles of interpretation Identify the components and measurements of the ECG ECG analysis ECG Monitoring
Rhythm ECG Characteristics Example. Normal Sinus Rhythm (NSR)
") Normal Sinus Rhythm (NSR) Rate: 60-100 per minute Rhythm: R- R = P waves: Upright, similar P-R: 0.12-0.20 second & consistent P:qRs: 1P:1qRs Sinus Tachycardia Exercise Hypovolemia Medications Fever Substances
Normal Sinus Rhythm (NSR) Rate: 60-100 per minute Rhythm: R- R = P waves: Upright, similar P-R: 0.12-0.20 second & consistent P:qRs: 1P:1qRs Sinus Tachycardia Exercise Hypovolemia Medications Fever Substances
Cardiac Telemetry Self Study: Part One Cardiovascular Review 2017 THINGS TO REMEMBER
 Please review the above anatomy of the heart. THINGS TO REMEMBER There are 3 electrolytes that affect cardiac function o Sodium, Potassium, and Calcium When any of these electrolytes are out of the normal
EKG Abnormalities. Adapted from:
 EKG Abnormalities Adapted from: http://www.bem.fi/book/19/19.htm Some key terms: Arrhythmia-an abnormal rhythm or sequence of events in the EKG Flutter-rapid depolarizations (and therefore contractions)
-RHYTHM PRACTICE- By Dr.moanes Msc.cardiology Assistant Lecturer of Cardiology Al Azhar University. OBHG Education Subcommittee
 -RHYTHM PRACTICE- By Dr.moanes Msc.cardiology Assistant Lecturer of Cardiology Al Azhar University The Normal Conduction System Sinus Node Normal Sinus Rhythm (NSR) Sinus Bradycardia Sinus Tachycardia
BEDSIDE ECG INTERPRETATION
 BEDSIDE ECG INTERPRETATION Presented by: Ryan Dean, RN, MSN, CCRN, CCNS, CFRN Flight Nurse 2017 Based on presentations originally by Gennifer DePaoli, RN Objectives Hospital policies Electrical conduction
Arrhythmic Complications of MI. Teferi Mitiku, MD Assistant Clinical Professor of Medicine University of California Irvine
 Arrhythmic Complications of MI Teferi Mitiku, MD Assistant Clinical Professor of Medicine University of California Irvine Objectives Brief overview -Pathophysiology of Arrhythmia ECG review of typical
Electrocardiography Abnormalities (Arrhythmias) 7. Faisal I. Mohammed, MD, PhD
 7. Faisal I. Mohammed, MD, PhD") Electrocardiography Abnormalities (Arrhythmias) 7 Faisal I. Mohammed, MD, PhD 1 Causes of Cardiac Arrythmias Abnormal rhythmicity of the pacemaker Shift of pacemaker from sinus node Blocks at different
Electrocardiography Abnormalities (Arrhythmias) 7 Faisal I. Mohammed, MD, PhD 1 Causes of Cardiac Arrythmias Abnormal rhythmicity of the pacemaker Shift of pacemaker from sinus node Blocks at different
This presentation will deal with the basics of ECG description as well as the physiological basics of
 Snímka 1 Electrocardiography basics This presentation will deal with the basics of ECG description as well as the physiological basics of Snímka 2 Lecture overview 1. Cardiac conduction system functional
Chapter 03: Sinus Mechanisms Test Bank MULTIPLE CHOICE
 Instant download and all chapters Tesst Bank ECGs Made Easy 5th Edition Barbara J Aehlert https://testbanklab.com/download/tesst-bank-ecgs-made-easy-5th-edition-barbara-jaehlert/ Chapter 03: Sinus Mechanisms
3/26/15 HTEC 91. EKG Sign-in Book. The Cardiac Cycle. Parts of the ECG. Waves. Waves. Review of protocol Review of placement of chest leads (V1, V2)
") EKG Sign-in Book HTEC 91 Review of protocol Review of placement of chest leads (V1, V2) Medical Office Diagnostic Tests Week 2 http://www.cvphysiology.com/arrhythmias/a013c.htm The Cardiac Cycle Represents
EKG Sign-in Book HTEC 91 Review of protocol Review of placement of chest leads (V1, V2) Medical Office Diagnostic Tests Week 2 http://www.cvphysiology.com/arrhythmias/a013c.htm The Cardiac Cycle Represents
Cardiac Arrhythmia How to approach นพ.พ น จ แกวส วรรณะ หน วยโรคห วใจและหลอดเล อด
 Cardiac Arrhythmia How to approach นพ.พ น จ แกวส วรรณะ หน วยโรคห วใจและหลอดเล อด EKG paper is a grid where time is measured along the horizontal axis. Each small square is 1 mm in length and represents
Full file at
 MULTIPLE CHOICE. Choose the one alternative that best completes the statement or answers the question. 1) What electrical event must occur for atrial kick to occur? 1) A) Atrial repolarization B) Ventricular
The ABCs of EKGs/ECGs for HCPs. Al Heuer, PhD, MBA, RRT, RPFT Professor, Rutgers School of Health Related Professions
 The ABCs of EKGs/ECGs for HCPs Al Heuer, PhD, MBA, RRT, RPFT Professor, Rutgers School of Health Related Professions Learning Objectives Review the basic anatomy of the heart Describe the cardiac conducting
Ekg pra pr c a tice D.HAMMOUDI.MD
 Ekg practice D.HAMMOUDI.MD Anatomy Revisited RCA (Right Coronary Artery) Right ventricle Inferior wall of LV Posterior wall of LV (75%) SA Node (60%) AV Node (>80%) LCA (Left Coronary Artery) Septal wall
EKG Rhythm Interpretation Exam
 as EKG Rhythm Interpretation Exam Name: Date: ID# Unit Assume each strip is a 6 second strip. Passing is 80%. 1. Identify the following rhythm: a. Asystole b. Ventricular fibrillation c. Atrial fibrillation
By the end of this lecture, you will be able to: Understand the 12 lead ECG in relation to the coronary circulation and myocardium Perform an ECG
 By the end of this lecture, you will be able to: Understand the 12 lead ECG in relation to the coronary circulation and myocardium Perform an ECG recording Identify the ECG changes that occur in the presence
Sample. Analyzing the Heart with EKG. Computer
 Analyzing the Heart with EKG Computer An electrocardiogram (ECG or EKG) is a graphical recording of the electrical events occurring within the heart. In a healthy heart there is a natural pacemaker in
12-Lead ECG Interpretation. Kathy Kuznar, RN, ANP
 12-Lead ECG Interpretation Kathy Kuznar, RN, ANP The 12-Lead ECG Objectives Identify the normal morphology and features of the 12- lead ECG. Perform systematic analysis of the 12-lead ECG. Recognize abnormalities
Chapter 9. Learning Objectives. Learning Objectives 9/11/2012. Cardiac Arrhythmias. Define electrical therapy
 Chapter 9 Cardiac Arrhythmias Learning Objectives Define electrical therapy Explain why electrical therapy is preferred initial therapy over drug administration for cardiac arrest and some arrhythmias
TELEMETRY BASICS FOR NURSING STUDENTS
 TELEMETRY BASICS FOR NURSING STUDENTS Accuracy of cardiac monitoring is an important component of patient safety in hospitalized patients who meet the criteria for dysrhythmia monitoring. (AACN, 2016,
Understanding the 12-lead ECG, part II
 Bundle-branch blocks Understanding the 12-lead ECG, part II Most common electrocardiogram (ECG) abnormality Appears as a wider than normal S complex Occurs when one of the two bundle branches can t conduct
ECG. Prepared by: Dr.Fatima Daoud Reference: Guyton and Hall Textbook of Medical Physiology,12 th edition Chapters: 11,12,13
 ECG Prepared by: Dr.Fatima Daoud Reference: Guyton and Hall Textbook of Medical Physiology,12 th edition Chapters: 11,12,13 The Concept When the cardiac impulse passes through the heart, electrical current
BASIC CONCEPT OF ECG
 BASIC CONCEPT OF ECG Electrocardiogram The electrocardiogram (ECG) is a recording of cardiac electrical activity. The electrical activity is readily detected by electrodes attached to the skin. After the
COURSE DESCRIPTION. Rev 2.0 7/2013. Page 1 of 26
 COURSE DESCRIPTION Ventricular dysrhythmias (arrhythmias) are unique and potentially dangerous cardiac rhythms. They are often associated with Code Blue calls, and life and death situations. The only two
4/14/15 HTEC 91. Topics for Today. Guess That Rhythm. Premature Ventricular Contractions (PVCs) Ventricular Rhythms
 Ventricular Rhythms") 4/14/15 Topics for Today HTEC 91 Medical Office Diagnostic Tests Week 5 Ventricular Rhythms PVCs: Premature Ventricular Contractions VT: Ventricular Tachycardia VF: Ventricular Fibrillation Asystole Study
4/14/15 Topics for Today HTEC 91 Medical Office Diagnostic Tests Week 5 Ventricular Rhythms PVCs: Premature Ventricular Contractions VT: Ventricular Tachycardia VF: Ventricular Fibrillation Asystole Study
physiology 6 Mohammed Jaafer Turquoise team
 15 physiology 6 Mohammed Jaafer 22-3-2016 Turquoise team Cardiac Arrhythmias and Their Electrocardiographic Interpretation Today, we are going to talk about the abnormal excitation. As we said before,
Electrocardiogram ECG. Hilal Al Saffar FRCP FACC College of medicine,baghdad University
 Electrocardiogram ECG Hilal Al Saffar FRCP FACC College of medicine,baghdad University Tuesday 29 October 2013 ECG introduction Wednesday 30 October 2013 Abnormal ECG ( ischemia, chamber hypertrophy, heart
Please check your answers with correct statements in answer pages after the ECG cases.
 ECG Cases ECG Case 1 Springer International Publishing AG, part of Springer Nature 2018 S. Okutucu, A. Oto, Interpreting ECGs in Clinical Practice, In Clinical Practice, https://doi.org/10.1007/978-3-319-90557-0
2) Heart Arrhythmias 2 - Dr. Abdullah Sharif
 Heart Arrhythmias 2 - Dr. Abdullah Sharif") 2) Heart Arrhythmias 2 - Dr. Abdullah Sharif Rhythms from the Sinus Node Sinus Tachycardia: HR > 100 b/m Causes: o Withdrawal of vagal tone & Sympathetic stimulation (exercise, fight or flight) o Fever
2) Heart Arrhythmias 2 - Dr. Abdullah Sharif Rhythms from the Sinus Node Sinus Tachycardia: HR > 100 b/m Causes: o Withdrawal of vagal tone & Sympathetic stimulation (exercise, fight or flight) o Fever
Northwest Community Healthcare Paramedic Education Program AV Conduction Defects/AV Blocks Connie J. Mattera, M.S., R.N., EMT-P
 Northwest Community Healthcare Paramedic Education Program AV Conduction Defects/ Connie J. Mattera, M.S., R.N., EMT-P Reading assignments: Bledsoe Vol. 3: pp. 88-93; 120-121 (atropine, norepinephrine,
ECG Interpretation. Introduction to Cardiac Telemetry. Michael Peters, RN, CCRN, CFRN CALSTAR Air Medical Services
 ECG Interpretation Introduction to Cardiac Telemetry Michael Peters, RN, CCRN, CFRN CALSTAR Air Medical Services Disclosures Nothing to disclose Objectives Describe the electrical conduction pathway in
Electrocardiography for Healthcare Professionals
 Electrocardiography for Healthcare Professionals Chapter 9: Ventricular Dysrhythmias 2012 The Companies, Inc. All rights reserved. Learning Outcomes 9.1 Describe the various ventricular dysrhythmias 9.2
ECG Interpretation and Clinical Significance
 Confirming Pages ECG Interpretation and Clinical Significance Chapter Outline 5.1 5.2 5.3 5.4 5.5 5.6 5.7 5.8 5.9 5.10 Learning Outcomes Key Terms Introduction (p. 114) Identifying the Components of the
PATIENT WITH ARRHYTHMIA IN DENTIST S OFFICE. Małgorzata Kurpesa, MD., PhD. Chair&Department of Cardiology
 PATIENT WITH ARRHYTHMIA IN DENTIST S OFFICE Małgorzata Kurpesa, MD., PhD. Chair&Department of Cardiology Medical University of Łódź The heart is made up of four chambers Left Atrium Right Atrium Left Ventricle
5- The normal electrocardiogram (ECG)
") 5- The (ECG) Introduction Electrocardiography is a process of recording electrical activities of heart muscle at skin surface. The electrical current spreads into the tissues surrounding the heart, a small
5- The (ECG) Introduction Electrocardiography is a process of recording electrical activities of heart muscle at skin surface. The electrical current spreads into the tissues surrounding the heart, a small
ECGs and Arrhythmias: Family Medicine Board Review 2009
 Rate Rhythm Intervals Hypertrophy ECGs and Arrhythmias: Family Medicine Board Review 2009 Axis Jess (Fogler) Waldura, MD University of California, San Francisco walduraj@nccc.ucsf.edu Ischemia Overview
Electrocardiography for Healthcare Professionals
 Electrocardiography for Healthcare Professionals Kathryn A. Booth Thomas O Brien Chapter 5: Rhythm Strip Interpretation and Sinus Rhythms Learning Outcomes 5.1 Explain the process of evaluating ECG tracings
Cardiology Flash Cards
 Cardiology Flash Cards EKG in a nut shell www.brain101.info Conduction System www.brain101.info 2 Analyzing EKG Step by step Steps in Analyzing ECG'S 1. Rhythm: - Regular _ Sinus, Junctional or Ventricular.
EKG Intermediate Tips, tricks, tools
 Birmingham Regional Emergency Medical Services System 2018 ALCTE Summer Conference EKG Intermediate Tips, tricks, tools Brian Gober, MAT, ATC, NRP, CSCS Education Services Manager ECC Training Center Coordinator
Basic ECG Interpretation Module Notebook
 Basic ECG Interpretation Module Notebook ECG_Notebook_04.27.05 Page 1 of 142 Basic ECG Interpretation Table of Contents Module Objectives... 3 Module Outline... 6 Lesson I... 6 Lesson II... 8 Lesson III...
EKG. Danil Hammoudi.MD
 EKG Danil Hammoudi.MD What is an EKG? The electrocardiogram (EKG) is a representation of the electrical events of the cardiac cycle. Each event has a distinctive waveform, the study of which can lead to
Step by step approach to EKG rhythm interpretation:
 Sinus Rhythms Normal sinus arrhythmia Small, slow variation of the R-R interval i.e. variation of the normal sinus heart rate with respiration, etc. Sinus Tachycardia Defined as sinus rhythm with a rate
Relax and Learn At the Farm 2012
 Relax and Learn At the Farm 2012 Session 2: 12 Lead ECG Fundamentals 101 Cynthia Webner DNP, RN, CCNS, CCRN-CMC, CHFN Though for Today Mastery is not something that strikes in an instant, like a thunderbolt,
ECG CONVENTIONS AND INTERVALS
 1 ECG Waveforms and Intervals ECG waveforms labeled alphabetically P wave== represents atrial depolarization QRS complex=ventricular depolarization ST-T-U complex (ST segment, T wave, and U wave)== V repolarization.
CASE 10. What would the ST segment of this ECG look like? On which leads would you see this ST segment change? What does the T wave represent?
 CASE 10 A 57-year-old man presents to the emergency center with complaints of chest pain with radiation to the left arm and jaw. He reports feeling anxious, diaphoretic, and short of breath. His past history
Basic EKG Interpretation. Nirja Parikh, PT, DPT
 Basic EKG Interpretation Nirja Parikh, PT, DPT Electrocardiogram (EKG) Using surface electrodes record the electrical activity of the heart electrical activity (usually) correlates to mechanical function
12 Lead ECG Skills: Building Confidence for Clinical Practice. Presented By: Cynthia Webner, BSN, RN, CCRN-CMC. Karen Marzlin, BSN, RN,CCRN-CMC
 12 Lead ECG Skills: Building Confidence for Clinical Practice NTI 2009 Preconference Session 803 Presented By: Karen Marzlin, BSN, RN,CCRN-CMC 1 12 Lead ECG Fundamentals: The Starting Place for Linking
Cardiac Arrhythmias. Cathy Percival, RN, FALU, FLMI VP, Medical Director AIG Life and Retirement Company
 Cardiac Arrhythmias Cathy Percival, RN, FALU, FLMI VP, Medical Director AIG Life and Retirement Company The Cardiovascular System Three primary functions Transport of oxygen, nutrients, and hormones to
Introduction to ECG Gary Martin, M.D.
 Brief review of basic concepts Introduction to ECG Gary Martin, M.D. The electrical activity of the heart is caused by a sequence of rapid ionic movements across cell membranes resulting first in depolarization
Interpreting Electrocardiograms (ECG) Physiology Name: Per:
 Physiology Name: Per:") Interpreting Electrocardiograms (ECG) Physiology Name: Per: Introduction The heart has its own system in place to create nerve impulses and does not actually require the brain to make it beat. This electrical
Interpreting Electrocardiograms (ECG) Physiology Name: Per: Introduction The heart has its own system in place to create nerve impulses and does not actually require the brain to make it beat. This electrical
Basic Dysrhythmia Interpretation
 Basic Dysrhythmia Interpretation Objectives 2 To understand the Basic ECG To understand the meaning of Dysrhythmia To describe the normal heart conduction system. To describe the normal impulse pathways.
The Electrocardiogram
 The Electrocardiogram Chapters 11 and 13 AUTUMN WEDAN AND NATASHA MCDOUGAL The Normal Electrocardiogram P-wave Generated when the atria depolarizes QRS-Complex Ventricles depolarizing before a contraction
The ECG Course. Boone County Fire Protection District EMS Education
 The ECG Course Level I G rated material AV Blocks What Causes AV Block? Long list of bad things that includes ischemia and.. Old age / disease Medications or drugs Electrolyte imbalances Physiologic Blocks
EKG Competency for Agency
 EKG Competency for Agency Name: Date: Agency: 1. The upper chambers of the heart are known as the: a. Atria b. Ventricles c. Mitral Valve d. Aortic Valve 2. The lower chambers of the heart are known as
Lake EMS Basic EKG Review: Atrial Rhythms. The Lake EMS Quality Development Team
 Lake EMS Basic EKG Review: Atrial Rhythms The Lake EMS Quality Development Team This program is the Intellectual Property of Lake Emergency Medical Services Use of this program is limited to training and
Dysrhythmias that every Learn how to recognize an abnormal cardiac rhythm and intervene appropriately. By AnneMarie Palatnik, RN, APN-BC, MSN
 Too fast, too slow, too ugly: Dysrhythmias that every Learn how to recognize an abnormal cardiac rhythm and intervene appropriately. By AnneMarie Palatnik, RN, APN-BC, MSN 2.5 ANCC CONTACT HOURS CONTINUOUS
Rate: The atrial and ventricular rates are equal; heart rate is greater than 100 bpm (usually between bpm).
.") Sinus Bradycardia Regularity: The R-R intervals are constant; the rhythm is regular. Rate: The atrial and ventricular rates are equal; heart rate is less than 60 bpm. P wave: There is a uniform P wave
Sinus Bradycardia Regularity: The R-R intervals are constant; the rhythm is regular. Rate: The atrial and ventricular rates are equal; heart rate is less than 60 bpm. P wave: There is a uniform P wave
5AB Dysrhythmia Interpretation tation and Management Review Please complete and return by:
 1 5AB Dysrhythmia Interpretation tation and Management Review 2014 RN Please complete and return by: Overview 2 This review begins with a discussion of the physiology of cardiac conduction, and then covers
15 16 September Seminar W10O. ECG for General Practice
 15 16 September 2012 Seminar W10O ECG for General Practice Speaker: Ms Natasha Eaton ECG for General Practice Speaker: Natasha Eaton Cardiac CNC Executive Representative Electrocardiography The graphic
Cardiac arrhythmias. Janusz Witowski. Department of Pathophysiology Poznan University of Medical Sciences. J. Witowski
 Cardiac arrhythmias Janusz Witowski Department of Pathophysiology Poznan University of Medical Sciences A 68-year old man presents to the emergency department late one evening complaining of increasing
ACLS Study Guide for Precourse Self-Assessment
 20 rhythm strips on Precourse Self-Assessment with the following matching choices: Agonal Rhythm/Asystole Atrial Fibrillation Flutter Ventricular Fibrillation Monomorphic Ventricular Normal Sinus Rhythm
REtrive. REpeat. RElearn Design by. Test-Enhanced Learning based ECG practice E-book
 Test-Enhanced Learning Test-Enhanced Learning Test-Enhanced Learning Test-Enhanced Learning based ECG practice E-book REtrive REpeat RElearn Design by S I T T I N U N T H A N G J U I P E E R I Y A W A
Family Medicine for English language students of Medical University of Lodz ECG. Jakub Dorożyński
 Family Medicine for English language students of Medical University of Lodz ECG Jakub Dorożyński Parts of an ECG The standard ECG has 12 leads: six of them are considered limb leads because they are placed
12 Lead ECG. Presented by Rebecca Sevigny BSN, RN Professional Practice & Development Dept.
 12 Lead ECG Presented by Rebecca Sevigny BSN, RN Professional Practice & Development Dept. Two Main Coronary Arteries RCA LCA which branches into Left Anterior Descending Circumflex Artery Two Main Coronary
Chapter 20 (2) The Heart
 The Heart") Chapter 20 (2) The Heart ----------------------------------------------------------------------------------------------------------------------------------------- Describe the component and function of
Chapter 20 (2) The Heart ----------------------------------------------------------------------------------------------------------------------------------------- Describe the component and function of
Atlantic Health System
 Atlantic Health System Morristown Medical Center Newton Medical Center Overlook Medical Center Basic Dysrhythmia Course Day 1 1 2 Chapter 1 Anatomy and Physiology Learning Objectives 1) Identify electrophysiology
ECG Interpretation Made Easy
 ECG Interpretation Made Easy Dr. A Tageldien Abdellah, MSc MD EBSC Lecturer of Cardiology- Hull University Hull York Medical School 2007-2008 ECG Interpretation Made Easy Synopsis Benefits Objectives Process
BASIC PRINCIPLES OF ECG INTERPRETATION
 Chapter 1 BASIC PRINCIPLES OF ECG INTERPRETATION Cardiac rhythm analysis may be accomplished informally via cardiac monitoring and more diagnostically via a 12-lead electrocardiogram (ECG). An electrocardiogram
Pennsylvania Academy of Family Physicians Foundation & UPMC 43rd Refresher Course in Family Medicine CME Conference March 10-13, 2016
 Pennsylvania Academy of Family Physicians Foundation & UPMC 43rd Refresher Course in Family Medicine CME Conference March 10-13, 2016 Disclosures: EKG Workshop Louis Mancano, MD Speaker has no disclosures
ELECTROCARDIOGRAPHY (ECG)
") ELECTROCARDIOGRAPHY (ECG) The heart is a muscular organ, which pumps blood through the blood vessels of the circulatory system. Blood provides the body with oxygen and nutrients, as well as assists in
ELECTROCARDIOGRAPHY (ECG) The heart is a muscular organ, which pumps blood through the blood vessels of the circulatory system. Blood provides the body with oxygen and nutrients, as well as assists in
WHAT S THAT RHYTHM I AM HEARING? GUIDE TO AUSCULTATION OF ARRHYTHMIAS IN HORSES
 WHAT S THAT RHYTHM I AM HEARING? GUIDE TO AUSCULTATION OF ARRHYTHMIAS IN HORSES Michelle Henry Barton DVM, PhD, DACVIM University of Georgia, Athens, GA INTRODUCTION The purpose of this talk is to review
The Electrocardiogram part II. Dr. Adelina Vlad, MD PhD
 The Electrocardiogram part II Dr. Adelina Vlad, MD PhD Basic Interpretation of the ECG 1) Evaluate calibration 2) Calculate rate 3) Determine rhythm 4) Determine QRS axis 5) Measure intervals 6) Analyze
12 Lead EKG. The Basics
 12 Lead EKG The Basics Objectives Demonstrate proper 12 EKG lead placement Determine electrical axis Identify ST and T wave changes as they relate to myocardial ischemia Describe possible complications
Telemetry Interpretation: Rates, Rhythms, and More
 Telemetry Interpretation: Rates, Rhythms, and More This course has been awarded three (3) contact hours. This course expires on January 31, 2021. Copyright 2008 by RN.com. All Rights Reserved. Reproduction
Arrhythmias. Sarah B. Murthi Department of Surgery University of Maryland Medical School R. Adams Cowley Shock Trauma Center
 Arrhythmias Sarah B. Murthi Department of Surgery University of Maryland Medical School R. Adams Cowley Shock Trauma Center 2012 Clinical Congress Presenter Disclosure Slide American College of Surgeons
ECG interpretation basics
 ECG interpretation basics Michał Walczewski, MD Krzysztof Ozierański, MD 21.03.18 Electrical conduction system of the heart Limb leads Precordial leads 21.03.18 Precordial leads Precordial leads 21.03.18
Lecture outline. Electrical properties of the heart. Automaticity. Excitability. Refractoriness. The ABCs of ECGs Back to Basics Part I
 Lecture outline The ABCs of ECGs Back to Basics Part I Meg Sleeper VMD, DACVIM (cardiology) University of Florida Veterinary School Electrical properties of the heart Action potentials Normal intracardiac
DR QAZI IMTIAZ RASOOL OBJECTIVES
 PRACTICAL ELECTROCARDIOGRAPHY DR QAZI IMTIAZ RASOOL OBJECTIVES Recording of electrical events in heart Established electrode pattern results in specific tracing pattern Health of heart i. e. Anatomical
Diploma in Electrocardiography
 The Society for Cardiological Science and Technology Diploma in Electrocardiography The Society makes this award to candidates who can demonstrate the ability to accurately record a resting 12-lead electrocardiogram
Analyzing the Heart with EKG
 Analyzing the Heart with EKG LabQuest An electrocardiogram (ECG or EKG) is a graphical recording of the electrical events occurring within the heart. In a healthy heart there is a natural pacemaker in
CHAPTER 17 Patient Assessment: Cardiovascular System 245
 CHAPTER 17 Patient Assessment: Cardiovascular System 245 at any time to aid in diagnosis and to note trends in the patient s status Wireless communication devices carried by the nurse that provide data
Lake EMS Basic EKG Review: Dreaded Heart Blocks. The Lake EMS Quality Development Team
 Lake EMS Basic EKG Review: Dreaded Heart Blocks The Lake EMS Quality Development Team This program is the Intellectual Property of Lake Emergency Medical Services Use of this program is limited to training
Electrocardiography for Healthcare Professionals
 Electrocardiography for Healthcare Professionals Chapter 7: Junctional Dysrhythmias 2012 The Companies, Inc. All rights reserved. Learning Outcomes 7.1 Describe the various junctional dysrhythmias 7.2
8/20/2012. Learning Outcomes (Cont d)
") 1 2 3 4 Electrocardiography for Healthcare Professionals Chapter 7: Junctional Dysrhythmias Learning Outcomes 7.1 Describe the various junctional dysrhythmias 7.2 Identify premature junctional complexes
1 2 3 4 Electrocardiography for Healthcare Professionals Chapter 7: Junctional Dysrhythmias Learning Outcomes 7.1 Describe the various junctional dysrhythmias 7.2 Identify premature junctional complexes
A Review of Cardiac Pathophysiology and EKG. Jamie Dyson PT, DPT Kathy Swanick PT, DPT, OCS
 A Review of Cardiac Pathophysiology and EKG Jamie Dyson PT, DPT Kathy Swanick PT, DPT, OCS Cardiac Pathophysiology Coronary Artery Disease Congestive Heart Failure Valvular Heart Disease Athletic Heart