Perirhinal and Postrhinal Cortices of the Rat: Interconnectivity and Connections With the Entorhinal Cortex
|
|
|
- Roderick Harvey
- 5 years ago
- Views:
Transcription
1 THE JOURNAL OF COMPARATIVE NEUROLOGY 391: (1998) Perirhinal and Postrhinal Cortices of the Rat: Interconnectivity and Connections With the Entorhinal Cortex REBECCA D. BURWELL 1 * AND DAVID G. AMARAL 2 1 Department of Psychology, Brown University, Providence, Rhode Island Department of Psychiatry and Center for Neuroscience, The University of California at Davis, Davis, California ABSTRACT The cortical regions dorsally adjacent to the posterior rhinal sulcus in the rat can be divided into a rostral region, the perirhinal cortex, which shares features of the monkey perirhinal cortex, and a caudal region, the postrhinal cortex, which has connectional attributes similar to the monkey parahippocampal cortex. We examined the connectivity among the rat perirhinal (areas 35 and 36), postrhinal, and entorhinal cortices by placing anterograde and retrograde tracers in all three regions. There is a dorsal-to-ventral cascade of connections in the perirhinal and entorhinal cortices. Dorsal area 36 projects strongly to ventral area 36, and ventral area 36 projects strongly to area 35. The return projections are substantially weaker. The cascade continues with the perirhinal to entorhinal connections. Area 35 is more strongly interconnected with the entorhinal cortex, ventral area 36 somewhat less strongly, and dorsal area 36 projects only weakly to the entorhinal cortex. The postrhinal-to-perirhinal connections also follow this general pattern. The postrhinal cortex is more heavily connected with dorsal area 36 than with ventral area 36 and is more heavily connected with area 36 than with area 35. The rostral portion of the postrhinal cortex has the strongest connections with the perirhinal cortex. Like in the monkey, the perirhinal and postrhinal cortices have different patterns of projections to the entorhinal cortex. The perirhinal cortex is preferentially connected with the rostrolateral portion of the entorhinal cortex. The postrhinal cortex projects to a part of this same region but is also connected to caudal and medial portions of the entorhinal cortex. The perirhinal and postrhinal projections to the entorhinal cortex originate in layers III and V and terminate preferentially in layers II and III. J. Comp. Neurol. 391: , Wiley-Liss, Inc. Indexing terms: polysensory cortex; hippocampus; memory; anterograde; retrograde The primate perirhinal and parahippocampal cortices play a critical role in certain forms of memory (Gaffan and Murray, 1992; Murray and Mishkin, 1986; Suzuki et al., 1993; Zola-Morgan et al., 1989). The origins of cortical input differ for the two regions (Suzuki and Amaral, 1994a), suggesting that they might contribute differently to memory function. In the rat, most cytoarchitectonic descriptions of the cortex include a region called the perirhinal cortex, although the borders differ widely in different studies. This region is commonly taken to be the homologue of the perirhinal cortex in the monkey (for review, see Burwell et al., 1995) and has also been implicated in memory (Bunsey and Eichenbaum, 1993; Mumby and Pinel, 1994; Myhrer and Wangen, 1996; Otto and Eichenbaum, 1992; Wiig et al., 1996; Zhu et al., 1995). Until recently, there were insufficient neuroanatomical data on the rat perirhinal cortex to resolve controversial issues, such as the precise borders of the field. Another unresolved issue is whether there is any region of the rat brain that is homologous to the monkey parahippocampal cortex. We have conducted a program of cytoarchitectonic, histochemical, and connectional studies on the rat perirhinal region that shed new light on these issues (preliminary data reported in Burwell and Amaral, 1993, 1995, 1996; Burwell et al., 1994; Dolorfo and Amaral, 1993, 1994). These data provide support for the conclusion that the Grant sponsor: NIH; Grant number: NS 16980; Grant sponsor: NIMH; Grant number: F32-NS *Correspondence to: Rebecca D. Burwell, Ph.D., Department of Psychology, Brown University, Providence, RI rebecca_burwell@brown.edu Received 13 June 1997; Revised 18 September 1997; Accepted 19 September WILEY-LISS, INC.
2 294 R.D. BURWELL AND D.G. AMARAL rostral perirhinal region in the rat resembles the perirhinal cortex of the monkey, and the caudal perirhinal region exhibits connectional characteristics similar to those of the parahippocampal cortex of the monkey. For reasons that we have reviewed elsewhere (Burwell et al., 1995), the term postrhinal, originally used by Deacon et al. (1983), rather than parahippocampal, has been applied to the caudal region in the rat. Essentially, although the postrhinal cortex appears to have connectional similarities with the parahippocampal cortex, the cytoarchitecture of the rat and monkey regions is quite different. Maintenance of the two terms for these regions is justified, because, in the rat, as in the monkey, the cytoarchitecture of the two regions is quite distinct. Moreover, the origins of cortical input to the rat perirhinal and postrhinal cortices differ substantially. For example, the perirhinal cortex receives roughly 4% of its cortical input from visual associational regions, whereas the postrhinal cortex receives almost 40% (Burwell and Amaral, unpublished findings). The perirhinal cortex, in contrast, receives substantially more somatosensory, olfactory, and auditory input than the postrhinal cortex. The two regions also differ substantially in the amount of input from cingulate, retrosplenial, and parietal regions, with the postrhinal cortex receiving the stronger inputs (Burwell and Amaral, unpublished findings). In the monkey, the perirhinal and parahippocampal cortices provide the major source of sensory information to the hippocampal formation through their connections with the entorhinal cortex (Insausti et al., 1987). The extent and patterns of perirhinal and postrhinal connections with the rat hippocampal formation have not yet been studied extensively. In fact, in the only previous study of the connectivity of the perirhinal region, the perirhinal-toentorhinal connections were largely ignored (Deacon et al., 1983). Given the major role that these regions are likely to play in memory function in the rat, it is important to determine the details of how these regions are interconnected and how they interact with the entorhinal cortex. We present here a detailed description of the topography and laminar pattern of interconnections among the perirhinal, postrhinal, and entorhinal cortices of the rat. MATERIALS AND METHODS Surgery One hundred and twenty-seven previously untreated, male, Sprague-Dawley rats obtained from Harlan Laboratories (Houston, TX) and weighing between 300 g and 400 g were used for these neuroanatomical tracing experiments. Injection sites from 42 cases were selected for analysis. All subjects were housed individually or in pairs under standard vivarium conditions with ad libitum access to food and water. All methods involving the use of live subjects were approved by the appropriate institutional animal care committee and conformed to NIH guidelines. Animals were anesthetized with one of two protocols. Subjects were either injected with pentobarbital sodium (n 98; Nembutal; 50 mg/kg, i.p.; Abbott Laboratories, North Chicago, IL) or brought to a surgical level of anesthesia with halothane gas (n 29). All subjects were then secured in a Kopf stereotaxic apparatus (Tujunga, CA) in the flat skull position. A hole was drilled in the skull above each intended injection site, and a small incision was made in the dura to permit unobstructed penetration of the glass micropipette. Each animal received one to three tracer injections. After all injections were completed, the wound was sutured, and the animal was kept warm in its cage for 1 2 hours before being returned to the colony. Anterograde tracer injections. The anterograde tracers, Phaseolus vulgaris-leucoagglutinin (PHA-L; Vector Laboratories, Burlingame, CA) or biotinylated dextran amine (BDA; Molecular Probes, Inc., Eugene, OR), were stereotaxically injected at various locations along the rhinal sulcus according to the rat brain atlas of Paxinos and Watson (1986). PHA-L was used in a 2.5% solution in 0.1 M phosphate-buffered saline (PBS), and BDA was used in a 10% solution in 0.1 M PBS. The tracers were injected by iontophoresis with positive DC current (4 µamps; 7 seconds on and 7 seconds off) for 8 minutes through glass micropipettes with tip diameters ranging from 5 µm to 15 µm. Retrograde tracer injections. The retrograde tracers, fast blue (FB) or Diamidino yellow (DY; Dr. Illing GmbH and Co., Gross Umstadt, Germany), were stereotaxically injected at various locations along the rhinal sulcus (Paxinos and Watson, 1986). For FB, approximately 150 nl of a 3% solution in distilled H 2 O were injected. For DY, approximately 200 nl of a 2% solution in distilled H 2 O were injected. In one experiment (108FG), 100 nl of a 2% solution of Fluoro-Gold (FG; Fluorochrome, Inc., Englewood, CO) in normal saline was used (Schmued and Fallon, 1986). The tracers were injected through glass micropipettes (tip diameters ranging from 60 µm to 90 µm) with air-pressure pulses (Amaral and Price, 1983). The approximate rate of injection was 30 nl/minute. Following injection of the tracer, the micropipette was raised 100 µm, followed by a 10-minute wait, then slowly raised the remaining distance in 5 10 minutes, depending upon the depth of the injection site. Tissue processing Following a 7 9 day survival period, subjects were deeply anesthetized with a 35% solution of chloral hydrate. The subjects were transcardially perfused by using a ph-shift protocol, chosen to optimize immunohistochemical processing of the anterograde tracers. The perfusion was accomplished with a peristaltic pump at a flow rate of ml/minute. Room temperature saline was first perfused for 2 minutes to clear the blood. Saline was followed by a solution of 4% paraformaldehyde in 0.1 M sodium acetate buffer, ph 6.5, at 4 C for 10 minutes followed by a solution of 4% paraformaldehyde in 0.1 M sodium borate buffer, ph 9.5, at 4 C for 15 minutes. Ice was packed around the head of the animals during perfusion. After removal from the skull, the brains were postfixed for 6 hours in the final fixative at 4 C and cryoprotected for at least 24 hours by using 20% glycerol in 0.02 M potassium PBS (KPBS), ph 7.4, at 4 C. The brains were coronally sectioned at 30 µm on a freezing microtome. Sections were collected in five series for processing and storage. Depending on the experiment, one or two 1-in-5 (1:5) series were collected in KPBS for immunohistochemical processing for anterograde tracers, and one or two 1:5 series were collected into 0.1 M phosphate buffer for retrograde tracer procedures. One series was mounted and stained for Nissl by using thionin. The remaining one or two series were collected and stored at 20 C in cryoprotectant tissue-collecting solution con-
3 PERIRHINAL, POSTRHINAL, AND ENTORHINAL INTERCONNECTIONS 295 sisting of 30% ethylene glycol and 20% glycerol in sodium phosphate buffer, ph 7.4. Anterograde tracer procedures. Immunohistochemical processing for visualization of PHA-L-immunoreactive fibers was accomplished by one of two methods, depending on whether the subject received one anterograde injection of PHA-L alone or two injections of PHA-L and BDA. The first method was adapted from Gerfen and Sawchenko (1984) and employed a biotinylated secondary antibody with an avidin-biotin incubation to visualize PHA-Limmunoreactive fibers. Nonspecific binding was reduced by incubating the sections for 2 3 hours in 5% normal goat serum (NGS) and 0.5% Triton X-100 (TX) in KPBS. The sections were then incubated in the primary antiserum solution of rabbit anti-pha-l (1:12,000 dilution; Dako, Carpenteria, CA) in 0.3% TX and 2% NGS in KPBS at 4 C for hours. The remainder of processing was conducted at room temperature. Following two 10-minute washes in 2% NGS in KPBS, the sections were incubated in the biotinylated secondary antibody solution containing goat anti-rabbit IgG (1:227 dilution; Vector Laboratories, Burlingame, CA), 0.3% TX, and 2% NGS in KPBS for 1 hour. Following two 10-minute washes in 2% NGS in KPBS, the sections were incubated in a solution of avidin reagent and stabilizer (1:100 and 1:200 dilutions, respectively; Super ABC Kit; Biomeda Corporation, Foster City, CA) in KPBS for 45 minutes. The sections were washed twice for 10 minutes in 2% NGS in KPBS and then recycled into the biotinylated secondary solution for 45 minutes. The sections were then washed twice for 10 minutes in KPBS only and recycled into the avidin solution for 30 minutes. Following three 10-minute washes in KPBS, the sections were processed for visualization by incubation in 0.05% diaminobenzidine (DAB; Pierce, Tacoma, WA) and 0.04% H 2 O 2 in KPBS for 5 10 minutes. The second method for PHA-L visualization was used for tissue that also contained BDA and utilized a peroxidase anti-peroxidase (PAP) complex rather than an avidin reagent. The protocol for this method was identical to the one described previously, with the following exceptions: The secondary antiserum was goat anti-rabbit IgG from Sternberger Monoclonals (Baltimore, MD) at a 1:200 dilution, and the two avidin-reaction incubations were replaced by PAP incubations utilizing a rabbit-pap complex, also from Sternberger Monoclonals, at a 1:200 dilution. An avidin-biotin reaction was used for visualization of BDA-immunoreactive fibers. The sections were first pretreated in a 1% solution of TX in KPBS for 1 hour to increase subsequent penetration of the reagents. The sections were incubated overnight at 4 C in a solution of avidin reagent and stabilizer (1:25 and 1:50 dilutions, respectively; Super ABC Kit; Biomeda Corporation) in KPBS plus 0.1% solution of TX. Following three 10-minute washes in KPBS, the sections were processed for visualization by incubation at room temperature in 0.05% DAB and 0.04% H 2 O 2 in KPBS for minutes. After immunohistochemical processing, all sections were washed, mounted on gelatin-coated slides, dried, defatted, and intensified with osmium tetroxide and thiocarbohydrazide (Lewis et al., 1986). Retrograde tracer procedures. Sections to be analyzed for fluorescent, retrogradely labeled cells were mounted onto gelatin-coated slides. The mounted tissue was dried for 2 4 hours in a vacuum dessicator at room temperature, dehydrated in 100% ethanol (2 2 minutes), cleared in xylene (3 2 minutes), and coverslipped with DPX. This technique improves visibility and retards fading of fluorescent dyes, indefinitely preserving material for repeated inspection. Data analysis To quantify and present the patterns of anterograde or retrograde labeling within a cortical region, a technique was employed that permits displaying the three dimensional distribution of label in two dimensions. This can be accomplished by flattening, or unfolding, the surface of the neocortex from the coronal sections. Techniques for constructing unfolded maps of cortical regions have been described previously (Suzuki and Amaral, 1996; Van Essen and Maunsell, 1980). Construction of two-dimensional unfolded maps. In the present study, unfolded maps of the perirhinal, postrhinal, and entorhinal cortices were used for documenting patterns of anterograde and retrograde labeling. Figure 1A shows lateral (top) and ventral (bottom) surface views of the rat brain, with these regions designated by different shading patterns. Figure 1C shows a subset of the drawings used to construct the map. Figure 1B shows the finished map. The fundus of the rhinal sulcus was marked for use as the alignment point. At more caudal levels, where the rhinal sulcus is little more than a shallow indentation, a point was marked at the center of the indentation. To quantify the number of retrogradely labeled cells, counting bins were constructed throughout the analyzed cortex. A spreadsheet program (Excel; Microsoft, Redmond, WA) was used to create straight-line, unfolded maps from the analyzed cortical sections (Fig. 1C, right). The resulting unfolded map represents the surface area of the perirhinal, postrhinal, and entorhinal cortices for each case. Quantification of anterograde label. Sections from each anterograde experiment were initially surveyed by using both bright- and darkfield optics. Section contours were drawn from a 1:5 series of 30-µm Nissl-stained sections at a total magnification of 16 by using a Wild stereomicroscope (Leica, Deerfield, IL). The contour surface was then segmented at 4-mm intervals representing 250-µm columns. For density analysis, the adjacent PHA-Lor BDA-labeled sections were examined at a total magnification of 50 or 125, depending on the quality of the labeled material, with a Leica Laborlux D microscope fitted with a drawing tube. The density of anterograde label was rated while it was visualized with darkfield optics. Density for all experiments was rated according to a five-level set of standards, designated very light, light, moderate, heavy, and very heavy. Qualitatively, the standards ranged from very light, in which the labeling consisted of only one to a few fibers, to very heavy, in which the labeling was so dense that individual fibers could not be discerned. Once all the contours were analyzed, the location of the injection site and the density level for each column of cortex were entered into the appropriate bins of the Excel spreadsheet. For easier interpretation and presentation of the data, the numeric density ratings were transformed
4 296 R.D. BURWELL AND D.G. AMARAL Fig. 1. A: Lateral (top) and ventral (bottom) views of the rat brain. The perirhinal cortex (PR) is shown in two shades of unmarked gray. The darker gray represents area 36 (36), and the lighter gray represents area 35 (35). The postrhinal cortex (POR) is indicated by a dotted shading pattern on light gray. The entorhinal cortex (EC) is shown in a hatched pattern on light or dark gray. The lateral entorhinal area (LEA) is dark, and the medial entorhinal area (MEA) is light. Vertical lines mark the locations of six coronal planes labeled a f. B: Straight-line, unfolded surface map of the PR, POR, and EC. Letters a f indicate slabs of the unfolded map that correspond to the coronal planes demarcated in the surface views. C: Six coronal sections used for the unfolded map. Each coronal section corresponds to the indicated level of the surface views and the unfolded map. Level with respect to Bregma is shown below for each section for Swanson (1992) and for Paxinos and Watson (1986). rs, Rhinal sulcus; PaSub, parasubiculum; D, dorsal; L, lateral; R, rostral; C, caudal; V, ventral; M, medial. into a five-level gray scale, and straight-line, unfolded maps were generated. The bins corresponding to columns in which the injection site was located were marked by a distinctive pattern. After the experiments were analyzed in this way, all of the injection sites were transferred to a composite unfolded map (Fig. 2A). Quantification of retrogradely labeled cells. Sections from each retrograde experiment were initially surveyed for placement of injection site by using brightfield optics. The contour of the hemisphere and the distribution of fluorescently labeled cells were then plotted for a 1:10 series of sections throughout the ipsilateral perirhinal, postrhinal, and entorhinal cortices. This was accomplished at a total magnification of 100 by using a computerized data collection system (Neurolucida V1.5; MicroBrightfield, Inc., Colchester, VT) coupled to a Nikon Optiphot-2 microscope (Tokyo, Japan). The contours and plotted cells were printed at a magnification of 16. The plots were

5 PERIRHINAL, POSTRHINAL, AND ENTORHINAL INTERCONNECTIONS 297 Fig. 2. A: Representative unfolded map of the perirhinal (PR; areas 35 and 36), postrhinal (POR), and entorhinal (EC; areas lateral entorhinal area [LEA] and medial entorhinal area [MEA]) cortices showing the location of the 24 anterograde injection sites selected for analysis. Hatching or open boxes are used to show location when injection sites are overlapping. Otherwise, the sites are shown in shades of gray. B: Representative unfolded map showing the location of the 33 retrograde injection sites selected for analysis. C: Generic unfolded map showing the approximate location of the lateral, intermediate, and medial dentate-projecting bands in the entorhinal cortex. See text for details of the organization of these projections. DG, dentate gyrus; B, biotinylated dextranamine (BDA); P, Phaseolus vulgaris-leucoagglutinin (PHA-L); FB, fast blue; DY, Diamidino yellow. Scale bar 1 mm. aligned to adjacent Nissl-stained sections by using a Wild stereomicroscope in order to add cytoarchitectonic borders and to document the location of the injection site. The contour surface was then segmented at 4.8-mm intervals representing 300-µm sampling columns. The number of retrogradely labeled cells per column was counted for the perirhinal, postrhinal, and entorhinal cortices. The numbers of retrogradely labeled cells and the location of the injection site were then entered into a spreadsheet to generate a straight-line, unfolded map. To better present the data and permit comparison with unfolded maps of anterograde material, the density of label was transformed into a five-level proportional density scale. Only the bins representing columns of cortex with some retrogradely labeled cells were included in the proportion. These density levels were then converted into a five-level gray scale, representing density of labeling in each bin. Bins with labeling above the 90th percentile were designated very heavy and are shown in black. Bins above the 75th percentile and below the 90th were designated as representing heavy labeling and are shown in dark gray. Bins between the 55th and 75th percentiles represent moderate labeling and are shown in middle gray. Bins between the 30th and 55th percentiles represent light labeling and are shown in light gray. Bins below the 30th percentile were designated very light and are shown in very light gray. Bins representing columns in which the injection site was located were marked by a distinctive shading pattern. When all experiments were analyzed, the injection sites were transferred to a composite generic, unfolded map (Fig. 2B). RESULTS Nomenclature Based on cytoarchitectonic, chemoarchitectonic, and connectional criteria, we have proposed that the perirhinal cortex be divided into two regions: a rostral region, for which we have retained the name perirhinal cortex, and a caudal region, termed the postrhinal cortex (Burwell and Amaral, 1995; Burwell et al., 1995). A detailed description of the borders and neuroanatomical characteristics of these regions is in preparation (Burwell and Amaral, unpublished observations). For the purposes of the present study, the major neuroanatomical features that we used to set the borders of the perirhinal and postrhinal cortices will be briefly described. The perirhinal, postrhinal, and entorhinal cortices of the rat occupy the lateral, ventral, and caudal surfaces of the posterior cortical mantle. The perirhinal and postrhinal cortices comprise a strip of cortex on the lateral surface of the rat brain; the perirhinal cortex lies rostral to the postrhinal cortex (Fig. 1A, top). The entorhinal cortex provides the ventral border for the posterior perirhinal cortex and the postrhinal cortex and wraps around the ventrocaudal surface of the brain (Fig. 1A, top, Fig. 1B). Previous descriptions indicated that the perirhinal and postrhinal cortices occupy both banks of the rhinal sulcus from midrostrocaudal levels to its caudal extent (Deacon et al., 1983). Subsequent histochemical and tract tracing studies, however, showed that the entorhinal cortex occupies both banks of the rhinal sulcus at caudal levels (Dolorfo and Amaral, 1993). The postrhinal cortex lies
6 298 R.D. BURWELL AND D.G. AMARAL dorsally adjacent to the entorhinal cortex and does not include any of the cortex that occupies the rhinal sulcus (Fig. 1C,e,f). Perirhinal cortex. The perirhinal cortex is comprised of two strips of cortex associated with the most deeply invaginated portion of the rhinal sulcus. The region is bordered rostrally by the insular cortex, which overlies the claustrum. The perirhinal cortex, as we have defined it, begins at the caudal limit of the claustrum. The rostrocaudal level at which this border occurs corresponds roughly to plate 26 of Paxinos and Watson (1986). Area 35 is a narrow strip of cortex that primarily occupies the ventral bank and the fundus of the rhinal sulcus. Area 36 is a broader, more dorsally situated strip that includes much of the dorsal bank of the rhinal sulcus as well as a portion of the dorsally adjacent cortex. Area 35 in the rat is agranular cortex characterized by a broad layer I. It is distinguished from the nearby piriform and entorhinal cortices by a population of lightly stained round cells occupying layer II and a poorly populated layer III. Layer V is distinguished by the occurrence of large, darkly stained, heart-shaped pyramidal cells that are organized in a gradient fashion, with smaller cells located superficially and progressively larger cells located more deeply in the layer. In the portion of area 35 that lies ventral and deep to the fundus of the rhinal sulcus, the cells are arranged in a distinctive arc-like pattern. Area 36 has a distinctly different cytoarchitecture from area 35. It is characterized by a prominent layer II containing many round cells that are often smaller and darker than those in area 35. Layer II generally has a patchy appearance. Layer III is sparsely populated with small pyramids. A very weak granular layer (IV) is present in which granule cells are intermixed with the cells that constitute layers III and V. Layer V is noticeably broader, and the cells are smaller and more densely packed than in layer V of area 35. In dorsal portions of area 36, the cortex is organized in a more columnar fashion. Layer IV is more prominent in the dorsal portion of the field. Layer V is broader, and the cells are slightly larger and less densely packed than in ventral area 36. Area 36 extends caudally beyond the level at which area 35 is visible and, at these levels, is bordered ventrally by the entorhinal cortex. At caudal levels, area 36 is less radial in appearance, and the differences between the dorsal and ventral area 36 are less apparent. By most accounts, the dorsal border of the perirhinal cortex is formed by association cortex, either multimodal association cortex or auditory association cortex (Kreig, 1946a,b; Swanson, 1992; Zilles, 1985). The band of cortex lying dorsal to area 36 can be distinguished from it by a combination of several cytoarchitectonic features. The cortex, in general, is both more columnar and more laminar. Layer IV is clearly visible. Layer V is broader and sparsely populated with larger cells. Layer VI is also broader than that of area 36 and is separated from layer V by a cell sparse gap. It is important to note that the perirhinal cortex, as defined here, extends farther dorsally than typically described. The region includes the ventral portions of caudal Par2, Te3, and Te2 according to Paxinos and Watson (1986) and the ventral portion of Tev according to Swanson (1992). Postrhinal cortex. This postrhinal cortex includes portions of areas that have been described previously as the perirhinal, ectorhinal, and postrhinal cortices. The borders, as defined here, are different from all previous descriptions (for full discussion, see Burwell et al., 1995). The postrhinal cortex is located caudal to the perirhinal cortex and dorsal to the rhinal sulcus. Perhaps the most characteristic cytoarchitectonic feature of the POR is its bilaminate appearance. Layers II and III are fused and have a fairly homogeneous appearance due to the similar size, staining intensity, and packing densities of the resident cells. Cells in layers V and VI are also merged and are quite similar in appearance. In the ventral portion of the postrhinal cortex, layer V is narrower than in the dorsal portion. Another difference between dorsal and ventral postrhinal cortex is that cells in layer III are relatively homogeneous ventrally but are more heterogeneous in size, shape and color dorsally. The postrhinal cortex can be distinguished from the dorsally adjacent associational regions primarily by the differences in layer IV; dorsally adjacent cortices have a much more prominent layer IV. The postrhinal cortex is bordered medially by the cytoarchitectonically distinct agranular retrosplenial cortex (Vogt, 1985). Although the retrosplenial cortex has a broad fused layer II/III, like the postrhinal cortex, it has a weaker layer IV that is nonetheless made up of distinctive, very large cells. In horizontal sections, there are prominent cell-sparse gaps on either side of layer IV. The postrhinal cortex is bordered ventrally mainly by the entorhinal cortex. The caudomedial portion of the postrhinal cortex, however, is bordered by a thin band of the parasubiculum that is interposed between the entorhinal and postrhinal cortices (Fig. 1C,f). The postrhinal cortex, as defined here, includes the most caudal portions of the perirhinal cortex and Te2 as well as ventral portions of Oc2L according to Paxinos and Watson (1986). In Swanson s terminology (1992) our postrhinal cortex includes caudal ectorhinal cortex and the ventral portion of caudal Tev. Entorhinal cortex. The nomenclature used for the entorhinal cortex is based on classical descriptions of this region (Blackstad, 1956; Kreig, 1946a,b). The entorhinal cortex is subdivided into a lateral entorhinal area (LEA) and a medial entorhinal area (MEA; Fig. 1A). The LEA is a roughly triangular-shaped region of cortex (Fig. 1B). It is bordered dorsally by the perirhinal and postrhinal cortices and rostrally by the piriform and periamygdaloid cortices. At caudal levels, the LEA is bordered caudally and medially by the MEA. The MEA is interposed between the postrhinal cortex and caudal LEA. The MEA, which encompasses a substantial portion of the caudal pole of the cortical mantle, is bordered medially by the parasubiculum (Dolorfo and Amaral, 1993). Description of injection sites Figure 2 shows the location of the anterograde (Fig. 2A) and retrograde (Fig. 2B) tracer injection sites that were selected for analysis. The injection sites are plotted on representative straight-line, unfolded maps of the perirhinal, postrhinal, and entorhinal cortices. Tracer experiments were selected for analysis on the basis of location of the injection site and the quality of labeled material. Twenty-four representative experimental injections were selected from a library of 75 anterograde tracer injection sites in and around the perirhinal, postrhinal, and entorhinal cortices. It is evident in the unfolded maps that no systematic differences in the density or patterns of fiber
7 PERIRHINAL, POSTRHINAL, AND ENTORHINAL INTERCONNECTIONS 299 TABLE 1. Anterograde Tracer Injection Sites 1 Location Experiment Size (µm) Layer Perirhinal Rostral area 36 54P 400 V VI Rostral area 36 90P 400 V VI Midrostrocaudal area 36 45P 300 V VI Midrostrocaudal area 36 62B 400 II V Midrostrocaudal area B 400 II VI Ventral area B III VI Ventral area B 300 II V Caudal area 36 27P 300 III VI Rostral area 35 24P 300 III VI Caudal area 35 16P 400 II V Postrhinal Rostrodorsal POR 83B 500 V VI Dorsal POR 134B 500 I VI Rostral POR 39P 400 I VI Caudal POR 40P 500 III VI Entorhinal Rostral LEA 127B III VI Rostral LEA 21P 300 III V Lateral LEA 61B I III Rostral LEA 57P 400 III VI Midrostrocaudal LEA 66P 300 II III Midrostrocaudal LEA 60B 700 II V Caudomedial LEA 70P 400 III VI Lateral MEA 28P 300 V VI Medial MEA 68P 500 V VI Medial MEA 41P 200 V VI 1 Anterograde injection sites have the suffix P or B, respectively, for Phaseolus vulgarisleucoagglutinin (PHA-L) or biotinylated dextran amine (BDA). LEA, lateral entorhinal area; MEA, medial entorhinal area; POR, postrhinal area. 2 Experiment 130B encroached slightly on area Experiment 127B encroached slightly on deep layers of area Experiment 61B encroached slightly on superficial layers of area 36. labeling related to tracer (BDA or PHA-L) or size of injection site were observed. Thirty-three experimental injections were selected from a library of 72 retrograde tracer injection sites. It is evident in the unfolded maps that no systematic differences in the density or patterns of retrogradely labeled cells related to tracer (FB or DY) or size of injection were observed in the experiments selected for analysis. Because some cases involved multiple tracers, the injection sites are indicated by the number of the case and a suffix denoting the tracer type. For anterograde tracer experiments, the injection site was defined as the area containing labeled cell bodies. For retrograde tracer experiments, the injection site was defined as the region occupied by the dye core plus the region of heavy necrosis immediately surrounding the dye core. Any bin of the unfolded map that included even a part of an injection site, as defined above, was coded as part of the injection site. Thus, the unfolded maps may overestimate the size of injections. The approximate size and the laminar location of the injection sites in each region are summarized in Tables 1 and 2. Overview of the presentation of results Descriptions of the intrinsic connections of the perirhinal cortex and the postrhinal cortex are followed by descriptions of the interconnections between the perirhinal and postrhinal cortices, the perirhinal and entorhinal cortices, and the postrhinal and entorhinal cortices. In each section, the results of the anterograde and retrograde experiments are discussed in terms of both regional and laminar patterns of labeling. Projections may be described in terms of strength or heaviness, but all such descriptions are based on density of retrogradely labeled cells or anterogradely labeled fibers. To minimize the number of illustrations, only a single unfolded map is shown for each injection site, and the unfolded map shows the patterns of labeling in the perirhinal, postrhinal, and entorhinal TABLE 2. Retrograde Tracer Injection Sites 1 Location Experiment Size (µm) Layer Perirhinal Rostral area FB 400 I V Rostrodorsal area FB 700 III V Rostroventral area 36 97DY 500 III V Midrostrocaudal area 36 98DY 300 I V Midrostrocaudal area FB I II Midrostrocaudal area 36 94FB 200 V Ventral area 36 99DY 300 II III Caudodorsal area DY 300 V Caudoventral area DY 300 V Rostral area DY 400 I III Rostroventral area DY 300 V VI Ventral area DY 400 V Caudal area FG 300 I VI Postrhinal Rostral POR 97FB 400 V Rostroventral POR 102FB 200 V Middle POR 98FB 600 I VI Caudodorsal POR 100FB 500 I V Caudal POR 95DY 400 III VI Caudal POR 99FB 500 I V Entorhinal Rostrolateral LEA 113FB 600 I V Rostral LEA 129DY 300 III V Caudolateral LEA 130FB 400 V VI Rostral LEA 124FB 800 I VI Caudal LEA 105DY 400 V Caudal LEA 128DY 300 V Caudomedial LEA 105FB III VI Medial LEA 129FB 300 V VI MEA at caudal LEA border 119DY 400 I II Lateral MEA 113DY 300 V Lateral MEA 118FB 600 III VI Caudomedial MEA 124DY 600 I III MEA at medial LEA border 106DY 500 II VI MEA at medial LEA border 128FB 300 V 1 Retrograde injection sites have the suffix DY, FB, or FG for Diamidino yellow, fast blue, or Fluoro-Gold, respectively. For other abbreviations, see Table 1. 2 The dye core and heavy necrosis of the injection site in experiment 132FB involved superficial layers, but moderate necrosis was observed in an arc that extended into the external capsule. 3 Experiment 105FB may have slightly involved the underlying white matter. cortices. The patterns of anterograde and retrograde labeling in all three regions arising from injection sites in the perirhinal, postrhinal, and entorhinal cortices are shown in Figures 3, 4, and 5, respectively. In addition to addressing the conventional subdivisions of the entorhinal cortex (LEA and MEA), its connections with the perirhinal and postrhinal cortices are also described within the context of recent findings concerning the topography of the entorhinal projection to the dentate gyrus. The entorhinal projections to septal versus temporal levels of the dentate gyrus of the rat originate from largely nonoverlapping bands within the entorhinal cortex (Ruth et al., 1982, 1988; Witter et al., 1989; Dolorfo and Amaral, unpublished observations). A caudolaterally situated band of entorhinal cortex (which contains portions of LEA and MEA) projects to the septal half of the dentate gyrus, whereas intermediate and medially situated bands project to the third and fourth quarters, respectively (Fig. 2C). Intrinsic entorhinal connections also respect this band-like organization, such that the associational projections preferentially terminate within the band of origin (Dolorfo and Amaral, 1994; Kohler, 1988a,b; Witter et al., 1989). Thus, the entorhinal cortex will be described as comprising lateral, intermediate, and medial bands, which may be further broken down to the LEA or MEA portions of a certain band. To illustrate the types of connectivity patterns that we have observed in a more traditional format than the unfolded maps, Figures 6 10 show the distributions of retrogradely labeled cells from computergenerated plots of four rostrocaudal levels of five retro-

8 300 R.D. BURWELL AND D.G. AMARAL Fig. 3. Unfolded maps of the density and distribution of label arising from perirhinal injection sites. Location of injection sites is shown in white-and-black hatching. Bins shaded in black represent areas of the heaviest labeling. Progressively lighter shades of gray represent lighter labeling. A: Anterograde maps. B: Retrograde maps. Scale bar 1 mm.

9 PERIRHINAL, POSTRHINAL, AND ENTORHINAL INTERCONNECTIONS 301 Figure 3 (Continued)

10 302 R.D. BURWELL AND D.G. AMARAL Fig. 4. Unfolded maps of the density and distribution of label arising from postrhinal injection sites. Location of injection sites is shown in white- and black-hatching. Bins shaded in black represent areas of the heaviest labeling. Progressively lighter shades of gray represent lighter labeling. A: Anterograde maps. B: Retrograde maps. Scale bar 1 mm.

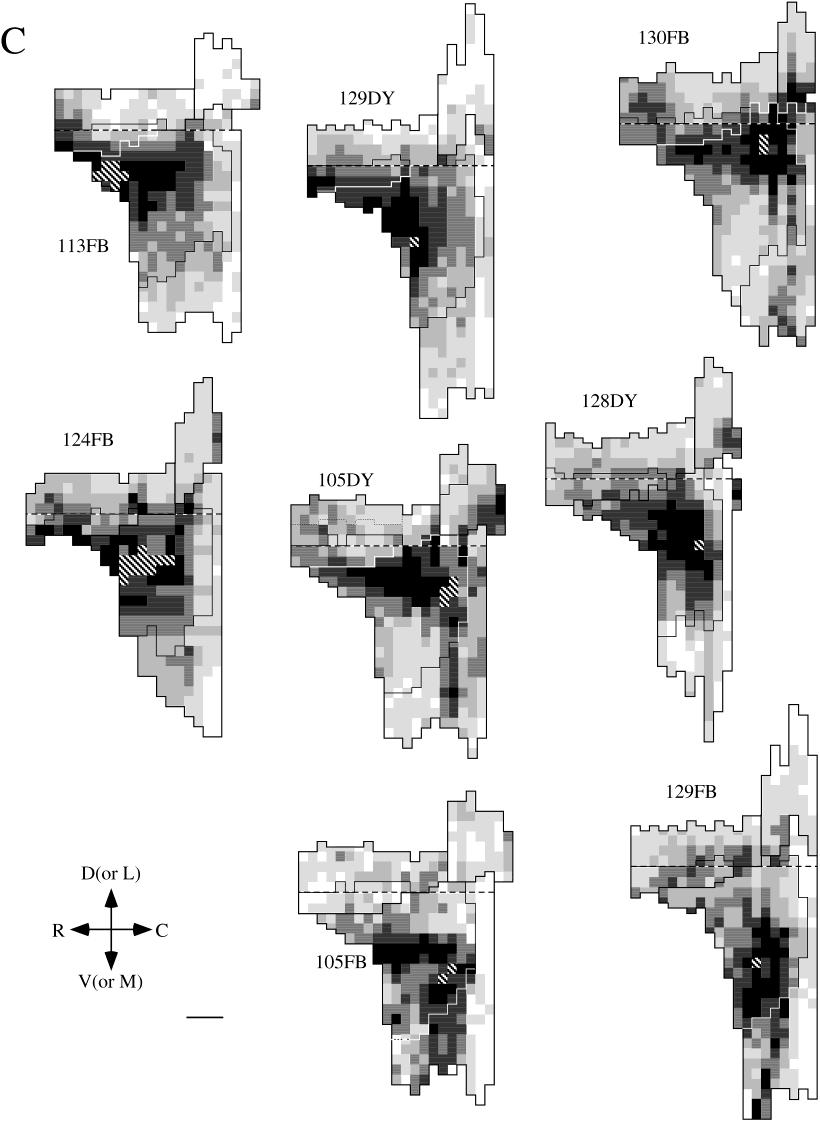
11 PERIRHINAL, POSTRHINAL, AND ENTORHINAL INTERCONNECTIONS 303 Fig. 5. Unfolded maps of the density and distribution of label arising from entorhinal injection sites. Location of injection sites is shown in white-and-black hatching. Bins shaded in black represent areas of the heaviest labeling. Progressively lighter shades of gray represent lighter labeling. A: Anterograde maps of lateral entorhinal area sites. B: Anterograde maps of medial entorhinal area sites. C: Retrograde maps of lateral entorhinal area sites. D: Retrograde maps of medial entorhinal area sites. Scale bar 1 mm.
12 Figure 5 (Continued)

13 PERIRHINAL, POSTRHINAL, AND ENTORHINAL INTERCONNECTIONS 305 Figure 5 (Continued) grade cases. Photomicrographs of four levels of five anterograde tracer experiments for areas 35 and 36, POR, LEA, and MEA are shown in Figures Intrinsic connections of the perirhinal cortex Several principles of intrinsic connectivity were apparent in the patterns of labeling arising from area 36 injections. First, intrinsic connections in area 36 are distributed extensively throughout the field. When an anterograde tracer was placed into area 36, the areas of highest density of labeled fibers were usually found in areas adjacent to the injection site, but labeled fibers were generally observed throughout area 36 (Figs. 3A, 11D). Similarly, when a retrograde tracer was placed into area 36, the highest numbers of labeled cells were found in areas close to the injection site, but labeled cells were also observed throughout the region (Figs. 3B, 6C). Second, projections to a focus in area 36 originate about equally from regions located rostrally and caudally to the focus. Experiments 128B and 94FB provided particularly good examples of this principle (Fig. 3A,B). Third, although there is no gradient in the rostrocaudal origin of projections, there is a prominent dorsal to ventral gradient. There were always more labeled cells located dorsally to a retrograde tracer injection than ventrally (Fig. 3B, experiment 99DY). Although this pattern was more evident in cases with injection sites located closer to the
14 306 R.D. BURWELL AND D.G. AMARAL Fig. 6. A D: Computer-generated plots of coronal sections showing the location of a retrograde tracer injection in area 36 of the perirhinal cortex and the distribution of retrogradely labeled cells arising from that injection site in the regions of interest. Arrows indicate cytoarchitectonic boundaries. Four rostrocaudal levels are shown for experiment 94FB. POR, postrhinal cortex; LEA, lateral entorhinal area; MEA, medial entorhinal area. Scale bar 1 mm. rhinal sulcus, it was generally true for all injections in area 36. The laminar location of the injection site did not alter this pattern. This dorsal-to-ventral polarity was also reflected in connections between areas 35 and 36. Projections to area 36 were heavier from dorsally adjacent area 36 than from 35 (Fig. 3B, experiment 97DY). This pattern of connections was confirmed by the anterograde tracer experiments (Fig. 3A, experiments 45P and 128B). The area 36 associational connections appeared to arise from all cell layers, although retrogradely labeled cells were more concentrated in layers II, V, and deep VI (Fig. 6A,B). The terminal labeling arising from anterograde injection sites was also distributed to all layers; layers I and V demonstrated the highest density of labeled fibers (Fig. 11B). Associational connections within area 35 are lighter than in area 36. This was apparent in both anterograde and retrograde tracing experiments (Fig. 3A,B, bottom rows). The area 35 associational connections arise from all cell layers, but the largest numbers of cells were observed in layers II and III (Fig. 7C). The associational connections terminate in all layers, but the projections are heavy to
15 PERIRHINAL, POSTRHINAL, AND ENTORHINAL INTERCONNECTIONS 307 Fig. 7. A D: Computer-generated plots of coronal sections showing the location of a retrograde tracer injection in area 35 of the perirhinal cortex and the distribution of retrogradely labeled cells arising from that injection site. Arrows indicate cytoarchitectonic boundaries. Four rostrocaudal levels are shown for experiment 112 DY. POR, postrhinal cortex; LEA, lateral entorhinal area; MEA, medial entorhinal area. Scale bar 1 mm. layers II through V and moderate to layers I and VI (Fig. 12C). Area 36, as noted previously, projects heavily to area 35, but area 35 returns a weaker projection to area 36. This principle is well illustrated by comparing the area 36 injection site in experiment 120FB with the area 35 injection site in experiment 112DY (Fig. 3B). Based on observations of the anterograde material, the projection to area 35 appeared to arise primarily from ventral area 36. Moreover, the projections terminate at about the same rostrocaudal level at which they originate, i.e., retrograde tracer injections in area 35 produced high densities of labeled cells in a strip of area 36 located dorsal to the injection site. Thus, projections originating in area 36 and terminating in area 35 exhibit a strong dorsal-to-ventral polarity, with very little spread in the rostrocaudal directions (Fig. 3B, experiments 102DY, 108FG, and 112DY). Cells in layers II/III and deep VI of area 36 provide the predominant input to area 35 (Fig. 7A), and the projection terminates in all layers (Fig. 11C). The reciprocal projection, area 35 to area 36, arises primarily in layers II and VI (Fig. 6C) and terminates in layers I, II, and VI (Fig. 12B). To summarize, associational connections are more extensive in area 36 than in area 35. Area 36 projects heavily to
16 308 R.D. BURWELL AND D.G. AMARAL Fig. 8. A D: Computer-generated plots of coronal sections showing the location of a retrograde tracer injection in the postrhinal cortex and the distribution of retrogradely labeled cells arising from that injection site. Four rostrocaudal levels are shown for experiment 98FB. POR, postrhinal cortex; LEA, lateral entorhinal area; MEA, medial entorhinal area. Scale bar 1 mm. area 35, but the reciprocal projections are lighter. Throughout the perirhinal cortex, there is a dorsoventral cascade of projections. Dorsal area 36 projects more strongly to ventral area 36 than the reciprocal projection, and ventral area 36 projects more strongly to area 35 than the reciprocal connection. Based on the laminar origins and terminations of these connections, the area 36 projection to area 35 can best be described as a lateral pathway according to the criteria for hierarchical relationships in cortical regions described by Felleman and Van Essen (1991), i.e., cells in superficial and deep layers terminate in all layers. The return projection, however, resembles a feedback pathway (Felleman and Van Essen, 1991), i.e., the projection exhibits a bilaminate origin in area 35 and a bilaminate termination in area 36. Intrinsic connections of the postrhinal cortex The associational projections within the POR, like those in area 36, are fairly extensive. Unlike the perirhinal cortex, the postrhinal associational connections do not
17 PERIRHINAL, POSTRHINAL, AND ENTORHINAL INTERCONNECTIONS 309 Fig. 9. A D: Computer-generated plots of coronal sections showing the location of a retrograde tracer injection in the lateral entorhinal area (LEA) of the entorhinal cortex and the distribution of retrogradely labeled cells arising from that injection site. Arrows indicate cytoarchitectonic boundaries. Four rostrocaudal levels are shown for experiment 129DY. POR, postrhinal cortex; MEA, medial entorhinal cortex. Scale bar 1 mm. exhibit any clear-cut topography (Fig. 4A,B). Injections of either anterograde or retrograde tracers into the POR produced a pattern of labeling that demonstrated an abrupt drop-off of labeling at the border with area 36. Thus, the POR associational connections appear to provide a useful criterion for defining the border between area 36 and the POR. The laminar pattern of the associational connections in the postrhinal cortex is similar to that found in area 36. Labeled cells were densest in layers II, V, and VI (Fig. 8C), and terminal label was heaviest in layers I and V/VI (Fig. 13D). Perirhinal and postrhinal interconnections Perirhinal projection to the postrhinal cortex. Areas 35 and 36 both project to the postrhinal cortex (Fig. 4B), with the heavier projection originating in area 36 (Fig. 3A, experiments 128P, 129P, and 62B). The perirhinal projections are generally heavier to rostral levels of POR (Fig. 3A, middle row). However, projections arising in the most rostral part of area 36, terminate either exclusively or more heavily in the caudal part of POR (Fig. 3A, experiments 90P and 54P).
18 310 R.D. BURWELL AND D.G. AMARAL Fig. 10. A D: Computer-generated plots of coronal sections showing the location of a retrograde tracer injection in the medial entorhinal cortex (MEA) of the entorhinal cortex and the distribution of retrogradely labeled cells arising from that injection site. Arrows indicate cytoarchitectonic boundaries. Four rostrocaudal levels are shown for experiment 106DY. POR, postrhinal cortex; LEA, lateral entorhinal area. Scale bar 1 mm. The cells of origin of the perirhinal to postrhinal projections were observed primarily in deep layer V and in layer VI (Fig. 7D). There were fewer labeled cells in layer II. Terminal labeling was observed in layers I/II and V/VI of the postrhinal cortex, although scattered labeled fibers were observed in other layers. Postrhinal projection to the perirhinal cortex. The postrhinal cortex projects both to area 36 and to area 35. The projections arise primarily in rostral postrhinal cortex (Fig. 3B). They terminate more strongly in dorsal area 36 than in ventral area 36 (see experiments 120DY and 100DY in Fig. 3B for a good comparison) and more strongly in area 36 than in area 35 (Fig. 4A). The postrhinal projection terminates preferentially in the caudal half of area 36 (see experiments 120FB and 120DY in Fig. 3B for a good comparison) and the caudal half of area 35 (Fig. 3B, bottom row). The cells of origin of the postrhinal to perirhinal projections are located primarily in layers II and V, although scattered retrogradely labeled cells were observed in other layers (Figs. 6D, 7D). The postrhinal projection to area 36 and to area 35 terminated in a columnar fashion in all layers (Fig. 13A C).
 and the distributions of fiber labeling in the perirhinal, postrhinal,")
19 PERIRHINAL, POSTRHINAL, AND ENTORHINAL INTERCONNECTIONS 311 Fig. 11. A D: Darkfield photomicrographs of coronal sections for case 129B with a BDA injection in area 36 of the perirhinal cortex (D) and the distributions of fiber labeling in the perirhinal, postrhinal, and entorhinal cortices resulting from the anterograde tract tracer injection. These photomicrographs and those in the following figures were taken with a Nikon HFX-DX photographic attachment coupled with a Leica MZ-6 stereomicroscope, scanned into Adobe Photoshop at 450 dpi, and digitally adjusted for brightness and contrast. The background was darkened, and any obvious dust specks were corrected. Arrowheads indicate cytoarchitectonic boundaries. Four rostrocaudal levels are shown. LEA, lateral entorhinal area. Scale bar 1 mm.
 and the distributions of fiber labeling in the perirhinal,")
20 312 R.D. BURWELL AND D.G. AMARAL Fig. 12. A D: Darkfield photomicrographs of coronal sections for case 16P with a PHA-L injection site in area 35 of the perirhinal cortex (C) and the distributions of fiber labeling in the perirhinal, postrhinal, and entorhinal cortices resulting from the anterograde tract tracer injection. Arrowheads indicate cytoarchitectonic boundaries. Four rostrocaudal levels are shown. POR, postrhinal cortex; LEA, lateral entorhinal area; MEA, medial entorhinal area. Scale bar 1 mm.
 and the distributions of fiber labeling in the perirhinal, postrhinal, and")
21 PERIRHINAL, POSTRHINAL, AND ENTORHINAL INTERCONNECTIONS 313 Fig. 13. A D: Darkfield photomicrographs of coronal sections for case 40P with a PHA-L injection site in the postrhinal cortex (D) and the distributions of fiber labeling in the perirhinal, postrhinal, and entorhinal cortices resulting from the anterograde tract tracer injection. Arrowheads indicate cytoarchitectonic boundaries. Four rostrocaudal levels are shown. POR, postrhinal cortex; LEA, lateral entorhinal area; MEA, medial entorhinal area. Scale bar 1 mm.
 of the entorhinal cortex (C) and the distributions of fiber labeling")
22 314 R.D. BURWELL AND D.G. AMARAL Fig. 14. A D: Darkfield photomicrographs of coronal sections for case 60P with a PHA-L injection site in the lateral entorhinal area (LEA) of the entorhinal cortex (C) and the distributions of fiber labeling in the perirhinal, postrhinal, and entorhinal cortices resulting from the anterograde tract tracer injection. Arrowheads indicate cytoarchitectonic boundaries. Four rostrocaudal levels are shown. POR, postrhinal cortex; MEA, medial entorhinal area. Scale bar 1 mm.
 of the entorhinal cortex (D) and the distributions of fiber labeling")
23 PERIRHINAL, POSTRHINAL, AND ENTORHINAL INTERCONNECTIONS 315 Fig. 15. A D: Darkfield photomicrographs of coronal sections for case 41P with a PHA-L injection site in the medial entorhinal area (MEA) of the entorhinal cortex (D) and the distributions of fiber labeling in the perirhinal, postrhinal, and entorhinal cortices resulting from the anterograde tract tracer injection. Arrowheads indicate cytoarchitectonic boundaries. Four rostrocaudal levels are shown. POR, postrhinal cortex; LEA, lateral entorhinal area. Scale bar 1 mm.
24 316 R.D. BURWELL AND D.G. AMARAL Summary of perirhinal-postrhinal connections. The rostral postrhinal cortex is more strongly interconnected with the perirhinal cortex than the caudal postrhinal cortex, and the postrhinal-to-perirhinal projection is only slightly stronger than its reciprocal. The topography of the connections, however, is complex. The postrhinal cortex is more heavily interconnected with dorsal area 36 than with ventral area 36 and is more heavily interconnected with area 36 than with area 35. Moreover, these interconnections were not point-to-point reciprocal. The dorsal portion of the postrhinal cortex gives rise to the heavier projection to the perirhinal cortex, whereas the ventral portion of the postrhinal cortex receives the heavier return projection from the perirhinal cortex. Finally, the postrhinal projection to the perirhinal cortex exhibits characteristics of a lateral pathway, in that deep and superficial layers project to all layers in a columnar fashion (Felleman and Van Essen, 1991). The perirhinal projection to the postrhinal cortex, in contrast, exhibits characteristics of a feedback pathway, because the projection originates in deep and superficial layers and terminates in a bilaminar fashion. Perirhinal and Entorhinal Interconnections Perirhinal projection to the entorhinal cortex. The perirhinal cortex projects strongly to the entorhinal cortex. The topography of the projections is best described both in terms of the regional subdivisions (LEA and MEA) and the organization of entorhinal projections to the dentate gyrus (see Fig. 2C for the topography of these bands). Rostral perirhinal cortex (areas 35 and 36) projects preferentially to rostrolateral LEA. This projection is heavier from area 35 than from area 36 (Fig. 5C). These projections terminate in the rostral portion of LEA that innervate septal levels of the dentate gyrus, i.e., the lateral band (Fig. 3A, anterograde experiments 54P, 90P, and 24P). Projections arising in the caudal half of the perirhinal cortex terminate more medially and caudally in the LEA. They project more lightly to the rostral portion of LEA of the lateral band and more heavily to the LEA portions of the intermediate band that innervates midseptotemporal levels of the dentate gyrus (Fig. 3A, experiments 128B and 16P). These observations were confirmed in the retrograde material. When a retrograde tracer injection was placed into rostrolateral LEA, labeling was heaviest in rostral area 35 and 36 (Fig. 5A, experiment 113FB). When the injection was in the intermediate LEA region, there were more labeled cells in the caudal part of areas 35 and 36 (Fig. 5A, experiment 128DY). The perirhinal cortex has only minor projections to the most medial portion of the LEA i.e. the portion which innervates temporal levels of the dentate gyrus. The perirhinal projections to the MEA are light and are directed only to the most lateral portion of MEA (Fig. 5D, experiments 113DY and 118FB). All other portions of the MEA receive little if any input from the perirhinal cortex (Fig. 3A; see also Fig. 5D, last four experiments). The area 36 projections to the entorhinal cortex originate primarily in layers II, superficial V, and VI (Figs. 9A C, 10A C). The projections to lateral portions of the entorhinal cortex originate preferentially in layer II, whereas the projections to intermediate portions of the entorhinal cortex preferentially originate from layer VI. In area 35, there are more retrogradely labeled cells in layers II/III and less in layers V and VI. The perirhinal projection to the entorhinal cortex terminates mainly in layers II and III. At the focus of the heaviest labeling, labeled fibers are denser in layer II than in layer III. The pattern of terminal labeling is similar regardless of whether the projection originates in area 35 or area 36 (Fig. 12D). Entorhinal projection to the perirhinal cortex. The entorhinal projection to the perirhinal cortex arises almost exclusively from the LEA. The projection originates mainly in the rostrolateral LEA and terminates more heavily in area 35 than in area 36 (Fig. 5A, experiments 61B and 66P). Within area 36, the ventral portion is more heavily innervated than the dorsal (Fig. 5A, experiments 127B and 57P). Medial portions of the LEA project lightly to area 35 and very lightly to area 36 (Fig. 5A, experiments 60B and 70P). The rostral LEA projects preferentially to the rostral perirhinal cortex, whereas the caudal LEA projects throughout the perirhinal cortex (Fig. 5A, 70P). MEA injections gave rise to little or no labeling in the perirhinal cortex (Figs. 3B, 5A, bottom row). The only exception to this conclusion involves a portion of the perirhinal cortex located very near to the border with the entorhinal cortex; this portion of area 35 receives a minor projection from all portions of the entorhinal cortex (Fig. 3B, experiments 132FB, 112DY, and 108FG). The entorhinal projection to the perirhinal cortex originates predominantly in layers III and V (Figs. 6C, 7C). When a retrograde tracer site was located in area 35, retrogradely labeled cells appeared primarily in layers III and superficial layer V in most portions of the LEA but were labeled in all cellular layers in extreme rostrolateral LEA. Only cells in layer V were labeled in the MEA. The entorhinal projections to area 36 invariably originate in layer V. However, layer III also contributes to the projections to caudal portions of ventral area 36. Projections arising in the LEA terminate in all layers of area 35 but are heaviest in layers I and V (Fig. 14A,B). The same pattern was observed in area 36 for projections originating in rostrolateral LEA. Projections from more medial portions of the LEA terminate in layers II/III and VI. Summary of perirhinal-entorhinal connections. The perirhinal cortex projects preferentially to the LEA, particularly to those portions that innervate septal and midseptotemporal levels of the dentate gyrus. Area 35 is more strongly interconnected with the entorhinal cortex than area 36. Rostral perirhinal locations project more strongly to the portion of the LEA that projects to the septal half of the dentate gyrus whereas caudal perirhinal cortex projects more strongly to the part of LEA that innervates midseptotemporal levels of the dentate gyrus. The perirhinal to entorhinal projection resembles a feed forward pathway in that deep and superficial layers project primarily to layers II and III (Felleman and Van Essen, 1991). The entorhinal cortex projection to the perirhinal cortex appears to be relatively weaker than the perirhinal to entorhinal projection. It resembles a feedback pathway in that superficial and deep layers of the entorhinal cortex project onto superficial and deep layers of the perirhinal cortex (Felleman and Van Essen, 1991). Postrhinal and entorhinal interconnections Postrhinal projection to the entorhinal cortex. In contrast to the perirhinal cortex, which projects mainly to the LEA, the postrhinal cortex projects both to the LEA and to the MEA. The postrhinal cortex projects most strongly to the lateral (septally projecting) band of the entorhinal cortex and slightly less strongly to the intermediate (midseptotemporally projecting) band (Fig. 4A). Like
25 PERIRHINAL, POSTRHINAL, AND ENTORHINAL INTERCONNECTIONS 317 the perirhinal cortex, the most medial (temporally projecting) band of the entorhinal cortex is only lightly innervated by the postrhinal cortex (Fig. 4A). The projections to the LEA arise mainly in ventral and caudal portions of the postrhinal cortex (Fig. 5C), but all portions of the postrhinal cortex project to the MEA (Fig. 5D). The postrhinal-to-entorhinal projection originates primarily in layers II/III and V. The projections terminate in layers I III of the rostrolateral entorhinal cortex and mainly in layers II and III of more caudal and medial portions of the entorhinal cortex. Entorhinal projection to the postrhinal cortex. All portions of the entorhinal cortex provide input to some portion of the postrhinal cortex. The strongest projections arise primarily in the lateral band of the entorhinal cortex (Figs. 4B, 5A, top row), but the postrhinal cortex also receives substantial input from the intermediate band (Figs. 4B, 5A, intermediate row). A substantially lighter projection originates in the medial band (Fig. 4B, experiments 97FB and 95DY). The entorhinal projections terminate mainly in layer VI of the postrhinal cortex except in its ventral border region, where terminations were observed in all layers. Summary of postrhinal-entorhinal connections. The postrhinal cortex is reciprocally interconnected with both the LEA and MEA portions of all three projection bands of the entorhinal cortex. The connections are strongest between the postrhinal cortex and the lateral band, less substantial with the intermediate band, and relatively meager with the medial band. The postrhinal cortex projects to a more restricted portion of the rostrolateral LEA than the perirhinal cortex but is heavily interconnected with caudal and medial portions of the MEA. It is this substantial projection to the MEA that differentiates the postrhinal cortex from the perirhinal cortex. Like the perirhinal cortex, the postrhinal projections to the entorhinal cortex exhibit a modified feed-forward pattern and the reciprocal projections resemble a feedback pathway. DISCUSSION The perirhinal and postrhinal cortices of the rat are important sources of cortical input to the hippocampal formation via their connections with the entorhinal cortex (Burwell et al., 1995; Naber et al., 1996). The present report describes new information on the organization of associational connections within the perirhinal and postrhinal cortices, on the connections between the perirhinal and postrhinal cortices, and on the interconnections between the perirhinal/postrhinal cortices and the entorhinal cortex. This information is summarized in Figure 16. Although the precise topography of these connections is complex, there are some simplifying organizational principles. For example, there is a strong dorsal-to-ventral bias to the perirhinal intrinsic connections (Fig. 16A). Dorsal area 36 projects strongly to ventral area 36, but the reciprocal projection is relatively weak. Similarly, ventral area 36 projects strongly to area 35, and the reciprocal projection is relatively weak. A similar type of cascade-like topography is also apparent in the perirhinal-postrhinal connections (Fig. 16B). The postrhinal cortex is more strongly interconnected with dorsal area 36 than with ventral area 36 and more strongly interconnected with ventral area 36 than with area 35. These data are consistent with previous findings by Romanski and LeDoux (1993), who demonstrated that there is a similar cascade of connections from sensory cortices lying dorsal to the perirhinal cortex that ultimately leads to the dorsal portion of area 36. These assertions concerning the strength of projections within the perirhinal region are based on the numbers of retrogradely labeled cells or the density of anterogradely labeled fibers that are observed in the various experiments. Our conclusions about the polarity of connections would need to be markedly altered if the numbers of fibers going in each direction were under differential physiological control. Barring this scenario, however, it would appear that the feedback projections from the entorhinal to perirhinal and from the perirhinal to sensory cortices are not as prominent in the rat as in the monkey. In the monkey, the return projections from the entorhinal cortex to the perirhinal cortex are as prominent as the perirhinal projections into the entorhinal cortex. Another implication of this progression of connections is that much of the information that reaches ventral area 36 and area 35 arrives from dorsal area 36. Thus, to the extent that the perirhinal cortex may mediate some forms of memory on its own (Ennaceur, et al., 1996; Meunier et al., 1993; Murray and Gaffan, 1993; Ramus et al., 1994; Wiig and Bilkey, 1995), a lesion involving dorsal area 36 may be as devastating to its function as a lesion involving the entire perirhinal cortex. A similar topography was found for the perirhinal inputs to the entorhinal cortex. Area 35 provides the strongest input to the entorhinal cortex (Fig. 16C), with progressively weaker inputs originating in ventral area 36 and dorsal area 36. Thus, a lesion of area 35 would effectively eliminate most of the perirhinal input to the hippocampal formation. To the extent that this input is essential for the hippocampal formation to mediate certain memory tasks, this lesion should be as disruptive as total perirhinal lesions or lesions of the hippocampus. The present study has provided conclusive evidence that the perirhinal and postrhinal cortices project differently to portions of the entorhinal cortex (Burwell and Amaral, 1996; Naber et al., 1996). Although the projections are overlapping, a simplifying statement is that the perirhinal cortex preferentially innervates the LEA and, thus, its connections to the rest of the hippocampal formation, whereas the postrhinal cortex preferentially innervates the MEA and, thus, its connections to the hippocampal formation (Figs. 16D, 17). For both the perirhinal and postrhinal cortices, connections are stronger with the lateral (septally projecting) and intermediate (midseptotemporally projecting) portions of the entorhinal cortex and are only meager to the medial (temporally projecting) portion of the cortex. What are the functional implications of the different topographies of the perirhinal and postrhinal inputs to the entorhinal cortex? We first review previous findings regarding principles of hippocampal connectivity. The flow of information through the hippocampal formation is defined by unique and largely unidirectional pathways (for review, see Amaral and Witter, 1995). Thus, the entorhinal cortex provides the dentate gyrus with its major input through the perforant pathway, and this input is not reciprocated. Similar, largely unidirectional, projections characterize other intrinsic connections of the hippocampal formation (dentate gyrus to the CA3 field of the hippocampus, CA3 to the CA1 field, and CA1 to the subiculum). Importantly, the
, postrhinal (POR), and entorhinal cortices (LEA and MEA) and their intrinsic connections.")
26 318 R.D. BURWELL AND D.G. AMARAL Fig. 16. Wiring diagrams illustrating the interconnections among the perirhinal (PR; areas 35 and 36), postrhinal (POR), and entorhinal cortices (LEA and MEA) and their intrinsic connections. The upper left box of each diagram represents the perirhinal cortex (PR) divided into areas 35 and 36. The upper right box represents the postrhinal cortex (POR). The lower box represents the entorhinal cortex divided into the LEA and the MEA by an oblique dashed line. Both subdivisions are further divided by horizontal dashed lines into bands characterized by different patterns of projections to the dentate gyrus. The bands are labeled L, I, and M to represent, respectively, the lateral, intermediate, and medial DG-projecting bands of the entorhinal cortex. The L, I, and M bands project to septal, intermediate, and temporal levels of the dentate gyrus, respectively. The origin of a connection is indicated by the circle, and the termination is indicated by the Y. The thickness of the line represents the strength of a connection (light, moderate, or heavy), and very light connections are denoted by dashes. A: The intrinsic connections for each area. B: The interconnections of the perirhinal and postrhinal cortices. C: The interconnections of the perirhinal and entorhinal cortices. D: The interconnections of the postrhinal and entorhinal cortices. entorhinal cortex appears to have three domains or bands that project to three different septotemporal levels of the dentate gyrus, hippocampus, and subiculum. It is important to keep in mind that each one of these bands occupies portions of the LEA and the MEA. The lateral band projects to the septal half of the dentate gyrus and hippocampus, the intermediate band projects to the third quarter, and the medial band projects to the temporal quarter (Fig. 17; Ruth et al., 1982, 1988; Witter et al., 1989; Dolorfo, personal communication). The associational projections within the entorhinal cortex tend to reinforce the isolation of these three bands. Thus, associational connections arising within one of these bands tend to stay within the same band. (Fig. 16A; Dolorfo and Amaral, 1994; Kohler, 1988a,b; Witter et al., 1989). Another wellestablished principle is that the LEA projects to the outer one-third of the dentate molecular layer and the outer portion of the CA3 stratum lacunosum-moleculare, whereas the MEA projects to the middle one-third of the dentate molecular layer and the inner portion of the CA3 stratum lacunosum-moleculare (Steward, 1976; Witter, 1990, 1993; Wyss, 1981). In contrast to the laminar or radial pattern of the entorhinal to dentate gyrus and CA3 projections, the entorhinal projections to CA1 and the subiculum terminate in a transverse topographic pattern. The LEA and MEA projections to CA1 and the subiculum terminate throughout the molecular layer (Steward, 1976; Witter and Amaral, 1991). Fibers from the MEA terminate in the

27 PERIRHINAL, POSTRHINAL, AND ENTORHINAL INTERCONNECTIONS 319 Fig. 17. A summary of the connections among the perirhinal, postrhinal, and entorhinal cortices showing how these connections impact the entorhinal projections to the DG via the perforant path. On the left are boxes representing the perirhinal cortex divided into areas 35 and 36, the postrhinal cortex (POR), and the entorhinal cortex divided into the LEA and the MEA. The connections among these regions are represented by arrows. In the middle of the figure is a schematic of the DG from the septal pole (top) to the temporal pole (bottom). On the right are icons representing septal and temporal levels of the DG. The perirhinal and postrhinal regions are hatched, so that the processing of information arising in these areas can be followed along the projection paths. In the entorhinal cortex box, the area that receives input from the perirhinal cortex is marked with diagonal hatching from the upper left to the lower right. The area that receives input from the postrhinal cortex is marked with diagonal hatching from the upper right to the lower left. Thus, the area that receives input from both the perirhinal and postrhinal cortices is cross hatched. These patterns are carried through to the coronal views of the DG and hippocampus, so that it is possible to see where information arising in the perirhinal and postrhinal corticies is transmitted in these structures. In the entorhinal box, the three DG-projecting bands are represented by different shades of gray. These shades are carried through the projection path (curved arrows) and are seen in the unfolded dentate gyrus and in the coronal views of the DG and the hippocampus. portion of CA1 that is located closer to CA3 and the portion of the subiculum that is closer to the presubiculum. Fibers from the LEA terminate closer to the border of CA1 with the subiculum. These principles of hippocampal connectivity together with the topography of the perirhinal and postrhinal projections to the entorhinal cortex suggest conclusions that are summarized schematically in Figure 17. The perirhinal and postrhinal cortices exert more influence over septal levels of the dentate gyrus and hippocampus than temporal levels. Within a septotemporal level, the postrhinal cortex influences entorhinal input to the middle one-third of the dentate molecular layer, but both the perirhinal and, to a lesser extent, the postrhinal cortices influence input to the outer one-third. In contrast to this radial topography, the perirhinal and postrhinal influences upon the CA1 field and the subiculum exhibit a transverse topography. Information arising from the postrhinal cortex via the MEA has the greatest influence on the portion of CA1 that is closer to CA3, whereas information arising from the perirhinal cortex via the lateral LEA innervates the distal portion of the CA1 (near the border with the subiculum). A similar transverse influence would also be seen in the subiculum. There are several implications of this neuroanatomical organization. Our studies indicate that the primary unimodal associational input to the postrhinal cortex is visual, whereas the unimodal associational input to the perirhinal cortex is evenly weighted across all sensory modalities (Burwell and Amaral, unpublished observations). Because information from the perirhinal and postrhinal cortices converges in the dentate gyrus, one would expect the granule cells to be receiving more integrated or multimodal information. In contrast, the input to different transverse regions of the CA1 and subiculum would be more distinctly related to the perirhinal or postrhinal cortex. One would expect the perirhinal cortex to have more influence over the CA1-subiculum border and the postrhinal cortex to have more influence over the part of CA1 that is near CA3. These same CA1 cells, however, would also be receiving the integrated input from the dentate gyrus via the Schaffer collateral projection arising in CA3. Another important implication of these findings is that septal levels of the dentate gyrus and hippocampus appear to receive substantially more cortically derived sensory input than temporal levels. Experimental lesion and physiological studies have already provided evidence that there may be septotemporal differences in the function of the hippocampus. Lesions of the septal hippocampus that are no greater than 20% of the total volume of the structure are sufficient to impair performance on measures of spatial learning. Yet, lesions of the ventral hippocampus spare performance unless nearly 50% of the structure is damaged (Moser et al., 1993, 1995). The response properties of neurons in the septal and temporal portions of the hippocampus also show differences. The proportion of neurons with spatially selective firing patterns is lower and the firing fields less selective in the ventral hippocampus than
Perirhinal and Parahippocampal Cortices of the Macaque Monkey: Intrinsic Projections and Interconnections
 THE JOURNAL OF COMPARATIVE NEUROLOGY 472:371 394 (2004) Perirhinal and Parahippocampal Cortices of the Macaque Monkey: Intrinsic Projections and Interconnections PIERRE LAVENEX, 1 * WENDY A. SUZUKI, 2
Intrinsic Connections of the Macaque Monkey Hippocampal Formation: II. CA3 Connections
 Published in "The Journal of Comparative Neurology 515(3): 349-377, 2009" which should be cited to refer to this work. Intrinsic Connections of the Macaque Monkey Hippocampal Formation: II. CA3 Connections
Nature Neuroscience doi: /nn Supplementary Figure 1. Characterization of viral injections.
 Supplementary Figure 1 Characterization of viral injections. (a) Dorsal view of a mouse brain (dashed white outline) after receiving a large, unilateral thalamic injection (~100 nl); demonstrating that
Contralateral Projections of the Rat Anterior Olfactory Nucleus
 512:115 123 (2009) Contralateral Projections of the Rat Anterior Olfactory Nucleus KURT R. ILLIG* AND JENNIFER D. EUDY Department of Psychology, University of Virginia, Charlottesville, Virginia 22904
Deficits in Attentional Orienting Following Damage to the Perirhinal or Postrhinal Cortices
 Behavioral Neuroscience Copyright 2004 by the American Psychological Association 2004, Vol. 118, No. 5, 1117 1122 0735-7044/04/$12.00 DOI: 10.1037/0735-7044.118.5.1117 Deficits in Attentional Orienting
P. Hitchcock, Ph.D. Department of Cell and Developmental Biology Kellogg Eye Center. Wednesday, 16 March 2009, 1:00p.m. 2:00p.m.
 Normal CNS, Special Senses, Head and Neck TOPIC: CEREBRAL HEMISPHERES FACULTY: LECTURE: READING: P. Hitchcock, Ph.D. Department of Cell and Developmental Biology Kellogg Eye Center Wednesday, 16 March
Connections between Anterior Inferotemporal Cortex and Superior Temporal Sulcus Regions in the Macaque Monkey
 The Journal of Neuroscience, July 1, 2000, 20(13):5083 5101 Connections between Anterior Inferotemporal Cortex and Superior Temporal Sulcus Regions in the Macaque Monkey K. S. Saleem, 1,2 W. Suzuki, 1,3
Regional and Lobe Parcellation Rhesus Monkey Brain Atlas. Manual Tracing for Parcellation Template
 Regional and Lobe Parcellation Rhesus Monkey Brain Atlas Manual Tracing for Parcellation Template Overview of Tracing Guidelines A) Traces are performed in a systematic order they, allowing the more easily
Contributions of Postrhinal and Perirhinal Cortex to Contextual Information Processing
 Behavioral Neuroscience Copyright 2000 by the American Psychological Association, Inc. 2000, Vol, 114, No. 5, 882-894 0735-7044/00/$5.00 DOI: 10.1037//0735-7044.114.5.882 Contributions of Postrhinal and
Anterior Olfactory Nucleus
 A Anterior Olfactory Nucleus PETER C. BRUNJES, KURT R. ILLIG Department of Psychology, University of Virginia Charlottesville, VA, USA Synonyms Anterior olfactory cortex Definition The primary component
Nigral Projections to the Inferior and the Superior Colliculus in the Rat: A Horseradish Peroxidase Study
 Okajimas Foils Anat. Jpn., 56(5) : 289-296, December 1979 Nigral Projections to the Inferior and the Superior Colliculus in the Rat: A Horseradish Peroxidase Study By KAZUO WATANABE and ETSURO KAWANA Department
NEUROSYSTEMS. Abstract. Introduction. European Journal of Neuroscience, Vol. 39, pp , doi: /ejn.12389
 European Journal of Neuroscience, Vol. 39, pp. 107 123, 2014 doi:10.1111/ejn.12389 NEUROSYSTEMS The origin of projections from the posterior cingulate and retrosplenial cortices to the anterior, medial
MR Volumetric Analysis of the Human Entorhinal, Perirhinal, and Temporopolar Cortices
 AJNR Am J Neuroradiol 19:659 671, April 1998 MR Volumetric Analysis of the Human Entorhinal, Perirhinal, and Temporopolar Cortices Ricardo Insausti, Kirsi Juottonen, Hilkka Soininen, Ana Maria Insausti,
Department of Cognitive Science UCSD
 Department of Cognitive Science UCSD Verse 1: Neocortex, frontal lobe, Brain stem, brain stem, Hippocampus, neural node, Right hemisphere, Pons and cortex visual, Brain stem, brain stem, Sylvian fissure,
Supporting Online Material for
 www.sciencemag.org/cgi/content/full/330/6009/1408/dc1 Supporting Online Material for Paradoxical False Memory for Objects After Brain Damage Stephanie M. McTighe, Rosemary A. Cowell, Boyer D. Winters,
Cerebral Cortex 1. Sarah Heilbronner
 Cerebral Cortex 1 Sarah Heilbronner heilb028@umn.edu Want to meet? Coffee hour 10-11am Tuesday 11/27 Surdyk s Overview and organization of the cerebral cortex What is the cerebral cortex? Where is each
Acquisition and retention of visual discrimination learning after ablation of perirhinal cortex in the rat
 Psychobiology 1998.26 (1).36-41 Acquisition and retention of visual discrimination learning after ablation of perirhinal cortex in the rat M.J.EACOTT University oj Durham, Durham, England Eight Dark Agouti
Projections from the hippocampal region to the mammillary bodies in macaque monkeys
 European Journal of Neuroscience, Vol. 22, pp. 2519 2530, 2005 ª Federation of European Neuroscience Societies Projections from the hippocampal region to the mammillary bodies in macaque monkeys John P.
THE JOURNAL OF COMPARATIVE NEUROLOGY 250~ (1986)
") THE JOURNAL OF COMPARATIVE NEUROLOGY 250~403-430 (1986) Microelectrode Maps, Myeloarchitecture, and Cortical Connections of Three Somatotopically Organized Representations of the Body Surface in the Parietal
THE JOURNAL OF COMPARATIVE NEUROLOGY 250~403-430 (1986) Microelectrode Maps, Myeloarchitecture, and Cortical Connections of Three Somatotopically Organized Representations of the Body Surface in the Parietal
Supplementary Methods
 1 Supplementary Methods Social Preference Test Subjects Seventy-four Long-Evans, male rats served as subjects (S-rats) in the foodpreference test, with 40 assigned to the CXT-Same (CXT-S) Condition and
University of Groningen. Neuronal control of micturition Kuipers, Rutger
 University of Groningen Neuronal control of micturition Kuipers, Rutger IMPORTANT NOTE: You are advised to consult the publisher's version (publisher's PDF) if you wish to cite from it. Please check the
Supplementary Figure S1: Histological analysis of kainate-treated animals
 Supplementary Figure S1: Histological analysis of kainate-treated animals Nissl stained coronal or horizontal sections were made from kainate injected (right) and saline injected (left) animals at different
Memory Impairment on a Delayed Non-Matching-to-Position Task After Lesions of the Perirhinal Cortex in the Rat
 Behavioral Neuroscience Copyright 1998 by the American Psychological Association, Inc. 1998, Vol. 112, No. 4, 827-838 0735-7044/98/$3.00 Memory Impairment on a Delayed Non-Matching-to-Position Task After
Anatomy of the Hippocampus
 Anatomy of the Hippocampus Lecture 3.2 David S. Touretzky September, 2015 Human Hippocampus 2 Human Hippocampus 3 Hippocampus Means Seahorse Dissected human hippocampus next to a specimen of hippocampus
CSE511 Brain & Memory Modeling. Lect21-22: Vision Central Pathways
 CSE511 Brain & Memory Modeling CSE511 Brain & Memory Modeling Lect02: BOSS Discrete Event Simulator Lect21-22: Vision Central Pathways Chapter 12 of Purves et al., 4e Larry Wittie Computer Science, StonyBrook
The Effects of Cytotoxic Perirhinal Cortex Lesions on Spatial Learning by Rats: A Comparison of the Dark Agouti and Sprague Dawley Strains
 Behavioral Neuroscience Copyright 2006 by the American Psychological Association 2006, Vol. 120, No. 1, 150 161 0735-7044/06/$12.00 DOI: 10.1037/0735-7044.120.1.150 The Effects of Cytotoxic Perirhinal
Cortical Connections of Area V4 in the Macaque
 Cerebral Cortex March 2008;18:477-499 doi:10.1093/cercor/bhm061 Advance Access publication June 4, 2007 Cortical Connections of Area V4 in the Macaque Leslie G. Ungerleider 1, Thelma W. Galkin 2, Robert
Psyc 311A, fall 2008 Conference week 3 TA: Jürgen Germann
 Psyc 311A, fall 2008 Conference week 3 TA: Jürgen Germann e-mail: jurgen.germann@mcgill.ca Overview: 1. Meninges 2. Cerebral cortex-cytoarchitecture 3. Diencephalon (thalamus/hypothalamus) (this replaces
Human Obestatin ELISA
 K-ASSAY Human Obestatin ELISA For the quantitative determination of obestatin in human serum and plasma Cat. No. KT-495 For Research Use Only. 1 Rev. 081309 K-ASSAY PRODUCT INFORMATION Human Obestatin
Neocortex. Cortical Structures in the Brain. Neocortex Facts. Laminar Organization. Bark-like (cortical) structures: Shepherd (2004) Chapter 12
 structures: Shepherd (2004) Chapter 12") Neocortex Shepherd (2004) Chapter 12 Rodney Douglas, Henry Markram, and Kevan Martin Instructor: Yoonsuck Choe; CPSC 644 Cortical Networks Cortical Structures in the Brain Bark-like (cortical) structures:
Neocortex Shepherd (2004) Chapter 12 Rodney Douglas, Henry Markram, and Kevan Martin Instructor: Yoonsuck Choe; CPSC 644 Cortical Networks Cortical Structures in the Brain Bark-like (cortical) structures:
DISSECTION OF THE SHEEP'S BRAIN
 Sheep Brain Dissection Guide Page 1 DISSECTION OF THE SHEEP'S BRAIN Introduction The purpose of the sheep brain dissection is to familiarize you with the threedimensional structure of the brain and teach
Location-Scene Association Task. The Role of the Primate Medial Temporal Lobe in Associative Memory Formation. Wendy A. Suzuki AP 14.
 The Role of the Primate Medial Temporal Lobe in Associative Memory Formation Ventral View of Macaque Monkey Brain Wendy A. Suzuki Center for Neural Science New York University PH PR ER rs AP. DG HPC Sub
Hypothalamus. To learn how the brain regulates neuroendocrine secretions NTA Ch 14, pgs Key Figs: 14-3; 14-4,
 Hypothalamus Objectives To learn the general organization of the hypothalamus and the functions of the major nuclei NTA Ch 14, pgs. 419-422 Key Figs: 14-2, 14-3 To learn how the brain regulates neuroendocrine
in the New World Monkey, Saguinus
 THE JOURNAL OF COMPARATIVE NEUROLOGY 285487-513 (1989) Connections of Primary Auditory Cortex in the New World Monkey, Saguinus L.E. LUETHKE, L.A. KRUBITZER, AND J.H. KAAS Department of Hearing and Speech
CISC 3250 Systems Neuroscience
 CISC 3250 Systems Neuroscience Levels of organization Central Nervous System 1m 10 11 neurons Neural systems and neuroanatomy Systems 10cm Networks 1mm Neurons 100μm 10 8 neurons Professor Daniel Leeds
Supplementary Materials for
 advances.sciencemag.org/cgi/content/full/1/10/e1500775/dc1 Supplementary Materials for Structural-functional connectivity deficits of neocortical circuits in the Fmr1 /y mouse model of autism Matthias
A study of the histochemical demonstration of cytochrome oxidase
 497 A study of the histochemical demonstration of cytochrome oxidase By R. G. BUTCHER, J. V. DIENGDOH, and J. CHAYEN (From the Department of Pathology, Royal College of Surgeons of England, Lincoln's Inn
Medical Neuroscience Tutorial Notes
 Medical Neuroscience Tutorial Notes Finding the Central Sulcus MAP TO NEUROSCIENCE CORE CONCEPTS 1 NCC1. The brain is the body's most complex organ. LEARNING OBJECTIVES After study of the assigned learning
Relationship of Prefrontal Connections to Inhibitory Systems in Superior Temporal Areas in the Rhesus Monkey
 Cerebral Cortex September 2005;15:1356--1370 doi:10.1093/cercor/bhi018 Advance Access publication January 5, 2005 Relationship of Prefrontal Connections to Inhibitory Systems in Superior Temporal Areas
Sulcus Classification Rating Protocol: Anterior Temporobasal Sulci (SCRaP:aTB)
") Sulcus Classification Rating Protocol: Anterior Temporobasal Sulci (SCRaP:aTB) 2012 Reckess, Dunn, Bauer & Leonard Address correspondence to: Gila Z. Reckess, Ph.D. reckessg@gmail.com Anterior Temporobasal
Sulcus Classification Rating Protocol: Anterior Temporobasal Sulci (SCRaP:aTB) 2012 Reckess, Dunn, Bauer & Leonard Address correspondence to: Gila Z. Reckess, Ph.D. reckessg@gmail.com Anterior Temporobasal
Diversity of connections of the temporal neocortex with amygdaloid nuclei in the dog (Canis familiaris)
") Diversity of connections of the temporal neocortex with amygdaloid nuclei in the dog (Canis familiaris) Anna Kosmal, Monika Malinowska and Agnieszka Woinicka Department of Neurophysiology, Nencki Institute
Diversity of connections of the temporal neocortex with amygdaloid nuclei in the dog (Canis familiaris) Anna Kosmal, Monika Malinowska and Agnieszka Woinicka Department of Neurophysiology, Nencki Institute
Department of Health Sciences, Boston University, Boston, Massachusetts
 THE JOURNAL OF COMPARATIVE NEUROLOGY 410:343 367 (1999) Medial Prefrontal Cortices Are Unified by Common Connections With Superior Temporal Cortices and Distinguished by Input From Memory-Related Areas
Multiple Visual Areas in the Caudal Superior Temporal Sulcus of the Macaque
 THE JOURNAL OF COMPARATIVE NEUROLOGY 248:164-189 (1986) Multiple Visual Areas in the Caudal Superior Temporal Sulcus of the Macaque ROBERT DESIMONE AND LESLIE G. UNGERLEIDER Laboratory of Neuropsychology,
Mouse Cathepsin B ELISA Kit
 GenWay Biotech, Inc. 6777 Nancy Ridge Drive San Diego, CA 92121 Phone: 858.458.0866 Fax: 858.458.0833 Email: techline@genwaybio.com http://www.genwaybio.com Mouse Cathepsin B ELISA Kit Catalog No. GWB-ZZD154
Suppl. Information Supplementary Figure 1. Strategy/latency analysis of individual mice during maze learning. a,
 Goal-oriented searching mediated by ventral hippocampus early in trial-and-error learning Ruediger, S, Spirig, D., Donato, F., Caroni, P. Suppl. Information Supplementary Figure 1. Strategy/latency analysis
Nature Neuroscience: doi: /nn Supplementary Figure 1. Large-scale calcium imaging in vivo.
 Supplementary Figure 1 Large-scale calcium imaging in vivo. (a) Schematic illustration of the in vivo camera imaging set-up for large-scale calcium imaging. (b) High-magnification two-photon image from
Hippocampal diencephalic cingulate networks for memory and emotion: An anatomical guide
 723443BNA0010.1177/2398212817723443Brain and Neuroscience AdvancesBubb et al. review-article2017 Review Article Hippocampal diencephalic cingulate networks for memory and emotion: An anatomical guide Brain
London CYVlE 6BT. animals, by plotting receptive field positions for different recording sites. Results
 J. Physiol. (1978), 277, pp. 193-226 193 With 3 plates and 14 text-figures Printed in Great Britain THE TOPOGRAPHIC ORGANIZATION OF RHESUS MONKEY PRESTRIATE CORTEX BY D. C. VAN ESSEN* AND S. M. ZEKIt From
The Neurophysiology of Memory
 The Neurophysiology of Memory WENDY A. SUZUKI a,c AND HOWARD EICHENBAUM b a Center for Neural Science, New York University, 4 Washington Place, Room 809, New York, New York 10003, USA b Laboratory of Cognitive
THE ORGANIZATION OF AMYGDALOPETAL PROJECTIONS FROM THE LATERAL HYPOTHALAMUS AND PREOPTIC AREA IN THE RAT
 ACTA NEUROBIOL. EXP. 1977, 37: 247-252 THE ORGANIZATION OF AMYGDALOPETAL PROJECTIONS FROM THE LATERAL HYPOTHALAMUS AND PREOPTIC AREA IN THE RAT Liliana NITECKA, Olgierd NARKIEWICZ and Czeslaw JAKIEL Department
Medical Neuroscience Tutorial Notes
 Medical Neuroscience Tutorial Notes Lateral Surface of the Brain MAP TO NEUROSCIENCE CORE CONCEPTS 1 NCC1. The brain is the body's most complex organ. LEARNING OBJECTIVES After study of the assigned learning
Prior Knowledge and Memory Consolidation Expanding Competitive Trace Theory
 Prior Knowledge and Memory Consolidation Expanding Competitive Trace Theory Anna Smith Outline 1. 2. 3. 4. 5. Background in Memory Models Models of Consolidation The Hippocampus Competitive Trace Theory
Human Cathepsin D ELISA Kit
 GenWay Biotech, Inc. 6777 Nancy Ridge Drive San Diego, CA 92121 Phone: 858.458.0866 Fax: 858.458.0833 Email: techline@genwaybio.com http://www.genwaybio.com Human Cathepsin D ELISA Kit Catalog No. GWB-J4JVV9
Cortical Connections of Functional Zones in Posterior Parietal Cortex and Frontal Cortex Motor Regions in New World Monkeys
 Cerebral Cortex Advance Access published January 24, 2011 Cerebral Cortex doi:10.1093/cercor/bhq260 Cortical Connections of Functional Zones in Posterior Parietal Cortex and Frontal Cortex Motor Regions
Skeletal Muscle : Structure
 1 Skeletal Muscle : Structure Dr.Viral I. Champaneri, MD Assistant Professor Department of Physiology 2 Learning objectives 1. Gross anatomy of the skeletal muscle 2. Myofilaments & their molecular structure
Nature Neuroscience: doi: /nn Supplementary Figure 1. Diverse anorexigenic signals induce c-fos expression in CEl PKC-δ + neurons
 Supplementary Figure 1 Diverse anorexigenic signals induce c-fos expression in CEl PKC-δ + neurons a-c. Quantification of CEl c-fos expression in mice intraperitoneal injected with anorexigenic drugs (a),
Brain anatomy and artificial intelligence. L. Andrew Coward Australian National University, Canberra, ACT 0200, Australia
 Brain anatomy and artificial intelligence L. Andrew Coward Australian National University, Canberra, ACT 0200, Australia The Fourth Conference on Artificial General Intelligence August 2011 Architectures
Mechanosensation. Central Representation of Touch. Wilder Penfield. Somatotopic Organization
 Mechanosensation Central Representation of Touch Touch and tactile exploration Vibration and pressure sensations; important for clinical testing Limb position sense John H. Martin, Ph.D. Center for Neurobiology
20 2 Stomach Fig. 2.1 An illustration showing different patterns of the myenteric plexus peculiar to the regions in the guinea-pig stomach stained wit
 Stomach 2 The stomach is unique in that ICC have a different distribution in proximal and distal regions of the same organ. ICC-CM and ICC-LM are densely distributed throughout the thick circular and longitudinal
Dissociable Effects of Lesions to the Perirhinal Cortex and the Postrhinal Cortex on Memory for Context and Objects in Rats
 Behavioral Neuroscience Copyright 2005 by the American Psychological Association 2005, Vol. 119, No. 2, 557 566 0735-7044/05/$12.00 DOI: 10.1037/0735-7044.119.2.557 Dissociable Effects of Lesions to the
PHY3111 Mid-Semester Test Study. Lecture 2: The hierarchical organisation of vision
 PHY3111 Mid-Semester Test Study Lecture 2: The hierarchical organisation of vision 1. Explain what a hierarchically organised neural system is, in terms of physiological response properties of its neurones.
Zhu et al, page 1. Supplementary Figures
 Zhu et al, page 1 Supplementary Figures Supplementary Figure 1: Visual behavior and avoidance behavioral response in EPM trials. (a) Measures of visual behavior that performed the light avoidance behavior
Nature Neuroscience: doi: /nn Supplementary Figure 1. Distribution of starter cells for RV-mediated retrograde tracing.
 Supplementary Figure 1 Distribution of starter cells for RV-mediated retrograde tracing. Parcellation of cortical areas is based on Allen Mouse Brain Atlas and drawn to scale. Thick white curves, outlines
Hiroyuki Nakamura, 1,2 Tatsuya Kuroda, 3 Masumi Wakita, 4 Makoto Kusunoki, 5 Akemi Kato, 4 Akichika Mikami, 4 Hideo Sakata, 5 and Kazuo Itoh 1
 The Journal of Neuroscience, October 15, 2001, 21(20):8174 8187 From Three-Dimensional Space Vision to Prehensile Hand Movements: The Lateral Intraparietal Area Links the Area V3A and the Anterior Intraparietal
Protn-Latex. For Determination of Protein in Latex. (Cat. # Latex, Latex) think proteins! think G-Biosciences
 think proteins! think G-Biosciences") 415PR-02 G-Biosciences 1-800-628-7730 1-314-991-6034 technical@gbiosciences.com A Geno Technology, Inc. (USA) brand name Protn-Latex For Determination of Protein in Latex (Cat. # 786-20Latex, 786-21Latex)
415PR-02 G-Biosciences 1-800-628-7730 1-314-991-6034 technical@gbiosciences.com A Geno Technology, Inc. (USA) brand name Protn-Latex For Determination of Protein in Latex (Cat. # 786-20Latex, 786-21Latex)
Cortical Control of Movement
 Strick Lecture 2 March 24, 2006 Page 1 Cortical Control of Movement Four parts of this lecture: I) Anatomical Framework, II) Physiological Framework, III) Primary Motor Cortex Function and IV) Premotor
POSITIONAL FIRING PROPERTIES
 Neuroscience 0 (2003) 000 POSITIONAL FIRING PROPERTIES OF POSTRHINAL CORTEX NEURONS R. D. BURWELL a * AND D. M. HAFEMAN b a Brown University, Psychology Department, 89 Waterman, Providence, RI 02912, USA
Perirhinal Cortex Lesions in Rats: Novelty Detection and Sensitivity to Interference
 Behavioral Neuroscience 2015 The Author(s) 2015, Vol. 129, No. 3, 227 243 0735-7044/15/$12.00 http://dx.doi.org/10.1037/bne0000049 Perirhinal Cortex Lesions in Rats: Novelty Detection and Sensitivity to
Introduction to Ultrasound Guided Region Anesthesia
 Introduction to Ultrasound Guided Region Anesthesia Brian D. Sites, MD Dept of Anesthesiology Dartmouth-Hitchcock Medical Center INTRODUCTION Welcome to Introduction to Ultrasound Guided Regional Anesthesia.
Supporting Information
 Supporting Information Markov et al. 10.1073/pnas.1218972110 SI Methods Source and Target Locations. Source and target locations first were identified on section outlines of the individual macaque brains
CEREBRUM & CEREBRAL CORTEX
 CEREBRUM & CEREBRAL CORTEX Seonghan Kim Dept. of Anatomy Inje University, College of Medicine THE BRAIN ANATOMICAL REGIONS A. Cerebrum B. Diencephalon Thalamus Hypothalamus C. Brain Stem Midbrain Pons
Human Cingulate Cortex: Surface Features, Flat Maps, and Cytoarchitecture
 THE JOURNAL OF COMPARATIVE NEUROLOGY 359:490-506 (1995) Human Cingulate Cortex: Surface Features, Flat Maps, and Cytoarchitecture BRENT A. VOGT, ESTHER A. NIMCHINSKY, LESLIE J. VOGT, AND PATRICK R. HOF
Neurofilament and Calcium-Binding Proteins in the Human Cingulate Cortex
 THE JOURNAL OF COMPARATIVE NEUROLOGY 384:597 620 (1997) Neurofilament and Calcium-Binding Proteins in the Human Cingulate Cortex ESTHER A. NIMCHINSKY, 1 BRENT A. VOGT, 4 JOHN H. MORRISON, 1,2 AND PATRICK
LISC-322 Neuroscience Cortical Organization
 LISC-322 Neuroscience Cortical Organization THE VISUAL SYSTEM Higher Visual Processing Martin Paré Assistant Professor Physiology & Psychology Most of the cortex that covers the cerebral hemispheres is
Chapter 6: Hippocampal Function In Cognition. From Mechanisms of Memory, second edition By J. David Sweatt, Ph.D.
 Chapter 6: Hippocampal Function In Cognition From Mechanisms of Memory, second edition By J. David Sweatt, Ph.D. Grid Cell The Hippocampus Serves a Role in Multimodal Information Processing and Memory
LIMBIC SYSTEM. Dr. Amani A. Elfaki Associate Professor Department of Anatomy
 LIMBIC SYSTEM Dr. Amani A. Elfaki Associate Professor Department of Anatomy Learning Objectives Define the limbic system Identify the parts of the limbic system Describe the circulation of the limbic system
Cells and viruses. Human isolates (A/Kawasaki/173/01 [H1N1], A/Yokohama/2057/03 [H3N2],
![Cells and viruses. Human isolates (A/Kawasaki/173/01 [H1N1], A/Yokohama/2057/03 [H3N2],](/thumbs/86/93801604.jpg "Cells and viruses. Human isolates (A/Kawasaki/173/01 [H1N1], A/Yokohama/2057/03 [H3N2],") Supplementary information Methods Cells and viruses. Human isolates (A/Kawasaki/173/01 [H1N1], A/Yokohama/2057/03 [H3N2], and A/Hong Kong/213/03 [H5N1]) were grown in Madin-Darby canine kidney (MDCK) cells
Supplementary information Methods Cells and viruses. Human isolates (A/Kawasaki/173/01 [H1N1], A/Yokohama/2057/03 [H3N2], and A/Hong Kong/213/03 [H5N1]) were grown in Madin-Darby canine kidney (MDCK) cells
Medical Neuroscience Tutorial Notes
 Medical Neuroscience Tutorial Notes Blood Supply to the Brain MAP TO NEUROSCIENCE CORE CONCEPTS 1 NCC1. The brain is the body's most complex organ. LEARNING OBJECTIVES After study of the assigned learning
The Hippocampus and Long-Term Object Memory in the Rat
 The Journal of Neuroscience, April 15, 1996, 16(8):278-2787 The Hippocampus and Long-Term Object Memory in the Rat Norbert Vnek and Lawrence A. Rothblat Department of Psychology, George Washington University,
Chapter 3. Structure and Function of the Nervous System. Copyright (c) Allyn and Bacon 2004
 Allyn and Bacon 2004") Chapter 3 Structure and Function of the Nervous System 1 Basic Features of the Nervous System Neuraxis: An imaginary line drawn through the center of the length of the central nervous system, from the
Chapter 3 Structure and Function of the Nervous System 1 Basic Features of the Nervous System Neuraxis: An imaginary line drawn through the center of the length of the central nervous system, from the
Ultrasound Physics & Terminology
 Ultrasound Physics & Terminology This module includes the following: Basic physics terms Basic principles of ultrasound Ultrasound terminology and terms Common artifacts seen Doppler principles Terms for
Prof. Saeed Abuel Makarem & Dr.Sanaa Alshaarawy
 Prof. Saeed Abuel Makarem & Dr.Sanaa Alshaarawy 1 Objectives By the end of the lecture, you should be able to: Describe the anatomy and main functions of the thalamus. Name and identify different nuclei
Protein MultiColor Stable, Low Range
 Product Name: DynaMarker Protein MultiColor Stable, Low Range Code No: DM670L Lot No: ******* Size: 200 μl x 3 (DM670 x 3) (120 mini-gel lanes) Storage: 4 C Stability: 12 months at 4 C Storage Buffer:
Background & Rationale Great apes share many behavioral, cognitive, and neuroanatomical similarities with humans. Yet, there are also significant
 Background & Rationale Great apes share many behavioral, cognitive, and neuroanatomical similarities with humans. Yet, there are also significant differences that distinguish humans from apes in terms
Multiple Circuits Relaying Primate Parallel Visual Pathways
 The Journal of Neuroscience, December 6, 2006 26(49):12789 12798 12789 Behavioral/Systems/Cognitive Multiple Circuits Relaying Primate Parallel Visual Pathways to the Middle Temporal Area Jonathan J. Nassi
Microcircuitry coordination of cortical motor information in self-initiation of voluntary movements
 Y. Isomura et al. 1 Microcircuitry coordination of cortical motor information in self-initiation of voluntary movements Yoshikazu Isomura, Rie Harukuni, Takashi Takekawa, Hidenori Aizawa & Tomoki Fukai
Mouse C-peptide EIA. Cat. No. YII-YK013-EX FOR LABORATORY USE ONLY
 Mouse C-peptide EIA Cat. No. YII-YK013-EX FOR LABORATORY USE ONLY TOYO 2CHOME, KOTO-KU, TOKYO, 135-0016, JAPAN http://www.cosmobio.co.jp e-mail : export@cosmobio.co.jp Phone : +81-3-5632-9617 FAX : +81-3-5632-9618
A sketch of the central nervous system and its origins. MIT 9.14 Classes 31
 A sketch of the central nervous system and its origins G. E. Schneider 2014 Part 9: Hypothalamus & Limbic System MIT 9.14 Classes 31 The vertebrate medial pallium; in mammals: the hippocampal formation
ZBED6 expression pattern during embryogenesis and in the central nervous system
 ZBED6expressionpatternduringembryogenesisandin thecentralnervoussystem AxelEricsson 2010 DepartmentofNeuroscience DevelopmentalgeneticsUppsalaUniversity Supervisors:KlasKullanderandMartinLarhammar 1 P
Application Note # MT-91. High Quality MALDI Imaging of Proteins and Peptides in Small Rodent Organ Tissues. Bruker Daltonics.
 Bruker Daltonics Application Note # MT-91 18385 Da 6230 Da 7843 Da High Quality MALDI Imaging of Proteins and Peptides in Small Rodent Organ Tissues New developments in MALDI instrumentation, laser technology
Contextual Fear Discrimination Is Impaired by Damage to the Postrhinal or Perirhinal Cortex
 Behavioral Neuroscience Copyright 2002 by the American Psychological Association, Inc. 2002, Vol. 116, No. 3, 479 488 0735-7044/02/$5.00 DOI: 10.1037//0735-7044.116.3.479 Contextual Fear Discrimination
Cortical Connections of the Inferior Parietal Cortical Convexity of the Macaque Monkey
 Cerebral Cortex October 2006;16:1389--1417 doi:10.1093/cercor/bhj076 Advance Access publication November 23, 2005 Cortical Connections of the Inferior Parietal Cortical Convexity of the Macaque Monkey
Connections of Somatosensory Cortex in Megachiropteran Bats: The Evolution of Cortical Fields in Mammals
 THE JOURNAL OF COMPARATIVE NEUROLOGY 327~473-506 (1993) Connections of Somatosensory Cortex in Megachiropteran Bats: The Evolution of Cortical Fields in Mammals LEAH A. KRUBITZER, MIKE B. CALFORD, AND
Outline of the next three lectures
 Outline of the next three lectures Lecture 35 Anatomy of the human cerebral cortex gross and microscopic cell types connections Vascular supply of the cerebral cortex Disorders involving the cerebral cortex
Mouse TrkB ELISA Kit
 Mouse TrkB ELISA Kit CATALOG NO: IRKTAH5472 LOT NO: SAMPLE INTENDED USE For quantitative detection of mouse TrkB in cell culture supernates, cell lysates and tissue homogenates. BACKGROUND TrkB receptor
ANATOMY & PHYSIOLOGY DISSECTION OF THE SHEEP BRAIN LAB GROUP:
 ANATOMY & PHYSIOLOGY DISSECTION OF THE SHEEP BRAIN LAB GROUP: Introduction The purpose of the sheep brain dissection is to familiarize you with the three dimensional structure of the brain and teach you
Supplemental Information. A Visual-Cue-Dependent Memory Circuit. for Place Navigation
 Neuron, Volume 99 Supplemental Information A Visual-Cue-Dependent Memory Circuit for Place Navigation Han Qin, Ling Fu, Bo Hu, Xiang Liao, Jian Lu, Wenjing He, Shanshan Liang, Kuan Zhang, Ruijie Li, Jiwei
Projections of the posterior parietal cortex to the orbitofrontal cortex in the rat
 NORWEGIAN UNIVERSITY OF SCIENCE AND TECHNOLOGY MASTER S THESIS Projections of the posterior parietal cortex to the orbitofrontal cortex in the rat Author: Karoline Hovde Supervisor: Prof. Menno P. Witter