Supplementary Figure 1. Nature Neuroscience: doi: /nn.4547
|
|
|
- Lesley Walker
- 5 years ago
- Views:
Transcription
1 Supplementary Figure 1
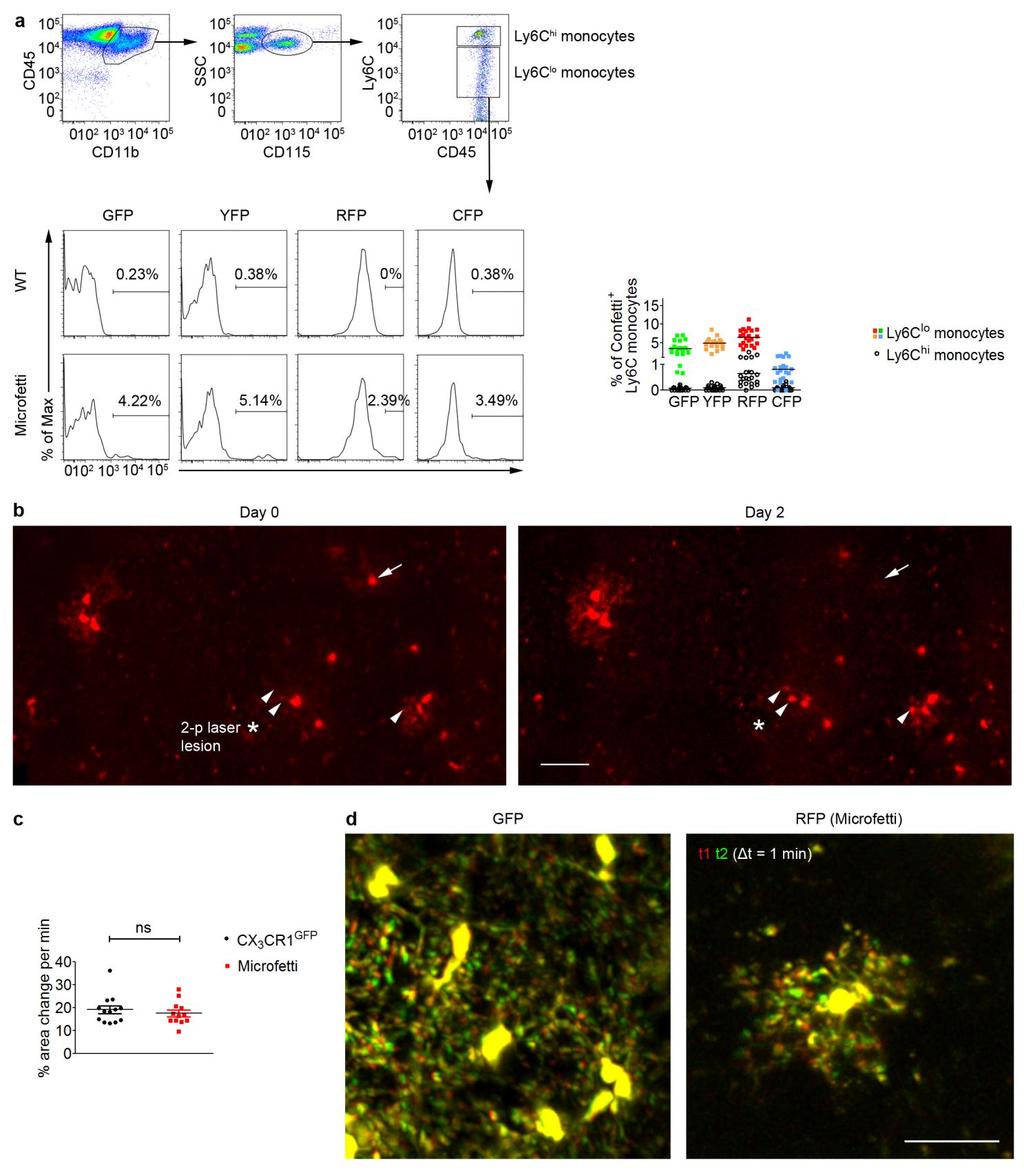
2 Characterization of the Microfetti mouse model. (a) Gating strategy for 8-color flow analysis of peripheral Ly-6C + monocytes from Microfetti mice 5-7 days after TAM treatment. Living cells in the forward and side scatter were gated on CD45 + CD11b +, followed by CD115 + to separate monocytes from granulocytes. Monocytes were distinguished by Ly-6C expression levels. Representative histograms of Confetti (GFP, YFP, RFP and CFP) expression in Microfetti Ly-6C lo monocytes (left). Confetti signals were gated on Confetti-negative WT counterparts. Expression of Confetti reporter in Ly-6C hi (open circle) and Ly-6C lo (colored) monocytes (right). Each symbol represents one mouse. Animals with Confetti-labeled Ly-6C lo monocytes were used for tracking long-term microglial self-renewal during homeostasis (n = 21 mice; data shown as total Confetti expression in Fig. 2b, 1 dead animal excluded). (b) Detection of microglial division in vivo. Three Microfetti mice were examined by two-photon laser scanning microscopy via a cortical window six weeks after TAM treatment (see Supplemental Experimental Procedures). A representative image shows RFP + microglial cells (arrowheads) emerged two days after targeted laser lesion (asterisk). One RFP + microglial cell (arrow) was no longer detected in the same 200 µm depth volume on Day 2. Scale bar, 50 µm (same scale in both panels). (c) Quantification of change in area of coverage by GFP + and RFP + microglia per minute of in vivo imaging over 30 minutes from Cx3cr1 GFP/+ and Microfetti mice, respectively. Each symbol represents one microglial cell. Mann Whitney U-test, P = ns, not significant. Data are represented as mean ± SEM. n = 3 mice per genotype. (d) Representative maximum intensity projection images for c showing two consecutive time points, t1 (red) and t2 (green), with 1 minute interval. Static structures are revealed in the overlay (yellow). Scale bar, 30 µm (same scale in both panels). See also Supplementary Videos 1 and 2.
3
4 Supplementary Figure 2 Differential regional stability of the microglial network during steady state. (a) Representative 2D renderings of Confetti + (green, yellow, red, and cyan colored balls) and Iba-1 immunolabeled (magenta balls) microglia from 636 µm x 636 µm x 50 µm confocal volumes of the cortex, hippocampus and cerebellum over 1-36 weeks after TAM treatment of 8 weeks old female Microfetti mice. (b) Confetti + microglial densities in different brain regions over 36 weeks. Microglial density (y-axis) was obtained from dividing same color cell counts by ring volume of each central ring size (x-axis). Cell densities from recorded data (red line) were plotted against densities derived from 10,000 Monte Carlo (MC) simulation of random distribution of Confetti + microglia within each dataset (blue box plots represent simulated density distributions: central mark is the median, box represents the 25 th to 75 th percentiles, whiskers extend up to the 98 th percentile and data points above were regarded as outliers). Measured values (red line) that appear above the 98 th percentile of MC simulations (blue whiskers), for example at 8 weeks after TAM treatment in the hippocampus and cerebellum where r = 40 µm, indicate the non-random appearance of same color Confetti + microglial cells and imply that proliferation occurred. This peak represents a single cell replication event in an arbitrary volume of mm 3. Mean data are shown. n = 5 mice per time point. (c) Quantitative analysis of randomness of microglial cell proliferation events detected in b. A pair of same color Confetti + microglial cells with 50 µm spatial distance was considered a single cell replication event. Distribution of standard deviation (SD) of a MC simulation (10,000 iterations) of locations of proliferation events derived from a uniform distribution are represented as box plots (blue box plots: central mark is the median, box represents the 25 th to 75 th percentiles, whiskers represent the 2 nd and 98 th percentiles, and outliers are plotted in red + signs). Average SD of the distribution of observed replication events to a perfect uniform distribution (black cross) was compared to MC simulation. Where the observed SD falls within the MC range between the whiskers, the locations of proliferation events can be considered randomly distributed.
5
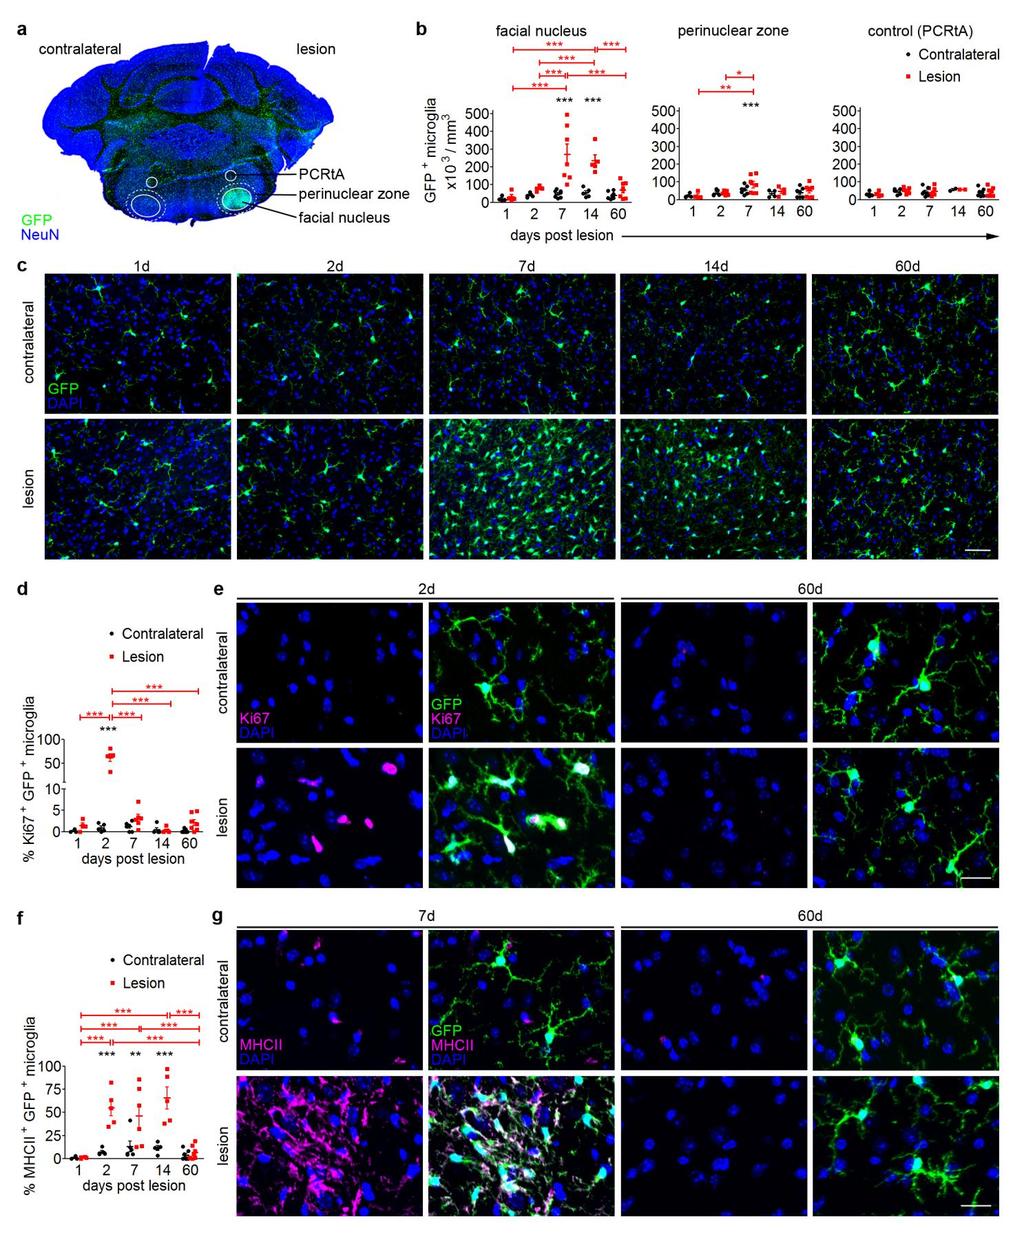
6 Supplementary Figure 3 Spatiotemporal analysis of microglial expansion and redistribution in the injured facial nucleus. (a) Coronal brain section of a Cx3cr1 GFP/+ mouse 7d post facial nerve lesion depicts areas analyzed for kinetics of microglial proliferation in the facial nucleus degeneration model. Microglial cells were marked by GFP (green). Neurons were immunolabeled with NeuN (blue) to locate the facial nucleus in the pons. The facial nucleus, a 200 µm broad perinuclear zone, and the parvicellular reticular nucleus, alpha part (PCRtA) were isolated in equal dimensions on lesion and contralateral sides for quantification of GFP + microglia using the Imaris software. (b) Quantification of GFP + microglial cells in contralateral (black) and injured (red) facial nuclei from onset (1 to 2d) to peak (7 and 14d) to resolution of injury (60d) in 8-14 weeks old female Cx3cr1 GFP/+ mice. (c) Representative confocal images of microglia (GFP, green) with DAPI nuclear counterstain (blue) in matched facial nuclei during the time course of injury. (d) Kinetics of microglial proliferation indicated by Ki67 immunohistochemistry. (e) Representative confocal images for d. Microglia took on less ramified and more amoeboid morphology at 2 d after the lesion. GFP + microglia (green), Ki67 (magenta) and DAPI (blue). (f) Kinetics of microglial activation indicated by MHC class II immunohistochemistry. (g) Representative confocal images for f. Microglia were highly activated and assumed a rod-like or amoeboid morphology 7d following nerve transection. GFP + microglia (green), MHC class II (magenta) and DAPI (blue). Data are represented as mean ± SEM in b, d and f. n = 4 (1 d), 5 (2 d), 6 (7 d), 5 (14 d) and 7 (60 d) mice pooled from five experiments, 3-6 sections each. Two-way ANOVA, * P = in b, ** P = in b, in f, *** P < in b, d and f. Scale bars, 50 µm in c, 20 µm in e and g.
 Quantification of EdU + GFP + microglial cells external of the facial nuclei (in female Cx3cr1 GFP/+ mice injured at 8-14 weeks old) at peak of microgliosis (7 d) and recovery (60 d).")
7 Supplementary Figure 4 Distribution of EdU + GFP + microglial cells outside of facial nuclei at 7 and 60 d after lesion. (a) Quantification of EdU + GFP + microglial cells external of the facial nuclei (in female Cx3cr1 GFP/+ mice injured at 8-14 weeks old) at peak of microgliosis (7 d) and recovery (60 d). Each black and red symbol represents one paired count. Data are pooled from two experiments and shown as mean ± SEM. n = 8 (7 d) and 9 (60 d) mice. Two-way ANOVA, time point *** P = 0.001, lesion *** P < (b) Representative overview images for a showing lesion and contralateral pons. Dotted lines demarcate the facial nuclei. High magnification insets show EdU + GFP + microglial cells in the intermediate reticular nucleus. Scale bars, 500 µm, 50 µm in inset.
8 Supplementary Figure 5 Graphical abstract of context-dependent microglial renewal and clonal expansion. Microglial renewal occurs randomly and steadily throughout the healthy CNS with regional differences in rate. The onset of neurodegeneration triggers rapid clonal expansion and activation of microglial cells. During recovery the altered microglial network gradually returns to homeostatic cell density and a non-activated state. Excess microglia associated with disease are eliminated via cell egress and local apoptotic cell death to regain steady state microglial interfaces in the CNS.
9 Supplementary Table 1. Quantification of total Iba1 + microglia analyzed in cortex, hippocampus and cerebellum to determine the mean cell-cell distance (NN, nearest neighbor) and microglial distribution over 36 weeks. n = 5 mice per group. Brain region Total Iba1 + microglia analyzed Weeks after TAM Mean NN ± SEM / µm cortex 2,293 2,174 2,064 2,019 2, ± 0.86 hippocampus 2,168 2,076 2,027 2,130 2, ± 1.02 cerebellum 1,181 1,041 1,102 1,041 1, ± 2.14
10 Supplementary Table 2. Quantification of total CX3CR1 + GFP + microglia analyzed and microglial proliferation rates in each brain compartment. Proliferation rates were calculated from BrdU label per day ± SEM. n = 3 mice. Brain region Total GFP + microglia analyzed Daily proliferation rate / % olfactory bulb 12, ± cortex 15, ± hippocampus 8, ± hypothalamus 9, ± midbrain 12, ± cerebellum 7, ± 0.080
11 Supplementary Table 3. Quantification of Iba-1 + microglial density by measurement of nearest neighbor (NN) cell-cell distance. Mean distance ± SEM are shown. Minimum NN distance recorded is indicated in parentheses. Quantification of total microglial cells analyzed in each group is indicated in bold. n = 6 (2 d), 5 (7 d), 6 (14 d), 6 (30 d) and 7 (60 d) mice pooled from two experiments. Brain region contralateral lesion Days post lesion NN /µm ± ± ± ± ± 5.41 (min.) (18.33) (24.00) (19.69) (15.51) (25.26) cells NN /µm ± ± ± ± ± 2.33 (min.) (12.07) (7.82) (9.16) (8.97) (12.09) cells
Supplementary Figure 1
 Supplementary Figure 1 Genetic labeling of microglia Male and female 2-3 month-old CreERT2;R26-tdTomato mice or CreERT2;R26-tdTomato;Iba1-eGFP transgenic mice were treated with 1x, 2x (48 h apart), or
PHENOTYPIC DYNAMICS OF MICROGLIAL AND MONOCYTE-DERIVED CELLS IN GLIOBLASTOMA-BEARING MICE.
 SUPPLEMENTARY FIGURES, TABLES AND VIDEOS PHENOTYPIC DYNAMICS OF MICROGLIAL AND MONOCYTE-DERIVED CELLS IN GLIOBLASTOMA-BEARING MICE. Clément Ricard 1,2,3,4, Aurélie Tchoghandjian 2,4, Hervé Luche 5, Pierre
GFP/Iba1/GFAP. Brain. Liver. Kidney. Lung. Hoechst/Iba1/TLR9!
 Supplementary information a +KA Relative expression d! Tlr9 5!! 5! NSC Neuron Astrocyte Microglia! 5! Tlr7!!!! NSC Neuron Astrocyte! GFP/Sβ/! Iba/Hoechst Microglia e Hoechst/Iba/TLR9! GFP/Iba/GFAP f Brain
Nature Neuroscience: doi: /nn Supplementary Figure 1. Splenic atrophy and leucopenia caused by T3 SCI.
 Supplementary Figure 1 Splenic atrophy and leucopenia caused by T3 SCI. (a) Gross anatomy of representative spleens from control and T3 SCI mice at 28 days post-injury. (b and c) Hematoxylin and eosin
Nature Neuroscience: doi: /nn Supplementary Figure 1. MADM labeling of thalamic clones.
 Supplementary Figure 1 MADM labeling of thalamic clones. (a) Confocal images of an E12 Nestin-CreERT2;Ai9-tdTomato brain treated with TM at E10 and stained for BLBP (green), a radial glial progenitor-specific
Nature Neuroscience: doi: /nn Supplementary Figure 1
 Supplementary Figure 1 Atlas representations of the midcingulate (MCC) region targeted in this study compared against the anterior cingulate (ACC) region commonly reported. Coronal sections are shown on
Supplementary Information
 Supplementary Information Title Degeneration and impaired regeneration of gray matter oligodendrocytes in amyotrophic lateral sclerosis Authors Shin H. Kang, Ying Li, Masahiro Fukaya, Ileana Lorenzini,
Supplementary Figure 1
 Supplementary Figure 1 The average sigmoid parametric curves of capillary dilation time courses and average time to 50% peak capillary diameter dilation computed from individual capillary responses averaged
Supplementary Figure 1. Microglia do not show signs of classical immune activation following MD a-b. Images showing immunoreactivity for MHCII (a)
") 1 Supplementary Figure 1. Microglia do not show signs of classical immune activation following MD a-b. Images showing immunoreactivity for MHCII (a) and CD45 (b) in fixed sections of binocular visual cortex
1 Supplementary Figure 1. Microglia do not show signs of classical immune activation following MD a-b. Images showing immunoreactivity for MHCII (a) and CD45 (b) in fixed sections of binocular visual cortex
Specimen. Humeral Head. Femoral Head. Objective. Femoral Condyle (medial) Supplementary Figure 1
 Supplementary Figure 1") A B Specimen Humeral Head 2 1 µm 76 µm Femoral Head Objective Femoral Condyle (medial) Supplementary Figure 1 A Femoral Head Global Cell Density Superficial Cell Density Cell Number at 1 µm Nuclei /.1
A B Specimen Humeral Head 2 1 µm 76 µm Femoral Head Objective Femoral Condyle (medial) Supplementary Figure 1 A Femoral Head Global Cell Density Superficial Cell Density Cell Number at 1 µm Nuclei /.1
Nature Neuroscience doi: /nn Supplementary Figure 1. Characterization of viral injections.
 Supplementary Figure 1 Characterization of viral injections. (a) Dorsal view of a mouse brain (dashed white outline) after receiving a large, unilateral thalamic injection (~100 nl); demonstrating that
File name: Supplementary Information Description: Supplementary Figures, Supplementary Table and Supplementary References
 File name: Supplementary Information Description: Supplementary Figures, Supplementary Table and Supplementary References File name: Supplementary Data 1 Description: Summary datasheets showing the spatial
Nature Neuroscience: doi: /nn Supplementary Figure 1
 Supplementary Figure 1 Quantification of myelin fragments in the aging brain (a) Electron microscopy on corpus callosum is shown for a 18-month-old wild type mice. Myelin fragments (arrows) were detected
Diabetic pdx1-mutant zebrafish show conserved responses to nutrient overload and anti-glycemic treatment
 Supplementary Information Diabetic pdx1-mutant zebrafish show conserved responses to nutrient overload and anti-glycemic treatment Robin A. Kimmel, Stefan Dobler, Nicole Schmitner, Tanja Walsen, Julia
ROCK/Cdc42-mediated microglial motility and gliapse formation lead to phagocytosis of degenerating dopaminergic neurons in vivo
 Supplementary Information ROCK/Cdc42-mediated microglial motility and gliapse formation lead to phagocytosis of degenerating dopaminergic neurons in vivo Carlos Barcia* 1,2, Carmen M Ros 1,2, Valentina
SUPPLEMENTARY INFORMATION
 doi:10.1038/nature10188 Supplementary Figure 1. Embryonic epicardial genes are down-regulated from midgestation stages and barely detectable post-natally. Real time qrt-pcr revealed a significant down-regulation
Nature Neuroscience: doi: /nn Supplementary Figure 1. Behavioral training.
 Supplementary Figure 1 Behavioral training. a, Mazes used for behavioral training. Asterisks indicate reward location. Only some example mazes are shown (for example, right choice and not left choice maze
SUPPLEMENTARY INFORMATION
 doi: 10.1038/nature06994 A phosphatase cascade by which rewarding stimuli control nucleosomal response A. Stipanovich*, E. Valjent*, M. Matamales*, A. Nishi, J.H. Ahn, M. Maroteaux, J. Bertran-Gonzalez,
Supplementary information - Table (1), Figures (12), and Videos (5)
, Figures (12), and Videos (5)") Supplementary information - Table (1), Figures (12), and Videos (5) A soft, transparent, freely accessible cranial window for chronic imaging and electrophysiology Chaejeong Heo 1, Hyejin Park 1, 2, Yong-Tae
Supplementary information - Table (1), Figures (12), and Videos (5) A soft, transparent, freely accessible cranial window for chronic imaging and electrophysiology Chaejeong Heo 1, Hyejin Park 1, 2, Yong-Tae
Supplementary Figure 1 Chemokine and chemokine receptor expression during muscle regeneration (a) Analysis of CR3CR1 mrna expression by real time-pcr
 Analysis of CR3CR1 mrna expression by real time-pcr") Supplementary Figure 1 Chemokine and chemokine receptor expression during muscle regeneration (a) Analysis of CR3CR1 mrna expression by real time-pcr at day 0, 1, 4, 10 and 21 post- muscle injury. (b)
Supplementary Figure 1 Chemokine and chemokine receptor expression during muscle regeneration (a) Analysis of CR3CR1 mrna expression by real time-pcr at day 0, 1, 4, 10 and 21 post- muscle injury. (b)
Supplementary Materials for
 www.sciencetranslationalmedicine.org/cgi/content/full/4/117/117ra8/dc1 Supplementary Materials for Notch4 Normalization Reduces Blood Vessel Size in Arteriovenous Malformations Patrick A. Murphy, Tyson
mm Distance (mm)
") b a Magnet Illumination Coverslips MPs Objective 2575 µm 1875 µm 1575 µm 1075 µm 875 µm 545 µm 20µm 2 3 0.5 0.3mm 1 1000 100 10 1 0.1 1000 100 10 1 0.1 Field Induction (Gauss) 1.5 0 5 10 15 20 Distance
b a Magnet Illumination Coverslips MPs Objective 2575 µm 1875 µm 1575 µm 1075 µm 875 µm 545 µm 20µm 2 3 0.5 0.3mm 1 1000 100 10 1 0.1 1000 100 10 1 0.1 Field Induction (Gauss) 1.5 0 5 10 15 20 Distance
Ahtiainen et al., http :// /cgi /content /full /jcb /DC1
 Supplemental material JCB Ahtiainen et al., http ://www.jcb.org /cgi /content /full /jcb.201512074 /DC1 THE JOURNAL OF CELL BIOLOGY Figure S1. Distinct distribution of different cell cycle phases in the
Supplementary figure 1: LII/III GIN-cells show morphological characteristics of MC
 1 2 1 3 Supplementary figure 1: LII/III GIN-cells show morphological characteristics of MC 4 5 6 7 (a) Reconstructions of LII/III GIN-cells with somato-dendritic compartments in orange and axonal arborizations
Nature Neuroscience: doi: /nn Supplementary Figure 1. Neuron class-specific arrangements of Khc::nod::lacZ label in dendrites.
 Supplementary Figure 1 Neuron class-specific arrangements of Khc::nod::lacZ label in dendrites. Staining with fluorescence antibodies to detect GFP (Green), β-galactosidase (magenta/white). (a, b) Class
B220 CD4 CD8. Figure 1. Confocal Image of Sensitized HLN. Representative image of a sensitized HLN
 B220 CD4 CD8 Natarajan et al., unpublished data Figure 1. Confocal Image of Sensitized HLN. Representative image of a sensitized HLN showing B cell follicles and T cell areas. 20 µm thick. Image of magnification
Supplemental Information. Myocardial Polyploidization Creates a Barrier. to Heart Regeneration in Zebrafish
 Developmental Cell, Volume 44 Supplemental Information Myocardial Polyploidization Creates a Barrier to Heart Regeneration in Zebrafish Juan Manuel González-Rosa, Michka Sharpe, Dorothy Field, Mark H.
Supplementary Figure S1: Tanycytes are restricted to the central/posterior hypothalamus
 Supplementary Figure S1: Tanycytes are restricted to the central/posterior hypothalamus a: Expression of Vimentin, GFAP, Sox2 and Nestin in anterior, central and posterior hypothalamus. In the anterior
Zhu et al, page 1. Supplementary Figures
 Zhu et al, page 1 Supplementary Figures Supplementary Figure 1: Visual behavior and avoidance behavioral response in EPM trials. (a) Measures of visual behavior that performed the light avoidance behavior
Supplementary Materials
 Supplementary Materials Fig. S1. Weights of full-dose treatment groups comparing 1 st, 2 nd, and 3 rd generation gene replacement therapy. Mice were treated at p1 with 4x10 11 GC of the three different
Inhibition of DYRK1A stimulates human beta-cell proliferation
 Inhibition of DYRK1A stimulates human beta-cell proliferation Ercument Dirice 1,, Deepika Walpita 2,, Amedeo Vetere 2, Bennett C. Meier 2,5, Sevim Kahraman 1, Jiang Hu 1, Vlado Dančík 2, Sean M. Burns
Nature Neuroscience: doi: /nn Supplementary Figure 1. Diverse anorexigenic signals induce c-fos expression in CEl PKC-δ + neurons
 Supplementary Figure 1 Diverse anorexigenic signals induce c-fos expression in CEl PKC-δ + neurons a-c. Quantification of CEl c-fos expression in mice intraperitoneal injected with anorexigenic drugs (a),
Supplementary Figure 1: Validation of labeling specificity of immature OSNs and presynaptic terminals. (A) (B) (C) (D) (E)
 (B) (C) (D) (E)") Supplementary Figure 1: Validation of labeling specificity of immature OSNs and presynaptic terminals. (A) Confocal images of septal olfactory epithelium of an adult Gγ8-sypGFP-tdTom mouse showing colocalization
Supplementary Figure 1: Validation of labeling specificity of immature OSNs and presynaptic terminals. (A) Confocal images of septal olfactory epithelium of an adult Gγ8-sypGFP-tdTom mouse showing colocalization
d e f Spatiotemporal quantification of subcellular ATP levels in a single HeLa cell during changes in morphology Supplementary Information
 Ca 2+ level (a. u.) Area (a. u.) Normalized distance Normalized distance Center Edge Center Edge Relative ATP level Relative ATP level Supplementary Information Spatiotemporal quantification of subcellular
Broad Integration of Expression Maps and Co-Expression Networks Compassing Novel Gene Functions in the Brain
 Supplementary Information Broad Integration of Expression Maps and Co-Expression Networks Compassing Novel Gene Functions in the Brain Yuko Okamura-Oho a, b, *, Kazuro Shimokawa c, Masaomi Nishimura b,
Supplementary Figure 1 Information on transgenic mouse models and their recording and optogenetic equipment. (a) 108 (b-c) (d) (e) (f) (g)
 108 (b-c) (d) (e) (f) (g)") Supplementary Figure 1 Information on transgenic mouse models and their recording and optogenetic equipment. (a) In four mice, cre-dependent expression of the hyperpolarizing opsin Arch in pyramidal cells
Supplementary Figure 1 Information on transgenic mouse models and their recording and optogenetic equipment. (a) In four mice, cre-dependent expression of the hyperpolarizing opsin Arch in pyramidal cells
McWilliams et al., http :// /cgi /content /full /jcb /DC1
 Supplemental material JCB McWilliams et al., http ://www.jcb.org /cgi /content /full /jcb.201603039 /DC1 THE JOURNAL OF CELL BIOLOGY Figure S1. In vitro characterization of mito-qc. (A and B) Analysis
SUPPLEMENTARY INFORMATION
 doi:1.138/nature1554 a TNF-α + in CD4 + cells [%] 1 GF SPF 6 b IL-1 + in CD4 + cells [%] 5 4 3 2 1 Supplementary Figure 1. Effect of microbiota on cytokine profiles of T cells in GALT. Frequencies of TNF-α
Supplementary Figure 1
 Supplementary Figure 1 Kif1a RNAi effect on basal progenitor differentiation Related to Figure 2. Representative confocal images of the VZ and SVZ of rat cortices transfected at E16 with scrambled or Kif1a
Supplemental Figure 1. Intracranial transduction of a modified ptomo lentiviral vector in the mouse
 Supplemental figure legends Supplemental Figure 1. Intracranial transduction of a modified ptomo lentiviral vector in the mouse hippocampus targets GFAP-positive but not NeuN-positive cells. (A) Stereotaxic
Santulli G. et al. A microrna-based strategy to suppress restenosis while preserving endothelial function
 ONLINE DATA SUPPLEMENTS Santulli G. et al. A microrna-based strategy to suppress restenosis while preserving endothelial function Supplementary Figures Figure S1 Effect of Ad-p27-126TS on the expression
T H E J O U R N A L O F C E L L B I O L O G Y
 Supplemental material Brooks and Wallingford, http://www.jcb.org/cgi/content/full/jcb.201204072/dc1 T H E J O U R N A L O F C E L L B I O L O G Y Figure S1. Quantification of ciliary compartments in control
Nature Neuroscience: doi: /nn Supplementary Figure 1. Trial structure for go/no-go behavior
 Supplementary Figure 1 Trial structure for go/no-go behavior a, Overall timeline of experiments. Day 1: A1 mapping, injection of AAV1-SYN-GCAMP6s, cranial window and headpost implantation. Water restriction
Supplementary Figure 1. Double-staining immunofluorescence analysis of invasive colon and breast cancers. Specimens from invasive ductal breast
 Supplementary Figure 1. Double-staining immunofluorescence analysis of invasive colon and breast cancers. Specimens from invasive ductal breast carcinoma (a) and colon adenocarcinoma (b) were staining
Supplemental Figure 1. Characterization of CNS lysosomal pathology in 2-month-old IDS-deficient mice. (A) Measurement of IDS activity in brain
 Measurement of IDS activity in brain") Supplemental Figure 1. Characterization of CNS lysosomal pathology in 2-month-old IDS-deficient mice. (A) Measurement of IDS activity in brain extracts from wild-type (WT) and IDS-deficient males. IDS
Supplemental Figure 1. Characterization of CNS lysosomal pathology in 2-month-old IDS-deficient mice. (A) Measurement of IDS activity in brain extracts from wild-type (WT) and IDS-deficient males. IDS
Nature Neuroscience: doi: /nn Supplementary Figure 1. ACx plasticity is required for fear conditioning.
 Supplementary Figure 1 ACx plasticity is required for fear conditioning. (a) Freezing time of conditioned and control mice before CS presentation and during CS presentation in a new context. Student s
Supplementary Figure 1 Expression of Crb3 in mouse sciatic nerve: biochemical analysis (a) Schematic of Crb3 isoforms, ERLI and CLPI, indicating the
 Schematic of Crb3 isoforms, ERLI and CLPI, indicating the") Supplementary Figure 1 Expression of Crb3 in mouse sciatic nerve: biochemical analysis (a) Schematic of Crb3 isoforms, ERLI and CLPI, indicating the location of the transmembrane (TM), FRM binding (FB)
Supplementary Figure 1 Expression of Crb3 in mouse sciatic nerve: biochemical analysis (a) Schematic of Crb3 isoforms, ERLI and CLPI, indicating the location of the transmembrane (TM), FRM binding (FB)
Macrophages form functional vascular mimicry channels in vivo. SI Figures and Legend
 Macrophages form functional vascular mimicry channels in vivo Authors: *Faith H. Barnett, *Mauricio Rosenfeld, Malcolm Wood, William Kiosses, Yoshihiko Usui, Valentina Marchetti, Edith Aguilar, and Martin
Supplementary Figure 1: TSLP receptor skin expression in dcssc. A: Healthy control (HC) skin with TSLP receptor expression in brown (10x
 skin with TSLP receptor expression in brown (10x") Supplementary Figure 1: TSLP receptor skin expression in dcssc. A: Healthy control (HC) skin with TSLP receptor expression in brown (10x magnification). B: Second HC skin stained for TSLP receptor in brown
Supplementary Figure 1: TSLP receptor skin expression in dcssc. A: Healthy control (HC) skin with TSLP receptor expression in brown (10x magnification). B: Second HC skin stained for TSLP receptor in brown
Supplementary Figure 1: GFAP positive nerves in patients with adenocarcinoma of
 SUPPLEMENTARY FIGURES AND MOVIE LEGENDS Supplementary Figure 1: GFAP positive nerves in patients with adenocarcinoma of the pancreas. (A) Images of nerves stained for GFAP (green), S100 (red) and DAPI
Supplemental Figures:
 Supplemental Figures: Figure 1: Intracellular distribution of VWF by electron microscopy in human endothelial cells. a) Immunogold labeling of LC3 demonstrating an LC3-positive autophagosome (white arrow)
Nature Neuroscience: doi: /nn Supplementary Figure 1
 Supplementary Figure 1 Drd1a-Cre driven ChR2 expression in the SCN. (a) Low-magnification image of a representative Drd1a-ChR2 coronal brain section (n = 2) showing endogenous tdtomato fluorescence (magenta).
Suppl Video: Tumor cells (green) and monocytes (white) are seeded on a confluent endothelial
 and monocytes (white) are seeded on a confluent endothelial") Supplementary Information Häuselmann et al. Monocyte induction of E-selectin-mediated endothelial activation releases VE-cadherin junctions to promote tumor cell extravasation in the metastasis cascade
Supplementary Information Häuselmann et al. Monocyte induction of E-selectin-mediated endothelial activation releases VE-cadherin junctions to promote tumor cell extravasation in the metastasis cascade
SUPPLEMENTARY INFORMATION
 b 350 300 250 200 150 100 50 0 E0 E10 E50 E0 E10 E50 E0 E10 E50 E0 E10 E50 Number of organoids per well 350 300 250 200 150 100 50 0 R0 R50 R100 R500 1st 2nd 3rd Noggin 100 ng/ml Noggin 10 ng/ml Noggin
Influenza virus exploits tunneling nanotubes for cell-to-cell spread
 Supplementary Information Influenza virus exploits tunneling nanotubes for cell-to-cell spread Amrita Kumar 1, Jin Hyang Kim 1, Priya Ranjan 1, Maureen G. Metcalfe 2, Weiping Cao 1, Margarita Mishina 1,
Hypothalamic TLR2 triggers sickness behavior via a microglia-neuronal axis
 Hypothalamic TLR triggers sickness behavior via a microglia-neuronal axis Sungho Jin, *, Jae Geun Kim,, *, Jeong Woo Park, Marco Koch,, Tamas L. Horvath and Byung Ju Lee Department of Biological Sciences,
Nature Neuroscience: doi: /nn Supplementary Figure 1. Large-scale calcium imaging in vivo.
 Supplementary Figure 1 Large-scale calcium imaging in vivo. (a) Schematic illustration of the in vivo camera imaging set-up for large-scale calcium imaging. (b) High-magnification two-photon image from
nature methods Organelle-specific, rapid induction of molecular activities and membrane tethering
 nature methods Organelle-specific, rapid induction of molecular activities and membrane tethering Toru Komatsu, Igor Kukelyansky, J Michael McCaffery, Tasuku Ueno, Lidenys C Varela & Takanari Inoue Supplementary
Prss56, a novel marker of adult neurogenesis in the mouse brain. - Supplemental Figures 1 to 5- Brain Structure and Function
 Prss56, a novel marker of adult neurogenesis in the mouse brain - Supplemental Figures 1 to 5- Brain Structure and Function Alexandre Jourdon 1,2, Aurélie Gresset 1, Nathalie Spassky 1, Patrick Charnay
Supplementary Materials for
 www.sciencesignaling.org/cgi/content/full/8/375/ra41/dc1 Supplementary Materials for Actin cytoskeletal remodeling with protrusion formation is essential for heart regeneration in Hippo-deficient mice
Fibrinogen-induced perivascular microglial clustering is required for the. development of axonal damage in neuroinflammation
 SUPPLEMENTARY INFORMATION Fibrinogen-induced perivascular microglial clustering is required for the development of axonal damage in neuroinflammation Dimitrios Davalos, Jae Kyu Ryu, Mario Merlini, Kim
effect on the upregulation of these cell surface markers. The mean peak fluorescence intensity
 SUPPLEMENTARY FIGURE 1 Supplementary Figure 1 ASIC1 disruption or blockade does not effect in vitro and in vivo antigen-presenting cell activation. (a) Flow cytometric analysis of cell surface molecules
Supplementary Information. Tissue-wide immunity against Leishmania. through collective production of nitric oxide
 Supplementary Information Tissue-wide immunity against Leishmania through collective production of nitric oxide Romain Olekhnovitch, Bernhard Ryffel, Andreas J. Müller and Philippe Bousso Supplementary
Supporting Information. Calculation of the relative contributions of myocyte proliferation, stem cell. Supporting Information Fig 1 (page 9)
") Supporting Information Table of contents Calculation of the relative contributions of myocyte proliferation, stem cell differentiation and cardioprotection (page 2) Supporting Information Fig 1 (page 9)
Supporting Information Table of contents Calculation of the relative contributions of myocyte proliferation, stem cell differentiation and cardioprotection (page 2) Supporting Information Fig 1 (page 9)
Supplementary Figure 1: Kv7 currents in neonatal CA1 neurons measured with the classic M- current voltage-clamp protocol.
 Supplementary Figures 1-11 Supplementary Figure 1: Kv7 currents in neonatal CA1 neurons measured with the classic M- current voltage-clamp protocol. (a), Voltage-clamp recordings from CA1 pyramidal neurons
Nature Neuroscience: doi: /nn Supplementary Figure 1. Confirmation that optogenetic inhibition of dopaminergic neurons affects choice
 Supplementary Figure 1 Confirmation that optogenetic inhibition of dopaminergic neurons affects choice (a) Sample behavioral trace as in Figure 1d, but with NpHR stimulation trials depicted as green blocks
activation with anti-cd3/cd28 beads and 3d following transduction. Supplemental Figure 2 shows
 Supplemental Data Supplemental Figure 1 compares CXCR4 expression in untreated CD8 + T cells, following activation with anti-cd3/cd28 beads and 3d following transduction. Supplemental Figure 2 shows the
John Nguyen, Nozomi Nishimura, Robert Fetcho, Costantino Iadecola, Chris B. Schaffer
 Supplemental figures and text for Occlusion of cortical ascending venules causes blood flow decreases, reversals in flow direction, and vessel dilation in upstream capillaries John Nguyen, Nozomi Nishimura,
fl/+ KRas;Atg5 fl/+ KRas;Atg5 fl/fl KRas;Atg5 fl/fl KRas;Atg5 Supplementary Figure 1. Gene set enrichment analyses. (a) (b)
 (b)") KRas;At KRas;At KRas;At KRas;At a b Supplementary Figure 1. Gene set enrichment analyses. (a) GO gene sets (MSigDB v3. c5) enriched in KRas;Atg5 fl/+ as compared to KRas;Atg5 fl/fl tumors using gene set
KRas;At KRas;At KRas;At KRas;At a b Supplementary Figure 1. Gene set enrichment analyses. (a) GO gene sets (MSigDB v3. c5) enriched in KRas;Atg5 fl/+ as compared to KRas;Atg5 fl/fl tumors using gene set
Supplementary Information
 Nature Immunology doi:1.138/ni.2477 Supplementary Information Capillary and arteriolar pericytes attract innate leukocytes exiting through venules and instruct them with pattern recognition and motility
Type of file: PDF Title of file for HTML: Supplementary Information Description: Supplementary Figures
 Type of file: PDF Title of file for HTML: Supplementary Information Description: Supplementary Figures Type of file: MOV Title of file for HTML: Supplementary Movie 1 Description: NLRP3 is moving along
Wenqin Hu, Cuiping Tian, Tun Li, Mingpo Yang, Han Hou & Yousheng Shu
 Distinct contributions of Na v 1.6 and Na v 1.2 in action potential initiation and backpropagation Wenqin Hu, Cuiping Tian, Tun Li, Mingpo Yang, Han Hou & Yousheng Shu Supplementary figure and legend Supplementary
SUPPLEMENTARY INFORMATION
 DOI: 10.1038/ncb2988 Supplementary Figure 1 Kif7 L130P encodes a stable protein that does not localize to cilia tips. (a) Immunoblot with KIF7 antibody in cell lysates of wild-type, Kif7 L130P and Kif7
Nature Immunology: doi: /ni eee Supplementary Figure 1
 eee Supplementary Figure 1 Hyphae induce NET release, but yeast do not. (a) NET release by human peripheral neutrophils stimulated with a hgc1 yeast-locked C. albicans mutant (yeast) or pre-formed WT C.
Nature Neuroscience: doi: /nn Supplementary Figure 1
 Supplementary Figure 1 Relative expression of K IR2.1 transcript to enos was reduced 29-fold in capillaries from knockout animals. Relative expression of K IR2.1 transcript to enos was reduced 29-fold
Supplementary information
 Supplementary information Intrahepatic myeloid cell-aggregates enable local CD8 + T cell expansion and successful immunotherapy against chronic viral liver infection Li- Rung Huang, Dirk Wohlleber, Florian
Supplementary Table 1. The primers used for quantitative RT-PCR. Gene name Forward (5 > 3 ) Reverse (5 > 3 )
 Reverse (5 > 3 )") 770 771 Supplementary Table 1. The primers used for quantitative RT-PCR. Gene name Forward (5 > 3 ) Reverse (5 > 3 ) Human CXCL1 GCGCCCAAACCGAAGTCATA ATGGGGGATGCAGGATTGAG PF4 CCCCACTGCCCAACTGATAG TTCTTGTACAGCGGGGCTTG
770 771 Supplementary Table 1. The primers used for quantitative RT-PCR. Gene name Forward (5 > 3 ) Reverse (5 > 3 ) Human CXCL1 GCGCCCAAACCGAAGTCATA ATGGGGGATGCAGGATTGAG PF4 CCCCACTGCCCAACTGATAG TTCTTGTACAGCGGGGCTTG
Supplementary Fig. 1: TBR2+ cells in different brain regions.
 Hip SVZ OB Cere Hypo Supplementary Fig. 1: TBR2 + cells in different brain regions. Three weeks after the last tamoxifen injection, TBR2 immunostaining images reveal a large reduction of TBR2 + cells in
Supplemental Information. 3D-CLEM Reveals that a Major Portion. of Mitotic Chromosomes Is Not Chromatin
 Molecular Cell, Volume 64 Supplemental Information 3D-CLEM Reveals that a Major Portion of Mitotic Chromosomes Is Not Chromatin Daniel G. Booth, Alison J. Beckett, Oscar Molina, Itaru Samejima, Hiroshi
Supplementary Information. Staged decline of neuronal function in vivo in an animal model of Alzheimer s Disease. Supplementary Figures S1-10
 Supplementary Information Staged decline of neuronal function in vivo in an animal model of Alzheimer s Disease Christine Grienberger 1 *, Nathalie L. Rochefort 1 *, Helmuth Adelsberger 1, Horst A. Henning
Supplementary Figure 1. Efficiency of Mll4 deletion and its effect on T cell populations in the periphery. Nature Immunology: doi: /ni.
 Supplementary Figure 1 Efficiency of Mll4 deletion and its effect on T cell populations in the periphery. Expression of Mll4 floxed alleles (16-19) in naive CD4 + T cells isolated from lymph nodes and
Supplementary Figure 1. Genotyping strategies for Mcm3 +/+, Mcm3 +/Lox and Mcm3 +/- mice and luciferase activity in Mcm3 +/Lox mice. A.
 Supplementary Figure 1. Genotyping strategies for Mcm3 +/+, Mcm3 +/Lox and Mcm3 +/- mice and luciferase activity in Mcm3 +/Lox mice. A. Upper part, three-primer PCR strategy at the Mcm3 locus yielding
Postn MCM Smad2 fl/fl Postn MCM Smad3 fl/fl Postn MCM Smad2/3 fl/fl. Postn MCM. Tgfbr1/2 fl/fl TAC
 A Smad2 fl/fl Smad3 fl/fl Smad2/3 fl/fl Tgfbr1/2 fl/fl 1. mm B Tcf21 MCM Tcf21 MCM Smad3 fl/fl Tcf21 MCM Smad2/3 fl/fl Tcf21 MCM Tgfbr1/2 fl/fl αmhc MCM C 1. mm 1. mm D Smad2 fl/fl Smad3 fl/fl Smad2/3
Expanded View Figures
 PEX13 functions in selective autophagy Ming Y Lee et al Expanded View Figures Figure EV1. PEX13 is required for Sindbis virophagy. A, B Quantification of mcherry-capsid puncta per cell (A) and GFP-LC3
(a) Significant biological processes (upper panel) and disease biomarkers (lower panel)
 Significant biological processes (upper panel) and disease biomarkers (lower panel)") Supplementary Figure 1. Functional enrichment analyses of secretomic proteins. (a) Significant biological processes (upper panel) and disease biomarkers (lower panel) 2 involved by hrab37-mediated secretory
Supplementary Figure 1. Functional enrichment analyses of secretomic proteins. (a) Significant biological processes (upper panel) and disease biomarkers (lower panel) 2 involved by hrab37-mediated secretory
Supplementary Figure 1
 Supplementary Figure 1 AAV-GFP injection in the MEC of the mouse brain C57Bl/6 mice at 4 months of age were injected with AAV-GFP into the MEC and sacrificed at 7 days post injection (dpi). (a) Brains
Supplementary Figure 1. Identification of the type II spiral ganglion neurons (SGN) via immunofluorescence of peripherin protein (PRPH).
 via immunofluorescence of peripherin protein (PRPH).") Supplementary Figure 1. Identification of the type II spiral ganglion neurons (SGN) via immunofluorescence of peripherin protein (PRPH). (a), (b), PRPH immunolabelling of cryosections from post-natal day
Supplementary Figure 1. Identification of the type II spiral ganglion neurons (SGN) via immunofluorescence of peripherin protein (PRPH). (a), (b), PRPH immunolabelling of cryosections from post-natal day
F-actin VWF Vinculin. F-actin. Vinculin VWF
 a F-actin VWF Vinculin b F-actin VWF Vinculin Supplementary Fig. 1. WPBs in HUVECs are located along stress fibers and at focal adhesions. (a) Immunofluorescence images of f-actin (cyan), VWF (yellow),
Supplementary Information. Conformational states of Lck regulate clustering in early T cell signaling
 Supplementary Information Conformational states of Lck regulate clustering in early T cell signaling Jérémie Rossy, Dylan M. Owen, David J. Williamson, Zhengmin Yang and Katharina Gaus Centre for Vascular
Supplemental Figure 1. Quantification of proliferation in thyroid of WT, Ctns -/- and grafted
 Supplemental Figure 1. Quantification of proliferation in thyroid of WT, Ctns -/- and grafted Ctns -/- mice. Cells immunolabeled for the proliferation marker (Ki-67) were counted in sections (n=3 WT, n=4
SUPPLEMENTARY INFORMATION
 doi:1.138/nature1139 a d Whisker angle (deg) Whisking repeatability Control Muscimol.4.3.2.1 -.1 8 4-4 1 2 3 4 Performance (d') Pole 8 4-4 1 2 3 4 5 Time (s) b Mean protraction angle (deg) e Hit rate (p
Nature Neuroscience: doi: /nn.4642
 Supplementary Figure 1 Recording sites and example waveform clustering, as well as electrophysiological recordings of auditory CS and shock processing following overtraining. (a) Recording sites in LC
Supplementary Figure 1 The ability to regenerate an ear hole is discontinuous with wound healing. Ear-hole closure at D85 for each sex within each
 Supplementary Figure 1 The ability to regenerate an ear hole is discontinuous with wound healing. Ear-hole closure at D85 for each sex within each species observed. Data show a binary response to a 4 mm
Supplementary Information. Induction of human pancreatic beta cell replication by inhibitors of dual specificity tyrosine regulated kinase
 Journal: Nature Medicine Supplementary Information Induction of human pancreatic beta cell replication by inhibitors of dual specificity tyrosine regulated kinase 1,2 Peng Wang PhD, 1,2 Juan-Carlos Alvarez-Perez
Supplementary Materials for. c-abl Activation Plays a Role in α-synucleinopathy Induced Neurodegeneration
 Supplementary Materials for c-abl Activation Plays a Role in α-synucleinopathy Induced Neurodegeneration Saurav Brahmachari, Preston Ge, Su Hyun Lee, Donghoon Kim, Senthilkumar S. Karuppagounder, Manoj
Supplementary Figure 1. Analysis of LN S1P gradients.
 Supplementary Figure 1 Analysis of LN S1P gradients. (a) Diagram showing the spatial distribution of NK cells in WT LN. Inset: Upon infection, sinus-lining macrophages secrete IL-18 and other cytokines,
Supplementary Figure 1
 8w Pia II/III IV V VI PV EYFP EYFP PV EYFP PV d PV EYFP Supplementary Figure a Spike probability x - PV-Cre d Spike probability x - RS RS b e Spike probability Spike probability.6......8..... FS FS c f
CD4 and CD8 T cells show a similar accumulation in the tumor stroma.
 Fig S1 CD4 Fibronectin EpCM CD8 CD4 and CD8 T cells show a similar accumulation in the tumor stroma. Fluorescently-labeled CD4 (CMFD, green) and CD8 (Hoechst, yellow) T cells were added to a human lung
Real-time imaging reveals the single steps of brain metastasis fo mation r
 Real-time imaging reveals the single steps of brain metastasis fo mation r Yvonne Kienast, Louisa von Baumgarten, Martin Fuhrmann, Wolfgang E.F. Klinkert, Roland Goldbrunner, Jochen Herms and Frank Winkler
Nature Immunology: doi: /ni Supplementary Figure 1. RNA-Seq analysis of CD8 + TILs and N-TILs.
 Supplementary Figure 1 RNA-Seq analysis of CD8 + TILs and N-TILs. (a) Schematic representation of the tumor and cell types used for the study. HNSCC, head and neck squamous cell cancer; NSCLC, non-small