Nature Neuroscience: doi: /nn.4642
|
|
|
- Coral Poole
- 5 years ago
- Views:
Transcription
1
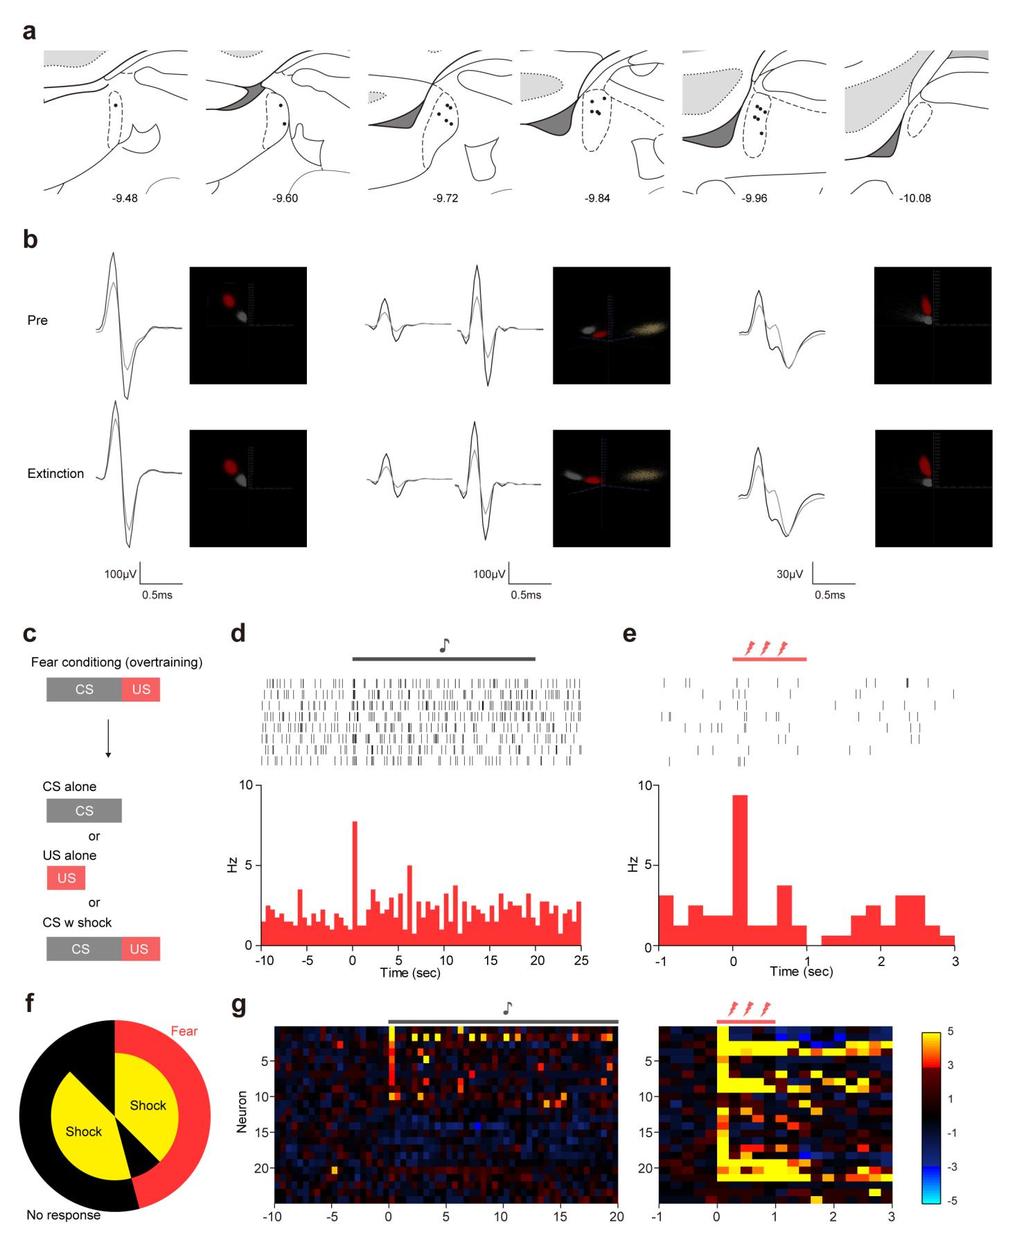
2 Supplementary Figure 1 Recording sites and example waveform clustering, as well as electrophysiological recordings of auditory CS and shock processing following overtraining. (a) Recording sites in LC for experiments in which cells were held throughout fear conditioning and extinction. (b) Example waveforms and clusters from stereotrode recordings during pre-conditioning, fear learning and extinction experiments. (c) Experimental protocol. In overtraining experiments, all units (24 units) were optogenetically identified before CS, US, and CS-US presentations. (d,e) Perievent time histograms showing auditory CS (d) and shock US (e) evoked firing rate (y-axis) responses in example LC cells. Time is on x-axis with 0=CS or US onset time (CS period denoted by gray bar and US period denoted by orange bar). Bin size=500 ms (d), 200 ms (e). (f) Pie chart showing proportion of cells (n=24) auditory responsive (red, 45.8%), shock responsive cells (yellow inside, 79.2%) and those not exhibiting shock or auditory responding (black). 37.5% of cells responded to both CS and US, 8.3% responded to CS alone and 41.7% responded to US alone. (g) Heat plots showing auditory- (left) and shock-evoked (right) responses in all cells recorded aligned vertically by cell number. X-axis=time, 0 denotes tone CS or shock US onset, top gray bar shows tone CS duration and red bar shows US duration. Bin size=500 ms (left), 200 ms (right).
3 Supplementary Figure 2 Task-related changes in tonic firing rate and optogenetically identified cell characterization. (a) Tonic firing rate (20 sec prior to first stimulus in each session) changes across pre-cs, fear conditioning (FC), early and late extinction trials for all LC neurons held across all sessions (n=37) (one-way RM ANOVA, F 3, 111 = 0.90, P = 0.37). (b) Tonic firing rate changes for each auditory CS defined cell population during pre-cs, early and late extinction (two-way repeated RM ANOVA; interaction F 9,63 = 0.74, P = 0.67; effect of time F 3, 63 = 0.62, P = 0.60; effect of neuron type F 3, 21 = 0.21, P = 0.89). (c) Baseline firing rate (60 sec prior to first stimulus in each session) changes across pre-cs, fear conditioning (FC), early and late extinction trials for all LC neurons held across all sessions (n=37) (one-way RM ANOVA, F 3, 111 = 0.90, P = 0.37). (d) Baseline firing rate changes for each auditory CS defined cell population during pre-cs, early and late extinction (two-way repeated RM ANOVA; interaction F 9,63 = 0.87, P = 0.56; effect of time F 3, 63 = 1.06, P = 0.37; effect of neuron type F 3, 21 = 0.44, P = 0.73). (e) Schematic showing optogenetic identification and electrophysiological recording experimental approach. (f) Example perievent time histogram of cell showing laser inhibition of an LC neuron for optogenetic identification. (g) Pie chart showing proportion of optogenetically identified LC cells recorded across all tasks (n=10) which were classified as pre-cs (gray, 20%), Fear (red, 10%), Fear & Extinction (purple, 10%), Extinction (blue, 30%) or not responsive (black, 30%). Yellow inside chart shows proportion of shock responsive cells in each cell classification. (h) Population averaged auditory CS-evoked responses (y-axis) at pre-cs, early and late extinction for each cell type showing a similar trend to that seen when analyzing all LC cells recorded (see Fig. 2g for comparison). Data represent the mean ± SEM.
 Representative waveform (a), cluster (b), interspike interval (c), and autocorrelogram (d) of high frequency firing cell.")
4 Supplementary Figure 3 Identification of high-firing-rate neurons using optogenetic ID of LC noradrenaline neurons in a TH-Cre rat. (a-d) Representative waveform (a), cluster (b), interspike interval (c), and autocorrelogram (d) of high frequency firing cell. (e) Example of perievent time histogram of optogenetic inhibition in high frequency firing cell. Bin size = 100 ms. (f) Distribution of spontaneous firing rate of all optogenetically identified units in overtraining experiment. 6/24 (data from 5 rats: rat 1=6 cells, rat 2=8 cells, rat 3=7 cells, rat 4=2 cells, rat 5=1 cell) cells are defined as high firing rate based on baseline firing rates of >10 Hz. Optogenetically identified, high firing rate cells were also apparent before any behavioral manipulation (2/10 optogenetically identified cells, data from 4 rats: rat 1=1 cell, rat 2=3 cells, rat 3=4 cells, rat 4=1 cell). (g) Perievent time histograms showing shock US evoked firing rate (y-axis) responses in example LC cell. Time is on x-axis with 0=CS or US onset time (US period denoted by bar). Bin size=200 ms. (h) Pie chart showing proportion of high-frequency firing rate cells (n=6) which were identified as auditory responsive (red, 50.0%), shock responsive (yellow inside, 83.3%) or non-responsive to shocks or auditory stimuli (black). 33.3% of cells responded to both CS and US, 16.6% responded to CS alone and 50.0% responded to US alone.
5 Supplementary Figure 4 Quantitative differences in LC neuronal responses to aversive shocks vs. sensory predictive cues. (a) Shock evoked responses do not differ between fear ( Fear and Fear+Extinction cells) and Extinction neurons (t 18 = 0.66, P = 0.52, unpaired t-test). Data represent the mean ± SEM. (b) Shock USs activate a significantly larger proportion of LC neurons 2 compared with tone CSs presented during pre-cs, early and late extinction (Cochran s Q test (3) =37.17, P<0.0001, followed by Wilcoxon sign tests for individual comparisons ****P<0.0001, ***P<0.001, *P<0.05). (c) Shocks evoke a significantly larger response compared with auditory CS-evoked responses in LC neurons (t 36 = 4.50, * P < ).
 Example of different populations of LA/B- (green) and IL- (blue) projecting LC neurons following injection of retrograde tracer (CTb- 647) into IL and RVG-GFP into LA/B (n=3 animals).")
6 Supplementary Figure 5 Retrograde tracer labeling. (a) Example of different populations of LA/B- (green) and IL- (blue) projecting LC neurons following injection of retrograde tracer (CTb- 647) into IL and RVG-GFP into LA/B (n=3 animals). (b) Same as a except LA/B projecting cells are green (from retrograde CAV2-cre- GFP injections) and IL projecting cells are labeled red (CAV2-DsRed into IL) (n=3 animals). TH is pseudocolored in blue. (c) Example of control experiment in which green and red retrobeads were coinjected into IL resulting in a high degree of overlap in LC neurons (green+red/green=80.1%, green+red/red=81.5%) (n=3 animals). Yellow triangles denote double labeled cells. (d) Example of similar non-overlapping noradrenaline populations in mouse LC. Green and red retrobeads were injected into IL and LA/B respectively. In mice, 9.9% of LA/B projecting neurons overlapped with IL projecting, 4.9% overlap of IL projecting cells with LA/B projecting (n=3 animals). TH is pseudocolored blue. All scale bars=20 μm.
7 Supplementary Figure 6 Freezing responses in c-fos experiments. (a) Paired CS-US group showed high freezing level while unpaired control group showed low freezing to CSs during 5CS retrieval. (b) Paired, but not unpaired, CS-US group extinguished fear memory during extinction session. Data represent the mean ± SEM.
 in LC-noradrenaline (immunostaining for TH, red) cells.")
8 Supplementary Figure 7 Rabies virus expression in the LC. (a,b) RVG-eArchT3.0-EGFP injected in LA/B (a) or IL (b) resulted in expression of earcht3.0-egfp (green cells) in LC-noradrenaline (immunostaining for TH, red) cells. Quantification of double labeled TH+&EGFP+ LC cells/total number of EGFP+ cells in LA/B- and ILprojecting cells. Data represent the mean ± SEM.
9 Supplementary Figure 8 Effect of inactivation of LA/B- or IL-projecting LC neurons on expression of extinction memories. (a,b) Inactivation of LA/B (a) or IL (b) projecting LC neurons had no effect on the expression of extinction memories when light illumination occurred during the retrieval test after extinction training. (unpaired students t-tests comparing GFP to Arch groups during at the Retrieval tests in A, t 16 = 0.77, P = 0.45 and B, t 13 = 0.62, P = 0.54). Data represent the mean ± SEM, and the numbers in parentheses represent the number of samples.
 Quantification of the pixel density of axon terminal labeling in each area (pixel count in each region/pixel count in total region) for LA/B (red) and IL (green) projecting cells.")
10 Supplementary Figure 9 Efferent mapping of LA/B- and IL-projecting terminal fields. (a) Quantification of the pixel density of axon terminal labeling in each area (pixel count in each region/pixel count in total region) for LA/B (red) and IL (green) projecting cells. (b) Density of innervation of LA/B, IL, ACx1 and ACx2 from TH+, LA/B projecting and IL projecting LC neurons. For a and b, parentheses show number of animals used in each group. (c) Confocal images showing examples of synaptophysin-mcherry labeling of axon terminals in IL, LA/B and ACx from TH-cre expressing, LA/B projecting and IL projecting cell populations. PL, prelimbic; ACC, anterior cingulate; OFC, orbitofrontal cortex; ACx, auditory cortex; CeA/MeA, central and medial nuclei of the amygdala; IC, insula; PRh, perirhinal; BNST, bed nucleus of the stria terminalis; dhip/vhip, dorsal/ventral hippocampus; Hpt, hypothalamus; MT, medial thalamus; VPM/L, ventroposterior medial/lateral thalamus; MgM, medial geniculate thalamus; VTA, ventral tegmental area; SN, substantia nigra; v/dpag, ventral/dorsal periaqueductal gray. For a&b, individual data-points are represented as black dots. Data represent the mean ± SEM, and the numbers in parentheses represent the number of samples. Scale bar=20 μm.
Supplemental Information. A Visual-Cue-Dependent Memory Circuit. for Place Navigation
 Neuron, Volume 99 Supplemental Information A Visual-Cue-Dependent Memory Circuit for Place Navigation Han Qin, Ling Fu, Bo Hu, Xiang Liao, Jian Lu, Wenjing He, Shanshan Liang, Kuan Zhang, Ruijie Li, Jiwei
Hormonal gain control of a medial preoptic area social reward circuit
 CORRECTION NOTICE Nat. Neurosci. 20, 449 458 (2017) Hormonal gain control of a medial preoptic area social reward circuit Jenna A McHenry, James M Otis, Mark A Rossi, J Elliott Robinson, Oksana Kosyk,
Nature Neuroscience: doi: /nn Supplementary Figure 1. Diverse anorexigenic signals induce c-fos expression in CEl PKC-δ + neurons
 Supplementary Figure 1 Diverse anorexigenic signals induce c-fos expression in CEl PKC-δ + neurons a-c. Quantification of CEl c-fos expression in mice intraperitoneal injected with anorexigenic drugs (a),
Nature Neuroscience: doi: /nn Supplementary Figure 1
 Supplementary Figure 1 Atlas representations of the midcingulate (MCC) region targeted in this study compared against the anterior cingulate (ACC) region commonly reported. Coronal sections are shown on
Nature Neuroscience: doi: /nn Supplementary Figure 1. Confirmation that optogenetic inhibition of dopaminergic neurons affects choice
 Supplementary Figure 1 Confirmation that optogenetic inhibition of dopaminergic neurons affects choice (a) Sample behavioral trace as in Figure 1d, but with NpHR stimulation trials depicted as green blocks
Nature Neuroscience: doi: /nn Supplementary Figure 1. Splenic atrophy and leucopenia caused by T3 SCI.
 Supplementary Figure 1 Splenic atrophy and leucopenia caused by T3 SCI. (a) Gross anatomy of representative spleens from control and T3 SCI mice at 28 days post-injury. (b and c) Hematoxylin and eosin
Nature Neuroscience: doi: /nn Supplementary Figure 1. Trial structure for go/no-go behavior
 Supplementary Figure 1 Trial structure for go/no-go behavior a, Overall timeline of experiments. Day 1: A1 mapping, injection of AAV1-SYN-GCAMP6s, cranial window and headpost implantation. Water restriction
Nature Neuroscience: doi: /nn Supplementary Figure 1. Lick response during the delayed Go versus No-Go task.
 Supplementary Figure 1 Lick response during the delayed Go versus No-Go task. Trial-averaged lick rate was averaged across all mice used for pyramidal cell imaging (n = 9). Different colors denote different
Nature Neuroscience doi: /nn Supplementary Figure 1. Characterization of viral injections.
 Supplementary Figure 1 Characterization of viral injections. (a) Dorsal view of a mouse brain (dashed white outline) after receiving a large, unilateral thalamic injection (~100 nl); demonstrating that
Supplementary Figure 1
 Supplementary Figure 1 Localization of virus injections. (a) Schematic showing the approximate center of AAV-DIO-ChR2-YFP injection sites in the NAc of Dyn-cre mice (n=8 mice, 16 injections; caudate/putamen,
Supplementary Figure 1. Recording sites.
 Supplementary Figure 1 Recording sites. (a, b) Schematic of recording locations for mice used in the variable-reward task (a, n = 5) and the variable-expectation task (b, n = 5). RN, red nucleus. SNc,
Nature Neuroscience: doi: /nn Supplementary Figure 1. Visualization of AT1a-positive cells using AT1a lacz/+ mouse.
 Supplementary Figure 1 Visualization of AT1a-positive cells using AT1a lacz/+ mouse. (a f) Immunohistochemical detection of β-gal in the mouse brain. Coronal sections at the respective anteroposterior
Nature Neuroscience: doi: /nn Supplementary Figure 1
 Supplementary Figure 1 Bidirectional optogenetic modulation of the tonic activity of CEA PKCδ + neurons in vitro. a, Top, Cell-attached voltage recording illustrating the blue light-induced increase in
Nature Neuroscience: doi: /nn.4335
 Supplementary Figure 1 Cholinergic neurons projecting to the VTA are concentrated in the caudal mesopontine region. (a) Schematic showing the sites of retrograde tracer injections in the VTA: cholera toxin
Supplementary Figure 1 Information on transgenic mouse models and their recording and optogenetic equipment. (a) 108 (b-c) (d) (e) (f) (g)
 108 (b-c) (d) (e) (f) (g)") Supplementary Figure 1 Information on transgenic mouse models and their recording and optogenetic equipment. (a) In four mice, cre-dependent expression of the hyperpolarizing opsin Arch in pyramidal cells
Supplementary Figure 1 Information on transgenic mouse models and their recording and optogenetic equipment. (a) In four mice, cre-dependent expression of the hyperpolarizing opsin Arch in pyramidal cells
SUPPLEMENTARY INFORMATION
 SUPPLEMENTARY INFORMATION doi:10.1038/nature11306 Supplementary Figures Supplementary Figure 1. Basic characterization of GFP+ RGLs in the dentate gyrus of adult nestin-gfp mice. a, Sample confocal images
Supplementary Materials for
 advances.sciencemag.org/cgi/content/full/1/10/e1500775/dc1 Supplementary Materials for Structural-functional connectivity deficits of neocortical circuits in the Fmr1 /y mouse model of autism Matthias
Nature Neuroscience: doi: /nn Supplementary Figure 1. Distribution of starter cells for RV-mediated retrograde tracing.
 Supplementary Figure 1 Distribution of starter cells for RV-mediated retrograde tracing. Parcellation of cortical areas is based on Allen Mouse Brain Atlas and drawn to scale. Thick white curves, outlines
Supplementary figure 1: LII/III GIN-cells show morphological characteristics of MC
 1 2 1 3 Supplementary figure 1: LII/III GIN-cells show morphological characteristics of MC 4 5 6 7 (a) Reconstructions of LII/III GIN-cells with somato-dendritic compartments in orange and axonal arborizations
Tuning properties of individual circuit components and stimulus-specificity of experience-driven changes.
 Supplementary Figure 1 Tuning properties of individual circuit components and stimulus-specificity of experience-driven changes. (a) Left, circuit schematic with the imaged component (L2/3 excitatory neurons)
Nature Neuroscience: doi: /nn Supplementary Figure 1. ACx plasticity is required for fear conditioning.
 Supplementary Figure 1 ACx plasticity is required for fear conditioning. (a) Freezing time of conditioned and control mice before CS presentation and during CS presentation in a new context. Student s
Supplemental Information. A Labeled-Line Neural Circuit. for Pheromone-Mediated Sexual Behaviors in Mice
 Neuron, Volume Supplemental Information A Labeled-Line Neural Circuit for Pheromone-Mediated Sexual Behaviors in Mice Kentaro K. Ishii, Takuya Osakada, Hiromi Mori, Nobuhiko Miyasaka, Yoshihiro Yoshihara,
Supplementary Material for
 Supplementary Material for Selective neuronal lapses precede human cognitive lapses following sleep deprivation Supplementary Table 1. Data acquisition details Session Patient Brain regions monitored Time
Nature Neuroscience: doi: /nn Supplementary Figure 1
 Supplementary Figure 1 Drd1a-Cre driven ChR2 expression in the SCN. (a) Low-magnification image of a representative Drd1a-ChR2 coronal brain section (n = 2) showing endogenous tdtomato fluorescence (magenta).
Supplemental Information. Dorsal Raphe Dual Serotonin-Glutamate Neurons. Drive Reward by Establishing Excitatory Synapses
 Cell Reports, Volume 26 Supplemental Information Dorsal Raphe Dual Serotonin-Glutamate Neurons Drive Reward by Establishing Excitatory Synapses on VTA Mesoaccumbens Dopamine Neurons Hui-Ling Wang, Shiliang
Supplementary Figure 1
 Supplementary Figure 1 Arcuate ChIEF-tdTomato neurons expressed TH These micrographs show that TH-Cre-ChIEF-tdTomato (magenta), expressed by AAV in a TH-Cre mouse, were immunostained with TH (green) in
Zhu et al, page 1. Supplementary Figures
 Zhu et al, page 1 Supplementary Figures Supplementary Figure 1: Visual behavior and avoidance behavioral response in EPM trials. (a) Measures of visual behavior that performed the light avoidance behavior
ZNZ Advanced Course in Neuroscience Mon Limbic System II. David P. Wolfer MD
 ZNZ Advanced Course in Neuroscience Mon 05.05.2014 Limbic System II David P. Wolfer MD Institute of Anatomy, University of Zurich Institute for Human Movement Sciences and Sport, ETH Zurich http://www.dpwolfer.ch
Supplementary Figure 1
 Supplementary Figure 1 Miniature microdrive, spike sorting and sleep stage detection. a, A movable recording probe with 8-tetrodes (32-channels). It weighs ~1g. b, A mouse implanted with 8 tetrodes in
Orexin and Sleep. Team: A Little Bit of Leptin
 Orexin and Sleep Team: A Little Bit of Leptin Intro to Orexin 1997 -Scripps Research Institute gene expression in the hypothalamus Found gene clone 35 - expression limited to the lateral hypothalamus NTs
Summary of behavioral performances for mice in imaging experiments.
 Supplementary Figure 1 Summary of behavioral performances for mice in imaging experiments. (a) Task performance for mice during M2 imaging experiments. Open triangles, individual experiments. Filled triangles,
Nature Neuroscience: doi: /nn Supplementary Figure 1
 Supplementary Figure 1 Distribution of GlyT2::eGFP fibers in the mouse thalamus at three different coronal levels. Note the innervation centered in the rostral (CL, PC) and caudal (PF) nuclear groups of
Nature Neuroscience: doi: /nn Supplementary Figure 1. MADM labeling of thalamic clones.
 Supplementary Figure 1 MADM labeling of thalamic clones. (a) Confocal images of an E12 Nestin-CreERT2;Ai9-tdTomato brain treated with TM at E10 and stained for BLBP (green), a radial glial progenitor-specific
Supplementary Figure 1. Example of an amygdala neuron whose activity reflects value during the visual stimulus interval. This cell responded more
 1 Supplementary Figure 1. Example of an amygdala neuron whose activity reflects value during the visual stimulus interval. This cell responded more strongly when an image was negative than when the same
File name: Supplementary Information Description: Supplementary Figures, Supplementary Table and Supplementary References
 File name: Supplementary Information Description: Supplementary Figures, Supplementary Table and Supplementary References File name: Supplementary Data 1 Description: Summary datasheets showing the spatial
Supplementary Figure 1. Nature Neuroscience: doi: /nn.4547
 Supplementary Figure 1 Characterization of the Microfetti mouse model. (a) Gating strategy for 8-color flow analysis of peripheral Ly-6C + monocytes from Microfetti mice 5-7 days after TAM treatment. Living
Double dissociation of value computations in orbitofrontal and anterior cingulate neurons
 Supplementary Information for: Double dissociation of value computations in orbitofrontal and anterior cingulate neurons Steven W. Kennerley, Timothy E. J. Behrens & Jonathan D. Wallis Content list: Supplementary
Brain Mechanisms of Emotion 1 of 6
 Brain Mechanisms of Emotion 1 of 6 I. WHAT IS AN EMOTION? A. Three components (Oately & Jenkins, 1996) 1. caused by conscious or unconscious evaluation of an event as relevant to a goal that is important
9.14 Class 32 Review. Limbic system
 9.14 Class 32 Review Limbic system 1 Lateral view Medial view Brainstem, sagittal section Sensory- Perceptual Motor Behavior Major functional modules of the CNS Motivation Courtesy of MIT Press. Used with
-51mV 30s 3mV. n=14 n=4 p=0.4. Depolarization (mv) 3
 3") Supplementary Figure 1 a optoβ 2 -AR b ChR2-51mV 30s 3mV -50mV 30s 3mV c 4 n=14 n=4 p=0.4 Depolarization (mv) 3 2 1 0 Both optogenetic actuators, optoβ 2 AR and ChR2, were effective in stimulating astrocytes
Supplementary Figure 1 a optoβ 2 -AR b ChR2-51mV 30s 3mV -50mV 30s 3mV c 4 n=14 n=4 p=0.4 Depolarization (mv) 3 2 1 0 Both optogenetic actuators, optoβ 2 AR and ChR2, were effective in stimulating astrocytes
SUPPLEMENTARY INFORMATION
 doi:1.138/nature9553 Supplementary Table 1. Overlap of neuronal marker and PKC- expression in CEl. Marker/PKC- PKC- Marker Gad65 87.4±4.7 5.3±12.6 CRH 1.2±1. 16.9±15.2 Dyn 1.9±1.2 4.5±2.9 Enk 42.8±7.4
SUPPLEMENTARY INFORMATION
 Encoding of conditioned fear in central amygdala inhibitory circuits Stephane Ciocchi 1,*, Cyril Herry 1,,*, François Grenier 1, Steffen B.E. Wolff 1, Johannes J. Letzkus 1, Ioannis Vlachos 3, Ingrid Ehrlich
Role of the anterior cingulate cortex in the control over behaviour by Pavlovian conditioned stimuli
 Role of the anterior cingulate cortex in the control over behaviour by Pavlovian conditioned stimuli in rats RN Cardinal, JA Parkinson, H Djafari Marbini, AJ Toner, TW Robbins, BJ Everitt Departments of
Unique functional properties of somatostatin-expressing GABAergic neurons in mouse barrel cortex
 Supplementary Information Unique functional properties of somatostatin-expressing GABAergic neurons in mouse barrel cortex Luc Gentet, Yves Kremer, Hiroki Taniguchi, Josh Huang, Jochen Staiger and Carl
Supplementary Figure 1. SDS-FRL localization of CB 1 in the distal CA3 area of the rat hippocampus. (a-d) Axon terminals (t) in stratum pyramidale
 Axon terminals (t) in stratum pyramidale") Supplementary Figure 1. SDS-FRL localization of CB 1 in the distal CA3 area of the rat hippocampus. (a-d) Axon terminals (t) in stratum pyramidale (b) show stronger immunolabeling for CB 1 than those in
Supplementary Figure 1. SDS-FRL localization of CB 1 in the distal CA3 area of the rat hippocampus. (a-d) Axon terminals (t) in stratum pyramidale (b) show stronger immunolabeling for CB 1 than those in
Supplementary Material S3 Further Seed Regions
 Supplementary Material S3 Further Seed Regions Figure I. Changes in connectivity with the right anterior insular cortex. (A) wake > mild sedation, showing a reduction in connectivity between the anterior
Reward prediction based on stimulus categorization in. primate lateral prefrontal cortex
 Reward prediction based on stimulus categorization in primate lateral prefrontal cortex Xiaochuan Pan, Kosuke Sawa, Ichiro Tsuda, Minoro Tsukada, Masamichi Sakagami Supplementary Information This PDF file
Lack of GPR88 enhances medium spiny neuron activity and alters. motor- and cue- dependent behaviors
 Lack of GPR88 enhances medium spiny neuron activity and alters motor- and cue- dependent behaviors Albert Quintana, Elisenda Sanz, Wengang Wang, Granville P. Storey, Ali D. Güler Matthew J. Wanat, Bryan
Awake-behaving recordings in mice during fear conditioning. Eric H. Chang, Ph.D. Goldsmith Postdoctoral Fellow
 Awake-behaving recordings in mice during fear conditioning Eric H. Chang, Ph.D. Goldsmith Postdoctoral Fellow Weill Cornell Medical College Burke Cornell Medical Research Institute White Plains, NY Noldus
Class 16 Emotions (10/19/17) Chapter 10
 Chapter 10") Class 16 Emotions (10/19/17) Chapter 10 Notes By: Rashea Psych 302 10/19/17 Emotions The issues o Innate or learned? o Voluntary or involuntary? (conscious/unconscious) o Adaptive behavior or communication?
Class 16 Emotions (10/19/17) Chapter 10 Notes By: Rashea Psych 302 10/19/17 Emotions The issues o Innate or learned? o Voluntary or involuntary? (conscious/unconscious) o Adaptive behavior or communication?
-80 Figure 1. Identification of dopaminergic neurons in. VTA slices (a) Micrographs demonstrate the location of the VTA with
 Micrographs demonstrate the location of the VTA with") Potential (mv) A B C Potential (mv) D E F Biocytin TH Merge R 12 12 1 1 8 G 6 4 8 6 4 H 2 2-2 -2-4 -4-6 -6 Supplemental -8-8 Figure 1. Identification of dopaminergic neurons in -1 VTA slices. -1 (a) Micrographs
Potential (mv) A B C Potential (mv) D E F Biocytin TH Merge R 12 12 1 1 8 G 6 4 8 6 4 H 2 2-2 -2-4 -4-6 -6 Supplemental -8-8 Figure 1. Identification of dopaminergic neurons in -1 VTA slices. -1 (a) Micrographs
Supplementary Figure 1
 8w Pia II/III IV V VI PV EYFP EYFP PV EYFP PV d PV EYFP Supplementary Figure a Spike probability x - PV-Cre d Spike probability x - RS RS b e Spike probability Spike probability.6......8..... FS FS c f
doi: /nature09554
 SUPPLEMENTARY INFORMATION doi:10.1038/nature09554 Supplementary Figure 1: Optical Tracing with New Photoactivatable GFP Variants Reveals Enhanced Labeling of Neuronal Processes We qualitatively compare
ONTOGENY AND NEURAL SUBSTRATES OF THE CONTEXT PREEXPOSURE FACILITATION EFFECT ON CONTEXTUAL FEAR CONDITIONING. Felipe Schiffino
 ONTOGENY AND NEURAL SUBSTRATES OF THE CONTEXT PREEXPOSURE FACILITATION EFFECT ON CONTEXTUAL FEAR CONDITIONING by Felipe Schiffino A thesis submitted to the Faculty of the University of Delaware in partial
Limbic system outline
 Limbic system outline 1 Introduction 4 The amygdala and emotion -history - theories of emotion - definition - fear and fear conditioning 2 Review of anatomy 5 The hippocampus - amygdaloid complex - septal
SUPPLEMENTARY INFORMATION
 Supplementary Figure 1. Normal AMPAR-mediated fepsp input-output curve in CA3-Psen cdko mice. Input-output curves, which are plotted initial slopes of the evoked fepsp as function of the amplitude of the
Behavioral generalization
 Supplementary Figure 1 Behavioral generalization. a. Behavioral generalization curves in four Individual sessions. Shown is the conditioned response (CR, mean ± SEM), as a function of absolute (main) or
Supplementary Information. Staged decline of neuronal function in vivo in an animal model of Alzheimer s Disease. Supplementary Figures S1-10
 Supplementary Information Staged decline of neuronal function in vivo in an animal model of Alzheimer s Disease Christine Grienberger 1 *, Nathalie L. Rochefort 1 *, Helmuth Adelsberger 1, Horst A. Henning
S100B+ Cell Density day Spine Formation (%)
") b * CP * HC CP Th DAPI S100B ** 50 40 30 * 20 10 0-10 -20 * * ** 9 6 3 0 0-50 50-100 100-150 150-200 Distance from Prism Face (um) 1-day Spine Formation (%) 1-day Spine Elimination (%) 12 Distance from
b * CP * HC CP Th DAPI S100B ** 50 40 30 * 20 10 0-10 -20 * * ** 9 6 3 0 0-50 50-100 100-150 150-200 Distance from Prism Face (um) 1-day Spine Formation (%) 1-day Spine Elimination (%) 12 Distance from
Nature Neuroscience: doi: /nn Supplementary Figure 1
 Supplementary Figure 1 Reward rate affects the decision to begin work. (a) Latency distributions are bimodal, and depend on reward rate. Very short latencies (early peak) preferentially occur when a greater
Modulation of Host Learning in Aedes aegypti Mosquitoes
 Current Biology, Volume 28 Supplemental Information Modulation of Host Learning in Aedes aegypti Mosquitoes Clément Vinauger, Chloé Lahondère, Gabriella H. Wolff, Lauren T. Locke, Jessica E. Liaw, Jay
Nature Neuroscience: doi: /nn Supplementary Figure 1
 Supplementary Figure 1 Quantification of myelin fragments in the aging brain (a) Electron microscopy on corpus callosum is shown for a 18-month-old wild type mice. Myelin fragments (arrows) were detected
Emotion I: General concepts, fear and anxiety
 C82NAB Neuroscience and Behaviour Emotion I: General concepts, fear and anxiety Tobias Bast, School of Psychology, University of Nottingham 1 Outline Emotion I (first part) Studying brain substrates of
Supplementary Figure 1: Validation of labeling specificity of immature OSNs and presynaptic terminals. (A) (B) (C) (D) (E)
 (B) (C) (D) (E)") Supplementary Figure 1: Validation of labeling specificity of immature OSNs and presynaptic terminals. (A) Confocal images of septal olfactory epithelium of an adult Gγ8-sypGFP-tdTom mouse showing colocalization
Supplementary Figure 1: Validation of labeling specificity of immature OSNs and presynaptic terminals. (A) Confocal images of septal olfactory epithelium of an adult Gγ8-sypGFP-tdTom mouse showing colocalization
Research Paper. Christopher W. Butler, 1 Yvette M. Wilson, 1 Jenny M. Gunnersen, and Mark Murphy
 Research Paper Tracking the fear memory engram: discrete populations of neurons within amygdala, hypothalamus, and lateral septum are specifically activated by auditory fear conditioning Christopher W.
Stress and Emotion. Stressors are things that challenge homeostasis -- these challenges may be real or merely anticipated
 Stress and Emotion 1 Stressors are things that challenge homeostasis -- these challenges may be real or merely anticipated Stress responses are what the body does about it 2 1 Two broad stressor categories
Suppl. Information Supplementary Figure 1. Strategy/latency analysis of individual mice during maze learning. a,
 Goal-oriented searching mediated by ventral hippocampus early in trial-and-error learning Ruediger, S, Spirig, D., Donato, F., Caroni, P. Suppl. Information Supplementary Figure 1. Strategy/latency analysis
Nature Neuroscience: doi: /nn Supplementary Figure 1. Large-scale calcium imaging in vivo.
 Supplementary Figure 1 Large-scale calcium imaging in vivo. (a) Schematic illustration of the in vivo camera imaging set-up for large-scale calcium imaging. (b) High-magnification two-photon image from
Structural basis for the role of inhibition in facilitating adult brain plasticity
 Structural basis for the role of inhibition in facilitating adult brain plasticity Jerry L. Chen, Walter C. Lin, Jae Won Cha, Peter T. So, Yoshiyuki Kubota & Elly Nedivi SUPPLEMENTARY FIGURES 1-6 a b M
HHS Public Access Author manuscript Nat Neurosci. Author manuscript; available in PMC 2014 September 19.
 Selective optical drive of thalamic reticular nucleus generates thalamic bursts & cortical spindles Michael M. Halassa 1,2,4, Joshua H. Siegle 2,4, Jason T. Ritt 3, Jonathan T. Ting 2, Guoping Feng 2,
Social transmission and buffering of synaptic changes after stress
 SUPPLEMENTARY INFORMATION Articles https://doi.org/10.1038/s41593-017-0044-6 In the format provided by the authors and unedited. Social transmission and buffering of synaptic changes after stress Toni-Lee
Nature Neuroscience: doi: /nn Supplementary Figure 1. Task timeline for Solo and Info trials.
 Supplementary Figure 1 Task timeline for Solo and Info trials. Each trial started with a New Round screen. Participants made a series of choices between two gambles, one of which was objectively riskier
Supplementary Figure 1. ACE robotic platform. A. Overview of the rig setup showing major hardware components of ACE (Automatic single Cell
 2 Supplementary Figure 1. ACE robotic platform. A. Overview of the rig setup showing major hardware components of ACE (Automatic single Cell Experimenter) including the MultiClamp 700B, Digidata 1440A,
Supplementary Online Material Supplementary Table S1 to S5 Supplementary Figure S1 to S4
 Supplementary Online Material Supplementary Table S1 to S5 Supplementary Figure S1 to S4 Table S1: Brain regions involved in the adapted classification learning task Brain Regions x y z Z Anterior Cingulate
SOM Husse et al. Supplementary online material. Synaptotagmin10-Cre, a driver to disrupt clock genes in the SCN
 SOM Husse et al. Supplementary online material Synaptotagmin10-Cre, a driver to disrupt clock genes in the SCN Jana Husse, Xunlei Zhou, Anton Shostak, Henrik Oster and Gregor Eichele SOM Husse et al.,
Supplementary materials for: Executive control processes underlying multi- item working memory
 Supplementary materials for: Executive control processes underlying multi- item working memory Antonio H. Lara & Jonathan D. Wallis Supplementary Figure 1 Supplementary Figure 1. Behavioral measures of
Thalamo-Cortical Relationships Ultrastructure of Thalamic Synaptic Glomerulus
 Central Visual Pathways V1/2 NEUR 3001 dvanced Visual Neuroscience The Lateral Geniculate Nucleus () is more than a relay station LP SC Professor Tom Salt UCL Institute of Ophthalmology Retina t.salt@ucl.ac.uk
Biological Bases of Behavior. 3: Structure of the Nervous System
 Biological Bases of Behavior 3: Structure of the Nervous System Neuroanatomy Terms The neuraxis is an imaginary line drawn through the spinal cord up to the front of the brain Anatomical directions are
Nature Neuroscience: doi: /nn Supplementary Figure 1
 Supplementary Figure 1 Relative expression of K IR2.1 transcript to enos was reduced 29-fold in capillaries from knockout animals. Relative expression of K IR2.1 transcript to enos was reduced 29-fold
SUPPLEMENTARY INFORMATION
 SUPPLEMENTARY INFORMATION doi:10.1038/nature12024 entary Figure 1. Distribution of the number of earned cocaine Supplementary Figure 1. Distribution of the number of earned cocaine infusions in Shock-sensitive
Behavioral Neuroscience: Fear thou not. Rony Paz
 Behavioral Neuroscience: Fear thou not Rony Paz Rony.paz@weizmann.ac.il Thoughts What is a reward? Learning is best motivated by threats to survival Threats are much better reinforcers Fear is a prime
Supplementary Figure S1: Tanycytes are restricted to the central/posterior hypothalamus
 Supplementary Figure S1: Tanycytes are restricted to the central/posterior hypothalamus a: Expression of Vimentin, GFAP, Sox2 and Nestin in anterior, central and posterior hypothalamus. In the anterior
Paul-Chen Hsieh, Ming-Tsung Tseng, Chi-Chao Chao, Yea-Huey Lin Wen-Yih I. Tseng, Kuan-Hong Liu, Ming-Chang Chiang, Sung-Tsang Hsieh
 IMAGING SIGNATURES OF ALTERED BRAIN RESPONSES IN SMALL-FIBER NEUROPATHY: REDUCED FUNCTIONAL CONNECTIVITY OF THE LIMBIC SYSTEM AFTER PERIPHERAL NERVE DEGENERATION Paul-Chen Hsieh, Ming-Tsung Tseng, Chi-Chao
Neural Recording Methods
 Neural Recording Methods Types of neural recording 1. evoked potentials 2. extracellular, one neuron at a time 3. extracellular, many neurons at a time 4. intracellular (sharp or patch), one neuron at
SUPPLEMENTARY INFORMATION
 doi:10.1038/nature11436 Supplementary Figure 1. CRF peptide is localized cholinergic interneurons throughout the nucleus accumbens. Immunofluorescent images demonstrating localization of CRF peptide, tyrosine
Two distinct mechanisms for experiencedependent
 SUPPLEMENTARY INFORMATION Articles https://doi.org/10.1038/s41593-018-0150-0 In the format provided by the authors and unedited. Two distinct mechanisms for experiencedependent homeostasis Michelle C.
nucleus accumbens septi hier-259 Nucleus+Accumbens birnlex_727
 Nucleus accumbens From Wikipedia, the free encyclopedia Brain: Nucleus accumbens Nucleus accumbens visible in red. Latin NeuroNames MeSH NeuroLex ID nucleus accumbens septi hier-259 Nucleus+Accumbens birnlex_727
Circuits & Behavior. Daniel Huber
 Circuits & Behavior Daniel Huber How to study circuits? Anatomy (boundaries, tracers, viral tools) Inactivations (lesions, optogenetic, pharma, accidents) Activations (electrodes, magnets, optogenetic)
LESIONS OF THE MESOLIMBIC DOPAMINE SYSTEM DISRUPT SIGNALLED ESCAPE RESPONSES IN THE RAT
 ACTA NEUROBIOL: EXP. 1988, 48: 117-121 Short communication LESIONS OF THE MESOLIMBIC DOPAMINE SYSTEM DISRUPT SIGNALLED ESCAPE RESPONSES IN THE RAT W. Jeffrey WILSON and Jennifer C. HALL Department of Psychological
SUPPLEMENTARY INFORMATION
 doi:10.1038/nature11239 Introduction The first Supplementary Figure shows additional regions of fmri activation evoked by the task. The second, sixth, and eighth shows an alternative way of analyzing reaction
Supplementary Information
 Supplementary Information Title Degeneration and impaired regeneration of gray matter oligodendrocytes in amyotrophic lateral sclerosis Authors Shin H. Kang, Ying Li, Masahiro Fukaya, Ileana Lorenzini,
QUANTIFYING CEREBRAL CONTRIBUTIONS TO PAIN 1
 QUANTIFYING CEREBRAL CONTRIBUTIONS TO PAIN 1 Supplementary Figure 1. Overview of the SIIPS1 development. The development of the SIIPS1 consisted of individual- and group-level analysis steps. 1) Individual-person
SUPPLEMENTARY INFORMATION
 doi: 10.1038/nature06310 SUPPLEMENTARY INFORMATION www.nature.com/nature 1 www.nature.com/nature 2 www.nature.com/nature 3 Supplementary Figure S1 Spontaneous duration of wake, SWS and REM sleep (expressed
Resistance to forgetting associated with hippocampus-mediated. reactivation during new learning
 Resistance to Forgetting 1 Resistance to forgetting associated with hippocampus-mediated reactivation during new learning Brice A. Kuhl, Arpeet T. Shah, Sarah DuBrow, & Anthony D. Wagner Resistance to
The primate amygdala combines information about space and value
 The primate amygdala combines information about space and Christopher J Peck 1,8, Brian Lau 1,7,8 & C Daniel Salzman 1 6 npg 213 Nature America, Inc. All rights reserved. A stimulus predicting reinforcement
Prof. Anagnostaras, Lecture 7: Fear
 Historical views that thought and emotion were processed separately in the brain Prof. Anagnostaras, Lecture 7: So far, fear is the best understood What is fear? Dictionary: A feeling of agitation and
Supplementary Figure 1. Satellite cell contribution to myofibers in whole. gastrocnemius/plantaris/soleus, diaphragm, and EOM of 12 or 20 month
 Keefe et al. p. 1 Supplementary Figure 1. Satellite cell contribution to myofibers in whole muscles. (a-l) Representative cross-sections through whole TA/EDL, gastrocnemius/plantaris/soleus, diaphragm,
Supplementary Figure 1: Kv7 currents in neonatal CA1 neurons measured with the classic M- current voltage-clamp protocol.
 Supplementary Figures 1-11 Supplementary Figure 1: Kv7 currents in neonatal CA1 neurons measured with the classic M- current voltage-clamp protocol. (a), Voltage-clamp recordings from CA1 pyramidal neurons
Systems Neuroscience November 29, Memory
 Systems Neuroscience November 29, 2016 Memory Gabriela Michel http: www.ini.unizh.ch/~kiper/system_neurosci.html Forms of memory Different types of learning & memory rely on different brain structures
Chapter 5: Learning and Behavior Learning How Learning is Studied Ivan Pavlov Edward Thorndike eliciting stimulus emitted
 Chapter 5: Learning and Behavior A. Learning-long lasting changes in the environmental guidance of behavior as a result of experience B. Learning emphasizes the fact that individual environments also play