Supplemental data Supplemental Figure Legends Supplemental Figure 1. Supplemental Figure 2.
|
|
|
- Cornelius Bell
- 5 years ago
- Views:
Transcription
1 Supplemental data Supplemental Figure Legends Supplemental Figure 1. Analysis of deletion of AMPK!2 in POMC and AgRP neurons in control and POMC!2KO and AgRP!2KO mice. (A) mmunofluorescence analysis for AMPK!2 (green) and POMC (red) expression in the hypothalami of control and POMC!2KO mice. Colocalisation of typical nuclear staining of AMPK!2 is seen in POMC neurons in control section (indicated by white arrows) and no colocalization is seen in POMC!2KO section. (B) mmunofluorescence analysis for AMPK!2 (red) and AgRPCreYFP (green) expression in the hypothalami of control and AgRP!2KOYFP mice. Colocalisation of typical nuclear staining of AMPK!2 is seen in AgRP neurons in control section (indicated by white arrows) and no colocalization is seen in AgRP!2KOYFP section. Confocal images of representative ARC fields are shown and are typical of results from 3 mice of each genotype. Scale bars: 1 µm. (C) Quantification of deletion of AMPK!2 in POMC!2KO and AgRP!2KO neurons. AMPK!2 staining was assessed in at least 5 POMC or AgRP neurons from 3 mice of each genotype. Results are expressed as percentage of cells in which AMPK!2 expression was absent and are means " SEM. Supplemental Figure 2. Unaltered neuropeptide release in hypothalamic explants from POMC!2KO and AgRP!2KO mice and normal anterior pituitary hormone gene expression in POMC!2KO mice. (A)!-MSH release in control and POMC!2KO hypothalamic explants (n = 15 per genotype). (B) AgRP and (C) NPY release in control and AgRP!2KO hypothalamic explants (n = 8 per genotype). (D) Pre-pro-opiomelanocortin (POMC), growth hormone (GH) and thyroid stimulating hormone beta subunit (TSH#) mrna expression in control and POMC!2KO pituitaries assessed by quantitative RT-PCR, n = 6-1. Probes for GAPDH were used to adjust for total RNA content. All values are mean " SEM.
2 Supplemental Figure 3. Glucose homeostasis in POMC!2KO and AgRP!2KO mice. (A) Glucose tolerance in 12-week old male control and POMC!2KO mice on chow diet, n = 16. (B) Glucose tolerance in male control and POMC!2KO mice after 18 week exposure to HFD, n = (C) Glucose tolerance in 12-week old male control and AgRP!2KO mice, n = 5-7. (D) nsulin tolerance in 12-week old male control and AgRP!2KO mice, n = All values are mean ± SEM. * P <.5. Supplemental Figure 4. AgRP neuronal anatomy is normal in AgRP!2KO mice. (A) n situ hybridization for AgRP mrna in ARC of control and AgRP!2KO mice. Representative sections from 3 mice for each genotype are shown. (B) mmunoreactivity for AgRP in ARC of control and AgRP!2KO mice. Representative sections from 3 mice for each genotype are presented. Population size and distribution (C and D) for AgRP neurons within the ARC in control and AgRP!2KO mice (n = 2-3). AgRP somatic area (E) and diameter (F) in control and AgRP!2KO mice. A minimum of 1 neurons were analysed per group. 3V, 3 rd ventricle. Scale bars, 5 $m. All values are mean " SEM.
3 Supplemental Table 1. Body length, bone mineral content and biochemical parameters in AMPK!2 mutant mice. POMC!2KO!1HetPOMC!2KO AgRP!2KO Nose/anus length (cm) 9.4 ± ± ± ± ±.3 (8) (8) (8) (8) Bone mineral content.51 ±.54 ±.53 ± ND ND (g/cm 2 ).1 (8).1 (8).1 (8) Randomly fed blood 8.1 ± ± ± ± ±.2 glucose (mmol/l) (27) () (12) (15) (14) Fasted blood glucose 5.7 ± ± ± ± ±.2 (mmol/l) (24) (23) (18) (16) (17) nsulin (ng/ml).149 ±.173 ± ND.155 ±.186 ± Adiponectin ($g/ml) 4.8 ± ±.6 ND 4. ± ±.3 (6) Corticosterone (ng/ml) 11.1 ± 1.9 (6) 9.2 ± 1.9 ND ND ND T4 ($g/dl) 6.1 ± ±.7 ND 3.4 ± ±.3 (6) (6) Data are expressed as mean ± SEM. The number of mice per group is shown in parenthesis. ND, not determined.
4 Supplemental Table 2. The biophysical properties of ARC AgRP-expressing neurons in control and AgRP!2KO mice. AgRP!2KO Membrane potential (mv) -46 ± 1 (26) -51 ± 1 (19)* nput resistance (G%) 2.5 ±.3 (23) 2.8 ±.3 (17) Spike firing frequency (Hz) 2.1 ±.4 (26) 2.8 ±.5 (19) Data are expressed as mean ± SEM. The number of neurons per group is shown in parenthesis. * P <.5.
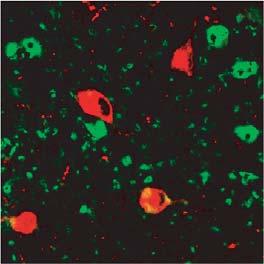
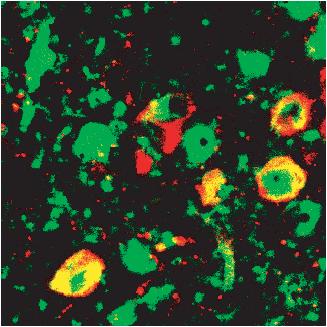
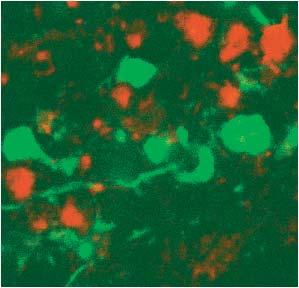
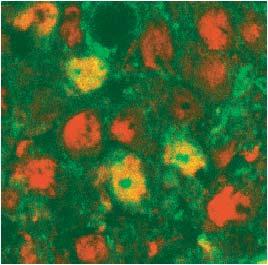
5 Supplemental Figure 1 A B POMCα2KO C AMPKa2 deletion (%) POMCα2KO
6 Supplemental Figure 2 A 15 B 15 Basal α-msh release (pg/hypothalamus/45 mins) Basal AgRP release (pg/hypothalamus/45 mins) POMC α2ko AgRP α2ko C 1 D Basal NPY release (pg/hypothalamus/45 mins) 75 5 mrna expression relative to control (%) POMCα2KO POMC GH TSHβ
7 Supplemental Figure 3 A Blood glucose (mmol/l) POMCα2KO B Blood glucose (mmol/l) * HFD POMCα2KO HFD * Time after injection (min) Time after injection (min) C Blood glucose (mmol/l) D Blood glucose (% of fasting levels) Time after injection (min) Time after injection (min)


 12 1 8 6 4 2")
8 Supplemental Figure 4 A B 3V 3V 3V 3V C D AgRP cell count (total) AgRP α2ko AgRP cell count ARC section E F AgRP cell area (µm 2 ) AgRP α2ko AgRP cell diameter (µm) AgRP α2ko
High-fat Feeding Promotes Obesity via Insulin Receptor/PI3k- Dependent Inhibition of SF-1 VMH Neurons
 High-fat Feeding Promotes Obesity via Insulin Receptor/PI3k- Dependent Inhibition of SF-1 VMH Neurons Tim Klöckener 1,2,3, Simon Hess 2,4, Bengt F. Belgardt 1,2,3, Lars Paeger 2,4, Linda A. W. Verhagen
Supplementary Figure 1) GABAergic enhancement by leptin hyperpolarizes POMC neurons A) Representative recording samples showing the membrane
 GABAergic enhancement by leptin hyperpolarizes POMC neurons A) Representative recording samples showing the membrane") Supplementary Figure 1) GABAergic enhancement by leptin hyperpolarizes POMC neurons A) Representative recording samples showing the membrane potential recorded from POMC neurons following treatment with
Supplementary Figure 1) GABAergic enhancement by leptin hyperpolarizes POMC neurons A) Representative recording samples showing the membrane potential recorded from POMC neurons following treatment with
perk/erk STAT5B
 pakt/akt relative to saline (fold).5.5.5 control perk/erk relative to saline (fold).6.4..8.6.4. p=.6 control db/+ Hsp6 VDAC Hsp6/VDAC (relative to db/+) 8 6 4 db/+ C db/+ Hsp6 Hsp6/actin (relative to db/+)
glucagon receptor AgRP merged color map I corr = 0.76±0.024 glucagon receptor DAPI merged
 Hypothalamic glucagon signaling inhibits glucose production Patricia I. Mighiu*, Jessica T.Y. Yue*, Beatrice M. Filippi, Mona A. Abraham, Madhu Chari, Carol K.L. Lam, Clair S. Yang, Nikita R. Christian,
Supplemental methods. Total RNA was extracted from the stomach, liver, pancreas, pituitary, and
 Supplemental methods Real-time quantitative RT-PCR and Semi-quantitative PCR Total RNA was extracted from the stomach, liver, pancreas, pituitary, and hypothalamus as previously described (). Primers and
SUPPLEMENTARY INFORMATION
 DOI: 10.1038/ncb2211 a! mir-143! b! mir-103/107! let-7a! mir-144! mir-122a! mir-126-3p! mir-194! mir-27a! mir-30c! Figure S1 Northern blot analysis of mir-143 expression dependent on feeding conditions.
a b c Physical appearance of mice Lean mass Adipocyte size d e f
 LFD HFD LFD HFD Area under curve (GTT) HFD-VSL#3 LFD HFD Area under curve (ITT) HFD-VSL#3 Liver TG content (% l) HFD-VSL#3 LFD HFD HFD-VSL#3 LFD HFD HFD-VSL#3 LFD HFD HFD + VSL#3 Lean mass (gm) Mean adipocyte
AMPK is essential for energy homeostasis regulation and glucose sensing by POMC and AgRP neurons
 Related Commentary, page 2089 Research article AMPK is essential for energy homeostasis regulation and glucose sensing by POMC and AgRP neurons Marc Claret, 1 Mark A. Smith, 2 Rachel L. Batterham, 1 Colin
Supplemental Table 1. Plasma NEFA and liver triglyceride levels in ap2-hif1ako and ap2-hif2ako mice under control and high fat diets.
 Supplemental Table 1. Plasma NEFA and liver triglyceride levels in Hif1aKO and Hif2aKO mice under control and high fat diets. Hif1a (n=6) Hif1aK O (n=6) Hif2a Hif2aK O Hif1a (n=5) Hif1aKO (n=5) Hif2a Hif2aK
Hypothalamic TLR2 triggers sickness behavior via a microglia-neuronal axis
 Hypothalamic TLR triggers sickness behavior via a microglia-neuronal axis Sungho Jin, *, Jae Geun Kim,, *, Jeong Woo Park, Marco Koch,, Tamas L. Horvath and Byung Ju Lee Department of Biological Sciences,
Diabetic pdx1-mutant zebrafish show conserved responses to nutrient overload and anti-glycemic treatment
 Supplementary Information Diabetic pdx1-mutant zebrafish show conserved responses to nutrient overload and anti-glycemic treatment Robin A. Kimmel, Stefan Dobler, Nicole Schmitner, Tanja Walsen, Julia
Supplementary Figure 1. DNA methylation of the adiponectin promoter R1, Pparg2, and Tnfa promoter in adipocytes is not affected by obesity.
 Supplementary Figure 1. DNA methylation of the adiponectin promoter R1, Pparg2, and Tnfa promoter in adipocytes is not affected by obesity. (a) Relative amounts of adiponectin, Ppar 2, C/ebp, and Tnf mrna
The Obesity Susceptibility Gene Carboxypeptidase E Links FoxO1 Signaling in Hypothalamic Pro opiomelanocortin Neurons with Regulation of Food Intake
 Plum et al., Supplementary online material The Oesity Suseptiility Gene Caroxypeptidase E Links FoxO1 Signaling in Hypothalami Pro opiomelanoortin Neurons with Regulation of Food Intake Leona Plum, Hua
Figure S1. Body composition, energy homeostasis and substrate utilization in LRH-1 hep+/+ (white bars) and LRH-1 hep-/- (black bars) mice.
 and LRH-1 hep-/- (black bars) mice.") Figure S1. Body composition, energy homeostasis and substrate utilization in LRH-1 hep+/+ (white bars) and LRH-1 hep-/- (black bars) mice. (A) Lean and fat masses, determined by EchoMRI. (B) Food and water
Figure S1. Body composition, energy homeostasis and substrate utilization in LRH-1 hep+/+ (white bars) and LRH-1 hep-/- (black bars) mice. (A) Lean and fat masses, determined by EchoMRI. (B) Food and water
Supplementary Figure 1
 Supplementary Figure 1 Arcuate ChIEF-tdTomato neurons expressed TH These micrographs show that TH-Cre-ChIEF-tdTomato (magenta), expressed by AAV in a TH-Cre mouse, were immunostained with TH (green) in
GPR120 *** * * Liver BAT iwat ewat mwat Ileum Colon. UCP1 mrna ***
 a GPR120 GPR120 mrna/ppia mrna Arbitrary Units 150 100 50 Liver BAT iwat ewat mwat Ileum Colon b UCP1 mrna Fold induction 20 15 10 5 - camp camp SB202190 - - - H89 - - - - - GW7647 Supplementary Figure
General Laboratory methods Plasma analysis: Gene Expression Analysis: Immunoblot analysis: Immunohistochemistry:
 General Laboratory methods Plasma analysis: Plasma insulin (Mercodia, Sweden), leptin (duoset, R&D Systems Europe, Abingdon, United Kingdom), IL-6, TNFα and adiponectin levels (Quantikine kits, R&D Systems
Table 1. Oligonucleotides and RT-PCR conditions Supplementary Material and Methods Fig. 1
 Table 1. Oligonucleotides and RT-PCR conditions. Overview of PCR templates, gene accession number of sequences used as template, product size, annealing temperatures and optimal cycles, cdna and MgCl 2
Central injection of fibroblast growth factor 1 induces sustained remission of diabetic hyperglycemia in rodents
 Central injection of fibroblast growth factor 1 induces sustained remission of diabetic hyperglycemia in rodents Jarrad M Scarlett 1,,1, Jennifer M Rojas 1,1, Miles E Matsen 1, Karl J Kaiyala 3, Darko
SUPPLEMENTARY INFORMATION
 Supplementary Figure 1. Histogram showing hybridization signals for chicken (left) and quail (right) genomic DNA analyzed by Chicken GeneChip (n=3). www.nature.com/nature 1 Supplementary Figure 2. Independent
SUPPLEMENTARY INFORMATION
 doi:10.1038/nature12652 Supplementary Figure 1. PRDM16 interacts with endogenous EHMT1 in brown adipocytes. Immunoprecipitation of PRDM16 complex by flag antibody (M2) followed by Western blot analysis
SUPPLEMENTARY INFORMATION
 Supplementary Figure 1. Behavioural effects of ketamine in non-stressed and stressed mice. Naive C57BL/6 adult male mice (n=10/group) were given a single dose of saline vehicle or ketamine (3.0 mg/kg,
Title: Obesity in mice with adipocyte-specific deletion of clock component Bmal1
 Title: Obesity in mice with adipocyte-specific deletion of clock component Bmal1 Authors: Georgios K. Paschos, Salam Ibrahim, Wen-Liang Song, Takeshige Kunieda, Gregory Grant, Teresa M. Reyes, Christopher
Metabolic Programming. Mary ET Boyle, Ph. D. Department of Cognitive Science UCSD
 Metabolic Programming Mary ET Boyle, Ph. D. Department of Cognitive Science UCSD nutritional stress/stimuli organogenesis of target tissues early period critical window consequence of stress/stimuli are
SUPPLEMENTARY FIGURE LEGENDS
 SUPPLEMENTARY FIGURE LEGENDS Supplementary Figure 1. Hippocampal sections from new-born Pten+/+ and PtenFV/FV pups were stained with haematoxylin and eosin (H&E) and were imaged at (a) low and (b) high
! acts via the autonomic nervous system. ! maintaining body weight within tight limits. ! ventromedial (VMN) ! arcuate (ARC) ! neuropeptide Y (NPY)
 ! arcuate (ARC) ! neuropeptide Y (NPY)") Brain Regulates energy homeostatis Glucose Sensing in the Brain Seminar 2012 Gareth Price! acts in response to circulating signals of nutrient states! acts via the autonomic nervous system Ensures a balance
Brain Regulates energy homeostatis Glucose Sensing in the Brain Seminar 2012 Gareth Price! acts in response to circulating signals of nutrient states! acts via the autonomic nervous system Ensures a balance
TBP (H) CACAGTGAATCTTGGTTGTAAACTTGA AAACCGCTTGGGATTATATTCG ANGPTL8 (H) CTGGGCCCTGCCTACCGAGA CCGATGCTGCTGTGCCACCA [1]
![TBP (H) CACAGTGAATCTTGGTTGTAAACTTGA AAACCGCTTGGGATTATATTCG ANGPTL8 (H) CTGGGCCCTGCCTACCGAGA CCGATGCTGCTGTGCCACCA [1]](/thumbs/89/99233308.jpg "TBP (H) CACAGTGAATCTTGGTTGTAAACTTGA AAACCGCTTGGGATTATATTCG ANGPTL8 (H) CTGGGCCCTGCCTACCGAGA CCGATGCTGCTGTGCCACCA [1]") ESM Table 1. Immunoblot antibodies. Primary Supplier Dilution Antibody Akt Cell Signaling 1:1000 Technology Phosphorylated Cell Signaling 1:1000 Akt (Ser 473) Technology PKCε Cell Signaling 1:1000 Technology
ESM Table 1. Immunoblot antibodies. Primary Supplier Dilution Antibody Akt Cell Signaling 1:1000 Technology Phosphorylated Cell Signaling 1:1000 Akt (Ser 473) Technology PKCε Cell Signaling 1:1000 Technology
Supplementary Figure S1: Tanycytes are restricted to the central/posterior hypothalamus
 Supplementary Figure S1: Tanycytes are restricted to the central/posterior hypothalamus a: Expression of Vimentin, GFAP, Sox2 and Nestin in anterior, central and posterior hypothalamus. In the anterior
CNS Control of Food Intake. Adena Zadourian & Andrea Shelton
 CNS Control of Food Intake Adena Zadourian & Andrea Shelton Controlling Food Intake Energy Homeostasis (Change in body adiposity + compensatory changes in food intake) Background Information/Review Insulin
SUPPLEMENTARY INFORMATION
 DOI: 10.1038/ncb3461 In the format provided by the authors and unedited. Supplementary Figure 1 (associated to Figure 1). Cpeb4 gene-targeted mice develop liver steatosis. a, Immunoblot displaying CPEB4
Expression of acid base transporters in the kidney collecting duct in Slc2a7 -/-
 Supplemental Material Results. Expression of acid base transporters in the kidney collecting duct in Slc2a7 -/- and Slc2a7 -/- mice. The expression of AE1 in the kidney was examined in Slc26a7 KO mice.
Cell to Cell Communication
 Review #1 08 Review using OPAL figures Review using class web PDF Preview of test #1 Cell to Cell Communication 1 Communication Strategies endocrine neurocrine paracrine autocrine Endocrine System Overview
The central melanocortin system affects the hypothalamopituitary thyroid axis and may mediate the effect of leptin
 The central melanocortin system affects the hypothalamopituitary thyroid axis and may mediate the effect of leptin M.S. Kim, C.J. Small, S.A Stanley, D.G.A. Morgan, L.J. Seal, W.M. Kong, C.M.B. Edwards,
Supporting Information
 Supporting Information Charalambous et al. 10.1073/pnas.1406119111 SI Experimental Procedures Serum and Tissue Biochemistry. Enzymatic assay kits were used for determination of plasma FFAs (Roche), TAGs
Supplementary Figure 1.
 Supplementary Figure 1. FGF21 does not exert direct effects on hepatic glucose production. The liver explants from C57BL/6J mice (A, B) or primary rat hepatocytes (C, D) were incubated with rmfgf21 (2
SUPPLEMENTARY INFORMATION
 DOI: 10.1038/ncb2607 Figure S1 Elf5 loss promotes EMT in mammary epithelium while Elf5 overexpression inhibits TGFβ induced EMT. (a, c) Different confocal slices through the Z stack image. (b, d) 3D rendering
Neural pathways controlling homeostatic and hedonic feeding in rats on free-choice diets van den Heuvel, J.K.
 UvA-DARE (Digital Academic Repository) Neural pathways controlling homeostatic and hedonic feeding in rats on free-choice diets van den Heuvel, J.K. Link to publication Citation for published version (APA):
SUPPLEMENTARY INFORMATION
 SUPPLEMENTARY INFORMATION doi:10.1038/nature11464 Supplemental Figure S1. The expression of Vegfb is increased in obese and diabetic mice as compared to lean mice. a-b, Body weight and postprandial blood
marker. DAPI labels nuclei. Flies were 20 days old. Scale bar is 5 µm. Ctrl is
 Supplementary Figure 1. (a) Nos is detected in glial cells in both control and GFAP R79H transgenic flies (arrows), but not in deletion mutant Nos Δ15 animals. Repo is a glial cell marker. DAPI labels
Mechanisms underlying epigene2c effects of endocrine disrup2ve chemicals. Joëlle Rüegg
 Mechanisms underlying epigene2c effects of endocrine disrup2ve chemicals Joëlle Rüegg 2 EDCs and human health Bisphenol A Epigenetic mechanisms Behavioural and psychiatric disorders Phthalates DNA methylation
Supplementary Table 1. List of primers used in this study
 Supplementary Table 1. List of primers used in this study Gene Forward primer Reverse primer Rat Met 5 -aggtcgcttcatgcaggt-3 5 -tccggagacacaggatgg-3 Rat Runx1 5 -cctccttgaaccactccact-3 5 -ctggatctgcctggcatc-3
BNP mrna expression in DR and DS rat left ventricles (n = 5). (C) Plasma norepinephrine
. (C) Plasma norepinephrine") Kanazawa, et al. Supplementary figure legends Supplementary Figure 1 DS rats had congestive heart failure. (A) DR and DS rat hearts. (B) QRT-PCR analysis of BNP mrna expression in DR and DS rat left ventricles
Kanazawa, et al. Supplementary figure legends Supplementary Figure 1 DS rats had congestive heart failure. (A) DR and DS rat hearts. (B) QRT-PCR analysis of BNP mrna expression in DR and DS rat left ventricles
Nature Neuroscience: doi: /nn Supplementary Figure 1
 Supplementary Figure 1 Drd1a-Cre driven ChR2 expression in the SCN. (a) Low-magnification image of a representative Drd1a-ChR2 coronal brain section (n = 2) showing endogenous tdtomato fluorescence (magenta).
Supplemental Table 1. Primers used for RT-PCR analysis of inflammatory cytokines Gene Primer Sequence
 Supplemental Table 1. Primers used for RT-PCR analysis of inflammatory cytokines Gene Primer Sequence IL-1α Forward primer 5 -CAAGATGGCCAAAGTTCGTGAC-3' Reverse primer 5 -GTCTCATGAAGTGAGCCATAGC-3 IL-1β
BMI risk SNPs associate with increased CADM1 and CADM2 expression in the cerebellum of human subjects.
 Supplementary Figure 1 BMI risk SNPs associate with increased CADM1 and CADM2 expression in the cerebellum of human subjects. Boxplots show the 25% and 75% quantiles of normalized mrna expression levels
Ophthalmology, Radiation Oncology,
 Supporting Online Material Journal: Nature Neuroscience Article Title: Corresponding Author: All Authors: Affiliations: Tanycytes of the Hypothalamic Median Eminence Form a Diet- Responsive Neurogenic
Homeostasis Through Chemistry. The Endocrine System Topic 6.6
 Homeostasis Through Chemistry The Endocrine System Topic 6.6 Comparing NS & ES Animals have two systems of internal communication and regulation The nervous system Response time: Fast, quick Signals: electrical
Dep. Control Time (min)
") aa Control Dep. RP 1s 1 mv 2s 1 mv b % potentiation of IPSP 2 15 1 5 Dep. * 1 2 3 4 Time (min) Supplementary Figure 1. Rebound potentiation of IPSPs in PCs. a, IPSPs recorded with a K + gluconate pipette
aa Control Dep. RP 1s 1 mv 2s 1 mv b % potentiation of IPSP 2 15 1 5 Dep. * 1 2 3 4 Time (min) Supplementary Figure 1. Rebound potentiation of IPSPs in PCs. a, IPSPs recorded with a K + gluconate pipette
Supplementary Materials for
 www.sciencesignaling.org/cgi/content/full/8/407/ra127/dc1 Supplementary Materials for Loss of FTO in adipose tissue decreases Angptl4 translation and alters triglyceride metabolism Chao-Yung Wang,* Shian-Sen
Supplemental Information. Otic Mesenchyme Cells Regulate. Spiral Ganglion Axon Fasciculation. through a Pou3f4/EphA4 Signaling Pathway
 Neuron, Volume 73 Supplemental Information Otic Mesenchyme Cells Regulate Spiral Ganglion Axon Fasciculation through a Pou3f4/EphA4 Signaling Pathway Thomas M. Coate, Steven Raft, Xiumei Zhao, Aimee K.
ZL ZDF ZDF + E2 *** Visceral (g) ZDF
 ZDF") Body Weight (g) 4 3 2 1 ** * ZL ZDF 6 8 1 12 14 16 Age (weeks) B * Sub-cutaneous (g) 16 12 8 4 ZL ZDF Visceral (g) 25 2 15 1 5 ZL ZDF Total fat pad weight (g) 4 3 2 1 ZDF ZL Supplemental Figure 1: Effect
Body Weight (g) 4 3 2 1 ** * ZL ZDF 6 8 1 12 14 16 Age (weeks) B * Sub-cutaneous (g) 16 12 8 4 ZL ZDF Visceral (g) 25 2 15 1 5 ZL ZDF Total fat pad weight (g) 4 3 2 1 ZDF ZL Supplemental Figure 1: Effect
Supplementary Fig. S1. Schematic diagram of minigenome segments.
 open reading frame 1565 (segment 5) 47 (-) 3 5 (+) 76 101 125 149 173 197 221 246 287 open reading frame 890 (segment 8) 60 (-) 3 5 (+) 172 Supplementary Fig. S1. Schematic diagram of minigenome segments.
Supplementary Table 1. The primers used for quantitative RT-PCR. Gene name Forward (5 > 3 ) Reverse (5 > 3 )
 Reverse (5 > 3 )") 770 771 Supplementary Table 1. The primers used for quantitative RT-PCR. Gene name Forward (5 > 3 ) Reverse (5 > 3 ) Human CXCL1 GCGCCCAAACCGAAGTCATA ATGGGGGATGCAGGATTGAG PF4 CCCCACTGCCCAACTGATAG TTCTTGTACAGCGGGGCTTG
770 771 Supplementary Table 1. The primers used for quantitative RT-PCR. Gene name Forward (5 > 3 ) Reverse (5 > 3 ) Human CXCL1 GCGCCCAAACCGAAGTCATA ATGGGGGATGCAGGATTGAG PF4 CCCCACTGCCCAACTGATAG TTCTTGTACAGCGGGGCTTG
Supplementary Fig. 1 V-ATPase depletion induces unique and robust phenotype in Drosophila fat body cells.
 Supplementary Fig. 1 V-ATPase depletion induces unique and robust phenotype in Drosophila fat body cells. a. Schematic of the V-ATPase proton pump macro-complex structure. The V1 complex is composed of
c Ischemia (30 min) Reperfusion (8 w) Supplementary Figure bp 300 bp Ischemia (30 min) Reperfusion (4 h) Dox 20 mg/kg i.p.
 Reperfusion (8 w) Supplementary Figure bp 300 bp Ischemia (30 min) Reperfusion (4 h) Dox 20 mg/kg i.p.") a Marker Ripk3 +/ 5 bp 3 bp b Ischemia (3 min) Reperfusion (4 h) d 2 mg/kg i.p. 1 w 5 w Sacrifice for IF size A subset for echocardiography and morphological analysis c Ischemia (3 min) Reperfusion (8
a Marker Ripk3 +/ 5 bp 3 bp b Ischemia (3 min) Reperfusion (4 h) d 2 mg/kg i.p. 1 w 5 w Sacrifice for IF size A subset for echocardiography and morphological analysis c Ischemia (3 min) Reperfusion (8
SUPPLEMENTARY INFORMATION
 doi: 10.1038/nature06994 A phosphatase cascade by which rewarding stimuli control nucleosomal response A. Stipanovich*, E. Valjent*, M. Matamales*, A. Nishi, J.H. Ahn, M. Maroteaux, J. Bertran-Gonzalez,
Figure S1. Reduction in glomerular mir-146a levels correlate with progression to higher albuminuria in diabetic patients.
 Supplementary Materials Supplementary Figures Figure S1. Reduction in glomerular mir-146a levels correlate with progression to higher albuminuria in diabetic patients. Figure S2. Expression level of podocyte
SUPPLEMENTARY DATA. Supplementary Table 1. Primers used for PCR and qpcr Primer Name
 Supplementary Table. Primers used for PCR and qpcr Primer Name ccession Number Fwd Rev Type of PCR Cre NC_8 GGCGTCTTCCGC GTGCCCCTCGTTTG Standard PCR LoUcp CCGGGCTGTCTCCGCGG GGCTGTTCGCCCGGCC Standard PCR
Supplementary Table 1 Clinicopathological characteristics of 35 patients with CRCs
 Supplementary Table Clinicopathological characteristics of 35 patients with CRCs Characteristics Type-A CRC Type-B CRC P value Sex Male / Female 9 / / 8.5 Age (years) Median (range) 6. (9 86) 6.5 (9 76).95
2.5. AMPK activity
 Supplement Fig. A 3 B phos-ampk 2.5 * Control AICAR AMPK AMPK activity (Absorbance at 45 nm) 2.5.5 Control AICAR Supplement Fig. Effects of AICAR on AMPK activation in macrophages. J774. macrophages were
AdPLA ablation increases lipolysis and prevents obesity induced by high fat feeding or leptin deficiency
 AdPLA AdPLA ablation increases lipolysis and prevents obesity induced by high fat feeding or leptin deficiency Kathy Jaworski, Maryam Ahmadian, Robin E. Duncan, Eszter Sarkadi-Nagy, Krista A. Va rady,
Males- Western Diet WT KO Age (wks) Females- Western Diet WT KO Age (wks)
 Females- Western Diet WT KO Age (wks)") Relative Arv1 mrna Adrenal 33.48 +/- 6.2 Skeletal Muscle 22.4 +/- 4.93 Liver 6.41 +/- 1.48 Heart 5.1 +/- 2.3 Brain 4.98 +/- 2.11 Ovary 4.68 +/- 2.21 Kidney 3.98 +/-.39 Lung 2.15 +/-.6 Inguinal Subcutaneous
Relative Arv1 mrna Adrenal 33.48 +/- 6.2 Skeletal Muscle 22.4 +/- 4.93 Liver 6.41 +/- 1.48 Heart 5.1 +/- 2.3 Brain 4.98 +/- 2.11 Ovary 4.68 +/- 2.21 Kidney 3.98 +/-.39 Lung 2.15 +/-.6 Inguinal Subcutaneous
Nature Structural & Molecular Biology: doi: /nsmb Supplementary Figure 1. Generation and validation of mtef4-knockout mice.
 Supplementary Figure 1 Generation and validation of mtef4-knockout mice. (a) Alignment of EF4 (E. coli) with mouse, yeast and human EF4. (b) Domain structures of mouse mtef4 compared to those of EF4 (E.
Supporting Online Material for
 www.sciencemag.org/cgi/content/full/1171320/dc1 Supporting Online Material for A Frazzled/DCC-Dependent Transcriptional Switch Regulates Midline Axon Guidance Long Yang, David S. Garbe, Greg J. Bashaw*
Cell to Cell Communication
 Review #1 15 Review using OPAL figures Review using class web PDF Preview of test #1 Cell to Cell Communication 1 Communication Strategies endocrine neurocrine paracrine autocrine Endocrine System Overview
Supplementary Table 2. Plasma lipid profiles in wild type and mutant female mice submitted to a HFD for 12 weeks wt ERα -/- AF-1 0 AF-2 0
 Supplementary Table 1. List of specific primers used for gene expression analysis. Genes Primer forward Primer reverse Hprt GCAGTACAGCCCCAAAATGG AACAAAGTCTGGCCTGTATCCA Srebp-1c GGAAGCTGTCGGGGTAGCGTC CATGTCTTCAAATGTGCAATCCAT
SUPPLEMENTARY FIGURES
 SUPPLEMENTARY FIGURES 1 Supplementary Figure 1, Adult hippocampal QNPs and TAPs uniformly express REST a-b) Confocal images of adult hippocampal mouse sections showing GFAP (green), Sox2 (red), and REST
Supplementary Figure 1 Validation of Per2 deletion in neuronal cells in N Per2 -/- mice. (a) Western blot from liver extracts of mice held under ad
 Western blot from liver extracts of mice held under ad") Supplementary Figure 1 Validation of Per2 deletion in neuronal cells in N Per2 -/- mice. (a) Western blot from liver extracts of mice held under ad libitum conditions detecting PER2 protein in brain and
Supplementary Figure 1 Validation of Per2 deletion in neuronal cells in N Per2 -/- mice. (a) Western blot from liver extracts of mice held under ad libitum conditions detecting PER2 protein in brain and
Supplemental Figure 1. (A) The localization of Cre DNA recombinase in the testis of Cyp19a1-Cre mice was detected by immunohistchemical analyses
 The localization of Cre DNA recombinase in the testis of Cyp19a1-Cre mice was detected by immunohistchemical analyses") Supplemental Figure 1. (A) The localization of Cre DNA recombinase in the testis of Cyp19a1-Cre mice was detected by immunohistchemical analyses using an anti-cre antibody; testes at 1 week (left panel),
Supplemental Figure 1. (A) The localization of Cre DNA recombinase in the testis of Cyp19a1-Cre mice was detected by immunohistchemical analyses using an anti-cre antibody; testes at 1 week (left panel),
Obesity in aging: Hormonal contribution
 Obesity in aging: Hormonal contribution Hormonal issues in obesity and aging Hormonal role in regulation of energy balance Genetic component in hormonal regulation Life style contribution to hormonal changes
Leptin Intro/Signaling. ATeamP: Angelo, Anthony, Charlie, Gabby, Joseph
 Leptin Intro/Signaling ATeamP: Angelo, Anthony, Charlie, Gabby, Joseph Overview Intro to Leptin Definition & Sources Physiology Bound vs. Free Receptors Signaling JAK/STAT MAPK PI3K ACC Experimental findings
SUPPLEMENTARY INFORMATION
 DOI:.38/ncb3399 a b c d FSP DAPI 5mm mm 5mm 5mm e Correspond to melanoma in-situ Figure a DCT FSP- f MITF mm mm MlanaA melanoma in-situ DCT 5mm FSP- mm mm mm mm mm g melanoma in-situ MITF MlanaA mm mm
Supplementary legends
 Supplementary legends Supplemental figure S1. Apelin-TAMRA is functional and induces apelin receptor internalization. HEK-293T cells transiently expressing YFP tagged APJ were incubated for 1 hour with:
Quantitative Real-Time PCR was performed as same as Materials and Methods.
 Supplemental Material Quantitative Real-Time PCR Quantitative Real-Time PCR was performed as same as Materials and Methods. Expression levels in the aorta were normalized to peptidylprolyl isomerase B
Supplementary Figure 1: STAT3 suppresses Kras-induced lung tumorigenesis
 Supplementary Figure 1: STAT3 suppresses Kras-induced lung tumorigenesis (a) Immunohistochemical (IHC) analysis of tyrosine 705 phosphorylation status of STAT3 (P- STAT3) in tumors and stroma (all-time
Title: Smooth muscle cell-specific Tgfbr1 deficiency promotes aortic aneurysm formation by stimulating multiple signaling events
 Title: Smooth muscle cell-specific Tgfbr1 deficiency promotes aortic aneurysm formation by stimulating multiple signaling events Pu Yang 1, 3, radley M. Schmit 1, Chunhua Fu 1, Kenneth DeSart 1, S. Paul
Neonatal ghrelin programs development of hypothalamic feeding circuits
 RESEAR CH AR TICLE Neonatal ghrelin programs development of hypothalamic feeding circuits Sophie M. Steculorum, 1,2 Gustav Collden, 2 Berengere Coupe, 1 Sophie Croizier, 1,2 Sarah Lockie, 3 Zane B. Andrews,
Supplementary Figure 1. DJ-1 modulates ROS concentration in mouse skeletal muscle.
 Supplementary Figure 1. DJ-1 modulates ROS concentration in mouse skeletal muscle. (a) mrna levels of Dj1 measured by quantitative RT-PCR in soleus, gastrocnemius (Gastroc.) and extensor digitorum longus
BIOL212 Biochemistry of Disease. Metabolic Disorders - Obesity
 BIOL212 Biochemistry of Disease Metabolic Disorders - Obesity Obesity Approx. 23% of adults are obese in the U.K. The number of obese children has tripled in 20 years. 10% of six year olds are obese, rising
Genotype analysis by Southern blots of nine independent recombinated ES cell clones by
 Supplemental Figure 1 Selected ES cell clones show a correctly recombined conditional Ngn3 allele Genotype analysis by Southern blots of nine independent recombinated ES cell clones by hybridization with
Ghrelin mediates stressinduced. behavior in mice. Chuang et al 2011 L3: Love, Lust, Labor
 Ghrelin mediates stressinduced food-reward behavior in mice Chuang et al 2011 L3: Love, Lust, Labor Agenda Introduction What is Ghrelin? Previous Models New model Methods Results Discussion Conclusion
Supplementary Figure S I: Effects of D4F on body weight and serum lipids in apoe -/- mice.
 Supplementary Figures: Supplementary Figure S I: Effects of D4F on body weight and serum lipids in apoe -/- mice. Male apoe -/- mice were fed a high-fat diet for 8 weeks, and given PBS (model group) or
Supplemental Table 1: Demographics and characteristics of study participants. Male, n (%) 3 (20%) 6 (50%) Age, years [mean ± SD] 33.3 ± ± 9.
![Supplemental Table 1: Demographics and characteristics of study participants. Male, n (%) 3 (20%) 6 (50%) Age, years [mean ± SD] 33.3 ± ± 9.](/thumbs/90/103696086.jpg "Supplemental Table 1: Demographics and characteristics of study participants. Male, n (%) 3 (20%) 6 (50%) Age, years [mean ± SD] 33.3 ± ± 9.") SUPPLEMENTAL DATA Supplemental Table 1: Demographics and characteristics of study participants Lean (n=15) Obese (n=12) Male, n (%) 3 (20%) 6 (50%) Age, years [mean ± SD] 33.3 ± 9.5 44.8 ± 9.1 White, n
SUPPLEMENTAL DATA Supplemental Table 1: Demographics and characteristics of study participants Lean (n=15) Obese (n=12) Male, n (%) 3 (20%) 6 (50%) Age, years [mean ± SD] 33.3 ± 9.5 44.8 ± 9.1 White, n
Internal Regulation II Energy
 Internal Regulation II Energy Reading: BCP Chapter 16 lookfordiagnosis.com Homeostasis Biologically, what is necessary for life is a coordinated set of chemical reactions. These reactions take place in
EPIGENETIC RE-EXPRESSION OF HIF-2α SUPPRESSES SOFT TISSUE SARCOMA GROWTH
 EPIGENETIC RE-EXPRESSION OF HIF-2α SUPPRESSES SOFT TISSUE SARCOMA GROWTH Supplementary Figure 1. Supplementary Figure 1. Characterization of KP and KPH2 autochthonous UPS tumors. a) Genotyping of KPH2
Supplementary Figure 1: Kv7 currents in neonatal CA1 neurons measured with the classic M- current voltage-clamp protocol.
 Supplementary Figures 1-11 Supplementary Figure 1: Kv7 currents in neonatal CA1 neurons measured with the classic M- current voltage-clamp protocol. (a), Voltage-clamp recordings from CA1 pyramidal neurons
Supplementary Figure 1: si-craf but not si-braf sensitizes tumor cells to radiation.
 Supplementary Figure 1: si-craf but not si-braf sensitizes tumor cells to radiation. (a) Embryonic fibroblasts isolated from wildtype (WT), BRAF -/-, or CRAF -/- mice were irradiated (6 Gy) and DNA damage
Supplementary Figure 1
 Combination index (CI) Supplementary Figure 1 2. 1.5 1. Ishikawa AN3CA Nou-1 Hec-18.5...2.4.6.8 1. Fraction affected (Fa) Supplementary Figure 1. The synergistic effect of PARP inhibitor and PI3K inhibitor
Hypoxia-Inducible Factor Directs POMC Gene to Mediate Hypothalamic Nutrient Sensing and. Energy Balance Regulation.
 Hypoxia-Inducible Factor Directs POMC Gene to Mediate Hypothalamic Nutrient Sensing and Energy Balance Regulation By Hai (Chuck) Zhang A dissertation submitted in partial fulfillment of the requirements
Royal jelly improves mental health
 6 Apimedica & 5 Apiquality International Symposium, Nov., 2016 Royal jelly improves mental health Noriko Hattori, and Nagaragawa research center, email: ichihara-kenji@api3838.co.jp 1 Royal jelly is a
Supplemental Tables and Figures. The metalloproteinase-proteoglycans ADAMTS7 and ADAMTS12 provide an innate,
 Supplemental Tables and Figures The metalloproteinase-proteoglycans ADAMTS7 and ADAMTS12 provide an innate, tendon-specific protective mechanism against heterotopic ossification Timothy Mead et al Supplemental
Supplementary Figure 1 Expression of Crb3 in mouse sciatic nerve: biochemical analysis (a) Schematic of Crb3 isoforms, ERLI and CLPI, indicating the
 Schematic of Crb3 isoforms, ERLI and CLPI, indicating the") Supplementary Figure 1 Expression of Crb3 in mouse sciatic nerve: biochemical analysis (a) Schematic of Crb3 isoforms, ERLI and CLPI, indicating the location of the transmembrane (TM), FRM binding (FB)
Supplementary Figure 1 Expression of Crb3 in mouse sciatic nerve: biochemical analysis (a) Schematic of Crb3 isoforms, ERLI and CLPI, indicating the location of the transmembrane (TM), FRM binding (FB)
Insights from Rare Obesity Disorders
 Insights from Rare Obesity Disorders Ashley Shoemaker, MD, MSCI Ian M. Burr Division of Pediatric Endocrinology and Diabetes Disclosures Research funding: Zafgen, AstraZeneca, Rhythm Member, Zafgen Hypothalamic
SUPPLEMENTARY INFORMATION
 DOI: 10.1038/ncb2988 Supplementary Figure 1 Kif7 L130P encodes a stable protein that does not localize to cilia tips. (a) Immunoblot with KIF7 antibody in cell lysates of wild-type, Kif7 L130P and Kif7
Targeting of the circadian clock via CK1δ/ε to improve glucose homeostasis in obesity
 Targeting of the circadian clock via CK1δ/ε to improve glucose homeostasis in obesity Peter S. Cunningham, Siobhán A. Ahern, Laura C. Smith, Carla S. da Silva Santos, Travis T. Wager and David A. Bechtold
Supplementary Information
 Supplementary Information GADD34-deficient mice develop obesity, nonalcoholic fatty liver disease, hepatic carcinoma and insulin resistance Naomi Nishio and Ken-ichi Isobe Department of Immunology, Nagoya
Hypothalamic Autophagy and Regulation of Energy Balance
 Hypothalamic Autophagy and Regulation of Energy Balance Rajat Singh, MD Albert Einstein College of Medicine New York NuGOweek 211 Sept 6-9, 211 Autophagy Evolutionarily conserved cellular recycling program
Fig. S1. Weight of embryos during development. Embryos are collected at different time points (E12.5, E14.5, E16.5 and E18.5) from matings between
 from matings between") Fig. S1. Weight of embryos during development. Embryos are collected at different time points (E12.5, E14.5, E16.5 and E18.5) from matings between Myod +/ or Myod / females and Myod +/ ;Igf2 +/ males and
Fig. S1. Weight of embryos during development. Embryos are collected at different time points (E12.5, E14.5, E16.5 and E18.5) from matings between Myod +/ or Myod / females and Myod +/ ;Igf2 +/ males and
SOPten flox/flox (KO) Pten flox/flox (WT) flox allele 6.0 kb. Pten. Actin. ! allele 2.3 kb. Supplementary Figure S1. Yanagi, et al.
 Pten flox/flox (WT) flox allele 6.0 kb. Pten. Actin. ! allele 2.3 kb. Supplementary Figure S1. Yanagi, et al.") s1 A Pten flox/flox () SOPten flox/flox () flox allele 6. kb B Pten flox/flox () SOPten flox/flox () Pten Actin! allele 2.3 kb Supplementary Figure S1. Yanagi, et al. A B BrdU BrdU positive cells ( ) 3
s1 A Pten flox/flox () SOPten flox/flox () flox allele 6. kb B Pten flox/flox () SOPten flox/flox () Pten Actin! allele 2.3 kb Supplementary Figure S1. Yanagi, et al. A B BrdU BrdU positive cells ( ) 3