The digital copy of this thesis is protected by the Copyright Act 1994 (New Zealand).
|
|
|
- Cuthbert Burke
- 6 years ago
- Views:
Transcription
1 Copyright Statement The digital copy of this thesis is protected by the Copyright Act 1994 (New Zealand). This thesis may be consulted by you, provided you comply with the provisions of the Act and the following conditions of use: Any use you make of these documents or images must be for research or private study purposes only, and you may not make them available to any other person. Authors control the copyright of their thesis. You will recognise the author's right to be identified as the author of this thesis, and due acknowledgement will be made to the author where appropriate. You will obtain the author's permission before publishing any material from their thesis. To request permissions please use the Feedback form on our webpage. General copyright and disclaimer In addition to the above conditions, authors give their consent for the digital copy of their work to be used subject to the conditions specified on the Library Thesis Consent Form and Deposit Licence. Note : Masters Theses The digital copy of a masters thesis is as submitted for examination and contains no corrections. The print copy, usually available in the University Library, may contain corrections made by hand, which have been requested by the supervisor.
2 Promoting use-dependent plasticity to improve upper limb recovery after stroke Suzanne Jennifer Ackerley A thesis submitted in fulfilment of the requirements for the degree of Doctor of Philosophy in Sport and Exercise Science, The University of Auckland, 2011.
3 Abstract Motor recovery is a major factor influencing independence in everyday living after stroke. The objective of this dissertation was to explore two ways to promote use-dependent plasticity (UDP) to improve upper limb recovery after stroke. One approach was to adapt the delivery of training by incorporating auditory pacing. The specific aim was to augment UDP within the primary motor cortex (M1) by increasing synaptic efficacy through the synchronous arrival of auditory and sensorimotor input. Two cross-over, repeated-measures, studies were conducted in healthy adults. Training protocols consisted of simple, repetitive, upper limb movements that were either metronome-paced in synchrony or syncopation, selfpaced, or paced at a fast rate. Neurophysiological measures obtained with transcranial magnetic stimulation (TMS), and behavioural measures, were collected before and after training to evaluate UDP. The second approach was to prime M1 with theta burst stimulation (TBS) prior to training. The aim was to facilitate ipsilesional M1 excitability, and lower the threshold for UDP during subsequent training. TBS primed training was evaluated in two blinded, sham-controlled, repeated-measures studies in chronic subcortical stroke patients with upper limb impairment. In separate sessions, neurophysiological, behavioural, and clinical assessments were performed before and after precision grip training primed by one of three different TBS protocols (intermittent TBS, continuous TBS and sham TBS). A preliminary technical study was conducted to ensure the validity of the measure of sensorimotor integration used for the final study. Metronome-paced training at a comfortable speed improved synaptic efficacy within M1, as shown by selective facilitation of corticomotor excitability and altered kinematics of TMS-evoked movement that reflected the trained movement. Priming with intermittent TBS increased the receptiveness of ipsilesional M1 to afferent input and enabled stroke patients to i
4 engage in better quality motor training. Overall, this dissertation presents two clinically feasible approaches, auditory-paced training and TBS primed training to enhance UDP within a given therapy dose. Further clinical research is warranted to translate these promising novel approaches into rehabilitation practice. ii
5 Acknowledgements Firstly, I wholeheartedly thank my supervisor Professor Winston Byblow and co-supervisor Dr Cathy Stinear for their unwavering support. Winston and Cathy shared their vast knowledge, with patience and enthusiasm. They provided critical advice to help me achieve my goals. I dedicate this dissertation to my Dad and Mum, Paul and Rosemary Ackerley, who provided me with a wonderful childhood, continued support during my education and adulthood, and accompanied me through the journey of my PhD. I would like to express my sincere gratitude to the following people and organisations for their contributions: All of my participants who I admire for their motivation and dedication to help others by participating in health research. The Neurological Foundation of New Zealand for financial support, and also to The Maurice and Phyllis Paykel Trust. My advisors Professor Alan Barber, for his valuable overview, and Dr Samir Anwar. The staff and students of the Sport & Exercise Science Department. In particular, Lynley Bradnam, Dr James Coxon, Melanie Fleming, Fred Noten, Chelsea England, Hayley MacDonald and Phil Lacey who all provided assistance in numerous ways. To Denise Miller, Professor Ngaire Kerse, Linda and Mairi from University Health Services and Dr Dan Exeter for their assistance during data collection. To Dr Richard Doocey and the Haematology staff at Auckland City Hospital for their thorough treatment, care and compassion which enabled me to complete my PhD. My sisters Janine and Catherine and their families, for their unassuming generosity. I could not have completed this work without the support, camaraderie, and entertainment provided by my close friends, especially Kelly and Danny Phillips and Judy and Sam Walter. Lastly and importantly, I wish to thank my husband Daniel who has loved, cared and supported me, and for whom I fought to spend more time with. viii
6 Table of Contents Abstract... i Acknowledgements... viii List of Figures... xii List of Tables... xiii List of Abbreviations... xiv Chapter 1. INTRODUCTION... 1 Chapter 2. AN OVERVIEW OF THE CORTICAL SENSORIMOTOR SYSTEM The cortical motor system The cortical somatosensory system Sensorimotor integration... 9 Chapter 3. PLASTICITY Use-dependent plasticity (UDP) Proposed site and mechanisms of UDP Modulation of UDP in healthy adults Externally-paced movements Chapter 4. STROKE Recovery of brain function following stroke UDP after stroke Improving motor recovery following stroke using repetitive transcranial magnetic stimulation Chapter 5. TECHNICAL AND ETHICAL CONSIDERATIONS ix
7 5.1. Transcranial magnetic stimulation (TMS) Ethical considerations Chapter 6. THE EFFECT OF COORDINATION MODE ON USE-DEPENDENT PLASTICITY Abstract Introduction Methods Results Discussion Chapter 7. PROMOTING USE-DEPENDENT PLASTICITY WITH EXTERNALLY- PACED TRAINING Abstract Introduction Methods Results Discussion Significance Chapter 8. COMBINING THETA BURST STIMULATION WITH TRAINING AFTER SUBCORTICAL STROKE Abstract Introduction Methods x
8 8.3. Results Discussion Chapter 9. HIGH INTENSITY TRANSCRANIAL MAGNETIC STIMULATION MASKS SHORT LATENCY AFFERENT INHIBITION Abstract Introduction Methods Results Discussion Chapter 10. PRIMING SENSORIMOTOR CORTEX TO ENHANCE TASK-SPECIFIC TRAINING AFTER SUBCORTICAL STROKE Abstract Introduction Methods Data reduction and statistical analysis Results Discussion Chapter 11. OVERVIEW AND FUTURE DIRECTIONS Appendices References xi
9 List of Figures Figure Figure Figure Figure Figure Figure Figure Figure Figure Figure Figure Figure Figure Figure Figure Figure Figure Figure Figure Figure Figure xii
10 List of Tables Table 4.1: Table 7.1: Table 8.1: Table 8.2: Table 9.1: Table 10.1: Table 10.2: Table 10.3: Table 10.4: Table 10.5: Table 10.6: Table 10.7: xiii
11 List of Abbreviations AMPA Alpha-amino-3-hydroxy-5-methyl-4-isoxazolepropionic acid AMT Active motor threshold APB Abductor pollicis brevis BDNF Brain-derived neurotrophic factor CIT Constraint-induced therapy CoG Centre of gravity CST Corticospinal tract EMG Electromyography fmri Functional magnetic resonance imaging FDI First dorsal interosseous GABA Gamma-amino-butyric acid Hz Hertz imeps Ipsilateral motor evoked potentials ICF Intracortical facilitation LTD Long-term depression LTP Long-term potentiation M1 Primary motor cortex MEP Motor evoked potential xiv
12 NMDA N-methyl-D-aspartate PMC Premotor cortex; PMd (dorsal region) and PMv (ventral region) RM-ANOVA Repeated-measures analysis of variance RMT Rest motor threshold rtms Repetitive transcranial magnetic stimulation S1 Primary somatosensory cortex SAI Short latency afferent inhibition SICI Short-interval intracortical inhibition SEM Standard error of the mean SMA Supplementary motor area SNP Single nucleotide polymorphism tdcs Transcranial direct current stimulation TBS Theta burst stimulation; intermittent (itbs) and continuous (ctbs) TES Transcranial electrical stimulation TMS Transcranial magnetic stimulation UDP Use-dependent plasticity xv
13 Chapter 1. INTRODUCTION Whether it is a family member, friend, or colleague, most people know someone affected by stroke. In New Zealand, over 6,000 people have a stroke each year and at any given time there are approximately 45,000 people living with disability due to stroke (Tobias et al., 2007). Internationally this prevalence is similar, proportionally (Seshadri and Wolf, 2007, Strong et al., 2007). Motor impairment is common after stroke, and between 70 85% of patients have hemiparesis (Dobkin, 2004). Many who survive stroke are unable to use their affected arm in everyday activities, with about 70% requiring some form of assistance for self-care or activities of everyday living (Dobkin, 2005, Kwakkel et al., 2003, Tobias et al., 2007). Developing methods to improve upper limb motor recovery and promote independence are essential, and may minimise the burden of stroke. Neuroplasticity is the mechanism of reorganisation within the nervous system that involves the strengthening of existing, and the formation of new, synapses in response to experience (Boroojerdi et al., 2001a, Sanes and Donoghue, 2000). Plastic reorganisation of motor-related cortical regions achieved as a consequence of motor practice is referred to as use-dependent plasticity (UDP) (Boroojerdi et al., 2001a, Classen et al., 1998, Nudo et al., 1996). The study of cortical plasticity in the human population has been significantly advanced with the introduction of non-invasive brain stimulation techniques, such as transcranial magnetic stimulation (TMS) and neuroimaging methods including functional magnetic stimulation (fmri). TMS provides information about the functional integrity and excitability of the pathways from the primary motor cortex (M1) to muscles in the periphery at the moment of stimulation (Hallett, 2000, 2007). TMS studies that have investigated the excitability of M1 before and after performance of repetitive movements have facilitated our understanding of UDP (Ljubisavljevic, 2006). 1
14 UDP may be crucial for recovery after brain injury, and is a principle which underpins stroke rehabilitation (Richards et al., 2008). For example, upper limb therapy engages the patient in specific, repetitive training to reduce motor impairment and improve arm function (Schaechter, 2004). Many of the applied therapeutic approaches and interventions currently used for motor and sensory rehabilitation of patients are arbitrary, and not based on physiological research (Dobkin, 2005, Kollen et al., 2006). Knowledge of the pathophysiological consequences of stroke and the alterations of cortical excitability and activity in response to time and therapy is increasing (Kreisel et al., 2007, Ward et al., 2003a). It is important to capitalise on this emerging understanding of neurophysiology and cortical plasticity after stroke. A continued effort to increase our knowledge of the processes and mechanisms underlying M1 plasticity is essential to assist in establishing strategies to promote UDP and improve recovery of motor function after stroke. This thesis explored ways to promote UDP to improve upper limb recovery after stroke. A brief overview of the dissertation is as follows. The central theme of the literature review explores models of UDP in M1, in particular drawing on research that evaluates motor cortical excitability using magnetic stimulation techniques. Chapter 2 provides an overview of cortical sensorimotor control, commenting on sensorimotor integration during precision grip as this is particularly relevant to upper limb function after stroke. Chapter 3 reviews UDP and its proposed site, mechanisms, and modulation. The effect of externally-paced movements on UDP is explored. A review of UDP within the context of stroke recovery and rehabilitation is covered in Chapter 4. This chapter evaluates emerging brain stimulation protocols that can temporarily alter motor cortex excitability, and its potential role for improving upper limb recovery following stroke. The use of TMS is of particular relevance to this thesis, and technical and ethical considerations are summarised in Chapter 5. 2
15 The dissertation reports outcomes from five experiments, which examine approaches for promoting UDP. One approach involves adapting the delivery of motor training through the use of auditory pacing. The other approach investigates neurophysiological priming techniques to enhance cortical plasticity. The first and second experiments investigated the role of externally-paced motor training on UDP within M1 in healthy adults, using a cross-over, repeated-measures experimental design. First, the role of auditory pacing on the generation of UDP was investigated and is presented in Chapter 6. It was hypothesised that the pattern of external pacing during motor practice (i.e. synchronisation or syncopation) would be a powerful modulator of corticomotor excitability and TMS-evoked movement kinematics. In the second experiment, modulation of corticomotor excitability and the kinematics of TMSevoked movements produced by self-paced training were compared to those produced by training that was externally-paced with an auditory metronome (Chapter 7). Externally-paced motor practice was expected to increase resting corticomotor excitability in pathways mediating the trained movement and alter the kinematics of TMS-evoked movement toward the trained direction, to a greater extent than self-paced training. An alternative to adapting the delivery of training is to prime the brain before training. In my third study (Chapter 8), I asked can theta burst stimulation (TBS) prime the brain for a better response to upper limb training in chronic subcortical stroke patients? A blinded, cross-over, sham-controlled study was performed with patients who had upper limb impairment secondary to first-ever subcortical stroke. It was hypothesised that intermittent TBS of the ipsilesional M1, and continuous TBS of the contralesional M1, would transiently increase corticomotor excitability in the ipsilesional M1, creating a window for optimised UDP during precision grip training with the paretic upper limb. The findings from this study were extended in the final study (Chapter 10), which investigated the mechanisms underlying 3
16 the beneficial effects of TBS. One possible mechanism is improved cortical sensorimotor integration, which can be assessed by measuring short latency afferent inhibition (SAI). A preliminary study (Chapter 9) was conducted to investigate the relationship between short latency afferent inhibition (SAI), TMS intensity and motor evoked potential (MEP) amplitude, in healthy adults. This study was needed to ensure that SAI provided a valid means to evaluate sensorimotor integration before and after TBS and motor training, when modulation of corticomotor excitability was expected. The final experiment (Chapter 10) was a blinded, cross-over, sham-controlled study with patients with upper limb impairment after first mono-hemispheric stroke. It was hypothesised that intermittent TBS of ipsilesional M1, and continuous TBS of contralesional M1, would facilitate ipsilesional corticomotor excitability and enhance grip-lift performance with motor training. It was also hypothesised that ipsilesional sensorimotor integration would be facilitated after TBS and motor training, as indicated by measures of SAI. The possibility that the response to TBS and motor training could be blunted in patients with a common single nucleotide polymorphism (SNP) in the gene for brain derived neurotrophic factor (BDNF) was also explored. The results of this study have potential clinical implications, as the combination of TBS and motor training may enhance UDP and motor recovery after stroke. In summary, there is a rising burden of stroke-related disability and increasing pressure on health care services. To streamline rehabilitation delivery we need to develop novel methods for enhancing plasticity and improving the efficacy of rehabilitation. The research contained in this dissertation explores novel approaches to promote UDP to improve outcomes after stroke. 4
17 Chapter 2. AN OVERVIEW OF THE CORTICAL SENSORIMOTOR SYSTEM 2.1. The cortical motor system The motor system consists of the central and peripheral nervous system and muscles of the body. The cortex is the highest level of sensorimotor control. The motor cortex is divided into several distinct regions including M1, premotor cortex (PMC), the supplementary motor area (SMA) and the cingulate motor area. The subcortical structures, the cerebellum and basal ganglia, provide feedback circuits that regulate motor cortical output. M1 integrates complex input from multiple motor and non-motor regions of the brain and is regarded as the main motor output point of the brain for voluntary movement. M1 is located in the precentral gyrus of the frontal lobe. Traditionally, M1 has been portrayed somatotopically with the leg, trunk, arm, head and face being depicted medial to lateral (Penfield and Boldrey, 1937). This homunculus arrangement suggested a systematic, spatial arrangement where representations within M1 for each body part occupied orderly and nonoverlapping cortical space (Sanes and Donoghue, 2000). More recent data utilising contemporary methods have built on this view. Studies indicate that the mostly separate representations of individual larger body parts (head, upper limb, trunk and lower limb) are segregated into functional subregions (Sanes and Donoghue, 2000, Sanes and Schieber, 2001, Schieber, 2001). Representations of the smaller body parts are multiple, widely distributed and overlapping within these subregions (Schieber, 2001). For example, within the cortex devoted to the representations of the upper limb there is no clear delineation of movements of the shoulder, elbow, forearm, wrist or individual fingers, they intermingle in a mosaic type pattern (Nudo et al., 1996, Nudo et al., 2001). Functional aspects of movement such as 5
18 direction and velocity, are also cortically represented (Georgopoulos et al., 1986, Reina et al., 2001, Z'Graggen et al., 2009). M1 consists of six distinct layers containing both pyramidal and non-pyramidal cells. When depolarised, pyramidal neurons with their cell bodies arising from layer V of the motor cortex transmit an action potential to the spinal cord via the corticospinal tract (CST) (Kandel et al., 2000). Approximately half the fibers that comprise the CST are contributed by M1, with the remaining fibers arising from secondary motor areas, the primary somatosensory cortex (S1) and the posterior parietal cortex. Most CST fibers decussate at the level of the medulla and travel down the spinal cord on the contralateral side of the body before synapsing onto alpha motor neurons that project to skeletal muscle. Pyramidal neurons in separate M1 representations and subregions can converge onto the same alpha motor neuron. Furthermore, a pyramidal neuron exhibits divergent properties enabling it to project onto the alpha motor neurons controlling multiple muscles, supporting synergistic muscle activation. In the upper limb, a large proportion of the monosynaptic corticomotor pathway terminate in the distal musculature (Palmer and Ashby, 1992). In addition, pyramidal neurons have horizontal axon collaterals that can form connections with other pyramidal neurons at a cortical level to aid in synchronising firing patterns. Pyramidal neurons release glutamate (an excitatory amino acid) as their primary neurotransmitter, which acts mainly through N- methyl-d-aspartate (NMDA) and alpha-amino-3-hydroxy-5-methyl-4-isoxazolepropionic acid receptors (AMPA) receptors on the cell membrane surface (Kandel et al., 2000). Nonpyramidal cells (i.e. interneurons) generally arise within the more superficial layers of the cortex, many with their axons orientated horizontally in the plane of the cortical layers (Kandel et al., 2000). These local interneurons can exert inhibitory or excitatory influence on pyramidal neurons. Inhibitory interneurons use the neurotransmitter gamma-amino-butyric acid (GABA). It is thought that communication between movement and/or muscle 6
19 representations occurs within this extensive horizontal intracortical interneuron circuitry (Nudo et al., 2001). The complex interactions between pyramidal neurons and intracortical interneurons facilitate highly specific motor control during functional tasks. Communication between M1 and other cortical areas is essential for motor control. Within the ipsilateral hemisphere, M1 receives input from both dorsal and ventral components of the PMC (PMd and PMv respectively), SMA and the cingulate motor areas (Gerloff et al., 1998a, Reis et al., 2008a). These motor areas are integral in the planning and preparation of movement. M1 also receives input from ipsilateral non-motor regions including S1, secondary somatosensory areas, and the basal ganglia and cerebellum via the thalamus (Reis et al., 2008a). In particular, the basal ganglia are major contributors to the initiation and maintenance of movement, providing internally generated feedback to M1 via basal ganglia-thalamocortical motor circuits (Groenewegen, 2003, Jueptner and Weiller, 1998). There is substantial evidence that communication exists between homologous M1 representations (Daskalakis et al., 2002, Ferbert et al., 1992, Hanajima et al., 2001), operating through fibers that span the corpus callosum (Boroojerdi et al., 1996). Finally, M1 receives input from the contralateral PMC. This complex interhemispheric communication may occur via PMC-PMC-M1 and/or PMC-M1-M1 pathways (Dum and Strick, 2005, Marconi et al., 2003). Interhemispheric pathways undergo maturation during childhood and this contributes to improving bimanual coordination of the upper limbs during development (Fagard et al., 2001). With advancing age, interhemispheric inhibition acting on the ipsilateral M1 to movement diminishes (Talelli et al., 2008a). Additional activation of ipsilateral M1 and bilateral premotor areas may act to compensate for reduced contralateral M1 output to maintain functional motor performance in late-adulthood (Talelli et al., 2008b). 7
20 2.2. The cortical somatosensory system The somatosensory system processes the four main modalities of sensation; discriminative touch (touch, pressure and vibration), proprioception (position sense), pain and temperature. When receptors located in the skin, muscles, joints and internal organs are activated by stimuli, action potentials are generated in sensory neurons and transmitted to the spinal cord. Afferent signals ascend the spinal cord within the dorsal column (medial lemniscus) and spinothalamic systems, which terminate in the thalamus (Kandel et al., 2000). Third order neurons in the thalamus transmit afferent information to the somatosensory cortex through the internal capsule and corona radiata. In parallel, proprioceptive information is relayed to the ipsilateral cerebellum through the spinocerebellar tract (Jueptner and Weiller, 1998). The somatosensory cortex is divided into three regions; the primary (S1) and secondary (S2) somatosensory cortices, and the posterior parietal cortex. In humans, these regions have been investigated with electrical stimulation, during surgery with exposure of the cortical surface (Woolsey et al., 1979). S2 and the posterior parietal cortex have dense connections with S1 and with premotor areas (Kandel et al., 2000). S2 is located in the parietal operculum, and is activated in response to sensations including pain and light touch (Eickhoff et al., 2006a, Eickhoff et al., 2006b). The posterior parietal cortex lies behind S1 and plays a role in the localisation of the body in relation to external objects. This dissertation mainly focuses on S1, which is situated within the post central gyrus in the parietal lobe, behind and across the central sulcus from M1. It consists of four anatomical areas; Brodmann areas 3a, 3b, 1 and 2. Like M1, large body parts are represented somatotopically within each subdivision of S1 (Kaas, 1991). Areas of the body with the greatest discriminative capability, such as the face and hands, have the largest S1 cortical representations. Each subdivision processes different types of sensory information. 8
21 Proprioceptive information from muscles and joints is represented in area 3a and further processed in area 2, whereas touch discrimination is represented in areas 3b and 1. S1 can influence motor execution via its direct influence on M1, or on motor planning via S1-S2- PMC projections (Kandel et al., 2000) Sensorimotor integration Voluntary activity requires coordinated interaction between sensory and motor systems. Sensorimotor integration is the process by which sensory information from the periphery is integrated in the central nervous system to shape descending motor commands. The somatosensory cortex, secondary motor areas, and the basal ganglia and cerebellum have crucial roles in influencing M1 before (i.e. feedforward) and during (i.e. feedback) movement execution (Seidler et al., 2004). Feedforward motor control is an anticipatory mechanism that supports postural control and coordinated movement (Desmurget and Grafton, 2000). Feedforward control relies on information gained from the sensory systems prior to movement initiation, for example knowledge of how the body is positioned. The study of people with impaired sensorimotor coordination, such as Parkinsons Disease patients (Abbruzzese and Berardelli, 2003), has provided significant insight into how sensorimotor integration is achieved in healthy adults. Feedback control depends on the integration of afference with the descending motor command, at multiple levels including S1. It is necessarily slower than feedforward control. After movement has commenced, cutaneous receptors and muscle spindles in the periphery provide critical feedback to modify task performance. Errors are detected and corrected during the course of ongoing movement. Optimal movement typically requires a combination of feedforward and feedback control (Desmurget and Grafton, 2000). 9
22 Adequate sensorimotor coordination is essential for performing dexterous upper limb movements. For example, lifting an object with a precision grip between the thumb and the index finger requires the use of appropriate forces to prevent slipping of the object or excessive forces that might damage it (Johansson and Westling, 1984). M1 and S1 have different roles in the performance of precision grip-lift. M1 has a major role in the anticipatory (i.e. feedforward) control of grip force scaling once the object s properties are familiar (Seidler et al., 2004). When a load is to be lifted the motor system estimates the grip and load force needed on the basis of previous experience. Sensory signals arising from contact with the object are integrated to enable adjustment of ongoing motor output (i.e. feedback control) (Schabrun et al., 2008). The contribution of sensory processing to sensorimotor control during pinch grip has been demonstrated in studies where grip is evaluated in the presence of cutaneous anaesthesia (Johansson and Westling, 1984, Nowak et al., 2001). These studies have shown that cutaneous afferent information contributes to adaptation of grip and load forces to enable coordinated grip control. In patients with pure sensory deficit, grip dysfunction can be present despite no limitations in motor ability (Smania et al., 2003). Furthermore, grip performance can be improved with practice incorporating sensory retraining (Smania et al., 2003). The important role of tactile discrimination in grip formulation was demonstrated in patients with combined sensory and motor deficit, where the contribution of sensory input was determined by controlling for vision and motor components of grip (Blennerhassett et al., 2007). Together these studies highlight the importance of somatosensory feedback to the development and maintenance of efficient grip. After lesions involving the CST, such as stroke, sensorimotor integration can become impaired and there is a greater reliance on feedback control (McDonnell et al., 2006). In health, there is a brief delay (~ ms) as grip is established prior to lift-off (i.e. preload 10
23 duration) (Duque et al., 2003, Johansson and Westling, 1984, Nowak et al., 2003). Stroke patients exhibit excessive preload duration (~ 600 ms) with the paretic hand compared with the nonparetic hand (~ 250 ms) (McDonnell et al., 2006). Likewise, the amount of downward force applied to the object prior to lift (i.e. preload force) is approximately doubled in the paretic (-0.64 N) relative to the nonparetic (-0.30 N) hand. Increasing preload force and duration may increase cutaneous sensory input and allow more time for this sensory information to be used for feedback control, as a compensatory strategy for impaired feedforward mechanisms after stroke. It is worthwhile noting that measures of grip-lift kinetics for the nonparetic are greater than those of healthy adults, indicating that the nonparetic hand is not unaffected by the stroke. 11
24 Chapter 3. PLASTICITY The term plasticity commonly refers to the ability of the nervous system to change in structure or function in response to a variety of internal and external pressures (Boroojerdi et al., 2001a, Nudo et al., 2001, Sanes et al., 1990, Sanes and Donoghue, 2000). Although the central nervous system has a limited capacity to regenerate, accumulating evidence indicates that the adult brain undergoes dynamic change throughout life (Ljubisavljevic, 2006). These plastic adaptations occur at synaptic, cellular, network and systems levels, naturally due to experience and also in response to specific injury or disease (Nudo, 2006, Ward, 2005). Plasticity has been studied within different cortical regions using a variety of techniques. The somatosensory cortex was one of the first areas where the potential for reorganisation was recognised. Dramatic changes in S1 map organisation have been observed in animal models after deafferentation, digital fusion and electrical peripheral nerve stimulation (for a review, see Kaas, 1991). In humans, S1 reorganisation has also been demonstrated after deafferentation from peripheral nerve injury, including amputation of the upper limb (Elbert et al., 1994, Yang et al., 1994). Using MRI techniques, cortical expansion of the representation of the digits of the left hand has been observed in musicians who play the violin, or other string instruments (Elbert et al., 1995). Expansion was not seen in representations of the right hand, which does not require as much precise digital control during recital. Of interest, the degree of the expansion was correlated with the number of years playing the instrument. This indicates long-term experience-dependent reorganisation of the somatosensory cortex. Plasticity within the motor system has also been investigated in numerous studies. Reorganisation of M1 has been demonstrated in both animal and human experiments after 12
25 peripheral or central injuries, such as limb amputation (Cohen et al., 1991, Hall et al., 1990, Sanes et al., 1990), spinal cord injury (Topka et al., 1991) and stroke (Cicinelli et al., 1997, Liepert et al., 2000a, Traversa et al., 1997). Representational maps in the motor cortex can also be altered by a variety of temporary manipulations, including deafferentation (Brasil- Neto et al., 1993, Donoghue et al., 1990, Sanes et al., 1990) and pharmacological agents (Jacobs and Donoghue, 1991). Motor cortex organisation is also modified by motor activity or use (Boroojerdi et al., 2001b, Classen et al., 1998, Nudo et al., 1996). This form of plasticity, where repetitive movement leads to cortical reorganisation of functionally relevant representations within M1, is commonly referred to as use-dependent plasticity (UDP) Use-dependent plasticity (UDP) Use-dependent alterations in M1 representations were first studied during behavioural training of non-human primates (Nudo et al., 1996). In this seminal experiment, a small sample of squirrel monkeys was trained in a pellet retrieval task for 30 minutes twice daily for at least 11 days. This task required fine control of the forepaw to manipulate the pellet from a well. Intracortical microstimulation techniques, which involve passing low levels of current through the tips of microelectrodes that penetrate the cortex (Nudo et al., 1990), were used to create detailed maps of cortical representations of muscles and movements in the M1. These maps revealed an expansion of the digit representation at the expense of the wrist/forearm representation. In contrast, a single monkey trained in a forearm training task, involving repetitive supination and pronation of the forelimb, showed an enlargement of the wrist/forearm representation and a contraction of the digit representation. These results indicated that repetitive movement training resulted in specific cortical M1 reorganisation. 13
26 Evidence that UDP within M1 occurs in humans has accumulated since the introduction of non-invasive brain stimulation techniques. UDP within M1 can transpire as a rapid consequence of motor-reinforcement (within minutes or hours) as well as over days, weeks or even years, described in the following sections. Motor system reorganisation has been demonstrated after extensive practice of specific skills. A classic example of this is illustrated in competitive sportspeople. In racquet players, hours of practice are necessary to maintain and improve their skills, which require precise movements of the hand in combination with powerful movements generated by the forearm and shoulder. In 2000, Pearce et al. (2000) found that the motor cortical representation of the first dorsal interosseous (FDI) muscle in elite badminton players was laterally displaced toward the representation for elbow and shoulder, compared to untrained players and non-players (Pearce et al., 2000). Similar long-term effects of motor skills have been observed in Braille readers (Pascual-Leone et al., 1993). The FDI muscle in the reading hand produces the sweeping action of the index finger over the Braille letters. Expansion of the FDI representation in M1 contralateral to their reading hand was demonstrated in proficient Braille readers (reading 5-10 h/day) at the expense of the other fingers (Pascual- Leone et al., 1993). No significant change was observed in the non-reading hand, or in control subjects (reading < 1 h/day). These studies indicate task-specific reorganisation occurs within M1 during long-term training and this is related to the amount of practice. Complementary evidence has emerged demonstrating UDP in response to experimental protocols of prolonged training. After 4 weeks of daily practice, performance of a complex four-finger tapping sequence resulted in greater activation of the M1 hand representation, detected with fmri, than performance of a comparable but unpracticed sequence (Karni et al., 1995). Increased M1 activation was accompanied by improvement in task performance (accuracy and speed). In agreement, progressive expansion of the M1 14
27 representation for the long finger flexor and extensor muscles was observed using TMS after several days of training a specific sequence on a piano (Pascual-Leone et al., 1995). A concurrent reduction in key pressing and sequence errors was seen, but not formally correlated with measures of corticomotor excitability. Of interest, in an additional experiment these authors showed that mental practice alone was sufficient to promote similar modulation of corticomotor excitability (Pascual-Leone et al., 1995). These observations are supported by studies showing that motor imagery engages the same networks within M1 as voluntary motor activity (Stephan et al., 1995, Stinear and Byblow, 2003a, 2004a). Together these findings indicate both actual and imagined voluntary activity may induce UDP. Plasticity can also occur within the motor system quickly and transiently (Brasil-Neto et al., 1993, Jacobs and Donoghue, 1991). In humans, two established experimental protocols have demonstrated rapid neural plasticity following short-term training. One protocol involves the performance of brisk, paired movements of two body parts over a relatively short training period (Liepert et al., 1999, Tegenthoff et al., 1999). Using TMS, interactions between separate representations within M1 are evaluated by measuring shifts in the centre of gravity (CoG) of each movement representation. After training, there is displacement of the CoG of one cortical representation toward the other, but only when training movements are performed synchronously and not when performed asynchronously. These results demonstrate that training performed synchronously leads to greater overlapping of the representations for the two trained movements. A second protocol investigates cortical reorganisation within M1 after isolated, repetitive thumb movements by measuring changes in the direction of TMS-evoked thumb movements. Classen et al. (1998) measured the baseline direction of TMS-evoked thumb movements using an accelerometer mounted on the proximal phalanx of the thumb. Subjects then performed unidirectional thumb movements for 30 minutes, paced by a metronome at 1 15
28 Hz, in a direction that was 180 degrees to their baseline direction. After training, movements elicited by TMS had changed toward that of the trained direction for minutes, before slowly returning to the original direction (Classen et al., 1998). Researchers using this paradigm commonly compare the proportion of TMS-evoked thumb movements that occur in the trained direction (target training zone, TTZ = trained direction ± 20 ) before and after short-term training as a means of assessing UDP (Bütefisch et al., 2000, Bütefisch et al., 2002, Bütefisch et al., 2004, Foster et al., 2006, Meintzschel and Ziemann, 2006, Sawaki et al., 2002a). However, defining UDP as an increase in TMS-evoked thumb movements in a narrow training zone (TTZ) has the potential disadvantage of missing small training-induced changes in the direction of TMS-induced thumb movements (Meintzschel and Ziemann, 2006). These protocols have been successfully used to show that short-term training can result in rapid reorganisation within the motor cortex. Facilitation of corticomotor excitability has also been interpreted as a marker of UDP after short-term training. However, kinematic measures of UDP have been accompanied by an increase or a decrease in MEP amplitude of the training agonist (Meintzschel and Ziemann, 2006). The duration of training after-effects on kinematics and excitability also appear disparate. For example, Classen et al. (1998) found that the kinematic alterations in movement toward the trained direction were short-lasting compared to facilitation of the thumb corticomotor representation. This brings into question the relationship between kinematic measures and measures of excitability. Some studies have shown that changes in MEP amplitude are not closely linked to the magnitude of UDP (Bütefisch et al., 2002, Floel et al., 2005a). In contrast, systematic trial-by-trial equivalence (> 80%) was observed between angular deviation and the normalised MEP amplitude ratio of training agonist and antagonist muscles (Krutky and Perreault, 2007). Further evidence to support or refute the relationship between kinematic and corticomotor excitability measures of UDP is required, 16
29 and caution is needed when interpreting changes in MEP amplitude alone as evidence for UDP. In summary, TMS can allow researchers to investigate rapid cortical plasticity in humans. Established protocols may be used or modified to explore the site and mechanisms of UDP, and to evaluate methods of enhancing UDP Proposed site and mechanisms of UDP The site of UDP It has been proposed that the most likely site for UDP is at the cortex, rather than at the level of the brainstem or more distally within the spinal cord. Several approaches have been taken to examine the site of UDP including the use of transcranial electrical stimulation (TES), paired-pulse TMS and pharmacological studies. Classen et al. (1998) compared the assessment of UDP using TMS and TES techniques. TES produces more direct axonal activation of corticospinal neurons than TMS, therefore responses to TES should be less affected by training if UDP was occurring within the cortex via trans-synaptic mechanisms. It was found that thumb movements evoked by TES following training were altered to a significantly lesser extent than those evoked by TMS, thus indicating a cortical site for UDP. Using an alternate approach, Ziemann et al. (2001) examined the site of UDP using a measurement of intracortical excitability, which reflected synaptic efficacy of inhibitory and facilitatory intracortical circuitry. They used a paired pulse technique, which could provide more specific information on the site of UDP by measuring the excitability of intracortical interneurons within the superficial layers of the motor cortex. MEP amplitude itself cannot 17
30 be used to determine the site of UDP, as it reflects the excitability of the entire corticomotor pathway. In their study, Ziemann et al. (2001) observed a significant increase in intracortical facilitation under the condition that enhanced UDP (motor practice + ischaemic nerve block). It is worthwhile noting that these results were based on pooled data collected across three interstimulus intervals, 4, 10 and 15 ms. Although it is questionable to pool data over ISIs that produce both inhibitory and excitatory effects on MEP amplitude, this does not detract from their conclusion that UDP is likely to occur at a cortical level. A cortical site is further supported by studies that have used pharmacological interventions that act at a cortical level and shown modulation of UDP (Bütefisch et al., 2000, Tegenthoff et al., 1999, Ziemann et al., 2001). In summary, there is currently strong evidence to indicate a cortical site for UDP. Mechanistic studies of UDP strengthen this proposal and are discussed below The mechanisms underlying UDP Functional modifications in the cortex can occur within milliseconds and thus may provide the basis for rapid plasticity (Sanes and Donoghue, 2000). In contrast, morphological changes, such as synaptic remodelling, synaptogenesis and neurogenesis, take days to months for full expression and thus may provide for subsequent learning (Sanes and Donoghue, 2000). Animal research has shed light on how alterations in synaptic efficacy may underlie UDP. In rodents, synaptic efficacy within M1 can be altered bidirectionally in an activity dependent manner, through processes of long-term potentiation (LTP) and long-term depression (LTD) (Hess and Donoghue, 1994). LTP and LTD are broad terms that describe the direction of the alteration in synaptic strength. LTP was first demonstrated in mammalian hippocampal slices where it was shown that the coincidental activation of two or more excitatory pathways increase synaptic efficacy (Bliss and Lomo, 1973). This mechanism of 18
31 synaptic plasticity, whereby repeated and persistent depolarisation of the postsynaptic neuron by the presynaptic neuron results in augmented synaptic efficacy, conforms to Hebbian principles (Hebb, 1949). An opposite phenomenon, LTD, results in weakening of excitatory (or inhibitory) synapses (Abraham and Bear, 1996, Hess and Donoghue, 1996). The two necessary components of LTP and LTD are glutamate release from the presynaptic neuron and postsynaptic depolarisation (for a review, see Malenka and Bear, 2004). When glutamate is released into the synaptic cleft it binds with AMPA receptors on the postsynaptic membrane. The AMPA receptors open, which allows an influx of sodium into the postsynaptic neuron. This generates an excitatory postsynaptic current that depolarises the postsynaptic membrane. Glutamate binding and depolarisation are necessary for activation of the NMDA receptors that are also located in the postsynaptic membrane. Once the neuron is sufficiently depolarised, magnesium is expelled from the NMDA receptor, which then opens allowing the influx of sodium and importantly calcium (Ca 2+ ). A fast rate of Ca 2+ influx activates kinases and triggers a cascade of intracellular events that increase the density and conductance of AMPA receptors in the postsynaptic membrane, improving synaptic efficacy. In contrast, a slower influx of Ca 2+ activates phosphatases and triggers a cascade of events that decrease the density and conductance of AMPA receptors, reducing synaptic efficacy. Evidence from rodent studies indicates that LTP in M1 typically depends on activation of NMDA receptors in the postsynaptic membrane, and blocking these receptors prevents activity-dependent plasticity (Hess, 2004). The excitability of M1 corticospinal neurons is controlled via an extensive horizontal network of inhibitory interneurons (GABA interneurons) contained in the upper layers of M1 (Kandel et al., 2000). GABA interneurons act simultaneously with intracortical excitatory neurons, suppressing the excitatory neurons connections with M1 output neurons (i.e. feedforward inhibition) (Jacobs and Donoghue, 1991). The unmasking of horizontal excitatory 19
32 connections was first described by Jacobs and Donoghue, who showed that plastic reorganisation of the rodent motor cortex could be achieved through local injection of the GABA A receptor antagonist, Bicuculline (Jacobs and Donoghue, 1991). After administering this drug into the forelimb area, stimulation of the adjacent vibrissa representation resulted in forelimb movement. A rapid reduction in intracortical inhibition (ICI) and thus unmasking of intracortical excitatory interneurons was proposed to account for the observed reorganisation. A positive relationship between the unmasking of horizontal connections and induction of LTP was found by Hess and Donoghue (1994) using rodent cortical slice preparations. This animal research indicates the unmasking of latent horizontal connections through a decrease in GABAergic inhibition results in reorganisation of M1 representations. LTP has a role in strengthening unmasked connections, which leads to cortical reorganisation. Both LTP and UDP involve rapid changes in synaptic efficacy within the motor cortex (Classen et al., 1998, Hess and Donoghue, 1994, Tegenthoff et al., 1999). In addition, LTP relies on inputs converging onto the target postsynaptic membrane in temporal synchrony (Malenka, 2003). Similarly, use-dependent alterations require repetitive, persistent training regimes that provide temporally coincident inputs to the motor cortex (Nudo et al., 1996). These similarities indicate that UDP involves a LTP-like mechanism. Whilst in vitro animal studies have been used to explore the underlying mechanisms of plasticity at a cellular level, this approach is understandably limited in human research. Corroborative evidence in human populations has been accrued by studies utilising TMS. In 2000, Bütefisch et al. (2000) investigated the role of both NMDA receptor activation and GABAergic inhibition in UDP, using the thumb movement protocol. They demonstrated suppression of UDP (defined as a reduction in the proportion of TMS-evoked thumb movements in the trained direction) when subjects were pre-treated with the GABA A 20
33 receptor agonist Lorazepam, or the NMDA receptor antagonist Dextromethorphan, compared to placebo. Similar results have been observed using the paired movements protocol for investigating UDP (Tegenthoff et al., 1999). Displacement of the TMS-derived motor map of the abductor pollicis brevis (APB) CoG was no longer seen after training when subjects were pre-treated with Lorazepam. Furthermore, pre-treatment with the NMDA receptor antagonist Amantadine also reduced the CoG shift produced by training of paired movements. However, the latter finding was based on two subjects and needs to be validated with a larger group. These results support the idea that UDP relies on NMDA receptor and GABAergic mechanisms. The influence on UDP of administering agonists and antagonists for each of three neuromodulating transmitter systems (NE: norepinephrine, DA: dopamine, ACh: Acetylcholine) was examined by Meintzschel and Ziemann (2006). All antagonists resulted in a decrease in UDP, conversely all agonists enhanced it. The authors suggested that NMDA receptor activation and GABA-related processes were involved. This seems likely given the influence of these neuromodulating transmitter systems on the rate of ion flow into pre- and post-synaptic neurons. Evidence for an association between the modulation of GABAergic inhibition and UDP has also been provided by Teo et al. (2009). These researchers measured SICI before and after training, preceded with Lorazepam and Zolpidem, to investigate specific GABA circuits that may be responsible for use-dependent alterations of corticomotor excitability (Teo et al., 2009). The non-specific GABA A receptor antagonist Lorazepam, but not the GABA A -α 1 receptor agonist Zolpidem, increased SICI before training. Of note, this study showed an important correlation between the amount of SICI before training with subsequent use-dependent modulation of MEP amplitude. Subjects who had the largest increase in SICI after Lorazepam treatment had the smallest change in MEP amplitude after motor practice. 21
34 The dependence of UDP on GABAergic deactivation cannot be easily determined in humans, as administration of GABA antagonists is not advised. However, rapid reduction in GABAergic inhibition using deafferentation techniques has been related to enhancement of UDP, and indirectly to improvements in movement kinematics of the trained arm (Ziemann et al., 2001). This provides some evidence that a reduction in GABAergic neurotransmission has an important role in UDP in humans and may produce changes in movement behaviour, a finding of potential clinical relevance. The use of pharmacological interventions within UDP models has provided valuable confirmation in humans of the importance of GABA A disinhibition and NMDA receptor activation for LTP-like plasticity Modulation of UDP in healthy adults Endogenous differences in UDP Motor training does not elicit a change in TMS-evoked movements into the trained direction in a small proportion of volunteers. Some studies have taken advantage of this endogenous variability, by selecting participants most likely to respond to their experimental protocol. For example, studies which hypothesised that an intervention would depress UDP (Bütefisch et al., 2000, Sawaki et al., 2002a) have only recruited participants who demonstrated an increase in TMS-evoked movements into the trained direction within a separate inclusion experiment (i.e. had post-training TMS-evoked movements in the trained direction). Conversely, when it was predicted that an intervention may enhance UDP (Sawaki et al., 2002b) subjects that previously failed to show an increase in TMS-evoked movements into the trained direction were recruited. Whilst pre-selecting participants for 22
35 UDP experiments can increase the likelihood of detecting the effects of specific protocols, it also limits the generalisability of the results to the general population. Some of the endogenous factors affecting UDP are described below. There is an inverse correlation between age and the magnitude of UDP, predominantly in males (Rogasch et al., 2009, Sawaki et al., 2003). The underlying mechanisms are not known, however an age-related decrease in neurotransmitters involved in motor performance and sensory processing are thought to play a role (Sawaki et al., 2003). Age-related differences in UDP are unlikely to be due to altered intracortical inhibition. SICI is similar between young and old adults (Rogasch et al., 2009, Smith et al., 2009). Furthermore Rogasch et al. (2009) found disparate UDP, despite no modulation of SICI in either age group. In another study by the same authors, UDP could not be elicited in a chronic stroke population after motor training alone (Sawaki et al., 2006). The mean age of the stroke patients was 66.7 years, which may have influenced the development of UDP. Therefore, the possibility that younger stroke sufferers have the potential for this form of plastic reorganisation from motor training alone should not be dismissed. However, the control group, with a lower mean age (32.7 years) also did not demonstrate UDP. Instead these results highlight the fact that even in healthy young adults there is variability in the UDP produced by motor practice. Most studies have investigated UDP in response to training performed with the dominant hand. In 2010, Cirillo et al. explored hemispheric differences in the ability to generate UDP. They found increases in MEP amplitude were larger after thumb abduction training using the non-dominant hand. SICI modulation did not account for increased UDP in the non-dominant hemisphere. Again, SICI was not modulated significantly and not different between hemispheres, indicating that reduced resting SICI did not account for 23
36 increased UDP in the non-dominant hemisphere. Anatomical and other physiological differences between the left and right motor cortices may contribute (Hammond, 2002). UDP may be graded depending on the movement under investigation. In 2007, Krutky et al. (2007) investigated UDP in cortical representations of finger, wrist and elbow movements. They assessed UDP by measuring angular deviation ( ) from baseline after repetitive training involving the finger, wrist, or elbow. A graded effect of UDP from distal to proximal joints was demonstrated, with the largest angular deviation in TMS-evoked movements seen after repetitive finger training. Shifts in TMS-evoked movement after wrist training paralleled that of the finger, although were more variable and less persistent. Training of elbow movement did not significantly change the direction of TMS-evoked elbow movements. Distal muscles have a larger cortical representational area, and more direct monosynaptic projections from M1, compared to proximal muscles (Palmer and Ashby, 1992, Penfield and Boldrey, 1937, Wassermann et al., 1992). Further, TMS intensities required to evoke movement at more proximal muscles are typically higher than those used to evoke movement in distal musculature, which could confound measures of mechanical displacement at more proximal joints. These differences in the organisation of distal and proximal cortical representations may account for grading of UDP. A recent study identified that a single nucleotide polymorphism (SNP) at codon 66 in the gene encoding brain-derived neurotrophic factor (BDNF) may affect UDP (Kleim et al., 2006). This SNP results in methionine (Met) being encoded instead of valine (Val) in one (Val/Met) or both (Met/Met) copies of the gene. BDNF supports the survival, growth and synaptic transmission of several neuronal subtypes, including glutamatergic neurons (Barde, 1994). Upregulation of BDNF is associated with LTP (Figurov et al., 1996), whereas downregulation is linked with LTD (Woo et al., 2005). In their study Kleim et al. (2006) found 17 out of 78 healthy young adults (age range years) carried at least one copy of 24
37 the SNP. Behaviourally these individuals were similar to those without the SNP (i.e. Val/Val). However, this SNP was associated with depressed UDP measured at a neurophysiological level. Using TMS, the authors showed that individuals with the Val/Met SNP had reduced training-dependent increases in corticomotor measures such as MEP amplitude, map volume and CoG shift, compared to the Val/Val genotype (Kleim et al., 2006). Of importance, BDNF genotype is related to motor learning (Fritsch et al., 2010). These researchers showed that motor skill learning is attenuated in humans and mice with the Val/Met SNP, which reduces activity-dependent BDNF secretion. Given the important role of BDNF in use-dependent neural plasticity, genetic variations affecting the release of BDNF are a significant finding. With further research in this area, our understanding of genetic factors in neural plasticity may impact on the provision of rehabilitation services in the future Therapeutic manipulation of UDP Identification of protocols or techniques that regulate UDP has the potential to benefit those with neurological conditions. In particular, interventions that facilitate UDP could be integrated to complement current neurorehabilitation practices. This may be of particular importance for subgroups within the population who do not exhibit use-dependent neural plasticity after motor practice alone. As UDP requires an increase in excitatory and/or a decrease in inhibitory neurotransmission, the effects of therapeutic manipulation of these mechanisms have been examined in healthy and neurologically impaired populations. Pharmacotherapy Modulation of UDP by drugs that influence the main neurotransmitter (Glutamate and GABA) and neuromodulating (NE: norepinephrine, DA: dopamine, ACh: Acetylcholine) systems has already been discussed above, as it provides insight into the mechanisms 25
38 underlying UDP. In summary, a suppression of UDP is observed when training is preceded by drugs that agonise GABA A receptor activation or antagonise NMDA receptor activation. As mentioned, GABA A receptor antagonists cannot be used in humans as they have a potential proconvulsive effect. D-amphetamine, a drug that acts on multiple neuromodulator systems including NE, serotonin, and DA (Meintzschel and Ziemann, 2006), has been widely studied. Clinical trials have reported that administration of D-amphetamine during the rehabilitation process improves recovery in stroke patients with severe motor deficits, though the mechanisms are not well-understood (Nudo et al., 2001, Walker-Batson et al., 1995). Studies using the thumb movement protocol with D-Amphetamine given prior to training have found UDP to be enhanced (Bütefisch et al., 2002) and even induced in some subjects for whom training alone failed to induce UDP (Sawaki et al., 2002b). Limitations of using D-amphetamine to facilitate UDP include contraindications and precautions, undesired side effects and difficulty with timing of administration of this drug. These factors potentially limit the usefulness of D-amphetamine in the clinical setting. Foster et al. (2006) investigated the effects of two drugs with fewer side effects, Atomoxetine and Venlafaxine. Atomoxetine (a selective NE re-uptake inhibitor) was found to augment UDP whereas Venlafaxine (both a serotonin and NE re-uptake inhibitor) produced no significant effects (Foster et al., 2006). Although these results have some promise, clinical trials are necessary to determine the usefulness of these drugs in those recovering from neurological injury. One study has explored the use of dopamine agonists in the stroke population. Treatment with Levodopa, a dopamine precursor, enhanced neural plasticity in chronic stroke patients (> 1 year poststroke), assessed using the thumb movement protocol (Floel et al., 26
39 2005b). It is thought that Levodopa may work through the facilitatory effects of dopaminergic neurotransmission on NMDA-dependent and -independent LTP induction (Floel et al., 2005b). It is worthwhile noting that the population tested was restricted to patients with a subcortical stroke, and with motor deficits in the absence of somatosensory impairment. Therefore these results, although promising, may not be applicable to other types of stroke. In addition, the enhancement of UDP was not consistent, as three of the nine patients did not show UDP with either the placebo or Levodopa. These findings indicate a potential role for Levodopa for treatment poststroke, but again highlight the variability of generation of UDP with these experimental protocols. Therefore, alternate ways of modulating UDP should continue to be explored. Overall, the research indicates that manipulation of the neurotransmitter systems through pharmacotherapy has the ability to modulate UDP. There is potential for this approach to be used to optimise the outcome of neurorehabilitation. However, further clinical trials to determine the effects of each of the various pharmacological agents for different clinical populations are still required. Sensory stimulation Somatosensory input has a significant influence on motor function and it is therefore conceivable that manipulation of afferent input affects UDP. In a study described above, ischaemic nerve block was used to rapidly increase corticomotor excitability and reduce SICI of the representations for muscles proximal to the blockade, and enhance UDP during subsequent training (Ziemann et al., 2001). Using somatosensory stimulation rather than deprivation, UDP was evaluated in a chronic stroke population (Sawaki et al., 2006). Initially UDP was not elicited in either the stroke (n = 7) or healthy control groups (n = 6). A significant practice-dependent shift in the direction of TMS-evoked thumb movement was 27
40 seen in both groups when training was preceded by two hours of electrical stimulation to the ulnar, median and radial nerves. An additional control procedure applying stimulation to the tibial, superficial peroneal and sural nerves in the paretic leg did not significantly affect UDP measured in the hand. The authors do not discuss any possible mechanisms that may contribute the observed facilitation of UDP by prior sensory stimulation. It is likely that afferent stimulation lowered the threshold for subsequent LTP when motor training commenced. These studies used different methods for inducing UDP, and provide some evidence that modulating sensory input can potentiate motor cortical plasticity. Stimulation protocols Non-invasive brain stimulation modalities, such as rtms, delivered to M1 can modulate cortical excitability and reduce SICI (for a review, see Ziemann et al., 2008). A compelling working hypothesis is that the application of non-invasive brain stimulation lowers the threshold for LTP by increasing postsynaptic excitability, and subsequently enhances LTP induced during motor training (Bolognini et al., 2009, Reis et al., 2008b, Ziemann and Siebner, 2008). This phenomenon has been referred to as gating (Ziemann and Siebner, 2008). Both non-invasive brain stimulation and motor practice operate through similar modes of action involving NMDA-receptor dependent LTP and LTD (-like) processes (Bütefisch et al., 2000, Bütefisch et al., 2002, Huang et al., 2007, Liebetanz et al., 2002, Teo et al., 2007). It is possible that non-invasive brain stimulation may preferentially activate networks that are selectively recruited during motor practice, providing a context for interaction. To enhance UDP, the intuitive approach is to increase corticomotor excitability using facilitatory non-invasive brain stimulation applied directly to M1 contralateral to the training hand. An alternative approach is to reduce the excitability of M1 ipsilateral to the training 28
41 hand with suppressive non-invasive brain stimulation. This can indirectly increase MEP amplitude and reduce SICI in the contralateral M1, presumably via trancallosal pathways (Gilio et al., 2003a, Plewnia et al., 2003, Schambra et al., 2003). Modulation of UDP and motor learning by non-invasive brain stimulation has been assessed by measuring corticomotor excitability and motor performance during and after a period of upper limb motor practice. TMS protocols have been integrated during motor practice to facilitate skill acquisition and learning. Bütefisch et al. (2004) applied single pulse TMS at 80% of rest motor threshold (RMT) during performance of repetitive thumb movements in the opposite direction to TMS-evoked movements recorded at baseline. The number of TMS-evoked movements into the trained direction increased post-training when TMS was applied to the contralateral M1, synchronous with 1 of every 10 voluntary thumb movements (EMGtriggered). Specifically, the proportion of movements into the target training zone (TTZ) was larger than that seen after training coupled with asynchronous TMS to the contralateral M1, training with synchronous TMS to the ipsilateral M1, and training performed alone. Another study interleaved facilitatory M1 rtms (10 Hz, 80% RMT) with practice blocks of sequential key pressing with the contralateral hand (Kim et al., 2004). Improvements in speed and accuracy of key pressing observed with M1 rtms were greater than when practice was combined with sham rtms. Although these results are promising, the practicality of applying TMS during performance of complex tasks or in the clinical environment is debatable. In addition, TMS equipment is expensive and its use is contraindicated in some people. A more practical option might be transcranial direct current stimulation (tdcs). TDCS is a more portable form of non-invasive brain stimulation that can increase or decrease corticomotor excitability depending on the electrode configuration. Anodal tdcs depolarises neuronal membranes to increase corticomotor excitability, whereas 29
42 hyperpolarisation is achieved with cathodal tdcs (for a review of tdcs, see Nitsche et al., 2008). Application of anodal tdcs during a single session of upper limb motor learning can increase skill acquisition (Nitsche et al., 2003). With repeated daily sessions, this beneficial effect can be enhanced and retained (Reis et al., 2009), highlighting the potential role of multiple sessions for longer-term change in motor function. A recent study by Fritsch et al. (2010) supported and extended the findings of Reis et al. (2009). In an animal model they demonstrated that anodal tdcs combined with repetitive low frequency synaptic activation induced LTP, which was NMDA receptor and BDNF secretion dependent (Fritsch et al., 2010). Mice that were pre-treated with an NMDA receptor antagonist, or had their BDNF gene deleted, did not show LTP. Anodal tdcs with low frequency stimulation increased BDNF secretion compared to low frequency stimulation alone. Of interest, anodal tdcs during training increased overall skill learning to a similar extent in Val/Met and Val/Val human subjects. This study makes an important contribution to our understanding of the mechanisms of tdcs and highlights the potential importance of BDNF in LTP-like processes. Anodal tdcs induces neuronal depolarisation of the postsynaptic neuron, which when coupled with neural activity (stimulation of the slices, or skill learning) enhances UDP, and this whole process appears to be dependent on BDNF secretion. The after-effects of non-invasive brain stimulation outlast the period of stimulation, providing a window of opportunity after stimulation when the threshold for LTP may be lowered. Non-invasive brain stimulation may prime (i.e. prepare) the brain and optimise the effects of motor practice. The efficacy of priming M1 with high frequency rtms has been mainly been demonstrated in studies conducted in stroke patients, and are discussed in a Chapter 4. In brief, in a single-session chronic stroke patients performing a sequential finger movement task showed a larger improvement in movement speed and accuracy when training was preceded by 10 Hz rtms, but not sham rtms (Kim et al., 2006). Furthermore, acute 30
43 stroke patients who received 3 Hz rtms prior to their standard rehabilitation for 10 days showed less overall disability compared to patients receiving sham stimulation and rehabilitation (Khedr et al., 2005). The use of high frequency rtms is not as common in healthy adults. One study found no kinematic advantage (in terms of finger abduction amplitude, velocity or acceleration) when subthreshold (90% RMT) 5 Hz rtms was applied prior to repetitive finger abduction training, despite inducing the expected increase in corticomotor excitability in the contralateral M1 (Agostino et al., 2007). It is possible that the small number of rtms pulses (150) and the brief training regime (60 abductions) accounted for negligible differences between real and sham groups. It is also possible that coupling high frequency rtms and training is more likely to show a benefit a patient population with hypoexcitability of ipsilesional M1. Excitation of the M1 contralateral to the training hand can also be achieved indirectly, via cortico-cortical pathways, with suppressive rtms of the ipsilateral M1. Suppressive rtms has the potential advantage of being low frequency and therefore carrying a lower relative risk of inducing seizure (Rossi et al., 2009). Priming M1 with 1 Hz rtms (90% RMT) has been shown to improve temporal aspects of finger movements performed with the ipsilateral hand, for up to 30 minutes (Avanzino et al., 2008, Avanzino et al., 2009). In support, Kobayashi et al. (2004) found increased speed in a sequential key pressing task in young participants (mean age, 30 years) who had received 1 Hz frequency rtms (90% RMT) of the ipsilateral M1. Contrary to the working hypothesis that non-invasive brain stimulation may enhance subsequent motor practice, Carey et al. (2006) showed a detrimental effect of 1 Hz rtms (90% RMT) on ipsilateral finger tracking. Several factors could contribute to this finding. Firstly, reduced corticomotor excitability in the stimulated M1 cannot be confirmed as neurophysiological measures were not recorded. Secondly, the after-effects of rtms protocols are influenced by the number of stimuli delivered. The protocol delivered by this 31
44 group comprised 600 stimuli. With less than approximately 900 stimuli the after-effects of rtms on corticomotor excitability are more varied (Hoogendam et al., 2010). Finally, rtms protocols may interact with motor training. Several studies have shown that prior motor training can disrupt the after-effects of a variety of non-invasive brain stimulation protocols (Baraduc et al., 2004, Muellbacher et al., 2002, Ziemann et al., 2004). The importance of considering the interactions of voluntary motor activity and non-invasive brain stimulation is becoming apparent, and is discussed later in this literature review in the context of combining theta burst stimulation (i.e. a patterned form of rtms) with therapy after stroke. Whilst suppressive non-invasive brain stimulation can indirectly facilitate contralateral M1 excitability, it may also adversely affect performance with the contralateral hand. A coincidental reduction of contralateral hand performance has been reported in some (Kobayashi et al., 2009), but not all cases (Carey et al., 2006, Kobayashi et al., 2004). The indirect and direct effects of suppressive non-invasive brain stimulation of M1 must be considered before this approach can be applied therapeutically in stroke patients, in whom contralesional M1 may contribute to paretic upper limb movement. This issue is discussed in more detail in subsequent chapters. In summary, UDP involves a rapid increase in synaptic efficacy through an LTP-like mechanism. LTP is most likely dependent on increased NMDA receptor activity and GABA A ergic disinhibition of the M1 representation. UDP can be promoted by drugs, altered afferent input, and non-invasive brain stimulation techniques, but may be diminished in older adults or people with a SNP of the gene encoding BDNF. Understanding UDP can help us to promote beneficial plasticity that may facilitate recovery after stroke. The experimental work presented in this dissertation draws on the potential for sensory and non-invasive brain stimulation protocols to promote UDP, in healthy and stroke populations. 32
45 3.4. Externally-paced movements Many everyday activities involve rhythmic coordination, such as sport, music and dancing. Synchronisation and syncopation are two modes of sensorimotor coordination that can be adopted to establish rhythmical movement. Synchronisation is when movements are performed in time with an external beat such as an auditory metronome, whereas syncopation involves movement occurring directly between consecutive beats. In the human population there is a tendency to synchronise with an external rhythm (Keller and Repp, 2005), a more stable form of coordination (Kelso et al., 1990). Synchronisation can be achieved when the rate of external cueing is within a Hz range (Mayville et al., 2002). Syncopation patterns are more difficult to establish and can generally only be successfully performed at low frequencies, below approximately 2 Hz (Kelso et al., 1990). At higher frequencies the performer will inevitably revert to a pattern of synchronisation in an attempt to maintain coordination (Byblow et al., 1999) Comparison of anatomical cortical activation patterns Functional brain imaging techniques have identified a broader activation pattern within cortical and subcortical motor-related regions during syncopation when compared to synchronisation (Jantzen et al., 2004, Mayville et al., 2002). Synchronisation is associated with neural activity in the contralateral sensorimotor cortex, ventrolateral premotor region, posterior aspect of the SMA, and the ipsilateral cerebellum (Gerloff et al., 1998a, Jantzen et al., 2004, Mayville et al., 2002). In addition to the above areas, syncopation activates the dorsolateral portion of the premotor areas, anterior aspect of the SMA, cingulate gyrus, several regions of the frontal and temporal lobes and cerebellum, and the basal ganglia (Jantzen et al., 2004, Mayville et al., 2002). The PMC and SMA, which are involved in motor planning and execution, have previously been shown to increase in activity with 33
46 increased complexity of movement (Lang et al., 1990, Rao et al., 1993). Additionally, the basal ganglia and cerebellum play key roles in the timing of movement (Groenewegen, 2003, Jueptner and Weiller, 1998). Attentional demands also increase during syncopation when compared to synchronisation (Carson et al., 1999, Temprado and Laurent, 2004). This may explain the added recruitment of the prefrontal cortex, an area which is generally thought to relate to attention and working-memory (Jantzen et al., 2004). Together these findings indicate that syncopation recruits supplementary brain areas to facilitate processing of more complex temporal information. The extent of primary and secondary motor cortex recruitment appears to be ratedependent. Regardless of coordination mode, movements paced at a faster rate are typically associated with increased activation of the contralateral sensorimotor cortex (Jenkins et al., 1997, Rao et al., 1996, Riecker et al., 2003). Recruitment of additional motor regions begins at frequencies between 0.75 to 1.75 Hz for syncopated movement, and above 2 Hz for synchronised movement (Jantzen et al., 2009, Rao et al., 1997). Brain activity during transition from syncopation to synchronisation has been studied (Mayville et al., 1999). Electroencephalographic (EEG) activity was obtained as participants performed right index finger flexion (onto an air pressure sensor cushion) between metronome beats. Metronome frequency was incrementally increased by 0.25 Hz. At a critical frequency (usually ~ Hz) coordination pattern spontaneously from syncopation to synchronisation. Phase transition was accompanied by a reduction in neural activity in the sensorimotor cortex. Brain electrical activity modulated to match that seen in subjects who had started, and remained, in synchrony with the metronome. This study demonstrates dynamic modulation of cortical activity to reflect the demands of the new coordination mode. 34
47 The relationship between synchronisation, syncopation and intracortical inhibition Modulation of SICI facilitates the development of synergistic movements (Schneider et al., 2002), with disinhibition of M1 enabling functional coupling between motor representations (Jacobs and Donoghue 1991; Schneider et al. 2002). Synchronisation and syncopation movement patterns rely on the coordinated activation of multiple muscles. The modulation of SICI in synchronised and syncopated movement patterns is therefore of interest. Using paired pulse TMS, Liepert et al. (1998) measured SICI in resting participants after each of 4 blocks of repetitive thumb abductions synchronised to a 1 Hz metronome (Liepert et al., 1998). There was a significant reduction in SICI over the course of training in APB and the fourth dorsal interosseous muscles involved in task performance. However, when subjects were asked to relax their fourth dorsal interosseous during the same task (with the assistance of auditory EMG), APB continued to show a reduction in SICI but there was a significant increase in SICI for fourth dorsal interosseous. Although this finding demonstrates that changes in SICI can be muscle specific and volitionally increased, measures were taken when the subject was at rest at the end of training, therefore it remained unclear as to whether SICI was modulated differentially during performance of the task itself. Phasic modulation of SICI was explored by Stinear and Byblow (2003b). They assessed SICI using paired pulse TMS during the ON (during finger flexion) and OFF (between finger flexions) phases of a synchronised finger tapping task (Stinear and Byblow, 2003b). In agreement with previous studies (Devanne et al., 1997, Flament et al., 1993), they found an increase in corticomotor excitability and a decrease in SICI in the representation of the muscle involved in performing the tapping task (FDI). Their study demonstrated that these effects were significantly greater during the ON phase than the OFF phase, indicating 35
48 that SICI and corticomotor excitability are temporally modulated. The authors also recorded MEPs from a control muscle, APB. Two groups of participants emerged. APB MEPs were facilitated during the ON phase in some participants (group 1) and facilitated in the OFF phase in others (group 2). There was a decrease in APB SICI during ON phase for group 1 participants, mirroring the effects observed in FDI. In contrast, APB SICI increased during finger flexion for group 2. This demonstrates an increase in SICI acting on a resting muscle representation, even during voluntary activation of nearby muscles. The observed muscle specific modulation of SICI may act to increase the selectively of the motor output to the hand. These studies together indicate that the performance of a stable coordinated movement pattern such as synchronisation involves a reduction in SICI acting on the M1 representation of muscles that are specific to the desired movement task. This reduction in SICI is modulated temporally within task performance, with the release of inhibition greater during movement as opposed to between movements. In addition, the representations of muscles not required for task performance have an increase in SICI. This is likely to prevent unwanted muscle activation that may interfere with the accuracy of performance. Byblow and Stinear (2006) compared the modulation of SICI in synchronised versus syncopated finger movements. Participants were required to abduct their right index finger against a switch at a rate of 1 Hz, either synchronised or syncopated with an auditory metronome beat. SICI was measured using paired pulse TMS during the OFF phase, when all hand muscles were at rest but the subject was still engaged in the ongoing task. A significant increase in SICI was found between finger movements during syncopation when compared to synchronisation. The authors suggested that an increase in SICI between syncopated movements serves to suppress a tendency for entrainment to the metronome. Based on the findings of previous research (Stinear and Byblow, 2003b), it would be expected that 36
49 voluntary activation of FDI during finger abduction in a syncopated pattern would result in a similar release of inhibition. In summary, this study provides evidence to suggest syncopation is associated with an increase in SICI during the interval between movements and may have a functional role in preventing a phase transition from syncopation to the more stable pattern of movement, synchronisation Comparison of externally-paced and self-paced movements Studies comparing externally-paced with self-paced movements can give insight into auditory-motor interactions and help determine the potential therapeutic benefit of paced training. Auditory pacing can induce immediate improvements in spatial and temporal aspects of gait after stroke and in people with Parkinsons Disease (McIntosh et al., 1997, Roerdink et al., 2007, Roerdink et al., 2009, Thaut et al., 1993, Thaut et al., 1996). Over a three week training period, gait training performed in synchrony with a metronome beat induced larger gains in multiple aspects of gait (velocity, stride length, cadence and symmetry) when compared to gait re-education using a neurodevelopmental/bobath approach (Thaut et al., 2007). However, gait is rhythmic and therefore well suited to temporal cueing. Upper limb movement is more discrete, specific, and volitional, which may explain why there are fewer studies comparing externally-paced and self-paced upper limb training. In sport and music there are several ways that external pacing is used to complement practice of upper limb tasks, such as the use of metronome when playing the piano or practicing the timing of a golf swing. In 2002, Thaut et al. (2002) investigated the kinematic properties of repetitive reaching with the paretic upper limb in self-paced and metronomepaced (at the self-paced frequency) conditions in subacute to chronic stroke patients (Thaut et al., 2002). The authors described immediate improvements in spatiotemporal aspects of reach when paced in synchrony with the metronome beat. Specifically, the travel time to 37
50 reach the target was reduced and the arm trajectory was less variable. In addition, increased elbow extension was observed, which could indicate improved quality of movement. Acceleration profiles in the self-paced and paced conditions were compared to a predicted reach profile. The mean deviation from the predicted model was significantly lower in the paced group (39%) when compared to the non-paced group (168%). These findings indicate that metronome-paced upper limb movement provided a cyclical time constraint on upper limb reach that served to optimise movement kinematics and minimise overall movement cost. Pacing has been used as an adjunct to other therapies, such as bilateral arm training (Luft et al., 2004, Whitall et al., 2000). However, a single group design (Whitall et al., 2000) and a randomised controlled study comparing bilateral arm training with dose-matched standardised therapy (Luft et al., 2004) were used, which do not allow the effect of temporal cueing to be deconstructed. One study has used rhythmically cued movement training as the primary intervention for paretic upper limb training in stroke patients (Malcolm et al., 2009). Although this study found improved reach kinematics, less upper limb impairment and increased function, it was limited by a very small sample size (n = 5) and had no control group. Despite promising behavioural and functional effects of external pacing in small groups of patients, these studies do not provide insight into the possible underlying cortical processes involved. Studies using fmri have compared the patterns of cortical activity associated with metronome-paced and self-paced patterns hand movements. Like syncopation, self-paced movements required an extended motor cortical network in comparison to synchronisation. Similar to the pattern observed with synchronised movement, repeated brisk isolated hand movement at a comfortable self-paced tempo activated the contralateral sensorimotor cortex, PMC, SMA, and the ipsilateral cerebellum (Gerloff et al., 1998a). In addition, ipsilateral 38
51 sensorimotor cortex, PMC, SMA and contralateral cerebellum were recruited (Gerloff et al., 1998a, Mayville et al., 2002, Rao et al., 1997). The degree of inter-regional coupling within the distributed motor network is also greater during self-paced movement when compared to movements synchronised with an auditory metronome (Gerloff et al., 1998a). Connectivity between the right and left sensorimotor cortices, and the contralateral sensorimotor and premotor cortices was enhanced during repetitive movements performed in the absence of auditory cueing. It is likely that increased cortical activity and inter-regional coupling reflects the increased demands of performing internally-generated movements. The exact mechanisms of how auditory information converges with descending motor commands are not clear. The primary auditory cortex is activated with auditory stimulation, such as the metronome beat. It is likely that this temporal information is relayed to M1 via PMC and SMA (Jantzen et al., 2009). Like previous research, this group showed ratedependency of the extent of neural activity in the primary auditory and motor cortices. However, the relative coupling strength between the primary auditory cortex and PMC did not change with rate or pattern of coordination. This indicates that processing of auditory information for coordination constraint of movement probably does not occur within the primary auditory cortex, but within motor areas. However, there have been no neurophysiological studies of motor cortex activity during externally-paced and self-paced movements Modulation of UDP with externally-paced movement Enhancement of UDP is produced by interventions that induce a reduction in SICI and/or facilitate excitability. Previous research has used various manipulations including, administration of pharmacological agents (Bütefisch et al. 2000; Foster et al. 2006; Sawaki et al. 2002b), rtms (Bütefisch et al., 2004), and somatosensory stimulation (Sawaki et al., 39
52 2006) in an effort to enhance the effects of training. Although results to date have been promising, and have shown that UDP can be enhanced, side effects of medications, difficulty with timing of drug administration, and a lack of research to support these interventions within patient populations, limit their application in a clinical setting at this time. It is possible that changes in the training regiment itself could modulate UDP. Increasing the training dose by increasing intensity or duration of training may amplify the plastic response. However, this is not always realistic given the fatigue commonly experienced by patients from stroke. The potential effects of coordination pattern on UDP during training have not yet been explored. Movement of one body part can be paired with movement of another body part (e.g. thumb abductions and foot extensions). Paired movements performed asynchronously prevent the reorganisation of the motor cortex secondary to motor training (Liepert et al., 1999). A syncopated coordination pattern has been shown to increase SICI whereas synchronisation decreases SICI (Byblow and Stinear, 2006). It is possible the development of UDP is abolished with a syncopated training regime, as motor cortical inhibition is likely to be increased. Repetitive motor training is a relatively common method of promoting motor recovery after neurological injury. However, it is most common to set exercises at a comfortable pace in the absence of pacing. To date most of the studies investigating UDP after a short period of repetitive training have paced movements with an external beat, such as an auditory metronome. The pattern of cortical activity during self-paced and syncopated training is similar, therefore may not release SICI to the same extent as movements that are synchronised to an external pacing cue. We know that a release of inhibition is needed for UDP, so self-paced training may not be as conducive to UDP as externally-paced training. There is evidence that synchronizing gait to an external pacing stimulus is clinically 40
53 beneficial, but we know little about the neurophysiological mechanisms, or whether similar benefits might be observed for the upper limb. 41
54 Chapter 4. STROKE Stroke or cerebrovascular accident (CVA) is the clinical designation for rapidly developing neurological deficits that persist beyond 24 hours, and are caused by a disturbance in the brain s blood supply. Stroke is one of the most common causes of death, and a leading cause of adult long-term disability (Dobkin, 2004, Seshadri and Wolf, 2007, Strong et al., 2007, Tobias et al., 2007). The symptoms of a stroke are related to the anatomical location of the damage, and the nature and severity of symptoms are heterogeneous. Stroke commonly causes deficits in the motor system (Cramer, 2008, Dobkin, 2004). If the area of the brain affected contains one or more of the three main central nervous system pathways: the CST, spinothalamic tract and dorsal column (medial lemniscus), symptoms may include hemiparesis and sensory disturbances. Strokes involving the basal ganglia reduce a person s ability to perform coordinated movement. In addition, if the cerebral cortex is involved there may be deficits in speech (e.g. dysphasia), vision, cognition and higher order deficits in movement (e.g. dyspraxia). Involvement of the cerebellum can lead to symptoms including impaired movement coordination and vertigo. In the poststroke period, patients will often undergo rehabilitation to maximise their physical, psychological, social and vocational potential. A multidisciplinary rehabilitation team commonly comprises a neurologist, registered nurse specialist, physiotherapist, occupational therapist, speech language therapist and social worker, with access to a neuropsychologist and dietician. The duration of rehabilitation is usually dependent on the patient s impairments and functional deficits (Schaechter, 2004), and also on their rate of improvement. Formal rehabilitation typically does not continue for more than 6 months (Schaechter, 2004). Upper limb therapy constitutes a main part of motor rehabilitation as 42
55 upper limb impairment, in particular, is a factor limiting function after stroke (Dobkin, 2005, Kwakkel et al., 2003). During the rehabilitation period physiotherapists and occupational therapists provide therapy to promote upper limb motor recovery and function. Initially rehabilitation emphasis may be placed on compensatory strategies to enable the patient to care for themselves. Subsequent interventions aim to elicit voluntary activation of the paretic upper limb and restore appropriate sensory and proprioceptive afferent information to the brain. Rehabilitation is progressed to incorporate resistance exercises to improve strength. Training for functional activities tends to commence when the arm and hand can be moved against gravity. A variety of therapeutic approaches are used, including Bobath techniques which focus on regaining normal movement patterns through postural control and therapeutic handling (Bobath, 1990), constraint-induced therapy (CIT) which forces the use of the paretic arm by restraining the nonparetic arm (Taub et al., 1993), and task-specific and task-oriented training which practices components of, or related to, everyday activities (Schaechter, 2004, French et al., 2010, Carey et al., 2009). These approaches incorporate interventions such as splinting, range of motion exercises, specific strengthening exercises, sensory re-education and specific practice for activities of daily living (Barreca et al., 2003, Duncan et al., 2005, Schaechter, 2004, French et al., 2010, Teasell et al., 2006). The choice of therapeutic approaches and interventions is therapist dependent and demonstration of their efficacy is often based on research with varying methodological quality (Dobkin, 2005, Kollen et al., 2006). The heterogeneous nature of patients symptoms and recovery make it difficult to demonstrate differences between experimental and control groups (Kollen et al., 2006). Other issues include poorly defined or controlled interventions, lack of appropriate blinding, lack of randomisation, inadequate sample sizes and insensitive outcome measures (Dobkin, 43
56 2005). However, in the absence of curative therapy, rehabilitation is the gold standard to improve outcome and quality of life after stroke. The optimal intensity of upper limb therapy is unclear. The amount of rehabilitation for people after stroke varies considerably. Therapy sessions typically consist of minutes per day, per therapist during inpatient care. Outpatient therapy is commonly provided at approximately 2-3 sessions per week, with similar session times to inpatient facilities. However, this therapy is not guaranteed to be focused on the upper limb. The results of a meta-analysis provided no evidence that stroke patients benefit from general upper limb rehabilitation at an increased intensity, as defined by total amount of therapy time (Kwakkel et al., 2004). However, this conclusion was limited by the small number of trials that met the inclusion criteria. The results reflect the pooled findings of only five randomised controlled trials. This meta-analysis is also limited by defining intensity by time alone, as this does not indicate the patient s effort and energy expenditure. CIT, and modified versions of CIT, are particularly intensive approaches that have shown promising results, and are discussed later in further detail. However, those who qualify to proceed with CIT require high levels of motivation to remain compliant to this intensive therapy regime. The high level of intensity required is difficult to maintain for many patients. CIT studies have shown up to a 25% drop out rate (Taub et al., 2006, Wolf et al., 2006). Using another interventional approach Lincoln et al. (1999) evaluated the benefit of augmented Bobath therapy. In this randomised controlled trial, one group received routine daily Bobath therapy (~ 45 minutes daily) for 5 weeks, and the other group received routine therapy plus a further 2 hours extra Bobath therapy weekly (Lincoln et al., 1999). Increased therapy hours did not improve upper limb function compared to routine therapy. However, it is of interest to note that one third of the patients receiving augmented therapy did not complete the full number of additional hours due to low tolerance to upper limb 44
57 rehabilitation. Factors such as fatigue, depression, and lack of transportation are all common after stroke, and can also impact on the patient s ability to attend and participate in intensive rehabilitation. Likewise, a considerable investment from the rehabilitation facility in terms of therapist time and resources is required, which is not always feasible. Despite the dedication of everybody involved, approximately two thirds of patients cannot incorporate the paretic hand into their usual daily activities six months after stroke (Dobkin 2005; Kwakkel et al. 2003). Higher intensity rehabilitation may enhance motor recovery, but is not always practical. The timing of rehabilitation interventions also requires consideration. Currently, most rehabilitation takes place in the acute and subacute phases after stroke. Input after this time is limited, despite some capacity for meaningful change in the chronic phase in some patients (Stinear et al., 2008). Further investigation into specific treatment approaches and interventions is required. A thorough understanding of the processes occurring in the brain after stroke could be used to improve the efficacy of current practices and develop new strategies for optimising stroke outcome Recovery of brain function following stroke Clinical recovery from stroke is varied. Some people are left severely impaired, while others appear to have a miraculous recovery. To minimise damage and restore function, the central nervous system undergoes spontaneous processes at molecular, cellular, system and behavioural levels (Cramer, 2008). Functional MRI studies have shown that after motor stroke the brain recruits an extended network of cortical regions for paretic upper limb movement, including bilateral sensorimotor cortices, bilateral PMC and SMA, and contralesional posterior parietal cortices (Marshall et al., 2000, Ward et al., 2003a). The extent and pattern of reorganisation over time is complex, but appears to be dependent on 45
58 factors including the lesion location and extent of disruption to the CST (Liepert et al., 2005, Stinear et al., 2007, Ward et al., 2006), as well as exogenous (e.g. pharmacotherapy) and endogenous (e.g. age) factors (Cramer and Riley, 2008). Patients usually participate in rehabilitation after stroke, so it is impossible to investigate changes in the motor system in the absence of motor experience. It would be unethical to preclude standard and usual care, such as access to rehabilitation, in order to delineate between the processes involved in spontaneous recovery and recovery induced by experience or therapy. The following sections discuss neuroplasticity in ipsilesional and contralesional hemispheres, to support recovery early after stroke and over time. In addition, the interhemispheric interactions between homologous motor cortices are reviewed Reorganisation of the ipsilesional hemisphere In general, TMS studies have indicated that the excitability of the ipsilesional corticomotor pathway is decreased in the days and weeks after stroke. MEPs in the paretic hand may be absent, even at maximum stimulator output (100%MSO) (Catano et al., 1996, Cicinelli et al., 1997, Traversa et al., 1997). When some voluntary contraction of the paretic target muscle is possible, measureable MEP responses tend to be present, but are typically abnormal (Turton et al., 1996). Motor threshold is usually increased, MEP latencies are prolonged, and MEP amplitudes are reduced relative to the contralesional M1 (Catano et al., 1996, Cicinelli et al., 1997, Delvaux et al., 2003, Traversa et al., 1997, Traversa et al., 1998, Traversa et al., 2000, Turton et al., 1996). Studies using paired pulse techniques have shown reduced SICI in the ipsilesional M1, likely reflecting a reduction in GABAergic activity (Bütefisch et al., 2003, Cicinelli et al., 2003, Liepert et al., 2000b, Manganotti et al., 2002, Manganotti et al., 2008). Disinhibition may serve to enable ipsilesional M1 to be more receptive to inputs from a broad cortical network (Swayne et al., 2008). 46
59 The properties of MEP responses in the paretic upper limb tend to normalise with time in those who show a good recovery. An early study investigated corticomotor excitability in patients two to four months after first-ever stroke (Traversa et al., 1998). An increase in MEP amplitude in the paretic abductor digiti minimi muscle was seen over time, and was accompanied by a decrease in MEP amplitude in nonparetic abductor digiti minimi. These researchers demonstrated that patients who showed improvement in the balance (i.e. symmetry) of corticomotor excitability between M1s showed some motor recovery. In contrast, those who did not increase ipsilesional M1 excitability showed a further increase in contralesional M1 excitability, leading to further imbalance, and little improvement in motor function. An increase in ipsilesional M1 excitability and a reduction in contralesional M1 excitability in the first 6 months poststroke were also reported by Swayne et al. (2008). Of note, these researchers calculated and compared recruitment-curves (RC) gradients, instead of MEP amplitude. RC gradients are a more sensitive measure of corticomotor excitability, being less likely to be effected by changes in motor threshold (Devanne et al., 1997, Ridding and Rothwell, 1997). This is pertinent in subacute stroke patients, who tend to have a reduction in motor threshold over time (Catano et al., 1996, Cicinelli et al., 1997, Traversa et al., 2000, Turton et al., 1996). Initially RC gradient was reduced in the paretic FDI compared with the nonparetic FDI. However, by 3 months poststroke there was no significant difference in RC gradients. Furthermore, Swayne et al. (2008) found a strong positive correlation between increased RC gradient in the paretic FDI and improved paretic arm and hand function, which was strongest in the first few months and decreased with time. Of interest, Swayne et al. (2008) showed that reduced SICI of the ipsilesional FDI representation persisted throughout the 6 month poststroke period. Persistent disinhibition may provide a context for ongoing plasticity in the ipsilesional M1. Together these studies 47
60 indicate that a return of balanced corticomotor excitability, through an increase in ipsilesional M1 corticomotor excitability, may optimise recovery. The importance of reorganisation of ipsilesional M1 to recovery of motor behaviour was investigated by Werhahn et al. (2003). These researchers induced a temporary virtual lesion in the ipsilesional M1 of poorly and well recovered chronic stroke patients. Using a reaction time paradigm, EMG responses in hand muscles were recorded during a key pressing task performed as fast as possible (in response to a GO signal) with the index finger. Disruption of ipsilesional M1 prolonged reaction times, but more so in those with a good recovery (Werhahn et al., 2003). It appears that the determination of good versus poor recovery was based on arbitrary stratification (Medical Research Council score), to create two approximately equal subgroups. Nevertheless, these results indicate that return of ipsilesional M1 control of the paretic hand may be instrumental for good recovery. This is consistent with fmri findings, showing that return of ipsilesional control of paretic hand movement is associated with better clinical upper limb recovery (Ward et al., 2003a). Areas that have anatomical connections to the paretic limb may contribute to recovery. Like M1, PMC has pyramidal cells (from layer V) with fibres that project via the posterior limb of the internal capsule, to the spinal cord and synapse onto alpha motor neurons (Zarei et al., 2007). These connections may enable PMC to take on some of the roles of ipsilesional M1. Using a reaction time task, the role of the ipsilesional PMd in control of the paretic arm was investigated in chronic stroke patients (Fridman et al., 2004). Interference of the ipsilesional PMd, with carefully timed TMS (100 ms prior the GO signal), elongated the reaction time of a key pressing task in the paretic hand of chronic stroke patients, although only in those who had some motor recovery. Increased activation in ipsilesional premotor areas in fmri may reflect the contribution of the ipsilesional PMd in control of movement of the paretic upper limb when CST damage is modest (Ward et al., 48
61 2006). Because secondary motor regions, such as the PMC, are less efficient at generating motor output and predominantly project to proximal musculature, overall motor recovery of function is likely to be partial (Nirkko et al., 2001, Ward et al., 2006) Reorganisation of the contralesional hemisphere TMS studies investigating corticomotor excitability in the contralesional M1 have given more varied results. Some studies have reported little difference compared to healthy control subjects in neurophysiological measures, such as contralateral MEP amplitude, MEP latency and motor threshold (Bütefisch et al., 2003, Catano et al., 1996, Cicinelli et al., 1997). Other studies have reported increases in MEP amplitudes recorded from the contralesional hemisphere compared with normal healthy subjects (Delvaux et al., 2003, Traversa et al., 1998, Traversa et al., 2000). Acutely, SICI may be reduced in the contralesional hemisphere (Bütefisch et al., 2003, Manganotti et al., 2002, Manganotti et al., 2008, Shimizu et al., 2002), but this has not always been observed (Cicinelli et al., 2003, Swayne et al., 2008). As discussed above, the balance of corticomotor excitability between the ipsilesional and contralesional M1 tends to improve over time, particularly in those who show a good recovery. This appears to be related to an increase in ipsilesional M1 excitability, but a concurrent reduction in contralesional excitability may contribute (Swayne et al., 2008, Traversa et al., 1998). Resolution of contralesional M1 disinhibition may be important in regaining ipsilesional motor control of the paretic hand. A normalisation of contralesional SICI has been associated with improved upper limb function (Manganotti et al., 2002, Manganotti et al., 2008, Swayne et al., 2008). A reduction in contralesional M1 excitability and normalisation of intracortical inhibition may promote a return of ipsilesional M1 control of the paretic hand. 49
62 When there is compromised integrity of the ipsilesional CST there may be substantial cortical reorganisation at a network level to make use of preserved pathways (Grefkes et al., 2008a, Stinear et al., 2007, Ward et al., 2006). Functional MRI studies provide evidence for continued abnormal activation in a number of contralesional motor and motor-related brain regions, particularly in severely-affected patients (Bütefisch et al., 2005, Grefkes et al., 2008a, Marshall et al., 2000, Ward et al., 2003a). In addition, assessment of SICI with TMS indicates continued disinhibition of contralesional M1 in patients severely-affected after stroke (Swayne et al., 2008). The recruitment of contralesional motor regions could provide a compensatory mechanism for achieving some paretic upper limb movement. This may allow the activation of upper limb musculature via ipsilateral projections to alpha motor neurons innervating the paretic upper limb. Uncrossed CST pathways from the contralesional M1 (i.e. ipsilateral pathways) may contribute to the control of the paretic upper limb, particularly for proximal musculature. Ipsilateral corticospinal fibres predominantly supply the proximal muscles, with sparse projections to the hand (Rothwell, 1994). In healthy subjects, ipsilateral MEPs (imeps) can be recorded in proximal muscles of the upper limb after ipsilateral TMS of M1, but are rarely seen in distal muscles (Misawa et al., 2008, Ziemann et al., 1999). After stroke, imeps are more frequent in proximal muscles, and seem to be more prevalent in those with poorer recovery (Caramia et al., 2000, Misawa et al., 2008, Trompetto et al., 2000, Turton et al., 1996, Werhahn et al., 2003). The clinical relevance of imeps has been debated. Two studies found that the presence of imeps was associated with improved recovery (Misawa et al., 2008, Trompetto et al., 2000), whilst others have not (Turton et al., 1996, Werhahn et al., 2003). The former finding is supported by an fmri study where a temporary virtual lesion of the contralesional M1 of chronic stroke patients induced timing errors in the performance of complex hand movements with the paretic hand (Lotze et al., 2006). Although the functional 50
63 contribution of pathways from the contralesional M1 remains unclear, this region may have an important role in proximal upper limb movement in some patients. It is possible that pathways other than the CST, such as the reticulospinal tract, could provide efferent output from contralesional M1 to the paretic upper limb (Rothwell, 1994). A recent study provided evidence for the role of propriospinal motoneurons (which receive input from the reticulospinal tract) in the coordinated movement of upper limb movement in healthy adults (Bradnam et al., 2010). Suppression of these pathways reduced selective muscle activation in the ipsilateral upper limb and induced abnormal synergy formation. In a subsequent study, these authors speculate that increased facilitation of contralesional M1 after stroke may overwhelm the inhibitory effect of propriospinal neurons and allow movement of the ipsilateral upper limb (Bradnam et al., 2011). Together these studies indicate that contralesional M1 could contribute to upper limb movement, but perhaps in a synergistic manner that does not allow for smooth coordinated movement. The role of contralesional PMd in recovery of the paretic upper limb was investigated with TMS by Johansen-Berg et al. (2002a). Disruption of the contralesional PMd just prior (- 100 ms) to a reaction time task slowed reaction time of visually-cued index finger movement of the paretic hand in chronic stroke patients (Johansen-Berg et al., 2002a). This effect was greatest in the poorly recovered patients, with greater bilateral PMC activation. These findings indicate that the contralesional PMd may assist recovery of upper limb movement when more severe impairment is present, but is probably restricted to proximal movement (Nirkko et al., 2001). Whilst contralesional activation may be maladaptive in mildly affected patients, it may be beneficial in those more severely affected (Talelli et al., 2006). Involvement of a 51
64 broad neural network may not enable complete functional recovery of the upper limb, but it may provide for more movement than would have otherwise been possible Interhemispheric inhibition In the healthy brain, motor cortex excitability is approximately symmetrical and mutual inhibition acts on each M1 via the corpus callosum. In healthy adults, TMS studies have shown that there is a reduction of interhemispheric inhibition (IHI) from the ipsilateral M1 to the contralateral M1 and an increase in IHI from the contralateral to the ipsilateral M1, just prior to movement onset (Duque et al., 2005, Grefkes et al., 2008b, Murase et al., 2004). Ultimately this facilitates the intended movement and prevents muscular activity in the nonperforming upper limb (Nowak et al., 2009). A stroke can disrupt interhemispheric inhibition, which can contribute to imbalance in corticomotor excitability. Early after stroke, a reduction in ipsilesional IHI onto the contralesional M1 may influence corticomotor excitability symmetry (Bütefisch et al., 2008, Shimizu et al., 2002). Shimizu et al. (2002) showed an absence of transcallosal inhibition (as measure by ipsilateral silent period) from the ipsilesional M1 to the contralesional hemisphere in patients less than 3 months poststroke, but only in patients with lesions at or above the level of the corpus callosum. They proposed that reduced transcallosal inhibition contributed to the observed disinhibition of the contralesional M1, but no correlation analysis was conducted. Using a paired pulse TMS method Butefisch et al. (2008) investigated IHI in subacute stroke patients (up to 6 weeks poststroke). They showed abnormally reduced IHI passing from the ipsilesional to contralesional M1 in cortical patients, in agreement with Shimizu et al. (2002). They also observed reduced IHI in subcortical patients. Differences in the measures of inhibition may contribute to this discrepancy. Transcallosal inhibition assessed with silent period duration does not necessarily measure the same population of neurons as 52
65 interhemispheric inhibition using paired pulse TMS (Chen et al., 2003), and should therefore be considered complementary rather than equivalent. Butefisch et al. (2008) did not report a change in IHI from the contralesional to the ipsilesional M1 when compared to control subjects. Measures of IHI were not correlated with SICI in the study by Bütefisch et al. (2008), but SICI is highly variable in the first few weeks of stroke (Swayne et al., 2008). At the early stages poststroke, IHI acting on the contralesional M1 from ipsilesional M1 appears reduced. This is consistent with reduced output in general, via both corticospinal and interhemispheric pathways, from the M1 of the lesioned hemisphere. The rebalance of IHI may contribute to improved ipsilesional M1 control. Murase et al. (2004) demonstrated that IHI from the contralesional M1 to the ipsilesional M1 can be excessive in chronic stroke patients. Furthermore they showed that those with better clinical recovery had reduced IHI acting onto ipsilesional M1 at paretic upper limb movement onset, compared to poorly-recovered patients, a finding supported by Duque et al. (2005). On the other hand, the concept of interhemispheric competition has been proposed to account for poor recovery in some patients (Nowak et al., 2009). Over-activity in the contralesional M1 can lead to increased inhibitory effects on the ipsilesional M1, and under-activity of the ipsilesional M1 may pass less inhibition onto the contralesional M1 (Murase et al., 2004, Shimizu et al., 2002). This can lead to a compounding cycle that exacerbates both contralesional M1 hyperexcitability and ipsilesional M1 hypoexcitability. Overall, a rebalancing of IHI contributes to better motor outcomes, whereas a persistent imbalance can lead to persistent impairment of upper limb function. Complementary evidence from TMS and fmri studies support the idea that balanced hemispheric excitability, where ipsilesional control of the paretic upper limb is regained, leads to a better motor outcome (Di Lazzaro et al., 2010a, Koski et al., 2004, Traversa et al.,1998, Ward et al., 2003a). The role of the 53
66 contralesional M1 in recovery from stroke remains unclear, but in some people it may potentially be an important contributor to at least partial function of the paretic upper limb UDP after stroke In healthy adults, long-term and short-term training can increase the neurophysiological responsiveness of M1 representations that are specific to the trained task (Classen et al., 1998, Pascual-Leone et al., 1993, Pearce et al., 2000). This use-dependent process involves mechanisms that are likened to LTP. Motor training provides specific and repetitive activation of afferent synapses onto pyramidal cells in M1, which can lead to increased synaptic efficacy of these corticomotor pathways. After stroke the spontaneous reorganisation of the motor system, may be an attempt to make ipsilesional M1 (and contralesional M1) more receptive to input from within surrounding movement representations and other motor-related areas. In particular, the general disinhibition observed in the first few months after stroke is likely to provide a context that optimises the potential for UDP. Research conducted in animal models of stroke has indicated enriched rehabilitation and specific training of the paretic forelimb can lead to beneficial reorganisation of the motor system, which is associated with improvements in motor behaviour (for a review, see Kleim and Jones, 2008). In humans, accumulating research has started to shed light on the neurophysiological processes that underlie UDP after stroke. An effort has been made to relate the efficacy of rehabilitation approaches with use-dependent reorganisation in the motor cortex. Several studies have considered the effects of longer periods of motor training on the reorganisation of the M1, whilst fewer have evaluated the effects of single training sessions on rapid reorganisation of the motor system. 54
67 Long-term training Studies evaluating UDP and clinical recovery after stroke have mainly focused on structured rehabilitation approaches such as task-orientated (Koski et al., 2004, Jang et al., 2003, Nelles et al., 2001), task-specific (Barreca et al., 2003, Carey et al., 2002, French et al., 2010), Bobath and constraint-induced training (Levy et al., 2001, Liepert et al., 2000c, Liepert et al., 2001, Liepert et al., 2006, Sawaki et al., 2008,, Schaechter, 2004, Wittenberg et al., 2003). These interventions have been delivered at different stages poststroke and for varying treatment durations. Despite this, these studies provide useful information to help evaluate the important relationship between specific interventions and both clinical and neurophysiological recovery after stroke. Task-oriented training involves the repetitive practice of tasks using whatever proximal or distal function is present. Commonly this involves training of components of everyday activities, and involves the interplay of musculoskeletal, cognitive, perceptual and neural systems (Schaechter, 2004). In a preliminary study, Koski et al. (2004) used this training approach and explored any associated cortical reorganisation using TMS. They also correlated cortical reorganisation with change in functional recovery (Koski et al., 2004). Ten stroke patients (4 64 months poststroke) were included with a wide range of functional abilities. Each participant performed a series of 90-minute training sessions, with the total number of sessions varying across patients (5 27). Task-oriented training led to functional paretic upper limb improvement in all but 1 patient. Decreases in the RMT, increased raw map volume of ipsilesional M1, as well as a normalisation of MEP amplitude ratio, from preto post-intervention were positively correlated with improvements on the Wolf Motor Function Test and Fugl-Meyer Scale. As no control group was included in this pilot study the effectiveness of the intervention cannot be determined. However, these findings are consistent with functional neuroimaging studies that have shown task-oriented training results 55
68 in functional gains that are associated with increased activity in the ipsilesional sensorimotor cortex (Jang et al., 2003, Nelles et al., 2001). Task-specific training involves repetitive practice of components of a functional task. A critical review by Barreca et al., 2003 indicated that repetitive training had a positive effect on upper limb function, but this conclusion was based on the findings of two cohort studies. In 2010 a systematic review was published by French et al., which found no improvement in upper limb function as a result of repetitive task-specific practice. This was based on the analysis of eight randomised controlled trials. They highlighted a modest difference in the magnitude of treatment effects with length of training, as increased effects size were present after longer training regimes. This difference did not reach significance, but only three studies included more than 20 hours of training. Intensive training of paretic index finger has been evaluated using fmri in chronic stroke patients (Carey et al., 2002). Ten chronic stroke patients with mild to moderate upper limb impairment completed training involving tracking waveforms on a computer screen using paretic index finger extension and flexion movements. In this randomised cross-over study, patients completed training with their paretic hand and completed a period of no treatment of equal duration, as a control. Training sessions (18 20) were minutes long and conducted over 2 5 weeks, dependent on patient availability. Increased accuracy in finger tracking and improvement in grip function was only seen after training. Importantly, behavioural improvements in grip after taskspecific training of the index finger were associated with a shift in the laterality of activation in sensorimotor cortices from largely contralesional to predominantly ipsilesional (Carey et al., 2002). These results indicate that unilateral task-specific hand training induced functional improvements that were related to normalisation of brain activation. There is much interest in the potential benefit from bilateral training. One specific example of task-specific training is Bilateral Arm Training with Rhythmic Auditory Cueing 56
69 (BATRAC) (Whitall et al., 2000). For this intervention, patients sit in front of a manipulandum holding t-bars that move independently in near frictionless motion that approximates reaching for an object. In time with a metronome beat, patients are required to reach forward and back with both arms simultaneously. The trunk is restrained to prevent excessive compensatory trunk flexion during reach. This involves forced-use of the paretic arm, but does not restrict movement of the nonparetic arm like in CIT. Functional improvements of the paretic upper limb of chronic stroke patients were seen after a 6 week programme of 20 minutes active training (over a 1 hour session) on 3 days per week. BATRAC has also been investigated with fmri. Luft et al. (2004) investigated the reorganisation of motor related brain regions in response to BATRAC, comparing this with dose-matched therapeutic exercises based on neurodevelopmental principles (e.g. thoracic spine mobilisation, weight bearing with the paretic limb and opening a closed fist). Six of nine patients in the BATRAC group showed an increase in activation of ipsilesional M1, PMC and cerebellum, whereas the dose-matched exercise group did not show any changes in activation. Only patients in the BATRAC group who showed increased ipsilesional activation improved their arm function more than the dose-matched therapeutic exercise group. This may indicate that BATRAC training improves function of the paretic upper limb by promoting activity into the ipsilesional hemisphere. One potential confounder is that bilateral training is combined with rhythmic cueing, which may itself contribute to promotion of UDP, thus determination of the relative influence of bilateral training on functional gain cannot be determined. Further studies would need to compare self-paced and metronomecued bilateral arm training to delineate their respective contributions to functional improvement. Furthermore, no comparison was made with unilateral training so it remains unclear whether task-specific bilateral upper limb training intervention can improve UDP and/or function more than unilateral paretic arm training. 57
70 A TMS study conducted by Summers et al. (2007) investigated bilateral and unilateral training of task-specific training with TMS. Twelve chronic stroke patients were randomly assigned to repetitive practice (50 trials for 6 days) involving reaching and placing a wooden dowel on a shelf at shoulder height, with either the paretic arm only or both arms simultaneously. Patients in the bilateral group, but not the unilateral training group, showed improved scores on the motor assessment scale. Likewise, the bilateral training group showed a tendency for reduction in nonparetic extensor digitorum communis map volume, but this did not reach a significant level. The authors speculate that bilateral training may lead to decreased transcallosal inhibition being passed to ipsilesional M1 (Summers et al., 2007). It is important to note that TMS assessment was limited to three participants in each group, due to TMS contraindications, technical issues and the absence of MEPs in the paretic target muscle. The coupling of bilateral upper limb training with neuromuscular electrical nerve stimulation has achieved significant large behavioural effects (Cauraugh et al., 2010). Neuromuscular electrical nerve stimulation is a relatively common rehabilitation intervention used to improve paretic upper limb sensorimotor recovery, although when used on its own the beneficial effect is borderline (Langhorne et al., 2009). The application of EMGtriggered neuromuscular electrical stimulation of the paretic upper limb, during performance of repetitive wrist and finger extension movements, can increase paretic upper limb function and voluntary EMG activity (Cauraugh and Kim, 2002, Cauraugh and Kim, 2003a, Cauraugh and Kim, 2003b, Cauraugh et al., 2005). These improvements were over and above that observed after pure bilateral or unilateral training, with or without active stimulation. Although bilateral training (+/- neuromuscular stimulation) may provide some functional gains above that of unilateral training, larger studies are obviously required to investigate UDP and recovery. Furthermore, TMS studies need to investigate UDP in an extended range of task-specific activities. 58
71 CIT involves intensive training with the paretic upper limb with a trained therapist (up to 6 hours most days) and the immobilisation of the nonparetic arm (in a splint or mitt) for typically 90% of waking hours for 2 weeks (Taub et al., 1993). Two recent systematic reviews of randomised controlled trials found clear functional benefits of CIT (Langhorne et al., 2009, Sirtori et al., 2009). Together these reviews indicated improved arm function, with more modest benefits for hand function. One major limitation of CIT is the strict inclusion criteria. Patients are required to have a minimum of 10 degrees of active finger and wrist extension in order to benefit from the therapy and as a consequence less than 10% of patients may benefit from this strategy (Taub et al., 1993). In addition, most studies using CIT do not include patients with symptoms such as pain and spasticity (Dahl et al., 2008, Taub et al., 2006, Wolf et al., 2006), which are common poststroke. These restrictions limit the use of this intensive therapy approach to those who have mild or moderate impairment in the paretic upper limb. Neurophysiological studies have been conducted in an effort to validate the neurophysiological basis for CIT. Some studies with a small number of stroke participants have shown expansion of motor maps derived with TMS in the ipsilesional M1 after CIT or modified CIT (fewer hours of splint and/or therapy) in the chronic and subacute phases poststroke, when compared to control interventions or the contralesional side (Liepert et al., 2000c, Liepert et al., 2001, Liepert et al., 2006, Wittenberg et al., 2003). An increase in the ipsilesional motor map has been associated with mild (mean < 5 mm) shifts in CoG of the map (Liepert et al., 2000c, Liepert et al., 2001). In a more recent study, Liepert et al. (2006) showed a larger shift in CoG (mean < 10 mm) after modified CIT, and interestingly the shift was in the opposite direction from areas surrounding the hotspot with the largest SICI pretreatment. These authors showed that improved performance on the Wolf Motor Function Test was related to the magnitude CoG shift. However, CoG shifts of mean 68 mm have 59
72 been shown over time (7 14 days) in the absence of intervention in healthy subjects (Wolf et al., 2004), and therefore clinical significance of CoG shifts needs further investigation. Small reductions in the size of the contralesional motor map have been noted after CIT (Wittenberg et al., 2003). When examined longitudinally, differences between hemispheric corticomotor excitability pre-intervention can become negligible postintervention (Liepert et al., 2001, Wittenberg et al., 2003). These findings indicate that CIT can produce reorganisation in the ipsilesional M1, and may improve balance of corticomotor excitability imbalance. However, the correlation of increased ipsilesional excitability with improvements paretic upper limb function is not clear, enlargement in ipsilesional TMS motor map size has been correlated with improvements in paretic upper limb function (Liepert et al., 2001, Liepert et al., 2006), but not in others (Sawaki et al., 2008). Consistent with this discrepancy, varied brain activation patterns have been shown after CIT. In 2001, Levy et al. (2001) evaluated two chronic stroke patients before and after CIT with fmri. The motor gains exhibited in both patients were accompanied by increased activation in the periinfarct area in both patients and in bilateral sensorimotor cortices in one of these patients, during paretic hand movements (Levy et al., 2001). The inability of the patients to complete the hand motor task adequately pre-intervention and lack of comparison to the nonparetic hand make it difficult to draw conclusions from this pilot study. The results of two further fmri studies have shown improved motor function with increased activation in ipsilesional secondary motor areas (Johansen-Berg et al., 2002b) and contralesional motor cortex (Schaechter, 2004) after modified CIT, involving fewer hours of therapist-directed paretic upper limb intervention. These changes were maintained six months after therapy (Schaechter et al., 2002). Whilst together these studies indicate that CIT can produce reorganisation of the motor cortex occur, no consensus is provided on the mechanisms that may be occurring to drive functional improvement. It is probable that the pattern of therapy- 60
73 induced plasticity is dependent on many factors, such as CST integrity, as is the case for spontaneous processes of recovery after stroke. Collectively this research indicates that long-term training is able to promote UDP in stroke patients. However, specific mechanisms for any given therapy approach has not been established. It must be remembered that these interventions are more intensive than rehabilitation would generally provide. In fact, in the meta-analysis conducted by Kwakkel et al. (2004) indicated that patients in experimental groups on average received 959 minutes more therapy than those receiving standard rehabilitation. Modified CIT studies have given some indication that fewer hours of CIT may be adequate to produce lasting reorganisation, but the duration of these modified regimes still exceed the number of hours given in usual and standard rehabilitation care. Further dose-response studies are required Short-term training In healthy patients, temporary increases in corticomotor excitability of the trained representation have been observed after short-training sessions of repetitive simple movements. Only a few studies have specifically investigated UDP in response to a single short training session in stroke patients (Liepert et al., 2000a, Sawaki et al., 2006). In 2000, Liepert et al. (2000a) showed that training-induced increases in cortical motor map size in the ipsilesional M1 can be observed in subacute stroke patients (1 2 months poststroke) immediately after a single 90 minute physiotherapy session (Liepert et al., 2000a). Although improvements in motor dexterity were noted post-training, the amount of this improvement was not correlated with the amount of increase of motor output size. One day later, motor output size had returned toward baseline, regardless of persistence or deterioration in dexterity of the paretic hand. 61
74 In another study, Sawaki et al. (2006) assessed seven chronic stroke patients using an established UDP paradigm (Classen et al., 1998) before and after 30 minutes of repetitive, consistent, thumb movement training. This short-term training protocol failed to elicit UDP in these stroke patients, although use-dependent plastic changes were generated in 5/7 subjects when training was preceded by somatosensory stimulation. The authors do not specifically comment on the lack of generation of UDP, although one reason for this may be that the method used in this study to analyse UDP (i.e. change in the proportion of TMSevoked movement into a narrow training zone) has the potential to miss modest plastic changes, as mentioned previously (Meintzschel and Ziemann, 2006). Koganemaru et al. (2010) found no abensce of UDP in response to 15 minutes of neuromuscular stimulation of the paretic hand. It is possible that 15 minutes was insufficient. A temporary reduction in GABAergic transmission has been proposed to account for rapid reorganisation after short-term training in stroke patients (Liepert et al., 2000a), like in healthy adults. Involvement in the GABAergic system in reorganisation of M1 was supported in a long-term training study (Liepert et al., 2006). Recently, Blicher et al. (2009) showed that SICI was reduced in the ipsilesional M1 of chronic stroke patients compared to healthy control subjects, like others have found (Swayne et al., 2008). However, an important distinction between these papers is the severity of stroke. Swayne et al. (2008) reported persistent disinhibition in more severely affected stroke patients, whereas the study by Blicher et al. (2009) only recruited patients with mild or no motor deficits after stroke, which tend to show normalisation of SICI over time (Manganotti et al., 2008, Wittenberg et al., 2003). Blicher et al. (2009) report an interesting finding, that SICI was not modulated in the abductor pollicis brevis motor representation after 15 minutes of paretic thumb abduction movements paced with a 1 Hz metronome, as it was in healthy subjects (Blicher et al., 2009). The results of this study and the latter indicate that modulation of SICI a mechanism that may 62
75 underlie UDP, could be impaired after stroke, and this potentially has serious implications for rehabilitation. Use-dependent plasticity may be an essential element of skill acquisition for those recovering from a brain injury (Classen et al., 1998). However, the theme emerging from these studies is that a single short-term training session does not elicit lasting changes in plasticity or performance, and is not sufficient to induce meaningful reorganisation poststroke. Longer-term training regimes on the other hand can lead to persistent reorganisation and functional gain, however the protocols investigated are more intensive than that prescribed in current standard rehabilitation. Importantly, if the ability for motor practice to induce disinhibition is impaired after stroke, it is possible that lower intensity training on its own will not be sufficient to promote UDP in recovery in some patients. 63
76 4.3. Improving motor recovery following stroke using repetitive transcranial magnetic stimulation The following section was adapted and reported as a review article in Physical Therapy Reviews, Ackerley and Stinear, Stimulating stimulation: Can we improve motor recovery following stroke using repetitive transcranial magnetic stimulation, Copyright W.S.Maney & Sons Ltd (2010);15; and Repetitive transcranial magnetic stimulation (rtms) When TMS is applied repeatedly it is referred to as repetitive TMS (rtms). Repetitive TMS is a form of non-invasive brain stimulation that is currently used in neuroscience research and has started to be trialled in people with neurological disorders. Conventional rtms can increase or decrease cortical excitability depending on the frequency of the stimulation pulses. In healthy adults, low frequency rtms (1 Hz) decreases excitability of the corticomotor pathway, conversely high frequency application ( 3 Hz) increases excitability (Fitzgerald et al., 2006). Conventional rtms is typically applied for min, depending on the number of stimuli and the frequency of their delivery. Repetitive TMS of M1 can modulate the excitability of corticomotor pathways for a period of time that outlasts the period of stimulation (often min) (Fitzgerald et al., 2006). Patterned rtms, namely theta burst stimulation, allows the safe delivery of low intensity stimuli at high frequency. Theta burst stimulation can increase or decrease excitability depending on the timing of stimuli delivery. Stimuli are delivered in bursts of 3 at 50 Hz, and these bursts are delivered every 200 ms (Huang et al., 2005). Theta burst stimulation can be delivered continuously (continuous theta burst stimulation, ctbs) or intermittently with 2 seconds of stimulation interleaved with 8 seconds of rest (intermittent theta burst stimulation, itbs). In general, the excitability of the corticomotor pathway is 64
. 4.3.2.")
77 decreased by continuous theta burst stimulation and increased by intermittent theta burst stimulation, when delivered to M1 in healthy individuals (Huang et al., 2005) Using rtms to improve motor recovery after stroke In healthy adults, motor cortex excitability is symmetrical between the hemispheres and the amount of inhibition passed from one M1 to the opposite M1, via the corpus callosum, is equivalent (Figure 4.1A). After stroke, excitability is usually decreased in ipsilesional M1 and increased in contralesional M1 (Swayne et al., 2008, Traversa et al., 1998). Impaired communication between M1s may contribute to this imbalance. Over-activity in contralesional M1 can lead to it passing excessive inhibition to ipsilesional M1 (Murase et al., 2004, Shimizu et al., 2002). Similarly, under-activity in ipsilesional M1 can lead to it passing less inhibition to contralesional M1 (Figure 4.1B) (Murase et al., 2004, Shimizu et al., 2002). A B C D Figure 4.1 Shaded hemisphere = lesioned hemisphere. M1 ipsi = Ipsilesional primary motor cortex. M1 contra = Contralesional primary motor cortex. A. In healthy adults, the excitability of the primary motor cortices (M1s) and the inhibition passed between hemispheres are balanced. B. After stroke, excitability of ipsilesional M1 is decreased and excitability of contralesional M1 is increased. There is more inhibition passed from contralesional to ipsilesional M1 than vice versa. C. Facilitatory rtms of ipsilesional M1 increases the excitability of ipsilesional M1. D. Suppressive rtms of contralesional M1 decreases the excitability of contralesional M1, and may indirectly increase excitability of ipsilesional M1 by decreasing inhibition to ipsilesional M1. Repetitive TMS can be used to rebalance the excitability of corticomotor pathways following stroke. Two strategies are used in an attempt to restore symmetry. One is to turn 65
78 up the excitability of ipsilesional M1 using facilitatory rtms, either high-frequency (> 1 Hz) rtms or itbs (Figure 4.1C). The alternative is to turn down the excitability of contralesional M1 using suppressive rtms, either low frequency (~ 1 Hz) rtms or ctbs (Figure 4.1D). Both strategies aim to influence the neurophysiology of the brain (i.e. modulate excitability) in order to enhance motor behaviour and function of the paretic upper limb. Examples of studies using rtms after stroke are provided in Table 4.1. Table 4.1: Examples of studies using rtms after Stroke N Recovery phase Intervention Physiological measures Behavioural measures Ipsilesional M1 (Ameli et al., 2009) 29 All 10 Hz rtms fmri Finger and hand movements (Yozbatiran et al., 2009) 12 Chronic 20 Hz rtms Blood Pressure Barthel Index Fugl-Meyer Action Research Arm Test Hand grip strength Nine hole peg test Active range of motion (Talelli et al., 2007a) 6 Chronic itbs MEPs Reaction time (Kim et al., 2006) 15 Chronic 10 Hz rtms + training MEPs (Khedr et al., 2005) 52 Acute 3 Hz rtms* MEPs RMT (Malcolm et al., 2007) 19 Chronic 20 Hz rtms + CIT* MEPs Sequential finger movements Scandinavian Stroke Scale NIH Stroke Scale Barthel Index Wolf Motor Function Test Motor Activity Log Box and block test Contralesional M1 (Dafotakis et al., 2008) 12 Acute 1 Hz rtms Grip-lift (Liepert et al., 2007) 12 Acute 1 Hz rtms Grip strength Nine Hole Peg Test (Nowak et al., 2008) 15 Acute 1 Hz rtms fmri Finger tapping Reach-to-grasp (Mansur et al., 2005) months 1 Hz rtms Reaction time Purdue Pegboard Test Finger tapping (Takeuchi et al., 2005) 20 Chronic 1 Hz rtms MEPs Pinch force and acceleration TCI (Talelli et al., 2007a) 6 Chronic ctbs MEPs Reaction time (Takeuchi et al., 2008) 20 Chronic 1 Hz rtms Pinch force and acceleration + training (Fregni et al., 2006) 15 Chronic 1 Hz rtms* RMT Jebsen Taylor Hand Test Reaction time Purdue Pegboard Test RMT = Rest motor threshold; NIH = National Institutes of Health; CIT = constraint-induced therapy; TCI = Transcallosal inhibition; * = repeat sessions 66
79 Applying rtms to the primary motor cortex of the lesioned hemisphere The feasibility of using facilitatory rtms with stroke patients to increase the excitability of ipsilesional M1 has been explored experimentally. High frequency rtms (3-20 Hz) and itbs protocols are well tolerated and safe in patients who are eligible for TMS (Ameli et al., 2009, Carey et al., 2008, Khedr et al., 2005, Kim et al., 2006, Malcolm et al., 2007, Talelli et al., 2007a, Yozbatiran et al., 2009). Importantly, experimental results have been promising. Studies with stroke patients have confirmed that facilitatory rtms over ipsilesional M1 increases the excitability of corticomotor pathways to the paretic hand (Kim et al., 2006, Talelli et al., 2007a), mirroring the results seen in healthy adults. Paretic hand motor behaviour can improve after rtms of ipsilesional M1. A review by Nowak et al. reports improvements of motor performance of the paretic hand between 20% and 125% in studies investigating facilitatory rtms (Nowak et al., 2009). A single session of high frequency rtms can enhance paretic hand behaviours including strength, dexterity and range of motion of the paretic hand in stroke patients with mild to moderate upper limb impairment (Ameli et al., 2009, Kim et al., 2006, Talelli et al., 2007a, Yozbatiran et al., 2009). Furthermore, Kim et al. found that the amount of improvement in motor behaviour was correlated to the increase in ipsilesional M1 excitability (i.e. the greater the increase in excitability, the greater the improvement in accuracy on a complex finger motor task) (Kim et al., 2006). These findings support the idea that rtms of ipsilesional M1 helps to rebalance excitability, leading to improvements in some aspects of paretic upper limb movement and control. Changes in overall upper limb function after rtms of ipsilesional M1 are largely unexplored. Yozbatiran et al. (2009) assessed upper limb function using the Fugl-Meyer Arm scale (Fugl-Meyer et al., 1975), and Action Research Arm Test (Lyle, 1981, Yozbatiran 67
80 et al., 2008). They found no change in scores from baseline after 20 Hz rtms. In contrast, reduced disability has been reported in acute stroke patients who received repeated sessions (10) of high frequency rtms of ipsilesional M1 prior to their normal therapy sessions (Khedr et al., 2005 (Khedr et al., 2005). Repeated sessions of rtms of ipsilesional M1 may be required to produce a clinically meaningful effect on paretic upper limb function. Applying rtms to the primary motor cortex of the opposite hemisphere For stroke patients, suppressive rtms of contralesional M1 is applied to decrease its excitability, and reduce the excessive inhibition passed from contralesional M1 to ipsilesional M1. The aim is to indirectly increase ipsilesional M1 excitability and therefore help to rebalance M1 excitability. Most research to date supports this idea. Typically, 1 Hz rtms of contralesional M1 decreases excitability of the corticomotor pathway to the nonparetic hand and increases excitability of the corticomotor pathway from ipsilesional M1 to the paretic hand (Takeuchi et al., 2005). A reduction in the amount of inhibition passed from contralesional to ipsilesional M1 appears to contribute to these effects on excitability (Takeuchi et al., 2005). The application of ctbs to contralesional M1 has also been investigated. Like 1 Hz rtms, ctbs of contralesional M1 tends to decrease non-lesioned corticomotor excitability (Talelli et al., 2007a), however the effect on excitability of the lesioned corticomotor pathway is more varied. After ctbs of contralesional M1, excitability of the lesioned corticomotor pathway has been shown to increase (Di Lazzaro et al., 2008a), or remain unchanged (Talelli et al., 2007a). Continuous TBS is particularly vulnerable to movement of the upper limb before, during and after application, which may account for the discrepancies between research findings (see Chapter 5 for discussion) (Gentner et al., 2008, Huang et al., 2008, Iezzi et al., 2008). 68
81 A functional magnetic resonance imaging study by Nowak et al. (2008) supports the use of low frequency rtms of contralesional M1 to rebalance excitability. These researchers showed that rtms of contralesional M1 reduced the neural activity in the initially overactive contralesional hemisphere and focused neural activity in the lesioned hemisphere. In other words, neural activity became more normal (i.e. more similar to the neural activation pattern seen in healthy individuals) following rtms of contralesional M1. The mechanisms of differing rtms protocols applied to contralesional M1 require more investigation. The ultimate goal is that neurophysiological changes induced by suppressive rtms will translate to enhanced motor behaviour and function of the paretic upper limb. Studies to date have shown modest improvements (10% and 60%) in motor performance after single sessions of rtms of contralesional M1 (Nowak et al., 2008, Nowak et al., 2009). Repetitive TMS applied at 1 Hz to contralesional M1 can enhance strength and dexterity of the paretic hand in mild to moderately impaired chronic stroke patients (Dafotakis et al., 2008, Mansur et al., 2005, Nowak et al., 2008, Takeuchi et al., 2005, Takeuchi et al., 2008). With repeated sessions these effects appear cumulative, are longer-lasting, and can positively influence upper limb function (Fregni et al., 2006). Priming therapy with rtms After stroke, neuroplasticity leads to reorganisation within the brain enabling recovery of movement and function. Upper limb physical therapy facilitates neuroplasticity by promoting activity and functional use of the paretic upper limb. This reinforces the strengthening of undamaged neural connections, and the un-masking of alternative motor pathways to innervate the paretic upper limb. In other words, therapy provides input to help the brain to reorganise for recovery of upper limb function. But what if we could prepare (i.e. prime ) the brain to respond better to this therapy? Can we enhance an individual s 69
82 response to therapy by priming the brain with rtms before therapy, increasing the excitability of ipsilesional M1 and making it easier to form new neural connections? Research investigating rtms primed therapy for stroke patients is in its infancy. Two single-session sham-controlled studies have shown that the effect of motor training was enhanced by priming M1 with rtms (Kim et al., 2006, Takeuchi et al., 2008). These studies reported short-term improvements in motor behaviour that were specific to the trained task (Kim et al., 2006, Takeuchi et al., 2008). It is unclear whether these improvements in motor behaviour following primed therapy can generalise to other similar tasks. Repetitive TMS has been used to prime M1 before therapy to influence overall upper limb function. Two sham-controlled, randomised and double-blinded studies applied rtms to ipsilesional M1 before therapy, over multiple sessions. Acute stroke patients who received 3 Hz rtms prior to 10 consecutive therapy sessions had an immediate and sustained (followup at 20 days) improvement in scores on two disability scales (Barthel Index and National Institutes of Health Stroke Scale) (Khedr et al., 2005). Contrasting these results, there was no functional advantage of priming CIT with 20 Hz rtms (Malcolm et al., 2007). Suppressive rtms of contralesional M1 has also been used to turn down the excitability of the nonlesioned hemisphere, but may not be appropriate in all patients. The non-lesioned hemisphere may be an important contributor to recovery in some patients to at least partial recovery of the upper limb, when corticospinal tract integrity is significantly affected (Lotze et al., 2006, Ward et al., 2006). More research is required to elucidate the potential benefit of rtms primed therapy for upper limb rehabilitation after stroke and its individualised application. 70
83 Where to from here? Despite an accumulating body of literature in favour of a beneficial role for rtms in management of stroke, many questions remain unanswered: How exactly does rtms exert its effect? What are the optimum parameters for application? What is the best timing and site for stimulation? Are these the same for everyone? The mechanisms underlying changes in corticomotor excitability are not fully understood. TMS acts on small neurons in the outer layers of the cortex (intracortical neurons), subsequently activating the pyramidal cells contributing to the corticospinal tract (Hallett, 2007). It is thought that facilitatory rtms induces a process similar to LTP and suppressive rtms induces a process similar to LTD (Cardenas-Morales et al., Ridding and Rothwell, 2007). These processes would account for changes in the efficiency of the connections between neurons in the cortex. Further research at cellular, molecular and neural levels is required to further elucidate the mechanisms involved in neurophysiological modulation after rtms. Should rtms be used during acute rehabilitation or combined with therapy in the chronic phase after stroke? Most research has been conducted at the chronic phase poststroke. Studies at this time allow researchers to assume that any effects of the intervention are (most likely) attributable to the intervention itself (as spontaneous recovery is largely complete and patients are usually not actively engaged in rehabilitation). Overall the experimental evidence indicates that rtms can enhance motor performance even some years after stroke, though it could be that using rtms may be more appropriate earlier after stroke. A handful of studies have been conducted in patients in the acute phase after stroke (Dafotakis et al., 2008, Khedr et al., 2005, Liepert et al., 2007, Nowak et al., 2008). They have shown short-term improvements in activity and participation in patients who received 71
84 real rtms when compared to those who received sham rtms. Longitudinal studies are required to determine the long-term effects of rtms used during the early poststroke period. There is little consensus regarding the optimal settings for rtms application. Varying stimulation frequencies (1 20 Hz), stimulation intensities (80-120% of motor threshold) and number of stimuli ( ) have been used. It is speculated that patterned rtms (i.e. TBS) can produce more consistent and more persistent effects on excitability and behaviour. Another advantage is that application time is significantly shorter (1 2 min) when compared to conventional rtms (10 25 min). The number of sessions required to produce the best results is unknown, but it is likely that repeated sessions are required. Current evidence is insufficient to determine the most advantageous parameters for rtms in the clinical context. Is it best to apply rtms to the lesioned or non-lesioned M1? There have been mild to moderate positive treatment effects reported after both applications. One disadvantage of stimulating ipsilesional M1 is that it requires high frequencies of rtms, and therefore has a greater risk of inducing seizures (Rossi et al., 2009). The use of the published safety guidelines when using high frequency rtms protocols can minimise this risk (see following section on the safe use of rtms). The itbs protocol is also a suitable alternative, as it delivers high frequency stimuli but at a much lower intensity than conventional rtms. The risk of inducing seizure is also less when using low frequency rtms. This has prompted researchers to explore rtms of contralesional M1 to influence ipsilesional M1 via the corpus callosum. However, the processes underlying interhemispheric communication are not yet fully understood. Gaining insight into the mechanisms involved in direct versus indirect stimulation of ipsilesional M1 should guide further clinical research. It also remains possible that rtms may be beneficial in other brain regions that contribute to movement, such as the premotor cortex (Mansur et al., 2005). 72
85 Not everybody responds to rtms in the same way. For example, patients with subcortical stroke without any cortical damage are more likely to respond beneficially to rtms of ipsilesional M1 (Ameli et al., 2009). Variations in the gene for brain-derived neurotrophic factor (BDNF) reduce an individuals response to training (Kleim et al., 2006), and to rtms (Cheeran et al., 2008). In 2007, Stinear et al. (2007) proposed an algorithm that uses TMS and functional magnetic resonance imaging to predict functional potential and guide individualised rehabilitation (Stinear et al., 2007). The authors suggest priming the brain with non-invasive brain stimulation, such as rtms, may be most beneficial when MEPs are absent on TMS assessment. Furthermore, the structural integrity of the motor pathways from the lesioned hemisphere to the paretic hand (as assessed using MRI) may guide the choice between priming ipsilesional M1 before unilateral therapy and priming contralesional M1 before bilateral therapy. This algorithm requires validation in larger randomised controlled studies. Finally, rtms is not the only priming option. Investigation into other non-invasive stimulation techniques such as transcranial direct current stimulation and active-passive bilateral training are being conducted concurrently. The advantages and disadvantages of one technique versus another, for a particular individual, have not been established (Hummel et al., 2008). Other methods of priming the brain may include invasive stimulation techniques (such as epidural electrical stimulation) and pharmacological interventions. It is possible that a combination of techniques offers the best results The safe use of rtms Guidelines for rtms were established in 1998 to ensure the safe and appropriate use of this technique. More recently, a review entitled Safety, ethical considerations, and application of transcranial magnetic stimulation in clinical practice and research was 73
86 published to update the original guidelines (Rossi et al., 2009). This was in the anticipation that rtms will become increasingly prevalent across several medical specialties in the years to come. People need to be thoroughly screened before having single pulse or repetitive TMS, to determine any contraindications or precautions to TMS. For stroke patients, screening should involve consultation with an appropriate medical professional, such as a neurologist. Contraindications to TMS include: the presence of a pacemaker or other implanted metal device; a history of seizures; and pregnancy. It may be inappropriate to have TMS in conjunction with certain medications (as they may increase seizure risk or alter the response to TMS) or with certain medical conditions (past or present). Before using TMS, it is essential for the operator to be familiar with all current safety guidelines and those specific to the institution where the TMS is being applied. TMS should only be carried out by trained professionals, and all participants should give their informed consent before receiving TMS. Although it is anticipated that rtms could be an effective adjunct to therapy in the future, it is important to stress that rtms is currently a research technique. To summarise, after stroke rtms can be safely used to modulate the excitability of descending motor pathways to the paretic arm and hand. Single-session studies have shown that increasing excitability of the lesioned corticomotor pathway using facilitatory rtms of ipsilesional M1, or decreasing excitability of the non-lesioned corticomotor pathway with suppressive rtms of contralesional M1, can rebalance excitability and translate to short-term improvements in motor behaviour of the paretic hand, such as strength and dexterity. It is possible that rtms is most effective in conjunction with therapy. By increasing the responsiveness of neurons in the brain to input, rtms may provide a window of opportunity for enhanced neuroplasticity in response to upper limb therapy. This could lead to improved motor recovery after stroke, but further longitudinal studies are required to confirm this. Questions about who might benefit most from rtms, and from what type of 74
87 application, remain to be answered. It is important that research clarifies these issues before rtms is integrated with current rehabilitation practice within a clinical setting. 75
88 Chapter 5. TECHNICAL AND ETHICAL CONSIDERATIONS 5.1. Transcranial magnetic stimulation (TMS) Introduced in 1985, TMS has become a common research tool to study human neurophysiology. This technique provides a safe, non-invasive and painless means to assess motor cortical plasticity (Hallett, 2007, Rothwell et al., 1991). A commercially available magnetic stimulator is used to discharge a capacitor through wire windings inside in a figureof-eight coil. This generates a brief magnetic field, which can be monophasic or biphasic in nature depending on the stimulator used. When the coil is held tangentially against the scalp over M1 at approximately 45 to the sagittal plane, the magnetic field produced passes through the skull and induces an electric current in the area of cortex under the coil. The induced current activates the pyramidal neurons of the CST, most likely trans-synaptically via intracortical interneuron connections (Rothwell et al., 1991). Monophasic stimulation with the induced current flowing in the tissue in a posterior to anterior (PA) direction optimises intracellular current in the horizontally oriented axons of intracortical circuitry (Rossini et al., 1994). The intensity of TMS can be set in 1% increments, zero to 100% of maximum stimulator output (MSO). A single pulse of TMS of sufficient intensity, applied over the representation for a given muscle within M1, produces a motor evoked potential (MEP) in the muscle of interest on the contralateral side of the body. MEPs may also be present in the ipsilateral upper limb after stimulation of M1 on the same side of the body (Turton et al., 1996). However, ipsilateral MEPs (imeps) are uncommon in healthy adults, but can be present after neurological injury such as stroke (Caramia et al., 2000, Trompetto et al., 2000, Turton et al., 1996, Werhahn et al., 2003). 76
89 The MEP is recorded by surface electromyography (EMG) via recording electrodes placed on the skin over the target muscle/s. The site of stimulation over the scalp that produces the largest MEP amplitude in the target muscle is referred to as the hot-spot. The coil location for stimulation of the hot-spot is marked on the scalp, or on a firmly fitting cap worn by the participant, to ensure consistent coil placement within and between trials. Figure 5.1 Transcranial magnetic stimulation (TMS) is applied using a coil held against the scalp. When applied to the primary motor cortex (M1), TMS can be used to assess the excitability of the corticomotor pathway to the muscle of interest on the contralateral side of the body. TMS can produce a motor evoked potential (MEP) that is recorded using electromyography (EMG) electrodes. From Physical Therapy Reviews 2010;15; Reproduced with permission. The MEP is composed of multiple descending volleys, including direct (D) and indirect (I) wave components (for a review, see Di Lazzaro et al., 2008b). D-waves represent 77
90 direct depolarisation of pyramidal neurons. I-waves (I1, I2, I3) represent indirect depolarisation of the pyramidal neurons trans-synaptically, by activation of excitatory intracortical interneurons at periods of 1.5 ms, indicative of synaptic delay. I1-waves are also referred to as early I-waves and reflect depolarisation of interneurons that synapse directly onto the pyramidal neuron (i.e. monosynaptic). I2- and I3-waves are referred to as later I- waves and are polysynaptic. I-waves are recruited in order as stimulation intensity increases (Di Lazzaro et al., 2004). D-waves tend to propagate when stimulation intensity is high (Di Lazzaro et al., 2008b). In humans, analysis of the wave components of the MEP has been carried out on recordings from cervical epidural electrodes that are present in some people for treatment of intractable pain (Di Lazzaro et al., 2004). Modulation of specific components of the MEP provides detailed insight into the mechanisms underlying plasticity. TMS can be delivered in single or paired pulses or in a train of repetitive pulses (rtms). In the laboratory setting, there are three main uses of TMS: 1) to test the excitability of corticomotor, intracortical and interhemispheric pathways; 2) to increase or decrease cortical excitability or; 3) to temporarily interrupt brain activity (Ljubisavljevic, 2006, Pascual-Leone et al., 1999, Sawaki, 2005). The commonly used measures of single and repetitive TMS that are relevant to this thesis are described below Single pulse TMS Single pulse TMS measures provide information regarding the integrity and conduction of the entire corticomotor pathway from cortex through to the target muscle at the moment of stimulation. Single pulse TMS is usually measured with monophasic stimulation. Corticomotor excitability Corticomotor excitability can be assessed with measures of motor threshold and MEP 78
91 size (including amplitude and area) recorded from the target muscle. Motor threshold probably reflects properties of the neuronal membrane (i.e. its resting threshold). When threshold membrane is hyperpolarised motor threshold increases. In contrast, when threshold membrane is depolarised motor threshold decreases. Motor threshold is the minimum TMS intensity (in %MSO) required to elicit a MEP in the target muscle, which can be recorded with the muscle at rest (RMT) and during active contraction (AMT). RMT is defined as the minimum stimulus intensity that produces a peak-to-peak amplitude of ~50 µv in 50% of trials (Rossini et al., 1994). The resting state of the muscle can be confirmed online by determining the root mean square value of EMG activity (rmsemg) in the target muscle within a defined time window just prior to stimulation (i.e. pre-trigger window). The muscle is considered to be at rest when the rmsemg value is below ~15 µv. AMT is obtained in a similar manner, however recordings are taken when the subject is performing an isotonic contraction of the target muscle at around % of maximal voluntary contraction (Day et al., 1987), with the MEP amplitude criterion set at ~ µV (Rossini et al., 1994, Rothwell et al., 1999). Motor threshold is most often determined at the hot-spot, and therefore provides information regarding the excitability of a central core of neurons within the cortical representation for the target muscle. Rest and active MT are frequently used to set TMS intensity in experimental paradigms. In stroke patients this helps to control for changes in MT over time. MEP amplitude most likely reflects synaptic efficacy. MEP amplitude is defined as the maximum peak-to-peak size (usually in mv). MEP amplitudes recorded from a muscle at rest are smaller than those recorded from an active muscle, for a given stimulation intensity (Rossini et al., 1994). This is because alpha motor neurons in the spinal cord are closer to firing threshold during active movement than at rest. A low level of tonic voluntary activity and relatively high stimulation intensity are required when attempting to measure imeps, and 79
92 usually only present in more proximal muscles with bilateral representations (Ziemann et al., 1999). There is a natural variability in MEP amplitude. To counter extreme outliers researchers commonly collect a number MEPs, for a given site and time-point. They then process data using trimming and averaging methods. Trimming involves removal of a percentage (~10%) of the smallest and largest MEPs. When MEP amplitudes are collected at a fixed site on the scalp (usually the hot-spot) across a range of intensities a recruitment curve (RC) (i.e. input-output curve, stimulus-response curve) can be plotted (Devanne et al., 1997, Ridding and Rothwell, 1997). As stimulation intensity increases, MEP amplitude increases. For intrinsic hand muscles such as FDI, the relationship is sigmoidal (Devanne et al., 1997, Ridding and Rothwell, 1997). RC curves are thought to be a more sensitive reflection of the excitability of the corticomotor pathway (Devanne et al., 1997, Ridding and Rothwell, 1997). Changes in synaptic efficacy alter the slope of the RC curve. An increased slope indicates that the neuronal pool is more readily activated by a given stimulation intensity. The increased excitability probably reflects increased density and conductance of AMPA receptors in the postsynaptic membrane. These factors strengthen the synapse, so a given input to the cell will produce more depolarisation, and the cell is more likely to reach firing threshold. When considered across many cells, the MEP will be larger for a given stimulus intensity. MEP area (often in mv ms) can be used as an alternate for MEP amplitude. MEP area is obtained from a rectified, averaged trace. A more accurate depiction of corticomotor excitability may be gained from calculating MEP area rather than MEP amplitude, especially when MEPs are polyphasic (Stinear and Byblow, 2004c). It is probable that the mechanisms underlying changes in motor threshold and MEP size differ. This is supported by pharmacological studies which show that drugs that block voltage gated sodium channels decrease motor threshold (Boroojerdi et al., 2001b, Ziemann et al., 1996a). In contrast, motor threshold is unchanged and MEP amplitude altered when 80
93 the CNS is influenced by drugs that agonise GABA A receptors and antagonise NMDA receptors (Di Lazzaro et al., 2000a, Ziemann et al., 1996a, Ziemann et al., 1998a). MEP amplitude can be increased by selective serotonin reuptake inhibitors (SSRIs) (Ilic et al., 2002a), which is an important consideration in studies of stroke patients, as the prevalence of depression is high. Recordings from repeated stimulation to multiple scalp positions surrounding the hotspot can be used to construct a cortical output map, which reflects the gross cortical representation for the target muscle. Three main measures can be ascertained; map area, map volume, and centre of gravity (CoG). Map area is the area of the scalp which produces a MEP above a particular criterion. Increases or decreases in map area are thought to reflect enlargement or reduction in the representation of the target muscle. It is important to note that TMS map area does not accurately indicate the anatomical area of the cortex that contains pyramidal neurons relevant to the target muscle, as fibres can be recruited at a distance from the coil due to trans-synaptic activation and possibly current spread (Talelli et al., 2006). Therefore it is possible that an increased in map size could reflect increased corticomotor excitability due to a reduced motor threshold. This confound could limit the use of TMS maps in stroke patients who tend to decrease motor threshold in the ipsilesional M1 over time. Map volume refers to the sum of average MEP amplitude (or MEP area) of the map area. TMS map areas and map volumes are often used to evaluate topographical reorganisation, including enlargements or reductions in cortical representation size. The CoG represents the spatial average of corticomotor excitability. Average MEP amplitude at each site is calculated and expressed relative to the maximum average MEP amplitude in the grid (Wassermann et al., 1992). Shifts in the CoG are thought to relate to underlying reorganisation of that cortical area. However, a shift must be of at least 2-3 mm to be taken as evidence of cortical reorganisation (Wassermann et al., 1996). Representations that 81
94 recruited together to achieve a task may move closer together after training or use (Liepert et al., 1999, Tegenthoff et al., 1999), due to altered excitability and unmasking of latent horizontal connections between specific elements of the mosaic representations of the movements involved. This likely reflects functional rather than anatomical reorganisation, as structural processes take longer to occur. Silent period (SP) When a MEP is evoked by a single suprathreshold TMS pulse during voluntary contraction a period of EMG inhibition follows, which is termed the silent period (SP) (Cantello et al., 1992). The duration of EMG silence is typically ms, and starts approximately 30 ms after the stimulus. Longer SPs indicate increased inhibition whereas shorter SPs indicate reduced inhibition (Chen et al., 2008). The length of the SP is also graded from distal to proximal, with longer SPs in more distal musculature of the upper limb (Ziemann et al., 1993). The mechanisms underlying the SP are uncertain, but may be GABA B -mediated (Werhahn et al., 1999). The level of target muscle voluntary activity is not critical to the length of the SP (Inghilleri et al., 1993, Wilson et al., 1993). On the other hand, stimulation intensity is an important factor. As TMS intensity increases from RMT the SP elongates (Wilson et al., 1993). The use of consistent stimulation intensity is an important consideration. Both contralateral and ipsilateral SPs can be recorded. Contralateral SPs are produced when suprathreshold TMS is applied to the M1 contralateral of the target muscle performing the voluntary contraction. In contrast, an ipsilateral SP (isp) may be produced when TMS is applied to the M1 on the same side as the contracting muscle. TMS induces an inhibitory effect on the unstimulated contralateral M1, probably via transcallosal pathways, which suppresses voluntary EMG activity in the ipsilateral upper limb for a short period (Ferbert et 82
95 al., 1992, Meyer et al., 1995). Ipsilateral SPs can therefore be a useful tool for assessing transcallosal inhibition. This measure is relevant in mechanistic studies of stroke patients, to understand interhemispheric competition or the effectiveness of interventions that aim to rebalance interhemispheric inhibition Paired pulse protocols Paired pulse techniques provide insight into intracortical mechanisms. Paired pulse protocols apply a conditioning stimulus and test stimulus with a specific interstimulus interval (ISI). The test stimulus can be combined with a conditioning stimulus delivered to the same site through the same coil, to a different cortical site through a second coil, or to a peripheral nerve with cutaneous electrical stimulation. These can be used to investigate intracortical inhibition and facilitation, interhemispheric inhibition and afferent inhibition respectively. The inhibitory or facilitatory effects of the conditioning stimulus are typically expressed as a ratio or percentage of the non-conditioned (i.e. NC or test) MEP amplitude. Short-interval intracortical inhibition (SICI) and intracortical facilitation (ICF) A subthreshold conditioning stimulus over M1 activates intracortical networks within the superficial layers of the cortex, but does not activate descending corticospinal projections. When a test stimulus arrives within a short time interval after the conditioning stimulus (ISI 1-6 ms) the resulting MEP amplitude is suppressed (Kujirai et al., 1993, Pascual-Leone et al., 2002). This is termed short-interval intracortical inhibition (SICI) (Kujirai et al., 1993). It is assumed that SICI occurs cortically, as the MEP suppression is present in the later I-waves of descending volleys recorded from cervical electrodes (Di Lazzaro et al., 1998, Di Lazzaro et al., 2006, Nakamura et al., 1997). GABA A ergic mediated processes contribute to SICI, as SICI increases after administration of the non-specific GABA A agonist Lorazepam (Ilic et al., 2002b, Teo et al., 2009, Ziemann et al., 1996a, b). SICI may act through a particular subtype 83
96 of GABA A receptor, as SICI is not modulated by the specific GABA A -α 1 receptor agonist Zolpidem (Teo et al., 2009). Antiglutamatergic and neuromodulatory drugs can also modulate SICI (Schwenkreis et al., 1999, Ziemann et al., 1998b). When measuring SICI certain factors must be taken into consideration. Firstly, SICI is dependent on NC MEP amplitude. SICI is optimal at moderate TMS intensities and reduced when low or high intensities are used that produce small (~0.2 mv) and large (~3 mv) NC MEP amplitudes respectively (Daskalakis et al., 2002, Lackmy and Marchand- Pauvert, 2010, Roshan et al., 2003, Sanger et al., 2001). To counter this, researchers often set TMS intensity to elicit NC MEP amplitudes around 1 mv, and adjust TMS intensity during the experiment to maintain this amplitude (Byblow and Stinear, 2006, Daskalakis et al., 2002, Ridding and Rothwell, 1999, Roshan et al., 2003). The intensity of the conditioning stimuli also influences SICI in a U-shaped manner (Chen et al., 1998). Importantly, SICI can be modulated during voluntary activity or volitional inhibition (Ridding et al., 1995b, Stinear and Byblow, 2003b). This highlights the need for researchers to control background muscle activity during MEP recordings. The selection of an appropriate ISI is important. A recent study by Peurala et al. (2008) demonstrated MEP facilitation or suppression depending on the ISI used during paired pulse techniques. At 1.5, and 4.5 ms ISIs, conditioned MEP amplitude was increased when the test MEP was %AMT. In contrast, MEP amplitude was maximally suppressed at an ISI close to 2 ms. Of particular note, it was shown that an increase in short-interval intracortical facilitation (SICF) caused the reduction in SICI. The results of this study indicate that researchers must be careful when to avoid ISIs, such as 2.5 ms, as SICI may be underestimated due to increased activation of facilitatory interneurons (Peurala et al., 2008). 84
97 Less is known about the phenomenon of intracortical facilitation (ICF). When the period between the conditioning stimulus and the test TMS pulse is set to an ISI between ms the resulting MEP amplitude is increased, reflecting intracortical facilitation (ICF) (Kujirai et al., 1993, Pascual-Leone et al., 2002). The mechanisms underlying ICF appear to be distinct from those of SICI (Chen et al., 1998, Ziemann et al., 1996b), but may involve glutamatergic neurotransmission as the NMDA receptor antagonist Dextromethorphan diminishes ICF (Ziemann et al., 1998b). A cortical site has not been confirmed (Chen et al., 2008). In summary, paired pulse TMS yields measures of ICF and ICI that provide a means to assess the excitability of intracortical excitatory (likely glutamatergic) and inhibitory (GABA mediated) circuitry in humans. Interhemispheric inhibition (IHI) To measure interhemispheric inhibition (IHI) a suprathreshold conditioning TMS pulse is applied to one M1 and followed 8-10 ms later with a suprathreshold test pulse to the opposite M1. EMG recordings from the upper limb contralateral to the test pulse show suppression of the conditioned MEP amplitude, compared to the non-conditioned. This measure can be obtained in the resting or active muscle. Incremental increase in the TMS test intensity results in reduced inhibition (Ferbert et al., 1992), probably due to increasing D- wave recruitment which is not sensitive to inhibitory influences. IHI is absent in people with significant callosal lesions or agenesis of the corpus callosum (Meyer et al., 1995, Meyer et al., 1998). IHI likely acts above the level of the spinal cord as H-reflexes are not suppressed with experimental IHI (Ferbert et al., 1992), and late I-waves are suppressed by the conditioning stimulus (Di Lazzaro et al., 1999). These results indicate that IHI probably acts via transcallosal pathways. However, subcortical brain regions may be involved as conditioned MEPs have been shown to be suppressed at the level of the pyramidal decussation, using transcranial electrical stimulation (Gerloff et al., 1998b). 85
98 Short latency afferent inhibition (SAI) Experimentally, sensorimotor integration can be evaluated by pairing electrical stimulation with TMS (Tokimura et al., 2000). Short latency afferent inhibition (SAI) is produced when electrical stimulation is applied either cutaneously via two ring electrodes over a digit (cathode proximal, anode distal) or to a peripheral nerve via electrodes, just before a suprathreshold single magnetic pulse to contralateral M1. Electrical stimulation is typically delivered at 2 3 times the perceptual threshold, which produces maximal SAI. Electrical stimulation at 5 times the perceptual threshold produces submaximal SAI (Tamburin et al., 2001). The TMS test pulse intensity and MEP amplitude also matter (Chapter 9). At interstimulus intervals between ms, MEP amplitudes recorded from resting homotopically related muscles are reduced (Alle et al., 2009, Classen et al., 2000, Helmich et al., 2005, Ni et al., 2011, Ridding and Rothwell, 1999, Ridding et al., 2005, Tokimura et al., 2000, Udupa et al., 2009, Voller et al., 2006). For example, electrical stimulation of the index finger produces SAI in FDI but not the ADM, whereas SAI is present in ADM but not FDI after fifth digit electrical cutaneous stimulation (Ridding et al., 2005). SAI is greater in the dominant hand (Helmich et al., 2005) and is increased when attention is paid to the stimulated hand (Kotb et al., 2005). Similar to SICI, SAI is modulated during active movement to facilitate selective movement on the hand (Voller et al., 2006). SAI can be decreased after stroke (Oliviero et al., 2005). Inhibition is likely to occur at a cortical level, via cortico-cortical projections (Alle et al., 2009, Tokimura et al., 2000). This is assumed as SAI is not produced when electrical stimulation is coupled with TES, which directly activates pyramidal neurons rather than intracortical circuitry (Tokimura et al., 2000). Cholinergic and GABA A ergic (α1 subtype) mechanisms are implicated in SAI as it is reduced following pretreatment with the anticholinergic antagonist Scopolamine and GABA A (ρ subtype) agonist 86
99 Lorazepam (Di Lazzaro et al., 2000b, Di Lazzaro et al., 2005a, Di Lazzaro et al., 2005b), while it is increased by treatment with GABA A (α1 subtype) agonist Diazepam (Di Lazzaro et al., 2000b, Di Lazzaro et al., 2005a, Di Lazzaro et al., 2005b). Like SICI, SAI is typically expressed as a ratio or percentage of the non-conditioned MEP Repetitive transcranial magnetic stimulation(rtms) In addition to investigating motor cortex excitability with single or paired pulses, TMS can be used to modify cortical excitability by applying stimuli repeatedly over a short time period. An overview of rtms has been provided in Chapter 6, additional details are provided below. This section will mainly focus on technical considerations for a patterned form of rtms called Theta Burst Stimulation (TBS). Conventional rtms The frequency of stimulation, stimulation intensity and the number of stimuli used, are critical factors in determining the after-effects of rtms. Low frequency rtms ( 1 Hz) is delivered in an uninterrupted train. High frequency rtms (5 25 Hz) consists of a train of stimuli delivered at identical ISIs, however the train may be interrupted with short breaks (inter-train intervals) to comply within safety regulations. Excitatory stimulation has the potential to induce a seizure, therefore the number and duration of trains delivered during rtms is restricted to minimise this risk (Chen et al., 1997a, Rossi et al., 2009). High frequency rtms at subthreshold stimulation intensities (i.e. below MT) seldom induces modulation of MEP amplitude (Bagnato et al., 2005, Daskalakis et al., 2006, Gerschlager et al., 2001, Modugno et al., 2003), but can if a large number stimuli are delivered ( 1200 stimuli) (Fitzgerald et al., 2007, Lang et al., 2004, Maeda et al., 2000a, b, Peinemann et al., 2004). For example, 5 Hz rtms (90% RMT) with 150 stimuli did not alter corticomotor excitability, whereas protocols with 900 and 1800 stimuli increased M1 excitability for 20 87
100 and > 40 minutes respectively (Peinemann et al., 2004). Motor cortex suppression is achieved more consistently with protocols that use a suprathreshold stimulation intensity, and deliver at least 900 stimuli (Chen et al., 1997b, Fitzgerald et al., 2002, Plewnia et al., 2003, Stinear and Byblow, 2004d). Both high and low frequency rtms tends to decrease SICI, but their influence on intracortical excitability is varied and consensus has not been reached (Pascual-Leone et al., 1998, Peinemann et al., 2004, Ziemann et al., 2008). Large interindividual variability in the effects of conventional rtms has been noted (Maeda et al., 2000a, b). A few studies have investigated the influence of rtms on the homologous M1. Suprathreshold low frequency rtms can increase M1 excitability of the unstimulated M1 (Gilio et al., 2003b, Schambra et al., 2003). Perhaps surprisingly, M1 facilitation of the opposite M1has occurred in the absence of MEP suppression in the stimulated M1, but reduced interhemispheric inhibition may play a role in this remote effect (Avanzino et al., 2007, Gilio et al., 2003b, Pal et al., 2005). Plewnia et al. (2003) demonstrated disinhibition of the unstimulated hemisphere with 1 Hz rtms (115%RMT), but Gilio et al. (2003b) with 1 Hz rtms (120%RMT) did not. There is one study that has investigated the effect of 5 Hz rtms (90%RMT) on the unstimulated hemisphere (Gorsler et al., 2003), which found that excitability increased in both motor cortices. Together, these studies provide some evidence for remote effects of rtms on the unstimulated motor cortex, most likely due to altered interhemispheric inhibition. The mechanisms of rtms action are assumed to be intracortical, and involve LTP and LTD like changes in synaptic efficacy (for reviews see Di Lazzaro et al., 2010b, and Thickbroom, 2007). Repetitive TMS at 1 Hz (110%RMT) suppressed late I-waves, which was correlated with MEP reduction, however this was observed clearly in only two of the five subjects tested (Di Lazzaro et al., 2008c). Both D-wave and late I-wave components of the 88
101 MEP are facilitated by 5 Hz rtms (120%RMT) (Di Lazzaro et al., 2002). Together these results indicate that rtms modulates intracortical circuitry. Involvement of the GABAergic system is likely as Lorazepam reduces the after-effects of 1 Hz rtms (Ziemann et al., 1998a). Additionally, pharmacological studies have shown that at least some rtms protocols are influenced by drugs that act on the NMDA receptors, suggesting that the effects may be due to altered efficacy of synaptic connections (Huang et al., 2007, Teo et al., 2007, Ziemann et al., 1998a). Theta burst stimulation First employed in animal research, theta burst stimulation (TBS) was modified and applied to the human population by Huang and Rothwell (2004). As mentioned previously, TBS involves bursts of 3 stimuli at 50 Hz which are repeated every 200ms (i.e. at 5 Hz) (Huang and Rothwell, 2004). Two patterns of TBS, intermittent (itbs) and continuous (ctbs) are commonly used. In general, itbs which consists of a 2 second train of TBS repeated every 10 seconds facilitates corticomotor excitability and increases SICI (Huang et al. 2005). In contrast, Huang et al. (2005) showed that ctbs (an uninterrupted train of TBS) applied for 20 seconds (ctbs300) or 40 seconds (ctbs600), causes suppression of MEP amplitude and a reduction in SICI, that lasts for 20 min and 60 min respectively. TBS is applied at low stimulation intensities, usually 80%AMT, subthreshold for activation of descending pathways. TBS does not affect H-reflex amplitudes (Huang et al. 2005) or descending corticospinal volleys recorded in patients with cervical epidural electrodes (Di Lazzaro et al. 2008; Di Lazzaro et al. 2005). The effects of TBS are therefore likely to be generated cortically. TBS applied to one M1 can influence corticomotor output from the opposite M1. Stefan et al. (2008) showed that MEP amplitudes were facilitated in APB ipsilateral to TBS 89
102 when ctbs 300 (70%RMT) was delivered to either M1 after motor training involving the right hand. The authors speculate that enhanced activity in the unstimulated M1 may be due to reduced transcallosal inhibition from the stimulated M1 to the unstimulated M1 (Stefan et al. 2008). However, this was not supported by the findings of Suppa et al. (2008). Although Suppa et al. (2008) observed MEP facilitation in the right hand after right M1 ctbs600, there was no change in IHI measured at rest. The direction of after-effects on corticomotor excitability found by Stefan et al. (2008) also differ from those reported by Ishikawa et al. (2007), who observed MEP depression in both right and left FDI muscles after ctbs 600 to left M1. It is difficult to understand why these results are disparate. Suppa et al. (2008) used similar stimulation parameters to Ishikawa et al. (2007) (i.e. both 80%AMT), yet obtained results that were more similar Stefan et al. (2008). However, we can infer from these studies that conditioning one M1 may influence excitability of the opposite M1, but the direction of these effects seem to be dependent on variables still to be determined. A reverse coil orientation can alter the magnitude of the after-effects of ctbs. TBS is typically delivered with a biphasic stimulator, and the second phase of the stimulus has the most influence on the underlying tissues. Typically, TBS is delivered with a standard (i.e. PA) coil orientation. In 2007, Talelli et al. (2007b) demonstrated that the after-effects of ctbs were prolonged if a reverse coil orientation (i.e. AP) was adopted at a stimulation intensity of 100%AMT. The authors suggest that the more persistent suppression could be due to the tendency of ctbs and the AP coil orientation to recruit I1-waves. On the other hand, the after-effects of itbs were more consistent with the standard coil orientation (Talelli et al., 2007b). The effects of TBS are likened to those of LTP and LTD mechanisms. It is assumed that TBS leads to a mixture of facilitatory and inhibitory effects (Huang et al., 2005). Facilitatory and inhibitory effects are likely to be driven by the rate of Ca 2+ influx into the 90
103 postsynaptic cell. A rapid influx of Ca 2+ activates kinases that trigger an intracellular cascade, which increases the density of AMPA receptor on the postsynaptic membrane and promotes LTP (Wankerl et al., 2010). Conversely, a slow influx of Ca 2+ activates phosphatises, that trigger an intracellular cascade resulting in internalisation of AMPA receptors and LTD (Wankerl et al., 2010). It is thought that summation of the two effects gives rise to the overall direction of the after-effects of TBS (Wankerl et al., 2010). The short trains of stimulation during the itbs protocol allow the rapid influx of Ca 2+ and generate a rapid facilitation, but does not allow for a slow build up of inhibition. In contrast, during the longer ctbs stimulation train the initial facilitation is dominated by an inhibitory effect that builds up over time (Huang et al., 2011). Pharmacological studies also provide evidence that the after-effect of TBS depend on NMDA receptor activation, which is also a characteristic of LTP/LTD (Huang et al. 2005; Teo et al. 2007). Overall, TBS offers an alternative rtms protocol that is efficient, taking several seconds rather than several minutes to deliver, providing a method to deliver high frequency rtms in a safe and effective manner. TBS can alter the excitability of the stimulated motor cortex, and potentially exert an influence on the opposite hemisphere. One disadvantage of TBS however, is that its effects may be modified by prior or subsequent muscle contraction (Gentner et al. 2008; Huang et al. 2008). It is important to consider how movement may modify the response to TBS. Interactions of TBS protocols with movement Muscle activation before, during or immediately after TBS can alter the direction of the after-effects of stimulation. It is important to understand these interactions, if the aim is to use non-invasive brain stimulation protocols such as TBS, in combination with training, to enhance UDP. 91
104 In 2008, Gentner et al. (2008) demonstrated that ctbs 300 (70%RMT) of left M1 facilitated, rather than suppressed, corticomotor excitability. If ctbs 300 was preceded with 5 minutes of repetitive isometric thumb abductions, MEP suppression was observed. The authors suggest that the 5 minutes of motor training was equivalent to the motor activity required for obtaining AMT (the typical method used to set stimulation intensity for TBS), and this may explain why ctbs 300 had previously been reported to have suppressive effects. In another study, Stefan et al. (2008) demonstrated MEP suppression in the right APB after left M1 ctbs 300 (70%RMT) after 4 5 minutes of brisk isometric thumb abductions with the right hand, in agreement with the findings of Gentner et al. (2008). They also demonstrated that right thumb movements followed by right ctbs 300 led to MEP suppression in the left APB. This indicated that motor activity of either hand was sufficient to induce MEP suppression. As EMG was not recorded from the untrained hand, it is possible that activity of this hand was responsible for the observed MEP suppression, however this seems unlikely. Together these results indicate that ctbs can result in corticomotor pathway facilitation or suppression, and the direction of after-effects may be dependent on muscle activity prior to stimulation. The effect of phasic movement before TBS, rather than isotonic contractions, was investigated by Iezzi et al. (2008). Training consisted of 2 3 minutes of repetitive index finger abduction. In this context, the after-effects of each TBS protocol were reversed. Intermittent TBS produced suppressive and ctbs produced facilitatory after-effects on corticomotor excitability. This may indicate metaplastic effects relating to the history of prior activation, discussed below. The effect of voluntary motor activity during or after TBS has also been investigated. Huang et al. (2008) required participants to perform an isometric voluntary contraction of their right FDI (~10% MVC) for 1 minute either during, or immediately after ctbs 300 or 92
105 itbs 600 of left M1 (80%AMT). Their results showed that if subjects contracted the FDI during itbs 600 or ctbs 300, then the effects on the MEP were abolished. Contraction immediately after itbs 600 enhanced its facilitatory effect. This interaction has been used to augment itbs 600 facilitation in a functional imaging study (Cardenas-Morales et al., 2010). In contrast, contraction immediately after ctbs 300 reversed the typical suppressive effect of ctbs 300 (set to AMT) to facilitation (Huang et al., 2008). Control experiments demonstrated that ctbs 300 followed immediately by 1 minute of peripheral nerve stimulation (mimicking voluntary contraction of FDI), or contraction of alternate muscles (biceps brachii or ADM), did not reverse the after-effects (i.e. MEPs remained suppressed). These results indicate that volitional motor output of the target muscle interacts with the cortical circuits responsible for TBS after-effects. It is therefore vital that motor activity is considered and controlled for in research applying TBS protocols, particularly when using ctbs which appears more vulnerable to interactions with movement Ethical considerations TMS should be delivered by trained professionals with approval from their local institutional review board. Consent to receive TMS should be gained in written form, with the risks and benefits explained. For this research carried out at the Movement Neuroscience Laboratory, information regarding the study, techniques and interventions (including TMS) were provided in an approved participant information sheet that was specific to each study and approved by the appropriate ethics committee. Written informed consent was obtained to acknowledge that participants had read and understood the information sheet, and that they had been given the opportunity to consult (the researcher, family, whanau and friends) on any aspect of the study. When consent was gained, potential participants were carefully screened 93
106 to ensure that TMS was safe for them. At the Movement Neuroscience Laboratory a standardised screening questionnaire (with guidelines) is used (Appendix 1). The Laboratory collaborates with an experienced neurologist, who determines the inclusion or exclusion of potential participants. Safety, ethical considerations, and application guidelines were guided by best practice recommendations to ensure the safe and considered use of TMS (Chen et al., 1997a, Rossi et al., 2009, Wassermann, 1998). The potential risks of TMS (single, paired and repetitive) are low provided participants are carefully screened for contraindications and factors that may elevate their risk of seizure. The relative risk of seizure is 1.4 % in epileptics and less than 1% in healthy adults (Rossi et al., 2009). A registered nurse or doctor was present for all TBS sessions, meeting The University of Auckland requirements and international recommendations. Emergency equipment was available, but not required. 94
107 Chapter 6. THE EFFECT OF COORDINATION MODE ON USE-DEPENDENT PLASTICITY This experiment has been reported in Clinical Neurophysiology, Ackerley et al., The effect of coordination mode on use-dependent plasticity, Copyright Elsevier (2007); 118; Abstract Objective: To evaluate the role of coordination mode on the generation of use-dependent plasticity (UDP) within the primary motor cortex (M1). Methods: Ten healthy volunteers performed brisk repetitive thumb movements for 30 min in the opposite direction to those evoked by transcranial magnetic stimulation (TMS) prior to training. This practice was synchronised or syncopated with a 1 Hz auditory metronome in two separate sessions. Motor evoked potentials (MEPs) were recorded from three intrinsic thumb muscles, to assess changes in corticomotor excitability. Results: Both synchronised and syncopated motor practice induced changes in the direction of TMS-evoked thumb movements, away from the baseline direction toward the trained direction. MEP amplitude increased following synchronised, but not syncopated, motor practice. Changes in movement direction and corticomotor excitability lasted for at least 30 min. Conclusions: UDP can be elicited in the presence or absence of changes in corticomotor excitability. Significance: Motor practice that is synchronised with external pacing may promote UDP and facilitate corticomotor excitability in patient populations with reduced corticomotor output, such as stroke. Training that is syncopated with external pacing may promote UDP without increasing corticomotor excitability. This could be relevant for individuals with disorders characterised by maladaptive plasticity. 95
108 6.2. Introduction The advent of non-invasive brain stimulation techniques, such as transcranial magnetic stimulation (TMS), has allowed the study of cortical plasticity in humans. The primary motor cortex (M1) can be modified by motor practice, commonly referred to as use-dependent plasticity (UDP) (Bütefisch et al., 2000, Bütefisch et al., 2002, Classen et al., 1998, Nudo et al., 1996). UDP can develop as a consequence of motor reinforcement that occurs over days, weeks and even years (Elbert et al., 1995, Karni et al., 1995, Liepert et al., 2000c, Pascual- Leone et al., 1993, Pascual-Leone et al., 1995, Pearce et al., 2000). Rapid, transient changes in the motor cortical representations of the thumb have been found following a training regime in which the subject synchronised movement of the thumb with the beat of a metronome (Classen et al., 1998). Repetitive thumb movements resulted in a change in direction of TMS-evoked thumb movements toward the trained direction. This was associated with an increase in corticomotor excitability of pathways mediating movement in the trained direction (Bütefisch et al., 2000, Foster et al., 2006). Administration of pharmacological agents that influence synaptic transmission has shown that a reduction in gamma-amino-butyric acid (GABA) mediated inhibition plays an important role in UDP (Bütefisch et al., 2000). Ziemann et al. (2001) found enhanced UDP was associated with decreased intracortical inhibition (ICI). Furthermore, when GABArelated inhibition was increased by pre-treatment with a GABA A receptor agonist, UDP was depressed (Ziemann et al., 2001). These studies strongly suggest that GABAergic inhibition is a potential mediator of UDP in the intact human motor cortex. Synchronisation and syncopation are two modes of sensorimotor coordination that establish rhythmical movement. There is a tendency in human behaviour to synchronise with an external rhythm, and this is considered the most stable coordination pattern (Kelso et al., 96
109 1990). Syncopation however is more difficult to establish, and can generally only be maintained at relatively slow rates of movement (Kelso et al., 1990). Neurophysiologically, synchronised finger movements made with respect to external pacing are associated with lower levels of excitability of ICI and an increase in cortical excitability of the involved muscle representations within M1. These are temporally modulated in phase with the bursts of muscle activation which generate finger movement (Stinear and Byblow, 2003b). Syncopated movement is also associated with temporally modulated corticomotor excitability and ICI, but with a significant increase in excitability of inhibitory networks mediating ICI relative to synchronisation. This inhibitory network may operate in the maintenance of the less stable coordination mode, and help prevent the tendency for entrainment (Byblow and Stinear, 2006). It has not yet been established whether training in different coordination patterns affects the generation of UDP. The aim of the current study was to evaluate UDP following a bout of simple, repetitive thumb movement made in synchrony, or in syncopation, with respect to an auditory metronome. Consistent with previous research, we expected that synchronised motor practice of brisk thumb movements would induce a rapid and transient change in the direction of TMS-evoked thumb movements toward the practiced direction. We predicted that synchronised motor practice would induce increases in corticomotor excitability of the muscles mediating the practiced movements, more so than syncopated motor practice. If facilitation of corticomotor excitability is a necessary condition, UDP may be attenuated or absent following syncopated motor practice. 97
110 6.3. Methods Subjects Thirteen healthy adults (7 male, mean age = 26.8 ± 8.3 years, range 20 50) took part in this study. Twelve subjects were right-handed as determined by the Edinburgh Handedness Inventory (Oldfield, 1971) (mean score = ± 19.5), and one left-handed (score = -57.1) (Appendix 2). All participants gave their written informed consent before participating in this study, which was approved by the local Ethics Committee and conformed to the Declaration of Helsinki (Appendix 3). All subjects were screened for contraindications to TMS by a neurologist ensuring their safe participation in this study Recording and stimulation Subjects were seated comfortably with their right forearm positioned in a custommade splint, providing a consistent resting posture with the wrist in slight extension and minimal finger flexion. The arm was positioned and secured to the armrest of the chair so that the right shoulder was adducted, the elbow was at 90 and the forearm was semipronated. The thumb was unrestrained and able to move through a full range of motion. Electromyography (EMG) was collected from extensor pollicis brevis (EPB), abductor pollicis brevis (APB) and flexor pollicis brevis (FPB), of the right hand using bipolar electrode arrangement and a common reference. Signals were amplified using Grass P511 amplifiers (Grass Instrument Division, Warwick, RI), band-pass filtered at Hz, sampled at 2 khz and stored for subsequent analysis. Single pulse TMS was applied using a figure-of-eight coil (70 mm wing diameter) connected to a Magstim 200 magnetic stimulator (maximum output intensity 2.0 T, Magstim, Dyfed, UK). The coil was positioned tangential to the scalp and rotated at 45 from midline to be perpendicular to the assumed line of the central sulcus. This is the most favourable orientation for activating the corticospinal tract 98
111 trans-synaptically (Kaneko et al., 1996). The coil was held so that the induced current flow was in a posterior to anterior direction. The site chosen for stimulation was the location over the left hemisphere that elicited isolated right thumb movements. The stimulation intensity (SI) was defined as the minimum intensity that produced thumb movement in a consistent direction, and that produced motor evoked potentials (MEPs) in all muscles of interest. TMS-evoked movement direction of the thumb was recorded using a miniature two-axis accelerometer (Dimension Engineering, DE-ACCM5G, sensitivity 312 mv/g) mounted on the distal phalanx of this digit. Acceleration vectors were constructed from the first-peak acceleration following TMS in the orthogonal axes, abduction-adduction and flexionextension (Classen et al., 1998). In addition, to recording movement direction, MEPs in all three muscles mediating movement of the thumb were recorded in the EMG. All data were stored for subsequent offline analysis using customised LabView software Experimental protocol The experiment was conducted over two sessions (separated by at least 24 h) that were identical in design with the exception of the coordination pattern used for training. One session incorporated motor practice that required synchronisation of thumb movement made at 1 Hz in time with the metronome beat, whereas the other required a syncopated pattern of thumb movements made at 1 Hz exactly between the beats of the metronome. Therefore, in both training modes, subjects made an equivalent number of thumb movements, at an identical rate of movement. The only aspect of motor practice which differed between the two modes was the phase relation of the movements with respect to the metronome. The order of the sessions was randomised. 99
112 Initial recordings Rest motor threshold (RMT) was determined to the nearest 1% maximum stimulator output for EPB. RMT was defined as the minimum stimulation intensity that produced a peak-to-peak MEP amplitude of ~50 µv in the EPB in four out of eight consecutive trials (Rossini et al., 1994). Twenty trials of brisk thumb movements (paced with a 1 Hz auditory metronome) were made in each of four directions (extension, abduction, flexion and adduction). The relative contribution of each muscle to each movement direction was determined from the EMG recordings collected over a 300 ms period from movement onset. Baseline (PRE) Before training, 60 stimuli were delivered at 0.1 Hz. Acceleration vectors were recorded for each TMS-induced thumb movement. Using customised LabView software, the acceleration vectors were summated producing a mean resultant vector, with a corresponding angle that reflected the most prominent direction of movement for the 60 stimuli. This angle was deemed the baseline (θ). MEPs were recorded in surface EMG of all three muscles of interest. Motor practice Motor practice consisted of subjects performing a 30 min training regime of brisk, voluntary thumb movements in a direction opposite to their baseline direction. The training direction was defined as baseline direction minus 180. Subjects were instructed to either synchronise or syncopate movements in time with an auditory metronome paced at 1 Hz. Training under each mode was performed in blocks of 120 movements followed by rest periods of exactly 30 s. Visual feedback provided information to the subjects regarding the 100
113 accuracy of timing and direction of each movement. Acceleration vectors were collected for all training movements for subsequent analysis. Post-training (POST) Following completion of training, TMS was delivered at 0.1 Hz for 40 min (240 stimuli). Thumb kinematics and MEPs were recorded Data reduction and analysis Data were binned into 5 time intervals: PRE (0 10 min); POST1 (0 10 min); POST2 (10-20 min); POST3 (20-30 min); POST4 (30-40 min). Data collected during training were binned into three intervals TRAIN1 (0-10 min), TRAIN2 (10-20 min) and TRAIN3 (20-30 min). Deviation and uniformity of evoked thumb movements Basic trigonometry principles were used to determine a mean resultant vector at each interval. The angle of each thumb movement was converted from degrees to radians, and decomposed to cosine and sine components to determine the resultant vector. A baseline direction for PRE was determined and then the mean angular deviation (degrees) from PRE was calculated offline for each of the time epoch POST1, POST2, POST3 and POST4, as a marker of UDP. The magnitude of the mean resultant vector for each time interval (PRE, POST1, POST2, POST3 and POST4) was calculated using Pythagorean Theorem, resulting in a measure of uniformity ranging from 1 (perfectly uniform) to 0 (random), reflecting dispersion. 101
114 Baseline zone (%BZ) and target training zone (%TTZ) A baseline zone (BZ) was defined as the baseline direction ± 20. The proportion of movements into the baseline zone was defined as the number of movements that resulted in an acceleration vector in this zone divided by the total number of acceleration vectors. A target training zone (TTZ) was defined spatially as the training direction ± 20 and temporally (during training) with the first acceleration peak occurring within 150 ms of the desired coordination mode (synchronisation or syncopation). The proportion of movements into the TTZ was determined as above. Training accuracy was determined by calculating the proportion of thumb movements in the TTZ during motor practice. Training accuracy was calculated for the time intervals TRAIN1, TRAIN2 and TRAIN3 and reflect both spatial (direction of thumb movement toward the training direction) and temporal components (accuracy of synchronisation or syncopation with the metronome beat). MEP amplitude and background EMG activity Peak-to-peak MEP amplitudes (mv) in EPB, APB and FPB were measured (10-45 ms) post stimulus during baseline (60 MEPs) and post-training (240 MEPs) periods. To ensure quiescence of all three muscles at the time of data collection, the root mean square (rms) of the pre-trigger EMG was determined over a 50 ms period ending 5 ms prior to each magnetic stimulus. Trials were rejected online if rmsemg exceeded 15 µv. The mean rmsemg value was calculated for each PRE and POST time interval, for each participant Statistical analysis MODE (synchronisation, syncopation) x TIME repeated-measures analyses of variance (RM-ANOVAs) were performed on raw and normalised (to PRE) measures as indicated. Huynh-Feldt corrections were applied when sphericity could not be assumed. T-tests were 102
115 used to investigate significant effects. A significance threshold of P < 0.05 was used. All results in text are reported as means ± SEM Results The Rayleigh test for randomness was initially used to determine a criterion for our data set (60 evoked movements), and volunteers were included if they had a uniformity value during the pre-training session > 0.26 (Batschelet, 1981). This ensured TMS elicited movement in a consistent direction, prior to training. One volunteer was excluded from participation as he/she did not meet this criterion. A further, more stringent, exclusion criterion was applied to ensure that each participant had a unimodal distribution of TMSevoked thumb movements during PRE. A further two subjects were excluded as their pretraining TMS-evoked thumb movements had bimodal distributions Rest motor threshold (RMT) and stimulation intensity (SI) The mean RMT following synchronised motor practice was 44.4 ± 2.9% maximum stimulator output (MSO) and 42.8 ± 2.7% MSO following syncopation. The mean SI used to achieve thumb movements in a consistent direction was 50.3 ± 3.4% and 49.9 ± 3.1% in the synchronisation and syncopation sessions, respectively. T-tests revealed no difference in RMT (P > 0.1) or SI (P > 0.6) between sessions Initial recordings The contribution of the three individual muscles to movement in each of four specific directions was determined following a simple trial involving 20 brisk thumb movements. From these data, the muscle mediating movement in the baseline direction (baseline agonist) and in the trained direction (training agonist) was determined for each subject. For example 103
116 (Figure 6.1), if the baseline angle (θ) was 20 and the trained direction was 200, the baseline agonist was FPB and the training agonist APB. Figure 6.1 The determination of baseline and training direction, and muscle agonist for each. Solid lines indicate direction and dashed lines indicate boundaries delineating primary muscle contribution. For this participant the baseline direction (θ) of TMS-evoked thumb movements was 20. Therefore, the baseline agonist is FPB. The trained direction was 200 and the training agonist was APB Motor practice Training accuracy, reflecting mainly temporal but also spatial elements of individual brisk thumb movements, improved over time. A 2 MODE x 3 TIME (TRAIN1, TRAIN2, TRAIN3) RM-ANOVA revealed a significant main effect of TIME (F 2,18 = 5.78, P < 0.05). The mean %TTZ during training for TRAIN1, TRAIN2 and TRAIN3 was 33.6 ± 4.3%, 36.9 ± 5.2% and 42.2 ± 5.1%, respectively. There was no effect of MODE and no interaction (both P > 0.4) Post-training: kinematic data TMS-evoked movement with respect to the baseline zone The percentage of movements made into the baseline zone was analysed in a 2 MODE x 5 TIME (PRE, POST1, POST2, POST3 and POST4) RM-ANOVA. There was a highly 104
117 significant main effect of TIME (F 4,36 = 13.06, P < 0.001). Following motor practice, the percentage of movements to the baseline zone was reduced in all POST intervals relative to PRE (all P < 0.001) (Figure 6.2A). There was no significant effect of MODE and no interaction (both P > 0.1). A B Figure 6.2 A. TMS-evoked thumb movements into the baseline zone (mean baseline direction ± 20 ) PRE and POST synchronised motor practice (black bars) and syncopated motor practice (grey bars). B. Mean angular deviation of TMS-evoked thumb movements away from baseline after training. Synchronised mode (filled circles); syncopated mode (open circles). Error bars, SEM. ***P < 0.001; *P < 0.05 differences between PRE and POST. Angular deviation and uniformity of evoked thumb movements Angular deviation of TMS-evoked movements from the baseline direction (θ) was examined at each POST interval. A highly significant deviation from baseline was observed following both the synchronisation and syncopation sessions at all time intervals (all P < ) (Figure 6.2B). There were no main effects or interactions identified following a 2 MODE x 4 TIME (POST1, POST2, POST3 and POST4) RM-ANOVA (all P > 0.2). These results suggest that post-training TMS-evoked thumb movements deviated toward the trained direction for both synchronisation and syncopation modes of motor practice and persisted
118 min post-training. The omnibus ANOVA revealed no effects on uniformity of TMS-evoked movements. Percentage of TMS-evoked movements to the target training zone (%TTZ) There were no significant main effects or interactions Post-training: corticomotor excitability Two subjects were excluded from MEP amplitude analysis due to inadequate mean MEP amplitude (< 0.05 mv) in one or more muscles of interest. The baseline and training agonist (APB, EPB, FPB) varied across subjects, but within subjects baseline and training agonist were consistent between modes (sessions) for all except one person. Statistical results were unaltered by exclusion of one subject who displayed a different baseline and training agonist across sessions, and therefore data from 8 subjects are reported in the analysis. MEP amplitude One-sample t-tests were used to determine if POST MEP amplitudes were facilitated following motor practice. Following synchronisation motor practice, MEP amplitudes of the training agonist were facilitated above PRE at POST2, POST3 and POST4, and MEP amplitudes of the baseline agonist were facilitated above PRE at POST3 and POST4 only (all P > 0.05). For the syncopation session POST MEP amplitudes did not alter from PRE for either training agonist (P = 0.09) or baseline agonist (P > 0.1). POST MEP amplitudes were further analysed in a 2 MODE x 2 MUSCLE (baseline agonist, training agonist) x 4 TIME (POST1, POST2, POST3 and POST4) RM-ANOVA. There was a significant main effect of MUSCLE (F 1,7 = 6.51, P < 0.05) with larger MEP amplitudes in the training agonist than baseline agonist (Figure 6.3). There were no other effects (P > 0.1). 106
119 Figure 6.3 Group mean MEP amplitude in training and baseline agonist displayed as POST normalised to PRE (100%) after synchronised motor practice (left, filled symbols) and syncopated motor practice (right, open symbols). Diamonds, baseline agonist; triangles, training agonist. MEP amplitudes were larger in the training agonist than baseline agonist for both practice modes (P < 0.05). MEP amplitudes were significantly facilitated relative to PRE in both muscles after synchronised motor practice (*P < 0.05), but for neither muscle after syncopated motor practice (all P > 0.09). Background EMG activity Descriptive statistics revealed that the background EMG of all muscles in all conditions was <10 µv. We therefore conclude that all muscles remained at rest throughout MEP recording Discussion The main finding of this study is that both synchronised and syncopated motor practice alters TMS-evoked thumb movements toward the trained direction. Corticomotor excitability was increased relative to baseline following the synchronised session but not following the syncopated training session, and was facilitated in the training agonist more so than the 107
120 baseline agonist. Baseline variables, including rest motor threshold, stimulation intensity and training accuracy, were similar for both session and therefore are unlikely to account for any post-training effects TMS-evoked movement kinematics In agreement with earlier studies (Bütefisch et al., 2000, Classen et al., 1998), shortterm training of voluntary thumb movement led to a shift in the direction of TMS-evoked thumb movements. In this study, a shift in the direction of TMS-evoked thumb movements was reflected by a decrease in the percentage of TMS-evoked thumb movements into the baseline zone, and an increase in mean angular deviation of TMS-evoked thumb movements. These changes were evident after both synchronised and syncopated training and persisted for 40 min after motor practice. However, the angular deviation of TMS-evoked thumb movements toward the trained direction was not of the magnitude of those reported previously (Bütefisch et al., 2000, Classen et al., 1998). In the present study, there was no significant increase in percentage of TMS-evoked movements into the TTZ. One reason for this may be that previous studies only included individuals in which UDP was elicited e.g., increases of 30 60% in the percentage of TMS-evoked thumb movements into the TTZ posttraining relative to baseline (Bütefisch et al., 2000, Bütefisch et al., 2002, Bütefisch et al., 2004, Sawaki et al., 2002a). Studies that did not restrict recruitment by the ability to elicit UDP have reported % increases in the percentage of TMS-evoked thumb movement into the TTZ (Foster et al., 2006, Meintzschel and Ziemann, 2006, Sawaki et al., 2006). A disadvantage of measuring UDP by an increase in TMS-evoked thumb movement into an arbitrary TTZ is that there is the potential to miss more subtle deviations in the direction of TMS-induced thumb movements (Meintzschel and Ziemann, 2006). For this reason, we prefer a measure of angular deviation from baseline to assess UDP. A significant deviation 108
121 from baseline was observed following both synchronised and syncopated motor practice. The maximum mean angular deviation was 53.2 ± 10.8 and 45.5 ± 7.4, following the synchronisation and syncopated motor practice, respectively, reflecting a bias toward, but not completely within, the trained direction (i.e. 180 ). Incorporating inclusion criteria for individuals based on UDP susceptibility would potentially allow differences between the two training modes to be amplified. However, this approach is somewhat compromised by sampling bias. We prefer the more conservative sampling strategy adopted here, combined with measures of change as they relate to baseline, as opposed to a training zone with arbitrarily defined boundaries. The change in direction of TMS-evoked thumb movements was smaller in magnitude and less consistent following motor practice in the syncopation mode, although these differences were not statistically significant. Following synchronised motor practice, there was a larger mean angular deviation, uniformity and shift of TMS-evoked thumb movements out of the baseline zone, particularly over the first 20 min following completion of training, when compared with syncopation. Such trends may indicate that training mode can produce subtle differences in generation of UDP. Arguably this difference may be greatest for individuals who are most susceptible to UDP Corticomotor excitability Facilitation of corticomotor excitability differed between the two modes of motor practice. Synchronised training induced facilitation in MEP amplitudes in both training and baseline agonists, with the largest increases occurring in the training agonist and lasting for at least 30 min. Compared to previous studies (Bütefisch et al., 2000, Bütefisch et al., 2002, Bütefisch et al., 2004), our results indicated a global increase in corticomotor excitability in response to synchronised training rather than differential modulation of the training agonist 109
122 and baseline agonist. This may simply reflect a differential gradation of the same phenomenon, due to difference in the in extent of UDP elicited between previous reports and the current study. Following syncopated motor practice, corticomotor excitability was not significantly altered in either the training or the baseline agonist, which contrasts more markedly with previous findings in UDP paradigms, and the current results involving synchronised motor practice. To what may we attribute the differential modulation of corticomotor excitability in response to training in synchronised and syncopated modes? We propose an account based on the modulation of intracortical inhibition within M1, which has been shown to be modulated differentially by the two coordination modes. Using short-interval paired pulse TMS, it has been shown that ICI is modulated temporally within the muscle representation mediating movement during performance of synchronised movements (Stinear and Byblow, 2003b). ICI is decreased during phasic movements and returns towards baseline between movements. In contrast, syncopation is associated with an increase in ICI above resting levels between movements (Byblow and Stinear, 2006). Over time, the cumulative downregulation of inhibition that occurs with synchronisation movements (relative to syncopation) may result in a slow build up facilitation within M1. When training in a syncopated manner, the decrease in ICI during voluntary activation is balanced by an increase in ICI occurring between movements, potentially limiting the facilitation of corticomotor excitability within M1. The idea that the UDP results from altered excitability of intracortical elements within M1 is supported by earlier findings (Classen et al., 1998). In a similar paradigm of motor practice, UDP was evident when responses were evoked using TMS-evoked responses but not when using transcranial electrical stimulation (TES). This is because TMS excites corticospinal elements trans-synaptically via intracortical networks, whereas TES excites the 110
123 corticospinal elements directly and is not sensitive to the excitability of intracortical elements. This further supports the idea that transient UDP induced by motor practice is mediated by the excitability of intracortical elements within M Potential limitations of the study It is well known that syncopation is associated with activation of a broader sensorimotor network than synchronisation (Mayville et al., 2002). When movements are made in syncopation and the movement frequency is increased, the syncopation patterns will revert to synchronisation, thus identifying synchronisation as the preferred mode, and an easier pattern to perform. In the present study, and a previous report involving movements made at a similar rate (Byblow and Stinear, 2006), we observed equivalent task performance across both modes for movements performed at 1 Hz. If there were large or consistent differences in task difficulty, we would expect differences in task performance as well. This did not occur in either study. It is also possible that the syncopation mode requires greater attention than synchronisation. Studies examining LTP-like changes in human M1 after paired-associative stimulation have shown that attention can modify the extent of facilitation induced by the protocol (Stefan et al., 2004). However, such studies have compared conditions of no attention, or attention directed away from the target hand, with attention directed toward the target hand. This is in marked contrast to the present study where attention was directed toward the hand in both motor practice conditions in order to maintain the instructed phase relationship with respect to the metronome. Any differences in attention between the two patterns would be expected to be small, and in fact, biased toward facilitation of the syncopation pattern. This is contrary to our hypothesis as it relates to intracortical inhibition, and the findings of facilitated MEP amplitudes following synchronisation, but not 111
124 syncopation. Although such contributions cannot be discounted entirely, for the reasons outlined above we consider differences in attention and task difficulty between conditions to have been inconsequential Significance UDP is thought to contribute to functional recovery after brain injury. Manipulation of GABAergic processes by pharmacotherapy in combination with motor practice can bidirectionally modulate UDP (Ziemann et al., 2001). However, difficulties with drug contraindications, precautions, side effects and timing of administration potentially limit the use of pharmacotherapy to enhance UDP in the clinical setting. Synchronised and syncopated training may provide an alternative non-invasive method to modulate UDP. Repetitive motor practice is commonly used to promote functional recovery during neurorehabilitation. In agreement with previous studies (Bütefisch et al., 2000, Classen et al., 1998), we have shown that motor practice of repetitive movements synchronised to an auditory metronome elicits UDP and increases cortical excitability within M1. Training in synchronisation may therefore be useful to promote plasticity and increase excitability following neurological injuries such as stroke, especially when excitability is decreased within the lesioned hemisphere (Turton et al., 1996). In most studies that have explored UDP, training movements are paced by an auditory metronome. It is possible that external pacing is an important aspect in generation of UDP and that self-paced training may not be optimal to produce robust use-dependent plastic changes. Since physical therapy tends to emphasise self-paced training, further investigation into this issue seems warranted. Syncopation is associated with greater levels of ICI than synchronisation (Byblow and Stinear, 2006). In the current study syncopated training was shown to induce plastic changes within M1, in the absence of significant changes in cortical excitability. This finding has 112
125 potential relevance in the management of conditions that present with maladaptive plasticity, for example focal hand Dystonia (FHD). FHD is a disorder characterised by excessive and widespread involuntary contraction of the muscles controlling the hand during performance of a specific task (Chen and Hallett, 1998). Individuals with FHD demonstrate a global deficit of intracortical inhibition (Gilio et al., 2003a, Ridding et al., 1995a, Siebner et al., 1999, Stinear and Byblow, 2004e), and are unable to recruit and modulate ICI to the same extent as healthy adults (Stinear and Byblow, 2004b). Future studies might determine if prolonged motor practice in a syncopated mode may permit UDP and associated changes to occur in the presence of ICI. This neurophysiological context may permit the maintenance or restoration of selectivity within and between muscle representations, which may be beneficial to certain clinical populations. 113
126 Chapter 7. PROMOTING USE-DEPENDENT PLASTICITY WITH EXTERNALLY-PACED TRAINING This experiment has been accepted by Clinical Neurophysiology, Ackerley et al., Promoting use-dependent plasticity with externally-paced training, Copyright Elsevier (2011); 122; Abstract Objective: To evaluate use-dependent plasticity (UDP) before and after training under metronome-paced and self-paced conditions. Methods: Twelve healthy adults were recruited to this cross-over, pseudo-randomised, repeated-measures study. Participants performed wrist extension training that was either selfpaced, or externally-paced to an auditory metronome at their preferred movement frequency or at a more demanding frequency. Motor evoked potentials from transcranial magnetic stimulation of left primary motor cortex were recorded in right extensor carpi radials (ECR) and flexor carpi radialis (FCR) to assess corticomotor excitability. The direction and velocity of TMS-evoked wrist movement (stimulus-evoked velocity, SEV) were measured before and after training to evaluate UDP. Results: The most persistent UDP occurred when training was metronome-paced at the participant s preferred movement frequency. This training protocol produced spatially selective modulation of resting ECR and FCR corticomotor excitability and directional tuning of TMS-evoked wrist movement toward the trained direction. Metronome-paced training at a more demanding frequency resulted in nonspecific facilitation of resting corticomotor excitability, and did not alter TMS-evoked wrist movement. Conclusions: These novel findings indicate that externally-paced training at the individual s preferred frequency facilitates UDP. 114
127 Significance: UDP underpins motor recovery after stroke. Externally-paced training may be a useful adjunct to movement rehabilitation therapy Introduction Use-dependent plasticity (UDP) involves the strengthening of existing neural connections, and the formation of new connections within the primary motor cortex (M1) in response to voluntary motor activity. Patients rely on UDP to regain function after brain injury, such as stroke (Nudo et al., 2001). Experimentally in human participants, UDP is evident after 30 minutes of brisk, repetitive thumb movements made in a specific direction, through measureable increases in corticomotor excitability to the involved musculature, and alteration of transcranial magnetic stimulation (TMS)-evoked thumb movements, toward the trained movement direction (Classen et al., 1998). A number of factors can influence UDP in this paradigm. Pharmacological agents can enhance or block UDP, but contraindications, side effects, and timing difficulties may limit their clinical utility (Bütefisch et al., 2002, Floel et al., 2005a, Meintzschel and Ziemann, 2006, Ziemann et al., 2006). External pacing may provide an alternate means of enhancing UDP. For example, when movements are made in time with a metronome beat, this results in more robust and consistent UDP compared to making the same movements between metronome beats (Chapter 6, Ackerley et al., 2007). In the present study we examined whether movements synchronised to external pacing enhances UDP compared to self-paced movements. Neurorehabilitation typically involves self-paced training and the use of metronome pacing is relatively uncommon. There is evidence that metronome-paced training can improve gait in people with Parkinson s disease and after stroke (Ford et al., 2010, McIntosh et al., 1997, Roerdink et al., 2007, 115
128 Roerdink et al., 2009, Thaut et al., 1993, Thaut et al., 1996, Thaut et al., 1997). Few studies have been conducted on the upper limb. A preliminary study found that metronome pacing induced spatiotemporal stability and enhanced paretic upper limb motor control in stroke patients (Thaut et al., 2002). Although metronome-paced training may have behavioural and functional benefit, the neurophysiological mechanisms underlying these improvements are unclear. The current study evaluated UDP using neurophysiological and behavioural assessments of healthy adults after training of repetitive wrist extension, under metronomepaced and self-paced conditions. Wrist movement was chosen for investigation because of its relevance to stroke, as wrist extensor weakness commonly limits patients ability to carry out daily activities. Our hypothesis was that training brisk, repetitive wrist extension paced by an auditory metronome would increase resting corticomotor excitability in pathways mediating wrist extension and alter the kinematics of TMS-evoked wrist movement toward extension, to a greater extent than self-paced training. The synchronous arrival of afferent auditory input from the auditory cortex via ipsilateral premotor and supplementary motor cortex (Jantzen et al., 2009), with depolarisation of pyramidal cells in the M1 wrist representation during movement execution, may lead to an increase in synaptic efficacy conforming to Hebbian principles (Hebb, 1949). We also investigated the effect of tempo on UDP by comparing metronome-paced training at the participant s preferred movement frequency with a more demanding movement frequency Methods Twelve right-handed (Edinburgh Handedness Inventory ± 4.2%, (Oldfield, 1971) (Appendix 2) healthy adults (6 male; mean age 26 years [range 20 49]) were 116
129 recruited. Participants were screened for potential contraindications to TMS to ensure their safe participation. Written consent was obtained from all participants for this study approved by the appropriate local ethics committee (Appendix 4) Recording and stimulation Participants were seated with their right arm supported in a customised manipulandum that enabled flexion and extension of the wrist (Figure 7.1A). Surface electromyography (EMG) was recorded from right extensor carpi radialis (ECR) and flexor carpi radialis (FCR) using bipolar electrode configurations. These muscles were chosen as they are major contributors to wrist extension and flexion, have a minimal effect on movement at adjacent joints, and can be monitored reliably by surface EMG. EMG was amplified (P511 AC, Grass Instrument Division, Warwick, RI, USA), band-pass filtered ( Hz), sampled at 2 khz using custom software (LabView, National Instruments Corporation, Austin, TX, USA) and stored for subsequent analysis. Single pulse TMS of left M1 (every 3 5 s) was used to elicit motor evoked potentials (MEPs) in the resting right forearm, and evoke movement at the wrist. TMS was applied using a 70 mm figure-of-eight coil connected to a Magstim 200 magnetic stimulator (maximum output intensity 2.0 T, Magstim, Dyfed, UK). The coil was held tangential to the scalp at 45 degrees to induce current flow in the postero-anterior (PA) direction (Kaneko et al., 1996). The optimal position on the scalp was marked to ensure consistent coil placement. Rest motor threshold (RMT) was defined as the minimum stimulation intensity that produced a peak-to-peak MEP amplitude 50 µv in FCR in four of eight consecutive trials (Rossini et al., 1994). The stimulation intensity for each experimental session was set to the minimum suprathreshold intensity ( 120% RMT) that consistently produced right wrist flexion or extension. 117
130 To determine whether UDP affected characteristics of a simple reaction time task, participants were required to extend their right wrist (within the manipulandum) as fast as possible in response to a cutaneous electrical stimulus (pulse duration 1 ms, CCU1, Grass Instrument Division, Warwick, RI, USA), delivered every 5 10 seconds to the dorsum of the left hand (3 x sensory perceptual threshold). Figure 7.1 A. Participant seated with their arm supported in a customised manipulandum, enabling wrist flexion and extension. B. Flowchart of experimental protocol. TMS = TMS to the left primary motor cortex (M1) delivered when the participant was at rest. RT = reaction time task. TRAIN = represents five training blocks. 118
131 Experimental protocol Each participant completed three sessions (at least 24 hours apart) that were identical, except for the pacing protocol used for training (Figure 7.1B). Data were collected before (PRE I, PRE II ), during (D), and early (E), mid (M) and late (L) after training. During training the participant s forearm remained secured in pronation, but the hand was unrestrained to enable brisk, repetitive wrist extension movements against gravity. A photo-electronic sensor beam (SunX, EX31-A, Japan) was mounted near maximum extension to provide a movement count, and to help participants maintain consistent movement amplitude. All sessions involved training consisting of ten blocks (T1 T10) of 120 wrist extensions interleaved with 30 second rest periods, except after T5 when TMS assessment occurred. In session one, training was self-paced (SP), with no auditory cueing. Participants were asked to briskly extend their wrist and then let it completely relax, and to do this repeatedly at a comfortable pace that they could maintain all day if they had to. The average movement frequency (Hz) during the SP session was used to set the tempo of the auditory metronome (pitch 800 Hz, pulse duration 50 ms) in the later sessions. Metronome pacing was given at the participant s preferred movement frequency (MP) (i.e. matched to SP) or at a demanding movement frequency (MD) (i.e. 1.5 times faster than SP). The order of the metronome-paced sessions (MP, MD) was randomised and counter-balanced Data treatment The primary outcome measures of MEP area and stimulus-evoked velocity (SEV) were used to evaluate UDP. An increase of MEP amplitude and SEV would indicate a dynamic increase of corticomotor excitability and a bias in M1 circuitry toward the kinematic properties of the trained movement. These measures therefore reflect an increase in synaptic efficacy, which contributes to UDP. 119
132 MEP area (mv ms) was used to assess corticomotor excitability from left M1 to the right forearm. Individual MEPs collected at each time-point were rectified and averaged. The average MEP area was calculated within a 15 ms window from MEP onset, determined for each participant. MEP area, rather than amplitude, was determined since MEPs in forearm muscles can be polyphasic (Stinear and Byblow, 2004c). Root mean square (rms) was calculated 50 ms pre-trigger to determine muscle quiescence. Trials were rejected online when rmsemg exceeded 15 µv and additional trials were collected to ensure 16 trials were available for subsequent analysis. Potentiometer signals (V) were calibrated and used to determine wrist angle (deg). Signals were differentiated and filtered (Butterworth, 5 Hz cut-off) to derive wrist angular velocity (deg s -1 ) and again for acceleration (deg s -2 ). SEV (deg s -1 ) was defined as the velocity at the first peak acceleration (Figure 7.2) (Byblow et al., 2007). SEV provides a measure of TMS-evoked movement direction and velocity, before reflexes or volition can affect the movement. Figure 7.2 Representative hand displacement, velocity and acceleration profiles from one participant, demonstrating transcranial magnetic stimulation (TMS)-evoked movements of the wrist and the method for determination of stimulus-evoked velocity (SEV, vertical dashed line). 120
133 To explore any behavioural effects of paced training, reaction time (RT) and ECR EMG area were calculated. Reaction time was defined as the elapsed time (ms) between the cutaneous stimulation and onset of EMG activity in right ECR. The ECR EMG area (mv ms) during brisk extension was calculated in a 150 ms window from EMG burst onset. To evaluate training, individual EMG bursts (120) were rectified and averaged for each training block (T1 T10). Average EMG activity was expressed as an area measure (mv ms) and calculated over the entire EMG burst (400 ms window, 250 ms pre-metronome beat), for both ECR and FCR for T1 T10. Additionally, the coefficient of variation (SD/mean frequency per training block x 100) was calculated to determine variability of movement frequency corrected for the mean Statistical analysis Repeated-measures analysis of variance (RM-ANOVA) was used, with Huynh-Feldt correction for non-spherical data (Huynh and Feldt, 1976). Factors and levels for each analysis are identified in the results section. Baseline data for each variable (MEP area, SEV, RT) were stable across two time-points (PRE I and PRE II, all P > 0.1) and were therefore pooled to produce a single PRE measure for subsequent analysis. The effects of training were analysed by normalising POST measures to PRE. Linear regression analysis was conducted to determine if there was any correlation between the differential modulation of corticomotor excitability (i.e. the difference between normalised ECR and FCR MEP area) and kinematic measures of UDP (i.e. normalised SEV). Average values for RT and ECR EMG area POST training were normalised to PRE. Paired t-tests were used post hoc to explore main effects and interactions with PACING. Based on the a priori hypotheses, data from SP sessions were compared to MP sessions, and MP to MD sessions. One-sample t- tests were used to determine whether POST training data differed from PRE. All results are 121
134 reported as mean ± SEM. Statistical significance was set to α = A modified Bonferroni procedure was used to correct for multiple comparisons (Rom, 1990) Results MEP area (mv ms) MEP area was modified by the pacing protocols (Figure 7.3A). A 2 MUSCLE (ECR, FCR) x 3 PACING (SP, MP, MD) x 4 TIME (D, E, M, L) RM-ANOVA revealed a MUSCLE x PACING interaction (F 2,18 = 3.76, P = 0.043), a MUSCLE x TIME interaction (F 3,27 = 3.00, P = 0.048), a PACING x TIME interaction (F 6,54 = 2.32, P = 0.046) and a main effect of TIME (F 3,27 = 10.51, P = 0.002). There were no other main effects or interactions (all P > 0.2). The MUSCLE x PACING interaction arose because ECR MEP area was similarly affected by the three pacing protocols, while FCR MEP area increased after MD training only. Paired t-tests were conducted on data collapsed over TIME. ECR MEP area was similar after SP and MP training (P > 0.4) and after MP and MD training (P > 0.3). FCR MEP area was similar after SP and MP training (P > 0.2), but was greater after MD than MP training (P = 0.017). For the SP and MP sessions, facilitation of ECR MEP area after training was larger than that of FCR MEP area, with the difference reaching significance after MP training (P = 0.023) but not SP training (P > 0.1). After MD training, FCR MEP area tended to be larger than ECR MEP area (P = 0.090). The PACING x TIME interaction was explored separately for ECR and FCR, due to the effects of muscle on MEP area described above. Post hoc analysis revealed that ECR MEP area increased over time for all protocols. ECR MEP facilitation was similar for SP and MP protocols, and MP and MD protocols, at each time-point (all P > 0.25). ECR MEP area was facilitated relative to baseline 20 minutes (LATE) after both MP and MD (both P < 0.04), but 122
135 not SP (P > 0.1). FCR MEP area was facilitated after MD training, but not SP or MP training. FCR MEP area was increased at the MID and LATE time-points after MD training compared to MP training (both P < 0.045) and baseline (both P < 0.03). FCR MEP areas were equivalent after SP and MP at all time-points (all P > 0.4) and did not differ from baseline (all P > 0.07) Stimulus-evoked velocity (SEV, deg s -1 ) There was a persistent increase in SEV after MP training and a transient increase early after SP training (Figure 7.3A). A 3 PACING (SP, MP, MD) x 4 TIME (D, E, M, L) RM- ANOVA revealed a PACING x TIME interaction (F 6,54 = 2.33, P = 0.045), but no main effects (P > 0.6). Post hoc analysis revealed a difference in SEV after SP and MP training at the MID (P = 0.049) and LATE (P = 0.021) time-points, as SEV increased relative to baseline after MP training (both P < 0.015) but not after SP training (both P > 0.07). SEV was increased EARLY after SP training (P = 0.022) but did not differ significantly from MP training (P > 0.1). After MD training SEV was unchanged (all P > 0.1) Linear regression Linear regression analysis revealed a positive correlation between MEP area difference measures and SEV (F 1,118 = 19.0, P < 0.001) (Figure 7.3B). As the difference between normalised ECR and FCR MEP area increased, normalised SEV values became more positive, reflecting wrist movement more toward extension than at baseline. 123
136 Figure 7.3 A. MEP AREA is normalized (PRE = 100%). Filled circles = ECR. Open circles = FCR. Filled triangles = normalized SEV (relative to PRE). Positive SEV reflects movement more toward extension than at baseline. SP = Self-paced training. MP = Metronome-paced training at the participant s preferred movement frequency. MD = Metronome-paced training at the demand movement frequency. D = During training. E = EARLY (0 10 min), M = MID (10 20 min), L = LATE (20 30 min) time-point after training. B. The difference between ECR and FCR MEP AREA (%) plotted against normalized SEV (deg s -1 ). The regression equation describes the line of best fit for all data points. Black diamonds = SP. Grey diamonds = MP. White diamonds = MD. Error bars, SEM. indicates a significant change relative to PRE, P < Reaction time task The training protocol did not differentially change RT (ms), or ECR EMG area (mv ms), with no main effects or interactions found with 3 PACING (SP, MP, MD) x 3 TIME (E, M, L) RM-ANOVAs (all P > 0.05). Posttraining data was pooled and compared to baseline. RT did not change (normalised POST 99.9 ± 1.0 %, one-sample t-test P > 0.9, PRE 146 ± 10.8 ms, POST 146 ± 11.9 ms). The ECR EMG area decreased after training (normalised POST 87.9 ± 2.8 %, one-sample t-test P < 0.01, PRE 14.8 ± 1.6 mv ms, POST 13.0 ± 1.2 mv ms) Training Training effort was consistent across all training protocols, as shown in Table 7.1. The 2 MUSCLE (ECR, FCR) x 3 PACING (SP, MP, MD) x 10 TIME (T1-T10) RM-ANOVA 124
137 revealed the expected main effect of MUSCLE (F 1,9 = 41.9, P < 0.001), because EMG activity was larger in ECR than FCR (P < 0.001). By design, movement frequency was matched during the SP and MP training (P > 0.9) and 1.5 times greater for MD training (P < 0.001). Coefficient of variation was greater during SP training compared to both metronome-paced training (both P < 0.01), which were equivalent (P = 0.149). Additional factors that could potentially influence interpretation of the results were analysed (Table 7.1). Mean RMT and stimulation intensity did not differ across training protocols. An omnibus RM-ANOVA of rmsemg data revealed no main effects or interactions with PACING (all P > 0.1), all rmsemg values for ECR and FCR muscles were < 15 µv confirming quiescence during TMS. Table 7.1: Analysis of Variables across training Protocols SP MP MD PACING main effect F 2,18 P Training EMG area (mv ms) ECR 27.7 ± ± ± FCR 4.5 ± ± ± Movement frequency (Hz) 1.0 ± ± ± Coefficient of variation (%) 7.8 ± ± ± Stimulation RMT (%MSO) 56 ± 4 58 ± 4 56 ± Stimulation intensity 60 ± 4 62 ± 4 60 ± During REST Mean rmsemg (µv) ECR 8.8 ± ± ± 0.2 FCR 6.9 ± ± ± 0.3 EMG = Electromyography. ECR = Extensor carpi radialis. FCR = Flexor carpi radialis. %MSO = Percentage maximum stimulator output. rms = root mean square. 125
138 7.5. Discussion Wrist extension training produced the most persistent UDP when metronome-paced, but only at the participant s preferred movement frequency (MP). When training was selfpaced (SP) there was early, but transient, UDP. MP training was associated with extensorspecific facilitation of resting corticomotor excitability that altered kinematics of TMSevoked movement more toward extension than at baseline. When metronome-paced training was performed at a more demanding pace (MD) there was non-specific facilitation of corticomotor excitability and no alteration in the kinematics of TMS-evoked wrist movement Self-paced versus metronome- paced training MP training produced a greater modulation of corticomotor excitability than SP training. ECR corticomotor excitability increased significantly from baseline only after MP training. FCR corticomotor excitability was unchanged after both protocols. These findings are consistent with previous research where short-term repetitive training paced by a 1 Hz metronome facilitated the training agonist, with or without suppression of the training antagonist (Ackerley et al., 2007, Bütefisch et al., 2000, Bütefisch et al., 2002, Bütefisch et al., 2004, Classen et al., 1998, Krutky and Perreault, 2007). Differential modulation of ECR and FCR MEP area was only observed after MP training, indicating that external pacing promotes a spatially selective bias in corticomotor excitability. TMS-evoked wrist kinematics were altered by SP and MP training protocols at different times. After MP training (mean movement frequency 1 Hz) stimulus-evoked velocity (SEV) gradually increased and differed from baseline after 20 minutes, reflecting faster TMS-evoked wrist movement toward extension. SEV was increased 10 minutes after SP training but was not sustained, returning to baseline 20 minutes after SP training. To our knowledge, self-paced training has not been evaluated previously within a UDP-producing 126
139 TMS paradigm. Our results show directional tuning of the wrist motor representation after MP training that is comparable to earlier UDP studies that paced training with a 1 Hz metronome (Ackerley et al., 2007, Bütefisch et al., 2000, Bütefisch et al., 2002, Bütefisch et al., 2004, Classen et al., 1998, Krutky and Perreault, 2007). External pacing at a participant s preferred movement frequency produces a more persistent alteration in the kinematics of the trained motor representation than self-paced training. Interestingly, linear regression analysis revealed a weak but significant positive correlation between the difference in ECR and FCR MEP size and SEV. The larger the spatially selective bias of corticomotor excitability, the greater the alteration of TMS-evoked movements toward the trained direction. Similar relationships can be drawn from previous studies (Bütefisch et al., 2000, Floel et al., 2005a, Krutky and Perreault, 2007, Meintzschel and Ziemann, 2006). MEPs were only recorded from the prime movers for wrist extension and flexion. This may have weakened the relationship between corticomotor excitability and kinematic variables, as smaller contributions from neighbouring musculature may influence SEV but not be reflected in ECR and FCR MEP areas. Similarly, as TMS intensities to evoke movement at the wrist are typically higher than those to evoke movement in distal musculature, we cannot rule out the possibility that mechanical displacement of the finger and thumb contributed to wrist displacement. This may also weaken the observed relationship. Recording EMG activity of distal musculature would be appropriate in future studies. We found that MP training produced the largest spatially selective bias in corticomotor excitability of the training agonist and antagonist and the most persistent increase in TMS-evoked wrist movement toward the trained direction. We suspect that entrainment to external pacing, but only at the participant s preferred movement frequency, augments synaptic efficacy of neural connections specific to the trained direction, more so than self-paced training. Functional brain imaging has identified a broader 127
140 activation pattern within cortical and subcortical regions and increased inter-regional coupling during self-paced movement when compared to movements synchronised with an auditory metronome (Gerloff et al., 1998a). This indicates that performing rhythmic selfpaced movement appears to increase the demands on the motor system, whereas metronomepacing enhances efficiency. Furthermore, rhythmic pacing appears to provide an anticipatory cyclical time constraint that improves spatial and temporal stability during repetitive upper limb reach, minimising overall movement cost (Thaut et al., 2002). It is possible that a difference in training contributes to the extent of UDP. In the present study movement frequency was more variable and the force produced was larger when movements were selfpaced compared to metronome-paced, although this did not reach statistical significance. This may indicate that training under self-paced conditions focuses attention on force at the expense of timing, whereas the opposite may occur during paced training. However, UDP did not depend on the participants goal, as metronome-paced and metronome-demand training produced disparate UDP, despite being performed with very similar force and timing. Therefore, the tendency for more forceful movements with more variable timing probably does not account for the lesser degree of UDP produced by self-paced training, compared to metronome-paced training. We also cannot exclude the possibility of differences in learning after motor training. Assessment of the behavioural consequence of training was measured with a reaction time task, where the hand was constrained within a manipulandum that only allowed pure flexion and extension of the wrist. There was no difference in reaction time or ECR EMG area across the different conditions, indicating that any learning effects may be equivalent. However, we acknowledge that this assessment approach may not be sensitive to the total kinematics of voluntary motor activity that may be induced by training. We suspect that the timely convergence of auditory input onto M1 during early movement execution may contribute to kinematic stability by facilitating more specific, consistent and synchronised 128
141 motor neuron recruitment. External pacing may therefore facilitates the creation of a spatially selective bias of corticomotor excitability Preferred versus demand metronome- paced training We sought to determine if training at a more demanding frequency would enhance UDP by having subjects make movements at a rate that was 1.5 times faster than their preferred frequency. MD training produced nonspecific facilitation of ECR and FCR corticomotor excitability and the direction and velocity of TMS-evoked wrist movements were unaffected by training. In contrast, MP training produced extensor-specific facilitation of corticomotor excitability, creating a spatially selective bias between ECR and FCR, leading to faster wrist movement toward extension. There are a few possible reasons why MD produced nonspecific modulation of corticomotor excitability. Training at a faster pace may involve greater co-contraction of the forearm musculature than training at a preferred tempo. However, this effect is unlikely to be very large given that EMG activity in ECR consistently exceeded that of FCR across all pacing conditions. A more likely possibility is that performing repetitive movements at a faster tempo requires increased cortical activation (Jancke et al., 2000, Riecker et al., 2003), and the faster pace increases attentional demands. These may result in disinhibition of closely related muscle representations (Rosenkranz and Rothwell, 2004), and contribute to the nonspecific facilitation effect observed after MD training. Similarly, the faster movement frequency may have downregulated the intracortical inhibition acting on active muscle representations within M1 during phasic movement (Stinear and Byblow, 2003b). As the time between movements decreases, a downregulation of inhibition may result in a global, rather than specific, increase in forearm representation excitability. Both of these 129
142 possibilities may have contributed to the nonspecific effects on FCR and ECR MEPs after MD training Significance The current study provides novel neurophysiological evidence that metronome-paced training at the participant s preferred movement frequency promoted UDP through spatially selective modulation of corticomotor excitability. Reaction times did not differ with or without pacing, however area of ECR EMG bursts were reduced after training indicating in part, an improved efficiency with respect to burst duration. The utility of external pacing for movement retraining has been demonstrated with clinical populations (Ford et al., 2010, McIntosh et al., 1997, Roerdink et al., 2007, Roerdink et al., 2009, Thaut et al., 1993, Thaut et al., 1996, Thaut et al., 1997, Thaut et al., 2002), yet it is not routinely used in rehabilitation. The present results may be especially relevant for motor recovery after stroke. After stroke corticomotor excitability is reduced in the lesioned hemisphere (Traversa et al., 1998), and improved recovery is associated with interventions that increase corticomotor excitability of this hemisphere (Hummel et al., 2005, Stinear et al., 2008). Controlled patient studies might evaluate the efficacy of metronome-paced movement training on UDP and motor recovery after stroke. 130
143 Chapter 8. COMBINING THETA BURST STIMULATION WITH TRAINING AFTER SUBCORTICAL STROKE This experiment has been reported in shorter form by Stroke, Ackerley et al., Combining theta burst stimulation with training after subcortical stroke, Copyright Wolters Kluwer Health (2010); 41; Abstract Background and purpose: Repetitive transcranial magnetic stimulation of the primary motor cortex (M1) may improve outcomes after stroke. The aim of the study was to determine the effects of M1 theta burst stimulation (TBS) and standardised motor training on upper limb function of patients with chronic stroke. Methods: Ten patients with chronic subcortical stroke and upper limb impairment were recruited to this double-blind, crossover, sham-controlled study. Intermittent TBS of the ipsilesional M1, continuous TBS of the contralesional M1, and sham TBS were delivered in separate sessions in conjunction with standardised training of a precision grip task using the paretic upper limb. Results: Training after real TBS improved paretic hand grip-lift kinetics, whereas training after sham TBS resulted in deterioration of grip-lift. Ipsilesional M1 excitability increased after intermittent TBS of the ipsilesional M1 but decreased after continuous TBS of the contralateral M1. Action Research Arm Test scores deteriorated when training followed continuous TBS of the contralesional M1, and this was correlated with reduced ipsilesional corticomotor excitability. Conclusions: Generally, TBS and training led to task-specific improvements in grip-lift. Specifically, continuous TBS of the contralesional M1 led to an overall decrement in upper limb function, indicating that the contralesional hemisphere may play a pivotal role in recovery after stroke. 131
144 8.1. Introduction After stroke, many patients are left with upper limb impairment. Poor upper limb recovery is associated with an imbalance in hemispheric activity, downregulated excitability in the ipsilesional primary motor cortex (M1), and upregulated excitability in the contralesional M1 (Koski et al., 2004). Experimental neuromodulation techniques that rebalance M1 excitability have led to improved upper limb function and may be used to prime the brain before therapy (Hummel et al., 2005, Stinear et al., 2008). Theta burst stimulation (TBS) is a pattern of repetitive, transcranial magnetic stimulation that can facilitate M1 excitability when delivered intermittently or suppress M1 excitability when delivered continuously (Huang et al., 2005). Intermittent TBS of the ipsilesional M1 (itbs ipsim1 ) and continuous TBS of the contralesional M1 (ctbs contram1 ) may be used to rebalance M1 excitability and may have therapeutic benefit (Hummel et al., 2008, Talelli et al., 2007a). However, engaging in voluntary activity can block or reverse the neurophysiologic after-effects of ctbs (Gentner et al., 2008, Huang et al., 2008). Furthermore, ctbs contram1 may have deleterious effects on the paretic upper limb if the contralesional M1 contributes to its motor control (Lotze et al., 2006). In this study, itbs ipsim1 and ctbs contram1 were each combined with standardised upper limb training. We hypothesised that both TBS protocols would facilitate ipsilesional M1 excitability and improve measures of upper limb performance Methods Subjects Ten adults with persistent upper limb impairment at least 6 months after subcortical stroke participated (Table 8.1). Exclusion criteria were contraindications to TMS, 132
145 medications known to alter CNS excitability, modified Rankin Scale (mrs) > 3 (Appendix 5), National Institutes of Health Stroke Scale (NIHSS) 16 (or score 2 on level of consciousness, sensory or language components) (Appendix 6), and upper limb wrist and hand Fugl-Meyer (FM) subscales total 28 (maximum 32, Appendix 7) (Fugl-Meyer et al., 1975). Written consent was obtained, and the study was approved by the regional ethics committee (Appendix 8). Table 8.1: Participant Characteristics No. Sex Age (years) Time since stroke (months) NIHSS (max 42) NIHSS sensory subscale FM mrs Hemi Type Affected Structures BG Capsule Cortical 1 M R I Pu, Th 2 M R I Ext 3 F R H Th 4 F R I Pu, GP, Ca Int (A, G) 5 F L I Pu, GP, Th Int (P) Ins 6 M L I All 7 F L I Ext 8 F L I Pu, GP 9 F L H All 10 F L I Pu, GP, Ca Int (A,G, P) Temp, Ins Mean SD Max Min NIHSS sensory subscale (normal = 0, mild/moderate sensory loss = 1). FM = Fugl-Meyer upper limb score (subscale maximum 32). mrs = Modified Rankin Score. Hemi = hemisphere affected by the stroke. Type (Ischaemic/Haemorrhagic). Affected Structures: BG = basal ganglia; Pu = putamen; Th = thalamus; GP = globus pallidus; Ca = caudate; Int = internal capsule (A = anterior limb, G = genu, P = posterior limb); Ext = external; Temp = temporal cortex; Ins = insular cortex. 133
146 Experimental procedures Three experiments (itbs ipsim1, ctbs contram1, and sham TBS) were performed in a randomised order and separated by 1 week (see Figure 8.1 for a flowchart of the experimental procedures). Upper limb motor training consisted of 4 blocks of precision grip movements, each lasting 4 minutes, and carried out 15 minutes after TBS. Participants performed a pegboard task by picking up cylindrical pegs and inserting them into holes in the board and then removing them one at a time. The dose of physical therapy was quantified as the number of pegs placed successfully in each block. Grip-lift kinetics, corticomotor excitability, and upper limb function assessments were made before and after intervention. Figure 8.1 Flowchart of the experimental procedures. In the experiment, blank rows indicate when patients are at rest and grey shading indicates voluntary activity with each hand in a randomised order. ARAT = Action research Arm Test. MEP = Twelve motor evoked potential (MEPs) recorded from each FDI. GRIP = 10 grip-lifts with the paretic hand. 134
147 During TBS the participant was seated and resting comfortably with their hands on their lap. TBS at 90% of the active motor threshold (AMT) of the nonparetic first dorsal interosseous (FDI) was administered with a biphasic stimulator (MagStim, Dyfed, UK) by an investigator blinded to data collection and analysis. TBS at 90%AMT was chosen in an attempt to prolong the after-effects on corticomotor excitability. Enhanced and longer-lasting suppression of M1 has been shown with ctbs applied with a reverse coil orientation at 100%AMT in healthy adults (Talelli et al., 2007b). For itbs, a standard coil orientation produced more facilitation than when delivered with a reverse coil orientation, but an increased stimulation intensity was not tested (Talelli et al., 2007b). Before the current study, pilot experimental data in healthy adults confirmed TBS after-effects in the expected direction. In each session, 600 stimuli were delivered (Huang et al., 2005), with a reverse coil orientation used for ctbs contram1. Sham TBS (intermittent or continuous) was delivered to either M1 with a sham coil. Grip-lift kinetics were acquired with an instrumented manipulandum (265 g) held between the index finger and thumb, lifted to 10 cm, and held for 3 seconds (Figure 8.2). Ten lifts were made with each hand at each grip time point. Grip force perpendicular to the contact surface and load force parallel to vertical were acquired with transducers (MLP-100, Transducer Techniques, Temecula, CA), and a data acquisition system (ADInstruments Ltd, NZ), sampled at 1 khz, low-pass filtered (15 Hz) and stored for offline analysis. Preload force (PF, in newtons) was determined as the maximal downward force on the manipulandum before lift-off. Preload duration (PD, ms) was determined as the time between grip force onset and positive load force at lift-off. PF and PD are sensitive measures of manual dexterity impairment in stroke patients (McDonnell et al., 2006). Longer PDs and larger PFs are associated with impairment in manual dexterity in adult hemiplegia (McDonnell et al., 2006). 135
148 Corticomotor excitability was assessed with single pulse transcranial magnetic stimulation of the M1 with a figure-of-eight coil (75mm wing diameter) connected to a MagStim 200 stimulator. The coil was positioned tangential to the scalp over M1, with the induced current in a posterior-anterior direction. The optimal sites for stimulation were marked directly on the scalp. Surface electromyography was recorded from both FDI muscles, amplified (P511 AC, Grass Instrument Division, Warwick, RI) and band-pass filtered ( Hz), and sampled at 2 khz for off-line analysis (LabView, National A B Figure 8.2 Grip force (thick trace) and load force (thin trace) data from a representative stroke patient as the manipulandum is lifted, held and then replaced onto the table. Nonparetic hand (A), paretic hand (B). The interval between the vertical dashed lines (X) represents preload duration (ms). The interval between the horizontal dashed lines (Y) represents preload force (N). Inset: grip-lift device during the lift. Instruments, TX). Stimulation intensity was set to produce a motor evoked potential amplitude (MEP, in mv) that was 50% of the maximum MEP obtainable in the resting contralateral FDI. Twelve MEPs were recorded from each FDI at each MEP time point. When no MEP was elicited from the ipsilesional M1 (< 0.05 mv), 100% stimulator intensity was applied at the mirror location of the contralesional M1. The computer software prevented data collection if the pre-trigger electromyography levels were >10 µv, ensuring that both muscles were at rest. 136
149 The ARAT provides an objective measure of upper limb motor function (Lyle, 1981) (Appendix 9). The ARAT is composed of 19 tasks within four categories; grasp (6), grip (4), pinch (6) and gross (3) movement. The tasks are relevant to upper limb activities that may be used in daily life. Each task is scored on an ordinal scale out of a maximum of three (0 3), thus the ARAT has a maximum score of 57. Scoring incorporates the time taken to perform the movement (compared to a normalised value) and the quality of movement (points are removed if the subject demonstrates excessive trunk flexion reflecting significant compensation). Higher scores indicate better upper limb function. The ARAT has high reliability and validity (Hsieh et al., 1998, Lyle, 1981) and is sensitive to change in a stroke population (Rabadi and Rabadi, 2006). Repeated-measures ANOVA was used for grip-lift kinetics and MEP amplitudes, with Huynh-Feldt correction for non-spherical data (Huynh and Feldt, 1976). MEP amplitudes of the paretic FDI required logarithmic transformation to meet the assumptions of normality. Baseline data (PRE I and PRE II ) were pooled into a single measure (PRE) because there were no main effects or interactions with time (all P > 0.25). Post-TBS PF and PD were normalised to PRE (%PRE). A Wilcoxon signed-rank test was used for ARAT scores. Paired t-tests and one-sample t-tests were used for post hoc analysis, with modified Bonferroni correction for multiple comparisons (Rom, 1990). Significance level was Results The protocols were well tolerated by all participants. Baseline data and stimulation intensities were stable across sessions (all P > 0.1) (Table 8.2). There were differences between the paretic and nonparetic hands for all dependent variables (all P 0.03), as 137
150 Table 8.2: Baseline Variables Paretic Nonparetic Between HANDS Between PROTOCOLS Sham itbs ctbs Mean Sham itbs ctbs Mean Between SESSIONS Stimulation F 1,9 P F 2,18 P F 2,18 P Stimulation Intensity (50% MEP max) ± 4.49 ± 4.40 ± 4.45 ± 4.36 ± 3.32 ± 3.23 ± 3.48 ± 3.23 Active motor threshold (%) 52.3 ± ± ± ± Parametric MEP amplitude (mv) ± 0.05 ± 0.04 ± 0.03 ± 0.04 ± 0.11 ± 0.10 ± 0.07 ± 0.07 Preload duration (ms) ± 107 ± 102 ± 280 ± 139 ± 24 ± 20 ± 22 ± 19 Preload force (N) ± 0.34 ± 0.32 ± 0.92 ± 0.53 ± 0.06 ± 0.04 ± 0.03 ± 0.03 Non-parametric Z P All Z All P All Z All P ARAT (median score [range]) 44 [27-56] 44 [27-55] 44 [27-56] 44 [27-56] 56 [55-57] 57 [56-57] 57 [56-57] 57 [56-57] < > 0.2 < > 0.06 Mean values and significant differences (P < 0.05) are bold. ARAT = Action research arm test. 138
151 expected. The amount of training was equivalent across sessions (all P > 0.3). There were no significant changes in any variable for the nonparetic hand (all P > 0.1) Grip-lift kinetics Paretic hand PF deteriorated when training followed sham TBS, but not real TBS. There was a PROTOCOL x HAND x TIME interaction (F 4,36 = 3.42, P = 0.018) and no main effects or other interactions (all P > 0.1). The interaction was explored for each protocol separately with no main effects or interactions for ctbs contram1 (all P > 0.085) or itbs ipsim1 (all P > 0.54). A HAND x TIME interaction occurred with training after sham TBS (F 2,18 = 4.16, P = 0.033) because PF deteriorated (was excessive) in the paretic hand, but not the nonparetic hand (Figure 8.3A). Paretic hand PF deteriorated at POST 26 (during training) compared with baseline and POST 9 (before training; both P 0.05) and remained excessive (POST 26 vs POST 41 P = 0.898) Paretic hand PD improved when training followed real TBS compared with sham TBS. A main effect of TIME indicated that PD improved (shortened) during the experiment (F 2,18 = 5.10, P = 0.034). A PROTOCOL x HAND interaction (F 2,18 = 4.15, P = 0.033) indicated that paretic hand PD improved when training followed ctbs contram1 (P = 0.026) and itbs ipsim1 (P = 0.046, non significant when corrected) compared with sham TBS. Paretic hand PD improved from baseline after ctbs contram1 (P = 0.028), with a similar trend after itbs ipsim1 (P = 0.057; Figure 8.3B). 139
152 Figure 8.3 Preload force (A) and preload duration (B, collapsed over time), during precision grip-lift. Values < 100% indicate improvement; values > 100% deterioration. Bars, black = itbs ipsim1, grey = ctbs contram1, white = sham TBS. Error bars, SEM. * P < P < 0.06 or P < 0.05 n.s. corrected MEP amplitude MEP amplitude was modulated by real TBS. For the paretic FDI, there was a PROTOCOL x TIME (PRE, POST 7 ) interaction (F 2,18 = 4.13, P = 0.033) because MEP amplitude increased after itbs ipsim1 (P = 0.029) but tended to decrease after ctbs contram1 (P = 0.049, n.s. corrected) (Figure 8.4A). Sham TBS did not change paretic FDI MEP amplitude (P = 0.208). The modulation of real TBS on paretic FDI MEP amplitude did not persist. For the paretic FDI, there was a PROTOCOL x TIME (POST 7, POST 13, POST 24, POST 39 ) interaction (F 6,54 = 2.30, P = 0.048). After itbs ipsim1, there was an effect of time (F 3,27 = 3.62, P = 0.026). Although MEP amplitude was facilitated at POST 7 (before training), it did not differ from baseline at any other time points (during training, all P > 0.1). After ctbs contram1 and sham TBS, there was no effect of time on MEP amplitude during training (both P > 0.1). 140
153 A B Figure 8.4 A. Paretic hand FDI MEP amplitude (untransformed, % PRE) for each participant and group mean immediately after (POST 7 ) itbs ipsim1 (left) and ctbs contram1 (right). B. Regression analysis between ARAT values (positive values indicate improvement; negative values deterioration) and paretic hand FDI MEP amplitude from the itbs ipsim1 and ctbs contram1 sessions. Data points are participants. Bars/symbols, black = itbs ipsim1, grey = ctbs contram1, white = sham TBS. Error bars, SEM. * P < P < 0.06 or P < 0.05 n.s.when corrected Upper limb function Paretic upper limb function deteriorated when training followed ctbs contram1, and this was correlated with the initial reduction in paretic FDI MEP amplitude. ARAT score (median pre vs post) deteriorated after the ctbs contram1 session (46 vs 41, P = 0.024) but was unchanged after the itbs ipsim1 (44 vs 44, P = 0.339) and sham TBS (43 vs 42, P = 0.778) sessions. Correlations were explored between ARAT (POST-PRE), grip-lift kinetics, and paretic FDI MEP amplitude (both % change from pre) after each TBS protocol. A moderate, positive correlation was found between ARAT and paretic FDI MEP amplitude after ctbs contram1 (R 2 = 0.47, P = 0.028; Figure 8.4B), indicating that a reduction in ARAT 141
154 score was related to paretic FDI MEP suppression. There were no other correlations (all P > 0.2) Discussion This study is the first to use M1 TBS before upper limb motor training in stroke patients, akin to its potential use in rehabilitation. Priming training with itbs ipsim1 or ctbs contram1 improved performance of the paretic hand, but ctbs contram1 was associated with reduced upper limb function. After sham TBS, paretic hand PF deteriorated and PD did not improve, indicating fatigue. In contrast, PF remained stable and PD improved with training after ctbs contram1 and tended to improve after itbs ipsim1. After subcortical stroke, grip forces are scaled less by anticipation (i.e. feedforward) and more in response to afferent input after contact with the object (i.e. feedback) (McDonnell et al., 2006). Our participants pressed down excessively on the manipulandum (PF) before initiating the lift with the paretic hand. This strategy increases afferent feedback from cutaneous receptors within the fingertips allowing the participant to test grip security before initiating the lift, and also explains the lengthening of preload duration - the additional time allows integration of sensory information with the motor plan. Improvements in paretic hand PF and PD after real TBS may have resulted from facilitated integration within the primary sensory and/or motor cortex, enabling more efficient processing of afferent feedback, and shortening the preload period (Schabrun et al., 2008). Upper limb function deteriorated after ctbs contram1. Paretic upper limb function transiently decreased after training combined with ctbs contram1 but not with itbs ipsim1 or sham TBS. Unlike an earlier study examining stroke patients at rest (Talelli et al., 2007a), ctbs contram1 suppressed ipsilesional M1 excitability. This may have occurred because the 142
155 effects of ctbs are vulnerable to motor activity or because of the reverse coil orientation (Gentner et al., 2008, Iezzi et al., 2008). The effect of ctbs contram1 on ipsilesional M1 is most likely mediated by transcallosal projections from the contralesional M1, but further investigation is required to elucidate specific mechanisms. Interestingly, participants in whom ctbs contram1 had the most suppressive effect on ipsilesional corticomotor excitability had the greatest decrement in ARAT score. However, grip-lift performance was not adversely affected. Although task-specific effects of upper limb training may be better maintained in cortical networks after real TBS, decrements in other tasks may be due to suppressive effects of ctbs contram1. Conversely, itbs ipsim1 produced immediate, but not persistent, facilitation of ipsilesional corticomotor excitability, consistent with previous research (Huang et al., 2008, Talelli et al., 2007a). These findings indicate task-specific benefits with primed training after subcortical stroke. The contralesional hemisphere may play a pivotal role in recovery after stroke, as indicated by the deterioration of functional performance after ctbs contram1. Further research is required to ascertain the contribution of the contralesional hemisphere to stroke recovery. 143
156 Chapter 9. HIGH INTENSITY TRANSCRANIAL MAGNETIC STIMULATION MASKS SHORT LATENCY AFFERENT INHIBITION 9.1. Abstract Background: The relationship between short latency afferent inhibition (SAI), a measure of sensorimotor integration, TMS intensity and motor evoked potential (MEP) amplitude was investigated. Hypothesis: We hypothesized that SAI would be dependent on non-conditioned (NC) MEP amplitude, and reduced with high TMS intensities that produce near maximal MEPs. Methods: SAI was obtained by pairing cutaneous stimulation of the finger with single-pulse TMS. Conditioned and NC MEPs recorded from first dorsal interosseous were used to obtain measures of SAI. Results: SAI varied with stimulation intensity (P = 0.003), and was reduced when TMS intensity produced NC MEP amplitudes that were near MEP MAX (P < 0.01). Conclusion: To ensure validity of SAI, we recommend using a stimulation intensity that elicits NC MEP amplitudes of around 50% of MEP MAX. These findings may have implications for the investigation of SAI modulation as a result of non-invasive brain stimulation. 144
157 9.2. Introduction Sensorimotor integration can be estimated by measuring short latency afferent inhibition (SAI). SAI involves electrical cutaneous stimulation of the hand or arm prior to suprathreshold transcranial magnetic stimulation (TMS) of the contralateral primary motor cortex (M1) (Tokimura et al., 2000). At interstimulus intervals (ISIs) between 20 and 50 ms, motor evoked potentials (MEPs) recorded from resting topographically related muscles are suppressed (Classen et al., 2000, Helmich et al., 2005, Ridding and Rothwell, 1999, Ridding et al., 2005, Tamburin et al., 2001). SAI likely reflects relatively direct inhibition of M1 by the primary sensory cortex (S1) via cortico-cortical connections (Ridding and Rothwell, 1999, Ridding et al., 2005, Tokimura et al., 2000), is sensitive to hand dominance (Helmich et al., 2005), spatial attention (Kotb et al., 2005), and modulated functionally to facilitate selective finger movements (Voller et al., 2006). SAI is often reduced in patients with Parkinson s disease (Sailer et al., 2003) or after stroke affecting movement and sensation (Oliviero et al., 2005). SAI may provide a means to evaluate mechanisms underlying the effects of non-invasive brain stimulation that can selectively modulate corticomotor excitability (Ziemann et al., 2008) and can be combined with motor training for therapeutic benefit (Ackerley et al., 2010, Boggio et al., 2007, Fregni et al., 2006, Reis et al., 2009). Therefore, it is important to understand the effects of TMS intensity and MEP amplitude on the measurement of SAI. Like short-interval intracortical inhibition (SICI), SAI appears to have a preferential effect on later I-waves (Di Lazzaro et al., 1998, Tokimura et al., 2000). SICI is optimal when NC MEP amplitude is neither minimal nor maximal (Daskalakis et al., 2002, Garry and Thomson, 2009, Roshan et al., 2003, Sanger et al., 2001). Although SAI influences the same population of corticospinal neurons, it may act through distinct inhibitory interneuron subtypes (Alle et al., 2009). Preliminary findings indicate that SAI may be reduced at higher 145
158 TMS intensities. Although the effect of MEP amplitude and SAI has been studied within a finite range mv (Ni et al., 2011, Udupa et al., 2009), the relationship has not been elaborated upon, nor explored across the full range of likely MEP amplitudes generated across a stimulus-response recruitment curve. While it may be possible to adjust TMS intensity to maintain a consistent NC MEP size, as is often adopted during measurement of SICI (Byblow and Stinear, 2006, Daskalakis et al., 2002, Ridding and Rothwell, 1999, Roshan et al., 2003), this may not always be desirable or possible when excitability changing protocols and their effects on SAI are evaluated e.g., after non-invasive brain stimulation. The aim of this study was to determine the effect of MEP amplitude on SAI and identify a relationship between SAI and MEP amplitude that could be useful for adjusting estimates of SAI. Hypotheses were formulated based on the idea that SAI may be dependent on the intracortical networks activated by TMS. We hypothesised that SAI would be dependent on the non-conditioned (NC) MEP amplitude, and that SAI may be underestimated at high TMS intensities that produce MEPs near maximum amplitude Methods Eighteen right-handed (Edinburgh Handedness Inventory ± 4.0%, (Oldfield, 1971) (Appendix 2) healthy adults (8 male; mean age 27, range years) were recruited. Volunteers with contraindications to TMS were excluded. Written informed consent was obtained from all participants (Appendix 10), and this study was approved by the appropriate ethics committee and in accordance with the 1989 Declaration of Helsinki. 146
159 Recording and stimulation Participants were seated comfortably with their arms resting on a cushion on their lap. Surface electromyography (EMG) was recorded from right first dorsal interosseous (FDI) using a bipolar electrode configuration. EMG signals were amplified (CED 1902, Cambridge, UK), bandwidth filtered ( Hz) and sampled at 2 khz (Signal, CED 1401, Cambridge, UK). Transcranial magnetic stimulation Single-pulse TMS of left M1 was delivered using a 70 mm figure-of-eight coil connected to a Magstim 200 stimulator (maximum output intensity 2.0 T, Magstim, Dyfed, UK) to elicit MEPs in the resting right FDI. The coil was held tangential to the scalp at 45 degrees to induce current flow in the postero-anterior direction (Kaneko et al., 1996). The coil position was marked to ensure consistent placement. Rest motor threshold (RMT) was defined as the minimum TMS intensity that produced a peak-to-peak MEP amplitude 50 µv in right FDI in four of eight trials (Rossini et al., 1994). MEP MAX (mv) was determined and defined as the maximum peak-to-peak MEP amplitude that was produced in resting FDI when TMS intensity was increased incrementally. Electrical cutaneous stimulation Electrical cutaneous stimulation (Digitimer, Constant Current DS7A, UK) was delivered to the right index finger via ring electrodes (Digitimer, UK). The cathode and anode were placed around proximal and middle phalanges respectively. Stimulation consisted of an electrical square wave pulse (1 ms) delivered at an intensity of three times perceptual threshold. 147
160 Experimental protocol Three blocks were collected at different TMS intensities to produce MEP amplitudes in the ranges of 15 35% of MEP MAX (LOW), 40 60% of MEP MAX (MED) and 65 85% of MEP MAX (HIGH). MEP MAX was determined starting from 50% maximum stimulator output and increasing intensity by 2% until MEP amplitude reached a plateau, or began to decrease (average of four MEPs). MEP MAX was used as a reference to ensure equivalent levels of sensitivity across participants, regardless of individual differences in absolute MEP size. TMS was either non-conditioned (NC, 16 stimuli) or conditioned (CS) by electrical cutaneous stimulation at an ISI of 25, 30 or 40 ms (16 stimuli at each ISI) to produce SAI (Helmich et al., 2005). Conditioning and block order were randomised Data treatment and analysis MEP amplitude (mv) was measured from individual traces and averaged for each condition. Trials were rejected if pre-trigger muscle activity exceeded mv. Pre-trigger EMG level (root mean square, rms) was determined for 50 ms preceding the conditioning stimulus to ensure muscle quiescence. SAI was expressed as a percentage using the formula, SAI (%) = 100 [(C/NC) x 100]. Higher SAI values reflect greater inhibition. Data from participants who did not demonstrate inhibition (average SAI < 0%) across all ISIs were excluded from analysis (N = 2). Repeated-measures analyse of variance (RM-ANOVA) were used, with Huynh-Feldt correction for non-spherical data (Huynh and Feldt, 1976). SAI was compared using a two-way RM-ANOVA with the factors INTENSITY (LOW, MED and HIGH) and ISI (25, 30 and 40 ms). Paired and one-sample t-tests were used for post hoc analysis. Linear regression was conducted between SAI (%) and NC MEP amplitude expressed as %MEP MAX at each participant s optimal ISI (i.e. the ISI that produced the greatest SAI across all 148
161 stimulation intensities). Results are reported as mean ± SEM. Statistical significance was set to α = Results Stimulation parameters Average RMT was 46.1 ± 1.9 %MSO for the group, and perceptual threshold was 0.43 ± 0.02 ma. Additional stimulation parameters are presented in Table 9.1. The low, medium and high stimulation intensities were distinct (all P < 0.001). NC MEP amplitudes increased with stimulation intensity (all P < 0.01) (Figure 9.1). The omnibus RM-ANOVA of rmsemg showed no main effects or interactions (all P > 0.1). RMS values did not exceed 15 µv confirming muscle quiescence during data collection (Table 9.1). Table 9.1: Stimulation Parameters N = 16 ISI (ms) LOW MED HIGH F (2,30) P %MEP MAX 24.2 ± ± ± < TMS intensity (%MSO) 56.4 ± ± ± < MEP amplitude (mv) NC 1.07 ± ± ± < C ± ± ± ± ± ± ± ± ± 0.39 rmsemg (mv) NC ± ± ± 0.01 C ± ± ± ± ± ± ± ± ± 0.01 %MEP MAX = Percentage MEP amplitude relative to the maximum peak-to-peak MEP amplitude. %MSO = Percentage maximum stimulator output. NC = Non-conditioned. C = Conditioned. rms = root mean square. 149
162 Short latency afferent inhibition SAI was observed at LOW, MED and HIGH stimulation intensities (all P < 0.001) (Figure 9.1A). There was a main effect of INTENSITY (F 2,30 = 8.95, P = 0.003), but no effect of ISI (F 2,30 = 0.015, P = 0.99) or interaction (F 4,60 = 0.952, P = 0.44) (Figure 9.1B). There was less SAI with HIGH stimulation compared to LOW and MED (both P < 0.01). Percentage SAI at LOW and MED levels not did differ (P > 0.15). There was a weak, but significant, negative correlation between SAI and MEP amplitude (F 1,46 = 6.71, P = 0.013) (Figure 9.2). A B Figure 9.1 A. Representative traces (average waveform of 16 stimuli) and SAI (%) at LOW, MED and HIGH stimulation intensities. NC = non-conditioned. C = Conditioned. B. SAI (left axis, line graph) and MEP amplitude (right axis, bar graph) across three stimulation intensities relative to MEP MAX. Diamonds, black = 25 ms ISI, grey = 30 ms ISI, white = 40 ms ISI. SAI was produced at all intensities, * P < Less SAI was produced at HIGH stimulation intensities compared with LOW and MID intensities, P <
163 Figure 9.2 Linear correlation between SAI (%) and NC MEP amplitude expressed as a %MEP MAX, individual data points are represented by black circles Discussion In support of the hypotheses, this study systematically demonstrates that estimates of SAI can vary with MEP amplitude (Ni et al., 2011, Udupa et al., 2009), and that SAI estimates decrease systematically through a range of TMS intensities that produce nearmaximal MEP amplitudes. The overall amount of homotopic SAI was similar to previous findings in healthy adults with NC MEP amplitude set to between mv (Alle et al., 2009, Helmich et al., 2005, Ni et al., 2011, Ridding and Rothwell, 1999, Ridding et al., 2005, Tokimura et al., 2000, Udupa et al., 2009, Voller et al., 2006). With high stimulation strengths and large MEP amplitudes relative to MEP MAX (absolute mean MEP amplitude 3.2 mv), SAI was nearly halved compared to low - medium stimulation where absolute mean MEP amplitude ranged from mv. Linear regression confirmed a weak negative correlation, with reducing SAI as NC MEP amplitude approaches %MEP MAX. The mechanisms underlying these relationships are uncertain. SAI may preferentially inhibit low threshold corticospinal neurons (Alle et al., 2009), and therefore SAI estimates may be lower as TMS intensity is increased and higher threshold corticospinal neurons are recruited but not inhibited. 151
164 Additionally, very strong TMS intensities may stimulate pyramidal neurons directly eliciting so called D-waves (Di Lazzaro et al., 2008b) which would be evident by a reduction in MEP latency of 1-2 ms, and would not be influenced by intracortical mechanisms mediating SAI. The proportion of the MEP attributable to D-wave activation is not susceptible to synaptic inhibition. Therefore SAI may be under-estimated as NC MEP amplitude approaches MEP MAX. Consistent with measures of SICI, SAI was within a sensitive range (neither floor nor ceiling) when NC MEP amplitudes were near 50% of MEP MAX (Daskalakis et al., 2002, Lackmy and Marchand-Pauvert, 2010, Roshan et al., 2003, Sanger et al., 2001). At very low stimulation strengths, which produce MEP amplitudes of 0.2 mv, there is very little if any SICI observed (Daskalakis et al., 2002). One contributing factor may be that late I-waves are not recruited at these low intensities, and early I-waves are not sensitive to intracortical inhibitory mechanisms (Di Lazzaro et al., 2008b). In the current study we referenced stimulation intensity to MEP MAX to maintain equivalent levels of sensitivity across participants. Referencing TMS intensity to MEP MAX made it more likely that stimulation strength was sufficient to recruit later I-waves in all participants, allowing afferent inhibition to be revealed. A mixture of submaximal and maximal estimates of SAI across individuals could lead to misinterpretation of the effectiveness and mechanisms of neuromodulatory techniques. For example, non-invasive brain stimulation techniques have the capacity to increase or decrease M1 excitability (Ziemann et al., 2008). The relationship between SAI and NC MEP amplitude relative to MEP MAX is such that if NC MEP amplitudes lie near the extremes of an individual s stimulus-response curve, SAI estimates will not reflect the maximum possible. To ensure sensitive SAI estimates are consistently obtained across individuals we recommend a TMS intensity that produces NC MEP amplitudes of 50% of MEP MAX.. 152
165 Chapter 10. PRIMING SENSORIMOTOR CORTEX TO ENHANCE TASK-SPECIFIC TRAINING AFTER SUBCORTICAL STROKE Abstract Background and purpose: Combining theta burst stimulation (TBS) of primary motor cortex (M1) with training can improve task-specific motor performance in subcortical stroke patients. The aim of this study was to elucidate neurophysiological mechanisms that contribute to improvements in grip-lift performance after task-specific training primed with TBS. Methods: Thirteen patients at the chronic stage after subcortical stroke and with upper limb impairment were recruited to this blinded, cross-over, sham-controlled study. Standardised precision grip training with the paretic upper limb was primed with intermittent TBS of the ipsilesional M1 (itbs ipsim1 ), continuous TBS of the contralesional M1 (ctbs contram1 ), or sham TBS, in separate sessions to examine effects on grip-lift kinetics, corticomotor excitability, sensorimotor integration, and sensation. Brain-derived neurotrophic factor (BDNF) genotyping was also performed, to identify Methionine (Met) allele carriers. Results: Training after real TBS, but not sham TBS, improved grip-lift performance. After itbs ipsim1 and training, ipsilesional M1 excitability and short latency afferent inhibition (SAI) increased. After ctbs contram1 and training, ipsilesional M1 excitability increased and contralesional SAI tended to decrease, but there was no effect on ipsilesional SAI. The pattern of modulation after TBS and training was similar in non-met and Met carriers. Conclusion: Priming M1 with TBS prior to motor training increased ipsilesional M1 excitability and enhanced paretic upper limb grip-lift performance, regardless of BDNF genotype. Increased sensorimotor integration between ipsilesional S1 and M1 may 153
166 contribute, but was not necessary for improved grip-lift performance. The after-effects of ctbs contram1 were variable, and associated with stroke severity, and this requires further investigation. Significance: Priming ipsilesional primary motor cortex transiently and predictably allows better sensorimotor coordination with the paretic upper limb during motor training Introduction A typical characteristic of subcortical stroke patients with upper limb impairment is that the excitability of the ipsilesional primary motor cortex (M1) is decreased, while the excitability of the contralesional M1 is increased (Di Lazzaro et al., 2010a, Koski et al., 2004). In addition, increased transcallosal inhibition may act from contralesional to ipsilesional M1 (Duque et al., 2005, Murase et al., 2004, Shimizu et al., 2002). Paretic upper limb impairment may be compounded by a cycle of asymmetric excitability and interhemispheric inhibition, which exacerbates ipsilesional M1 hypoexcitability and contralesional M1 hyperexcitability. Rebalancing of M1 excitability is associated with better outcomes (Di Lazzaro et al., 2010a, Koski et al., 2004, Traversa et al., 1998). Non-invasive brain stimulation has been used to purposefully modulate M1 excitability in stroke patients (Di Lazzaro et al., 2008a, Fregni et al., 2006, Takeuchi et al., 2005, Talelli et al., 2007a). Techniques such as repetitive transcranial magnetic stimulation (rtms) and transcranial direct current stimulation are applied to increase ipsilesional M1 excitability or decrease contralesional M1 excitability, to counter pathological alterations in cortical function (Ziemann et al., 2008). Theta burst stimulation (TBS) is a form of rtms that can temporarily increase or decrease corticomotor excitability (Huang et al., 2005), and can also modulate somatosensory evoked potentials (SEPs) (Ishikawa et al., 2007). In the 154
167 present study, TBS was applied to facilitate ipsilesional M1 excitability, and suppress contralesional M1 excitability, in separate sessions. A few studies have combined neuromodulatory stimulation protocols with motor training to improve aspects of the trained task (Ackerley et al., 2010, Kim et al., 2006, Reis et al., 2009, Takeuchi et al., 2008, Takeuchi et al., 2009). Priming ipsilesional M1 with intermittent TBS (itbs ipsim1 ) or contralesional M1 with continuous TBS (ctbs contram1 ) can improve the quality of specific upper limb motor training in subcortical stroke patients (Chapter 8, Ackerley et al., 2010), but the mechanisms that contribute to this improvement are unclear. Upper limb training is a common feature of rehabilitation after stroke. Motor training that produces afferent input to M1 shapes and focuses descending commands (Kaelin-Lang et al., 2005). After subcortical stroke impairments in sensorimotor integration have been observed in grip kinetics (McDonnell et al., 2006). These deficiencies arise through impaired motor control, but somatosensory deficits can also contribute (Blennerhassett et al., 2007, Johansson and Westling, 1984, Nowak et al., 2001, Smania et al., 2003). Abnormal sensorimotor integration is common in patients with lesions involving sensorimotor cortex, basal ganglia, or cerebellum (McDonnell et al., 2006, Oliviero et al., 2005, Sailer et al., 2003, Wiesendanger and Serrien, 2001). Here we investigate whether priming with TBS makes M1 more receptive to sensory input during sensorimotor training. The effects of TBS on cortical excitability may depend on a range of endogenous factors, including genotype. Brain-derived neurotrophic factor (BDNF) is a protein encoded by the BDNF gene. A common single nucleotide polymorphism in the BDNF gene results in Methionine (Met) being coded instead of Valine (Val) at codon 66, in about 1/3 rd of the population (Kleim et al., 2006). Met carriers may exhibit less use-dependent plasticity (Fritsch et al., 2010, Kleim et al., 2006, McHughen et al., 2010, Siironen et al., 2007). The 155
168 presence of this single nucleotide polymorphism may also attenuate the response to TBS (Antal et al., 2010, Cheeran et al., 2008). The objective of this study was to elucidate neurophysiological mechanisms that underlie the previously observed benefits of priming M1 with TBS prior to motor training in subcortical stroke patients. Based on previous findings (Ackerley et al., 2010), TBS combined with precision grip training with the paretic hand was expected to improve grip-lift performance. The main hypothesis was that ipsilesional M1 excitability would be directly facilitated by itbs ipsim1, and indirectly facilitated by ctbs contram1, but these protocols may have differential effects on ipsilesional sensorimotor integration, as indicated by measures of short latency afferent inhibition (SAI). In addition, we expected that BDNF gene status would modulate the response to TBS, with less facilitation of ipsilesional M1 excitability in Met carriers. We also sought to explore the response of Met carriers to combined TBS and motor training, as this is currently unknown Methods Subjects Thirteen adults with upper limb impairment secondary to chronic subcortical stroke (> 6 months) were recruited into this blinded, sham-controlled, repeated-measures study. Volunteers were included if they had experienced one stroke, and had persistent upper limb weakness ((Fugl-Meyer score of (Deakin et al., 2003, Fugl-Meyer et al., 1975); maximum, 66 (Appendix 7)). Volunteers were excluded if they had contraindications to TMS, were on medications that interfered with the interpretation of the results, had motor evoked potential (MEP) amplitudes less than 0.05 mv in the paretic first dorsal interosseous 156
169 (FDI), or had severe sensory loss of the paretic arm ((National Institutes of Health Stroke Scale (NIHSS) sensory subscale >1 (Appendix 6)). Written consent was obtained from all participants for this study approved by the regional ethics committee in accordance with the Declaration of Helsinki (Appendix 11). An introductory session was conducted to determine the demographic and clinical characteristics of the stroke patients (Table 10.1). A brief TMS session was carried out to determine the interstimulus interval (ISI; 25, 30, 40 ms) that produced the greatest SAI in the contralesional M1 (i.e. optimal ISI), using the paired pulse methods described below. Recordings were obtained from the nonparetic upper limb for comparison with the paretic upper limb, for all measures Brain-derived neurotrophic factor (BDNF) genotyping A single 5 ml EDTA blood sample was obtained by a trained phlebotomist from consenting participants (n = 11), and processed by a registered pathologist. Genotyping was performed off site by a third-party (LabPlus). Briefly, DNA was extracted using the Gentra Puregene DNA Extraction kit (Qiagen), according to the manufacturer s instructions. The online tetra-primer ARMS (amplification refractory mutation system) Polymerase Chain Reaction (PCR) primer design program (available at was used to design primers appropriate for the target variant c.196g>a (p.val/met) in the BDNF gene, in order to allow the amplification of both potential alleles in a single PCR. The p.val/met variant is listed as a polymorphism in the Single Nucleotide Polymorphism database (dbsnp) under ID number rs6265. The Genebank NM_ was used as the 157
170 Table 10.1: Participant Characteristics No. Sex Age (years) Time since stroke (months) BDNF status NIHSS (max 42) NIHSS sensory subscale FM (max 66) mrs ASH Hand 9HT (sec/peg) Hemi Type Affected Structures ISI NIHSS sensory subscale (normal = 0, mild/moderate sensory loss = 1). FM = Fugl-Meyer upper limb score. mrs = modified Rankin Score (Appendix 5). ASH = Modified Ashworth Scale (Appendix 12). 9HT = Nine hole peg test. Hand = Handedness prior to stroke. Hemi = hemisphere affected by the stroke. Type (Ischaemic/Haemorrhagic). Affected Structures: BG = basal ganglia; Pu = putamen; Th = thalamus; Ca = caudate; Cr = Corona radiata; Int = internal capsule ; Ext = external;. MCA territory = Middle cerebral artery territory; SCWM = Subcortical white matter. ISI = interstimulus interval. a = unable to access CT scans. b = patient did not complete all sessions, data not included in mean etc. BG Capsule Other 1 M Val/Val L 1.92 L I Cr 40 2 M Val/Val R >60 L I Int 40 3 M Val/Val R 20.0 R H Ca, Pu Int 30 4 F 68 7 Val/Val R 1.69 R I Th Cr 30 5 M 70 6 Val/Val R >60 R I Pontine 40 6 F Val/Val R >60 R H Int 30 7 a F Val/Val R >60 R I 25 8 M Val/Met R 2.40 L I Cr 25 9 F Val/Met R 7.50 R I MCA territory F Val/Met R >60 R I MCA territory F 79 6 Val/Met R >60 R I Cr SCWM a M L 30.0 L H b M 31 7 Met/Met R 1.90 R I SCWM 25 Mean SD Max Min
171 reference sequence for primer design, with cdna number +1 corresponding to the A of the translation initiation codon (codon 1). Primers were manufactured by Invitrogen Ltd PCR was performed using 1U Faststart Taq DNA polymerase (Invitrogen Ltd.), 50 ng genomic DNA, 2 mm MgCl 2, 0.4 μm of each of the four primers, with the following cycle conditions: 95 C for 4 min, 35 cycles of 94 C for 45 s, 60 C for 30 s, 72 C for 30 s, and a final extension at 72 C for 10 min. Gel electrophoresis of the PCR products was performed and the genotype determined. Each sample was tested in duplicate, alongside homozygous and heterozygous controls Experimental procedure Three experimental sessions were randomised, counterbalanced, and separated by at least 1 week (see Figure 10.1 for a flowchart of the experimental procedures). Each session consisted of a TBS protocol (itbs ipsim1, ctbs contram1 or sham TBS) followed by standardised motor training using the paretic hand. Patients were blinded to the TBS protocol. Neurophysiological measures, and precision grip and sensory assessments of the paretic hand, were completed before and after TBS and training. In addition, FDI MEP amplitudes were measured after movement (POST 18 ) but before training started (POST 20 ). Paretic upper limb function was assessed with the Action Research Arm Test (ARAT, maximum 57 (Lyle, 1981)) at the beginning and end of each session by a clinical assessor blinded to the TBS protocol. 159
172 Figure 10.1 Flowchart of the experimental procedures. In the experiment, gray shading indicates components that require muscle contraction. ARAT = Action Research Arm Test, SAI = Short latency afferent inhibition. MEPs = Motor evoked potentials measured from bilateral first dorsal interosseous. SENSORY = sensory assessment. TRAIN represents the four training blocks. Theta burst stimulation (90% active motor threshold of the nonparetic FDI) was delivered with a biphasic Rapid Stimulator (Magstim, Dyfed, UK) by an investigator blinded to data collection and analysis. All TBS protocols consisted of 600 stimuli. For ctbs contram1 current was induced in the brain in an anterior-posterior direction using a reverse coil 160
173 orientation to preferentially target early I-waves (Talelli et al., 2007b). Sham TBS (intermittent or continuous) was delivered to either M1 with a sham coil. Upper limb motor training consisted of 4 blocks of precision grip movements with the paretic hand, each block lasted 4 minutes (16 minutes training in total), and was commenced 20 minutes after TBS. Participants were required to move pegs in and out of a standardised pegboard. The number of pegs moved was recorded Precision grip assessment Precision grip of the paretic hand was measured using a custom grip-lift device (Chapter 8, Figure 8.2). Participants reached forward, gripped the device between their index finger and thumb, and lifted it 10 cm above the table surface. After a 3 s hold they lowered the device onto the table and released it, returning their hands to their lap. Ten lifts were made. Forces perpendicular to the grip surface (grip force) and tangential to vertical (load force) were acquired with transducers (MLP-100, Transducer Techniques, Temecula, CA), and a data acquisition system (ADInstruments Ltd, NZ), sampled at 1 khz, low-pass filtered (15 Hz) and stored for offline analysis Neurophysiological assessment Measures of corticomotor excitability (MEP amplitude) and sensorimotor integration (SAI) were obtained. Motor evoked potentials (MEPs) were recorded with surface electromyography (EMG) from bilateral resting FDI muscles using bipolar electrode configurations. The electrodes (15 mm Ag-AgCl, Ambu A/S, Ballerup, Denmark) were positioned in a belly tendon montage, with standard skin preparation techniques. EMG was amplified (CED 1902, Cambridge, UK), band-pass filtered ( Hz), sampled at 2 khz using Signal
174 software (CED 1401, Cambridge, UK) and stored for offline analysis. TMS was applied using a 70 mm figure-of-eight coil connected to a Magstim 200 magnetic stimulator (maximum output intensity 2.0 T, Magstim, Dyfed, UK). The optimal position (hot-spot) on each side of the scalp to evoke a MEP from contralateral FDI was marked to ensure consistent coil placement. Rest motor threshold (RMT) was defined as the minimum stimulus intensity that produced a peak-to-peak MEP amplitude 50 µv in FDI in four of eight consecutive trials (Rossini et al., 1994). TMS was either nonconditioned (NC) or conditioned (C) by electrical cutaneous stimulation at the patient s optimal ISI (i.e. the ISI (25, 30, or 40 ms) that produced the greatest SAI in the contralesional M1, as determined in the introductory session. Electrical cutaneous stimulation (Digitimer, Constant Current DS7A, UK) was delivered to the index finger via ring electrodes (Digitimer, UK). The cathode and anode were placed around proximal and middle phalanges respectively. Stimulation consisted of an electrical square wave pulse (1 ms) delivered at an intensity of two times perceptual threshold (Classen et al., 2000, Tamburin et al., 2001). Stimulation intensity was set to produce an MEP that was 50% of the individual s maximum MEP amplitude (50%MEP MAX ) in the contralateral FDI (Chapter 9). Sixteen C and NC MEPs (total 32) were recorded at each time point, and conditioning order was randomised. The root mean square (rms) value of pre-trigger EMG activity (rmsemg) was determined in a 50 ms window preceding the conditioning stimulus to ensure muscle quiescence. Trials were rejected offline when pre-trigger rmsemg exceeded 15 μv Sensory assessment For all sensory testing, participants sat with their hand positioned comfortably in supine and their eyes closed. 162
175 Spatial acuity (mm) was evaluated in the paretic index finger and thumb using commercially available Johnson-Van Boven-Phillips (JVP) grating domes (Stoelting Co., Wood Dale, IL). Eight domes were available for testing (grate widths of 0.35, 0.50, 0.75, 1.00, 1.20, 1.50, 2.00, and 3.00 mm). Dome presentation was lateral-medial (across) or proximal-distal (up), and each dome was held to the distal pad of the digit for up to 3 s. Using a forced-choice paradigm, participants were required to report whether the perceived presentation was across or up. Eight practice trials were conducted, four trials in which the correct presentation was stated by the experimenter on application, and four in which participants were required to report the presentation and were provided with trial-by-trial feedback ( yes or no ). For testing, the grating dome was presented eight times (4 of each presentation in a random order) with no feedback, starting with the largest (easiest) grating. The number of correct responses was recorded. If a participant scored < 75% correct discrimination (< 6/8) testing was discontinued for that digit. When they scored 75% correct discrimination ( 6/8), grating domes with successively smaller grating were presented until the number of correct responses fell below 75%. Cutaneous light touch sensation of the paretic index finger and thumb was evaluated with Semmes-Weinstein monofilaments (Touch-test, Stoelting Co., Wood Dale, IL) (Bell- Krotoski and Tomancik, 1987). Monofilaments were pressed at 90 against the skin of the distal pad of the digit until the filament bowed, and held for up to 1.5 s. Participants were requires to say yes when they perceived the filament on the skin. For testing, four trials were conducted with monofilament 2.83 and if a participant scored 75% accuracy testing was continued with monofilaments of smaller diameters until their score fell below 75%. If accuracy with monofilament 2.83 was < 75%, testing was continued with monofilaments of larger diameters until accuracy exceeded 75%. 163
176 Pain threshold was measured using the Pain Matcher (Cefar, Medical AB, Lund, Sweden). Participants were asked to grip the sensors of the Pain Matcher between the thumb and the index finger of their paretic hand until they felt the first sensation of pain, and then release. The Pain Matcher provides a constant current stimulation (10 Hz, 10 ma). An increase in sensation is produced through incremental lengthening of the pulse width (0-450 µs), 60 increments (7.5 µs) are possible. When grip is released a pain threshold value (1-60) is displayed on the screen of the Pain Matcher. Three trials were performed at each timepoint Data reduction and statistical analysis Data reduction Grip-lift kinetics For grip-lift data, preload duration (PD, ms) was measured as the time between onset of grip force and positive load force as the manipulandum was lifted. Preload force (PF, N) was measured as the maximal downwards force applied before the manipulandum was lifted. PD and PF are sensitive measures of manual dexterity after stroke (McDonnell et al., 2006). Corticomotor excitability and sensorimotor integration Peak-to-peak MEP amplitudes (mv) were obtained in a 20 ms window relative to the individual muscle MEP onset latency. For each timepoint, C and NC MEP amplitudes were sorted, trimmed and averaged. SAI (%) was calculated using the formula, SAI (%) =100 - [(C/NC)*100], with larger percentages reflecting greater inhibition. 164
177 Sensory assessment To evaluate spatial acuity, spatial discrimination threshold (SDT, mm) was calculated using the formula, SDT = W S + [(W L - W S ) x (0.75 P S )/(P L P S )]. W S is the smallest groove width that the participant responded to with 75% accuracy. W L is the largest groove width that the participant responded to with < 75% accuracy. P L and P S are the number of correct responses expressed as a fraction at W L and W S respectively. An arbitrary value of 4.0 mm was designated when a participant did not respond with 75% accuracy to the largest groove width (3.0 mm), consistent with previous research (Bara-Jimenez et al., 2000). Light touch threshold force (g) was determined from the smallest monofilament that achieved a score of 75% or above, using the manufacturer s conversion table (Touch-test, Stoelting Co., Wood Dale, IL). Pain threshold (a.u.) was taken as the average of three scores on the Pain Matcher Statistical analysis One patient (Table 10.1, # 13) did not complete all three sessions due to their family commitments, and their data were removed from all analyses. Wilcoxon signed-rank tests were used to analyse ARAT scores. Analyses of variance with repeated-measures (RM- ANOVAs) were used to analyse measures of grip-lift kinetics, corticomotor excitability, sensorimotor integration and sensation. Baseline data were compared across sessions using a one-way ANOVA with the factor PROTOCOL (itbs ipsim1, ctbs contram1, sham TBS). POST TBS data were normalized to PRE. Outliers were identified and replaced with computed values reflecting within subject and within group means using SPSS. To examine the effects of interventions, RM-ANOVAs used the factors PROTOCOL and TIME. Analyses were conducted for all patients, with the genotype (Val/Val, Val/Met) as a between-subjects factor. Stimulation parameters and the amount of motor training were 165
178 also compared with the factors PROTOCOL (itbs ipsim1, ctbs contram1, sham TBS), and HAND (paretic, nonparetic) where appropriate. Post hoc analyses were conducted to analyse main effects and interactions. Paired t-tests were used to compare real TBS protocols with sham TBS, and to compare the immediate after-effects of the TBS protocol with after-effects during and after training. One sample t-tests were conducted on all main effects or interactions for comparison against baseline for all patients, and by genotype separately. Regression analyses were performed to test the association between grip-lift kinetics (PD, PF) and clinical assessments (NIHSS, FM and ARAT) at baseline. In addition, post hoc regression analyses were performed to investigate any associations between grip-lift and neurophysiological effects in each real TBS session. Post hoc regression analyses were also used to determine associations between clinical presentation and the immediate after-effects of ctbs. For all analyses, corrections for multiple comparisons were made with a modified Bonferroni procedure (Rom, 1990). Significance level was set to α = Mean ± SEM is reported unless stated otherwise Results No participants reported any adverse effects from the protocols. Dependent measures for the paretic hand were stable at baseline (all P > 0.05), and pooled across sessions for comparison with the nonparetic hand (Table 10.2). As expected, paretic upper limb function (ARAT) was reduced, and precision grip kinetics (PD and PF) were impaired, in the paretic upper limb when compared to the nonparetic upper limb (all P < 0.05). Corticomotor excitability (NC MEP amplitude) and SAI were less in the paretic compared to the nonparetic FDI (both P < 0.01). 166
179 Table 10.2: Comparison of Dependent Measures at Baseline Paretic Nonparetic t 11 P Grip-lift kinetics Preload duration (ms) 515 ± ± Preload force (N) ± ± Neurophysiological MEP amplitude (mv) 0.55 ± ± SAI (%) 3.55 ± ± Sensory a Pain (a.u.) 10.5 ± ± Spatial acuity (mm) Index 3.17 ± ± Thumb 3.55 ± ± Light touch (g) Index 0.47 ± ± Thumb 0.50 ± ± UL function Z P ARAT (median score [range]) 38 [6 57] 57 [43 b 57] a One patient was unable to follow the instructions for sensory testing secondary to language difficulties. b One patient had a longstanding arthritic condition affecting both hands. Stimulation parameters and the amount of training did not differ between sessions (Table 10.3). As expected, a higher RMT was noted for the ipsilesional M1. A summary of RM-ANOVAs are summarised in Table 10.4, a schematic of the main effects is provided (Figure 10.2), and significant results are reported in complete detail below Paretic hand grip-lift kinetics Preload duration The PROTOCOL x TIME interaction was decomposed for each protocol with one-way ANOVAs for the factor TIME. Modulation of PD differed when training was combined with 167
180 Table 10.3: Stimulation Parameters and Training Paretic Nonparetic Between HANDS Between PROTOCOLS Interaction Stimulation parameters Stimulation intensity (50%MEP MAX ) Perceptual threshold (ma) Rest motor threshold a (%) Active motor threshold b (%) TBS stimulation intensity (90%AMT) itbs ctbs Sham Mean itbs ctbs Sham Mean F 1,11 P F 2,22 P F 2,22 P 79.5 ± ± ± ± ± ± ± ± ± ± ± ± ± ± ± ± ± ± ± ± ± ± ± ± ± ± ± ± ± c ± ± ± Training No. of pegs 189 ± ± ± ± a RMT collected with a monophasic Magstim 200 b MT collected with a biphasic RapidStim c Three participants were stimulated at below 90% AMT (2 at 70%, 1 at 80% AMT) as visible activity of the nonparetic hand was observed. Bold = mean values. 168
181 Table 10.4: Summary of ANOVA results (P values) Paretic Nonparetic Effect PRO TIME P x T N GENOTYPE N PRO TIME P x T N GENOTYPE N Grip-lift kinetics PD (%PRE) All > PF (%PRE) All > Neurophysiological MEP amplitude (%PRE) All > All > SAI (%) All > All > Sensory Pain (a.u.) All > Spatial acuity (mm) Index All > Thumb All > Light touch (g) Index All > TIME Thumb All > UL function ARAT Wilcoxon All PRO > All PRO > PRO = PROTOCOL. SAI = short latency afferent inhibition. PD = preload duration. PF = Preload force. P values: < 0.05; <
182 Figure 10.2 Schematic of the main effects of TBS and precision grip training. Shaded hemisphere = ipsilesional hemisphere. Corticomotor excitability is represented by the amplitude of the motor evoked potential (MEP) trace, which was recorded from the paretic (P) and nonparetic (NP) hand in a representative patient. Calibration bar = 0.5 mv for both N and P MEPs. Each trace reflects the average of 16 MEPs. At baseline, subcortical stroke patients had decreased ipsilesional corticomotor excitability and decreased SAI (dotted curved arrow from S1 to M1) recorded from their paretic FDI compared with their nonparetic FDI. After itbs, ipsilesional corticomotor excitability was increased and contralesional corticomotor excitability was decreased. When training was commenced (gray shading behind paretic hand) ipsilesional short latency afferent inhibition (SAI) increased and preload duration (PD) shortened. After ctbs and training, ipsilesional corticomotor excitability increased and contralesional SAI decreased, while paretic hand PD shortened. 170
. At POST 11, PD decreased after sham TBS (POST 11, t 11 = -5.46, P < 0.001), but increased with training (t 11 = 2.78, P < 0.")
183 real TBS compared with sham TBS (Figure 10.3). There was no effect of TIME after itbs ipsim1 (F 2,22 = 1.25, P > 0.3) and ctbs contram1 (F 2,22 = 2.44, P > 0.1). An effect of TIME was observed after sham TBS (F 2,22 = 4.42, P < 0.03). At POST 11, PD decreased after sham TBS (POST 11, t 11 = -5.46, P < 0.001), but increased with training (t 11 = 2.78, P < 0.02). In contrast, at POST 35 PD was decreased compared to baseline after itbs ipsim1 and ctbs contram1 (both P < 0.05). After ctbs contram1, there was a trend for PD to be decreased at POST 11 (t 11 = -1.93, P = n.s.) and POST 54 (t 11 = , P = n.s.). Figure 10.3 Paretic PD during precision grip-lift immediately after TBS (POST 11 ), and during (POST 35 ) and after training (POST 54 ). Values below 100% indicate improvement. Black bars indicate itbs ipsim1 ; gray, ctbs contram1 ; and white, sham TBS. Gray background shading indicates training. *P < indicates a trend P < 0.1. # differs from baseline, P < Preload force There were no main effects or interactions (all P > 0.1) Corticomotor excitability (CE) Paretic FDI MEP amplitude The PROTOCOL x TIME interaction was decomposed for each protocol with one-way ANOVAs for the factor TIME. Ipsilesional corticomotor excitability increased immediately after itbs ipsim1, and increased when ctbs contram1 was followed by training (Figure 10.4). After itbs ipsim1 there was an effect of TIME (F 3,33 = 4.90, P < 0.01). At POST 5 MEP 171
. After ctbs contram1 and sham TBS there was no effect of TIME (both P > 0.1).")
184 amplitude differed from the remaining time-points (all P < 0.05), as they were facilitated compared with baseline after itbs ipsim1 (t 11 = 2.55, P < 0.03). This effect did not persist (all P > 0.045, n.s. after correction). After ctbs contram1 and sham TBS there was no effect of TIME (both P > 0.1). However, after ctbs contram1 MEP amplitudes increased once training commenced, at POST 29 and POST 48 (both P < 0.02), but not after sham (all P > 0.4). Figure 10.4 Paretic FDI MEP amplitude (%PRE) immediately after TBS (POST 5 ), after movement (POST 18 ) (light gray background shading), and during (POST 29 ) and after training (POST 48 ) (darker gray background shading). Black bars indicate itbs ipsim1 ; gray, ctbs contram1 ; and white, sham TBS. Error bars are SEM. *P < # differs from baseline, P < Nonparetic FDI MEP amplitude The main effect of PROTOCOL was explored using data collapsed across time. Paired t-tests indicated no difference in MEP amplitude after itbs ipsim1 or ctbs contram1 when compared with sham (P > 0.1). MEP amplitude was reduced compared with baseline only after itbs ipsim1 (t 11 = , P < 0.02), and this effect was abolished by training. MEP amplitude was decreased compared to baseline at POST 5 and POST 18 (P < 0.05), but not at POST 35 or POST 48 (both P > 0.2). 172
 and baseline (t 8 = 3.60, P < 0.01). After ctbs contram1, SAI did not differ from sham (P > 0.8), and neither differed from baseline (both P > 0.8). The main effect of TIME was due to greater SAI at POST 29 compared to POST 48 (t 8 = 3.")
185 Sensorimotor integration Paretic SAI The main effect of PROTOCOL was due to increased SAI after itbs ipsim1 (Figure 10.5A). After itbs ipsim1, SAI was greater compared to sham (t 8 = 2.47, P < 0.04) and baseline (t 8 = 3.60, P < 0.01). After ctbs contram1, SAI did not differ from sham (P > 0.8), and neither differed from baseline (both P > 0.8). The main effect of TIME was due to greater SAI at POST 29 compared to POST 48 (t 8 = 3.09, P = 0.015) and baseline (t 8 = 2.86, P < 0.03). Figure 10.5 Change in short latency afferent inhibition ( SAI, %) for the paretic (A) and nonparetic (B) first dorsal interosseous (FDI). Positive values indicate increased inhibition. Black bars indicate itbs; gray, ctbs; and white, sham TBS. Gray background shading indicates training. Bars indicate time (POST 5, POST 29, POST 48 ). Error bars are SEM. *P < indicates a trend P < 0.1. # differs from baseline, P <
186 Nonparetic SAI The main effect of PROTOCOL was due to a tendency for SAI to decrease after ctbs contram1 compared to sham (t 8 = -1.95, P = 0.078) (Figure 10.5B). There were no differences between SAI in the itbs ipsim1 and sham TBS sessions (P > 0.8) or with any session compared to baseline (P > 0.1). The main effect of TIME was due to decreased SAI at POST 29 compared with POST 5 and POST 48 (all P < 0.04), but this did not reach significance against baseline (P > 0.1) Sensory assessment and upper limb function There was no main effect of PROTOCOL or TIME, or any interaction (all P > 0.05) for any sensory assessment variable or ARAT score Regression analyses At baseline, there was an association between paretic arm function, impairment, and grip-lift kinetics. ARAT and FM had a strong positive correlation (R 2 = 0.78, P < 0.001). Lower ARAT and FM scores were associated with longer PD (both R 2 > 0.6, P < 0.001) and larger PF (both R 2 > 0.5, P < 0.001). Measures of grip-lift were not associated with overall stroke severity, as measured by the NIHSS (both R 2 < 0.12, P > 0.05). Associations between PD and CE and SAI were explored (Table 10.5). In the itbs ipsim1 session, PD showed a trend for a moderate positive correlation with immediate CE contram1 (i.e. at POST 5 ), indicating that patients who had the largest suppression of contralesional M1 tended to have the largest reduction in PD (R 2 = 0.38, P = 0.051) (Figure 10.6). 174
187 Table 10.5: Regression analyses between changes in PD, MEP amplitude and SAI Session Effect CE ipsim1 CE contram1 CE ipsim1 SAI ipsi SAI contra IMMED (%) IMMED (%) DURING (%) POST (%) POST (%) R 2 P R 2 P R 2 P R 2 P itbs PD (%) SAI ipsi POST (%) ctbs PD (%) SAI contra POST (%) Figure 10.6 Regression analysis between PD (%, negative values indicate better grip kinetics) and CE contram1 (%) immediately after (POST 5 ) itbs ipsim1. Data points are participants. Corticomotor excitability was not modulated immediately after ctbs contram1 (POST 5 ). Therefore, regression analyses were conducted to explore the association between CE contram1 at POST 5 and baseline clinical scores (NIHSS, ARAT, FM, PD) (Table 10.6). There was a strong positive correlation between the immediate CE contram1 and NIHSS (R 2 = 0.65, F 2,9 = 175
188 16.7, P = 0.002) (Figure 10.7). Patients with lower overall stroke severity had greater suppression of contralesional M1 excitability after ctbs contram1. Table 10.6: Regression analyses between ctbs and clinical scores ctbs NIHSS ARAT PARETIC FM PARETIC PD PRE Effect R 2 P R 2 P R 2 P R 2 P CE ipsim1 IMMED CE contram1 IMMED Figure 10.7 Regression analysis between CE contram1 (%) immediately after (POST 5 ) ctbs contram1 (negative values indicate suppression) and NIHSS (lower values indicate less overall stroke severity). Data points are participants BDNF analyses There was no main effect of genotype in any session, for any measure (all P > 0.1) (Table 10.4), indicating Val/Val and Val/Met patients responded in a similar way to TBS and training. To reduce the chance of a possible Type II error due to the small sample of patients, 176
189 one-sample t-tests were conducted in non-met and Met carriers separately to compare the response to TBS and training against baseline (Table 10.7). During training after itbs ipsim1, PD decreased and ipsilesional SAI increased in both Val/Val and Val/Met patients (all P < 0.03). In Val/Val patients, contralesional M1 excitability was suppressed after itbs ipsim1 (i.e. POST 5 ) and before training commenced (i.e. POST 18 ) (both P < 0.02), with a trend towards an immediate facilitation of ipsilesional M1 (t 6 = 2.11, P = 0.080). In Val/Met patients, there was a trend for contralesional M1 suppression before training commenced (i.e. POST 18 ) (t 3 = -2.82, P = 0.067). After ctbs contram1, the reduction in PD did not reach significance for Val/Val or Val/Met patients separately (both P > 0.1). Ipsilesional corticomotor excitability was increased compared with baseline during training in Val/Met patients (t 3 = 4.48, P = 0.021) and after training in Val/Val patients (t 6 = 3.63, P = 0.011). Contralesional SAI tended to decrease in Val/Met (t 3 = -2.84, P = 0.066), but not Val/Val patients (P > 0.2). Table 10.7: Summary of BDNF secondary analyses Session itbs ctbs Val/Val P Val/Met P Val/Val P Val/Met P PD DURING (%PRE) 77.9 ± ± ± ± CE ipsim1 IMMED (%PRE) ± ± CE ipsim1 DURING (%PRE) ± ± CE ipsim1 AFTER (%PRE) ± ± CE contram1 IMMED (%PRE) 56.5 ± ± CE contram1 BEFORE (%PRE) 65.7 ± ± SAI ipsi POST (%) 30.5 ± ± SAI contra POST (%) ± ±
190 10.6. Discussion In support of the hypothesis, priming M1 with TBS followed by task-specific motor training improved grip-lift kinetics in the paretic hand. Ipsilesional M1 excitability was facilitated after itbs ipsim1 and ctbs contram1, but at different times with respect to training. This is the first study to show that SAI was modulated after M1 TBS in patients with subcortical stroke, indicative of altered sensorimotor integration at the cortical level. Ipsilesional SAI increased in the itbs ipsim1 session and contralesional SAI tended to decrease in the ctbs contram1 session, but the latter was not significant. The effects of combining each protocol of TBS with training are discussed below Intermittent TBS and training After itbs ipsim1 there was an immediate increase in ipsilesional M1 excitability, in agreement with earlier findings (Ackerley et al., 2010, Di Lazzaro et al., 2008a, Talelli et al., 2007a). In parallel, there was a reduction in contralesional M1 excitability. Indirect suppression of contralesional M1 excitability is an intended after-effect of itbs ipsim1 on contralesional M1, and has been observed in healthy adults (Suppa et al., 2008) and acute stroke patients (Di Lazzaro et al., 2008a). In a previous study we found no change in contralesional corticomotor excitability after itbs ipsim1 in chronic subcortical stroke patients with or without recordable MEPs in the paretic hand (Ackerley et al., 2010). In the present study all patients had MEPs of at least 0.05 mv in the paretic FDI, and all patients showed nonparetic FDI MEP suppression after itbs ipsim1. There was an indirect suppression of contralesional M1 excitability observed in these subcortical stroke patients. This may reflect the preservation of transcallosal projections from ipsilesional M1 in these patients with intact ipsilesional corticospinal tract integrity. Intermittent TBS ipsim1 and motor training improved grip-lift performance with the 178
191 paretic upper limb, reinforcing previous findings (Ackerley et al., 2010). Preload duration was shortened during training after itbs ipsim1, indicative of an overall improvement in griplift kinetics. Conversely, PD increased with training after sham TBS, which may reflect taskspecific fatigue. Intermittent TBS may have facilitated NMDA receptor activity (Huang et al., 2007) and reduced the threshold for subsequent UDP within ipsilesional M1. Facilitation of synaptic efficacy within M1 could have contributed to improved performance with the paretic hand. Of interest, patients who showed the largest decrease in nonparetic FDI MEP amplitude immediately after itbs ipsim1 tended to have the largest improvement in PD. The interhemispheric competition model proposes that ipsilesional M1 function may be hampered by contralesional M1 hyperexcitability (Nowak et al., 2009). The present study supports the interhemispheric competition model in that reduction in PD during itbs ipsim1 primed training scaled with contralesional M1 suppression. A novel finding was that SAI increased within ipsilesional sensorimotor cortex after itbs ipsim1 priming and precision grip training. How might this occur? Tsuji and Rothwell (2002) showed that facilitatory rtms of M1 increased MEPs and SEPs in parallel. The effect on SEPs after M1 rtms were thought to arise from cortico-cortical projections between M1 and S1 (Tsuji and Rothwell, 2002). We suggest that increased SAI after itbs ipsim1 was unlikely to be due to an indirect increase in S1 excitability for several reasons. Firstly, the stimulation intensity used for M1 TBS is lower than that used with non-patterned rtms, therefore any direct influence on S1 from M1 stimulation would be minimal (Ishikawa et al., 2007). Secondly, increased SAI occurred during, and not prior to, training. The delayed effects may reflect task-specificity, and argue against indirect excitation of S1 that would result in an immediate increase in SAI. Also, there were no effects on sensory performance. The threshold for spatial acuity, light touch and pain were unchanged at all time-points, 179
192 indicating that enhanced early sensory processing is unlikely to account for the observed increase in SAI. Given that itbs ipsim1 facilitated M1 excitability, we favour the explanation that SAI was increased due to the increased responsiveness of M1 to task-specific input from S1, and that this contributes to more efficient sensorimotor integration during training Continuous TBS and training The therapeutic objective of suppressing excitability of contralesional M1 is to indirectly increase the excitability of ipsilesional M1 (Bolognini et al., 2009, Hummel et al., 2008, Nowak et al., 2009). In this study the after-effects of ctbs contram1 on ipsilesional M1 were not immediate, but were observed when training commenced, and were in parallel with improvements in grip-lift performance of the paretic hand. Similar to previous results (Ackerley et al., 2010) there was no immediate suppression of contralesional M1 excitability after ctbs contram1. The lack of immediate effect of ctbs on contralesional M1 excitability may reflect variability in the direction of modulation in this heterogeneous sample of subcortical stroke patients. The after-effects of ctbs contram1 were explored with regression analyses. A positive correlation was observed between suppression of contralesional M1 excitability and overall stroke severity (R 2 = 0.65). Patients with the lowest NIHSS scores (i.e. less overall stroke severity) showed the greatest nonparetic FDI MEP suppression after ctbs contram1, whereas patients with greater severity had a tendency to exhibit contralesional M1 facilitation. Findings from magnetic resonance imaging indicate that subcortical stroke patients with poor overall recovery have excessive activation of contralesional M1 during movement of the paretic upper limb (Ward et al., 2003b), which may compensate for significant ipsilesional corticospinal tract damage and increase functional recovery (Lotze et al., 2006, Stinear et al., 2007, Ward et al., 2006). In the current 180
193 study, it is possible that patients with poorer overall recovery recruited contralesional M1 to a greater extent. Contralesional M1 may play a compensatory role in more severely affected patients, and under these conditions its homeostatic response to ctbs may be biased towards facilitation rather than suppression of excitability. The heightened level of activation of contralesional M1 in severely impaired patients may be such that ctbs enhances rather than suppresses excitability of target neurons. Whilst this is speculative, it is known that prior voluntary activation can reverse the effects of ctbs from suppression to facilitation (Gentner et al., 2008). After ctbs contram1, ipsilesional M1 excitability increased once training commenced. It is plausible that an interaction with training is required to observe increases in ipsilesional M1 excitability. Previous research has shown that suppressive rtms of contralesional M1 can facilitate ipsilesional M1 by reducing transcallosal inhibition from contralesional to ipsilesional M1 (Kobayashi et al., 2004, Takeuchi et al., 2005). There was also a tendency for contralesional SAI to decrease, but ipsilesional SAI was unchanged. Decreased contralesional SAI was perhaps due to reduced excitability of contralesional M1, making it less receptive to input from S1. This may be an interesting corollary to the observed increase in responsiveness of ipsilesional M1 after itbs ipsim1. Training of the nonparetic upper limb was not performed, and not clinically indicated, therefore the possible behavioural effects of reduced contralesional SAI are unknown. Regardless, preload duration in the paretic hand decreased, indicating that modulation of ipsilesional SAI is not necessary for behavioural improvement in paretic grip function. For this reason we propose that use-dependent plasticity within ipsilesional M1 was most likely promoted primarily by increased ipsilesional corticomotor excitability, due to reduced transcallosal inhibition from contralesional to ipsilesional M1, as previously reported (Takeuchi et al., 2008). 181
194 Clinical considerations Carriers of the Met-allele in the BDNF gene may have a blunted response to noninvasive brain stimulation (Antal et al., 2010, Cheeran et al., 2008, Fritsch et al., 2010), and to training itself (Kleim et al., 2006, McHughen et al., 2010, Pearson-Fuhrhop et al., 2009). This was confirmed in the present study as only non-met carriers had an immediate response to itbs, whereas Met carriers did not. Interestingly, when training was combined with itbs ipsim1 Met and non-met carriers had similar neurophysiological and behavioural responses whereby training preceded by itbs ipsim1 led to improved preload duration and SAI. This indicates that Met carriers may benefit from primed training, even though their response to each separately is diminished. The effects of genotype on response to ctbs contram1 are not as clear. Grouping by BDNF genotype was inconclusive due to limited statistical power. The small number of participants in this cross-over study limits the ability to draw firm conclusions regarding the influence of BDNF genotype. Carrying the Met allele results in modifications of the use dependent release of BDNF that will probably have a spectrum of effects across a population. Furthermore other factors may impact BDNF availability, for example exercise (Gomez- Pinilla et al., 2003). These preliminary data indicate that the efficacy of ctbs contram1 may depend on stroke severity, and possibly BDNF genotype. This idea warrants further study with a larger sample of patients. Met carriers may have a limited response to TBS or training alone. The combination of itbs ipsim1 and task-specific training may produce beneficial effects on sensorimotor performance in subcortical stroke patients and warrants further study. The improvements in precision grip-lift performance after TBS did not generalise to increases in upper limb function assessed with the ARAT. Previously we found an association between suppression of ipsilesional corticomotor excitability and deterioration of 182
195 upper limb function scored with ARAT after ctbs contram1 (Ackerley et al., 2010). In the present study ctbs contram1 did not produce an immediate suppression of ipsilesional M1 excitability, and no change in upper limb function was observed. In the present study, ctbs suppressed contralesional M1 in some patients while facilitating it in others, and this depended on overall stroke severity. We expect that the remote effects of ctbs on paretic upper limb function were similarly variable, and therefore there was no consistent effect on ARAT score Potential limitations Handedness and attention can influence measures of SAI (Helmich et al., 2005, Oliviero et al., 2005). In healthy right handed adults there is typically less SAI in the nondominant hemisphere when compared to the dominant hemisphere (Helmich et al., 2005). In the current study more patients had lesions affecting their non-dominant hemisphere (10/12). Whilst it is possible this discrepancy in handedness led to underestimation of ipsilesional SAI, it is more likely that SAI lateralisation reflects the influence of the stroke (Oliviero et al., 2005). Attention to the stimulated hand increases SAI, but only compared to when attention is diverted to the opposite hand and not compared to when no attention is given (Kotb et al. 2006). In the current study patients were not given instructions regarding attention. Whilst increased attention to the stimulated hand may occur to some extent naturally, it is unlikely that attention differed between hands given patients did not have significant sensory deficits Conclusions TBS and task-specific training lead to enhanced grip performance with the paretic hand, confirming previous findings. The promotion of use-dependent plasticity by facilitation of ipsilesional corticomotor excitability appeared to provide a foundation for 183
196 improvements in grip-lift performance. Sensorimotor integration (indicated by SAI) changed during training, and in the same direction as the after-effects of the TBS protocol on M1 excitability, in the stimulated but not in the non-stimulated hemisphere. This hemisphere specific modulation of SAI indicates that TBS primarily influences the responsiveness of M1 to afferent input, but enhanced sensorimotor integration was not necessary for improved griplift performance. Given that the contralesional M1 may play an important role in recovery of paretic limb movement in some patients, a cautious approach to protocols aimed at suppression of contralesional M1 seems warranted. However, an intriguing possibility is that priming ipsilesional M1 prior to therapy with techniques such as itbs ipsim1 may enable patients with subcortical stroke to engage in better quality motor training. 184
197 Chapter 11. OVERVIEW AND FUTURE DIRECTIONS The challenge One of the most pressing challenges for neurorehabilitation is to develop practical ways to promote neural plasticity to improve upper limb recovery after stroke. We know that more intensive rehabilitation enhances UDP and leads to better outcomes, but therapy dose is limited by patient factors (e.g. depression, lack of transportation) and clinical resources. We need to develop methods to promote a more plastic response to a given therapy dose. This dissertation presented two approaches, externally-paced training and primed training, which promoted UDP and may be useful adjuncts to improve upper limb recovery after stroke. UDP can be promoted by the addition of auditory pacing to training Auditory pacing has been used for gait re-education in neurological conditions including stroke, but limited attention has been given to its use in upper limb rehabilitation. The first study presented in this dissertation demonstrates, in healthy adults, that UDP is optimised when upper limb movement training is performed, at a comfortable speed, in time with a metronome beat (Chapter 6). Having observed the potential benefits of synchronised motor training, the next question was could faster be better? No, because UDP was attenuated when training movements were paced at a faster tempo (Chapter 7). While the precise mechanisms underlying the observed effects are difficult to determine, temporal synchrony of auditory and sensory input at M1 may augment synaptic efficacy to promote UDP, most likely through selective disinhibition within M1. After stroke the ipsilesional M1 can be hypoexcitable and have excessive trancallosal inhibition acting on it from 185
198 contralesional M1. These pathophysiological consequences can contribute to impaired movement of the opposite side of the body. Externally-paced training with the paretic upper limb has the potential to strengthen weak or latent synaptic connections within surviving corticomotor pathways, and contribute to task-specific improvements in upper limb performance. In Chapter 6 UDP was promoted in the presence or absence of an increase in corticomotor excitability of the training agonist. Training performed in synchrony with the metronome beat increased corticomotor excitability but training performed in syncopation did not. This indicates that facilitation of corticomotor excitability is not necessary for UDP. Furthermore, this finding reinforces the need for caution when using changes in MEP amplitude alone as a marker of UDP. There are potential therapeutic benefits to be gained from promoting UDP without increasing corticomotor excitability. Syncopated training may provide an effective method to treat neurological conditions that are characterised by cortical hyperexcitability. In the context of stroke rehabilitation, syncopated upper limb training may have a role in treatment of stroke patients who demonstrate dystonic movements of the paretic hand. Externally-paced movement training may increase UDP, for an equivalent therapy dose, and is a clinically feasible and economical approach to improving upper limb recovery. UDP can be promoted with theta burst stimulation and training An understanding is developing as to the effects of TBS alone, on excitability and behaviour, in healthy adults and those affected by stroke. The work presented here explored the combined effects of M1 TBS and motor training, akin to its potential use in rehabilitation, for the first time. I asked can theta burst stimulation (TBS) prime the brain for a better 186
199 response to upper limb training in chronic subcortical stroke patients? Yes, the results of two experimental studies presented in this dissertation provide important proof of concept (Chapters 8), and confirmation (Chapter 10), that priming M1 with TBS facilitated ipsilesional M1 excitability, and allowed stroke patients to engage in better quality practice. More specifically, training primed with itbs produced more consistent and predictable after-effects than ctbs primed training. After itbs, improvements in grip performance were probably due to direct facilitation and local disinhibition of ipsilesional M1. These effects increased the receptiveness of ipsilesional M1 to afferent input produced during training of the paretic hand, and enhanced UDP. Although there were task-specific improvements in paretic hand performance after ctbs primed training, in general the response to this intervention was variable, and associated with stroke severity. Furthermore, contralesional ctbs was also associated with a transient decrement in paretic upper limb function. These findings reflect the compensatory role that contralesional M1 may play in the control of paretic upper limb movement. Therefore ctbs primed therapy may not be appropriate for all stroke patients, in particular those with significant impairment. This highlights the need to identify which patients are more likely to benefit from a given priming protocol. Patients in whom contralesional M1 plays a compensatory role may not benefit from its suppression. Furthermore, genotype may also affect the choice of priming protocol. The response to TBS is blunted in people with a common polymorphism of the BDNF gene. Interestingly, the preliminary findings presented here indicate that patients with this polymorphism may benefit from the combination of itbs and therapy. The use of TBS to prime the brain for a better response to therapy in the clinical setting is feasible. This technique is well-tolerated and low risk, provided patients are carefully screened. The potential disadvantages include the cost of training staff to deliver TMS, and the cost of the TMS equipment itself. However, as TBS can be set up and 187
200 delivered in less than 10 minutes, it places minimal demands on the schedules of both staff and patients. The future The use of external pacing to promote UDP needs to be investigated in a stroke population. A blinded controlled patient trial is warranted to evaluate the efficacy of metronome-paced upper limb training on UDP and motor recovery after stroke. It will be important to objectively measure therapy content and dose between interventional arms, so that the influence of these potential confounders can be accounted for, and valid conclusions can be drawn. At present TBS is a research tool, and future studies will need to investigate the promotion of UDP using combined M1 TBS and therapy, in large sham-controlled, randomised clinical trials. It is important to see whether the beneficial effects of TBS can accumulate over repeated sessions and enhance the response to therapy. Multiple sessions of primed-therapy with other types of non-invasive brain stimulation protocols have produced after-effects that persist beyond the treatment period (Boggio et al., 2007, Fregni et al., 2006, Khedr et al., 2005, Malcolm et al., 2007, Reis et al., 2009). It may be that more varied training will result in more generalised improvements in upper limb function, for example incorporating sensory retraining and/or task-orientated therapy. The timing of training after TBS delivery needs to be considered and controlled for given the significant interactions of this rtms protocol with movement. Important factors in the experimental design will be gaining objective measures of structural and functional corticospinal tract integrity and BDNF genotype. The inclusion of these measures in clinical trials will assist in characterising an individual s functional potential and help to inform the tailored prescription of TBS to improve recovery after stroke. 188
201 In summary, this dissertation provides evidence to support future clinical studies of the promotion of UDP through two novel approaches. I hope that this will translate to improved outcomes for people living with the consequences of stroke. 189
202 Appendices Appendix 1. TMS participant screening checklist and guidelines Appendix 2. Edinburgh Handedness Inventory Appendix 3. Participant information sheet (PIS) and consent form for Chapter Appendix 4. PIS and consent form for Chapter Appendix 5. Modified Rankin Scale Appendix 6. National Institutes of Health Stroke Scale (NIHSS) Appendix 7. Fugl-Meyer (FM) scale Appendix 8. PIS and consent form for Chapter Appendix 9. Action Research Arm Test (ARAT) Appendix 10. PIS and consent form for Chapter Appendix 11. PIS and consent form for Chapter Appendix 12. Modified Ashworth Scale (ASH)
203 Appendix 1. TMS participant screening checklist and guidelines 191
204 192
205 193
206 194
207 195
208 196
209 197
210 198
211 199
212 Appendix 2. Edinburgh Handedness Inventory 200
 and")
213 Appendix 3. Participant information sheet (PIS) and consent form for Chapter 6 201

214 202
215 203

216 Appendix 4. PIS and consent form for Chapter 7 204
217 205
218 206
219 Appendix 5. Modified Rankin Scale 207
220 208
221 209
222 210
223 Appendix 6. National Institutes of Health Stroke Scale (NIHSS) 211
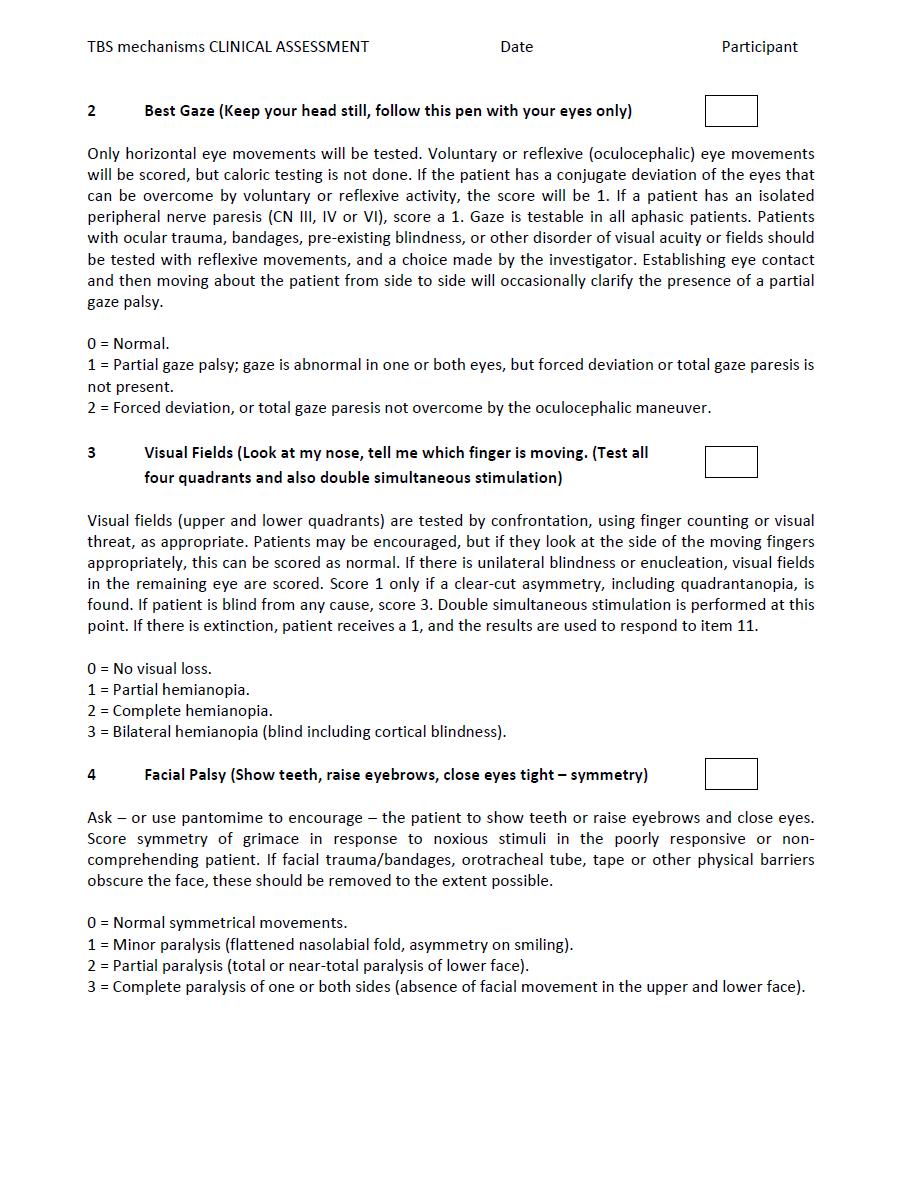
224 212
225 213
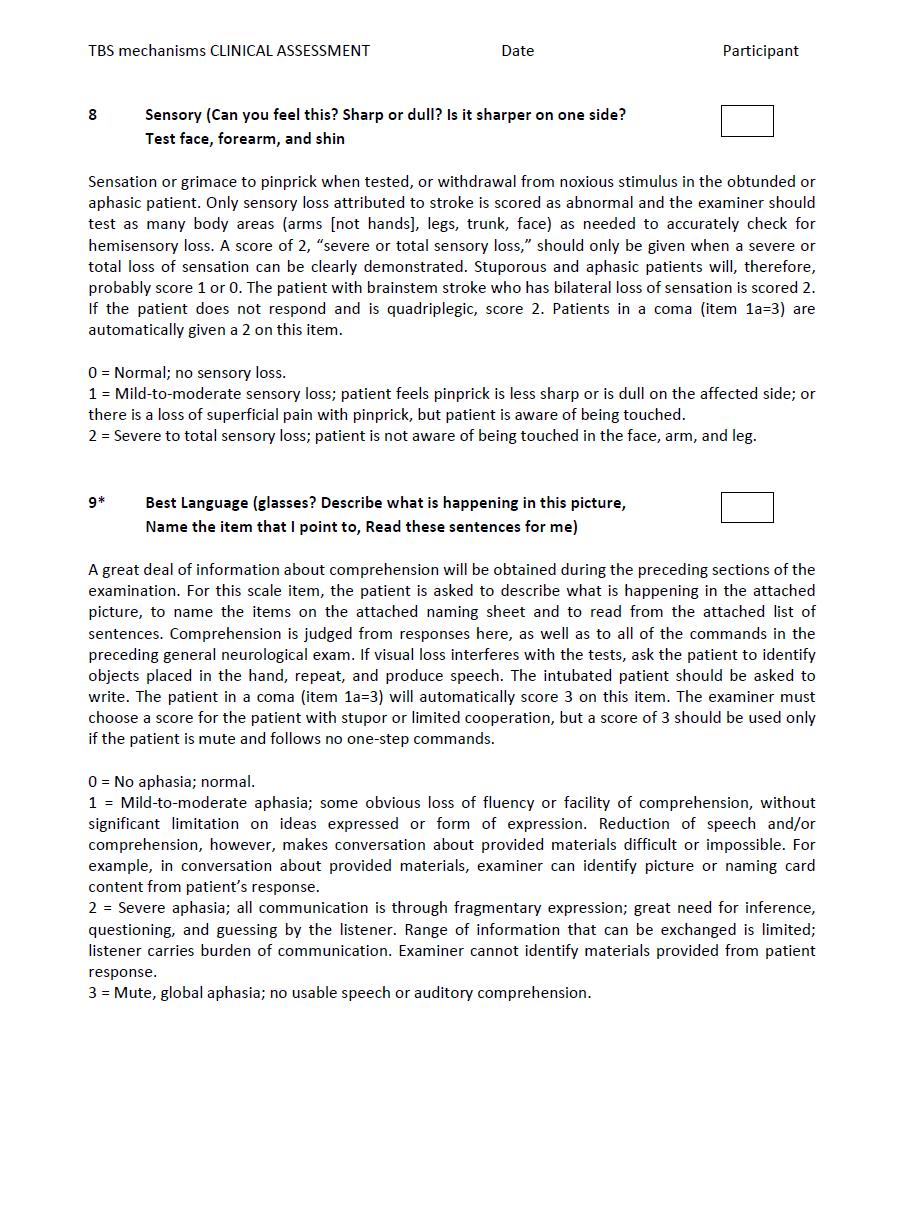
226 214
227 215
228 216
229 217
230 218
231 219
")
232 Appendix 7. Fugl-Meyer (FM) scale 220
233 221
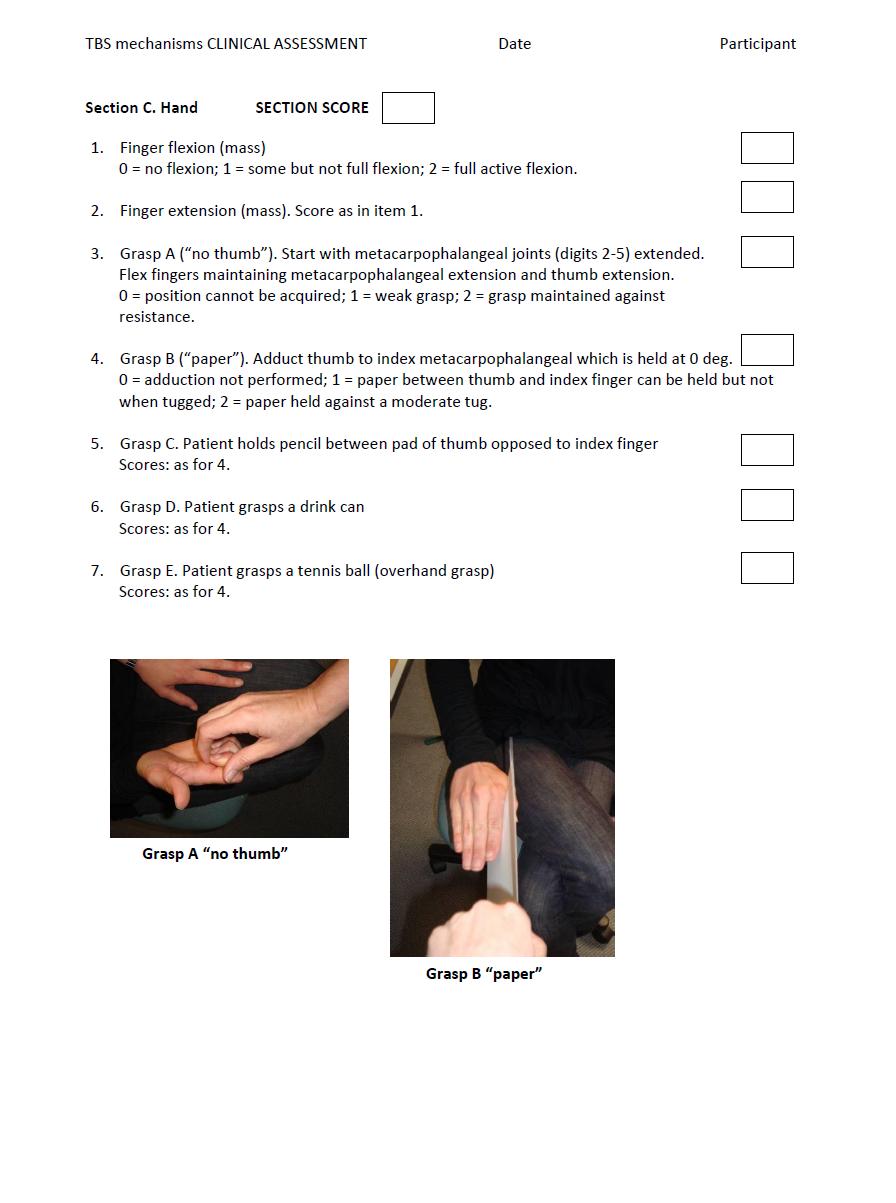
234 222
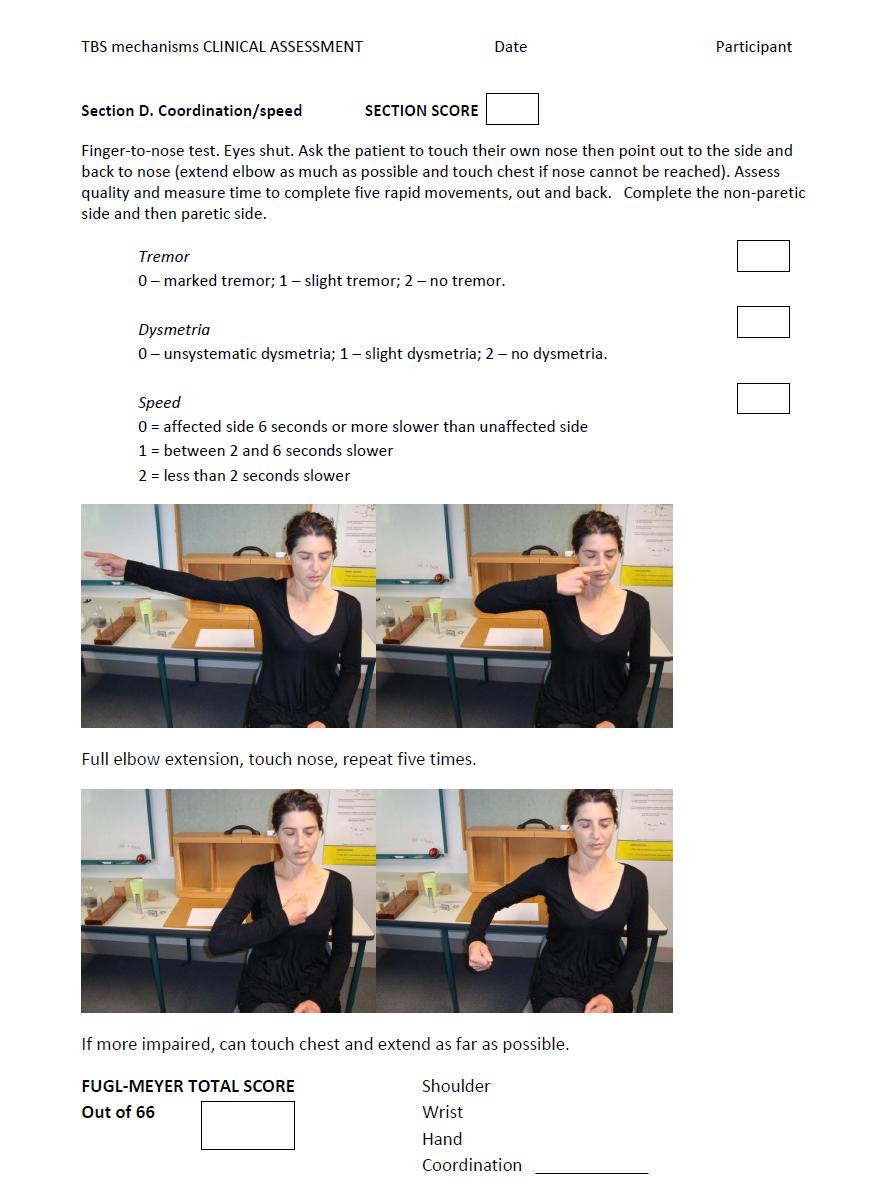
235 223

236 Appendix 8. PIS and consent form for Chapter 8 224
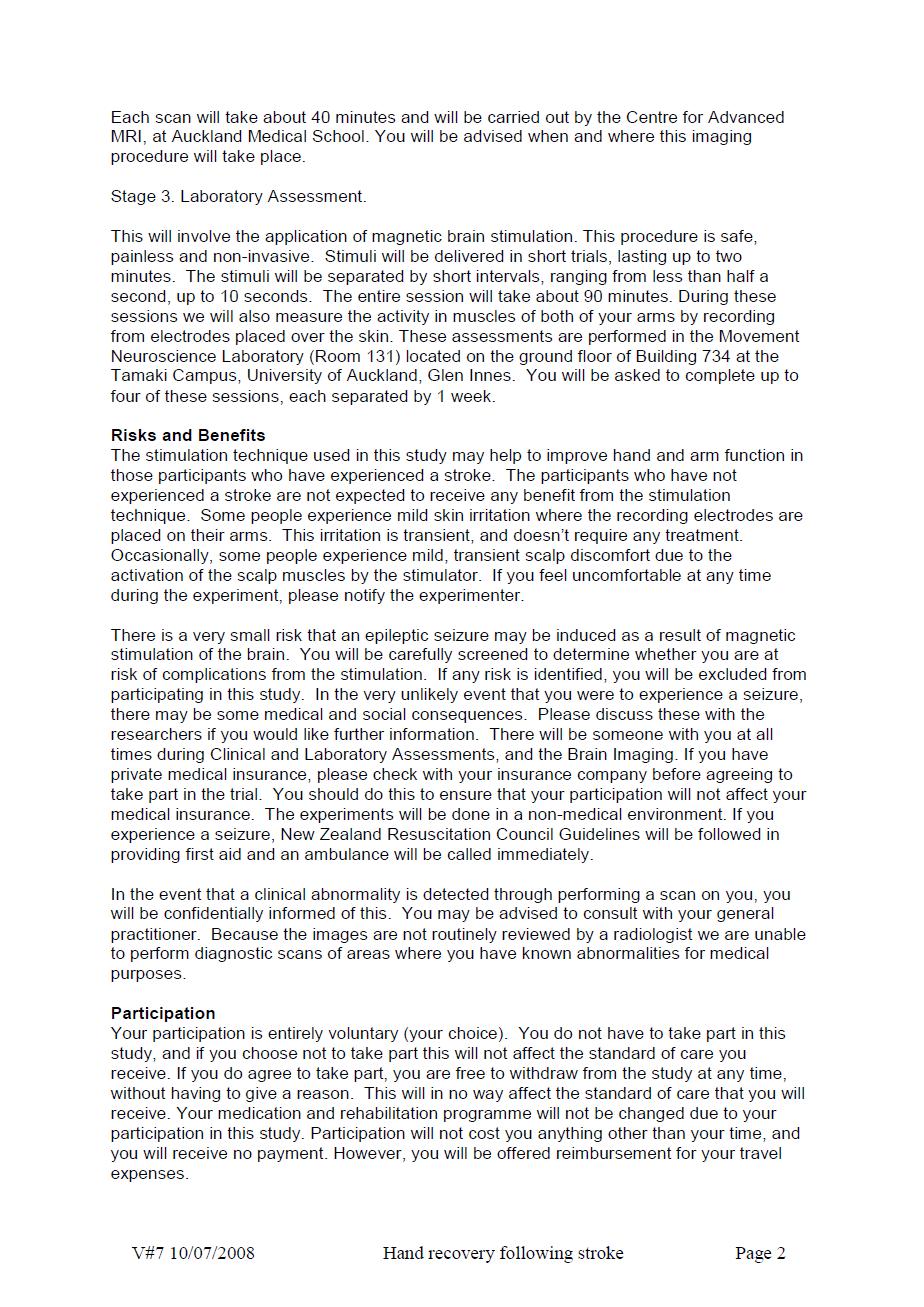
237 225
238 226
239 227
240 228
241 229

242 Appendix 9. Action Research Arm Test (ARAT) 230
243 231
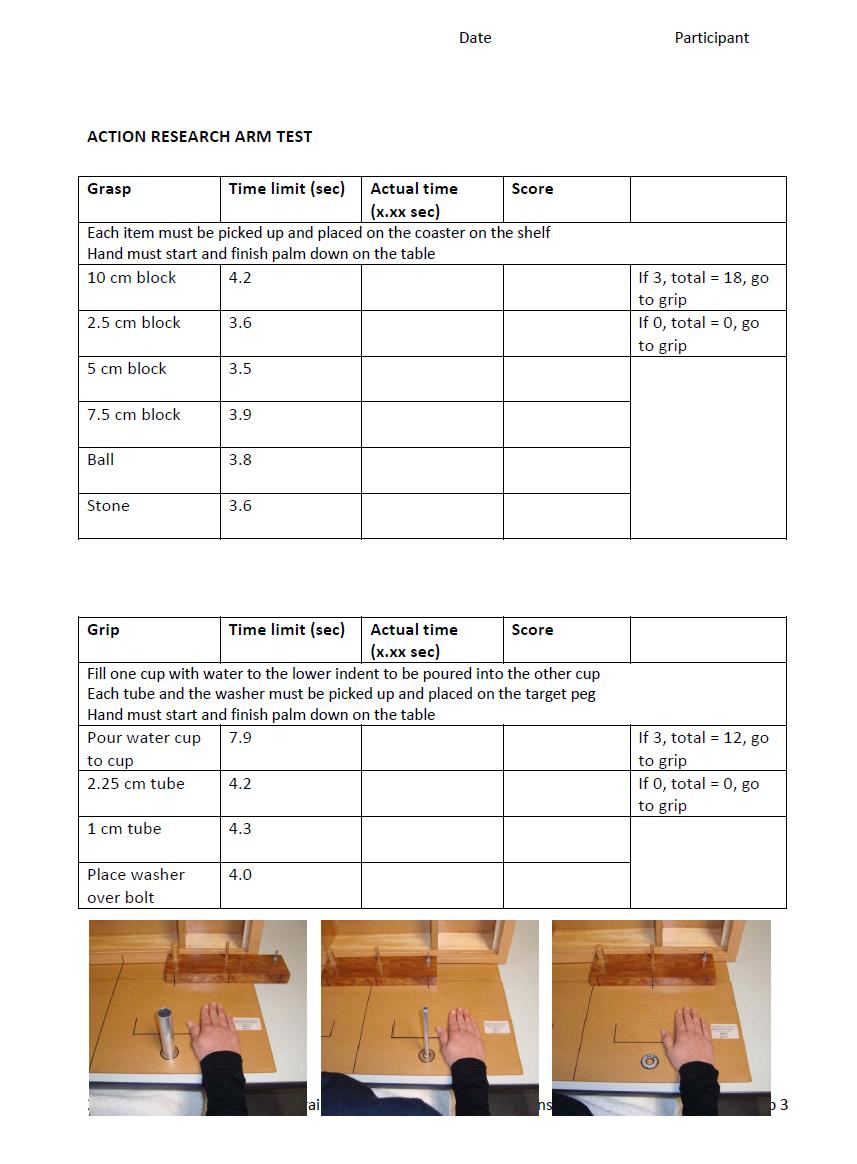
244 232
245 233

246 Appendix 10. PIS and consent form for Chapter 9 234
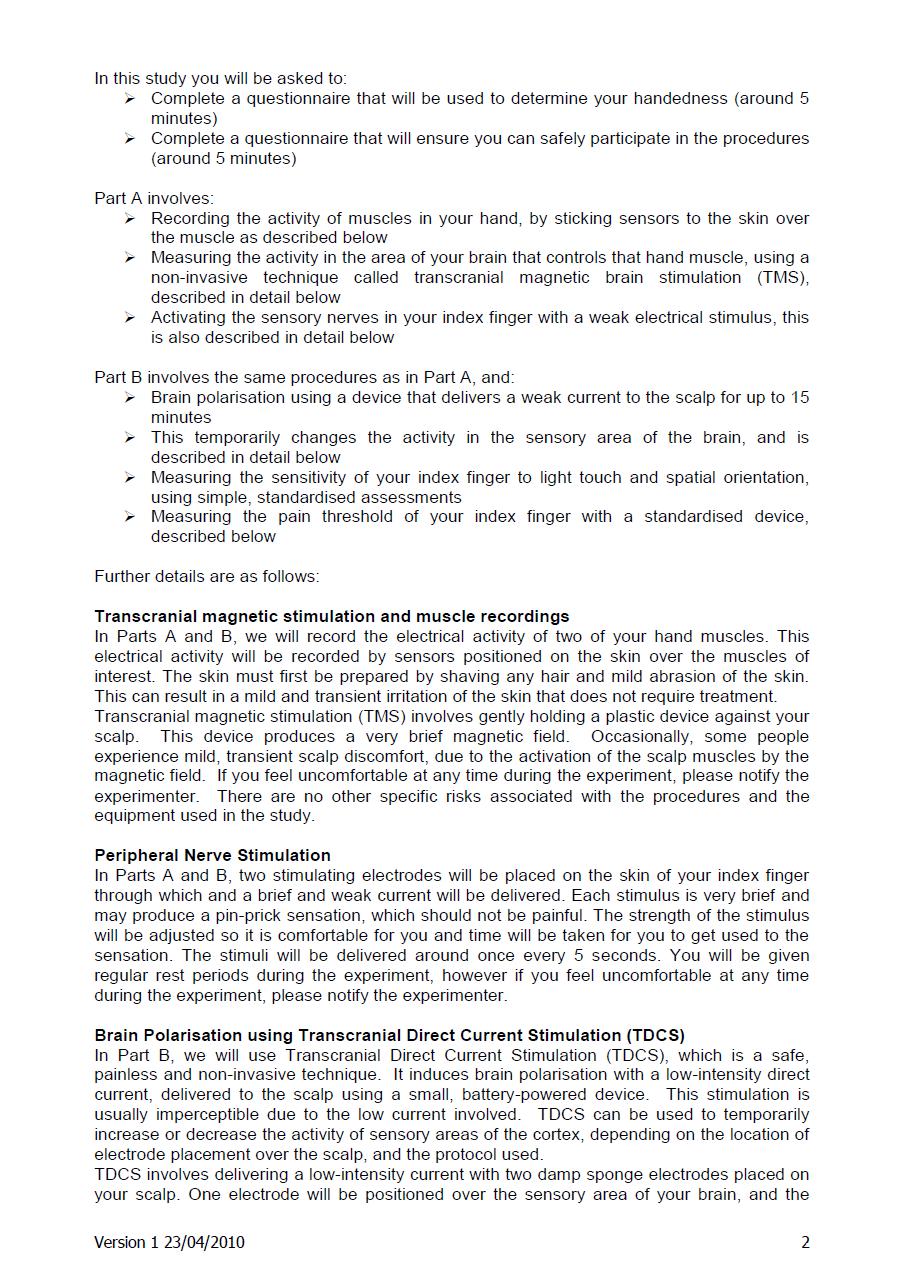
247 235
248 236
249 237
250 238
251 239

252 Appendix 11. PIS and consent form for Chapter
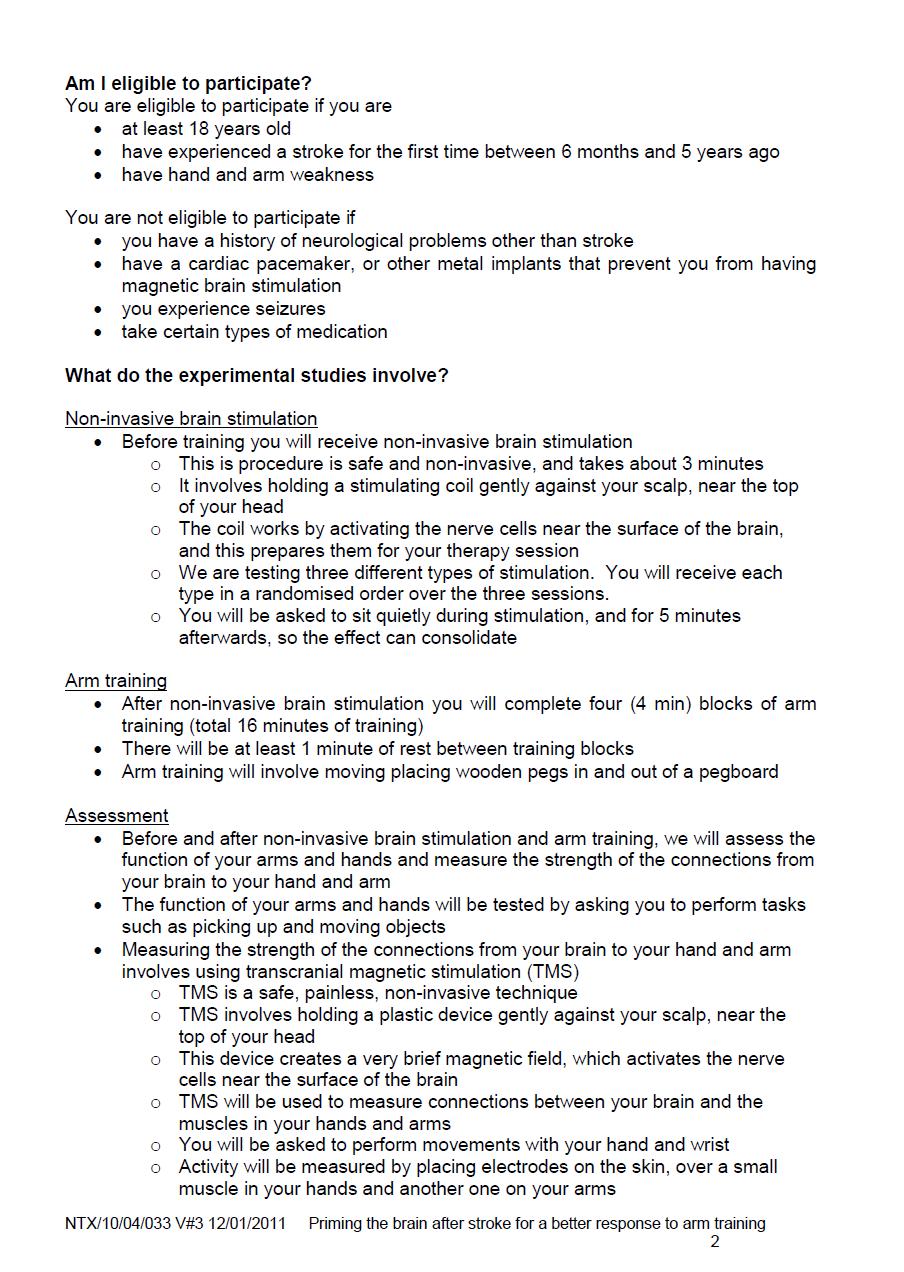
253 241
254 242
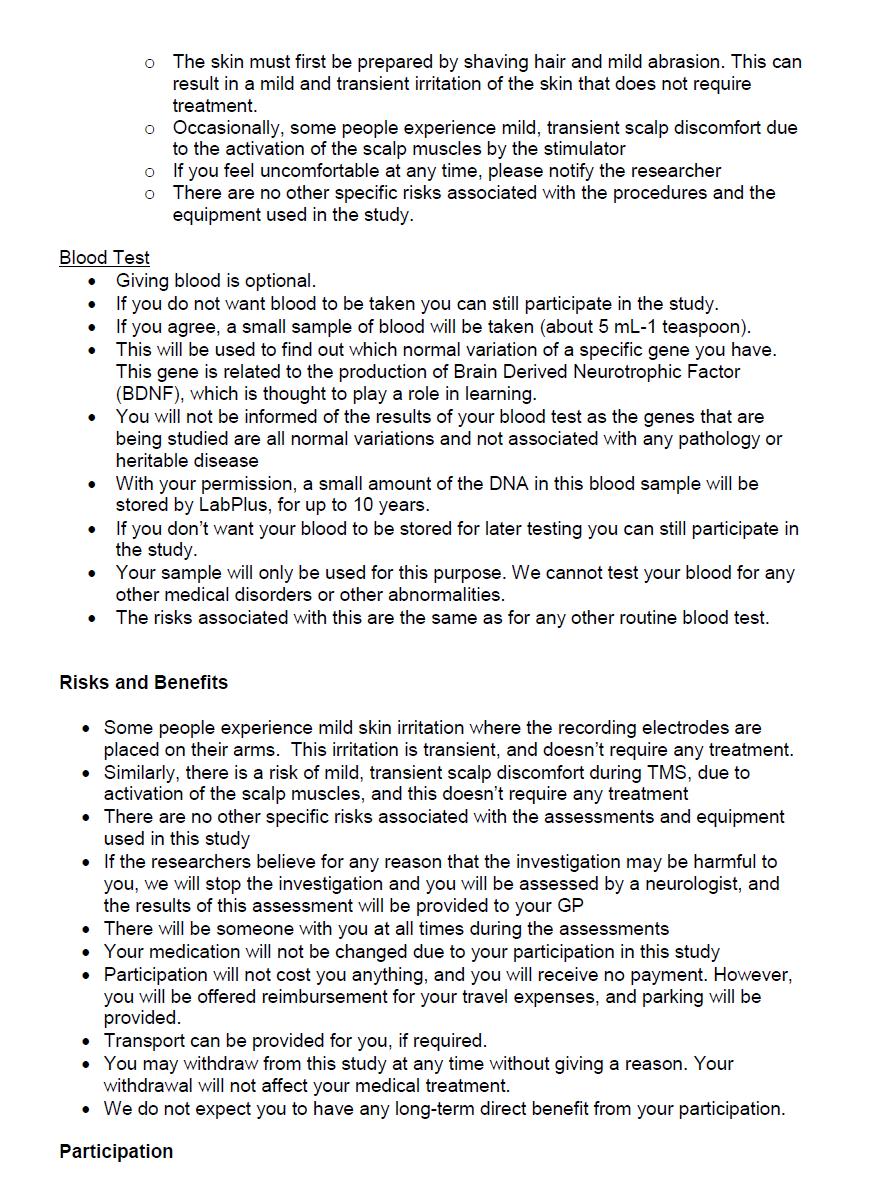
255 243

256 244
257 245
Neurophysiology of systems
 Neurophysiology of systems Motor cortex (voluntary movements) Dana Cohen, Room 410, tel: 7138 danacoh@gmail.com Voluntary movements vs. reflexes Same stimulus yields a different movement depending on context
Cortical Control of Movement
 Strick Lecture 2 March 24, 2006 Page 1 Cortical Control of Movement Four parts of this lecture: I) Anatomical Framework, II) Physiological Framework, III) Primary Motor Cortex Function and IV) Premotor
The Nervous System: Sensory and Motor Tracts of the Spinal Cord
 15 The Nervous System: Sensory and Motor Tracts of the Spinal Cord PowerPoint Lecture Presentations prepared by Steven Bassett Southeast Community College Lincoln, Nebraska Introduction Millions of sensory
The Physiology of the Senses Chapter 8 - Muscle Sense
 The Physiology of the Senses Chapter 8 - Muscle Sense www.tutis.ca/senses/ Contents Objectives... 1 Introduction... 2 Muscle Spindles and Golgi Tendon Organs... 3 Gamma Drive... 5 Three Spinal Reflexes...
Neural Basis of Motor Control
 Neural Basis of Motor Control Central Nervous System Skeletal muscles are controlled by the CNS which consists of the brain and spinal cord. Determines which muscles will contract When How fast To what
Water immersion modulates sensory and motor cortical excitability
 Water immersion modulates sensory and motor cortical excitability Daisuke Sato, PhD Department of Health and Sports Niigata University of Health and Welfare Topics Neurophysiological changes during water
1) Drop off in the Bi 150 box outside Baxter 331 or to the head TA (jcolas).
 Drop off in the Bi 150 box outside Baxter 331 or to the head TA (jcolas).") Bi/CNS/NB 150 Problem Set 5 Due: Tuesday, Nov. 24, at 4:30 pm Instructions: 1) Drop off in the Bi 150 box outside Baxter 331 or e-mail to the head TA (jcolas). 2) Submit with this cover page. 3) Use a
Bi/CNS/NB 150 Problem Set 5 Due: Tuesday, Nov. 24, at 4:30 pm Instructions: 1) Drop off in the Bi 150 box outside Baxter 331 or e-mail to the head TA (jcolas). 2) Submit with this cover page. 3) Use a
skilled pathways: distal somatic muscles (fingers, hands) (brainstem, cortex) are giving excitatory signals to the descending pathway
 (brainstem, cortex) are giving excitatory signals to the descending pathway") L15 - Motor Cortex General - descending pathways: how we control our body - motor = somatic muscles and movement (it is a descending motor output pathway) - two types of movement: goal-driven/voluntary
L15 - Motor Cortex General - descending pathways: how we control our body - motor = somatic muscles and movement (it is a descending motor output pathway) - two types of movement: goal-driven/voluntary
Cortical Map Plasticity. Gerald Finnerty Dept Basic and Clinical Neuroscience
 Cortical Map Plasticity Gerald Finnerty Dept Basic and Clinical Neuroscience Learning Objectives Be able to: 1. Describe the characteristics of a cortical map 2. Appreciate that the term plasticity is
I: To describe the pyramidal and extrapyramidal tracts. II: To discuss the functions of the descending tracts.
 Descending Tracts I: To describe the pyramidal and extrapyramidal tracts. II: To discuss the functions of the descending tracts. III: To define the upper and the lower motor neurons. 1. The corticonuclear
Lecture VIII. The Spinal Cord, Reflexes and Brain Pathways!
 Reflexes and Brain Bio 3411! Monday!! 1! Readings! NEUROSCIENCE 5 th ed: Review Chapter 1 pp. 11-21;!!Read Chapter 9 pp. 189-194, 198! THE BRAIN ATLAS 3 rd ed:! Read pp. 4-17 on class web site! Look at
Physiology of Tactile Sensation
 Physiology of Tactile Sensation Objectives: 1. Describe the general structural features of tactile sensory receptors how are first order nerve fibers specialized to receive tactile stimuli? 2. Understand
Motor Systems I Cortex. Reading: BCP Chapter 14
 Motor Systems I Cortex Reading: BCP Chapter 14 Principles of Sensorimotor Function Hierarchical Organization association cortex at the highest level, muscles at the lowest signals flow between levels over
biological psychology, p. 40 The study of the nervous system, especially the brain. neuroscience, p. 40
 biological psychology, p. 40 The specialized branch of psychology that studies the relationship between behavior and bodily processes and system; also called biopsychology or psychobiology. neuroscience,
Circuits & Behavior. Daniel Huber
 Circuits & Behavior Daniel Huber How to study circuits? Anatomy (boundaries, tracers, viral tools) Inactivations (lesions, optogenetic, pharma, accidents) Activations (electrodes, magnets, optogenetic)
The Motor Systems. What s the motor system? Plan
 The Motor Systems What s the motor system? Parts of CNS and PNS specialized for control of limb, trunk, and eye movements Also holds us together From simple reflexes (knee jerk) to voluntary movements
Acetylcholine (ACh) Action potential. Agonists. Drugs that enhance the actions of neurotransmitters.
 Action potential. Agonists. Drugs that enhance the actions of neurotransmitters.") Acetylcholine (ACh) The neurotransmitter responsible for motor control at the junction between nerves and muscles; also involved in mental processes such as learning, memory, sleeping, and dreaming. (See
Acetylcholine (ACh) The neurotransmitter responsible for motor control at the junction between nerves and muscles; also involved in mental processes such as learning, memory, sleeping, and dreaming. (See
The Three Pearls DOSE FUNCTION MOTIVATION
 The Three Pearls DOSE FUNCTION MOTIVATION Barriers to Evidence-Based Neurorehabilitation No placebo pill for training therapy Blinded studies often impossible Outcome measures for movement, language, and
Lateral view of human brain! Cortical processing of touch!
 Lateral view of human brain! Cortical processing of touch! How do we perceive objects held in the hand?! Touch receptors deconstruct objects to detect local features! Information is transmitted in parallel
Chapter 8. Control of movement
 Chapter 8 Control of movement 1st Type: Skeletal Muscle Skeletal Muscle: Ones that moves us Muscles contract, limb flex Flexion: a movement of a limb that tends to bend its joints, contraction of a flexor
P. Hitchcock, Ph.D. Department of Cell and Developmental Biology Kellogg Eye Center. Wednesday, 16 March 2009, 1:00p.m. 2:00p.m.
 Normal CNS, Special Senses, Head and Neck TOPIC: CEREBRAL HEMISPHERES FACULTY: LECTURE: READING: P. Hitchcock, Ph.D. Department of Cell and Developmental Biology Kellogg Eye Center Wednesday, 16 March
CASE 49. What type of memory is available for conscious retrieval? Which part of the brain stores semantic (factual) memories?
 memories?") CASE 49 A 43-year-old woman is brought to her primary care physician by her family because of concerns about her forgetfulness. The patient has a history of Down syndrome but no other medical problems.
CASE 49 A 43-year-old woman is brought to her primary care physician by her family because of concerns about her forgetfulness. The patient has a history of Down syndrome but no other medical problems.
Biology 218 Human Anatomy
 Chapter 21 Adapted form Tortora 10 th ed. LECTURE OUTLINE A. Overview of Sensations (p. 652) 1. Sensation is the conscious or subconscious awareness of external or internal stimuli. 2. For a sensation
Neural Integration I: Sensory Pathways and the Somatic Nervous System
 15 Neural Integration I: Sensory Pathways and the Somatic Nervous System PowerPoint Lecture Presentations prepared by Jason LaPres Lone Star College North Harris An Introduction to Sensory Pathways and
Biological Bases of Behavior. 8: Control of Movement
 Biological Bases of Behavior 8: Control of Movement m d Skeletal Muscle Movements of our body are accomplished by contraction of the skeletal muscles Flexion: contraction of a flexor muscle draws in a
Overview of Questions
 Overview of Questions What are the sensors in the skin, what do they respond to and how is this transmitted to the brain? How does the brain represent touch information? What is the system for sensing
Psychology in Your Life
 Sarah Grison Todd Heatherton Michael Gazzaniga Psychology in Your Life SECOND EDITION Chapter 2 The Role of Biology in Psychology 1 2016 W. W. Norton & Company, Inc. 2.1 How Do Our Nervous Systems Affect
PSYC& 100: Biological Psychology (Lilienfeld Chap 3) 1
 1") PSYC& 100: Biological Psychology (Lilienfeld Chap 3) 1 1 What is a neuron? 2 Name and describe the functions of the three main parts of the neuron. 3 What do glial cells do? 4 Describe the three basic
PSYC& 100: Biological Psychology (Lilienfeld Chap 3) 1 1 What is a neuron? 2 Name and describe the functions of the three main parts of the neuron. 3 What do glial cells do? 4 Describe the three basic
Part 11: Mechanisms of Learning
 Neurophysiology and Information: Theory of Brain Function Christopher Fiorillo BiS 527, Spring 2012 042 350 4326, fiorillo@kaist.ac.kr Part 11: Mechanisms of Learning Reading: Bear, Connors, and Paradiso,
Motor systems.... the only thing mankind can do is to move things... whether whispering or felling a forest. C. Sherrington
 Motor systems... the only thing mankind can do is to move things... whether whispering or felling a forest. C. Sherrington 1 Descending pathways: CS corticospinal; TS tectospinal; RS reticulospinal; VS
The Cerebellum. Outline. Lu Chen, Ph.D. MCB, UC Berkeley. Overview Structure Micro-circuitry of the cerebellum The cerebellum and motor learning
 The Cerebellum Lu Chen, Ph.D. MCB, UC Berkeley 1 Outline Overview Structure Micro-circuitry of the cerebellum The cerebellum and motor learning 2 Overview Little brain 10% of the total volume of the brain,
Mechanosensation. Central Representation of Touch. Wilder Penfield. Somatotopic Organization
 Mechanosensation Central Representation of Touch Touch and tactile exploration Vibration and pressure sensations; important for clinical testing Limb position sense John H. Martin, Ph.D. Center for Neurobiology
Sensory coding and somatosensory system
 Sensory coding and somatosensory system Sensation and perception Perception is the internal construction of sensation. Perception depends on the individual experience. Three common steps in all senses
CISC 3250 Systems Neuroscience
 CISC 3250 Systems Neuroscience Levels of organization Central Nervous System 1m 10 11 neurons Neural systems and neuroanatomy Systems 10cm Networks 1mm Neurons 100μm 10 8 neurons Professor Daniel Leeds
Note: Waxman is very sketchy on today s pathways and nonexistent on the Trigeminal.
 Dental Neuroanatomy Thursday, February 3, 2011 Suzanne Stensaas, PhD Note: Waxman is very sketchy on today s pathways and nonexistent on the Trigeminal. Resources: Pathway Quiz for HyperBrain Ch. 5 and
 Peripheral facial paralysis (right side). The patient is asked to close her eyes and to retract their mouth (From Heimer) Hemiplegia of the left side. Note the characteristic position of the arm with
BIPN 140 Problem Set 6
 BIPN 140 Problem Set 6 1) The hippocampus is a cortical structure in the medial portion of the temporal lobe (medial temporal lobe in primates. a) What is the main function of the hippocampus? The hippocampus
Brain Stem and cortical control of motor function. Dr Z Akbari
 Brain Stem and cortical control of motor function Dr Z Akbari Brain stem control of movement BS nuclear groups give rise to descending motor tracts that influence motor neurons and their associated interneurons
Exam 1 PSYC Fall 1998
 Exam 1 PSYC 2022 Fall 1998 (2 points) Briefly describe the difference between a dualistic and a materialistic explanation of brain-mind relationships. (1 point) True or False. George Berkely was a monist.
1. Which part of the brain is responsible for planning and initiating movements?
 Section: Chapter 10: Multiple Choice 1. Which part of the brain is responsible for planning and initiating movements? p.358 frontal lobe hippocampus basal ganglia cerebellum 2. The prefrontal cortex is
Sensory information processing, somato-sensory systems
 mm? Sensory information processing, somato-sensory systems Recommended literature 1. Kandel ER, Schwartz JH, Jessel TM (2000) Principles of Neural Science, McGraw-Hill, Ch. xx. 2. Berne EM, Levy MN, Koeppen
Movimento volontario dell'arto superiore analisi, perturbazione, ottimizzazione
 Movimento volontario dell'arto superiore analisi, perturbazione, ottimizzazione Antonio Currà UOS Neurologia Universitaria, Osp. A. Fiorini, Terracina UOC Neuroriabilitazione ICOT, Latina, Dir. Prof. F.
Naoyuki Takeuchi, MD, PhD 1, Takeo Tada, MD, PhD 2, Masahiko Toshima, MD 3, Yuichiro Matsuo, MD 1 and Katsunori Ikoma, MD, PhD 1 ORIGINAL REPORT
 J Rehabil Med 2009; 41: 1049 1054 ORIGINAL REPORT REPETITIVE TRANSCRANIAL MAGNETIC STIMULATION OVER BILATERAL HEMISPHERES ENHANCES MOTOR FUNCTION AND TRAINING EFFECT OF PARETIC HAND IN PATIENTS AFTER STROKE
BIPN 140 Problem Set 6
 BIPN 140 Problem Set 6 1) Hippocampus is a cortical structure in the medial portion of the temporal lobe (medial temporal lobe in primates. a) What is the main function of the hippocampus? The hippocampus
Posterior White Column-Medial Lemniscal Pathway
 Posterior White Column-Medial Lemniscal Pathway Modality: Discriminative Touch Sensation (include Vibration) and Conscious Proprioception Receptor: Most receptors except free nerve endings Ist Neuron:
SOMATIC SENSATION PART I: ALS ANTEROLATERAL SYSTEM (or SPINOTHALAMIC SYSTEM) FOR PAIN AND TEMPERATURE
 FOR PAIN AND TEMPERATURE") Dental Neuroanatomy Thursday, February 3, 2011 Suzanne S. Stensaas, PhD SOMATIC SENSATION PART I: ALS ANTEROLATERAL SYSTEM (or SPINOTHALAMIC SYSTEM) FOR PAIN AND TEMPERATURE Reading: Waxman 26 th ed, :
Dental Neuroanatomy Thursday, February 3, 2011 Suzanne S. Stensaas, PhD SOMATIC SENSATION PART I: ALS ANTEROLATERAL SYSTEM (or SPINOTHALAMIC SYSTEM) FOR PAIN AND TEMPERATURE Reading: Waxman 26 th ed, :
Voluntary Movement. Ch. 14: Supplemental Images
 Voluntary Movement Ch. 14: Supplemental Images Skeletal Motor Unit: The basics Upper motor neuron: Neurons that supply input to lower motor neurons. Lower motor neuron: neuron that innervates muscles,
TREATMENT-SPECIFIC ABNORMAL SYNAPTIC PLASTICITY IN EARLY PARKINSON S DISEASE
 TREATMENT-SPECIFIC ABNORMAL SYNAPTIC PLASTICITY IN EARLY PARKINSON S DISEASE Angel Lago-Rodriguez 1, Binith Cheeran 2 and Miguel Fernández-Del-Olmo 3 1. Prism Lab, Behavioural Brain Sciences, School of
Nervous System C H A P T E R 2
 Nervous System C H A P T E R 2 Input Output Neuron 3 Nerve cell Allows information to travel throughout the body to various destinations Receptive Segment Cell Body Dendrites: receive message Myelin sheath
Physiology of synapses and receptors
 Physiology of synapses and receptors Dr Syed Shahid Habib Professor & Consultant Clinical Neurophysiology Dept. of Physiology College of Medicine & KKUH King Saud University REMEMBER These handouts will
Role of brainstem in somatomotor (postural) functions
 functions") Role of brainstem in somatomotor (postural) functions (vestibular apparatus) The muscle tone and its regulation VESTIBULAR SYSTEM (Equilibrium) Receptors: Otolith organs Semicircular canals Sensation (information):
Role of brainstem in somatomotor (postural) functions (vestibular apparatus) The muscle tone and its regulation VESTIBULAR SYSTEM (Equilibrium) Receptors: Otolith organs Semicircular canals Sensation (information):
SAMPLE EXAMINATION QUESTIONS
 SAMPLE EXAMINATION QUESTIONS PLEASE NOTE, THE QUESTIONS BELOW SAMPLE THE ENTIRE LECTURE COURSE AND THEREORE INCLUDE QUESTIONS ABOUT TOPICS THAT WE HAVE NOT YET COVERED IN CLASS. 1. Which of the following
Psychology 320: Topics in Physiological Psychology Lecture Exam 2: March 19th, 2003
 Psychology 320: Topics in Physiological Psychology Lecture Exam 2: March 19th, 2003 Name: Student #: BEFORE YOU BEGIN!!! 1) Count the number of pages in your exam. The exam is 8 pages long; if you do not
OVERVIEW. Today. Sensory and Motor Neurons. Thursday. Parkinsons Disease. Administra7on. Exam One Bonus Points Slides Online
 OVERVIEW Today Sensory and Motor Neurons Thursday Parkinsons Disease Administra7on Exam One Bonus Points Slides Online 7 major descending motor control pathways from Cerebral Cortex or Brainstem
Neural Basis of Motor Control. Chapter 4
 Neural Basis of Motor Control Chapter 4 Neurological Perspective A basic understanding of the physiology underlying the control of voluntary movement establishes a more comprehensive appreciation and awareness
Nervous System, Neuroanatomy, Neurotransmitters
 Nervous System, Neuroanatomy, Neurotransmitters Neurons Structure of neurons Soma Dendrites Spines Axon Myelin Nodes of Ranvier Neurons Structure of neurons Axon collaterals 1 Neurons Structure of neurons
Differential modulation of intracortical inhibition in human motor cortex during selective activation of an intrinsic hand muscle
 J Physiol (2003), 550.3, pp. 933 946 DOI: 10.1113/jphysiol.2003.042606 The Physiological Society 2003 www.jphysiol.org Differential modulation of intracortical inhibition in human motor cortex during selective
General Sensory Pathways of the Trunk and Limbs
 General Sensory Pathways of the Trunk and Limbs Lecture Objectives Describe gracile and cuneate tracts and pathways for conscious proprioception, touch, pressure and vibration from the limbs and trunk.
Voluntary Movements. Lu Chen, Ph.D. MCB, UC Berkeley. Outline. Organization of the motor cortex (somatotopic) Corticospinal projection
 Corticospinal projection") Voluntary Movements Lu Chen, Ph.D. MCB, UC Berkeley 1 Outline Organization of the motor cortex (somatotopic) Corticospinal projection Physiology of motor neurons Direction representation, population coding
Voluntary Movements Lu Chen, Ph.D. MCB, UC Berkeley 1 Outline Organization of the motor cortex (somatotopic) Corticospinal projection Physiology of motor neurons Direction representation, population coding
Somatic Sensory System I. Background
 Somatic Sensory System I. Background A. Differences between somatic senses and other senses 1. Receptors are distributed throughout the body as opposed to being concentrated at small, specialized locations
Chapter 14: The Cutaneous Senses
 Chapter 14: The Cutaneous Senses Somatosensory System There are three parts Cutaneous senses - perception of touch and pain from stimulation of the skin Proprioception - ability to sense position of the
Paired Associative Plasticity in Human Motor Cortex. Behzad Elahi
 Paired Associative Plasticity in Human Motor Cortex by Behzad Elahi A thesis submitted in conformity with the requirements for the degree of Doctor of Philosophy Graduate Department of Institute of Medical
KINE 4500 Neural Control of Movement. Lecture #1:Introduction to the Neural Control of Movement. Neural control of movement
 KINE 4500 Neural Control of Movement Lecture #1:Introduction to the Neural Control of Movement Neural control of movement Kinesiology: study of movement Here we re looking at the control system, and what
Chapter 9. Nervous System
 Chapter 9 Nervous System Central Nervous System (CNS) vs. Peripheral Nervous System(PNS) CNS Brain Spinal cord PNS Peripheral nerves connecting CNS to the body Cranial nerves Spinal nerves Neurons transmit
The purpose of this systematic review is to collate evidence regarding the
 Authors: Manuela Corti, PT Carolynn Patten, PhD, PT William Triggs, MD Affiliations: From the Neural Control of Movement Lab (MC, CP, WT), Brain Rehabilitation Research Center, Malcom Randall VAMC, Gainesville,
Paired-Pulse TMS to one Brain Region. Joyce Gomes-Osman Research Fellow Berenson-Allen Center for Non-Invasive Stimulation LEASE DO NOT COPY
 Paired-Pulse TMS to one Brain Region Joyce Gomes-Osman Research Fellow Berenson-Allen Center for Non-Invasive Stimulation Paired-Pulse Paradigms Sequential pulses applied to the same cortical region Variable
Objectives Neurophysiology of brain area related to movement and motor control
 Objectives Neurophysiology of brain area related to movement and motor control 1. Ascending pathways (sensory input) 2. Sensory input treatment, and thalamo-cortical & cortico-thalamic filter 3. Sensory
Chapter 14: Integration of Nervous System Functions I. Sensation.
 Chapter 14: Integration of Nervous System Functions I. Sensation A. General Organization 1. General senses have receptors a. The somatic senses provide information about & 1. Somatic senses include: a.
INFLUENCE OF SI ON INTERHEMISPHERIC INHIBITION
 INFLUENCE OF SI ON INTERHEMISPHERIC INHIBITION INFLUENCE OF PRIMARY SOMATOSENSORY CORTEX ON INTERHEMISPHERIC INHIBITION BY CHRISTOPHER M. ZAPALLOW, B.SC. A Thesis Submitted to the School of Graduate Studies
Receptors and Neurotransmitters: It Sounds Greek to Me. Agenda. What We Know About Pain 9/7/2012
 Receptors and Neurotransmitters: It Sounds Greek to Me Cathy Carlson, PhD, RN Northern Illinois University Agenda We will be going through this lecture on basic pain physiology using analogies, mnemonics,
Making Things Happen: Simple Motor Control
 Making Things Happen: Simple Motor Control How Your Brain Works - Week 10 Prof. Jan Schnupp wschnupp@cityu.edu.hk HowYourBrainWorks.net The Story So Far In the first few lectures we introduced you to some
Neurology. Hollie Wilson
 Neurology Hollie Wilson Objectives Anatomy Physiology: Functional centres of brain UMN lesion vs. LMN lesion Spinal cord Main tracts ascending and descending Nerve roots and peripheral nerves action potentials
Chapter 11 Introduction to the Nervous System and Nervous Tissue Chapter Outline
 Chapter 11 Introduction to the Nervous System and Nervous Tissue Chapter Outline Module 11.1 Overview of the Nervous System (Figures 11.1-11.3) A. The nervous system controls our perception and experience
Human Paleoneurology and the Evolution of the Parietal Cortex
 PARIETAL LOBE The Parietal Lobes develop at about the age of 5 years. They function to give the individual perspective and to help them understand space, touch, and volume. The location of the parietal
Dendrites Receive impulse from the axon of other neurons through synaptic connection. Conduct impulse towards the cell body Axon
 Dendrites Receive impulse from the axon of other neurons through synaptic connection. Conduct impulse towards the cell body Axon Page 22 of 237 Conduct impulses away from cell body Impulses arise from
Degree of freedom problem
 KINE 4500 Neural Control of Movement Lecture #1:Introduction to the Neural Control of Movement Neural control of movement Kinesiology: study of movement Here we re looking at the control system, and what
Lecture 22: A little Neurobiology
 BIO 5099: Molecular Biology for Computer Scientists (et al) Lecture 22: A little Neurobiology http://compbio.uchsc.edu/hunter/bio5099 Larry.Hunter@uchsc.edu Nervous system development Part of the ectoderm
Neuroscience with Pharmacology 2 Functions and Mechanisms of Reflexes. Prof Richard Ribchester
 Neuroscience with Pharmacology 2 Functions and Mechanisms of Reflexes Prof Richard Ribchester René Descartes Cogito, ergo sum The 21st century still holds many challenges to Neuroscience and Pharmacology
Chapter 7. Objectives
 Chapter 7 The Nervous System: Structure and Control of Movement Objectives Discuss the general organization of the nervous system Describe the structure & function of a nerve Draw and label the pathways
Memory Systems II How Stored: Engram and LTP. Reading: BCP Chapter 25
 Memory Systems II How Stored: Engram and LTP Reading: BCP Chapter 25 Memory Systems Learning is the acquisition of new knowledge or skills. Memory is the retention of learned information. Many different
Medical Neuroscience Tutorial
 Pain Pathways Medical Neuroscience Tutorial Pain Pathways MAP TO NEUROSCIENCE CORE CONCEPTS 1 NCC1. The brain is the body's most complex organ. NCC3. Genetically determined circuits are the foundation
STRUCTURAL ORGANIZATION OF THE NERVOUS SYSTEM
 STRUCTURAL ORGANIZATION OF THE NERVOUS SYSTEM STRUCTURAL ORGANIZATION OF THE BRAIN The central nervous system (CNS), consisting of the brain and spinal cord, receives input from sensory neurons and directs
Motor Functions of Cerebral Cortex
 Motor Functions of Cerebral Cortex I: To list the functions of different cortical laminae II: To describe the four motor areas of the cerebral cortex. III: To discuss the functions and dysfunctions of
PSY 315 Lecture 11 (2/23/2011) (Motor Control) Dr. Achtman PSY 215. Lecture 11 Topic: Motor System Chapter 8, pages
 (Motor Control) Dr. Achtman PSY 215. Lecture 11 Topic: Motor System Chapter 8, pages") Corrections: No Corrections Announcements: Exam #2 next Wednesday, March 2, 2011 Monday February 28, 2011 we will be going over the somatosensory system, and there will be time left in class to review
Corrections: No Corrections Announcements: Exam #2 next Wednesday, March 2, 2011 Monday February 28, 2011 we will be going over the somatosensory system, and there will be time left in class to review
The How of Tactile Sensation
 The How of Tactile Sensation http://neuroscience.uth.tmc.edu/s2/chapter02.html Chris Cohan, Ph.D. Dept. of Pathology/Anat Sci University at Buffalo Objectives 1. Understand how sensory stimuli are encoded
PHY3111 Mid-Semester Test Study. Lecture 2: The hierarchical organisation of vision
 PHY3111 Mid-Semester Test Study Lecture 2: The hierarchical organisation of vision 1. Explain what a hierarchically organised neural system is, in terms of physiological response properties of its neurones.
Name: Period: Test Review: Chapter 2
 Name: Period: Test Review: Chapter 2 1. The function of dendrites is to A) receive incoming signals from other neurons. B) release neurotransmitters into the spatial junctions between neurons. C) coordinate
Neurophysiological Basis of TMS Workshop
 Neurophysiological Basis of TMS Workshop Programme 31st March - 3rd April 2017 Sobell Department Institute of Neurology University College London 33 Queen Square London WC1N 3BG Brought to you by 31 March
Chapter 7. The Nervous System: Structure and Control of Movement
 Chapter 7 The Nervous System: Structure and Control of Movement Objectives Discuss the general organization of the nervous system Describe the structure & function of a nerve Draw and label the pathways
Guided Reading Activities
 Name Period Chapter 28: Nervous Systems Guided Reading Activities Big idea: Nervous system structure and function Answer the following questions as you read modules 28.1 28.2: 1. Your taste receptors for
COGS 269. Lecture 1 Spring 2018
 COGS 269 Lecture 1 Spring 2018 Psychological Experience Methods of Cognitive Neuroscience Dissociation experiments (patients with brain damage) Neuroimaging experiments Computational modeling Brain damage
Nervous System. The Peripheral Nervous System Agenda Review of CNS v. PNS PNS Basics Cranial Nerves Spinal Nerves Reflexes Pathways
 Nervous System Agenda Review of CNS v. PNS PNS Basics Cranial Nerves Spinal Nerves Sensory Motor Review of CNS v. PNS Central nervous system (CNS) Brain Spinal cord Peripheral nervous system (PNS) All
Lesson 14. The Nervous System. Introduction to Life Processes - SCI 102 1
 Lesson 14 The Nervous System Introduction to Life Processes - SCI 102 1 Structures and Functions of Nerve Cells The nervous system has two principal cell types: Neurons (nerve cells) Glia The functions
HUMAN MOTOR CONTROL. Emmanuel Guigon
 HUMAN MOTOR CONTROL Emmanuel Guigon Institut des Systèmes Intelligents et de Robotique Université Pierre et Marie Curie CNRS / UMR 7222 Paris, France emmanuel.guigon@upmc.fr e.guigon.free.fr/teaching.html
The motor system. To move things is all that mankind can do whether in whispering a syllable or in felling a forest C.
 The motor system To move things is all that mankind can do whether in whispering a syllable or in felling a forest C. Sherrington 1920 Principles Components: Muscles, Spinal cord and spinal tracts, Subcortical
Bio11: The Nervous System. Body control systems. The human brain. The human brain. The Cerebrum. What parts of your brain are you using right now?
 Bio11: The Nervous System Body control systems Nervous system Quick Sends message directly to target organ Endocrine system Sends a hormone as a messenger to the target organ Can target several organs
How strong is it? What is it? Where is it? What must sensory systems encode? 9/8/2010. Spatial Coding: Receptive Fields and Tactile Discrimination
 Spatial Coding: Receptive Fields and Tactile Discrimination What must sensory systems encode? How strong is it? What is it? Where is it? When the brain wants to keep certain types of information distinct,
Spatial Coding: Receptive Fields and Tactile Discrimination
 Spatial Coding: Receptive Fields and Tactile Discrimination What must sensory systems encode? How strong is it? What is it? Where is it? When the brain wants to keep certain types of information distinct,
SOMATOSENSORY SYSTEMS: Pain and Temperature Kimberle Jacobs, Ph.D.
 SOMATOSENSORY SYSTEMS: Pain and Temperature Kimberle Jacobs, Ph.D. Sensory systems are afferent, meaning that they are carrying information from the periphery TOWARD the central nervous system. The somatosensory
Cortical Organization. Functionally, cortex is classically divided into 3 general types: 1. Primary cortex:. - receptive field:.
 Cortical Organization Functionally, cortex is classically divided into 3 general types: 1. Primary cortex:. - receptive field:. 2. Secondary cortex: located immediately adjacent to primary cortical areas,