Caspase-3 Promotes Genetic Instability and Carcinogenesis
|
|
|
- Stephen Rose
- 5 years ago
- Views:
Transcription

1 Article Caspase-3 Promotes Genetic Instability and Carcinogenesis Graphical Abstract Authors Xinjian Liu, Yujun He,..., Russell P. Hall, Chuan-Yuan Li Correspondence In Brief Activation of caspase-3 is associated with the initiation of apoptosis. Liu et al. show that mammalian cells exposed to ionizing radiation or other stresses can survive with persistent caspase-3 activation, which in turn promotes genetic instability and oncogenic transformation. Highlights d Cells exposed to ionizing radiation can survive caspase-3 activation d d d Caspase-3 activation can cause persistent DNA strand breaks in surviving cells Caspase-3 promotes skin carcinogenesis induced by DMBA+TPA treatment EndoG is a key downstream effector in causing DNA damage mediated by caspase-3 Liu et al., 2015, Molecular Cell 58, April 16, 2015 ª2015 Elsevier Inc.
2 Molecular Cell Article Caspase-3 Promotes Genetic Instability and Carcinogenesis Xinjian Liu, 1,6 Yujun He, 3,6 Fang Li, 1 Qian Huang, 4 Takamitsu A. Kato, 5 Russell P. Hall, 1 and Chuan-Yuan Li 1,2, * 1 Department of Dermatology, Duke University Medical Center, Durham, NC 27710, USA 2 Department of Pharmacology and Cancer Biology, Duke University Medical Center, Durham, NC 27710, USA 3 Department of General Surgery, Daping Hospital, Third Military Medical University, Chongqing , China 4 Cancer Center, First People s Hospital, Shanghai Jiao Tong University School of Medicine, Shanghai , China 5 Department of Environmental and Radiological Health Sciences, Colorado State University, Fort Collins, CO 80523, USA 6 Co-first author *Correspondence: chuan.li@duke.edu SUMMARY Apoptosis is typically considered an anti-oncogenic process since caspase activation can promote the elimination of genetically unstable or damaged cells. We report that a central effector of apoptosis, caspase-3, facilitates rather than suppresses chemical- and radiation-induced genetic instability and carcinogenesis. We found that a significant fraction of mammalian cells treated with ionizing radiation can survive despite caspase-3 activation. Moreover, this sublethal activation of caspase-3 promoted persistent DNA damage and oncogenic transformation. In addition, chemically induced skin carcinogenesis was significantly reduced in mice genetically deficient in caspase-3. Furthermore, attenuation of EndoG activity significantly reduced radiationinduced DNA damage and oncogenic transformation, identifying EndoG as a downstream effector of caspase-3 in this pathway. Our findings suggest that rather than acting as a broad inhibitor of carcinogenesis, caspase-3 activation may contribute to genome instability and play a pivotal role in tumor formation following damage. INTRODUCTION Apoptosis, or programmed cell death, is the most well-defined mode of cell death in multicellular organisms (Horvitz, 2003; Horvitz et al., 1994; Yuan et al., 1993). A major physiological function of apoptosis is to get rid of damaged or unwanted cells in early development or to maintain somatic tissue homeostasis at later stages. As such, it is generally assumed that apoptosis is an anticarcinogenic process due to its essential role in removing cells that have suffered DNA damage (Hanahan and Weinberg, 2000; Reed, 1999). DNA damage and subsequent mutations in key oncogenes and tumor suppressor genes is a key process leading to cancer (Lengauer et al., 1997). Therefore, the current paradigm is that apoptosis is a barrier for carcinogenesis. For example, many tumor suppressor genes mutated in cancer often have apoptosis-promoting functions. Examples of these include p53 (Lowe et al., 1994), PTEN (Weng et al., 2001), BAX (Wang et al., 1996), and INK4a/ARF (Kim et al., 2000). Mutations in these genes often allow damaged cells to survive when they should die. On the other hand, many oncogenes whose expressions are often enhanced in cancer cells possess anti-apoptotic functions. Examples of these include Bcl2 (Cory and Adams, 2002), Bcl-x L (Cory and Adams, 2002), Akt/PKB (Sabbatini and McCormick, 1999), and mtor (Panner et al., 2005). However, there is increasing recognition that the involvement of apoptosis in carcinogenesis may be more complicated. Some oncogenes appear to sensitize cells to apoptosis. For example, the apoptosis-promoting functions of c-myc and E1A are welldocumented in different studies (Debbas and White, 1993; Evan et al., 1992; Fanidi et al., 1992; Rao et al., 1992). However, the role of apoptosis in carcinogenesis induced by these genes is not well-understood. For both c-myc and E1A, their proapoptotic activities appear coupled to their hyperproliferative activities. Thus, it was suggested that apoptosis acts as a failsafe mechanism to limit the consequences of aberrant mitogenic signaling (Lowe and Lin, 2000). There was also a suggestion that oncogene-mediated excessive apoptosis might create a selection pressure to overcome apoptosis, thus allowing cancer cells to become more malignant (Lowe and Lin, 2000). However, these hypotheses have not been experimentally evaluated. Evidence is emerging that some factors in the apoptotic machinery may play facilitative roles in carcinogenesis. An example is Fas Ligand (CD95), which is a major player in mediating the extrinsic pathway of cellular apoptosis. Genetic knockout of Fas Ligand attenuated tumorigenesis in mice instead of promoting it. Fas Ligand was shown to promote carcinogenesis by activating downstream c-jun and JNK pathway (Chen et al., 2010). Fas Ligand has also been shown to promote cancer cell invasiveness and metastasis by interacting and activating c-met oncogene (Lin et al., 2012). Another recent study showed that higher levels of activated caspase-3 in head and neck cancer or breast cancer were correlated with increased post therapy tumor recurrence or patient death, contrary to conventional wisdom (Huang et al., 2011). In this study, we designed experiments to examine the counterintuitive hypothesis that caspase-3 facilitates carcinogenesis by 284 Molecular Cell 58, , April 16, 2015 ª2015 Elsevier Inc.
3 inducing genetic instability in cells that survived cytotoxic stress. We provided strong evidence that activated caspase-3 could indeed promote oncogenic transformation in human cells and in mice by inducing persistent genetic instability through its downstream effector, endonuclease G, whose normal function is to fragment genomic DNA in apoptotic cells. RESULTS Non-lethal Activation of Caspase-3 in Irradiated Cells Caspases are crucial enzymes in apoptosis through which damaged or unwanted cells systematically destroy their own infrastructure to commit suicide. Activation of caspases in cells exposed to cytotoxic stress (e.g., radiation) is usually considered an irreversible process that will result in the elimination of host cells. Thus, it has been generally assumed that all cells with apoptotic caspase activation will die. However, data in this respect are lacking for mammalian cells. We decided to carry out a detailed analysis of the relationship between caspase-3 activation and the fate of host cells, because caspase- 3 is involved at the end stage of apoptosis (Nicholson et al., 1995; Taylor et al., 2008). To do this, we used a non-invasive caspase-3 reporter recently developed in our laboratory (Figure 1A) (Huang et al., 2011; Li et al., 2010). In this reporter, the EGFP gene is fused with a firefly luciferase gene reporter through a flexible linker. The fusion protein is further linked up with a polyubiquitin domain, which renders the fusion reporter protein very unstable because it is recognized by the proteasome system as an ubiquitylated protein and rapidly degraded. In between the EGFP-luc and polyubiquitin domains, a caspase-3 cleavage site is inserted. Under normal circumstances steady-state reporter protein levels will be very low in host cells. However, when caspase-3 is activated, the polyubiquitin domain will be cleaved off and the EGFP-Luc fusion protein will be stabilized. To study the fate of cells with caspase-3 activation, we transduced the Casp3EGFP-Luc reporter gene into the MCF10A human mammary epithelial cells. We then subjected the cells to a moderate dose (0.5 grays [Gy]) of high energy (600 million electron volts per micrometer [MeV/m]) 56 Fe ion irradiation. High energy particle radiation has been shown to be more potent in inducing DNA damage and carcinogenesis compared with lower energy radiation (X-rays and g-rays) (Durante and Cucinotta, 2008). We show that radiation-induced significant caspase-3 reporter activation in a persistent manner, with some cells expressing high EGFP at 2 weeks post irradiation. To characterize reporter activation, the irradiated cells were sorted by use of fluorescence-activated cell sorting (FACS) according to their cellular GFP levels. Those with high GFP expression were separated from those with low GFP expression (Figure 1B). Interestingly, many cells with high EGFP levels appeared normal morphologically. This was despite robust cleaved caspase-3 cleavage and cytochrome C release status in irradiated cells in general (Figure S1A; see Table S1 for a list of antibodies used in this study) and in cells with high EGFP levels (Figure 1C). Those data, therefore, contradict with the currently established view that damaged cells with caspase-3 activation are destined to die. We further carried out experiments to observe the growth of the cells with high Casp3EGFP reporter activities. Our data suggest that both the EGFP-hi and EGFP-low groups of cells maintained continuous cellular growth and irradiated cells with high or low GFP expression grew only slightly slower than untreated parental cells (Figure S1B). Because caspase-3 activation is often accompanied by cytochrome C leakage in apoptotic cells, we carried out immunofluorescence analysis of cytochrome C in parental and Casp3EGFP-high cells. Our data (Figures S1C and S1D) showed that many irradiated GFP-hi cells showed a distinct cytochrome C staining pattern with a small, but significant, percentage of cytochrome C located in the extra-mitochondrial regions (Figure S1C, lower panels). In contrast, the vast majority of non-irradiated cells showed only mitochondrial cytochrome C staining (Figure S1C, top panels). Quantitatively, the percentage of GFP-hi cells with the leaky extra-mitochondrial cytochrome C staining pattern was about 23% at 14 days after irradiation. This is compared with about 0.5% with the leaky pattern in the non-irradiated cells (Figure S1D). The persistence of cells with cytochrome C leakage suggests that the leakage was at levels that did not lead to cell death. An analysis of mitochondrial membrane potential by use of the tetramethylrhodamine, ethyl ester (TMRE)-flow cytometry assay (Figure S1E) indicated that compared with parental MCF10A cells, those with high Casp3EGFP reporter activities showed higher degrees of mitochondrial membrane depolarization, indicating persistent and incomplete mitochondrial membrane leakage. Those data were also consistent with the leaky cytochrome C pattern shown in Figures S1C and S1D. To further characterize the fate of individual cells with caspase-3 activation, MCF10A cells transduced with caspase-3 reporters were irradiated with different doses of radiation and analyzed through flow cytometry (Figure 1D). The cells were then sorted through eight different ranges according to caspase-3 reporter activation levels (Figures 1D and 1E). Higher radiation doses increased the fraction of cells with higher levels of caspase-3 activation (Figures 1D and 1F). Cells from different ranges were then sorted one cell/well into different wells of 96-well plates. EGFP expression in the wells was further confirmed though fluorescence microscopy (data not shown). All the individual wells examined showed positive identification of one cell/well. In addition, EGFP expression was seen clearly in cells from M4 M8 ranges. Colony formation from the individually plated cells with different GFP expression status (M1 M8) was then analyzed after 2 weeks in the 96-well plates. As expected, there was a clear radiation dose-dependent decrease in colony forming abilities (Figure 1G). However, the relationship between caspase-3 activation and colony forming abilities was more complicated. It appeared that cells could tolerate a wide range of caspase-3 activation levels (Figure 1G, M1 M4), especially at lower doses of radiation. At a moderate radiation dose (3Gy), the relationship between caspase-3 activation and clonogenic survival become linear, with M4 as the threshold. At higher levels (>3Gy), most of the cells could not form colonies irrespective of caspase-3 reporter activities, consistent with the ability of radiation to kill cells in an apoptosis-independent manner. Our data thus clearly established that radiation could activate caspase-3 in a non-lethal manner at moderate radiation doses (%6 Gy). Molecular Cell 58, , April 16, 2015 ª2015 Elsevier Inc. 285
 9, a nine-ubiquitin polyubiqutin domain that serves as the proteasome recognition signal that causes the rapid degradation of the reporter protein, which consists of EGFP and firefly luciferase")
 MCF10A cells with low (top panels) and high (lower panels) caspase-3 reporter activities after separation by a FACS sorter based on Luc-GFP expression levels 7 days after")

.")
4 A B C D E F G Figure 1. Non-lethal Activation of Caspase-3 in MCF10A Cells Exposed to Ionizing Radiation (A) Diagram of the caspase-3 reporter gene. (Ub) 9, a nine-ubiquitin polyubiqutin domain that serves as the proteasome recognition signal that causes the rapid degradation of the reporter protein, which consists of EGFP and firefly luciferase linked by a flexible linker. (B) Irradiated (0.5 Gy 600 MeV 56 Fe ions) MCF10A cells with low (top panels) and high (lower panels) caspase-3 reporter activities after separation by a FACS sorter based on Luc-GFP expression levels 7 days after cellular exposure to radiation. (C) Western blot analysis of caspase-3 cleavage and activation in cells with high and low Casp3EGFP reporter activities 14 days after irradiation. Cytochrome C was probed using cytosolic extracts, while other proteins were probed with whole cell lysates. (D) Flow cytometry profiles of MCF10A-CASP3EGFP reporter activities in cells exposed to different doses of X-rays. Cells were analyzed 4 days after irradiation. Cells were ranged into eight different groups for colony forming assays according to their fluorescence intensity levels (M1 M8). (E) The mean (geometric) GFP fluorescence intensities of ranged MCF10A cells. (F) Distribution of MCF10A cells in each range after different irradiation doses. For each radiation dose, M1+M2+.+M8 = 100%. (G) Colony forming abilities of cells with different Casp3EGFP reporter activities. Cells from varying levels of reporter activities (M1 M8) were flow-sorted into individual wells of 96-well plates at one cell/well. At two weeks later, the numbers of MCF10A colonies on each 96-well plate were counted and plotted. Error bars in (E) (G) represent SD. All values are derived from the average of three independent experiments. See also Figure S Molecular Cell 58, , April 16, 2015 ª2015 Elsevier Inc.
 MCF10A cells. (B) The average number of gh2ax foci in Casp3 reporter-transduced MCF10A cells 14 days after being exposed to 0.5 Gy of 56 Fe ions.")

 or control (shcontrol) were evaluated for gh2ax foci formation at 10 days after 0.5 Gy or sham irradiation.")
 were evaluated for gh2ax foci formation with sham or 0.")
5 A B C E F D Figure 2. A Key Role for Activated Caspase-3 in Radiation-Induced Foci Formation (A) Typical micrographs of gh2ax foci in non-irradiated (0 Gy) and irradiated (0.5 Gy 56 Fe ions) MCF10A cells. (B) The average number of gh2ax foci in Casp3 reporter-transduced MCF10A cells 14 days after being exposed to 0.5 Gy of 56 Fe ions. The left two bars show the numbers for non-irradiated versus 0.5 Gy irradiated cells, while the right two bars show the numbers for irradiated MCF10A cells with high and low caspase-3 reporter activities based on GFP expression levels. (C) The effect of caspase-3 expression attenuation on gh2ax foci formation. MCF10A cells transduced with an shrna gene against the CASP3 gene (shcasp3) or control (shcontrol) were evaluated for gh2ax foci formation at 10 days after 0.5 Gy or sham irradiation. (D) The effect of caspase-3 inhibition on radiation-induced gh2ax foci formation in MCF10A cells. Cells transduced with a control lentiviral vector or those transduced with a dominant negative caspase-3 gene (CASP3DN) were evaluated for gh2ax foci formation with sham or 0.5 Gy of irradiation at 14 days after irradiation. (E) Typical micrographs of gh2ax foci in non-irradiated (0 Gy) and irradiated (3 Gy X-rays) MEF cells at 4 days after exposure. (F) The numbers of gh2ax foci in irradiated caspase-3 deficiency MEFs were significantly lower than those of caspase-3 proficiency MEFs at 4 days after irradiation. Error bars in (B) (D) and (F) represent SEM. All values are derived from the average of three independent experiments. See also Figures S1 S3. A Key Facilitative Role of Caspase-3 in Radiation- Induced DNA Damage Foci Formation in Surviving Cells Our observation of non-lethal caspase-3 activation in MCF10A cells points to an important question: what happens to the genome of the cells that survive caspase-3 activation?. This question is important since caspase-3 activation in those cells could lead to downstream nuclease activation and DNA fragmentation, similar to what occurs in apoptotic cells, which can potentially wreak havoc in the genomes of cells experiencing abortive apoptosis. To answer this question, we carried out experiments to examine DNA damage in cells that have survived caspase-3 activation. Our data show that radiation exposure induced significantly higher levels of gh2ax foci, an indication of DNA double strand breaks (DSBs) (Rogakou et al., 1998), when compared with sham-irradiated cells (Figures 2A and 2B, left side) at 14 days after irradiation. There was a dose-dependent increase in the number of gh2ax foci in irradiated cells (Figure S1F). Furthermore, cells with higher levels of Casp3EGFP reporter activation had significantly more gh2ax foci, when compared with those with low levels of reporter activation (Figure 2B, right side). Importantly, higher numbers of gh2ax foci persist in the irradiated MCF10A cells for more than three months (Figure S1G). To determine if activation of caspase-3 plays a causative role in the observed DNA strand breaks, we established MCF10A Molecular Cell 58, , April 16, 2015 ª2015 Elsevier Inc. 287
6 cells that express a small hairpin RNA (shrna) gene against the caspase-3 gene (see Figure S2A, top panels for confirmation of knockdown). In those cells, the numbers of gh2ax foci were significantly reduced after exposure to 56 Fe ions radiation when compared with those transduced with a control shrna gene (Figure 2C). The causative role of caspases-3 was further confirmed by use of MCF10A cells transduced with a dominant-negative version of caspase-3 (Casp3DN, Figure S2A, lower panels). The dominantnegative version of the caspase-3 has one single-base pair mutation that inactivates its cleavage activity (Stennicke and Salvesen, 1997). As shown in Figure 2D, the number of gh2ax foci was significantly lower in irradiated MCF10A cells expressing Casp3DN at 14 days after irradiation. In addition to the above data implicating caspase-3 in mediating radiation-induced DNA damage in human cells, we also examined radiation-induced gh2ax foci formation using wildtype (WT) and Casp3KO mouse embryonic fibroblast (MEF) cells. We observed significantly more attenuated radiation-induced foci formation in Casp3KO, than in WT MEF cells (Figures 2E and 2F). Thus, our data support a key role for caspase-3 in mediating radiation-induced gh2ax foci formation in murine cells as well. Previous studies have shown that caspase-3 and caspase-7 share a similar cleavage site, but are functionally distinct in their influences on host mice when each was genetically ablated (Lakhani et al., 2006; Walsh et al., 2008). In order to compare the relative contribution of caspase-3 and caspase-7, we also examined gh2ax foci formation in WT, Casp3KO, Casp7KO, and caspase-3 and caspase-7 double knockout (DKO) cells (Figure S2B). Our data show that Casp3 knockout had a more pronounced effect than Casp7 knockout. In addition, DKO cells did not exhibit less radiation-induced DNA damage than caspase-3 knockout cells alone, indicating that caspase-3 and caspase-7 have mostly overlapping functions in terms of DNA damage, with caspase-3 playing a much more dominant role. We next examined dynamic 53BP1 foci formation in irradiated cells. 53BP1 is a protein shown to be actively involved in DSB repair (Dimitrova et al., 2008; Wang et al., 2002). It forms foci with many other DNA DSB repair proteins such as gh2ax at sites of DSBs. Using a non-invasive red fluorescent protein (mcherry) based 53BP1 foci reporter (Dimitrova et al., 2008), we monitored 53BP1 foci formation in the nuclei of irradiated WT and Casp3- deficeint MEF cells. Our results show a significantly higher fraction of cells with 53BP1 foci in irradiated WT MEF cells when compared with sham irradiated controls (Figures S2C and S2D). In addition, deficiency in caspase-3 caused a significant reduction in 53BP1 foci (Figure S2D), similar to gh2ax foci. By time-lapse video, we were also able to observe dynamic and persistent 53BP1 foci formation in irradiated MCF10A cells and their progeny (Figure S2E). Another important question is whether the observed caspase- 3-dependent foci formation requires initial cellular exposure to ionizing radiation. In order to examine this issue, we transduced an artificially inducible, dimerizable Casp3 gene (icasp3) into MCF10A cells. The icasp3 gene is engineered by fusing caspase-3 gene with FK506-binding sites (FKBPs) so that the engineered icasp3 protein can dimerize and be activated when exposed to an FK506 analog in the absence of upstream apoptotic signaling (Fujioka et al., 2011; MacCorkle et al., 1998). We show that the addition of the chemical dimerizer (AP20187, an FK506 analog) was sufficient to induce caspase-3 activation and gh2ax foci formation (Figures S3A S3C). These results indicate that caspase-3 activation alone is sufficient to induce DNA damage in host cells. In another experiment, we evaluated gh2ax foci formation in WT and Casp3KO MEF cells exposed to staurosporine, an apoptosis inducer not known to cause direct DNA damage like ionizing radiation. Our results showed that staurosporine was able to induce gh2ax foci formation 3 days after WT MEF cells were exposed to it. However, the induction was almost abolished in Casp3KO cells (Figures S3D and S3E). These results provide further support for activated caspase-3 in inducing DNA damage. Evidence for Involvement of Caspase-3 in Radiation-Induced Persistent DNA Strand Breaks as Determined by Use of the Comet Assay We next determined the roles of caspase-3 in radiation-induced persistent DNA damage in MCF10A cells using the comet assay, another approach to measure DNA strand breaks (Olive et al., 1990; Ostling and Johanson, 1984; Singh et al., 1988). Our experiments show that in MCF10A cells exposed to 56 Fe ions irradiation, the comet tails of the cells whose sizes reflect the extent of DNA damage in host cells, were significantly bigger than those of the control cells at 14 days after irradiation (Figures 3A and 3B), indicating significantly higher levels of persistent DNA strand breaks in the irradiated cells. Furthermore, those cells with higher levels of caspase-3 activities possessed significantly larger DNA tails when examined by use of the comet assay (Figure 3B). In MCF10A cells transduced with an shrna gene against caspase-3, comet assay analyses detected significantly reduced levels of radiation-induced DNA damage when compared with WT cells at 10 days after irradiation (Figure 3C). Similar results were also obtained with cells transduced with CASP3DN (Figure 3D). Thus, results obtained with comet assay are very consistent with results obtained with the gh2ax assay (Figure 2). In addition to immortalized MCF10A cells, we examined the roles of caspase-3 in 56 Fe ions radiation-induced comet tails in IMR90 cells, a primary human fibroblast cell strain. Our data show that caspase-3 attenuation significantly downregulated radiation-induced DNA damage in terms of comet assays in those cells as well (Figure 3E). The role of caspase-3 in radiationinduced DNA damage in IMR90 cells was further examined by use of the gh2ax foci assay (Figure S3F) and chromosome aberration assay (Figure S3G). Our results show that shrna against caspase-3 (shcasp3)-mediated caspase-3 attenuation reduced 56 Fe ions induced DNA damage in both assays in IMR90 cells. We also carried out experiments to determine if the p53 protein, the guardian of the genome, plays any role in radiationinduced, persistent DNA damage as measured by gh2ax foci formation. We show that in MCF10A cells, radiation-induced p53 and its downstream p21 protein expression at 24 hr post exposure, similar to IMR90 cells (Figure S4A). By 10 days post irradiation, both p53 and p21 expression mostly went back to 288 Molecular Cell 58, , April 16, 2015 ª2015 Elsevier Inc.
 Typical examples of control and irradiated cells when run through electrophoresis during the comet assay.")

7 A B C D E Figure 3. A Key Role for Caspase-3 in Radiation-Induced DNA Damage as Determined by the Comet Assay (A) Typical examples of control and irradiated cells when run through electrophoresis during the comet assay. (B) The fraction of DNA in the comet tail in caspase-3 reporter-transduced MCF10A cells exposed to 0.5 Gy of 56 Fe ions 14 days after 56 Fe ions irradiation. The left two bars show fractions for non-irradiated versus 0.5 Gy irradiated cells, while the right two bars show the fractions for irradiated MCF10A cells with high and low caspase-3 reporter activities based on GFP expression levels. (C) The effect of caspase-3 expression attenuation on the fraction of DNA in the comet tails. MCF10A cells transduced with an shcasp3 or control (shcontrol) were evaluated for the fraction of DNA in the comet tails at 10 days after 0.5 Gy or sham irradiation. (D) The effect of caspase-3 inhibition on radiation-induced DNA strand breaks as quantified by the amount of cellular DNA in the comet tail in MCF10A cells. Cells transduced with a control lentiviral vector or those transduced with a dominant-negative caspase-3 gene (CASP3DN) were evaluated for the amount of DNA in the comet tails with sham or 0.5 Gy of irradiation at 14 days after irradiation. (E) The effect of caspase-3 attenuation on the fraction of DNA in the comet tails in IMR90 cells. IMR90 cells transduced with an shcasp3 or control (shcontrol) were evaluated for the fraction of DNA in the comet tails at 10 days after 0.5 Gy or sham irradiation. Error bars in (B) (E) represent SD. All values are derived from the average of three different samples within one experimental group. For each group, at least 50 cells from randomly chosen fields were scored by use of the Image J software (NIH) for DNA distribution. A two-sided Student s t test was used to calculate the p values. See also Figures S3 and S4. control levels (Figure S4A). In MCF10A cells transduced with TP53DN, a dominant-negative version of TP53 (Kendall et al., 2005), radiation-induced p21 induction is significantly reduced compared with parental MCF10 cells. However, when gh2ax foci formation was quantified in these cells at different time points post irradiation, we showed that no statistical difference exists between these two cell populations (Figure S4B), indicating the p53 did not play a significant role. Evidence Implicating an Important Role for Caspase-3 Activation in Radiation Induced Chromosome Aberrations We conducted chromosome aberration analyses to further determine the roles of caspase-3 in radiation-induced chromosome instability. Chromosome instability is key characteristic of cancer cells (Lengauer et al., 1997, 1998). We carried out chromosome aberration analysis in MCF10A cells. Our results show that inhibition of caspase-3 by use of CASP3DN significantly reduced radiation-induced chromosomal aberrations in MCF10A cells (Figures 4A and S4C S4F; Table S2). We also assessed radiation-induced chromosome aberrations in vivo in WT or Casp3 deficient (Casp3KO) C57BL/6 mice (Kuida et al., 1996). Radiation-induced a significant amount of chromosome aberrations in both WT and Casp3KO bone marrow cells (Figure 4B; also see Table S3). On the other hand, bone marrow cells in the caspase-3 knockout mice showed significantly less chromosome aberration after exposure to radiation when compared with WT mice. Molecular Cell 58, , April 16, 2015 ª2015 Elsevier Inc. 289
 were evaluated for chromosome aberrations with sham or 0.")
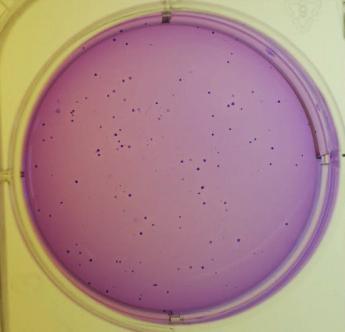
8 A C D Figure 4. A Key Role for Caspase-3 Activities in Radiation-Induced Chromosome Aberrations (A) The effect of caspase-3 inhibition on radiationinduced chromosome aberrations in MCF10A B E cells. Cells transduced with a control lentiviral vector or a dominant-negative caspase-3 gene (CASP3DN) were evaluated for chromosome aberrations with sham or 0.5 Gy of 600 MeV 56 Fe ions irradiation at 14 days after irradiation. (B) Radiation-induced chromosome aberrations in WT or CASP3 gene knockout (CASP3KO) C57BL/6 mice. Results were obtained from bone marrow cells harvested from irradiated mice 3 days after 3 Gy X-ray irradiation. (C) Whole chromosome painting results for chromosomes 1 (FITC) and 2 (rhodamine). A cellular chromosome spread showing a translocation of part of chromosome 2 (arrow in red) in irradiated WT C57BL/6 mice. (D) Quantitative summary of radiation-induced chromosome 1 and 2 translocations in WT or CASP3 gene knockout (CASP3KO) C57BL/6 mice. Results were obtained from bone marrow cells harvested from irradiated mice 3 days after. No translocations were identified in cells from either WT or CASP3KO mice without irradiation. (E) Radiation-induced chromosomal aberrations in WT, Casp3KO, Casp7KO, and Casp3KOCasp7KO (DKO) mouse embryonic fibroblast cells 5 days post irradiation. Error bars in (A), (B), (D), and (E) represent SD. All values are derived from the average of three separate experiments. In each experiment, 150 cells for each cell type were counted without knowledge of the cell types to enumerate chromosome aberrations. A two-tailed Student s t test was used to calculate the p values. See also Figure S4 and Tables S2 and S3. In additional experiments, we examined radiation-induced chromosome translocations in mouse bone marrow cells by use of whole chromosome painting to evaluate the frequencies of chromosomes 1 and 2 translocations. Bone marrow cells in the caspase-3 knockout mice showed significantly less chromosome 1 and 2 translocations after exposure to radiation when compared with WT mice (Figures 4C and 4D). In further experiments, we examined the relative contribution of caspase-3 and caspase-7 in radiation-induced chromosome aberrations by use of mouse embryonic fibroblasts from WT, Casp3KO, and Casp7KO cells. Our results (Figure 4E) show that both Casp3KO and Casp7KO cells exhibit significantly reduced, radiation-induced chromosome aberrations with caspase-3 playing a more prominent role. On the other hand, the caspase-3 and caspase-7 DKO MEF cells did not show additional reduction in chromosome aberrations, indicating that Casp3 plays a more dominant role in facilitating radiationinduced chromosome aberrations. Caspase-3 Plays a Facilitating Role in Oncogenic Transformation of MCF10A Cells Induced by Ionizing Radiation Our results so far clearly established a causative role for caspase- 3 in radiation-induced genetic instability at both the DNA and chromosome levels. We next explored the relationship between non-lethal caspase-3 activation and oncogenic transformation because genetic instability has been closely linked with carcinogenesis. We first use FACS to sort out cells with low or high caspase-3 activities. About 20% of the cells showed significantly increased caspase-3 reporter activities after 0.5 Gy 600 MeV 56 Fe ions irradiation (data not shown). Those cells were then cultured for 2 weeks and then plated into soft agar. The ability to grow in an anchorage-independent manner in soft agar is a hallmark of transformed cells (Cifone and Fidler, 1980; Weinberg, 2007). Our data show that MCF10A cells exposed to 56 Fe ions readily formed colonies in soft agar (Figures 5A 5C, also see S5A S5C for actual photos of soft agar colonies). Interestingly, those with high Casp3EGFP activities formed soft agar colonies at significantly higher frequencies than those with low Casp3EGFP caspase-3 activities (Figure 5A). Those data suggest that higher caspase-3 activities correlated with significantly higher frequencies of oncogenic transformation despite minimal effect of caspase-3 activation on the proliferation of the cells in culture (Figure S1B). We further examined if a causative relationship exists between caspase-3 activation and soft agar growth in irradiated MCF10A cells by use of shcasp3 and casp3dn to block caspase-3 activities. We observed significantly lower rates of soft agar colony formation in irradiated MCF10A-shCASP3 cells (Figure 5B). In further experiments, we showed that cells with Casp3DN expression also had less radiation-induced soft agar colony formation (Figure 5C). Our results thus confirmed a significant facilitative role for capases-3 in radiation-induced oncogenic transformation of MCF10A cells. We further attempted to confirm the tumorigenic nature of the irradiated cells in nude mice. Non-irradiated parental MCF10A cells did not form any tumors in nude mice (0/10) 12 weeks post subcutaneous injection into nude nice. On the other hand, irradiated (0.5 Gy 56 Fe ions) MCF10A cells readily formed tumors in nude mice (Figures 5D 5F). In fact, six out of ten mice injected with irradiated MCF10A cells formed tumors (Figure 5G). In contrast, neither control nor irradiated MCF10A-shCASP3 or MCF10A-CaspDN cells formed any tumors (0/10 for each of the two experimental 290 Molecular Cell 58, , April 16, 2015 ª2015 Elsevier Inc.
 Soft agar colony formation in MCF10A cells with high and low caspase-3 reporter activities.")
 The effects of shcasp3 gene expression on soft agar colony formation in irradiated MCF10A cells.")
 (C).")
9 A B C D E F G Figure 5. A Facilitative Role for Caspase-3 in Radiation-Induced Oncogenic Transformation of MCF10A Cells (A) Soft agar colony formation in MCF10A cells with high and low caspase-3 reporter activities. Irradiated (0.5 Gy of 600 MeV 56 Fe ions) cells were sorted for high and low caspase-3 reporter expression by use of an FACS sorter. They were then cultured for 14 days and seeded in soft agar plates. (B) The effects of shcasp3 gene expression on soft agar colony formation in irradiated MCF10A cells. (C) The effects of dominant-negative caspase-3 (CASP3DN) expression on soft agar colony formation ability of irradiated MCF10A cells. Error bars in (A) (C) represent SEM. All values are derived from the average of three independent experiments. Student s t test was used to calculate the p values in (A) (C). (D) A xenograft tumor in nude mice after 5 weeks inoculation of irradiated MCF10A cells (indicated by arrow in red). (E) H&E staining of tissues derived from a xenograft tumor formed from irradiated MCF10A cells in nude mice. The right panel shows an amplified image of part of the left panel. (F) Tumorigenic abilities of different MCF10A cells. Only the WT MCF10A cells irradiated with 0.5 Gy can form tumors in nude mice. For each group of tumor cells, ten mice were used. (G) Tumor growth kinetics from each of the ten mice injected with the WT MCF10A cells irradiated with 0.5 Gy of 56 Fe ions. There were six out of ten mice that showed tumor growth. See also Figure S5. groups, Figure 5F). Similar results were also obtained for MCF10A-CASP3DN cells. None of the mice injected with either non-irradiated or irradiated cells formed any tumors in 12 weeks of observation (0/10 for each group, Figure 5F). These data indicate that caspase-3 activities are required for tumorigenicity in 56 Fe ions irradiated MCF10A cells. Significantly Reduced Skin Carcinogenesis in Casp3 ( / ) Mice after Two-Stage Chemical Carcinogenesis We further conducted chemically induced carcinogenesis experiments in WT and caspase-3 deficient (Casp3 [ / ]) C57BL/6 mice. We used a long established 7,12-Dimethylbenz(a)anthracene (DMBA) + 12-O-tetradecanoyphobol-13-acetate (TPA) Molecular Cell 58, , April 16, 2015 ª2015 Elsevier Inc. 291
 C57BL/6 Mice (A) Activated caspase-3 in DMBA+TPA treated pre-malignant mouse skin.")
 Photographs representative of skin tumor formation in WT and Casp3 ( / ) C57BL/6 mice at 20 weeks after the initiation of two-stage chemical treatment.")
 Average number of tumors per mouse in DMBA+TPA treated WT and Casp3 ( / ) mice at 20 weeks after initiation of chemical treatment.")
10 A C B D E F Figure 6. A Facilitative Role for Caspase-3 in Two-Stage Chemically Induced Skin Carcinogenesis in WT and Casp3 ( / ) C57BL/6 Mice (A) Activated caspase-3 in DMBA+TPA treated pre-malignant mouse skin. Scale bars, 50 mm. (B) Quantitative measurement of caspase-3 activation in DMBA+TPA treated C57BL/6 mouse skin. Error bars show SD (n = 3). (C) Photographs representative of skin tumor formation in WT and Casp3 ( / ) C57BL/6 mice at 20 weeks after the initiation of two-stage chemical treatment. (D) Tumor incidence in DMBA+TPA treated WT (n = 23) and Casp3 ( / ) (n = 26) mice; p < and log rank test. (E) Average number of tumors per mouse in DMBA+TPA treated WT and Casp3 ( / ) mice at 20 weeks after initiation of chemical treatment. The difference between the two groups is statistically significant (p < and two-sided ANOVA test). (F) Average tumor volume per mouse during the course of two-stage chemical induction. For each mouse, tumor burden represents the aggregate of all tumors in the mouse. The difference between the two groups is statistically significant (p < and two-sided ANOVA test). Error bars in (E) and (F) represent SEM. See also Figures S5 and S6. two-stage carcinogenesis protocol following published procedures (Abel et al., 2009). In our induction regimen, an initial application of DMBA was followed by 20 weeks of TPA administration. When the skins from C57/BL6 mice that were treated with DMBA+TPA were analyzed for caspase-3 activation, we observed a gradual increase in caspase-3 activation that peaked at around 3 weeks post treatment and attenuated afterward (Figures 6A and 6B). In WT mice, DMBA+TPA induced numerous tumors, as expected. Tumor incidence was significantly earlier and higher in WT mice than in Casp3 ( / ) mice (Figures 6C and 6D). In addition, in Casp3-knockout (Casp3 / ) mice, the numbers of chemically induced tumors were significantly reduced (Figure 6E). Furthermore, the aggregate tumor sizes in WT mice were significantly larger than those in the Casp3 ( / ) mice (Figure 6F). Figure S5D shows typical H&E staining of two tumor sections from WT and Casp3 ( / ) mice, respectively. A careful analysis further reveals that there were clear sex differences in DMBA+TPA tumor induction in WT and Casp3KO (knockout or / ) mice (Figures S6A S6C). Female mice appeared to be more susceptible to DMBA+TPA induced tumors. In both sexes, caspase-3 knockout caused profound reductions in tumorigenesis. However, female mice showed earlier and higher tumor incidence (Figure S6A), higher numbers of tumors per mouse (Figure S6B), and bigger tumor sizes (Figure S6C) in WT as well as Casp3KO mice. We further compared the role of caspase-7 with that of caspase-3 in DMBA+TPA induced carcinogenesis. Our data suggest that Casp7 knockout also led to significantly attenuated 292 Molecular Cell 58, , April 16, 2015 ª2015 Elsevier Inc.
11 carcinogenesis (Figures S6D S6F). However, compared to caspase-3, knocking out caspase-7 had a more moderate effect in terms of attenuating DMBA+TPA induced carcinogenesis, a result consistent with results from radiation-induced DNA damage experiments obtained with Casp7 / mouse embryonic fibroblasts (Figures S2B and 4E). Endonuclease G as a Major Downstream Effector of Caspase-3-Mediated DNA Strand Breaks We next attempted to determine the factors downstream of caspase-3 that are responsible for generating DNA damage in cells with non-lethal activation of caspases 3. We focused our attention on Endonuclease G (EndoG), because it normally resides within the mitochondria and can migrate into the nucleus to fragment nuclear DNA in the event of caspase-3 activation (Li et al., 2001; Parrish et al., 2001). We first examined EndoG distribution through immunofluorescence staining. Our data indicated that most of the non-irradiated cells exhibited faint staining in the cytoplasmic region, with a small fraction showing nuclear staining. Cytoplasmic EndoG were localized mostly in the perinuclear regions that correlated with mitochrondria staining (Figure 7A, top panels), consistent with published literature. In irradiated cells, there is a significant increase in the fraction of cells with nuclear EndoG staining (Figure 7A, lower panels), consistent with EndoG movement from the mitochondria into the nucleus. Caspase-3 activity appears to be a major regulator of EndoG s cytoplasmic to nuclear movement as attenuation of Casp3 through either Casp3DN or shcasp3 expression in irradiated MCF10A cells significantly reduced the fraction of cells with nuclear EndoG staining (Figure 7B). Additional data using MEF cells with Casp3 gene knockout further confirmed the role of caspase-3 in mediating radiation-induced nuclear migration of EndoG (Figures S7A and S7B). Importantly, when DMBA+TPA induced skin tumors were analyzed; tumor tissues showed significantly more nuclear EndoG staining than adjacent normal skin tissue. In comparison, nuclear migration was significantly reduced in tumors induced in Casp3 / mice (Figures S7C and S7D), consistent with the hypothesis that EndoG nuclear migration was involved in DMBA+TPA induced carcinogenesis. We also carried western blot analysis of EndoG location in MCF10A cell before and after irradiation (Figure 7C). Our results indicate that radiation-induced a clear migration of EndoG to the cytoplasm as well as the nucleus. However, downregulation of caspase-3 activity through Casp3DN or shcasp3 expression significantly reduced the migration. In further analysis, we show that irradiated cells with nuclear EndoG staining contained significantly higher proportion of cells with gh2ax foci (45%) when compared with those without nuclear EndoG staining (5%, Figures 7D and 7E) at 10 days after irradiation, consistent with an important role for EndoG in inducing persistent DNA strand breaks. In additional experiments, we examined whether EndoG was required for radiation-induced persistent genetic instability by use of MCF10A cells stably transduced with ENDOG targeted shrnas (Figure S7E). Our results indicated that attenuation of EndoG expression significantly lowered the fraction of cells with persistent gh2ax foci among irradiated MCF10A cells (Figure 7F), thereby establishing EndoG as the key downstream effector of caspase-3 in causing DNA damage. Comet assay showed reduced DNA strand breaks in irradiated MCF10A cells with ENDOG knockdown (Figure 7G). These results were further supported by chromosome aberration analyses of MCF10A cells with shrna knockdown (Figure 7H; Table S2). Finally, we show that ENDOG knockdown also reduced the number of radiationinduced soft agar colonies from the MCF10A cells (Figure 7I). The results of downregulating EndoG were demonstrated with three independent shrnas against ENDOG (Figures S7E S7G), suggesting that they were not likely from off-target effects. DISCUSSION Apoptosis and factors involved in the apoptotic machinery are generally considered tumor suppressive (Hanahan and Weinberg, 2011). However, the absence of mutations in the apoptosis inducing factors (Casp3, Casp9, or APAF) in patient-derived tumor samples suggests that these factors are not major obstacles for carcinogenesis in mammalian cells. The most striking aspect of the present study is that our results demonstrate that caspase-3 can play an active role in promoting genetic instability and carcinogenesis. How do we reconcile the fact that most previous studies support the notion of apoptosis-inducing factors being tumor suppressive with our finding that caspase-3 activation promotes carcinogenesis? To really understand these conflicting results, we need to reexamine the fundamental premise of the apoptosis-tumor suppressive hypothesis. At first glance it is a very straightforward scenario: cells are exposed to stress and activate the apoptosis program, they die, and get scavenged. The whole process should be anti-oncogenic because there is no inflammation and no-leftover DNA damage. While this scenario is certainly true for cells that do die, an implied, but critical, assumption is that all cells that initiate the apoptotic process will die. While it is a reasonable assumption, it has not been carefully examined except in C. elegans. It was shown that some C. elegans cells with caspase activation can actually survive, if they are not engulfed by surrounding cells (Hoeppner et al., 2001; Reddien et al., 2001). In addition, previous studies have unveiled non-apoptotic roles of caspase-3 and its downstream caspase-dependent DNase (CAD) in muscle differentiation (Fernando et al., 2002; Larsen et al., 2010). In the present study, we show clear evidence that many irradiated mammalian cells with caspase-3 activation can survive. It is in these surviving cells with caspase-3 activation that one sees significantly elevated levels of genetic instability and oncogenic transformation. Our results are consistent with a recent report that indicates treatment of glioma or MEF cells with TRAIL or FasL, an apoptosis-inducing agent, causes increased DNA damage and mutagenesis that is caspase-8-dependent (Lovric and Hawkins, 2010). It is also consistent with another study, which shows that prolonged mitotic arrest triggers partial caspase activation that causes increased DNA damage (Orth et al., 2012). In conclusion, in this study we find that many cells can survive caspase-3 activation after exposure to ionizing radiation. We further reveal a surprising and unconventional function for caspase-3 in mammalian cells exposed to radiation: causing and sustaining DNA damage and facilitating oncogenic transformation. Molecular Cell 58, , April 16, 2015 ª2015 Elsevier Inc. 293
 Immunofluorescence co-staining of EndoG (green) and mitochondria")
 Effect of caspase-3 inhibition (through CASP3DN or shcasp3 expression) on radiation-induced EndoG migration from cytoplasmic to nuclear locations.")
, and b-actin were used as mitochondria, nuclear, and cytoplasmic loading controls, respectively.")
 Fraction of cells with gh2ax foci among cells with EndoG staining in the cytoplasm only or those in both the cytoplasm and nucleus.")
12 A B C D E F G H I Figure 7. A Significant Role for EndoG as a Downstream Factor of Caspase-3 in Mediating Radiation-Induced DNA Damage and Transformation (A) Immunofluorescence co-staining of EndoG (green) and mitochondria (red) in control (top panels) and irradiated (lower panels) MCF10A cells. Insets, DAPI staining of the same slides. (B) Effect of caspase-3 inhibition (through CASP3DN or shcasp3 expression) on radiation-induced EndoG migration from cytoplasmic to nuclear locations. (C) Western blot analysis of EndoG in the mitochondria, cytoplasmic, and nuclear fractions of MCF10A cells with or without Casp3DN or shcasp3 expression. Mito marker, TATA binding protein (TBP), and b-actin were used as mitochondria, nuclear, and cytoplasmic loading controls, respectively. (D) Immunofluorescence co-staining of EndoG (green) and gh2ax foci (red) in irradiated MCF10A cells. Insets, DAPI staining of the same slides. (E) Fraction of cells with gh2ax foci among cells with EndoG staining in the cytoplasm only or those in both the cytoplasm and nucleus. (F) Effect of attenuating EndoG expression on radiation-induced gh2ax foci in MCF10A cells. (G) Effects of attenuating EndoG expression on radiation-induced comet tail DNA amount (an estimate of DNA strand breaks) in MCF10A cells. (H) Effects of attenuating EndoG expression on the fraction of cells with radiation-induced chromosome aberrations in MCF10A cells. (I) Effects of attenuating EndoG expression on the soft agar colony forming abilities of irradiated MCF10A cells. (F I) shendog represents shrna2 from Figure S7F. Error bars in (B) and (E) (I) represent SEM (n = 3 for each data point). For gh2ax foci, at least 200 cells were counted for each measurement. For comet assay, a minimum of 50 cells were randomly chosen and measured automatically by Image J software (NIH) for DNA distribution. For chromosome aberration analysis, a minimum of 150 cells were counted without knowledge of cell identities. Student s t test was used to calculate the p values. See also Figure S7. EXPERIMENTAL PROCEDURES Cell Lines and Tissue Culture Early passage, immortalized, non-transformed human breast epithelial cell line, MCF10A, was a kind gift from Dr. Hatsumi Nagasawa of Colorado State University (Fort Collins, CO). MCF10A growth medium was composed of Dulbecco s modified Eagle s medium (DMEM)/F12 (Sigma) supplemented with 5% donor horse serum (Sigma), 20 nanogram per milliliter (ng/ml) epidermal growth factor (EGF; R&D Systems), 0.5 mg/ml hydrocortisone (Sigma), 100 ng/ml cholera toxin (Sigma), 10 mg/ml insulin (Invitrogen), and 100 units/ ml penicillin and 100 mg/ml streptomycin. For gh2ax foci assays, the cells were cultured in growth medium with only 2% horse serum and without EGF. 294 Molecular Cell 58, , April 16, 2015 ª2015 Elsevier Inc.
13 Exposure to Higher Energy 56 Fe Ions To conduct irradiation with 56 Fe ions, cells to be irradiated or sham-irradiated were shipped by FedEx to the National Aeronautics and Space Administration (NASA)-sponsored Space Radiation Laboratory at Brookhaven National Laboratory (BNL; Brookhaven, Long Island, NY) in sealed T-25 flasks. The iron beam energy used was 600 MeV/m. The dose rate for exposure was 0.5 Gy/ min. After irradiation, the cells were immediately shipped back to our laboratory in Durham, NC for further analysis. gh2ax Foci Assay To detect the radiation-induced DSBs, gh2ax foci in the irradiated cells were examined through immunofluorescence by use of an established protocol (Paull et al., 2000; Rogakou et al., 1998). Alkaline Comet Assay We also used alkaline comet assay (Olive et al., 1990; Ostling and Johanson, 1984; Singh et al., 1988) to detect DSBs. To do this, we used a commercial kit following the manufacturer s (Trevigen) instructions. Chromosome Aberration Analysis We carried out chromosome aberration analysis in cultured cells and in bone marrow cells irradiated in mice. We also analyzed chromosome translocations analysis by use of fluorescence in situ hybridization (FISH) analysis in bone marrow cells from sham and irradiated mice. Two-Stage Carcinogenesis An established protocol (Abel et al., 2009) was used to induce skin carcinogenesis in mice by use of combined DMBA+TPA administration onto shaved mouse skin. An initial DMBA treatment and periodic (23 weekly) TPA treatments were carried. At the end of 20 weeks, the number of tumor per mice and tumor sizes were enumerated and quantified, respectively. All animal experiments described in this study has been approved by the Duke University Institutional Animal Care and Use Committee. Statistical Analysis Specific statistical methods are mostly described in the figure legends. Where it is not stated, two-tailed Student s t test was used to compare differences between two groups. In other instances, ANOVA or log rank tests were also used and described in the figure legends. Please also see Supplemental Experimental Procedures for additional details on various experimental methods used in this study. SUPPLEMENTAL INFORMATION Supplemental Information includes Supplemental Experimental Procedures, seven figures, and three tables and can be found with this article online at AUTHOR CONTRIBUTIONS X.L., Y.H., and C.-Y.L. conceived ofthestudyanddesigned theexperiments. X.L. carried out most of the experiments. Y.H. carried out some of the initial studies and key initial carcinogenesis experiments. F.L. and Q.H. carried out some of the soft agar studies. T.A.K. carried out some of the chromosome aberrations analysis. R.P.H. provided intellectual input in designing some of the experiments and helped in writing the manuscript. X.L. and C.-Y.L. wrote the manuscript. ACKNOWLEDGMENTS This study was supported in part by grants CA131408, CA136748, CA155270, and ES from the NIH (to C.-Y.L.) and grant NNX12AB88G (to C.-Y.L.) from the NASA Space Radiation Biology Research Program, the Duke Skin Disease Research Core Center grant (AR066527) from the NIH to R.P.H., and grants and from the National Science Foundation of China and grant 2004CB from the Ministry of Science of China 973 project to Q.H. We thank Dr. Sally Kornbluth (Duke University) for reading our manuscript and providing insightful suggestions. We also thank Dr. Richard A. Flavell (Yale University) for depositing the CASP3 / mouse to Jackson Laboratory for research use; Drs. Guy Salvesen (Sanford Burnham Institute), David M. Spencer (Baylor College of Medicine), Chris Counter (Duke University), and Titia de Lange (Rockefeller University) for sharing their CASPDN, icasp3, p53dn, and 53BP1-mCherry plasmids, respectively, through Addgene; and Drs. Adam Rusek and Peter Guida for their help in carrying out 56 Fe ion irradiation of our cells at the Brookhaven National Laboratory. Received: October 1, 2014 Revised: December 24, 2014 Accepted: February 18, 2015 Published: April 9, 2015 REFERENCES Abel, E.L., Angel, J.M., Kiguchi, K., and DiGiovanni, J. (2009). Multi-stage chemical carcinogenesis in mouse skin: fundamentals and applications. Nat. Protoc. 4, Chen, L., Park, S.M., Tumanov, A.V., Hau, A., Sawada, K., Feig, C., Turner, J.R., Fu, Y.X., Romero, I.L., Lengyel, E., and Peter, M.E. (2010). CD95 promotes tumour growth. Nature 465, Cifone, M.A., and Fidler, I.J. (1980). Correlation of patterns of anchorage-independent growth with in vivo behavior of cells from a murine fibrosarcoma. Proc. Natl. Acad. Sci. USA 77, Cory, S., and Adams, J.M. (2002). The Bcl2 family: regulators of the cellular lifeor-death switch. Nat. Rev. Cancer 2, Debbas, M., and White, E. (1993). Wild-type p53 mediates apoptosis by E1A, which is inhibited by E1B. Genes Dev. 7, Dimitrova, N., Chen, Y.C., Spector, D.L., and de Lange, T. (2008). 53BP1 promotes non-homologous end joining of telomeres by increasing chromatin mobility. Nature 456, Durante, M., and Cucinotta, F.A. (2008). Heavy ion carcinogenesis and human space exploration. Nat. Rev. Cancer 8, Evan, G.I., Wyllie, A.H., Gilbert, C.S., Littlewood, T.D., Land, H., Brooks, M., Waters, C.M., Penn, L.Z., and Hancock, D.C. (1992). Induction of apoptosis in fibroblasts by c-myc protein. Cell 69, Fanidi, A., Harrington, E.A., and Evan, G.I. (1992). Cooperative interaction between c-myc and bcl-2 proto-oncogenes. Nature 359, Fernando, P., Kelly, J.F., Balazsi, K., Slack, R.S., and Megeney, L.A. (2002). Caspase 3 activity is required for skeletal muscle differentiation. Proc. Natl. Acad. Sci. USA 99, Fujioka, M., Tokano, H., Fujioka, K.S., Okano, H., and Edge, A.S. (2011). Generating mouse models of degenerative diseases using Cre/lox-mediated in vivo mosaic cell ablation. J. Clin. Invest. 121, Hanahan, D., and Weinberg, R.A. (2000). The hallmarks of cancer. Cell 100, Hanahan, D., and Weinberg, R.A. (2011). Hallmarks of cancer: the next generation. Cell 144, Hoeppner, D.J., Hengartner, M.O., and Schnabel, R. (2001). Engulfment genes cooperate with ced-3 to promote cell death in Caenorhabditis elegans. Nature 412, Horvitz, H.R. (2003). Worms, life, and death (Nobel lecture). ChemBioChem 4, Horvitz, H.R., Shaham, S., and Hengartner, M.O. (1994). The genetics of programmed cell death in the nematode Caenorhabditis elegans. Cold Spring Harb. Symp. Quant. Biol. 59, Huang, Q., Li, F., Liu, X., Li, W., Shi, W., Liu, F.F., O Sullivan, B., He, Z., Peng, Y., Tan, A.C., et al. (2011). Caspase 3-mediated stimulation of tumor cell repopulation during cancer radiotherapy. Nat. Med. 17, Molecular Cell 58, , April 16, 2015 ª2015 Elsevier Inc. 295
14 Kendall, S.D., Linardic, C.M., Adam, S.J., and Counter, C.M. (2005). A network of genetic events sufficient to convert normal human cells to a tumorigenic state. Cancer Res. 65, Kim, M., Katayose, Y., Rojanala, L., Shah, S., Sgagias, M., Jang, L., Jung, Y.J., Lee, S.H., Hwang, S.G., and Cowan, K.H. (2000). Induction of apoptosis in p16ink4a mutant cell lines by adenovirus-mediated overexpression of p16ink4a protein. Cell Death Differ. 7, Kuida, K., Zheng, T.S., Na, S., Kuan, C., Yang, D., Karasuyama, H., Rakic, P., and Flavell, R.A. (1996). Decreased apoptosis in the brain and premature lethality in CPP32-deficient mice. Nature 384, Lakhani, S.A., Masud, A., Kuida, K., Porter, G.A., Jr., Booth, C.J., Mehal, W.Z., Inayat, I., and Flavell, R.A. (2006). Caspases 3 and 7: key mediators of mitochondrial events of apoptosis. Science 311, Larsen, B.D., Rampalli, S., Burns, L.E., Brunette, S., Dilworth, F.J., and Megeney, L.A. (2010). Caspase 3/caspase-activated DNase promote cell differentiation by inducing DNA strand breaks. Proc. Natl. Acad. Sci. USA 107, Lengauer, C., Kinzler, K.W., and Vogelstein, B. (1997). Genetic instability in colorectal cancers. Nature 386, Lengauer, C., Kinzler, K.W., and Vogelstein, B. (1998). Genetic instabilities in human cancers. Nature 396, Li, L.Y., Luo, X., and Wang, X. (2001). Endonuclease G is an apoptotic DNase when released from mitochondria. Nature 412, Li, F., He, Z., Shen, J., Huang, Q., Li, W., Liu, X., He, Y., Wolf, F., and Li, C.Y. (2010). Apoptotic caspases regulate induction of ipscs from human fibroblasts. Cell Stem Cell 7, Lin, H.C., Lai, P.Y., Lin, Y.P., Huang, J.Y., and Yang, B.C. (2012). Fas ligand enhances malignant behavior of tumor cells through interaction with Met, hepatocyte growth factor receptor, in lipid rafts. J. Biol. Chem. 287, Lovric, M.M., and Hawkins, C.J. (2010). TRAIL treatment provokes mutations in surviving cells. Oncogene 29, Lowe, S.W., and Lin, A.W. (2000). Apoptosis in cancer. Carcinogenesis 21, Lowe, S.W., Bodis, S., McClatchey, A., Remington, L., Ruley, H.E., Fisher, D.E., Housman, D.E., and Jacks, T. (1994). p53 status and the efficacy of cancer therapy in vivo. Science 266, MacCorkle, R.A., Freeman, K.W., and Spencer, D.M. (1998). Synthetic activation of caspases: artificial death switches. Proc. Natl. Acad. Sci. USA 95, Nicholson, D.W., Ali, A., Thornberry, N.A., Vaillancourt, J.P., Ding, C.K., Gallant, M., Gareau, Y., Griffin, P.R., Labelle, M., Lazebnik, Y.A., et al. (1995). Identification and inhibition of the ICE/CED-3 protease necessary for mammalian apoptosis. Nature 376, Olive, P.L., Banáth, J.P., and Durand, R.E. (1990). Heterogeneity in radiationinduced DNA damage and repair in tumor and normal cells measured using the comet assay. Radiat. Res. 122, Orth, J.D., Loewer, A., Lahav, G., and Mitchison, T.J. (2012). Prolonged mitotic arrest triggers partial activation of apoptosis, resulting in DNA damage and p53 induction. Mol. Biol. Cell 23, Ostling, O., and Johanson, K.J. (1984). Microelectrophoretic study of radiation-induced DNA damages in individual mammalian cells. Biochem. Biophys. Res. Commun. 123, Panner, A., James, C.D., Berger, M.S., and Pieper, R.O. (2005). mtor controls FLIPS translation and TRAIL sensitivity in glioblastoma multiforme cells. Mol. Cell. Biol. 25, Parrish, J., Li, L., Klotz, K., Ledwich, D., Wang, X., and Xue, D. (2001). Mitochondrial endonuclease G is important for apoptosis in C. elegans. Nature 412, Paull, T.T., Rogakou, E.P., Yamazaki, V., Kirchgessner, C.U., Gellert, M., and Bonner, W.M. (2000). A critical role for histone H2AX in recruitment of repair factors to nuclear foci after DNA damage. Curr. Biol. 10, Rao, L., Debbas, M., Sabbatini, P., Hockenbery, D., Korsmeyer, S., and White, E. (1992). The adenovirus E1A proteins induce apoptosis, which is inhibited by the E1B 19-kDa and Bcl-2 proteins. Proc. Natl. Acad. Sci. USA 89, Reddien, P.W., Cameron, S., and Horvitz, H.R. (2001). Phagocytosis promotes programmed cell death in C. elegans. Nature 412, Reed, J.C. (1999). Dysregulation of apoptosis in cancer. J. Clin. Oncol. 17, Rogakou, E.P., Pilch, D.R., Orr, A.H., Ivanova, V.S., and Bonner, W.M. (1998). DNA double-stranded breaks induce histone H2AX phosphorylation on serine 139. J. Biol. Chem. 273, Sabbatini, P., and McCormick, F. (1999). Phosphoinositide 3-OH kinase (PI3K) and PKB/Akt delay the onset of p53-mediated, transcriptionally dependent apoptosis. J. Biol. Chem. 274, Singh, N.P., McCoy, M.T., Tice, R.R., and Schneider, E.L. (1988). A simple technique for quantitation of low levels of DNA damage in individual cells. Exp. Cell Res. 175, Stennicke, H.R., and Salvesen, G.S. (1997). Biochemical characteristics of caspases-3, -6, -7, and -8. J. Biol. Chem. 272, Taylor, R.C., Cullen, S.P., and Martin, S.J. (2008). Apoptosis: controlled demolition at the cellular level. Nat. Rev. Mol. Cell Biol. 9, Walsh, J.G., Cullen, S.P., Sheridan, C., Lüthi, A.U., Gerner, C., and Martin, S.J. (2008). Executioner caspase-3 and caspase-7 are functionally distinct proteases. Proc. Natl. Acad. Sci. USA 105, Wang, K., Yin, X.M., Chao, D.T., Milliman, C.L., and Korsmeyer, S.J. (1996). BID: a novel BH3 domain-only death agonist. Genes Dev. 10, Wang, B., Matsuoka, S., Carpenter, P.B., and Elledge, S.J. (2002). 53BP1, a mediator of the DNA damage checkpoint. Science 298, Weinberg, R. (2007). The Biology of Cancer. (New York: Garland Science). Weng, L., Brown, J., and Eng, C. (2001). PTEN induces apoptosis and cell cycle arrest through phosphoinositol-3-kinase/akt-dependent and -independent pathways. Hum. Mol. Genet. 10, Yuan, J., Shaham, S., Ledoux, S., Ellis, H.M., and Horvitz, H.R. (1993). The C. elegans cell death gene ced-3 encodes a protein similar to mammalian interleukin-1 beta-converting enzyme. Cell 75, Molecular Cell 58, , April 16, 2015 ª2015 Elsevier Inc.
15 Molecular Cell Supplemental Information Caspase-3 Promotes Genetic Instability and Carcinogenesis Xinjian Liu, Yujun He, Fang Li, Qian Huang, Takamitsu A. Kato, Russell P. Hall, and Chuan-Yuan Li
 Full Length CASP3 Cleaved CASP3 Cytochrome C β-actin B Cell number (x10e4) 60 50")
 C GFP-hi MCF10A 10µm 10µm D % of")

16 Fig. S1 A (KD) (Gy) Full Length CASP3 Cleaved CASP3 Cytochrome C β-actin B Cell number (x10e4) MCF10A 0Gy MCF10A 0.5Gy MCF10A 0.5Gy GFP-Lo MCF10A 0.5Gy GFP-Hi Time after irradiation (days) C GFP-hi MCF10A 10µm 10µm D % of cells with leaky Cyto C Normal ** p<0.001 GFP High E Cell Counts TMRE fluorescence F # γh2ax Foci/cell ** ** ** Irradiation dose (Gy) G #γh2ax Foci/cell Gy 2Weeks 1Month 3Months
17 Figure S1 (related to Figure 1&2). Caspase 3 activation, cell proliferation, and γh2ax foci formation after exposure to radiation. A. Western blot analysis of caspase 3 activation and cytochrome c release into the cytoplasm in MCF10A cells exposed to different doses of 56 Fe ions. B. Growth characteristics of irradiated (0.5 Gy) and shamirradiated MCF10A cells. Irradiated, FACS sorted cells with high or low reporter activities were also evaluated together with non sorted cells. C. Confocal microscopic imaging of Immunofluorescence staining of cytochrome c and mitochondria in parental and irradiated GFP hi MCF10CA cells. There is clear cytochrome c staining in cytoplasmic areas outside the mitochondria. D. Percentage of parental and GFP hi MCF10A cells with leaky extra mitochondrial cytochrome c staining pattern (similar to those shown in the lower panels of Fig.S1C). Error bars represent standard error of the mean. E. Flow cytometry of analysis of mitochondrial membrane potential in control MCF10A, FCCP treated, Casp3 GFP hi and Casp3 GFP low MCF10A cells. Higher levels of fluorescence correlated with higher mitochondrial membrane potential. F. Dose dependent γh2ax foci induction in MCF10A cells 14 days after exposure to 56 Fe ions (**p<0.01). G. Persistent γh2ax foci induction in MCF10A cells after exposure to 56 Fe ions.


18 Fig. S2 (KD) A shcon Vector shcasp3 Casp3 β-actin Casp3DN HA β-actin B #ƳH2AX Foci/cell Gy 3 Gy p<0.001 p=0.03 p<0.001 p=0.73 C 0.0 WT Casp3KO Casp7KO DKO D mcherry-53bp1 Foci/cell Gy 3Gy WT ** (p<0.001) Casp3 KO E mcherry- 53BP1 mcherry- 53BP1 +TL phase 0 h 8 h 20 h 25µm
19 Figure S2 (related to Figure 2). Additional data on caspase 3 activation and DNA damage foci formation. A. Western blot analysis of the effect of a small hairpin gene against the CASP3 gene (shcasp3) in MCF10A cells (top panels), and a dominantnegative caspase 3 gene expression (Casp3DN) as detected by the presence of a hemaglutinin (HA) tag, which is part of CASP3DN gene. B. The number of γh2ax foci in irradiated MEFs with caspase 3 and/or 7 knockout 5 days after irradiation with 3 Gy of x rays. Error bars represent standard deviation. C. Microscopic images of 53BP1 foci in sham and 3 Gy x rays irradiated WT and CASP3KO MEF cells transduced with the fusion reporter mcherry 53BP1 gene. D. The average number of 53BP1 foci in sham and 3 Gy x rays irradiated MEF cells transduced with the fusion reporter mcherry 53BP1 gene. Error bars represent standard deviation. All values are derived from the average of triplicate experiments. In each experiment, at least 200 cells were counted. Student s t test was used to calculate the P values. E. Persistent, de novo generation of 53BP1 foci in irradiated MCF10A cells 14 days after cellular exposure to radiation. Shown are select images of the same cell with the mcherry 53BP1 reporter at different time points after the start of observation. Notice persistent foci presence in the progeny of the parent cell (middle and right panels).


20 Fig. S3 A B C icasp3 Casp3 positive(%) icasp3 ** icasp3+ap20187 # γ-h2ax Foci/cell icasp3 ** icasp3+ap20187 icasp3+ap20187 D γh2ax γh2ax/dapi E 6 DMSO P<0.05 F MEF Casp3 KO MEF WT 10 0 Gy 0.5 Gy p=0.033 ϒH2AX Foci/Cell G 0.04 STS WT 0Gy 0.5Gy p<0.001 Casp3KO #ƳH2AX Foci/cell Ctr shrna shcasp3 Aberration/cell Ctr shrna shcasp3
21 Fig. S3 (related to Fig. 2&3). Additional data on the effect of caspase 3 attenuation and the role of p53 in radiation induced foci formation. A. MCF10A transduced with icasp3 incubated with or without AP20187 for 48 h, then stained with anti active casp3 antibody (Green). DAPI staining for cell count. Scale bar: 50µm. B. Caspase3 activation cells in MCF10A transduced with icasp3 incubated with or without AP20187 (**p<0.01). C. The number of γh2ax foci in MCF10A transduced with icasp3 incubated with or without AP20187 (**p<0.01). D. Immunofluorescence staining images of phosphorylated H2AX foci formation in wild type and Casp3KO MEF cells exposed to staurosporine (STS). Cells were processed 3 days after exposure with 0.2 um of staurosporine for 2 hrs. E. Quantitative estimate of average number of γh2ax foci per cell in WT and Casp3KO MEF cells after STS treatment. The error bars represent standard error of the mean. Two tailed student s t test was used for calculation of the p value. F. Knockdown caspase3 in IMR90 cells decreased radiation (0.5 Gy 56 Fe ions) induced γh2ax foci. G. Radiation induced chromosome aberrations in IMR90 cells.

22 Fig. S4 A B (KD) C D E F
23 Figure S4 (related to Figure 3 & 4). A Western blot analysis of p53 and p21 protein expression levels in MCF10A cells irradiated with 3 Gy of x rays. IMR90 cells were used as a normal cell control. B. Average number of γh2ax foci in irradiated MCF10A cells transduced with dominant negative p53 (p53dn) (n.s., not significant).c. A normal chromosome spread of MCF10A. D. A chromosome spread with a chromosome exchange in irradiated MCF10A cells. The exchange is shown as an enlarged image at lower left corner. E. A chromosome spread with a dicentric (left) and a dicentric and interstitial deletion (right) in MCF10A. F. A chromosome spread with a chromatid break in a MCF10A cell.


24 Fig. S5 A MCF10A, 0.5Gy Casp3GFP-Low MCF10A, 0.5Gy Casp3GFP-High Casp3-reporter B MCF10A-Ctr vector 0 Gy MCF10A-Ctr vector 0.5 Gy MCF10A-Casp3DN 0 Gy MCF10A Casp3DN 0.5 Gy Casp3DN C MCF10A-sh Control 0 Gy MCF10A-sh Control 0.5 Gy MCF10A-shCasp3 0 Gy MCF10A-shCasp3 0.5 Gy ShCasp3 D
25 Figure S5 (related to Figure 5&6). A. Soft agar growth from cells with high and low Casp3GFP reporter expression after 56 Fe ions irradiation. B. Soft agar formation from cells transduced with vector control or Casp3DN with or without 56 Fe ions irradiation. C. Soft agar growth cells transduced with vector control or shcasp3 expression. D. Representative H&E staining of a paraffin embedded tumor section derived from the two stage carcinogenesis.
26 Fig. S6 A Tumor incidence(%) Casp3 WT F (n=13) Casp3 WT M (n=10) Casp3 KO F (n=11) Casp3 KO M (n=15) WT F vs WT M KO F vs KO M WT F vs KO F WT M vs KO M WT M vs KO F p=0.007 p=0.250 p<0.001 p<0.001 p=0.005 D Tumor incidence(%) WT (n=23) Casp3 KO(n=26) Casp7 KO(n=16) Wt vs Casp3KO p<0.001 Wt vs Casp7KO p=0.028 Casp3KO vs Casp7KO p=0.009 B # of tumors/ mouse C Tumor volume /mouse (mm 3 ) Casp3 WT F Casp3 WT M Casp3 KO F Casp3 KO M WT F vs WT M p=0.005 KO F vs KO M p=0.227 WT F vs KO F p<0.001 WT M vs KO M p<0.001 WT M vs KO F p= Casp3 WT F Casp3 WT M Casp3 KO F Casp3 KO M WT F vs WT M p<0.001 KO F vs KO M p=0.465 WT F vs KO F p<0.001 WT M vs KO M p=0.033 WT M vs KO F p= Weeks of TPA treatment E # of tumors/ mouse F Tumor volume /mouse (mm 3 ) WT Casp3 KO Casp7 KO Wt vs Casp3KO p<0.001 Wt vs Casp7KO p=0.001 Casp3KO vs Casp7KO p= WT Casp3 KO Casp7 KO Wt vs Casp3KO p<0.001 Wt vs Casp7KO p=0.001 Casp3KO vs Casp7KO p= Weeks of TPA treatment
27 Figure S6 (related to Figure 6). Additional data on DMBA+TPA induced tumor formation in C57BL/6 with various genetic backgrounds. Sex difference in terms of DMBA+TPA induced tumor incidence (A), tumor numbers (B), and aggregate tumor size (C) in wild type vs casp3ko mice. The comparative roles of caspase 3 vs caspase 7 are shown in terms tumor incidence (D), tumor number per mouse (E), and aggregate tumor volume per mouse (F). P values were obtained from log rank test.

 100 80 60 40 20 0 0")


 80 60")


28 Fig. S7 A MEF cells 3 Gy 0 Gy EndoG DAPI Merge B Nuclear EndoG (%) Gy 3 Gy Casp3+/+ p<0.001 Casp3-/- C EndoG DAPI Merge D Casp3-/- DMBA+TPA induced tumors Casp3-/- Casp3+/+ Nuclear EndoG(%) Normal Skin Tumor p<0.001 Casp3+/+ E EndoG β actin shscr Endo shrna F (KD) # γh2ax Foci/cell Gy 0.5Gy ** ** ** ** * * * shscr sh2 sh3 sh4 G Colony # 0Gy 0.5Gy ** ** ** ** ** ** ** shscr sh2 sh3 sh4
Self-inflicted DNA double-strand breaks sustain tumorigenicity and stemness of cancer cells
 ORIGINAL ARTICLE Cell Research (2017) 27:764-783. www.nature.com/cr Self-inflicted DNA double-strand breaks sustain tumorigenicity and stemness of cancer cells Xinjian Liu 1, Fang Li 1, Qian Huang 2, Zhengxiang
Problem Set 8 Key 1 of 8
 7.06 2003 Problem Set 8 Key 1 of 8 7.06 2003 Problem Set 8 Key 1. As a bright MD/PhD, you are interested in questions about the control of cell number in the body. Recently, you've seen three patients
Introduction to pathology lecture 5/ Cell injury apoptosis. Dr H Awad 2017/18
 Introduction to pathology lecture 5/ Cell injury apoptosis Dr H Awad 2017/18 Apoptosis = programmed cell death = cell suicide= individual cell death Apoptosis cell death induced by a tightly regulated
(a) Schematic diagram of the FS mutation of UVRAG in exon 8 containing the highly instable
 Schematic diagram of the FS mutation of UVRAG in exon 8 containing the highly instable") Supplementary Figure 1. Frameshift (FS) mutation in UVRAG. (a) Schematic diagram of the FS mutation of UVRAG in exon 8 containing the highly instable A 10 DNA repeat, generating a premature stop codon
Supplementary Figure 1. Frameshift (FS) mutation in UVRAG. (a) Schematic diagram of the FS mutation of UVRAG in exon 8 containing the highly instable A 10 DNA repeat, generating a premature stop codon
SUPPLEMENTARY INFORMATION
 SUPPLEMENTARY INFORMATION doi:1.138/nature9814 a A SHARPIN FL B SHARPIN ΔNZF C SHARPIN T38L, F39V b His-SHARPIN FL -1xUb -2xUb -4xUb α-his c Linear 4xUb -SHARPIN FL -SHARPIN TF_LV -SHARPINΔNZF -SHARPIN
Programmed Cell Death (apoptosis)
") Programmed Cell Death (apoptosis) Stereotypic death process includes: membrane blebbing nuclear fragmentation chromatin condensation and DNA framentation loss of mitochondrial integrity and release of
Programmed Cell Death (apoptosis) Stereotypic death process includes: membrane blebbing nuclear fragmentation chromatin condensation and DNA framentation loss of mitochondrial integrity and release of
nuclear science and technology
 EUROPEAN COMMISSION nuclear science and technology The role of intercellular communication and DNA double-strand breaks in the induction of bystander effects (INTERSTANDER) Contract N o FIGH-CT2002-00218
C-Phycocyanin (C-PC) is a n«sjfc&c- waefc-jduble phycobiliprotein. pigment isolated from Spirulina platensis. This water- soluble protein pigment is
 is a n«sjfc&c- waefc-jduble phycobiliprotein. pigment isolated from Spirulina platensis. This water- soluble protein pigment is") ' ^Summary C-Phycocyanin (C-PC) is a n«sjfc&c- waefc-jduble phycobiliprotein pigment isolated from Spirulina platensis. This water- soluble protein pigment is of greater importance because of its various
' ^Summary C-Phycocyanin (C-PC) is a n«sjfc&c- waefc-jduble phycobiliprotein pigment isolated from Spirulina platensis. This water- soluble protein pigment is of greater importance because of its various
PREPARED FOR: U.S. Army Medical Research and Materiel Command Fort Detrick, Maryland
 AD Award Number: DAMD17-03-1-0392 TITLE: The Role of Notch Signaling Pathway in Breast Cancer Pathogenesis PRINCIPAL INVESTIGATOR: Annapoorni Rangarajan, Ph.D. CONTRACTING ORGANIZATION: Indian Institute
Cancer. The fundamental defect is. unregulated cell division. Properties of Cancerous Cells. Causes of Cancer. Altered growth and proliferation
 Cancer The fundamental defect is unregulated cell division. Properties of Cancerous Cells Altered growth and proliferation Loss of growth factor dependence Loss of contact inhibition Immortalization Alterated
Supplementary Figure 1: si-craf but not si-braf sensitizes tumor cells to radiation.
 Supplementary Figure 1: si-craf but not si-braf sensitizes tumor cells to radiation. (a) Embryonic fibroblasts isolated from wildtype (WT), BRAF -/-, or CRAF -/- mice were irradiated (6 Gy) and DNA damage
Supplementary Material
 Supplementary Material Summary: The supplementary information includes 1 table (Table S1) and 4 figures (Figure S1 to S4). Supplementary Figure Legends Figure S1 RTL-bearing nude mouse model. (A) Tumor
Early cell death (FGF) B No RunX transcription factor produced Yes No differentiation
 B No RunX transcription factor produced Yes No differentiation") Solution Key - Practice Questions Question 1 a) A recent publication has shown that the fat stem cells (FSC) can act as bone stem cells to repair cavities in the skull, when transplanted into immuno-compromised
Solution Key - Practice Questions Question 1 a) A recent publication has shown that the fat stem cells (FSC) can act as bone stem cells to repair cavities in the skull, when transplanted into immuno-compromised
Cancer. The fundamental defect is. unregulated cell division. Properties of Cancerous Cells. Causes of Cancer. Altered growth and proliferation
 Cancer The fundamental defect is unregulated cell division. Properties of Cancerous Cells Altered growth and proliferation Loss of growth factor dependence Loss of contact inhibition Immortalization Alterated
Supplementary Information POLO-LIKE KINASE 1 FACILITATES LOSS OF PTEN-INDUCED PROSTATE CANCER FORMATION
 Supplementary Information POLO-LIKE KINASE 1 FACILITATES LOSS OF PTEN-INDUCED PROSTATE CANCER FORMATION X. Shawn Liu 1, 3, Bing Song 2, 3, Bennett D. Elzey 3, 4, Timothy L. Ratliff 3, 4, Stephen F. Konieczny
Modelling the induction of cell death and chromosome damage by therapeutic protons
 Modelling the induction of cell death and chromosome damage by therapeutic protons M.P. Carante 1,2 and F. Ballarini 1,2, * 1 University of Pavia, Physics Department, Pavia, Italy 2 INFN, Sezione di Pavia,
Introduction. Cancer Biology. Tumor-suppressor genes. Proto-oncogenes. DNA stability genes. Mechanisms of carcinogenesis.
 Cancer Biology Chapter 18 Eric J. Hall., Amato Giaccia, Radiobiology for the Radiologist Introduction Tissue homeostasis depends on the regulated cell division and self-elimination (programmed cell death)
Nature Immunology: doi: /ni Supplementary Figure 1. Huwe1 has high expression in HSCs and is necessary for quiescence.
 Supplementary Figure 1 Huwe1 has high expression in HSCs and is necessary for quiescence. (a) Heat map visualizing expression of genes with a known function in ubiquitin-mediated proteolysis (KEGG: Ubiquitin
Supplementary Figure 1.TRIM33 binds β-catenin in the nucleus. a & b, Co-IP of endogenous TRIM33 with β-catenin in HT-29 cells (a) and HEK 293T cells
 and HEK 293T cells") Supplementary Figure 1.TRIM33 binds β-catenin in the nucleus. a & b, Co-IP of endogenous TRIM33 with β-catenin in HT-29 cells (a) and HEK 293T cells (b). TRIM33 was immunoprecipitated, and the amount of
Supplementary Figure 1.TRIM33 binds β-catenin in the nucleus. a & b, Co-IP of endogenous TRIM33 with β-catenin in HT-29 cells (a) and HEK 293T cells (b). TRIM33 was immunoprecipitated, and the amount of
supplementary information
 DOI: 10.1038/ncb1875 Figure S1 (a) The 79 surgical specimens from NSCLC patients were analysed by immunohistochemistry with an anti-p53 antibody and control serum (data not shown). The normal bronchi served
Apoptosis Chapter 9. Neelu Yadav PhD
 Apoptosis Chapter 9 Neelu Yadav PhD Neelu.Yadav@Roswellpark.org 1 Apoptosis: Lecture outline Apoptosis a programmed cell death pathway in normal homeostasis Core Apoptosis cascade is conserved Compare
Basics of Radiation Biology
 Basics of Radiation Biology Sally A. Amundson Columbia University Center for Radiological Research http://www.cmcr.columbia.edu/ Overview Radiation damage to cells DNA Effects of radiation damage on cells
Basics of Radiation Biology
 Basics of Radiation Biology Sally A. Amundson Columbia University Center for Radiological Research http://www.cmcr.columbia.edu/ Overview Radiation damage to cells DNA Effects of radiation damage on cells
Genome of Hepatitis B Virus. VIRAL ONCOGENE Dr. Yahwardiah Siregar, PhD Dr. Sry Suryani Widjaja, Mkes Biochemistry Department
 Genome of Hepatitis B Virus VIRAL ONCOGENE Dr. Yahwardiah Siregar, PhD Dr. Sry Suryani Widjaja, Mkes Biochemistry Department Proto Oncogen and Oncogen Oncogen Proteins that possess the ability to cause
Determination of the temporal pattern and importance of BALF1 expression in Epstein-Barr viral infection
 Determination of the temporal pattern and importance of BALF1 expression in Epstein-Barr viral infection Melissa Mihelidakis May 6, 2004 7.340 Research Proposal Introduction Apoptosis, or programmed cell
Supplementary Figure 1 Induction of cellular senescence and isolation of exosome. a to c, Pre-senescent primary normal human diploid fibroblasts
 Supplementary Figure 1 Induction of cellular senescence and isolation of exosome. a to c, Pre-senescent primary normal human diploid fibroblasts (TIG-3 cells) were rendered senescent by either serial passage
Transformation of Normal HMECs (Human Mammary Epithelial Cells) into Metastatic Breast Cancer Cells: Introduction - The Broad Picture:
 into Metastatic Breast Cancer Cells: Introduction - The Broad Picture:") Transformation of Normal HMECs (Human Mammary Epithelial Cells) into Metastatic Breast Cancer Cells: Introduction - The Broad Picture: Spandana Baruah December, 2016 Cancer is defined as: «A disease caused
Transformation of Normal HMECs (Human Mammary Epithelial Cells) into Metastatic Breast Cancer Cells: Introduction - The Broad Picture: Spandana Baruah December, 2016 Cancer is defined as: «A disease caused
mirna Dr. S Hosseini-Asl
 mirna Dr. S Hosseini-Asl 1 2 MicroRNAs (mirnas) are small noncoding RNAs which enhance the cleavage or translational repression of specific mrna with recognition site(s) in the 3 - untranslated region
Molecular biology :- Cancer genetics lecture 11
 Molecular biology :- Cancer genetics lecture 11 -We have talked about 2 group of genes that is involved in cellular transformation : proto-oncogenes and tumour suppressor genes, and it isn t enough to
File Name: Supplementary Information Description: Supplementary Figures and Supplementary Tables. File Name: Peer Review File Description:
 File Name: Supplementary Information Description: Supplementary Figures and Supplementary Tables File Name: Peer Review File Description: Primer Name Sequence (5'-3') AT ( C) RT-PCR USP21 F 5'-TTCCCATGGCTCCTTCCACATGAT-3'
Functional characterisation of hepatitis B viral X protein/microrna-21 interaction in HBVassociated hepatocellular carcinoma
 RESEARCH FUND FOR THE CONTROL OF INFECTIOUS DISEASES Functional characterisation of hepatitis B viral X protein/microrna-21 interaction in HBVassociated hepatocellular carcinoma CH Li, SC Chow, DL Yin,
Supplemental Figure 1
 Supplemental Figure 1 A S100A4: SFLGKRTDEAAFQKLMSNLDSNRDNEVDFQEYCVFLSCIAMMCNEFFEGFPDK Overlap: SF G DE KLM LD N D VDFQEY VFL I M N FF G PD S100A2: SFVGEKVDEEGLKKLMGSLDENSDQQVDFQEYAVFLALITVMCNDFFQGCPDR
SUPPLEMENTARY INFORMATION. Supplementary Figures S1-S9. Supplementary Methods
 SUPPLEMENTARY INFORMATION SUMO1 modification of PTEN regulates tumorigenesis by controlling its association with the plasma membrane Jian Huang 1,2#, Jie Yan 1,2#, Jian Zhang 3#, Shiguo Zhu 1, Yanli Wang
Supplementary Figure 1: STAT3 suppresses Kras-induced lung tumorigenesis
 Supplementary Figure 1: STAT3 suppresses Kras-induced lung tumorigenesis (a) Immunohistochemical (IHC) analysis of tyrosine 705 phosphorylation status of STAT3 (P- STAT3) in tumors and stroma (all-time
Functional Limitations
 Regulation of the Cell Cycle Chapter 12 Pg. 228 245 Functional Limitations Various factors determine whether and when a cell divides. Two functional limitations for cell size limit growth or influence
The Biochemistry of apoptosis
 The Biochemistry of apoptosis 1 1 The apoptosis is composed of multiple biochemical events 2 2 Biochemical, cellular, and molecular events in Apoptosis 1. Membrane blebbing; phosphatidyl serine exposure
Part-4. Cell cycle regulatory protein 5 (Cdk5) A novel target of ERK in Carb induced cell death
 A novel target of ERK in Carb induced cell death") Part-4 Cell cycle regulatory protein 5 (Cdk5) A novel target of ERK in Carb induced cell death 95 1. Introduction The process of replicating DNA and dividing cells can be described as a series of coordinated
Part-4 Cell cycle regulatory protein 5 (Cdk5) A novel target of ERK in Carb induced cell death 95 1. Introduction The process of replicating DNA and dividing cells can be described as a series of coordinated
LET, RBE and Damage to DNA
 LET, RBE and Damage to DNA Linear Energy Transfer (LET) When is stopping power not equal to LET? Stopping power (-de/dx) gives the energy lost by a charged particle in a medium. LET gives the energy absorbed
34 Apoptosis Programmed cell death is vital to the health and development of multicellular organisms.
 Principles of Biology contents 34 Apoptosis Programmed cell death is vital to the health and development of multicellular organisms. Apoptosis is the reason we have separate fingers and toes. During embryonic
APOPTOSIS, NECROSIS AND CANCER. Dr. S. P. Pattanayak
 APOPTOSIS, NECROSIS AND CANCER Dr. S. P. Pattanayak LEARNING OBJECTIVES At the end of the lecture, students should be able to: Know the importance of cell death. Define various modes of cell death. Identify
BIO360 Fall 2013 Quiz 1
 BIO360 Fall 2013 Quiz 1 1. Examine the diagram below. There are two homologous copies of chromosome one and the allele of YFG carried on the light gray chromosome has undergone a loss-of-function mutation.
Cells and reagents. Synaptopodin knockdown (1) and dynamin knockdown (2)
 and dynamin knockdown (2)") Supplemental Methods Cells and reagents. Synaptopodin knockdown (1) and dynamin knockdown (2) podocytes were cultured as described previously. Staurosporine, angiotensin II and actinomycin D were all obtained
Supplemental Methods Cells and reagents. Synaptopodin knockdown (1) and dynamin knockdown (2) podocytes were cultured as described previously. Staurosporine, angiotensin II and actinomycin D were all obtained
Supplementary Information
 Supplementary Information mediates STAT3 activation at retromer-positive structures to promote colitis and colitis-associated carcinogenesis Zhang et al. a b d e g h Rel. Luc. Act. Rel. mrna Rel. mrna
CANCER. Inherited Cancer Syndromes. Affects 25% of US population. Kills 19% of US population (2nd largest killer after heart disease)
") CANCER Affects 25% of US population Kills 19% of US population (2nd largest killer after heart disease) NOT one disease but 200-300 different defects Etiologic Factors In Cancer: Relative contributions
CANCER Affects 25% of US population Kills 19% of US population (2nd largest killer after heart disease) NOT one disease but 200-300 different defects Etiologic Factors In Cancer: Relative contributions
A. Generation and characterization of Ras-expressing autophagycompetent
 Supplemental Material Supplemental Figure Legends Fig. S1 A. Generation and characterization of Ras-expressing autophagycompetent and -deficient cell lines. HA-tagged H-ras V12 was stably expressed in
Supplementary Figure 1. Normal T lymphocyte populations in Dapk -/- mice. (a) Normal thymic development in Dapk -/- mice. Thymocytes from WT and Dapk
 Normal thymic development in Dapk -/- mice. Thymocytes from WT and Dapk") Supplementary Figure 1. Normal T lymphocyte populations in Dapk -/- mice. (a) Normal thymic development in Dapk -/- mice. Thymocytes from WT and Dapk -/- mice were stained for expression of CD4 and CD8.
Supplementary Figure 1. Normal T lymphocyte populations in Dapk -/- mice. (a) Normal thymic development in Dapk -/- mice. Thymocytes from WT and Dapk -/- mice were stained for expression of CD4 and CD8.
#19 Apoptosis Chapter 9. Neelu Yadav PhD
 #19 Apoptosis Chapter 9 Neelu Yadav PhD Neelu.Yadav@Roswellpark.org Why cells decide to die? - Stress, harmful, not needed - Completed its life span Death stimulation or Stress Cell Survival Death Functions
SUPPLEMENTARY INFORMATION
 Figure S1 Induction of non-apoptotic death of SV40-transformed and primary DKO MEFs, and DKO thymocytes. (A-F) STS-induced non-apoptotic death of DKO MEF. (A, B) Reduced viability of DKO MEFs after exposure
Supplemental Data Macrophage Migration Inhibitory Factor MIF Interferes with the Rb-E2F Pathway
 Supplemental Data Macrophage Migration Inhibitory Factor MIF Interferes with the Rb-E2F Pathway S1 Oleksi Petrenko and Ute M. Moll Figure S1. MIF-Deficient Cells Have Reduced Transforming Ability (A) Soft
Supplementary Figure S1: Defective heterochromatin repair in HGPS progeroid cells
 Supplementary Figure S1: Defective heterochromatin repair in HGPS progeroid cells Immunofluorescence staining of H3K9me3 and 53BP1 in PH and HGADFN003 (HG003) cells at 24 h after γ-irradiation. Scale bar,
(A) Cells grown in monolayer were fixed and stained for surfactant protein-c (SPC,
 Cells grown in monolayer were fixed and stained for surfactant protein-c (SPC,") Supplemental Figure Legends Figure S1. Cell line characterization (A) Cells grown in monolayer were fixed and stained for surfactant protein-c (SPC, green) and co-stained with DAPI to visualize the nuclei.
Supplemental Figure Legends Figure S1. Cell line characterization (A) Cells grown in monolayer were fixed and stained for surfactant protein-c (SPC, green) and co-stained with DAPI to visualize the nuclei.
Supplementary Figure 1
 Supplementary Figure 1 a γ-h2ax MDC1 RNF8 FK2 BRCA1 U2OS Cells sgrna-1 ** 60 sgrna 40 20 0 % positive Cells (>5 foci per cell) b ** 80 sgrna sgrna γ-h2ax MDC1 γ-h2ax RNF8 FK2 MDC1 BRCA1 RNF8 FK2 BRCA1
Soft Agar Assay. For each cell pool, 100,000 cells were resuspended in 0.35% (w/v)
") SUPPLEMENTARY MATERIAL AND METHODS Soft Agar Assay. For each cell pool, 100,000 cells were resuspended in 0.35% (w/v) top agar (LONZA, SeaKem LE Agarose cat.5004) and plated onto 0.5% (w/v) basal agar.
SUPPLEMENTARY MATERIAL AND METHODS Soft Agar Assay. For each cell pool, 100,000 cells were resuspended in 0.35% (w/v) top agar (LONZA, SeaKem LE Agarose cat.5004) and plated onto 0.5% (w/v) basal agar.
Src-INACTIVE / Src-INACTIVE
 Biology 169 -- Exam 1 February 2003 Answer each question, noting carefully the instructions for each. Repeat- Read the instructions for each question before answering!!! Be as specific as possible in each
To determine the effect of over-expression and/or ligand activation of. PPAR / on cell cycle, cell lines were cultured as described above until ~80%
 Supplementary Materials and Methods Cell cycle analysis To determine the effect of over-expression and/or ligand activation of PPAR / on cell cycle, cell lines were cultured as described above until ~80%
The Hallmarks of Cancer
 The Hallmarks of Cancer Theresa L. Hodin, Ph.D. Clinical Research Services Theresa.Hodin@RoswellPark.org Hippocrates Cancer surgery, circa 1689 Cancer Surgery Today 1971: Nixon declares War on Cancer
Supplementary Figure 1. Characterization of NMuMG-ErbB2 and NIC breast cancer cells expressing shrnas targeting LPP. NMuMG-ErbB2 cells (a) and NIC
 and NIC") Supplementary Figure 1. Characterization of NMuMG-ErbB2 and NIC breast cancer cells expressing shrnas targeting LPP. NMuMG-ErbB2 cells (a) and NIC cells (b) were engineered to stably express either a LucA-shRNA
Supplementary Figure 1. Characterization of NMuMG-ErbB2 and NIC breast cancer cells expressing shrnas targeting LPP. NMuMG-ErbB2 cells (a) and NIC cells (b) were engineered to stably express either a LucA-shRNA
Cell Quality Control. Peter Takizawa Department of Cell Biology
 Cell Quality Control Peter Takizawa Department of Cell Biology Cellular quality control reduces production of defective proteins. Cells have many quality control systems to ensure that cell does not build
Biology is the only subject in which multiplication is the same thing as division
 The Cell Cycle Biology is the only subject in which multiplication is the same thing as division Why do cells divide? For reproduction asexual reproduction For growth one-celled organisms from fertilized
Breaking Up is Hard to Do (At Least in Eukaryotes) Mitosis
 Mitosis") Breaking Up is Hard to Do (At Least in Eukaryotes) Mitosis Chromosomes Chromosomes were first observed by the German embryologist Walther Fleming in 1882. Chromosome number varies among organisms most
Breaking Up is Hard to Do (At Least in Eukaryotes) Mitosis Chromosomes Chromosomes were first observed by the German embryologist Walther Fleming in 1882. Chromosome number varies among organisms most
Follicular Lymphoma. ced3 APOPTOSIS. *In the nematode Caenorhabditis elegans 131 of the organism's 1031 cells die during development.
 Harvard-MIT Division of Health Sciences and Technology HST.176: Cellular and Molecular Immunology Course Director: Dr. Shiv Pillai Follicular Lymphoma 1. Characterized by t(14:18) translocation 2. Ig heavy
Annals of RSCB Vol. XVI, Issue 1
 ENDOPLASMIC RETICULUM INVOLVEMENT IN APOPTOSIS OF NORMAL AND TREATED GINGIVAL FIBROBLASTS Ancuţa Goriuc, Raluca Jipu, Roxana Irina Iancu, M. Costuleanu GR. T. POPA UNIVERSITY OF MEDICINE AND PHARMACY,
Supplementary figure legends
 Supplementary figure legends Supplementary Figure 1. Exposure of CRT occurs independently from the apoptosisassociated loss of the mitochondrial membrane potential (MMP). (A) HeLa cells treated with MTX
SUPPLEMENTAL FIGURE LEGENDS
 SUPPLEMENTAL FIGURE LEGENDS Supplemental Figure S1: Endogenous interaction between RNF2 and H2AX: Whole cell extracts from 293T were subjected to immunoprecipitation with anti-rnf2 or anti-γ-h2ax antibodies
number Done by Corrected by Doctor Maha Shomaf
 number 19 Done by Waseem Abo-Obeida Corrected by Abdullah Zreiqat Doctor Maha Shomaf Carcinogenesis: the molecular basis of cancer. Non-lethal genetic damage lies at the heart of carcinogenesis and leads
TITLE: Role of Notch Signaling in Human Breast Cancer Pathogenesis. CONTRACTING ORGANIZATION: Indian Institute of Science Bangalore India
 AD Award Number: DAMD17-03-1-0392 TITLE: Role of Notch Signaling in Human Breast Cancer Pathogenesis PRINCIPAL INVESTIGATOR: Annapoorni Rangarajan, Ph.D CONTRACTING ORGANIZATION: Indian Institute of Science
SUPPLEMENTARY INFORMATION
 b 350 300 250 200 150 100 50 0 E0 E10 E50 E0 E10 E50 E0 E10 E50 E0 E10 E50 Number of organoids per well 350 300 250 200 150 100 50 0 R0 R50 R100 R500 1st 2nd 3rd Noggin 100 ng/ml Noggin 10 ng/ml Noggin
Cell cycle and apoptosis
 Cell cycle and apoptosis Cell cycle Definition Stages and steps Cell cycle Interphase (G1/G0, S, and G2) Mitosis (prophase, metaphase, anaphase, telophase, karyokinesis, cytokinesis) Control checkpoints
Supplementary Figures
 Supplementary Figures Figure S1. Validation of kinase regulators of ONC201 sensitivity. Validation and screen results for changes in cell viability associated with the combination of ONC201 treatment (1
(a) Significant biological processes (upper panel) and disease biomarkers (lower panel)
 Significant biological processes (upper panel) and disease biomarkers (lower panel)") Supplementary Figure 1. Functional enrichment analyses of secretomic proteins. (a) Significant biological processes (upper panel) and disease biomarkers (lower panel) 2 involved by hrab37-mediated secretory
Supplementary Figure 1. Functional enrichment analyses of secretomic proteins. (a) Significant biological processes (upper panel) and disease biomarkers (lower panel) 2 involved by hrab37-mediated secretory
Supplementary Figure 1. Confocal immunofluorescence showing mitochondrial translocation of Drp1. Cardiomyocytes treated with H 2 O 2 were prestained
 Supplementary Figure 1. Confocal immunofluorescence showing mitochondrial translocation of Drp1. Cardiomyocytes treated with H 2 O 2 were prestained with MitoTracker (red), then were immunostained with
m 6 A mrna methylation regulates AKT activity to promote the proliferation and tumorigenicity of endometrial cancer
 SUPPLEMENTARY INFORMATION Articles https://doi.org/10.1038/s41556-018-0174-4 In the format provided by the authors and unedited. m 6 A mrna methylation regulates AKT activity to promote the proliferation
Studying The Role Of DNA Mismatch Repair In Brain Cancer Malignancy
 Kavya Puchhalapalli CALS Honors Project Report Spring 2017 Studying The Role Of DNA Mismatch Repair In Brain Cancer Malignancy Abstract Malignant brain tumors including medulloblastomas and primitive neuroectodermal
Type of file: PDF Size of file: 0 KB Title of file for HTML: Supplementary Information Description: Supplementary Figures
 Type of file: PDF Size of file: 0 KB Title of file for HTML: Supplementary Information Description: Supplementary Figures Supplementary Figure 1 mir-128-3p is highly expressed in chemoresistant, metastatic
Molecular and genetic analysis of stromal fibroblasts in prostate cancer
 Final report ESMO Translational Research Fellowship 2010-2011 Molecular and genetic analysis of stromal fibroblasts in prostate cancer Michalis Karamouzis Host Institute Department of Biological Chemistry,
Hunk is required for HER2/neu-induced mammary tumorigenesis
 Research article Hunk is required for HER2/neu-induced mammary tumorigenesis Elizabeth S. Yeh, 1 Thomas W. Yang, 1 Jason J. Jung, 1 Heather P. Gardner, 1 Robert D. Cardiff, 2 and Lewis A. Chodosh 1 1 Department
VIII Curso Internacional del PIRRECV. Some molecular mechanisms of cancer
 VIII Curso Internacional del PIRRECV Some molecular mechanisms of cancer Laboratorio de Comunicaciones Celulares, Centro FONDAP Estudios Moleculares de la Celula (CEMC), ICBM, Facultad de Medicina, Universidad
Spherical Nucleic Acids For Advanced Wound Healing Applications Chad A. Mirkin
 Spherical Nucleic Acids For Advanced Wound Healing Applications Chad A. Mirkin Departments of Chemistry, Infectious Disease, Materials Science & Engineering, Chemical & Biological Engineering, and Biomedical
BIO360 Quiz #1. September 14, Name five of the six Hallmarks of Cancer (not emerging hallmarks or enabling characteristics ): (5 points)
: (5 points)") Name: BIO360 Quiz #1 September 14, 2012 1. Name five of the six Hallmarks of Cancer (not emerging hallmarks or enabling characteristics ): (5 points) 2. The controversial hypothesis that only a small subset
Name: BIO360 Quiz #1 September 14, 2012 1. Name five of the six Hallmarks of Cancer (not emerging hallmarks or enabling characteristics ): (5 points) 2. The controversial hypothesis that only a small subset
Supplementary Fig. 1: ATM is phosphorylated in HER2 breast cancer cell lines. (A) ATM is phosphorylated in SKBR3 cells depending on ATM and HER2
 ATM is phosphorylated in SKBR3 cells depending on ATM and HER2") Supplementary Fig. 1: ATM is phosphorylated in HER2 breast cancer cell lines. (A) ATM is phosphorylated in SKBR3 cells depending on ATM and HER2 activity. Upper panel: Representative histograms for FACS
Supplementary Fig. 1: ATM is phosphorylated in HER2 breast cancer cell lines. (A) ATM is phosphorylated in SKBR3 cells depending on ATM and HER2 activity. Upper panel: Representative histograms for FACS
Figure S1. Sorting nexin 9 (SNX9) specifically binds psmad3 and not psmad 1/5/8. Lysates from AKR-2B cells untreated (-) or stimulated (+) for 45 min
 specifically binds psmad3 and not psmad 1/5/8. Lysates from AKR-2B cells untreated (-) or stimulated (+) for 45 min") Figure S1. Sorting nexin 9 (SNX9) specifically binds psmad3 and not psmad 1/5/8. Lysates from AKR2B cells untreated () or stimulated () for 45 min with 5 ng/ml TGFβ or 10 ng/ml BMP4 were incubated with
Figure S1. Sorting nexin 9 (SNX9) specifically binds psmad3 and not psmad 1/5/8. Lysates from AKR2B cells untreated () or stimulated () for 45 min with 5 ng/ml TGFβ or 10 ng/ml BMP4 were incubated with
shehab Moh Tarek ... ManarHajeer
 3 shehab Moh Tarek... ManarHajeer In the previous lecture we discussed the accumulation of oxygen- derived free radicals as a mechanism of cell injury, we covered their production and their pathologic
UNC-Duke Biology Course for Residents Fall
 UNC-Duke Biology Course for Residents Fall 2018 1 UNC-Duke Biology Course for Residents Fall 2018 2 UNC-Duke Biology Course for Residents Fall 2018 3 UNC-Duke Biology Course for Residents Fall 2018 4 UNC-Duke
Chapter 2. Aims & Objectives
 2.1. Statement of the problem: Earlier reports have shown ambiguous alteration of histone marks in response to DNA damage in asynchronized population of cells. These histone marks not only undergo dynamic
Impact of hyper-o-glcnacylation on apoptosis and NF-κB activity SUPPLEMENTARY METHODS
 SUPPLEMENTARY METHODS 3D culture and cell proliferation- MiaPaCa-2 cell culture in 3D was performed as described previously (1). Briefly, 8-well glass chamber slides were evenly coated with 50 µl/well
Supplementary Figures
 Supplementary Figures Supplementary Figure 1 DOT1L regulates the expression of epithelial and mesenchymal markers. (a) The expression levels and cellular localizations of EMT markers were confirmed by
Supplementary Figure 1: Comparison of acgh-based and expression-based CNA analysis of tumors from breast cancer GEMMs.
 Supplementary Figure 1: Comparison of acgh-based and expression-based CNA analysis of tumors from breast cancer GEMMs. (a) CNA analysis of expression microarray data obtained from 15 tumors in the SV40Tag
Breaking Up is Hard to Do (At Least in Eukaryotes) Mitosis
 Mitosis") Breaking Up is Hard to Do (At Least in Eukaryotes) Mitosis Prokaryotes Have a Simpler Cell Cycle Cell division in prokaryotes takes place in two stages, which together make up a simple cell cycle 1. Copy
Breaking Up is Hard to Do (At Least in Eukaryotes) Mitosis Prokaryotes Have a Simpler Cell Cycle Cell division in prokaryotes takes place in two stages, which together make up a simple cell cycle 1. Copy
Loss of RhoA promotes skin tumor formation. Supplementary Figure 1. Loss of RhoA does not impair F-actin organization.
 Supplementary Figure Legends Supplementary Figure 1. Loss of RhoA does not impair F-actin organization. a. Representative IF images of F-actin staining of big and small control (left) and RhoA ko tumors
Leucine Deprivation Reveals a Targetable Liability
 Cancer Cell, 19 Supplemental Information Defective Regulation of Autophagy upon Leucine Deprivation Reveals a Targetable Liability of Human Melanoma Cells In Vitro and In Vivo Joon-Ho Sheen, Roberto Zoncu,
Supplemental Table 1. Primers used for RT-PCR analysis of inflammatory cytokines Gene Primer Sequence
 Supplemental Table 1. Primers used for RT-PCR analysis of inflammatory cytokines Gene Primer Sequence IL-1α Forward primer 5 -CAAGATGGCCAAAGTTCGTGAC-3' Reverse primer 5 -GTCTCATGAAGTGAGCCATAGC-3 IL-1β
Supplementary Information
 Supplementary Information Significance of p53 dynamics in regulating apoptosis in response to ionizing radiation, and polypharmacological strategies Bing Liu 1,, Divesh Bhatt 1,, Zoltan N. Oltvai 2, Joel
Supporting Information. FADD regulates NF-кB activation and promotes ubiquitination of cflip L to induce. apoptosis
 1 2 Supporting Information 3 4 5 FADD regulates NF-кB activation and promotes ubiquitination of cflip L to induce apoptosis 6 7 Kishu Ranjan and Chandramani Pathak* 8 9 Department of Cell Biology, School
Lecture 10. G1/S Regulation and Cell Cycle Checkpoints. G1/S regulation and growth control G2 repair checkpoint Spindle assembly or mitotic checkpoint
 Lecture 10 G1/S Regulation and Cell Cycle Checkpoints Outline: G1/S regulation and growth control G2 repair checkpoint Spindle assembly or mitotic checkpoint Paper: The roles of Fzy/Cdc20 and Fzr/Cdh1
SUPPLEMENTARY INFORMATION
 doi:10.1038/nature10643 Supplementary Table 1. Identification of hecw-1 coding polymorphisms at amino acid positions 322 and 325 in 162 strains of C. elegans. WWW.NATURE.COM/NATURE 1 Supplementary Figure
Supplemental Materials. STK16 regulates actin dynamics to control Golgi organization and cell cycle
 Supplemental Materials STK16 regulates actin dynamics to control Golgi organization and cell cycle Juanjuan Liu 1,2,3, Xingxing Yang 1,3, Binhua Li 1, Junjun Wang 1,2, Wenchao Wang 1, Jing Liu 1, Qingsong
Mitosis and the Cell Cycle
 Mitosis and the Cell Cycle Chapter 12 The Cell Cycle: Cell Growth & Cell Division Where it all began You started as a cell smaller than a period at the end of a sentence Getting from there to here Cell
SUPPLEMENTARY INFORMATION
 DOI: 10.1038/ncb2607 Figure S1 Elf5 loss promotes EMT in mammary epithelium while Elf5 overexpression inhibits TGFβ induced EMT. (a, c) Different confocal slices through the Z stack image. (b, d) 3D rendering
Award Number: W81XWH TITLE: Synthetic Lethal Gene for PTEN as a Therapeutic Target. PRINCIPAL INVESTIGATOR: Kounosuke Watabe, Ph.D.
 AD Award Number: W81XWH-12-1-0151 TITLE: Synthetic Lethal Gene for PTEN as a Therapeutic Target PRINCIPAL INVESTIGATOR: Kounosuke Watabe, Ph.D. CONTRACTING ORGANIZATION: University of Mississippi Medical
Type of file: PDF Title of file for HTML: Supplementary Information Description: Supplementary Figures
 Type of file: PDF Title of file for HTML: Supplementary Information Description: Supplementary Figures Type of file: MOV Title of file for HTML: Supplementary Movie 1 Description: NLRP3 is moving along