Pho23 Regulates Gene Expression through Histone Methylation and an Mck1-Controlled Pathway in Budding Yeast
|
|
|
- Garry Milo Pierce
- 5 years ago
- Views:
Transcription
1 Pho23 Regulates Gene Expression through Histone Methylation and an Mck1-Controlled Pathway in Budding Yeast by Dennis Myers A thesis submitted in conformity with the requirements for the degree of Master of Science Department of Molecular Genetics University of Toronto Copyright by Dennis Myers 2010
2 Pho23 Regulates Gene Expression through Histone Methylation and an Mck1-Controlled Pathway in Budding Yeast Abstract Dennis Myers Master of Science Department of Molecular Genetics University of Toronto 2010 Eukaryotic organisms utilize post-translational modifications of highly conserved histone proteins to control gene expression programs. Methylation of lysine 4 on histone H3 (H3K4me) in particular, is thought to be associated with actively transcribed DNA. Paradoxically, recent evidence has suggested that H3K4me has a repressive function as well. Pho23, a member of the highly conserved ING family of tumour suppressor proteins, binds H3K4me and is a component of the gene repressive complex, Rpd3L. My genetic analysis suggests that Pho23 controls transcriptional repression via H3K4me and that Pho23 is itself regulated by the sequence-specific DNA-binding protein Ume6. Moreover, this Ume6-regulated function appears to be governed by Ume6 phosphorylation by Mck1, an evolutionarily conserved kinase. Finally, while Ume6/Pho23 are known to function together with the histone deacteylase Rpd3, my findings suggest the existence of an Rpd3-independent function for Pho23. ii
3 Acknowledgments Earning a Master of Science degree is not an easy feat. Aside from the years of undergraduate work to get into this program, hundreds of hours must be spent both in the lab and the library to complete a degree. I am proud of what I have accomplished but the work that went into this degree was not mine alone. First and foremost I want to thank my supervisor, Marc, who provided the support and motivation necessary to get through this process as well as the members of my lab that provided three years of both moral and technical assistance whenever it was needed. My family has always been there for me and I will always be appreciative for the love and care that they provide me. And last but not least, my friends. In three years a lot can change. I met many new people that I hope will remain close to me for the rest of my life but I also lost some people that I also expected would be close to me forever. The last three years have, more than anything, made me appreciate that the people that surround me are what keeps me going. Fortunately, they kept me going long enough to finish this degree. To all my friends past and present, to my coworkers and supervisor, and to my family; thank you. iii
4 Table of Contents Acknowledgments... iii Table of Contents... iv List of Tables... vii List of Figures... viii Abbreviations... x Chapter 1 Introduction Introduction to chromatin Histones, nucleosomes and DNA Post-translational modification of histones Histone acetylation Histone methylation Other histone modifications The histone code Histone modification binding proteins H3K4 methylation binding proteins Developmental control of gene expression through histone modifications Yeast as a model for cellular differentiation ING family proteins Mck The GSK3-β family GSK3-β family members in S. cerevisiae Rationale iv
5 Chapter 2 Materials and Methods Yeast strains and media Strains Ume6 alleles Media Titration assays Western Blot Microarray analysis Strains and growth conditions cdna synthesis and labeling Hybridization Microarray data collection Microarray dataset comparison Telomere proximity analysis Methylation and transcriptional frequency analysis Chapter 3 Investigation of regulation of Pho23 by Mck Over-expression of PHO23 is synthetically sick with mck Pho23 is regulated by Mck1 indirectly Pho23 may require non-enzymatic components of the Rpd3L complex to cause a growth defect Chapter 4 Genome-wide expression analysis of pho Deletion of PHO23 misregulates gene expression pho23 has similar silencing defects to rpd Deletion of PHO23 alters the expression of weakly transcribed and weakly methylated genes pho23 up and down genes have relatively low levels of H3K4me v
6 4.5 pho23 up genes overlap with set1 up genes Chapter 5 Discussion/Future directions Introduction to Discussion Mck1 regulation of Pho Mck1 regulates Pho23 through Ume The Rpd3L chromatin-binding core hypothesis Final thoughts on the regulation of Pho23 by Mck Genome-wide role of Pho Conclusion References Appendices Appendix Appendix vi
7 List of Tables Table 1: Yeast strains used in this study vii
8 List of Figures Figure 1: Distribution of methylation on H3K4 across an active ORF Figure 2: Venn diagram of two forms of Rpd3 complex components Figure 3: mck1 synthetic dosage lethality screen Figure 4: A model of the P GAL -PHO23 mck1 SDL interaction Figure 5: P GAL -PHO23 is SDL with mck1 and is suppressed by removal of H3K4 methylation Figure 6: Mck1 does not regulate Pho23 via protein stability or through phosphorylation of best putative phosphorylation site Figure 7: P GAL -PHO23 growth defect requires phosphorylation of Ume Figure 8: P GAL -PHO23 is not suppressed by deletion of RPD Figure 9: Some non-enzymatic components of the Rpd3L complex have dosage-dependent lethality with mck Figure 10: Deletion of ASH1, CTI6, DEP1 and TOD6 suppress P GAL PHO23 phenotype Figure 11: Dosage-dependent sickness of ASH1 and TOD6 can be suppressed by deletion of SWD Figure 12: pho23 mis-regulated genes have a statistically significant overlap with rpd3 misregulated genes Figure 13: Down regulated genes are enriched for proximity to the telomere while up regulated genes have a significant absence near the telomere Figure 14: Genes whose expression changes in pho23 versus wild-type are not evenly distributed across the spectrum of transcriptional frequency and H3K4me3 levels Figure 15: pho23 up genes are enriched for weakly expressed genes viii
9 Figure 16: Enrichment of pho23 up genes for weakly transcribed genes is not a global phenomenon for the deletion of all chromatin regulatory proteins Figure 17: pho23 up genes and down genes have lower levels of H3K4me3 at their promoters than unaffected genes Figure 18: Up genes with low levels of transcriptional frequency have low levels of methylation compared to other genes with the same transcriptional frequency Figure 19: Comparison of up genes in pho23 and set1 microarrays Figure 20: Suggested model of Mck1 regulation of the Rpd3L complex through phosphorylation of Ume ix
10 Abbreviations CTD COMPASS GNAT H3K4(me3) HMT HAT HDAC ING NURF ORF PHD PtdIns5P SAM SC SDL YPAD C-terminal domain Complex of proteins associated with SET1 Gcn5-related histone acetyltransferase Histone H3 lysine 4 (trimethylation) Histone methyltransferase Histone acetyltransferase Histone deacetylase Inhibitor of growth Nucleosome recognition factor Open reading frame Plant homeodomain Phosphotidylinositol-5-uhosphate Significance analysis of microarrays Synthetic complete Synthetic dosage lethality Yeast peptone extract with adenine and dextrose x
11 1 Chapter 1 Introduction 1.1 Introduction to chromatin Histones, nucleosomes and DNA DNA, the fundamental unit of heredity in all living organisms, is a highly organized fiber built from a sugar-phosphate backbone and a precise arrangement of nucleotides that confer the genetic information needed by the cell to accomplish any cellular function. In addition to the sequence of the DNA base-pairs, the organization and manipulation of the DNA molecule itself is essential to the regulation of gene expression. The use of mechanisms of gene regulation that are independent of DNA sequence is studied in the field of epigenetics. DNA is organized into individual chromosomes that fundamentally remain the same between individuals despite the fact that the sequences of their individual genes may vary considerably. Each chromosome can be hundreds of thousands or even millions of base pairs long and thus presents an organizational challenge to the cell. In both multi-cellular and unicellular organisms, a majority of the genetic information stored in the cell s DNA is not needed at any given time so the cell must organize the DNA in such a way that it can access the needed sequences as efficiently as possible. This is accomplished by the association of DNA with a series of proteins, forming the structure known as chromatin. The core unit of chromatin is the nucleosome, which is made of 146 base pairs of DNA wrapped around a group of eight proteins known as histones. The placement of histones along the DNA strand gives chromatin its characteristic beads on a string appearance. This arrangement allows the cell to regulate the accessibility of DNA to transcription factors and other proteins by, among other mechanisms, condensing and expanding the chromatin. These conformations are known as heterochromatin (highly condensed, inaccessible and generally inactive DNA) and euchromatin (relaxed, accessible and generally active DNA). Heterochromatin was originally defined cytologically [4] although nowadays the term is used more loosely (As I have in this thesis) to describe regions of the genome that are compacted and generally inaccessible to transcription factors.
12 2 The nucleosome comprises of an octamer of histone proteins called H2A, H2B, H3, and H4 and is formed by two H3-H4 dimers which interact with each other to form a core tetramer and two H2A-H2B dimers that bind this tetramer to complete the core protein complex [5]. Around this core octamer is spooled 146 base pairs of DNA to complete the nucleosome [5]. The bending of DNA around the histone octamer is thought to contribute to the inaccessibility of nucleosome-bound chromatin since most DNA-interacting factors appear to prefer naked, unbent DNA [6]. An additional histone, H1, adjoins adjacent nucleosomes by binding intervening DNA. While histone proteins were amongst the earliest proteins to be studied, the consensus was that they contributed nothing more than a mechanism of DNA compaction until Edgar and Ellen Stedman proposed that histones may play a critical role in gene regulation in 1950 [7]. Research in the ensuing 60 years has provided insight into the complex world of histonemediated gene regulation. As previously mentioned, nucleosomal histones have been thought to influence gene regulation simply by virtue of their intimate association with DNA: Nucleosomal DNA can limit the access of transcription factors binding to DNA. Accordingly, high-resolution nucleosomal mapping in Saccharomyces cerevisiae (a.k.a. budding yeast) demonstrated that, while nucleosomes occupy approximately 81% of the total genome, they are notably absent at transcription start sites [8]. Functionally related genes can be further clustered based on the pattern of nucleosome occupancy in their promoters [8]. We now know, however, that gene regulation based on the mere presence or absence of nucleosomes represents only a small portion of the regulatory capacity of chromatin. 1.2 Post-translational modification of histones Each of the four core histone proteins is well conserved throughout eukaryotic evolution and possess unstructured amino-terminal tails that contain sites of varied post-translational modifications. The position and function of these modifications are themselves also highly conserved. For example, phosphorylation of serine 10 on histone H3 plays a role in both transcription and cell division and is conserved from yeast to mammals [9]. Histone N-terminal tails protrude from the nucleosome and are accessible to a variety of enzymes that either add or reverse covalent modifications to the amino acid residues on the tail. Modifications include, but
13 3 are not limited to, phosphate groups, acetyl groups, ubiquitin moieties and methyl groups. While each modification may have specific regulatory roles, its relationship to surrounding modifications is also important to the understanding of its function within the cell. Because of this, it is necessary to understand the basic framework of the important modifications and how they relate to other modifications Histone acetylation Acetylation has been the most extensively studied histone modification to date. The discovery of a correlation between active transcription and histone acetylation in 1964 [10] stimulated the early stages of research into this modification. Histone acetylation is accomplished by enzymes known as histone acetyltransferases (HATs). These HATs catalyze addition of an acetyl group from acetyl-coa to the ε-amino group of specific lysine residues on the tails of each of the four core histones. HATs are divided into 5 families: Gcn5-related acetyltransferases (GNATs), MYST-related HATs, p300/cbp HATs, general transcription factor HATs and nuclear hormone related HATs (reviewed in [11]). Budding yeast contain 5 known HATs; Elp3 and Gcn5 belong to the GNAT family and Sas2, Sas3 and Esa1 are members of the MYST-related family. Higher eukaryotes contain many more HATs (reviewed in [12]). Although there are some exceptions, histone acetylation is generally associated with active transcription. For instance, it has been shown that all acetylatable lysines on histone H4 are heavily acetylated in euchromatic regions of the genome while heterochromatic regions remain hypoacetylated [13, 14]. Research addressing mechanistic connections between transcription and histone acetylation has revealed that specific HATs play important roles in nucleosomal positioning at promoters of genes which alters DNA accessibility to transcription factors. For example, Gcn5, the catalytic unit for three different HAT complexes in yeast [15, 16], is essential for the proper organization of nucleosomes at the PHO5 promoter [17] and influences the binding of Pho4, a transcription factor which regulates PHO5 expression. Histone acetylation also plays a role in transcription through the general decompaction of chromatin by neutralizing the positive charge on the histone tails, thereby weakening its association with DNA and permitting transcription factor access to DNA-binding sites [17-20]. More recently, research
14 4 has focused on histone acetylation as a modification that controls recruitment of other acetylhistone specific binding factors to chromatin. This recruiting role was supported by the discovery of acetylated lysine-binding domains known as bromodomains which provided some of the first evidence to support the role of the post-translational modifications of histones as sites of protein recruitment [21]. We now know that many protein complexes with specificity for specific acetylated histone residues are recruited to chromatin in a regulated manner. For example, the Swi/Snf ATP-dependent chromatin remodeling complex utilizes a bromodomain to enable binding to specific genomic regions, ensuring its proper regulation [22]. This phenomenon has helped support the development of a histone code hypothesis, discussed below. As HATs have been implicated primarily in the positive regulation of transcription, their counterparts, the histone deacetylases (HDACs), have been implicated in the negative regulation of transcription. Ten different HDACs have been identified in yeast; Rpd3, Hda1, Hos1-3, Sir2 and Hst1-4. While not all of these HDACs have been well characterized since they have only recently been discovered, Hda1, Rpd3 and Sir2 have been demonstrated to have very specific roles. Hda1, for instance is responsible for repressing many genes induced under precise environmental conditions [23]. Hda1 is also required, along with Rpd3, to oppose the Sir2- dependent spreading of silent heterochromatin at the telomeres, rdna and silent mating loci [24-26] The histone deacetylase Sir2, is responsible for maintaining large sections of the genome in an untranscribed, heterochromatic state by deacetylating histones and recruiting other Sir-family proteins which maintain the silent chromatin confirmation (reviewed in [27]). This seemingly contradictory role for histone decateylatiois not well understood but may be explained by a different role for the acetylation of different histone residues as proposed in DeRubertis et al. [28] Histone methylation Aside from acetylation, histone methylation has been one of the most well studied histone modifications. While much has been learned, there remain many questions about how histone methylation regulates cellular processes. In S. cerevisiae, H3K4, K36, K79 and H4R3 are the only residues known to be methylated while in mammals and other higher eukaryotes, dozens of
15 5 other residues are methylated across all four core histone proteins including the extensively studied, H3K9 residue. Histones can be methylated on either lysine or arginine residues by one of three families of histone methyltransferases; The SET-domain containing family, the DOT1/DOT1L family and the PRMT family. The SET-domain proteins and the DOT-family proteins methylate lysine residues on histone proteins while the PRMT family is responsible for histone arginine methylation. The methylation reaction is catalyzed by the addition of a methyl group from the substrate, S-adenosyl-L-methionine to the ε-amine group on the lysine residue [29]. This reaction can take place up to three times on a single lysine residue producing the possibility of three different varieties of methylated lysine; mono-,di- or tri-methylated [29]. In budding yeast, each of these three methylation states is achieved by the same histone methyltransferase (HMT). The mammalian genome boasts many more functional HMT s than methylated histone residues so some cooperation/redundancy must be present. In mammals for example, H3K9 is methylated by 5 different SET domain proteins; SUV39h1 [30], SUV39hh2[31], ESET[32], G9a[33] and GLP[34]. These HMT s have some cooperative activity as well as loci and cell-tissue specific activity [35]. The H3K9 HMT, Suv39 provided the first connection between the SET domain and methyltransferase activity. Methylation of H3K9 (a modification not present in budding yeast) represses gene expression by recruiting heterochromatin protein 1 (HP1) [36] which then spreads to other nucleosomes and aids in the condensation of heterochromatin [37]. Like all other histone methylations, methylation of H3K4 is highly conserved. H3K4me is associated with active transcription states since the Set1 HMT associates with RNA polymerase II during transcription initiation. Set1 was discovered as a member of the yeast COMPASS (Complex Proteins Associated with Set1) [38], components of which are required for the histone methylation function of Set1 to be present [39-41]. The COMPASS complex associates with the initiating form of RNA polymerase II that has been phosphorylated at serine 5 of its C-terminal domain (CTD) [42], explaining the association of H3K4me with actively transcribed chromatin. The processivity of RNA pol II and its controlled COMPASS association is responsible for the pattern of methylation across actively transcribed ORFs (Figure 1)[2, 42]. Histones are methylated through the promoter and along the body of the gene with a peak of H3K4me3 in the promoter and around the 5 start site of the gene [2]. The Paf1 complex, a
16 6 complex important for transcriptional elongation [43, 44], also plays a role in recruitment of the Set1 COMPASS complex with RNA pol II although the exact role that Paf1 plays in this is unknown [42]. Despite traditionally being thought to associate with active genes, Set1 and Paf1 play an important role in maintenance of silencing at telomeres and at the rdna locus [45-47]. These two contradictory roles for Set1 suggest that gene regulation via H3K4 methylation is complex and may support the hypothesis that different methylation states have different gene regulatory roles. Although, beyond what I have just described, little is known about what these roles may be.

17 7 Figure 1: Distribution of methylation on H3K4 across an active ORF. H3K4me3 peaks around the promoter and transcription start site, H3K4me2 is distributed across the body of the gene and H3K4me1 peaks at the 3 end of the gene [2].
18 8 The Set2 HMT is responsible for methylation of H3K36 and similarly to Set1, is associated with RNA pol II in a CTD phosphorylation-dependent manner. However, it is phosphorylation of serine 2 (and not serine 5) by the kinase Ctk1 that is required for effective Set2 association with RNA pol II and thus proper H3K36 methylation [48]. The elongation factor, Paf1 is also required for Set2 association with RNA pol II but deletion of SET2 perturbs transcriptional elongation [49] whereas deletion of SET1 does not appear to affect elongation. H3K36 methylation peaks at the 3 end of active ORFs which provides a recognition point for the chromodomain of Eaf3 [50], a subunit of the Rpd3S complex. This interaction recruits the Rpd3S complex to repress spurious intragenic transcription [51]. Members of the Dot1 family methylated H3K79 and do not contain SET domains [52]. This methylation event is conserved from yeast to humans and always requires a Dot1 homologue. H3K79 methylation is fundamentally different from other histone methylations in that it occurs in the globular histone fold region of H3 rather than in the N-terminal tail. DOT1 was originally discovered as a disrupter of telomeric silencing in S. cerevisiae [53] and is required for effective binding and silencing of these telomeric regions by the SIR proteins [54]. H3K79 methylation is unique because it appears only to have a repressive role compared to other methylated lysines that may have both positive and negative effects on transcription. However, no proteins have as of yet been identified which bind to H3K79 in vivo. Arginine residues on histones can also be methylated and have both positive and negative effects on transcription. The arginine methyltransferase PRMT5 may negatively regulate some genes along with some other chromatin binding complexes such as the msin3a/hdac2 and SWI/SNF [55]. PRMT1 has been shown to methylate H4R3 which leads to the acetylation of H3, a known active transcription-associated modification [56]. H4R3 is the only known methylated arginine in S. cerevisiae (reviewed in [57, 58]). For many years following the discovery of the post-translational modifications of histones, it was thought that these modifications were stable and irreversible. However, in 2004, Lsd1 the first histone lysine demethylase was identified [59]. The Lsd1 protein was found to demethylate H3K4me di- and mono-methylation but was unable to demethylate tri-methylated H3K4 [59], leading researchers to conclude that there must be other histone demethylases yet to be discovered. In fact, Lsd1 catalyzes the removal of methyl groups from lysines by amine
19 9 oxidation, a process that requires a protonated nitrogen atom which is not present in the trimethylated form. This led researchers to conclude that other demethylases must exist that are capable of demethylating tri-methylated lysine residues. In 2006 another type of histone demethylase was identified; the JmjC domain-containing family [60] which removes methyl groups using iron, oxygen and α-ketogluterate as cofactors to hydroxylate the methyl group and thus can operate on tri-methylated residues. Due to the dynamic nature of histone methylation, scientists have postulated that demethylation of histones plays an important role in developmental processes Other histone modifications Acetylation and methylation of histones, while central to my research, are not the only histone modifications. The phosphorylation of proteins has long been known to play an important signaling role in cellular function and the phosphorylation of histones is no exception. Histone phosphorylation was initially thought to be linked to processes such as apoptosis [61, 62] and the DNA damage response [63] as well as sporulation [64] and chromosome condensation [65] in yeast. Although some recent evidence has linked the phosphorylation of the histone variant H2A to the regulation of transcription [66]. Histones can also be modified by the addition of a number of different molecules including sumoylation, ubiquitination and ADPribosylation. 1.3 The histone code Histone modifications provide information for eukaryotic cells to accomplish many crucial cellular processes including transcription, recombination, cell cycle regulation and DNA damage repair. It has been suggested by David Allis and Thomas Jenuwein in the Histone code hypothesis that cells may use these modifications in a combinatorial manner [67]. proteins can: The histone code hypothesis states that different modifications on the tails of histone
20 10 generate synergistic or antagonistic interaction affinities with chromatinassociated proteins, which in turn dictate dynamic transitions between transcriptionally active or transcriptionally silent chromatin states [67] Furthermore, these marks operate in a manner such that the effect of a specific modification may be altered by the modifications that surround it. This combination of modifications provides a landscape of modified histones that are read by the cell and translated into specific transcriptional programs. This theory has been well studied in the 9 years since it was first published and numerous examples of this type of combinatorial action of histone modifications have been presented in the literature. For example, ubiquitinylation of histone H2B on lysine 123 at the GAL1 gene is required for effective methylation of H3 at the K4 and K79 residues [68]. These methylated residues aid in the recruitment of the SAGA histone acetyltransferase complex which adds acetyl groups to H3K9 and K14 and de-ubquitinates H2BK123 [69]. The removal of this ubquitin molecule is necessary to ensure methylation of K36 on histone H3 in the ORF of the gene which prevents the inappropriate transcription of intragenic transcripts [51]. Altogether, the addition and removal of these modifications are crucial to the effective activation of GAL1 transcription. This example illustrates the dynamic and sequential nature of the histone modifications and supports the idea that one modifications may be necessary for another to occur Histone modification binding proteins Central to the histone code hypothesis is the hierarchical series of protein interactions that govern gene regulation via histone modifications. All eukaryotic genomes contain a host of proteins with domains that bind specific histone modifications. Bromodomains, chromodomains and plant homeodomain (PHD) fingers are three such domains. Bromodomains bind to acetylated lysine residues [70] and are common in acetyltransferases such as Gcn5 and some nucleosome remodeling factors [71]. Chromodomains bind to methylated lysine residues [72] and are present in the aforementioned HP1 to mediate its binding to H3K9me. PHD fingers also bind methylated lysine residues and are present in the majority of H3K4 methylation-binding proteins. The study of proteins that bind modifications is as important as the study of the
21 11 modifications themselves because the binding proteins are responsible for the downstream effects (i.e. gene regulation, cell-cycle control, differentiation, etc.) of the modifications H3K4 methylation binding proteins H3K4 methylation binding proteins have many different gene regulatory effects. For instance, human Chd1 is an ATP-dependent chromatin remodeling factor that binds to H3K4me2/3 with two chromodomains [73]. Chd1 plays a role in gene activation by moving nucleosomes into an active conformation in an H3K4me3 dependent manner [74] and regulating the binding of chromatin factor HP1 [75]. Another chromatin remodeling complex, NURF (Nucleosome remodeling factor), binds to H3K4me3 to promote gene expression. The complex contains Isw1 and BPTF. The former is a chromatin remodeling ATPase while the latter contains both a bromodomain and a PHD finger. Chd1 and NURF bind to H3K4 methylation and have a distinct, positive impact on transcription. There exist other proteins that have negative regulatory effects that are dependent on binding of methylation on H3K4. The ING family of tumour suppressor proteins is the primary example of this and will be discussed shortly Developmental control of gene expression through histone modifications The complexity that can be achieved through these modifications provides a mechanism by which a eukaryotic cell can execute sweeping transcriptional changes in an efficient manner. Many developmental processes require this kind of drastic re-programming of the transcriptome and current research suggests that histone modifications are required for these processes to be executed. Histone methylation has been implicated in the maintenance of differentiated states [76] and progressively increases through developmental processes [77], depending on the residue being methylated. Research has also shown that, in embryonic stem cells, certain genes are methylated on both activating (H3K4) and repressing (H3K27) marks [78]. This arrangement poises these genes, which include many essential transcription factors, for activation as the cell differentiates
22 12 [78]. This data also suggests that H3K4 methylation is not only a mark of active chromatin but can also be associated with inactive genes. In concert with this, evidence has also arisen that H3K4 is not only associated with inactive genes but is also required for their repression. In support of this theory ING2, a PHD finger-containing, lysine methylation binding protein, was found to be a member of a repressive deacetylase complex and is required for the repression of proliferative genes as a DNA damage response [79]. Also, research in our lab has implicated the yeast H3K4me3 demethylase, Jhd2 in the regulation of the developmental process known as sporulation, in budding yeast. Jhd2-mediated removal of H3K4me3 is required globally for genes to be fully induced during spore differentiation. These results strongly suggest that H3K4 methylation, a mark previously thought to be a hallmark of active genes, has an essential role in gene repression Yeast as a model for cellular differentiation The budding yeast, S. cerevisiae is a simple organism, well-suited to the study of histone modifications during development. During sporulation, diploid yeast will go through a round of DNA replication followed by two meiotic divisions and finally sporogenesis. The result is four haploid cells, each with a thick spore wall, packaged into a sac-like membrane known as the ascus. Sporulation is an excellent model in which to study differentiation while avoiding the difficulties and complexities associated with studying more complex organisms. Elucidating the repressive role of H3K4me3 is central to the work in the Meneghini lab but little evidence of how H3K4-mediated repression is accomplished was available until the ING2 protein was identified as being a member of the repressive HDAC complex, msin3a-hdac1 [79]. Budding yeast have three ING family members in their genome ING family proteins The ING (Inhibitor of growth) family is a highly conserved family of tumour suppressor proteins that contain a PHD finger responsible for their interaction with methylated histones. The first member of the ING family, ING1, was discovered in a screen for cdna fragments capable
23 13 of promoting neoplastic growth [80]. Since this discovery four other human ING proteins (ING2-5) have been discovered as well as three ING family members in budding yeast; YNG1, YNG2 and PHO23. The PHD finger contains a C 4 HC 3 zinc finger and is the region with the most similarity between ING proteins [81]. As previously discussed in relation to the BPTF subunit of the NURF complex (Section 1.3.2), the PHD domain is critical for binding to methylated lysine residues [82, 83]. In a study by the Gozani lab, the methyl-lysine binding specificity of the 14 PHD finger-containing proteins in the S. cerevisiae genome was analyzed and it was found that 12 of the 14 bind to either H3K36 or H3K4 methylation [83]. The three ING proteins in S. cerevisiae bind to both di- and tri-methylation of H3K4 [83]. The ING family proteins have a diverse range of functions that are all required for their role as tumour suppressors. These functions include cell-cycle regulation, DNA damage repair and apoptosis. ING2 and ING3 in particular have been shown to negatively regulate cell proliferation [84, 85] while ING1 has the most well-defined role in apoptosis [86, 87]. Research in yeast has demonstrated that yeast ING proteins are capable of fulfilling the p53 transcriptional regulation functions associated with mammalian INGs [88]. These data suggest that, despite the fact that yeast has fewer ING family proteins than mammals, they are functionally closely related and much can be learned about ING function by studying the yeast homologs. In addition to binding to methylated lysine residues, the ING proteins are known to have other significant binding partners that can be divided into three different groups; HAT or HDAC complexes, the phosphatidylinositol 5-phosphate (PtdIns5P) signaling lipids and other gene regulatory proteins (e.g. transcription factors, etc.). All three of the budding yeast INGs interact with either an HAT or HDAC complex [89]; Yng1 is a member of the NuA3 HAT complex [90] and is required for its interaction with chromatin and therefore is required for its ability to modify histone tails [90, 91], Yng2 is a member of the NuA4 HAT complex [92] and is essential for the complex s ability to acetylate nucleosomes [93, 94] and Pho23 is a member of the Rpd3L HDAC complex and is required for its stability and its gene regulatory effects [95].
24 Pho23 Of particular interest to our lab is the yeast ING protein, Pho23, because of its known H3K4me3 binding activity and its association with the gene repressive complex, Rpd3L. PHO23 was identified through a genetic screen as a suppressor of PHO5 activity [96]. Pho5 is a secreted acid phosphatase whose expression is induced in response to low levels of inorganic phosphate [97]. Pho23 was initially suspected of being a subunit of the Rpd3L complex based on the fact that pho23 exhibited a similar PHO5 induction pattern to that of rpd3, sin3 and sap30, all of whom are components of Rpd3L [96, 98]. Subsequent biochemical data confirmed this suspicion [95]. Rpd3 has subsequently been shown to be involved in the cellular localization of the phosphate/h + symporter, Pho84 [99]. Deletion of RPD3 results in inappropriate recycling of Pho84 and leads to induction of PHO5 [99]. These results are consistent with Pho23 acting within the Rpd3L complex to repress PHO5 expression. Genome-wide localization data has also shown that Pho23 is localized to the nucleus is vegetatively growing cells [100] Pho23 in the Rpd3L complex The role of the Rpd3L complex, which has 14 total subunits [101], is still relatively poorly understood compared to its smaller counterpart, the Rpd3S complex. Rpd3, Sin3 and Ume1 are all members of both Rpd3 complexes. In addition to the three components that it shares with the Rpd3L complex, Rpd3S contains Eaf3 and Rco1 (Figure 2). These two proteins help recruit the complex to methylated H3K36 to repress spurious transcription in the body of ORFs [50, 51]. One model to explain these observations is that Rpd3S acts more globally and less specifically whereas the extra subunits in Rpd3L act to localize the complex to more specific targets in the genome. However, the role that Pho23 plays in the activity is not known.

25 Figure 2: Venn diagram of two forms of Rpd3 complex components [1] 15
26 Pho23 in the synthetic dosage lethality screen Through collaboration with the lab of Dr. Brenda Andrews, I determined that overexpression of Pho23 caused a significant growth defect when combined with a deletion of the GSK3-β family kinase MCK1. Dr. Dewald van Dyk from the Andrews lab conducted a synthetic dosage lethality (SDL) screen whereby a bait strain with a deleted kinase was crossed to a library of yeast ORFs under inducible promoters. The deletion of the kinase in combination with over-expression of one of its targets can yield a synthetically sick strain. This technique has proven useful in identifying the direct targets of kinases [102]. In the proof of principle screen, the kinase Pho85 was deleted and crossed to the over-expression library. Several known targets were identified as well as several putative targets who, with subsequent investigation, were determined to be bona fide [102]. Data from the mck1 SDL screen in coordination with previous studies using SDL screens suggested that Pho23 could be a direct target of the developmental regulatory kinase, Mck1 and that hyper-activation of the H3K4me3 binding protein, Pho23, causes a defect that inhibits the growth of cells (Figure 3). While SDL phenotypes have been used as evidence of direct regulatory interactions (with some success), an equally plausible interpretation of an SDL interaction is that there is in fact no direct regulatory interaction between the query and target genes. In this scenario, the synthetic sick phenotypes might just reflect a case of additive fitness consequences of deleting one gene and overexpressing another. Part of my thesis work was focused on investigating the nature of the mck1 PHO23 SDL phenotype, i.e. is it direct or indirect. Over the course of my graduate work, I pursued two specific goals: 1) Investigate the molecular underpinnings of the mck1 PHO23 synthetic phenotype; and 2) Investigate how Pho23 regulates gene expression in an H3K4me3-dependent manner and specifically how it translates methylation of H3K4 into gene repression.
 Plate number 9 from the SDL screen.")

27 17 Figure 3: mck1 synthetic dosage lethality screen. a) Plate number 9 from the SDL screen. MCK1 and mck1 as well as 2% Glucose and 2% Galactose. All strains in quadruplicate. P GAL -PHO23 (black square on mck1 /galactose plate) is column 5 row 4. b) Close-up of the two galactose plates. Black squares denote P GAL -PHO23.
28 Mck The GSK3-β family Mck1 is a GSK3-β kinase. The mammalian glycogen synthase kinase 3 was identified as an inhibitory kinase of glycogen synthase [ ], an enzyme responsible for the conversion of glucose to glycogen. The GSK3 kinases, however, are not limited to this function. They have been implicated in many cellular processes including cell fate determination [106, 107], cell cycle control [108] and environmental stress response [109, 110] as well as many diseases including Alzheimer s [111] and cancer [112]. GSK3 kinases are most well-known for their role in Wnt signaling [113] where inhibiting GSK3 phosphorylation of β-catenin is a crucial step in the canonical Wnt-signaling pathway [113]. The name does not do the enzyme justice as far as its diversity of function is concerned. There are two isoforms of GSK3 in mammals; GSK3-α and GSK3-β [105, 114]. These two isoforms are highly similar but not redundant [115, 116]. Homologues of GSK3 kinases exist in all eukaryotes and show a high degree of similarity in their kinase domains. With between 54 and 57% identity in their catalytic domain, the S. cerevisiae GSK3-β homologs have some of the lowest levels of similarity to the human GSK3-βs compared to the homologs of other species (reviewed in [117]). However, many functional aspects of the GSK3-β kinases are highly conserved in yeast GSK3-β family members in S. cerevisiae S. cerevisiae has 4 GSK3-β homologs; YGK3, RIM11, MRK1 and MCK1. The four homologs are likely the result of the whole genome duplication of S. cerevisiae followed by subsequent divergence of the paralogs RIM11 and MCK1 as well as YGK3 and MRK1 (reviewed in [118]). RIM11 and MCK1 have been extensively studied and implicated in the regulation of numerous proteins and processes. RIM11 stands for Regulator of Inducer of Meiosis 11 and is an important regulator of sporulation in yeast [119]. Rim11 phosphorylates both Rpd3L complex subunit, Ume6 [120], and key meiotic regulator, Ime1 [121]. In the presence of adequate
29 19 nitrogen and carbon, Rim11 is phosphorylated and, while it still binds to Ime1, it remains functionally inactive [121, 122]. The function of Mck1 is the best understood of all four of the GSK3-β homologs in budding yeast. Mck1 plays an important part in regulating the cell cycle in yeast through the camp dependent protein kinase A (PKA) pathway. This pathway determines whether, when cells exit G1 they continue their cell cycle, enter stationary phase (G0) or enter an alternate life cycle such as sporulation or pseudohyphal growth. PKA is inhibited by Mck1 although the exact mechanism of this inhibition is not known. Mck1 does phosphorylate Bcy1 [123], a negative regulator of PKA [124] and may therefore inhibit PKA indirectly through Bcy1. Mck1 also regulates the G2 to M transition by inhibiting Hsl1 [125] which is thought to inhibit Swe1, which delays the G2 to M transition in response to addition of Ca 2+ to the environment [126]. Mck1 also activates Swe1 indirectly by phosphorylating Rcn1 which activates calcineurin, an activator of Swe1 [127]. Despite the important roles that Mck1 has in regulating the cell cycle, mck1 yeast still grow normally under most conditions. Mck1 plays an important role in sporulation as well. It regulates meiosis similarly to Rim11 by inhibiting Ime1 in the presence of glucose and nitrogen, albeit indirectly via PKA [128]. Mck1 also phosphorylates Ume6 but, like Rim11, its exact mechanism of action is not entirely understood [109]. The mck1 mutant has defects both in initiation of meiosis and in the ascal maturation stage of sporulation [110], which indicates that its regulation of IME1 and Ume6 are not its only function during sporulation in yeast. 1.5 Rationale Research in the Meneghini lab is focused on how budding yeast use epigenetic mechanisms to execute sweeping transcriptional changes during developmental processes. As previously discussed, work in the lab has indicated that H3K4me3 is important for the repression of genes during sporulation despite the fact that it is commonly associated with active genes. From the SDL screen performed by Dr. van Dyk in the Andrews lab, I was able to identify a histone methylation binding protein that is regulated by a key developmental regulatory protein. The discovery of this pathway provided the opportunity to study how budding yeast use a
30 20 hierarchical series of protein-protein and protein-dna interactions to translate the information provided by the post-translational modification of histone H3 into a specific transcriptional profile. The SDL screen also provided a mechanism to study this pathway in vegetatively growing cells as opposed to dealing with stationary phase spores which are more complex to study in a laboratory setting. Over the course of my graduate work, I pursued two specific goals: 1) Investigate the regulation of Pho23 by Mck1; and 2) Investigate how Pho23 regulates gene expression in an H3K4me3-dependent manner and specifically how it translates methylation of H3K4 into gene repression.
31 21 Chapter 2 Materials and Methods 2.1 Yeast strains and media Strains All strains are constructed in the S288c background. All deletions were selected from the Invitrogen S288c Mat-a haploid deletion library (catalog #95041.H2P) with the exception of the rpd3 strains (dmy609 and dmy610) which were obtained through correspondence with Nicole Zimmerman from the lab of Dr. Leah Cowen. Table 1 is a list of all strains used in this study and their respective genotypes. P GAL -pho23-4x site-mutant strains were constructed by site-directed mutagenesis of the P GAL -PHO23 plasmid. The following oligonucleotides were used to amplify the wild-type plasmid and introduce mutations into the resulting polypeptide: Forward 5 - GCAAACTACGGAGGCGCCAGGCACGAGGCCCAAGACCACGCTGGTAACAACGCAA ACTCAAGAAAAAGAGCC-3 and Reverse 5 - GGCTCTTTTTCTTGAGTTTGCGTTGTTACCAGCGTGGTCTTGGGCCTCGTGCCTGGCG CCTCCGTAGTTTGC-3. The PCR products were digested with the restriction enzyme Dpn1 for 7 hours to remove the parent plasmid. The digested plasmid DNA was alcohol precipitated and was transformed into chemically competent DH5α E. coli. The transformed E. coli was miniprepped and sequenced to confirm successful mutation of the plasmid Ume6 alleles UME6-HA and ume6-ala3-ha alleles were obtained from the lab of Dr. Aaron Mitchell. Both alleles are contained on the prs406 integrating vector [129]. To integrate this vector, the plasmid was digested with the restriction enzyme PacI and transformed into a ume6::kanmx S288c strain (dmy4). Successful transformants can be selected for on synthetic complete media lacking uracil. Successful integrants were grown to saturation in YPAD medium and plated on synthetic complete medium containing 5-fluoroorotic acid to select for removal of the integrant. Successful de-integration results in strains that lack the ability to grow on media containing G418 (i.e. the ume6::kanmx allele has been looped out and the ume6-ala3-ha or UME6-HA
32 22 allele remains). The successful integration of the mutated allele into the chromosome was confirmed by sequencing Media All experiments were conducted with either YPAD (yeast peptone extract medium supplemented with adenine and dextrose and solidified with 4% agar where necessary) or Synthetic complete medium without uracil (Yeast nitrogen base without amino acids supplemented with ammonium sulfate and Sunrise scientific SC ura powder (catalog # ) and a specified carbon source and stabilized with 4% agar where necessary).
33 23 Table 1: Yeast strains used in this study Strain Mating type Plasmid Genotype dmy1 a his3 3 ura3 2 leu2 2 pho23 ::KAN dmy110 a his3 3 ura3 2 leu2 2 dmy150 a pegh his3 3 ura3 2 leu2 2 dmy152 a pegh-pho23 his3 3 ura3 2 leu2 2 dmy153 a pegh his3 3 ura3 2 leu2 2 mck1::natmx dmy155 a pegh-pho23 his3 3 ura3 2 leu2 2 mck1::natmx dmy257 a dmy259 a pegh-pho23-4x his3 2 ura3 1 leu2 1 pegh-pho23-4x his3 3 ura3 2 leu2 2 mck1::natmx dmy287 a pegh-ash1 his3 1 ura3 0 leu2 0 lyp1 met15 0 dmy289 a pegh-tod6 his3 1 ura3 0 leu2 0 lyp1 met15 0 dmy316 a pegh-ash1 his3 1 ura3 0 leu2 0 lyp1 met15 0 swd3 ::KAN dmy319 a pegh-tod6 his3 1 ura3 0 leu2 0 lyp1 met15 0 swd3 ::KAN dmy4 a his3 3 ura3 2 leu2 2 ume6 ::KAN dmy442 a pegh his3 1 ura3 0 leu2 0 UME6-HA dmy443 a pegh-pho23 his3 1 ura3 0 leu2 0 UME6-HA dmy444 a pegh his3 1 ura3 0 leu2 0 ume6 - Ala3 -HA dmy445 a pegh-pho23 his3 1 ura3 0 leu2 0 ume6 - Ala3 -HA dmy471 a pegh can1 ::STE2p-His5 his3 1 ura3 0 leu2 0 lyp1 met15 0 isw1 ::KAN dmy472 a pegh can1 ::STE2p-His5 his3 1 ura3 0 leu2 0 lyp1 met15 0 mck1::natmx isw1 ::KAN dmy473 a pegh can1 ::STE2p-His5 his3 1 ura3 0 leu2 0 lyp1 met15 0 swd3 ::KAN dmy474 a pegh can1 ::STE2p-His5 his3 1 ura3 0 leu2 0 lyp1 met15 0 mck1::natmx swd3 ::KAN dmy475 a pegh can1 ::STE2p-His5 his3 1 ura3 0 leu2 0 lyp1 met15 0 ume6 ::KAN dmy476 a pegh can1 ::STE2p-His5 his3 1 ura3 0 leu2 0 lyp1 met15 0 mck1::natmx ume6 ::KAN dmy477 a pegh-pho23 can1 ::STE2p-His5 his3 1 ura3 0 leu2 0 lyp1 met15 0 isw1 ::KAN dmy478 a pegh-pho23 can1 ::STE2p-His5 his3 1 ura3 0 leu2 0 lyp1 met15 0 mck1::natmx isw1 ::KAN dmy479 a pegh-pho23 can1 ::STE2p-His5 his3 1 ura3 0 leu2 0 lyp1 met15 0 swd3 ::KAN dmy480 a pegh-pho23 can1 ::STE2p-His5 his3 1 ura3 0 leu2 0 lyp1 met15 0 mck1::natmx swd3 ::KAN dmy481 a pegh-pho23 can1 ::STE2p-His5 his3 1 ura3 0 leu2 0 lyp1 met15 0 ume6 ::KAN dmy482 a pegh-pho23 can1 ::STE2p-His5 his3 1 ura3 0 leu2 0 lyp1 met15 0 mck1::natmx ume6 ::KAN dmy483 a pegh can1 ::STE2p-His5 his3 1 ura3 0 leu2 0 lyp1 met15 0 mck1::natmx dmy484 a pegh-pho23 can1 ::STE2p-His5 his3 1 ura3 0 leu2 0 lyp1 met15 0 mck1::natmx dmy486 a pegh can1 ::STE2p-His5 his3 1 ura3 0 leu2 0 lyp1 met15 0 dmy487 a pegh-pho23 can1 ::STE2p-His5 his3 1 ura3 0 leu2 0 lyp1 met15 0 dmy609 a pegh can1 ::STE2p-His5 his3 1 ura3 0 leu2 0 lyp1 met15 0 rpd3 ::KAN dmy610 a pegh-pho23 can1 ::STE2p-His5 his3 1 ura3 0 leu2 0 lyp1 met15 0 rpd3 ::KAN dmy639 a pegh his3 1 ura3 0 leu2 0 lyp1 met15 0 ash1 ::KAN dmy640 a pegh-pho23 his3 1 ura3 0 leu2 0 lyp1 met15 0 ash1 ::KAN dmy642 a pegh his3 1 ura3 0 leu2 0 lyp1 met15 0 cti6 ::KAN dmy643 a pegh-pho23 his3 1 ura3 0 leu2 0 lyp1 met15 0 cti6 ::KAN dmy646 a pegh his3 1 ura3 0 leu2 0 lyp1 met15 0 dep1 ::KAN dmy647 a pegh-pho23 his3 1 ura3 0 leu2 0 lyp1 met15 0 dep1 ::KAN dmy651 a pegh his3 1 ura3 0 leu2 0 lyp1 met15 0 tod6 ::KAN dmy652 a pegh-pho23 his3 1 ura3 0 leu2 0 lyp1 met15 0 tod6 ::KAN
34 Titration assays Yeast strains were inoculated into synthetic complete medium that lacks uracil to maintain selection for the URA3-marked plasmids with 2% raffinose and grown overnight to saturation. The saturated cultures are diluted to an OD 600 of 0.4 in 100µL of H 2 O in a 96-well plate. The diluted cultures are then serial diluted 10-fold four times. 5µL of each of the dilutions are plated onto synthetic complete plates lacking uracil containing either 2% galactose or 2% glucose. The cells are grown for 48 hours before being photographed. 2.3 Western Blot Strains were grown overnight to saturation in synthetic complete medium without uracil with 2% raffinose. Cells were diluted back to OD 600 of 0.25 in synthetic complete medium lacking uracil with either 2% glucose or 2% galactose. The cells were grown for ~3 hours until the strains had gone through two doublings and were harvested at an OD 600 of 1.0. Protein extraction was done according to Knop et. al [130], boiled and loaded onto a 10% acrylamide SDS-PAGE gel. Proteins were transferred to a nitrocellulose membrane and blotted first with anti-gst antibody (Open biosystems, CAB4169) and stained with ECL plus reagent (GE healthcare, RPN2132) to image. The membrane was stripped with 0.2M NaOH for 20 minutes, washed with water and re-probed with anti-h3 (Abcam, AB1791). 2.4 Microarray analysis Strains and growth conditions For the pho23 microarray, four biological replicates were conducted for each of the wild-type and pho23 genotypes and were grown to saturation overnight in YPAD medium. The eight cultures were diluted to an OD 600 of in YPAD and grown for ~16 hours until the OD 600 had reached 1.0. The cultures were once again diluted to 0.01 in 25mL of YPAD and grown until they reached an OD 600 of 0.7. The cells were harvested by centrifugation and flash frozen with liquid nitrogen.
35 25 RNA was isolated by incubating cell pellets at 65⁰C for 30 minutes in 46% acid phenol, 0.7% SDS and 46% AE Buffer (0.5M NaOAc, 0.1M EDTA) with occasional vortexing. The solution was spun down and supernatant transferred to Qiagen phase-lock tubes (Catalog #129065) and extracted twice with chloroform. Supernatant was incubated at -20⁰C overnight with 1/10 volume of 3M DEPC treated NaOAc and ~6mL isopropanol. The following day the solution is centrifuged at RPM for 30 minutes at 4⁰C, decanted and washed with 100% ethanol before being centrifuged at RPM. Pellets were then dried with a SpeedVac and resuspended in 500µL DEPC H 2 O where the A260:A280 ratio was assessed cdna synthesis and labeling cdna was constructed according to the Invitrogen SuperScript II (Catalog # ) protocol using random 9 base pair oligonucleotides and aminoallyl conjugated dutp at a 1:1 ratio with dttp. Following cdna synthesis, RNA was hydrolyzed by addition of NaOH to 0.3M and incubated at 65⁰C for 20 minutes. The NaOH was then neutralized by the addition of HCl to 0.3M and Tris ph 7.5 to 0.15M. cdna was purified using Qiaquick PCR purification kit (Catalog #28104). 500µL of PB buffer was added to cdna samples with 10µL 3M DEPC NaOAc and spun through column, reloaded and spun-again. Columns were then washed twice with 80% ethanol, dried and eluted in two-steps with 40µL of 65⁰C DEPC H 2 O in each step. Cy3 (GE Healthcare Catalog #PA23001) and Cy5 dyes (GE Healthcare Catalog #PA25001) were prepared by addition of 15µL of DMSO and 30µL of fresh bicarbonate buffer ph8.5 (For 25mL: 1 carbonate-bicarbonate buffer capsule (Sigma, Catalog #C CAP) and 191.7µL 6M HCl) to each dye packet. The cdna was coupled to Cy3 or Cy5 dyes by resuspending 2µg of dried cdna in 4µL of DEPC H 2 O and mixing with 4µL of the dye solution and incubating at room temperature in the dark for 1 hour. The labeling reaction is then quenched with 4µL of 4M hydroxylamine and incubated in the dark for 15 minutes. The labeled cdna is then purified using Qiagen MinElute Reaction cleanup kit (Catalog #28004). 500µL of PB buffer are added to each sample and loaded onto the purification column. The columns are washed 3 times with PE buffer and dried before elution with 10µL of EB buffer.
36 Hybridization One Cy3 and one Cy5 sample are added together along with 5µL 10X blocking agent (Agilent, catalog # ) and 25µL 2X GEx Hyb buffer (Agilent, catalog # ) and loaded into a well on the gasket slide (Agilent, catalog #G ) and sandwiched with the microarray slide according to the instructions provided by Agilent with their equipment. Samples were hybridized for 20 hours at 65⁰C. Following hybridization, slides are washed with 500mL Gene expression wash buffer 1 (Agilent, catalog # ) and 250µL 10% Triton X-102 (Agilent, catalog # ) and then washed with 500mL Gene expression wash buffer 2 (Agilent, catalog # ) at 37⁰C for one minute. The array slide was then scanned using the GenePix Professional 4200A microarray scanner from Molecular Devices Microarray data collection Gridding, flagging of bad spots and data extraction was performed using the SpotReader Image analysis software from Niles Scientific. Following gridding and data extraction, Lowess normalization was performed. All flagged spots were removed as well as all non yeast ORF control spots. The normalization was conducted using the web-based Goulphar microarray platform ( Global lowess normalization was performed and all flagged spots were removed. The resulting normalized data was used for all subsequent analysis. Spots whose intensity differed significantly between the pho23 and WT strains were identified using the Significance Analysis of Microarrays (SAM) developed at Stanford Univeristy [131]. Missing values were estimated using the nearest 10 neighbours and analyzed datasets using delta values that yielded a false discovery rate of 5%. The resultant list of genes whose expression increased in pho23 versus wild-type and those whose expression decreased in pho23 versus wild-type was used for all subsequent analysis unless otherwise specified Microarray dataset comparison To compare my pho23 dataset to the rpd3 dataset [3], pho23 microarray data was measured for significance by performing a student s t-test on the four replicates for all genes. Genes with a p-value of less than 0.05 and a magnitude fold change of 2 or greater were
37 27 considered significant for both the rpd3 and pho23 datasets (Appendix 2). For the set1 dataset, data from SAM analysis was available so the SAM analyzed pho23 dataset was also used. Significance of dataset overlap was measured using Fisher s exact test according to Fury et al [132] Telomere proximity analysis Telomere proximity analysis was conducted by calculating the expected number of up or down genes in a given bin (e.g. between and base pairs from the telomere) according to the total number of genes in that bin in the genome. Based on the expected number of genes in that bin, the graph represents how many times greater or less than the expected value the observed value is Methylation and transcriptional frequency analysis For Figure 17, H3K4me3 methylation ChIP-chip data from Pokholok et al. [2] was used for this analysis. The ChIP-chip data was divided into three groups: genes up-regulated by pho23, down-regulated by pho23 and genes unaffected by pho23. The ChIP-chip data for the genes in each of these groups was averaged across the ORFs. For example, the ChIP-chip data from the first probe within the ORF was averaged across all the up genes to create the first data point, the second probe was averaged to create the second data point, etc. The promoter region represents ChIP-chip data from 300bp 5 of the ORF start site. The first 8 data points from within the ORF were averaged to represent 5 region of the gene. Error bars represent standard error. Transcriptional frequency data from Holstege et al. [133] was used to calculate the number of up and down genes in each category of transcriptional frequency. The number of genes in each category of transcriptional frequency is represented by a percentage of total genes in the genome. For example, if 60 up genes were present in the lowest frequency category that contains 600 total genes in the genome, the data is represented as 10% of the genome in that category. P-values were calculated using a two-tailed z-test.
38 28 Chapter 3 Investigation of regulation of Pho23 by Mck1 3.1 Over-expression of PHO23 is synthetically sick with mck1 The mck1 SDL screen demonstrated that PHO23 over-expression is synthetically sick with deletion of MCK1. This suggests that, when over expressed in the absence of MCK1, Pho23 is having a detrimental effect on the cell s viability. As stated above, one simple explanation for this synthetic phenotype is that Mck1 negatively regulates Pho23 directly and that when relieved of Mck1-mediated inhibition, Pho23 overexpression is toxic. Of the many varied explanations for this Pho23-mediated toxicity, I was particularly interested in the possibility that Pho23 hyperactivation could cause reduced growth through global misregulation of gene expression owing to its H3K4me binding properties. Thus, the mck1 PHO23 SDL interaction seemed like a good entry point into investigating how pathways might converge onto H3K4me to influence gene expression. (Figure 4). The first goal of myproject was to test this model and determine what other proteins may be involved in this pathway. To begin I attempted to repeat the results of Dr. van Dyk using simple plate titre assays: does overexpression of PHo23 cause a sythnetic growth defect in combination with mck1? As a control, I also examined the growth rate of PGAL-PHO23 (the galactose-inducible overexpression strain) and mck1_ individually. As the screen from Dr. van Dyk demonstrated, over-expression of PHO23 in the absence of MCK1 is synthetically sick (Figure 5a, Row 4). However, Figure 5a, Row 2 shows that PHO23 overexpression alone is sufficient to induce a notable growth defect in the cell but disruption of MCK1 exacerbates the phenotype significantly. The mck1_ strain also exhibits a very mild growth defect on galactose (Figure 5a, Row 2). While these growth defects of mck1 and PGAL-PHO23 individually do not rule out the potential for a direct regulation of Pho23 by Mck1, they are consistent with, and suggestive of, a less experimentally tractable sick + sick = sicker interpretation. These observations suggest that, if Pho23 is regulated by Mck1, over-expression of PHO23 provides enough Pho23 protein to escape regulation by Mck1 but also suggests that the SDL result may not be a case of synthetic dosage lethality but rather two sick strains producing one even sicker
39 29 strain. Because my principle interest concerned the possibility that the SDL could be exploited to understand how Pho23 influences gene regulation, I carried on with further genetic tests. If hyperactivation of Pho23 causes reduced growth owing to Pho23 action on gene expression via H3K4me, one simple prediction is that removal of H3K4me should suppress the Pho23 effects. To test whether the fitness defect caused by over-expression of PHO23 requires H3K4me3, the SWD3 gene, which encodes an essential component of the Set1 COMPASS HMT complex [41], was deleted. Disruption of SWD3 abolishes methylation on lysine 4 of histone H3 [40]. By perturbing the Set1 complex and abolishing methylation in the P GAL -PHO23 strain, the slow growth phenotype associated with PHO23 over-expression is suppressed almost entirely (Figure 5a, Row 6). This supports the hypothesis that over-expression of PHO23 reduces the growth rate of cells in a manner that is dependent on H3K4me3. However, as growth rate is not completely reversed by swd3 (compare Figure 5a row 5 with row 6), there appears to be some small amount of reduced growth caused by PGAL-PHO23 that is independent of H3K4me3. However, as swd3 abolishes the activity of the Set1C, and the Set1C is known to have non histone targets, there existed the possibility that the incomplete suppression reflected H3K4me-independent pathways that were compromised by swd3. To address H3K4me more specifically, I made use of a strain in which the endogenous H3-H4 encoding loci are deleted and H3-H4 function is provided solely by a plasmid. By introducing mutated versions of these plasmids, it is possible to specifically evaluate the phenotypes of individual amino acid residues of H3 and/or H4. I engineered strains to evaluate P GAL -PHO23 growth phenotypes in cells expressing wild type H3 and a version of H3 that has mutated K4 to the unmethylatable residue alanine. Using these strains, I was able to detect more complete suppression of the P GAL - PHO23 growth phenotype (Figure 5b). Having shown that the P GAL -PHO23 growth phenotype is reversed by abolishing H3K4me, I next sought to evaluate the role of H3K4me in the context of the mck1 PHO23 SDL phenotype. I found that, although swd3 caused very strong reversal of the growth phenotype of an mck1 PGAL-PHO23 strain grown under inducing conditions (Figure 5a, compare rows 4 and 8), PGAL-PHO23 still caused a considerable degree of slow growth in this context that was apparently independent of SWD3 function (Figure 5a, compare rows 7 and 8). Another way of stating this result would be that at least part of the mck1 PGAL-PHO23 synthetic interaction persists in an swd3 strain. There are several potential explanations for this phenomenon. For
40 30 example, P GAL -PHO23 might be predicted to have consequences for the function of Rpd3 complexes that are at first not obvious. The Rpd3S complex is known to be recruited to ORFs (open reading frames) of genes, where it deacetylates histones to prevent spurious transcriptional initiation [51]. The recruitment of Rpd3S to chromatin is dependent upon H3K36me, rather that H3K4me. Accordingly, and as mentioned in the Introduction, Rpd3S does not contain Pho23. Perhaps overexpression of Pho23 causes a defect in the balance of Rpd3S and Rpd3L, and a consequential reduction of Rpd3S? Thus, in this scenario, P GAL -PHO23 might cause a loss of function phenotype for Rpd3S, perhaps explaining the incomplete suppression by swd3. Of the many varied ways one might investigate this possibility, simple genetic tests evaluating growth phenotypes of P GAL -PHO23 compared with strains that have Rpd3S-specific components deleted might shed further light on this matter. Another possibility might relate to subtle and synergistic genetic interactions related to swd3 and the fact that it affects other pathwats beyond H3K4 methylation. Evaluating suppression of the mck1 P GAL -PHO23 SDL phenotype by H3K4A would be a simple way to evaluate this. Nevertheless, the strong degree of suppression of the mck1 P GAL -PHO23 growth phenotype by swd3 is consistent with our results from above addressing P GAL -PHO23 growth phenotypes. While P GAL -PHO23 obviously represents a nonphysiological context, the SDL interaction has provided a experimental paradigm in which to probe genetic relationships with candidate regulators. Moreover, given that my data indicate that most, if not all, of the P GAL -PHO23 (single mutant) growth phenotype depends on H3K4me, further studies exploiting the P GAL -PHO23 represents a good way to evaluate how Pho23 might act to impinge on genome function via H3K4me. The simplest way to think about how Pho23 acts on the genome is through regulation of gene expression.
41 31 Figure 4: A model of the P GAL -PHO23 mck1 SDL interaction. Mck1negatively regulates Pho23, which binds to H3K4me3 to regulate gene expression Figure 5: P GAL -PHO23 is SDL with mck1 and is suppressed by removal of H3K4 methylation. a) Growth assay of PHO23 over-expression (P GAL -PHO23 on Galactose) with mck1 and swd3 in P GAL -PHO23 and mck1 backgrounds. b) Suppression of P GAL -PHO23 by mutation of H3K4 to alanine (H3K4A).
42 Pho23 is regulated by Mck1 indirectly If Mck1 regulates Pho23, one logical hypothesis of how this might occur is that Mck1 directly regulates Pho23 through phosphorylation. GSK3-β family kinases can regulate proteins through a phosphorylation event that targets the protein for proteosomal degradation [134]. Although no direct evidence of Mck1 using this mechanism to regulate its targets has been shown, indirect evidence of GSK3-β-dependent protein degradation has been shown in yeast [135]. To begin to evaluate if Pho23 is regulated at the level of protein abundance by Mck1, I compared the protein abundance of a GST-tagged copy of Pho23 in mck1 and MCK1 strain backgrounds. As a control, Figure 6a demonstrates that PHO23-GST is induced upon addition of galactose and not in the presence of glucose while Figure 6b demonstrates that the stability of the GST-tagged P GAL -PHO23 allele is unaffected by the presence or absence of MCK1. These data are not consistent with the hypothesis that Mck1 regulates Pho23 through targeting Pho23 for proteosomal degradation however; these results do not preclude the possibility that overexpression of PHO23 masks the effect of Mck1-mediated degradation. To further test for a direct interaction between Pho23 and Mck1, I mutated a series of four tandem putative GSK3-β sites on Pho23 to render the residues unphosphorylatable. The four residues (S191, S195, T199 and T203) are good candidates to be GSK3-β sites according to the criteria laid out in the literature [109, 136] (e.g. they consists of multiple repeats of the S/T-X-X- X-S/T sequence). Using the NetPhosYeast 1.0 Server ( that predicts phosphorylation sites in yeast proteins, the four phosphorylation sites were scored based on their likelihood of being phosphorylation target sites as the following: S191 = 0.378, S195 = 0.779, T199 = and T203 = out of a highest score of 1.00 (Figure 6c). If Pho23 is phosphorylated by Mck1 at these sites, the mutant allele would phenocopy deletion of MCK1 with PHO23 over-expression. However, the mutant PHO23 allele (P GAL -pho23-4x) grew at the same rate as the wild-type P GAL - PHO23 (Figure 6d, Rows 1 and 3). Deletion of MCK1 confirmed that the mutant allele behaves the same way as the wild-type PHO23 allele and is synthetically sick with mck1 (Figure 6d,
43 33 Rows 2 and 4). This analysis, which by no means constitutes a thorough investigation of whether Mck1 regulates Pho23 directly, also does not support this hypothesis. In vitro kinase assays and a more thorough biochemical approach (e.g. gel shift assays and mass spectrometry) would be an ideal method of further testing this hypothesis however, I elected to pursue other mechanisms of regulation of Pho23 by Mck1 in order to use my time most efficiently.
44 34 Figure 6: Mck1 does not regulate Pho23 via protein stability or through phosphorylation of best putative phosphorylation site. a) Western blot of Pho23-GST induction by galactose from P GAL - PHO23 plasmid. b) Western blot of Pho23-GST (P GAL -PHO23 lanes) and GST alone (EV lanes) protein abundance with and without MCK1. Black arrow indicates non-specific background band.c) Schematic of putative Mck1 phosphorylation site on Pho23. Red residues are putative target residues that were mutated to alanine with predicted phosphorylation scores from d) Titration assay comparing PGAL-pho23-4x allele with P GAL -PHO23 with and without MCK1
45 35 As outlined in the introduction of this thesis, Pho23 is a member of the histone deacetylase complex known as Rpd3L. This gene-repressive complex contains, among other proteins, the sequence specific DNA binding protein Ume6 [1]. Ume6 has both activating [137] and repressive [138] roles in the expression of early meiotic genes and is a target of Mck1 phosphorylation [109]. Since deletion of MCK1 exacerbates the P GAL -PHO23 phenotype and since no evidence of a direct interaction between Pho23 and Mck1 was found through genetic or biochemical investigation, I hypothesized that phosphorylation of Ume6 by Mck1 indirectly regulates Pho23 activity. To test this I examined whether deletion of UME6 would phenocopy deletion of MCK1 in the P GAL -PHO23 strain. Figure 7a demonstrates that deletion of UME6 exacerbates the dosage-dependent PHO23 phenotype and phenocopies mck1. This supports the idea that Pho23 activity is inhibited or limited by Ume6. To test whether inhibition of phosphorylation of Ume6 is sufficient to induce the synthetic growth defect, I obtained a mutant UME6 allele from the lab of Aaron Mitchell that was used in their investigation of Ume6 phosphorylation by Mck1 [109]. In this allele, the three Mck1 phosphorylation sites in Ume6, namely T99, T103 and S107 have been rendered unphosphorylatable by mutating the residues to alanine. The mutant UME6 allele, ume6-ha-ala3, phenocopies the SDL phenotype (mck1 P GAL -PHO23) (Figure 7b). The wild-type HA-tagged UME6 allele does not affect the dosagedependent PHO23 phenotype (Figure 7b, Row 6), while the ume6-ha-ala3 allele decreases the growth rate of the P GAL -PHO23 strain (Figure 7b, Row 8). Altogether the ume6 P GAL -PHO23 results (Figure 7a), the UME6 site mutant results (Figure 7b) and an absence of evidence of Mck1 phosphorylating Pho23, suggests that Pho23 is regulated by Mck1 indirectly through the sequence-specific DNA-binding protein Ume6. The data support the conclusion that Ume6 negatively regulates Pho23 and that Mck1 phosphorylation of Ume6 is necessary for this negative regulation to occur.
46 36 Figure 7: P GAL -PHO23 growth defect requires phosphorylation of Ume6. a) Deletion of UME6 is SDL with P GAL -PHO23. b) Mutation of Mck1 phosphorylation sites in Ume6 (ume6-ha-ala3) shows dosage-dependent lethality with PHO23.
47 Pho23 may require non-enzymatic components of the Rpd3L complex to cause a growth defect The implication of Ume6 in regulating Pho23 led to the hypothesis that Pho23 requires other components of the Rpd3L complex to perturb normal mitotic growth. To test this hypothesis, I obtained a PCR-confirmed rpd3 allele through correspondence with Nicole Zimmerman in the lab of Dr. Leah Cowen and transformed in the P GAL -PHO23 plasmid. Deletion of RPD3, however, failed to suppress the growth defect of the P GAL -PHO23 strain (Figure 8) leading to the conclusion that Rpd3 and its histone deacetylase activity are not required for the activity of Pho23 in this context. However, in the same mck1 SDL screen as the mck1 P GAL -PHO23 interaction was discovered, CTI6, the gene encoding another component of the Rpd3L complex [139] demonstrated a dosage-dependent slow growth phenotype in the mck1 strain. Further testing of Rpd3L components by Supipi Kaluarachchi from the Andrews lab, demonstrated that the Rpd3L subunits Ash1 and Tod6 also have similar dosage-dependent growth defects to Pho23 in mck1 (Figure 9) despite the fact that these genes did not appear as hits in the mck1 SDL screen. This suggests that some components (i.e. Ash1, Tod6, Cti6 and Pho23) may have some gene regulatory activity outside of the Rpd3L complex and independent of Rpd3 and Ume6 activity.


48 38 Figure 8: P GAL -PHO23 is not suppressed by deletion of RPD3 Figure 9: Some non-enzymatic components of the Rpd3L complex have dosage-dependent lethality with mck1. Experiment performed by Supipi Kaluarachchi from the Andrews lab. Robotic titration assay performed on 2% galactose.
49 39 To test the role of each of these components in the dosage-dependent slow growth phenotype of PHO23, I deleted each gene individually in the P GAL -PHO23 strain and performed the suppression experiment with replicates. The P GAL -PHO23 slow growth phenotype is weakly suppressed by deletion of CTI6, DEP1, TOD6 or ASH1 (Figure 10). These four Rpd3L subunits all contain chromatin binding motifs (the details of which are described in Section 5.4) and, along with Pho23, are the majority (5 of 7) of the chromatin-binding components in Rpd3L. The mild suppression of the P GAL -PHO23 phenotype by deletion of these genes suggests that, although deletion of no one component is sufficient to destroy the alternative complex, a subset of the proteins in the Rpd3L complex may function together independently of the Rpd3 deacetylase activity. The weakness of this suppression further indicates that each of these four components plays a non-essential role in this alternate complex. To further support the conclusion that these four Rpd3L components are acting with Pho23, I suppressed the dosagedependent sickness of ASH1 and TOD6 by deletion of SWD3 thereby demonstrating that H3K4 methylation is required for the P GAL -ASH1 and P GAL TOD6 phenotypes as well for the P GAL - PHO23 phenotype (Figure 11). Altogether these data are consistent with the conclusion that Pho23 has a role that is independent from Rpd3 deacetylase activity but requires other non-enzymatic components of the Rpd3L complex in order to cause the growth defect. A suggested model of Pho23 activity and regulation is presented and discussed in the discussion section of this thesis (Section 5.1).
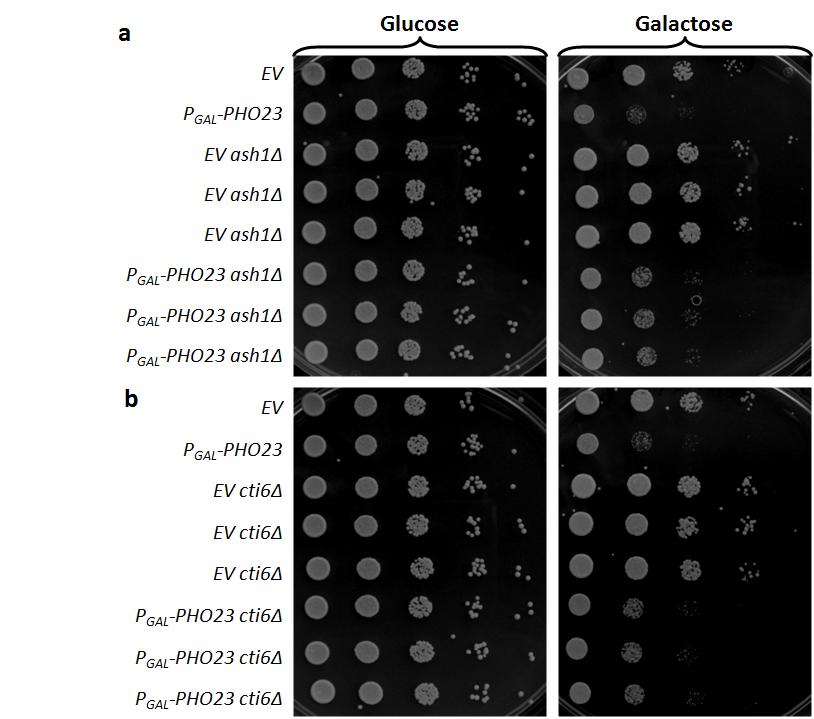
50 40
51 41 Figure 10: Deletion of ASH1, CTI6, DEP1 and TOD6 suppress P GAL PHO23 phenotype. a) Titration assay of ash1 suppression of P GAL PHO23 in triplicate. b) Titration assay of cti6 suppression of P GAL PHO23 in triplicate. c) Titration assay of dep1 suppression of P GAL PHO23 in triplicate. d) Titration assay of tod6 suppression of P GAL PHO23 in triplicate.

52 42 Figure 11: Dosage-dependent sickness of ASH1 and TOD6 can be suppressed by deletion of SWD3. Titration assay of PHO23, ASH1 and TOD6 over-expression with suppression of P GAL ASH1 and P GAL TOD6 by swd3.
53 43 Chapter 4 Genome-wide expression analysis of pho Deletion of PHO23 misregulates gene expression Despite the fact that the ING family was discovered over 14 years ago, little is known about how it regulates gene expression. The mammalian ortholog of Pho23, ING2, is known to mediate gene repression through its interaction with the msin3a/hdac1 complex [79]. This interaction requires the H3K4me3 binding activity of ING2, suggesting that a primary role of the ING family proteins may be to translate the H3K4me3 modification into gene repression. To begin to study the gene expression regulatory effect of the ING family, I performed genomewide expression analysis on a pho23 strain. The log 2 ratios of pho23 expression levels over wild-type expression levels were analyzed for significance using Significance Analysis of Microarray (SAM) software developed at Stanford University [131]. Appendix 1 lists the 698 genes whose expression is significantly altered by the deletion of PHO23 using a 5% false discovery rate. 560 of those genes have significantly increased expression in pho23 compared to wild-type (hereafter referred to as up genes ) and the remaining 138 have significantly lower expression in pho23 than in wild type cells (hereafter referred to as down genes ). The up genes have an average fold change of whereas the down genes have an average fold change of The larger number of up genes compared to down genes suggests that the primary gene regulatory role of Pho23 is to repress rather than activate genes; a finding that supports my hypothesis that H3K4me3 has a repressive effect on gene expression. To analyze the genes regulated by Pho23, I investigated whether either the up or down genes were enriched for Gene Ontology (GO) categories. The up genes are enriched for a cellular response to starvation (p-value= ) and mitochondrion degradation (p-value= ). The down genes only show enrichment for carbohydrate transport (p-value= ). It is worthwhile to note that the up genes are enriched in two categories whose genes are likely repressed under optimal growth conditions. The repression of infrequently transcribed genes by Pho23 will be discussed in more detail later in this chapter (Section 4.3).
54 pho23 has similar silencing defects to rpd3 Genes encoding chromatin regulatory proteins often have a significant effect on the proteins and protein modifications with which the regulatory proteins normally interact. Disruption or over-expression of these genes can alter the way genes are expressed and, in many cases, perturb normally silenced genes [53, ]. Deletion of RPD3 enhances silencing at telomeric loci, at rdna and at the silent mating loci [28]; three areas that are normally heavily silenced during vegetative growth. This contradicts the orthodoxy that histone deacetylation has a repressive rather than a de-repressive role. However, an analysis of the most recent genomewide rpd3 expression analysis available [3] demonstrates that down genes in rpd3 are enriched near telomeres (Figure 12a). Analysis of this new dataset supports previous research that suggests that Rpd3 antagonizes Sir2-mediated silencing at telomeres [143]. Pho23, a member of the Rpd3L complex, has previously been shown to play some role in this antisilencing function [95] although it has only been studied at specific loci and no genome-wide expression patterns have been published. In order to determine to what extent Pho23 functions with Rpd3 in the aforementioned silencing roles, I compared my pho23 microarray dataset to the rpd3 microarray dataset. Since only average log 2 ratios and not ratios from all individual replicates were available for the rpd3 microarray dataset, I used a different measure of significance for my pho23 dataset in order to provide the most meaningful comparison possible. The rpd3 dataset consisted of average log 2 ratios of rpd3 over wild-type and p-values from a student s t-test. I produced the same numbers for the pho23 dataset. For both datasets I used a p-value of less than 0.05 and a fold change greater than 2 as my significance cut-off. The resulting significant genes were as follows: 209 pho23 up genes, 92 pho23 down genes (Appendix 2), 209 rpd3 up genes and 82 rpd3 down genes. Figure 12b & c show the overlap between the pho23 and rpd3 genes. Both sets overlap significantly based on the hypergeometric distribution. The p-value for the overlap of the pho23 up genes and rpd3 up genes is 3.74x10⁻²² while the p-value for the overlap between down genes is 3.06x Considering the difficulties in comparing two datasets from completely independent microarray platforms, these measures of significance demonstrate than under normal vegetatively growing conditions, Pho23 and Rpd3 are likely acting together to regulate a subset of genes.
 b) Genes whose expression is increased in the mutant relative to wild-type.")
55 45 Figure 12: pho23 mis-regulated genes have a statistically significant overlap with rpd3 misregulated genes. a) Enrichment of rpd3 down-regulated genes proximal to the telomere. * denotes statistical significance (p <0.05) b) Genes whose expression is increased in the mutant relative to wild-type. c) Genes whose expression is decreased in the mutant relative to wild-type. [3]
56 46 Due to the significant overlap between the pho23 down genes and rpd3 down genes, I performed telomere proximity analysis on my original SAM analyzed data of pho23 as I did with the rpd3 dataset (Figure 13). The pho23 down genes have a very similar pattern to the rpd3 down genes in their enrichment for telomere proximity. Using a two-tailed, z-test to calculate p-values, the pho23 down genes are disproportionately present within 30kb of the telomeres (p <0.05). Also, the pho23 up genes are disproportionately absent within 20kb of the telomeres. These data support the view that like Rpd3, Pho23 has an essential role in the Rpd3L anti-silencing function at telomeres.
57 47 Figure 13: Down regulated genes are enriched for proximity to the telomere while up regulated genes have a significant absence near the telomere. * denotes p-value <0.05 for a one-sample z- test.
58 Deletion of PHO23 alters the expression of weakly transcribed and weakly methylated genes While the anti-silencing function of the Rpd3L complex provides an explanation for the pho23 down genes it does not explain the larger number of genes whose expression increases when PHO23 is deleted. Since the primary goal of my research is to examine how Pho23 mediates gene repression via H3K4me3, I created scatter plots of up genes and down genes comparing their transcriptional frequency and the level of H3K4me3 at the ORF start site. This provides a visual means of looking for a correlation between H3K4me3 levels, gene activity and pho23 -affected genes. H3K4me3 ChIP-chip data from the lab of Dr. Rick Young at the Whitehead institute [2] and transcriptional frequency data from the same lab [2] were used for this analysis. Figure 14a & b are the scatter plots of H3K4me3 levels versus transcriptional frequency of pho23 up genes (Figure 14a) and down genes (Figure 14b). Through visual inspection it appears as though pho23 up genes are skewed towards being weakly transcribed and weakly methylated whereas the pho23 down genes are skewed towards being weakly methylated but are not skewed towards a particular transcriptional frequency. Visual inspection obviously does not make a compelling argument but in this case, it rather suggests that these patterns should be more rigorously analyzed as I proceeded to do. Earlier in this chapter I discussed that the pho23 up genes were enriched for genes involved in the cellular response to starvation and mitochondrion degradation (Section 4.1). Both of these processes contain genes whose expression is unnecessary in vegetatively growing cells since they both represent stress responses rather than functions of a healthy, dividing cell [ ]. In concert with this, it appears from the scatter plot (Figure 14a) that the pho23 up genes contain more infrequently transcribed genes than would be expected at random. To test whether Pho23 predominantly represses genes that are weakly transcribed during vegetative growth, I performed an analysis of the transcriptional frequency distribution of those genes. Previous analysis of transcriptional frequency data utilized five bins to describe the frequency of transcription (numbers in brackets indicate total number of genes in the genome in each bin. Followed by the percentage of the genome in that bin.): those genes with less than one mrna transcribed per hour (1380, 27.25%), those with between 1 and 4 mrnas transcribed per hour (2156, 42.57%), those with between 4 and 16 mrnas transcribed per hour (1094, 21.60%),
59 49 those with between 16 and 50 mrnas transcribed per hour (255, 5.03%) and those with greater than 50 mrnas per hour (180, 3.55%) [2, 133]. Figure 15 shows that pho23 up genes are disproportionately genes with a low transcriptional frequency. Using a z-test to measure significance of the proportion of up genes in each transcriptional frequency class, I determined that the enrichment for genes with less than one mrna transcribed per hour was significant (pvalue <0.05) while the three classes of highest transcriptional frequency were significantly depleted of pho23 up genes (p-value <0.05). A similar pattern is not present in pho23 down genes. This analysis supports a model whereby Pho23 mediates gene repression of genes whose expression is not needed under optimal growth conditions.
60 50 Figure 14: Genes whose expression changes in pho23 versus wild-type are not evenly distributed across the spectrum of transcriptional frequency and H3K4me3 levels. a) Scatter plot of all unaffected genes and up genes. b) Scatter plot of all unaffected genes and down genes. The banding pattern at the low transcriptional frequency is representative of the fact the transcriptional frequency can only be measured to one decimal place.

61 51 Figure 15: pho23 up genes are enriched for weakly expressed genes. Significantly misregulated genes in pho23 grouped by transcriptional frequency. * denotes that the proportion of genes is significantly greater than expected (p-value <0.05) and # denotes that the proportion of genes is significantly less than expected (p-value <0.05).
62 52 To test that increased expression of weakly expressed genes is not just a common pattern resulting from the deletion of chromatin-associated proteins, I performed the same analysis with two other microarray data sets; isw2 and swi5 [148]. Isw2 is an ATP-dependent chromatin remodeling factor and, according to the available microarray dataset, deletion of the ISW2 gene results in 216 genes increasing in expression compared to wild-type. Swi5 is a transcription factor involved in cell-cycle regulation and deletion of the SWI5 gene results in 54 genes increasing in expression compared to wild type. In both cases, the up genes did not show the same pattern as with the pho23 genes (Figure 16a & b). In fact, the isw2 and swi5 up genes have the opposite enrichment and show a disproportionate number of genes whose expression is normally highly expressed in vegetatively growing yeast. These results demonstrate that the pattern of infrequently transcribed genes increasing in expression in pho23 is not a global pattern common to all genes encoding chromatin-associated proteins.
 Up genes from isw2 genome-wide expression profile binned according to transcriptional frequency. b) Up genes from swi5 genome-wide expression profile binned according to transcriptional frequency.")
63 53 Figure 16: Enrichment of pho23 up genes for weakly transcribed genes is not a global phenomenon for the deletion of all chromatin regulatory proteins. a) Up genes from isw2 genome-wide expression profile binned according to transcriptional frequency. b) Up genes from swi5 genome-wide expression profile binned according to transcriptional frequency. * denotes significant enrichment (p-value < 0.05). All data from microarray compendium from Hughes, T.R., et al., Functional discovery via a compendium of expression profiles. Cell, (1): p
64 pho23 up and down genes have relatively low levels of H3K4me3 The methylation versus transcriptional frequency scatter plots (Figure 14) suggested that there may be a correlation between Pho23-regulated genes and their H3K4me3 levels. Specifically, both the up genes and down genes appear to have lower than average levels of H3K4me3 at their start sites compared to genes whose expression is unaffected by deletion of PHO23. I more rigorously tested the hypothesis derived from the scatter plot by comparing the average H3K4me3 levels across the ORFs of the pho23 -affected genes and the rest of the genome. By doing this I determined that pho23 -affected genes have, on average, less methylation at their promoters and at the 5 end of their ORFs than an average gene (pvalues<0.5 based on a t-test for the difference between the three categories of genes at the average ORF start sites) (Figure 17). This result is curious because it would be expected that the deletion Pho23 would most drastically affect ORFs with abundant H3K4 trimethylation to which Pho23 could bind. However, this is not the case with PHO23 and suggests that the Pho23 gene expression regulatory mechanism is not as simple as expected. Explanations for this are discussed in Section 5.6. Since Pho23 represses weakly transcribed genes (Figure 15), I tested whether the low levels of methylation at the 5 ends of the up genes was due to the fact that these genes are weakly transcribed. By averaging the up genes at specific transcriptional frequencies, I found that pho23 up genes have lower levels of methylation compared to the rest of the genes in the genome at each of the transcriptional frequencies evaluated (Figure 18). This suggests that the low level of transcriptional frequency of the up genes is not sufficient to explain why they have low levels of H3K4me3 at the 5 ends of their ORFs. Since the down genes also have low levels of methylation it appears that Pho23 both positively and negatively affects genes with low levels of methylation.
 are averaged and plotted according to their location along an average ORF.")
65 55 Figure 17: pho23 up genes and down genes have lower levels of H3K4me3 at their promoters than unaffected genes. H3K4me3/H3 log 2 ratio at 9 locations through all genes in each category (Up genes, down genes and Unaffected genes) are averaged and plotted according to their location along an average ORF. Methylation ChIP-chip dataset from Pokholok et al. (2005) Figure 18: Up genes with low levels of transcriptional frequency have low levels of methylation compared to other genes with the same transcriptional frequency. Genes divided by transcriptional frequency at intervals of 0.1 mrnas/hour since the measurements are only accurate to one decimal place.
66 pho23 up genes overlap with set1 up genes My data in the previous section demonstrated that Pho23 affects genes with low levels of methylation. One interpretation of this is that the activity of Pho23 is not dependent on H3K4 methylation and that the negative correlation between Pho23-regulated genes and H3K4 methylation levels is due to some unknown factor. To further test whether gene regulation by Pho23 requires methylation on lysine 4 of histone H3, I compared my pho23 microarray data to the set1 data from Venkatasubrahmanyam et al [149]. Set1 is the HMT responsible for methylation on lysine 4 of histone H3 and its deletion results in a complete absence of methylation on that residue. The set1 dataset has 209 up genes and 31 of those are common between the set1 and the pho23 up genes which represents a significant overlap (p-value= 0.007) (Figure 19a). This suggests that, although Pho23 may have some H3K4me3-independent function, the deletion of SET1 (and therefore removal of H3K4me3) has a similar effect on gene expression as does deletion of PHO23. To elaborate on this hypothesis, I tested whether set1 up genes have the same transcriptional frequency pattern as pho23 up genes. set1 up genes are indeed significantly enriched for the lowest transcriptional frequency class (Figure 19b). This further supports the hypothesis that Pho23 requires H3K4me3 to maintain repression of genes under optimal growth conditions.
 Venn diagram of pho23 up genes and set1 up genes.")
.")
67 57 Figure 19: Comparison of up genes in pho23 and set1 microarrays. a) Venn diagram of pho23 up genes and set1 up genes. b) Genes binned as a percentage of total transcriptome according to 5 classes of transcriptional frequency. * denotes significantly greater percentage than expected by random (p-value < 0.05). # denotes significantly lower percentage than expected by random (p-value <0.05).
68 58 Chapter 5 Discussion/Future directions 5.1 Introduction to Discussion My research is focused on two main questions: Is the ING family protein, Pho23 regulated by the GSK3-β kinase, Mck1? And how does Pho23 mediate gene repression via H3K4me3? The former was addressed through genetic and molecular analysis of the SDL interaction of PHO23 and MCK1. The evidence I have uncovered is consistent with Pho23 being negatively regulated by Mck1 indirectly via Ume6, a sequence specific binding protein. The second question was addressed through genome-wide expression analysis of a pho23 strain. The results from this analysis support my hypothesis that Pho23 plays an important role in negatively regulating gene expression in concert with the histone deacetylase, Rpd Mck1 regulation of Pho23 My interest in Pho23 lies in the fact that, because of its H3K4me3 binding PHD finger, it is a good candidate to be a gene regulatory protein that operates in an H3K4me3-dependent manner. To test whether H3K4me3 was required for the gene regulatory effects of P GAL -PHO23, I removed H3K4 methylation by both disrupting the Set1 COMPASS complex responsible for this modification and by mutating the K4 residue to an unphosphorylatable alanine residue (Figure 5). Both of these genetic tests robustly suppressed the P GAL -PHO23 growth defect. This strongly supported my hypothesis that over-expression of PHO23 was having a harmful effect through H3K4me3. This conclusion, however, is somewhat weakened by the result in Figure 5 where the swd3 mck1 P GAL -PHO23 strain had a growth defect while neither the swd3 mck1 nor the swd3 P GAL -PHO23 strain were sick. This suggests that Pho23 has an H3K4 methylation independent role when MCK1 is deleted. This result is difficult to explain but, as I have discussed previously, Mck1 has many different roles. It is perhaps possible that the when the stress resistance role of Mck1 is removed through the deletion of MCK1, Pho23 has both H3K4
69 59 dependent and independent functions. Testing whether perturbing H3K4 methylation in the ume6-ha-ala3 mutant rescues the phenotype may provide support for this hypothesis. The pleotropic mck1 hypothesis is also supported by the fact that the ume6-ha-ala3 P GAL -PHO23 mutant grows slightly better than the mck1 P GAL -PHO23 mutant. This suggests that part of the growth defect in the mck1 P GAL -PHO23 strain is independent of the Ume6-dependent regulatory effect on Pho23. Also, the SGA interaction network from the lab of Dr. Charlie Boone demonstrated that there is a very mild negative interaction between mck1 and pho23 [150]. While I am not willing to draw any firm conclusions based a single result from a screen of this nature, it does provide support for the hypothesis that the deletion of MCK1 does have consequences other than just relieving the Ume6-dependent regulation on Pho23. The SDL interaction between PHO23 and MCK1, obtained through collaboration with Dr. van Dyk in the lab of Dr. Brenda Andrews was initially interpreted as evidence of Pho23 being a direct target of Mck1 kinase activity. This conclusion was drawn, in part, from the previous success of the SDL screen as a tool for identifying direct targets of kinases [102]. However, through genetic and biochemical analysis (Figure 6), I was unable to uncover any evidence to suggest that this was a direct interaction but rather that the mck1 and P GAL -PHO23 phenotypes were having an additive effect. The synthetic dosage lethality screen has been an effective technique for identifying the direct targets of kinases. This technique however, relies on two major assumptions: 1) phosphorylation is a modification that inhibits the function of its target and 2) that synthetic sickness is caused by the hyper-activation of the target protein and not by the additive effect of two independent pathways being mis-regulated by over-expression of one protein and the disruption of another (i.e. a true synthetic disruption of parallel pathways). In this case, Pho23 was identified as being a putative target of Mck1, however, since subsequent study revealed that both mck1 and PHO23 over-expression are sick on their own, further evidence was needed to demonstrate that Pho23 was a direct target of Mck1.
70 Mck1 regulates Pho23 through Ume6 Since attempts to find evidence of a direct interaction were insufficient to conclude that Mck1 phosphorylates Pho23 (Figure 6), I tested whether the known Mck1 target, Ume6 was involved in regulating Pho23. My genetic data suggest that Mck1 phosphorylation of Ume6 is necessary for Ume6 to inhibit Pho23. This type of function for Ume6 is not novel since it is known that Ume6 is a protein that interacts with different proteins under different conditions. Ume6 is phosphorylated by both Mck1 and the Mck1 paralog Rim11 which govern its interaction with the key meiotic activator Ime1 [120] while it also interacts with Isw2, Sin3 and Rpd3 (and possibly other Rpd3L components) to repress meiotic genes during vegetative growth [138, 151]. My data support the conclusion that under regular vegetative growth conditions, Ume6 is phosphorylated by Mck1 and interacts with Pho23 (and other Rpd3L components) but under some unknown conditions, simulated by deletion of MCK1 or over-expression of PHO23, Pho23 is released from its interaction with Ume6 and operates independently of Ume6. As previously mentioned, Ume6 is a multi-functional protein that can operate as both an activator and a repressor [152] and it plays an important regulatory role in the early stages of sporulation [138, ]. And while over-expression of any gene comes with caveats that suggest that the gain of function may not represent actual cellular processes, one potential interpretation of this data is that the over-expression of PHO23 represents a legitimate function for the protein that has not yet been described in the literature. Robust suppression of the P GAL - PHO23 phenotype by disruption of H3K4 methylation supports the notion that when overexpressed, Pho23 is not causing a cell growth defect merely through the toxicity caused by the over-abundance of a protein. While it is still a possibility that the consequences of overexpression of PHO23do not represent endogenous cellular processes, the possibility that a new function for this highly conserved protein has been discovered is worth investigating. The majority of genetic studies in yeast are conducted under optimal growth conditions; conditions where the cell is under no nutritional limitations. However, this does not accurately represent the physiological context of many cellular processes. The regulation of Ume6 is known to be dependent on, among other things, the presence of a fermentable carbon source and the availability of nitrogen. My hypothesis is that over-expression of PHO23 represents an alternate biological pathway that is not present in vegetatively growing cells. To test this hypothesis it
71 61 would be necessary to observe this pathway under sub-optimal conditions such as under respiratory or sporulation conditions. If my hypothesis is correct, hyper-activating this pathway by deleting MCK1 or over-expressing PHO23 would not have the same consequences as under optimal growth conditions. 5.4 The Rpd3L chromatin-binding core hypothesis Ume6 and Pho23 are both members of the histone deacetylase complex, Rpd3L. It was therefore logical to predict that the gene expression defect caused by Pho23 would be the result of inappropriate recruitment of Rpd3L to H3K4 methylation loci. I tested this prediction by attempting to suppress the P GAL -PHO23 phenotype by deleting the RPD3 gene (Figure 8). Deletion of RPD3 did not suppress the P GAL -PHO23 phenotype; however, genetic evidence suggested that Ash1, Cti6, Dep1 and Tod6 all are involved with Pho23 in its Rpd3/Ume6- independent regulation of gene expression (Figure 9- Figure 11). While not conclusive, these data suggest that Pho23 may operate in a complex other than Rpd3L. Up until now, Rpd3L is the only complex that Pho23 has been documented interacting with. There is also an interesting explanation for why Ash1, Cti6, Dep1 and Tod6 may have an Rpd3-independent function along with Pho23: three of these four components (Ash1, Cti6 and Tod6) have known chromatin interacting motifs and one (Dep1) has no known function. Ash1 has a zinc-finger DNA-binding domain and is involved in transcriptional repression [155]. Cti6 contains a PHD finger and has a role in transcriptional regulation via the recruitment of an HAT complex [156]. Tod6 contains two DNA-binding SANT domains and is involved in rrna and ribosome biosynthesis [157]. Dep1 has no discernable DNA or protein binding domains but has been implicated in the maintenance of telomere length [158]. Of the 14 components in the Rpd3L complex, Ash1, Cti6, Tod6, Pho23 and Ume6 along with another protein, Dot6 are the only subunits with known DNA or histone binding domains. No evidence as of yet suggests that Dot6 is a component of this potentially alternate Rpd3-indepenent complex. The components for which I have provided evidence of a potential alternate function comprise a majority of the chromatin-binding components of the Rpd3L complex. Sin3 is the main structural component of both Rpd3 complexes and Rpd3 is the catalytic component but Ash1, Cti6, Dep1, Tod6 and Pho23 are all components that are likely critical for the localization and specificity of the
72 62 complex. Hence, one model is that this chromatin-binding core of the Rpd3L complex is released from its association with Rpd3 and Sin3 in the absence of a phosphorylated Ume6 and the chromatin-binding core then recruits another enzymatic component or components to regulate a new set of genes (Figure 20). This model provides a number of testable hypotheses. Testing this model biochemically would be the first step towards providing a definitive description of the complexes involved in this pathway. Immunoprecipitating Pho23 and Ume6 in wild-type and mck1 backgrounds followed by mass spectrometry would be the most thorough method of identifying the specific proteins that interact with Ume6 and Pho23 when Ume6 is phosphorylated and unphosphorylated. However, co-immunoprecipitations with multiple tagged components (i.e. Pho23 vs Ume6, Pho23 vs Rpd3, Pho23 vs Cti6, etc.) would provide a simpler method of identifying what Rpd3L components interact with each other and under what conditions (i.e. mck1 or MCK1). To identify unknown components that may be involved in this pathway, a screen for suppressors of PHO23 over-expression and/or PHO23 over-expression with mck1 can be conducted using the DNA-barcode S. cerevisiae deletion library. This library contains all known viable gene deletion mutants with unique upstream and downstream identifiers. This allows for screening for genetic suppressors by microarray analysis as described in Jorgensen et al. [159].
 Deletion of MCK1 or mutation of phosphorylation sites on Ume6 results in an unphosphorylated Ume6 that is released from the Rpd3L complex.")
73 63 Figure 20: Suggested model of Mck1 regulation of the Rpd3L complex through phosphorylation of Ume6. a) Mck1 phosphorylates Ume6 to promote its interaction with the Rpd3L complex including Pho23. b) Deletion of MCK1 or mutation of phosphorylation sites on Ume6 results in an unphosphorylated Ume6 that is released from the Rpd3L complex. c) Following release by Ume6, Pho23 and the chromatin-binding core of the Rpd3L regulate genes through the recruitment of an unknown enzyme.
Eukaryotic transcription (III)
") Eukaryotic transcription (III) 1. Chromosome and chromatin structure Chromatin, chromatid, and chromosome chromatin Genomes exist as chromatins before or after cell division (interphase) but as chromatids
Eukaryotic transcription (III) 1. Chromosome and chromatin structure Chromatin, chromatid, and chromosome chromatin Genomes exist as chromatins before or after cell division (interphase) but as chromatids
Gene Expression DNA RNA. Protein. Metabolites, stress, environment
 Gene Expression DNA RNA Protein Metabolites, stress, environment 1 EPIGENETICS The study of alterations in gene function that cannot be explained by changes in DNA sequence. Epigenetic gene regulatory
Lecture 8. Eukaryotic gene regulation: post translational modifications of histones
 Lecture 8 Eukaryotic gene regulation: post translational modifications of histones Recap.. Eukaryotic RNA polymerases Core promoter elements General transcription factors Enhancers and upstream activation
Histones modifications and variants
 Histones modifications and variants Dr. Institute of Molecular Biology, Johannes Gutenberg University, Mainz www.imb.de Lecture Objectives 1. Chromatin structure and function Chromatin and cell state Nucleosome
Lecture 10. Eukaryotic gene regulation: chromatin remodelling
 Lecture 10 Eukaryotic gene regulation: chromatin remodelling Recap.. Eukaryotic RNA polymerases Core promoter elements General transcription factors Enhancers and upstream activation sequences Transcriptional
Epigenetics. Lyle Armstrong. UJ Taylor & Francis Group. f'ci Garland Science NEW YORK AND LONDON
 ... Epigenetics Lyle Armstrong f'ci Garland Science UJ Taylor & Francis Group NEW YORK AND LONDON Contents CHAPTER 1 INTRODUCTION TO 3.2 CHROMATIN ARCHITECTURE 21 THE STUDY OF EPIGENETICS 1.1 THE CORE
Transcription and chromatin. General Transcription Factors + Promoter-specific factors + Co-activators
 Transcription and chromatin General Transcription Factors + Promoter-specific factors + Co-activators Cofactor or Coactivator 1. work with DNA specific transcription factors to make them more effective
The Role of Protein Domains in Cell Signaling
 The Role of Protein Domains in Cell Signaling Growth Factors RTK Ras Shc PLCPLC-γ P P P P P P GDP Ras GTP PTB CH P Sos Raf SH2 SH2 PI(3)K SH3 SH3 MEK Grb2 MAPK Phosphotyrosine binding domains: PTB and
Transcriptional control in Eukaryotes: (chapter 13 pp276) Chromatin structure affects gene expression. Chromatin Array of nuc
 Chromatin structure affects gene expression. Chromatin Array of nuc") Transcriptional control in Eukaryotes: (chapter 13 pp276) Chromatin structure affects gene expression Chromatin Array of nuc 1 Transcriptional control in Eukaryotes: Chromatin undergoes structural changes
Transcriptional control in Eukaryotes: (chapter 13 pp276) Chromatin structure affects gene expression Chromatin Array of nuc 1 Transcriptional control in Eukaryotes: Chromatin undergoes structural changes
Eukaryotic Gene Regulation
 Eukaryotic Gene Regulation Chapter 19: Control of Eukaryotic Genome The BIG Questions How are genes turned on & off in eukaryotes? How do cells with the same genes differentiate to perform completely different,
Molecular Biology (BIOL 4320) Exam #2 May 3, 2004
 Exam #2 May 3, 2004") Molecular Biology (BIOL 4320) Exam #2 May 3, 2004 Name SS# This exam is worth a total of 100 points. The number of points each question is worth is shown in parentheses after the question number. Good
Molecular Biology (BIOL 4320) Exam #2 May 3, 2004 Name SS# This exam is worth a total of 100 points. The number of points each question is worth is shown in parentheses after the question number. Good
Genetics and Genomics in Medicine Chapter 6 Questions
 Genetics and Genomics in Medicine Chapter 6 Questions Multiple Choice Questions Question 6.1 With respect to the interconversion between open and condensed chromatin shown below: Which of the directions
Epigenetics: The Future of Psychology & Neuroscience. Richard E. Brown Psychology Department Dalhousie University Halifax, NS, B3H 4J1
 Epigenetics: The Future of Psychology & Neuroscience Richard E. Brown Psychology Department Dalhousie University Halifax, NS, B3H 4J1 Nature versus Nurture Despite the belief that the Nature vs. Nurture
Epigenetics Armstrong_Prelims.indd 1 04/11/2013 3:28 pm
 Epigenetics Epigenetics Lyle Armstrong vi Online resources Accessible from www.garlandscience.com, the Student and Instructor Resource Websites provide learning and teaching tools created for Epigenetics.
Ch. 18 Regulation of Gene Expression
 Ch. 18 Regulation of Gene Expression 1 Human genome has around 23,688 genes (Scientific American 2/2006) Essential Questions: How is transcription regulated? How are genes expressed? 2 Bacteria regulate
HDAC1 Inhibitor Screening Assay Kit
 HDAC1 Inhibitor Screening Assay Kit Catalog Number KA1320 96 assays Version: 03 Intended for research use only www.abnova.com Table of Contents Introduction... 3 Background... 3 Principle of the Assay...
Epigenetics q&more 01.11
 Laurie. Knight, istockphoto.com Epigenetics 6 Bookmarks About the reading of genes in the Book of Life Prof. Dr. Manfred Jung, Julia M. Wagner, Institute for Pharmaceutical Sciences, Albert-Ludwig-University
Biochemical Determinants Governing Redox Regulated Changes in Gene Expression and Chromatin Structure
 Biochemical Determinants Governing Redox Regulated Changes in Gene Expression and Chromatin Structure Frederick E. Domann, Ph.D. Associate Professor of Radiation Oncology The University of Iowa Iowa City,
SUPPLEMENTARY INFORMATION
 doi:10.1038/nature23267 Discussion Our findings reveal unique roles for the methylation states of histone H3K9 in RNAi-dependent and - independent heterochromatin formation. Clr4 is the sole S. pombe enzyme
Not IN Our Genes - A Different Kind of Inheritance.! Christopher Phiel, Ph.D. University of Colorado Denver Mini-STEM School February 4, 2014
 Not IN Our Genes - A Different Kind of Inheritance! Christopher Phiel, Ph.D. University of Colorado Denver Mini-STEM School February 4, 2014 Epigenetics in Mainstream Media Epigenetics *Current definition:
Jayanti Tokas 1, Puneet Tokas 2, Shailini Jain 3 and Hariom Yadav 3
 Jayanti Tokas 1, Puneet Tokas 2, Shailini Jain 3 and Hariom Yadav 3 1 Department of Biotechnology, JMIT, Radaur, Haryana, India 2 KITM, Kurukshetra, Haryana, India 3 NIDDK, National Institute of Health,
Alpha thalassemia mental retardation X-linked. Acquired alpha-thalassemia myelodysplastic syndrome
 Alpha thalassemia mental retardation X-linked Acquired alpha-thalassemia myelodysplastic syndrome (Alpha thalassemia mental retardation X-linked) Acquired alpha-thalassemia myelodysplastic syndrome Schematic
Protein methylation CH 3
 Protein methylation CH 3 methionine S-adenosylmethionine (SAM or adomet) Methyl group of the methionine is activated by the + charge of the adjacent sulfur atom. SAM S-adenosylhomocysteine homocysteine
Are you the way you are because of the
 EPIGENETICS Are you the way you are because of the It s my fault!! Nurture Genes you inherited from your parents? Nature Experiences during your life? Similar DNA Asthma, Autism, TWINS Bipolar Disorders
Regulation of Gene Expression in Eukaryotes
 Ch. 19 Regulation of Gene Expression in Eukaryotes BIOL 222 Differential Gene Expression in Eukaryotes Signal Cells in a multicellular eukaryotic organism genetically identical differential gene expression
Epigenetic Mechanisms
 RCPA Lecture Epigenetic chanisms Jeff Craig Early Life Epigenetics Group, MCRI Dept. of Paediatrics Overview What is epigenetics? Chromatin The epigenetic code What is epigenetics? the interactions of
1) DNA unzips - hydrogen bonds between base pairs are broken by special enzymes.
 DNA unzips - hydrogen bonds between base pairs are broken by special enzymes.") Biology 12 Cell Cycle To divide, a cell must complete several important tasks: it must grow, during which it performs protein synthesis (G1 phase) replicate its genetic material /DNA (S phase), and physically
Biology 12 Cell Cycle To divide, a cell must complete several important tasks: it must grow, during which it performs protein synthesis (G1 phase) replicate its genetic material /DNA (S phase), and physically
Chapter 10. Regulatory Strategy
 Chapter 10 Regulatory Strategy Regulation of enzymatic activity: 1. Allosteric Control. Allosteric proteins have a regulatory site(s) and multiple functional sites Activity of proteins is regulated by
The functional investigation of the interaction between TATA-associated factor 3 (TAF3) and p53 protein
 and p53 protein") THESIS BOOK The functional investigation of the interaction between TATA-associated factor 3 (TAF3) and p53 protein Orsolya Buzás-Bereczki Supervisors: Dr. Éva Bálint Dr. Imre Miklós Boros University of
THESIS BOOK The functional investigation of the interaction between TATA-associated factor 3 (TAF3) and p53 protein Orsolya Buzás-Bereczki Supervisors: Dr. Éva Bálint Dr. Imre Miklós Boros University of
mirna Dr. S Hosseini-Asl
 mirna Dr. S Hosseini-Asl 1 2 MicroRNAs (mirnas) are small noncoding RNAs which enhance the cleavage or translational repression of specific mrna with recognition site(s) in the 3 - untranslated region
Problem Set 5 KEY
 2006 7.012 Problem Set 5 KEY ** Due before 5 PM on THURSDAY, November 9, 2006. ** Turn answers in to the box outside of 68-120. PLEASE WRITE YOUR ANSWERS ON THIS PRINTOUT. 1. You are studying the development
R. Piazza (MD, PhD), Dept. of Medicine and Surgery, University of Milano-Bicocca EPIGENETICS
, Dept. of Medicine and Surgery, University of Milano-Bicocca EPIGENETICS") R. Piazza (MD, PhD), Dept. of Medicine and Surgery, University of Milano-Bicocca EPIGENETICS EPIGENETICS THE STUDY OF CHANGES IN GENE EXPRESSION THAT ARE POTENTIALLY HERITABLE AND THAT DO NOT ENTAIL A
R. Piazza (MD, PhD), Dept. of Medicine and Surgery, University of Milano-Bicocca EPIGENETICS EPIGENETICS THE STUDY OF CHANGES IN GENE EXPRESSION THAT ARE POTENTIALLY HERITABLE AND THAT DO NOT ENTAIL A
Post-translational modifications of proteins in gene regulation under hypoxic conditions
 203 Review Article Post-translational modifications of proteins in gene regulation under hypoxic conditions 1, 2) Olga S. Safronova 1) Department of Cellular Physiological Chemistry, Tokyo Medical and
Chemistry 107 Exam 4 Study Guide
 Chemistry 107 Exam 4 Study Guide Chapter 10 10.1 Recognize that enzyme catalyze reactions by lowering activation energies. Know the definition of a catalyst. Differentiate between absolute, relative and
The Biology and Genetics of Cells and Organisms The Biology of Cancer
 The Biology and Genetics of Cells and Organisms The Biology of Cancer Mendel and Genetics How many distinct genes are present in the genomes of mammals? - 21,000 for human. - Genetic information is carried
Introduction to Genetics
 Introduction to Genetics Table of contents Chromosome DNA Protein synthesis Mutation Genetic disorder Relationship between genes and cancer Genetic testing Technical concern 2 All living organisms consist
BIO360 Fall 2013 Quiz 1
 BIO360 Fall 2013 Quiz 1 1. Examine the diagram below. There are two homologous copies of chromosome one and the allele of YFG carried on the light gray chromosome has undergone a loss-of-function mutation.
Host cell activation
 Dept. of Internal Medicine/Infectious and Respiratory Diseases Stefan Hippenstiel Epigenetics as regulator of inflammation Host cell activation LPS TLR NOD2 MDP TRAF IKK NF-κB IL-x, TNFα,... Chromatin
Chromatin Modifications by Methylation and Ubiquitination: Implications in the Regulation of Gene Expression
 Annu. Rev. Biochem. 2006. 75:243 69 First published online as a Review in Advance on February 22, 2006 The Annual Review of Biochemistry is online at biochem.annualreviews.org doi: 10.1146/ annurev.biochem.75.103004.142422
Cell Cycle. Trends in Cell Biology
 Cell Cycle Trends in Cell Biology Cell Cycle The orderly sequence of events by which a cell duplicates its contents and divides into two Daughter Cells Activities of a cell from one cell division to the
On the way of revealing coactivator complexes cross talk during transcriptional activation
 DOI 10.1186/s13578-016-0081-y Cell & Bioscience REVIEW Open Access On the way of revealing coactivator complexes cross talk during transcriptional activation Aleksey N. Krasnov *, Marina Yu. Mazina, Julia
Signal Transduction Cascades
 Signal Transduction Cascades Contents of this page: Kinases & phosphatases Protein Kinase A (camp-dependent protein kinase) G-protein signal cascade Structure of G-proteins Small GTP-binding proteins,
The histone H3K36 demethylase Rph1/KDM4 regulates the expression of the photoreactivation gene PHR1
 Published online 3 February 2011 Nucleic Acids Research, 2011, Vol. 39, No. 10 4151 4165 doi:10.1093/nar/gkr040 The histone H3K36 demethylase Rph1/KDM4 regulates the expression of the photoreactivation
Removal of Shelterin Reveals the Telomere End-Protection Problem
 Removal of Shelterin Reveals the Telomere End-Protection Problem DSB Double-Strand Breaks causate da radiazioni stress ossidativo farmaci DSB e CROMATINA Higher-order chromatin packaging is a barrier to
Metabolism. Metabolic pathways. BIO 5099: Molecular Biology for Computer Scientists (et al) Lecture 11: Metabolic Pathways
 Lecture 11: Metabolic Pathways") BIO 5099: Molecular Biology for Computer Scientists (et al) Lecture 11: Metabolic Pathways http://compbio.uchsc.edu/hunter/bio5099 Larry.Hunter@uchsc.edu Metabolism Metabolism is the chemical change of
BIO 5099: Molecular Biology for Computer Scientists (et al) Lecture 11: Metabolic Pathways http://compbio.uchsc.edu/hunter/bio5099 Larry.Hunter@uchsc.edu Metabolism Metabolism is the chemical change of
Review. Ageing 2: Cancer! Review: Mutations. Mutations 2/14/11. The Raw Material for Evolution. The Double Edged Sword
 Ageing 2: Cancer! Review: The force of natural selection declines with ageing due to increase in extrinsic mortality (= weakening of natural selection) and reduction in reproduction with age (selection
PRC2 crystal clear. Matthieu Schapira
 PRC2 crystal clear Matthieu Schapira Epigenetic mechanisms control the combination of genes that are switched on and off in any given cell. In turn, this combination, called the transcriptional program,
Overview: Conducting the Genetic Orchestra Prokaryotes and eukaryotes alter gene expression in response to their changing environment
 Overview: Conducting the Genetic Orchestra Prokaryotes and eukaryotes alter gene expression in response to their changing environment In multicellular eukaryotes, gene expression regulates development
7.012 Quiz 3 Answers
 MIT Biology Department 7.012: Introductory Biology - Fall 2004 Instructors: Professor Eric Lander, Professor Robert A. Weinberg, Dr. Claudette Gardel Friday 11/12/04 7.012 Quiz 3 Answers A > 85 B 72-84
Removal of Shelterin Reveals the Telomere End-Protection Problem
 Removal of Shelterin Reveals the Telomere End-Protection Problem DSB Double-Strand Breaks causate da radiazioni stress ossidativo farmaci DSB e CROMATINA Higher-order chromatin packaging is a barrier to
Alternative splicing. Biosciences 741: Genomics Fall, 2013 Week 6
 Alternative splicing Biosciences 741: Genomics Fall, 2013 Week 6 Function(s) of RNA splicing Splicing of introns must be completed before nuclear RNAs can be exported to the cytoplasm. This led to early
Biochimica et Biophysica Acta
 BBAGRM-00286; No. of pages: 19; 4C: 8, 12 Biochimica et Biophysica Acta xxx (2010) xxx xxx Contents lists available at ScienceDirect Biochimica et Biophysica Acta journal homepage: www.elsevier.com/locate/bbagrm
Enzymes Part III: regulation II. Dr. Mamoun Ahram Summer, 2017
 Enzymes Part III: regulation II Dr. Mamoun Ahram Summer, 2017 Advantage This is a major mechanism for rapid and transient regulation of enzyme activity. A most common mechanism is enzyme phosphorylation
Amino acids. Side chain. -Carbon atom. Carboxyl group. Amino group
 PROTEINS Amino acids Side chain -Carbon atom Amino group Carboxyl group Amino acids Primary structure Amino acid monomers Peptide bond Peptide bond Amino group Carboxyl group Peptide bond N-terminal (
Chromatin Structure & Gene activity part 2
 Chromatin Structure & Gene activity part 2 Figure 13.30 Make sure that you understand it. It is good practice for identifying the purpose for various controls. Chromatin remodeling Acetylation helps to
EPIGENOMICS PROFILING SERVICES
 EPIGENOMICS PROFILING SERVICES Chromatin analysis DNA methylation analysis RNA-seq analysis Diagenode helps you uncover the mysteries of epigenetics PAGE 3 Integrative epigenomics analysis DNA methylation
DSB. Double-Strand Breaks causate da radiazioni stress ossidativo farmaci
 DSB Double-Strand Breaks causate da radiazioni stress ossidativo farmaci DSB e CROMATINA Higher-order chromatin packaging is a barrier to the detection and repair of DNA damage DSBs induce a local decrease
H2B Monoubiquitylation and H3 Methylation Levels
 Pittard 1 H2B Monoubiquitylation and H3 Methylation Levels Throughout Drosophila Development By Holly Pittard Senior Honors Thesis Biology University of North Carolina at Chapel Hill April16, 2016 This
Stem Cell Epigenetics
 Stem Cell Epigenetics Philippe Collas University of Oslo Institute of Basic Medical Sciences Norwegian Center for Stem Cell Research www.collaslab.com Source of stem cells in the body Somatic ( adult )
EpiQuik Circulating Acetyl Histone H3K18 ELISA Kit (Colorimetric)
") EpiQuik Circulating Acetyl Histone H3K18 ELISA Kit (Colorimetric) Base Catalog # PLEASE READ THIS ENTIRE USER GUIDE BEFORE USE Uses: The EpiQuik Circulating Acetyl Histone H3K18 ELISA Kit (Colorimetric)
EpiQuik Circulating Acetyl Histone H3K18 ELISA Kit (Colorimetric) Base Catalog # PLEASE READ THIS ENTIRE USER GUIDE BEFORE USE Uses: The EpiQuik Circulating Acetyl Histone H3K18 ELISA Kit (Colorimetric)
6.5 Enzymes. Enzyme Active Site and Substrate Specificity
 180 Chapter 6 Metabolism 6.5 Enzymes By the end of this section, you will be able to: Describe the role of enzymes in metabolic pathways Explain how enzymes function as molecular catalysts Discuss enzyme
Expert Intelligence for Better Decisions Epigenetics:
 Expert Intelligence for Better Decisions Epigenetics: Emerging Targets, Available Technologies, Expert Interviews, and an Epigenetic Community Perspective Using This Document Insight Pharma Reports are
Lecture 2: Virology. I. Background
 Lecture 2: Virology I. Background A. Properties 1. Simple biological systems a. Aggregates of nucleic acids and protein 2. Non-living a. Cannot reproduce or carry out metabolic activities outside of a
5.1. KEY CONCEPT Cells have distinct phases of growth, reproduction, and normal functions. 68 Reinforcement Unit 2 Resource Book
 5.1 THE CELL CYCLE KEY CONCEPT Cells have distinct phases of growth, reproduction, and normal functions. Cells have a regular pattern of growth, DNA duplication, and division that is called the cell cycle.
Biochemistry 673 Lecture 2 Jason Kahn, UMCP Introduction to steroid hormone receptor (nuclear receptor) signalling
 signalling") Biochemistry 673 Lecture 2 Jason Kahn, UMCP Introduction to steroid hormone receptor (nuclear receptor) signalling Resources: Latchman Lodish chapter 10, 20 Helmreich, chapter 11 http://www.nursa.org,
Biochemistry 673 Lecture 2 Jason Kahn, UMCP Introduction to steroid hormone receptor (nuclear receptor) signalling Resources: Latchman Lodish chapter 10, 20 Helmreich, chapter 11 http://www.nursa.org,
Biology. Lectures winter term st year of Pharmacy study
 Biology Lectures winter term 2008 1 st year of Pharmacy study 3 rd Lecture Chemical composition of living matter chemical basis of life. Atoms, molecules, organic compounds carbohydrates, lipids, proteins,
1. Identify and characterize interesting phenomena! 2. Characterization should stimulate some questions/models! 3. Combine biochemistry and genetics
 1. Identify and characterize interesting phenomena! 2. Characterization should stimulate some questions/models! 3. Combine biochemistry and genetics to gain mechanistic insight! 4. Return to step 2, as
Breast cancer. Risk factors you cannot change include: Treatment Plan Selection. Inferring Transcriptional Module from Breast Cancer Profile Data
 Breast cancer Inferring Transcriptional Module from Breast Cancer Profile Data Breast Cancer and Targeted Therapy Microarray Profile Data Inferring Transcriptional Module Methods CSC 177 Data Warehousing
Macro molecule = is all the reactions that take place in cells, the sum of all chemical reactions that occur within a living organism Anabolism:
 Macromolecule Macro molecule = molecule that is built up from smaller units The smaller single subunits that make up macromolecules are known as Joining two or more single units together form a M is all
Macromolecules. Large molecules made up of smaller building blocks or subunits. Chapter
 Macromolecules Large molecules made up of smaller building blocks or subunits Chapter 2.8 2.21 Types of macromolecules Carbohydrates Lipids Proteins Nucleic acids Carbohydrates Primary fuel source for
Gene Regulation Part 2
 Michael Cummings Chapter 9 Gene Regulation Part 2 David Reisman University of South Carolina Other topics in Chp 9 Part 2 Protein folding diseases Most diseases are caused by mutations in the DNA that
Dynamics of mono, di and tri-methylated histone H3 lysine 4 during male meiotic prophase I. Nuclei were co-stained for H3.1/H3.2. Progressing stages
 Dynamics of mono, di and tri-methylated histone H3 lysine 4 during male meiotic prophase I. Nuclei were co-stained for H3.1/H3.2. Progressing stages of spermatogenesis are shown from left to right. Arrows/dotted
Supplementary Figure S1. Appearacne of new acetyl groups in acetylated lysines using 2,3-13 C 6 pyruvate as a tracer instead of labeled glucose.
 Supplementary Figure S1. Appearacne of new acetyl groups in acetylated lysines using 2,3-13 C 6 pyruvate as a tracer instead of labeled glucose. (a) Relative levels of both new acetylation and all acetylation
Introduction to Cancer Biology
 Introduction to Cancer Biology Robin Hesketh Multiple choice questions (choose the one correct answer from the five choices) Which ONE of the following is a tumour suppressor? a. AKT b. APC c. BCL2 d.
DSB. Double-Strand Breaks causate da radiazioni stress ossidativo farmaci
 DSB Double-Strand Breaks causate da radiazioni stress ossidativo farmaci METODI DDR foci formation in irradiated (2 Gy) cells fixed 2 h later IRIF IRradiation Induced Focus Laser micro-irradiation DDR
BCHM3972 Human Molecular Cell Biology (Advanced) 2013 Course University of Sydney
 2013 Course University of Sydney") BCHM3972 Human Molecular Cell Biology (Advanced) 2013 Course University of Sydney Page 2: Immune Mechanisms & Molecular Biology of Host Defence (Prof Campbell) Page 45: Infection and Implications for Cell
BCHM3972 Human Molecular Cell Biology (Advanced) 2013 Course University of Sydney Page 2: Immune Mechanisms & Molecular Biology of Host Defence (Prof Campbell) Page 45: Infection and Implications for Cell
Chapter 11 How Genes Are Controlled
 Chapter 11 How Genes Are Controlled PowerPoint Lectures for Biology: Concepts & Connections, Sixth Edition Campbell, Reece, Taylor, Simon, and Dickey Copyright 2009 Pearson Education, Inc. Lecture by Mary
DOWNLOAD OR READ : PROTEIN METHYLTRANSFERASES PDF EBOOK EPUB MOBI
 DOWNLOAD OR READ : PROTEIN METHYLTRANSFERASES PDF EBOOK EPUB MOBI Page 1 Page 2 protein methyltransferases protein methyltransferases pdf protein methyltransferases N-alpha methyltransferases transfer
Cellular Signaling Pathways. Signaling Overview
 Cellular Signaling Pathways Signaling Overview Signaling steps Synthesis and release of signaling molecules (ligands) by the signaling cell. Transport of the signal to the target cell Detection of the
Tala Saleh. Ahmad Attari. Mamoun Ahram
 23 Tala Saleh Ahmad Attari Minna Mushtaha Mamoun Ahram In the previous lecture, we discussed the mechanisms of regulating enzymes through inhibitors. Now, we will start this lecture by discussing regulation
Cell Quality Control. Peter Takizawa Department of Cell Biology
 Cell Quality Control Peter Takizawa Department of Cell Biology Cellular quality control reduces production of defective proteins. Cells have many quality control systems to ensure that cell does not build
Chromatin-Based Regulation of Gene Expression
 Chromatin-Based Regulation of Gene Expression.George J. Quellhorst, Jr., PhD.Associate Director, R&D.Biological Content Development Topics to be Discussed Importance of Chromatin-Based Regulation Mechanism
The interplay of histone modifications writers that read
 Review Histones and Chromatin Review series The interplay of histone modifications writers that read Tianyi Zhang, Sarah Cooper *, & Neil Brockdorff Abstract Histones are subject to a vast array of posttranslational
Breaking Up is Hard to Do (At Least in Eukaryotes) Mitosis
 Mitosis") Breaking Up is Hard to Do (At Least in Eukaryotes) Mitosis Chromosomes Chromosomes were first observed by the German embryologist Walther Fleming in 1882. Chromosome number varies among organisms most
Breaking Up is Hard to Do (At Least in Eukaryotes) Mitosis Chromosomes Chromosomes were first observed by the German embryologist Walther Fleming in 1882. Chromosome number varies among organisms most
BIOL2005 WORKSHEET 2008
 BIOL2005 WORKSHEET 2008 Answer all 6 questions in the space provided using additional sheets where necessary. Hand your completed answers in to the Biology office by 3 p.m. Friday 8th February. 1. Your
Chapter 12 The Cell Cycle
 Chapter 12 The Cell Cycle Objectives Describe how cell reproduction contributes to repair and growth. Compare and contrast prokaryotic and eukaryotic cell division. Compare and contrast asexual and sexual
RNA Processing in Eukaryotes *
 OpenStax-CNX module: m44532 1 RNA Processing in Eukaryotes * OpenStax This work is produced by OpenStax-CNX and licensed under the Creative Commons Attribution License 3.0 By the end of this section, you
Thesis for doctoral degree (Ph.D.) 2009 Characterization of Gcn5 Histone acetyltransferase in Schizosaccharomyces pombe Anna Johnsson
 2009 Characterization of Gcn5 Histone acetyltransferase in Schizosaccharomyces pombe Anna Johnsson") Thesis for doctoral degree (Ph.D.) 2009 Thesis for doctoral degree (Ph.D.) 2009 Characterization of Gcn5 Histone acetyltransferase in Schizosaccharomyces pombe Anna Johnsson Characterization of Gcn5 Histone
Thesis for doctoral degree (Ph.D.) 2009 Thesis for doctoral degree (Ph.D.) 2009 Characterization of Gcn5 Histone acetyltransferase in Schizosaccharomyces pombe Anna Johnsson Characterization of Gcn5 Histone
Chapter 19 Eukaryotic Genomes
 Chapter 19 Eukaryotic Genomes Lecture Outline Overview: How Eukaryotic Genomes Work and Evolve Two features of eukaryotic genomes present a major information-processing challenge. First, the typical multicellular
The Carbon Atom (cont.)
") Organic Molecules Organic Chemistry The chemistry of the living world. Organic Molecule a molecule containing carbon and hydrogen Carbon has 4 electrons in its outer shell and can share electrons with
Organic Molecules Organic Chemistry The chemistry of the living world. Organic Molecule a molecule containing carbon and hydrogen Carbon has 4 electrons in its outer shell and can share electrons with
BIOCHEMISTRY. How Are Macromolecules Formed? Dehydration Synthesis or condensation reaction Polymers formed by combining monomers and removing water.
 BIOCHEMISTRY Organic compounds Compounds that contain carbon are called organic. Inorganic compounds do not contain carbon. Carbon has 4 electrons in outer shell. Carbon can form covalent bonds with as
Lecture 15. Signal Transduction Pathways - Introduction
 Lecture 15 Signal Transduction Pathways - Introduction So far.. Regulation of mrna synthesis Regulation of rrna synthesis Regulation of trna & 5S rrna synthesis Regulation of gene expression by signals
Biological Molecules
 The Chemical Building Blocks of Life Chapter 3 Biological molecules consist primarily of -carbon bonded to carbon, or -carbon bonded to other molecules. Carbon can form up to 4 covalent bonds. Carbon may
The Chemical Building Blocks of Life. Chapter 3
 The Chemical Building Blocks of Life Chapter 3 Biological Molecules Biological molecules consist primarily of -carbon bonded to carbon, or -carbon bonded to other molecules. Carbon can form up to 4 covalent
All living things are mostly composed of 4 elements: H, O, N, C honk Compounds are broken down into 2 general categories: Inorganic Compounds:
 Biochemistry Organic Chemistry All living things are mostly composed of 4 elements: H, O, N, C honk Compounds are broken down into 2 general categories: Inorganic Compounds: Do not contain carbon Organic
HDAC1 Inhibitor Screening Assay Kit
 HDAC1 Inhibitor Screening Assay Kit Item No. 10011564 www.caymanchem.com Customer Service 800.364.9897 Technical Support 888.526.5351 1180 E. Ellsworth Rd Ann Arbor, MI USA TABLE OF CONTENTS GENERAL INFORMATION
Basic Plant Biology A Review
 Basic Plant Biology A Review What is a plant? Traditional View of Biology: Animals and Plants What is a plant? Traditional View of Biology: Animals and Plants Problem: Microscopic Organisms (Bacteria,
The complex language of chromatin regulation during transcription Shelley L. Berger 1
 doi:10.1038/nature05915 The complex language of chromatin regulation during transcription Shelley L. Berger 1 An important development in understanding the influence of chromatin on gene regulation has
RECAP (1)! In eukaryotes, large primary transcripts are processed to smaller, mature mrnas.! What was first evidence for this precursorproduct
! In eukaryotes, large primary transcripts are processed to smaller, mature mrnas.! What was first evidence for this precursorproduct") RECAP (1) In eukaryotes, large primary transcripts are processed to smaller, mature mrnas. What was first evidence for this precursorproduct relationship? DNA Observation: Nuclear RNA pool consists of
RECAP (1) In eukaryotes, large primary transcripts are processed to smaller, mature mrnas. What was first evidence for this precursorproduct relationship? DNA Observation: Nuclear RNA pool consists of