Investigating the Effect of Energy Substrates and LPS-activation on the In Vitro Energy Metabolism of BV-2, RAW264.
|
|
|
- Dwain Jefferson
- 5 years ago
- Views:
Transcription
1 Investigating the Effect of Energy Substrates and LPS-activation on the In Vitro Energy Metabolism of BV-2, RAW264.7 and VM-M3 Cells Author: Ashley Kaye Brown Persistent link: This work is posted on Boston College University Libraries. Boston College Electronic Thesis or Dissertation, 2016 Copyright is held by the author, with all rights reserved, unless otherwise noted.
2 Boston College Graduate School of the Morrissey College of Arts and Sciences Department of Biology Investigating the Effect of Energy Substrates and LPS-activation on the In Vitro Energy Metabolism of BV-2, RAW264.7 and VM-M3 Cells Ashley Kaye Brown A thesis submitted in partial fulfillment of the requirements for the degree of Master of Science May 2016
3 Copyright 2016 Ashley Kaye Brown
4 Abstract Investigating the Effect of Energy Substrates and LPS-activation on the In Vitro Energy Metabolism of BV-2, RAW264.7 and VM-M3 Cells Ashley Kaye Brown Advisor: Thomas N. Seyfried, Ph.D. Two major metabolic phenomena observed in cancer cells include the Warburg effect and Crabtree effect. The Crabtree effect is the in vitro inhibition of respiration by glucose. The influence of glucose on the oxygen consumption rate (OCR) and extracellular acidification rate (ECAR) of tumorigenic RAW264.7 and VM-M3 macrophage cells, as well as non-tumorigenic BV-2 microglia cells, was studied using the Seahorse XF96 extracellular flux analyzer. RAW264.7, VM-M3, and BV-2 cells incubated in glucose medium displayed a significantly lower OCR and higher ECAR compared to cells incubated in no glucose medium. Furthermore, when glucose medium was added to the RAW264.7 and BV-2 cells in real-time using the Seahorse XF96 injection ports, a rapid decrease in OCR and increase and ECAR was observed. Therefore, RAW264.7, VM-M3, and BV-2 cells display a robust Crabtree effect in vitro, as assessed by OCR and ECAR. Additionally, it is important to consider the Crabtree effect when studying in vitro energy metabolism of all cell and tissue types. It was also found that the elimination of the Crabtree effect through glucose deprivation resulted in dynamic cardiolipin (CL) fatty acid changes in VM-M3 cells. VM-M3 cells incubated in 10 mm glucose medium for four hours displayed a short-chain, saturated (immature) CL fatty acid composition, while VM-M3 cells incubated in no glucose media for four hours displayed long-chain, unsaturated (mature) CL fatty acid composition. Cardiolipin (CL) is a phospholipid highly enriched in the inner mitochondrial membrane. Mature, long-chain, unsaturated CL molecular species are involved in maintaining mitochondrial function and membrane integrity.
5 Overall, these data suggest that CL fatty acid composition may function as a structural component of the Crabtree effect in vitro. The Warburg effect, or aerobic glycolysis, is the observation that tumor cells consume less oxygen and more glucose than normal, untransformed cells in the presence of oxygen. It has been shown that immune cells display a Warburg effect upon activation by changing their core metabolism from oxidative phosphorylation to glycolysis. In this study, it was observed that both RAW264.7 macrophage cells and BV-2 microglia cells display a significantly lower OCR and higher ECAR following LPS-activation. However, this observation is dependent on the concentration of LPS. Therefore, these data suggest that both RAW264.7 and BV-2 cells display a LPS concentration-dependent change in metabolism from oxidative phosphorylation to glycolysis upon LPS-activation in vitro. The in vitro lipid profiles that resulted from the Crabtree effect and the LPS-activated Warburg effect were also studied in the RAW264.7 cell line. The lipids phosphatidylserine (PS) and cardiolipin (CL) displayed the most robust changes in the RAW264.7 cells. Both PS and CL have been shown to be associated with cellular respiration.
6 A Note on Thesis Organization This thesis is organized into five individual chapters. Chapter one describes the Crabtree effect (inhibition of respiration by glucose) in BV-2 and RAW264.7 cells. Chapter two describes the Crabtree effect in VM-M3 cells and includes further research on the cardiolipin structural changes that occur in the VM-M3 cells after eliminating glucose from the culture media. Chapter three describes the metabolic changes that occur upon LPS-activation of the RAW264.7 and BV- 2 cells. Chapter four shows the lipid profile of RAW264.7 cells incubated in different energy substrates and activated with LPS. Finally, chapter five describes the implementation of an in vivo screening procedure to understand the variation in tumor growth and tumor burden that occurs within the VM-M3 mouse model. i
7 Table of Contents Page A NOTE ON THESIS ORGANIZATION... i TABLE OF CONTENTS... ii ACKNOWLEDGEMENTS... iv LIST OF FIGURES...v LIST OF TABLES... viii ABBREVIATIONS... ix CHAPTER INTRODUCTION...2 MATERIALS AND METHODS...6 RESULTS...9 DISCUSSION...12 TABLES AND FIGURES...16 CHAPTER INTRODUCTION...26 MATERIALS AND METHODS...29 RESULTS...34 DISCUSSION...37 TABLES AND FIGURES...40 ii
8 CHAPTER INTRODUCTION...55 MATERIALS AND METHODS...57 RESULTS...59 DISCUSSION...63 TABLES AND FIGURES...66 CHAPTER INTRODUCTION...79 MATERIALS AND METHODS...81 RESULTS...85 DISCUSSION...88 TABLES AND FIGURES...92 CHAPTER INTRODUCTION MATERIALS AND METHODS RESULTS DISCUSSION TABLES AND FIGURES APPENDIX REFERENCES iii
9 Acknowledgements I would like to thank Dr. Thomas N. Seyfried for taking a chance on a girl from Minnesota who sat in front of his desk three years ago enthralled by his intelligence and passion. Dr. Seyfried has been an integral mentor in my development as a scientific researcher. I would also like to extend my thanks to the Seyfried Lab, members of whom have provided me with invaluable support, guidance, and humor over the past three years. I would like to principally thank Roberto Flores, for his unparalleled intelligence and project design as well as his incredible patience, knowledge, friendship and guidance; Kevin Santos, for his invaluable friendship, humor, and for teaching me the foundation of lipid isolation and purification; Linh Ta for his intelligence and gas chromatography expertise; Purna Mukherjee, for her friendship and allowing me to use the TC20 Automated Cell Counter in her laboratory; Zeynep Akgoc, for her support and friendship; and Hannah Rockwell, for her mentorship and friendship. Additionally, I would like to extend my thanks to several undergraduate members of the Seyfried laboratory including: Luke Taus, Julianna (Julz) Khoury, Elizabeth (Lizzie) Lee, Jamie Chang, and Catherine (Cat) Doyle. Their friendship and in vivo assistance have been unparalleled. I would also like to extend my thanks to my family and friends; your support during the research and writing of this thesis has been invaluable to me. In particular, I would like to thank my mother, for being my rock and giving me the encouragement to succeed everyday. iv
10 List of Figures Page CHAPTER 1 1. Oxygen consumption rate (OCR) of RAW264.7 Cells Extracellular acidification rate (ECAR) of RAW264.7 Cells Oxygen consumption rate (OCR) of BV-2 Cells Extracellular acidification rate (ECAR) of BV-2 Cells CHAPTER 2 5. Oxygen consumption rate and extracellular acidification rate of VM-M3 Cells The structure of cardiolipin (CL) The association of cardiolipin (CL) with the electron transport chain High performance thin-layer chromatogram (HPTLC) of acidic lipids in VM-M3 cells grown in the presence (Glc+) and absence (Glc ) of 10 mm glucose for 4 hours Cardiolipin lipidome of VM-M3 cells cultured in 10 mm glucose (Glc+) and no glucose (Glc ) conditions for 4 h Proliferation of VM-M3 cells grown in the presence (Glc+) and absence (Glc ) of 10 mm glucose...52 CHAPTER Oxygen consumption rate (OCR) of RAW264.7 cells treated with LPS and L-NAME Extracellular acidification rate (ECAR) of RAW264.7 cells treated with LPS and L-NAME RAW264.7 growth in glucose (10 mm) and glucose (10 mm) + LPS (50 ng/ml) media OCR of BV-2 cells treated with LPS and L-NAME ECAR of BV-2 cells treated with LPS and L-NAME OCR/ECAR ratio in non-activated and 10 ng/ml LPS-activated RAW and BV-2 cells...76 v
11 CHAPTER High performance thin-layer chromatogram (HPTLC) of acidic lipids in RAW cells incubated for 72 h in glucose (10 mm) and low glucose (0.05 mm) media High performance thin-layer chromatogram (HPTLC) of neutral lipids in RAW cells incubated for 72 h in glucose (10 mm) and low glucose (0.05 mm) media High performance thin-layer chromatogram (HPTLC) of acidic lipids in RAW cells incubated for 72 h in galactose (10 mm) and glucose (10 mm) + LPS (50 ng/ml) media High performance thin-layer chromatogram (HPTLC) of neutral lipids in RAW cells incubated for 72 h in galactose (10 mm) and glucose (10 mm) + LPS (50 ng/ml) media Structure of phosphatidylserine Identification of phosphatidylserine RAW cell growth in glucose (10 mm), low glucose (0.05 mm), galactose (10 mm), and glucose (10 mm) + LPS (50 ng/ml) media for 72 h CHAPTER VM-M3 metastatic cancer model progression (A) and VM-M3 metastatic cancer model survival (B) Luciferin kinetic curves Whole body bioluminescence day 5 post inoculation Whole body bioluminescence day 8 post inoculation Whole body bioluminescence day 13 post inoculation Whole body bioluminescence day 13 post inoculation screen Primary tumor wet weight day 29 post inoculation Metastatic spread to the lung, liver, kidney, brain, and spleen Correlation between primary tumor luminescence on day 13 and primary tumor wet weight at the termination (day 29) of the study vi
12 33. Correlation between whole body bioluminescence on Day 13 and metastasis at the termination (day 29) of the study Differentiating primary tumor luminescence from metastasis luminescence vii
13 List of Tables CHAPTER 2 I. Acidic lipid distribution of VM-M3 cells cultured in the presence and absence of glucose...48 II. Fatty acid composition of cardiolipin in VM-M3 cells cultured in the presence and absence of glucose...49 CHAPTER 4 III. Percent distribution of acidic lipids in RAW264.7 cells IV. Percent distribution of neutral lipids in RAW264.7 cells viii
14 Abbreviations ATP BSA BV-2 CH 3 OH CHCl 3 CL CytC dh 2 O dpbs ECAR ETC FADH 2 FBS FFA Glucose media HIF-1α HPTLC inos L-NAME LPS NADH NO OCR PC PE PS RAW SD STD TCA VM-M3 WBI XF-96 adenosine triphosphate bovine serum albumin BV-2 murine microglial cell line methanol chloroform cardiolipin cytochrome c deionized water Dulbecco s phosphate buffered saline extracellular acidification rate electron transport chain flavin adenine dinucleotide (reduced form) fetal bovine serum free fatty acid 10 mm glucose hypoxia inducible factor 1-alpha high performance thin-layer chromatography inducible nitric oxide synthase N ω -Nitro-L-arginine methyl ester hydrochloride lipopolysaccharide nicotinamide adenine dinucleotide (reduced form) nitric oxide oxygen consumption rate phosphatidylcholine phosphatidylethanolamine phosphatidylserine RAW264.7 murine macrophage cell line standard deviation lipid standards tricarboxylic acid murine glioblastoma cells whole body image seahorse XF96 extracellular flux analyzer ix
15 CHAPTER 1 ENERGY METABOLISM: THE CRABTREE EFFECT IN VITRO Background: Two main metabolic phenomena studied in cancer cells include the Warburg effect and Crabtree effect. Otto Warburg observed that in the presence of oxygen, tumor tissues consumed less oxygen and more glucose than normal tissues. This observation has been named the Warburg effect. While, Herbert Crabtree observed that the presence of glucose in culture media suppressed the respiration of tumor tissues, but not normal tissues. This observation has been named the Crabtree effect. Methodology and Principal Observations: This study focused on the Crabtree effect in vitro. The murine RAW264.7 and BV-2 macrophage cell lines were studied. The RAW264.7 cell line is a highly metastatic macrophage cell line, while the BV-2 cell line is a transformed, non-tumorigenic microglia (resident macrophage of the brain) cell line. Therefore, both cell lines are macrophage in origin; however, the RAW264.7 cells form tumors when implanted in vivo into BALB/c natural host mice, while the BV-2 cell line does not form tumors when implanted in vivo into C57BL/6 natural host mice. The Crabtree effect was measured in each cell line using the Seahorse XF96 Flux Analyzer. The oxygen consumption rate (OCR) and extracellular acidification rate (ECAR) of both RAW and BV-2 cells were obtained in media containing 10 mm glucose and media containing no glucose. The effect of adding glucose to both RAW and BV-2 cells in real time was also studied in this assay. Media containing glucose was added to the cells incubated in no glucose media through the Seahorse XF96 injection ports. It was found that both the tumorigenic RAW264.7 cell line and non-tumorigenic BV-2 cell line displayed a robust Crabtree effect in vitro. The addition of glucose in real-time to the culture media of RAW and BV-2 cells caused a significant and rapid decrease in oxygen consumption, as analyzed by the Seahorse XF96 extracellular flux analyzer. Conclusions and Significance: This study shows that both tumorigenic RAW and nontumorigenic BV-2 cell lines display the Crabtree effect in vitro. Therefore, the influence of glucose on metabolism must be considered when performing, analyzing, and understanding in vitro energy metabolism experiments. 1
16 Introduction: The Warburg and Crabtree Effect I. Overview: Cancer Metabolism: The Warburg Effect and the Crabtree Effect The Warburg Effect Cancer cells show great diversity in their type and etiology, yet often share metabolic abnormalities. Otto Warburg first described the metabolic abnormality of cancer cells more than half a century ago. Warburg observed that in the presence of oxygen tumor tissues consumed less oxygen and more glucose than normal, untransformed tissues (1 3). The reduced oxygen consumption of cancer cells that Warburg observed was concomitant with an increase in lactate fermentation. In Warburg s 1956 paper On the Origin of Cancer Cells he stated, With the ascites cancer cells of the mouse, for example, we find an average respiration of 7 cubic millimeters of oxygen consumed per milligram, per hour, and fermentation of 60 cubic millimeters of lactic acid produced per milligram, per hour. This, converted to energy equivalents, means that the cancer cells can obtain approximately the same amount of energy from fermentation as from respiration, whereas the normal body cells obtain much more energy from respiration than from fermentation (2). This observation has been termed aerobic glycolysis or the Warburg effect, but it is unclear whether the increase in lactate in the presence of oxygen is due to respiratory insufficiency. In normal cells, the conversion of excess pyruvate into lactate is indicative of exposure to an environment that causes a respiratory insufficiency (hypoxia, respiratory poisons). Rather than producing energy through lactate fermentation, normal cell metabolism (e.g. neurons supplied with adequate oxygen) includes the conversion of glucose into pyruvate through glycolysis and the import of pyruvate into the 2
17 mitochondria (Appendix I). Upon entry into the mitochondria, pyruvate is oxidized to acetyl-coa and enters the TCA cycle in order to produce the reducing equivalents necessary for oxidative phosphorylation. Therefore, Warburg concluded that the increase in lactate fermentation in cancer cells is indicative of insufficient mitochondrial respiration (1 3). In support of Warburg s observations that respiration is insufficient in cancer cells compared to normal cells, both quantitative and qualitative mitochondrial insufficiencies have been observed in cancer cells. For example, Kiebish et al. found that mitochondria isolated from brain tumors in vivo had an abnormal cardiolipin (CL) profile that was associated with significant reductions in electron transport chain (ETC) activity (4). In addition, mitochondria content appears to be reduced in cancer cells (5). However, the reason for the excess glucose consumed and lactate produced by cancer cells has not been established since some investigators are under the impression that genetic metabolic reprogramming drives the aerobic glycolysis (Warburg effect) (6). The Crabtree Effect Another, less-studied, metabolic phenomena observed in vitro is the Crabtree effect. In his 1929 paper, Observations on the Carbohydrate Metabolism of Tumors, Herbert Crabtree observed that the oxygen consumption of both the Crocker sarcoma and Jensen s rat sarcoma was lowered, on average, by 12% in the glucose-containing Ringer solution compared to the xylose-containing Ringer solution. Crabtree therefore concluded that glycolytic activity inhibited the tumor tissues capacity for respiration. (7). Since Crabtree s seminal observation, many researchers have shown similar inhibitory effects 3
18 of carbohydrates on respiration in both cancer cells, such as Ehrlich ascites tumor cells and HeLa cells, and non-cancer tissues, such as pig platelets, coronary epithelium, guinea pig sperm, hamster embryos, and thymocytes, and, more recently, endothelial cells (8) (9). Initially, research focused on the inhibition of respiration by carbohydrates in Ehrlich ascites tumor cells. For example, Chance and Hess observed in 1961 that the respiration of ascites tumor cells was inhibited by the addition of glucose and proposed that this inhibition resulted from the observed increase in cytoplasmic ADP and decrease in cytoplasmic ATP, in conjunction with an accumulation of ATP and depletion of ADP in the mitochondria (10, 11). At the same time, Packer and Golder observed that light scattering in Ehrlich ascites tumor cells increases following the addition of glucose to the culture medium (12). Light scattering had previously been shown to increase after ADP addition and subsequent mitochondrial shrinkage in ascites tumor cells (13). Therefore, Packer and Golder suggested that the increase in light scattering supported the theories proposed by researchers such as Chance and Hess to explain the Crabtree effect. Shrunken mitochondria, which contain a high concentration of ATP and low concentration of ATP, increase light scattering (12). Packer and Golder were the first to describe structural changes that occur in conjunction with the Crabtree effect. The structural changes underlying the Crabtree effect were not comprehensively investigated until 2004 when Rossignol et al. were the first to study the structure and function of mitochondria in a transformed cell line (14). Rossignol et al. observed that HeLa cells grown in galactose medium displayed a two-fold higher respiratory rate compared to Hela cells grown in glucose medium (14). In addition, mitochondrial 4
19 morphology in HeLa cells grown in galactose medium was significantly different from HeLa cells grown in glucose medium (14). Cells grown in galactose medium contain more cristiae, an extended mitochondrial reticulum, and a condensed configuration compared to cells grown in glucose medium (14). In adding to this body of research on the Crabtree effect, the present study examines the Crabtree effect in RAW264.7 and BV-2 murine macrophage cell lines in real-time using the SeahorseXF96 Extracellular Flux Analyzer. RAW264.7 and BV-2 cell lines were chosen for this study due to the extensive use of these cells in research and subsequent studies on the LPS activation of these macrophage cells. 5
20 Materials and Methods Reagents Cell culture grade AlbuMAX I (Lipid Rich Bovine Serum Albumin) was obtained from gibco by Life Technologies (Grand island, NY, USA). AlbuMAX I (Albumax) contains the following fatty acids conjugated to BSA (the approximate concentration is indicated): Alpha-linolenic acid (0.59 mg FFA/g protein), Linoleic acid (0.65 mg FFA/g protein), Oleic acid (2.12 mg FFA/g protein), Stearic acid (2.09 mg FFA/g protein), and Palmitic acid (1.90 mg FFA/g protein). Cell lines and culture conditions The murine macrophage RAW264.7 cell line and the human microglia BV-2 cell line were purchased from American Type Culture Collection (Manassas, VA) BV-2 cells were derived from raf/myc-immortalized murine neonatal microglia. BV-2 cells do not form tumors when implanted in vivo into the natural C57BL/6 host. RAW264.7 cells were established from the ascites of a tumor induced in a male BAB/14 mouse by intraperitoneal injection of the Abelson Leukemia Virus (15). The BAB/14 mouse is a BALB/c congenic strain. The RAW264.7 cell line forms highly metastatic tumors when implanted in vivo into the natural BALB/c host. The cells were maintained in Dulbecco s Modified Eagle s Medium (DMEM, Sigma, St. Louis, MO) with high glucose (25mM) and supplemented with 10% fetal bovine serum (FBS, Sigma) and 50µg/ml penicillin-streptomycin (Sigma), and phenol red (Sigma) (DMEM complete media). The cells were maintained in a humidified incubator at 37ºC/5% CO 2 /95% air. 6
21 Measurement of oxygen consumption and extracellular acidification rates of RAW and BV-2 cells OCR and ECAR measurements were determined using the Seahorse XF96 Extracellular Flux Analyzer. All steps in the preparation of the assay were performed at Boston College and the Seahorse assay was performed at Berg, LLC (Framingham, MA). In order to obtain each individual OCR and ECAR value, the Seahorse XF96 Extracellular Flux Analyzer isolates 2 µl of media above the cell monolayer in each well of the micoplate to create a transient microchamber. Within this transient microchamber the Seahorse instrument measures the concentration of dissolved oxygen and free protons until the rate of change is linear. The slope of this rate of change graph is then used to calculate the flux of oxygen and free protons and record these values in units of pmol O 2 /min for OCR data and mph/min for ECAR data. After obtaining measurements of dissolved oxygen and free protons in the transient micochamber, the sensors lift to allow the larger media volume to mix with the transient microchamber to restore all values to baseline. RAW264.7, and BV-2 cells were plated in XF96 cell culture plates (Seahorse Bioscience, North Billerica, MA, USA) at near confluence. The cells were incubated for 12 h in DMEM complete media. The medium was then changed to 75 ul of the appropriate Seahorse media containing no sodium bicarbonate or phenol red: 7
22 Glucose Seahorse Media No Glucose Seahorse Media DMEM DMEM 10mM Glucose 2 mm Glutamine 2 mm Glutamine 0.5mg/mL Albumax I 0.5 mg/ml Albumax I 5mM N-2-hydroxyethylpiperazine-N -2- ethanesulfonic acid (HEPES) buffer 5mM N-2-hydroxyethylpiperazine-N -2 ethanesulfonic acid (HEPES) buffer 50 µg/ml penicillin-streptomycin 50 µg/ml penicillin-streptomycin The plate was inserted into the Seahorse XF96 Extracellular Analyzer 2 hours after the medium was changed. The XF analyzer was programmed to take 2-minute measurements with a 1-min mix and 2-min equilibration period before each measurement. Real-time measurements of the effect of glucose on the oxygen consumption and extracellular acidification rates of RAW and BV-2 cells were also studied in this assay. 25 µl of 40 mm glucose-seahorse Media was injected through drug delivery port A of the Seahorse XF96 Flux Analyzer into wells containing no glucose media to obtain a final 10 mm glucose concentration. 25 µl of 10 mm glucose media was also injected through drug delivery port A into wells containing glucose media to ensure that changes in OCR or ECAR were not the result of different media volumes. Statistics Statistical analyses were performed on all data using IBM SPSS 21 Statistics Software. Two-tailed t-tests were performed and the significance values were determined where indicated. 8
23 Results OCR and ECAR: RAW264.7 cells The average OCR under the 10 mm glucose and under the no glucose conditions in the RAW264.7 cells was 516 ± 23 pmol/min and 645 ± 24 pmol/min, respectively (P < 0.05) (Figure 1A). The average ECAR under these same conditions was 55 ± 8 mph/min and 13 ± 2 mph/min, respectively (p <0.001) (Figure 2A). These data showed that RAW264.7 cells under the no glucose condition displayed a significantly greater OCR and significantly lower ECAR compared to RAW cells under the glucose condition. The effect of glucose on the OCR and ECAR in the RAW264.7 cells was also assessed in real-time by injecting glucose seahorse media through drug delivery ports of the XF96 Flux Analyzer. After injecting glucose media, the OCR of RAW264.7 cells under the no glucose condition immediately decreased to a level below, and significantly different from, that of RAW264.7 cells under the 10mM glucose condition (Figure 1). The average OCR under the 10mM glucose and under the added glucose conditions was 477 ± 28 pmol/min and 374 ± 9 pmol/min, respectively (p < 0.001) (Figure 1B). After injecting glucose media, the average ECAR of RAW264.7 cells under the no glucose condition immediately increased to a level above, but not significantly different from RAW cells in 10 mm glucose condition (Figure 2). The average ECAR under the 10 mm glucose and under the added glucose conditions was 55 ± 7 pmol/min and 60 ± 5 mph/min, respectively (Figure 2 Panel B). After the initial decrease in OCR following glucose addition, the RAW cells to which glucose was added slowly increased their average OCR to a level that was not statistically significant from the 10 mm glucose media condition (Figure 1). The final 9
24 OCR measurement in the assay shows no difference between the average OCR for RAW cells in 10mM glucose media and RAW cells to which glucose media was added (Figure 1C). After the initial increase in the ECAR following glucose addition, the RAW cells to which glucose was added slowly decreased their ECAR. However, the final average ECAR measurement was not significantly different between the RAW cells under the glucose and added glucose conditions (Figure 2C). OCR and ECAR: BV-2 cells The average OCR under the 10 mm glucose and under the no glucose conditions in the BV-2 cells was 231 ± 8 pmol/min and 318 ± 3 pmol/min, respectively (P < 0.001). (Figure 3A). The average ECAR under these same conditions was 23 ± 2 mph/min and 7 ± 2 mph/min, respectively (p <0.001) (Figure 4A). These data showed that BV-2 cells under the no glucose condition displayed a significantly greater OCR and significantly lower ECAR compared to RAW cells under the glucose condition. This is the same trend as the RAW246.7 cells. The effect of glucose on the OCR and ECAR in the BV-2 cells was also assessed in real-time by injecting glucose seahorse media through drug delivery ports of the XF96 Flux Analyzer. After injecting glucose media, the OCR of BV-2 cells under the no glucose condition immediately decreased and the ECAR immediately increased to levels not significantly different from that of BV-2 cells under the 10 mm glucose condition (Figure 3 and 4). The average OCR under the 10mM glucose and under the added glucose conditions was 232 ± 9 pmol/min and 242 ± 2 pmol/min, respectively (Figure 10
25 3B). The average ECAR under the 10 mm glucose and under the added glucose conditions was 24 ± 2 mph/min and 23 ± 2 mph/min, respectively (Figure 4B). After the initial decrease in OCR following glucose addition, the BV-2 cells to which glucose was added further decreased their average OCR. However, this decrease was not statistically different from the 10 mm glucose media condition (Figure 3). The final OCR measurement in the assay shows no difference between the average OCR for BV-2 cells in 10mM glucose media and BV-2 cells to which glucose media was added (Figure 3C). After the initial increase in the ECAR following glucose addition, the ECAR measurements of the BV-2 cells to which glucose was added slowly decreased. However, the final average ECAR measurement was not significantly different between the BV-2 cells under the glucose and added glucose conditions (Figure 4C). Overall, both the tumorigenic RAW cells and non-tumorigenic BV-2 cells in the no glucose condition displayed a significantly higher oxygen consumption rate and a significantly lower extracellular acidification rate compared to the same cells incubated in 10 mm glucose condition. Furthermore, when glucose was added to the media of RAW and BV-2 cells, there was an immediate decrease in the oxygen consumption rate and an immediate increase in the extracellular acidification rate. 11
26 Discussion A real-time assessment of the Crabtree effect has not, to my knowledge, been previously performed using the Seahorse platform. In this study it was found that RAW264.7 and BV-2 cells display a robust and dynamic Crabtree effect in vitro. Upon addition of glucose to both the RAW246.7 and BV-2 cell lines, there was an immediate decrease in oxygen consumption and increase in extracellular acidification that occurred and was maintained for the duration of the assay. The decrease in oxygen consumption suggests a decrease in respiration following the addition of glucose. However, both nonmitochondrial and mitochondrial oxygen consumption are measured in the Seahorse assay. Therefore, the amount of oxygen consumption directly associated with mitochondrial ATP production must be determined in order to assess the amount of oxygen consumption associated directly with respiration. Furthermore, the increase in ECAR is suggestive of an increase in glycolysis. However, this measurement must also be compared to a direct measurement of L-lactate, a product of glycolysis. Nevertheless, the above data show that both a highly metastatic macrophage cell line and a transformed, non-tumorigenic macrophage cell line display the Crabtree effect in vitro. Therefore, the Crabtree effect is not a phenomenon specific to tumorigenesis in vitro, which has been previously characterized in several studies (8, 13, 14, 16 18). Although both tumorigenic RAW and non-tumorigenic BV-2 cells display a Crabtree effect, the degree to which the OCR is suppressed and ECAR is increased by glucose is significantly different between these two cell lines. The tumorigenic RAW264.7 cell line had a significantly larger percent reduction in oxygen consumption compared to the BV-2 cells when glucose was added to the culture medium. The percent 12
27 decrease in OCR following the addition of glucose was 42 ± 2 % for RAW cells and 23 ± 1 % for BV-2 cells (p < 0.001). These data suggest that the metabolism of the highly metastatic RAW264.7 cell line is more sensitive to the addition of glucose in the culture medium. The sensitivity of RAW264.7 cells to glucose is also displayed by the higher percent increase in ECAR following the addition of glucose. The percent increase in ECAR was 363 ± 54 % for RAW cells and 229 ± 80 % for BV-2 cells (p<0.001). Overall, RAW cells appear to have a greater sensitivity to glucose addition into their media, which may be a product of the tumorigenic and highly metastatic phenotype of these cells. From these data, it must also be noted that BV-2 cells exhibit an apparent high basal activation in vitro, which may influence the oxygen consumption and extracellular acidification of non-activated BV-2 cells (Chapter 3). A study by Leist et al. showed that LPS-activated BV-2 cells exhibited lower inflammatory gene transcription compared to LPS-activated primary microglia cells (19). The weaker response of BV-2 cells to LPSactivation indicates that these cells may have a high basal activation. This high basal activation may subsequently influence the metabolism of BV-2 cells and may explain the weaker metabolic response of BV-2 cells to glucose. The basal activation of BV-2 cells also questions the validity of BV-2 cells as a non-tumorigenic control cell in metabolic studies. Another metabolic phenomenon that must also be considered alongside the Crabtree effect is the Warburg effect. Cells displaying a Warburg effect show greater lactate production in the presence of oxygen. Tumorigenic RAW cells displayed a high extracellular acidification rate in the glucose condition. This observation may result from 13
28 the Warburg effect. However, it is difficult to determine the individual contributions of the Warburg effect and the Crabtree effect to the high extracellular acidification of cells in the glucose condition. Furthermore, the relative contribution of glycolysis to the total extracellular acidification rate must be determined in order to further characterize the metabolic phenotype of RAW and BV-2 cells in the glucose and no glucose conditions. Previous studies performed by Roberto Flores showed a correlation between ECAR and lactate metabolite measurements (data not shown). The ability of transformed cells to improve their respiratory capacity when cultured in the absence of glucose has been previously characterized in HeLa cells (14). The rotenone-sensitive endogenous respiratory rate was significantly increased in HeLa cells grown in galactose medium compared to glucose medium (14). The increase in respiration when cells are grown in galactose medium compared to glucose medium may result from mitochondrial biogenesis or the increased synthesis of mitochondrial enzymes (14). In addition to an increase in respiration, HeLa cells grown in galactose media displayed increased respiratory protein levels as well as structural remodeling of mitochondria into a condensed conformation (14). Thus, structural changes underlie the improved oxidative phosphorylation capacity seen in HeLa cells grown in galactose media. An extension of the current study in RAW and BV-2 cells may characterize the possible structural changes of the mitochondria in these cells when grown in no glucose or galactose media. However, despite all of the data that may be collected in vitro showing a mitochondrial adaptation of transformed cells to energy substrate type, the in vivo adaptation of cells to energy substrate type may be different. The metabolism of cells grown in vivo in their natural host is regulated by a myriad of factors including 14
29 hormones, signaling molecules, and the overall metabolic state of the organism. Nevertheless, the majority of cell metabolism experiments are conducted in vitro due to various factors. The inhibition of respiration and increase in glycolysis in glucose media is an important consideration when conducting any metabolic analysis in vitro. Most in vitro experiments are conducted in high glucose (25 mm) DMEM media. Therefore, such conditions may result in misleading in vitro metabolism data, as such high glucose conditions may not typically be found in vivo. For example, the growth of nontumorigenic cell types such as C2C12 murine myoblastic cell line in 25 mm glucose caused mitochondrial dysfunction, which is not seen in vivo (20). Therefore, the effect of the energy substrates on cells in vitro must be conducted before further metabolism experiments are performed. Additionally, the Crabtree effect may influence drug toxicity screens in vitro, as such conditions may not be indicative of in vivo cell behavior in the presence of the drug. This is particularly important when studying mitochondrial toxicants (21). The Crabtree effect may be modulating the effect of a mitochondrial toxicant in vitro such that when tested in vivo the mitochondrial toxicant is significantly more toxic to the organism. 15
30 Figure 1. Oxygen consumption rate (OCR) of RAW264.7 cells. RAW264.7 cells were incubated in Seahorse media containing glucose (10 mm) or no glucose for 2 hours before the start of the assay. Oxygen consumption rate (OCR) measurements were determined using an XF96 Extracellular Flux Analyzer. OCR measurements were obtained for each condition. The OCR for three indicated data points are expressed in bar graph format as the mean OCR ± SD (A-C). At 22 minutes, 25 µl of 40 mm glucose seahorse media was injected into the no glucose condition to produce a final glucose concentration of 10mM. 25ul of 10mM glucose media was also injected into the 10mM glucose condition to maintain the same media volume for all conditions in the assay. OCR measurements are expressed as the mean ± SD for each time point. Each point has n = 12 (no glucose) and n = 24 (10 mm glucose). ** indicates p <


31 17
32 Figure 2. Extracellular acidification rate (ECAR) of RAW264.7 cells. RAW264.7 cells were incubated in Seahorse media containing glucose (10 mm) or no glucose for 2 hours before the start of the assay. Extracellular acidification rate (ECAR) measurements for each condition were determined using an XF96 Extracellular Flux Analyzer. The ECAR values for three indicated data points are expressed in bar graph format as the mean ECAR ± SD (A-C). At 22 minutes, 25 µl of 40 mm glucose seahorse media was injected into the no glucose condition to produce a final glucose concentration of 10 mm. 25 µl of 10 mm glucose media was also injected into the 10 mm glucose condition to maintain the same media volume for all conditions in the assay. ECAR measurements are expressed as the mean ± SD for each time point. Each point has an n = 12 (no glucose) and n = 24 (10 mm glucose). ** indicates p <


33 19
34 Figure 3. Oxygen consumption rate (OCR) of BV-2 cells. BV-2 cells were incubated in Seahorse media containing glucose (10 mm) or no glucose for 2 hours before the start of the assay. Oxygen consumption rate (OCR) measurements for each condition were determined using an XF96 Extracellular Flux Analyzer. The OCR for three indicated time points are expressed in bar graph format as the mean ± SD (A-C). At 29 minutes, 25 µl of 40 mm glucose seahorse media was injected into the no glucose condition to produce a final glucose concentration of 10 mm. 25 µl of 10 mm glucose media was also injected into the 10 mm glucose condition to maintain the same media volume for all conditions in the assay. OCR measurements are expressed as the mean OCR ± SD for each time point. Each point has an n = 12 (no glucose) and n = 24 (10 mm glucose). ** indicates p <


35 21
36 Figure 4. Extracellular acidification rate (ECAR) of BV-2 cells. BV-2 cells were incubated in Seahorse media containing glucose (10 mm) or no glucose for 2 hours before the start of the assay. Extracellular acidification rate (ECAR) measurements for each condition were determined using an XF96 Extracellular Flux Analyzer. The ECAR for three indicated time points are expressed in bar graph format as the mean ECAR ± SD (A-C). At 29 minutes, 25 µl of 40 mm glucose media was injected into the no glucose condition to produce a final glucose concentration of 10 mm. 25 µl of 10 mm glucose media was also injected into the 10 mm glucose condition to maintain the same media volume for all conditions in the assay. ECAR measurements are expressed as the mean ECAR ± SD for each time point. Each point has an n = 12 (no glucose) and n = 24 (10 mm glucose). ** indicates p <


37 23
38 CHAPTER 2 ENERGY METABOLISM: THE CRABTREE EFFECT AND CARDIOLIPIN STRUCTURE IN VITRO Link to Chapter 1: Chapter one described the Crabtree effect in the RAW246.7 and BV- 2 murine macrophage cell lines. This chapter describes the Crabtree effect in another murine macrophage cell line: VM-M3. In addition to the Crabtree effect, this chapter also describes cardiolipin (CL) structural differences between VM-M3 cells grown in glucose and no glucose media. Background: Herbert Crabtree observed that the presence of glucose in culture media suppressed the respiration of tumor tissues, but not normal tissues. This observation has been named the Crabtree effect. The Crabtree effect, or the suppression of respiration by glucose, may be studied through oxygen consumption and extracellular acidification measurements, as shown previously. However, the respiration of a cell may also be studied by analyzing structural components involved in respiration. An example of such a structural component is the content and fatty acid chain composition of CL. CL is a phospholipid in the inner mitochondrial membrane and is involved in maintaining mitochondrial function and membrane integrity. CL content and composition in vivo and in vitro was previously studied by Kiebish et al. (4). This study provided a structural basis for the Warburg effect. However, analysis of both the tumorigenic VM-M3 cell line and non-tumorigenic astrocytes displayed an immature CL profile in vitro. It was expected that the non-tumorigenic cell line would display a mature CL profile in vitro similar to non-tumorigenic brain tissue in vivo. The immature CL profile of the non-tumorigenic astrocytes in vitro may be influenced by the Crabtree effect. In addition, the immature CL profile of the tumorigenic VM-M3 cell line may also be influenced by the Crabtree effect. Therefore, this study examined the possible influence of the Crabtree effect on the CL fatty acid profile of the tumorigenic VM-M3 cells line in vitro. Methodology and Principle Observations: This study focused on the Crabtree effect and the cardiolipin structural changes that occur in association with the Crabtree effect in the VM-M3 cell line. The VM-M3 cell line is a highly metastatic macrophage cell line derived from a spontaneous brain tumor in the VM/Dk strain mouse in Dr. Seyfried s laboratory. When the VM-M3 cell line is implanted in vivo into VM/Dk natural host mice, the VM-M3 cell line forms a primary tumor and metastasizes to all major organs. The Crabtree effect was measured in each cell line using the Seahorse XF96 Flux Analyzer. The Oxygen consumption rate (OCR) and extracellular acidification rate (ECAR) of both RAW and BV-2 cells were obtained in media containing 10 mm glucose 24
39 and media containing no glucose. It was found that the VM-M3 cell line displayed a robust Crabtree effect in vitro. CL content was analyzed by HPTLC and showed no significant difference between glucose (10mM) and no glucose conditions. CL fatty acid composition was analyzed by both gas chromatography and mass spectrometry. The sensitivity of mass spectrometry showed significant changes in cardiolipin structure occurred after incubating the VM-M3 cells in glucose (10mM) and no glucose media for 4 h. Conclusions and Significance: VM-M3 cells display the Crabtree effect, or suppression of oxygen consumption by glucose, in vitro. This was assessed through measuring the OCR and ECAR of the VM-M3 cells in glucose (10mM) and no glucose conditions. In association with the Crabtree effect is a change in CL fatty acid composition. VM-M3 cells incubated in the glucose condition displayed a CL profile with more short-chain unsaturated (immature) CL molecular species. In contrast, VM-M3 cells incubated in the no glucose condition displayed a CL profile containing more long-chain unsaturated (mature) molecular species. Overall, these data display a correlation between oxygen consumption rate/ extracellular acidification rate and CL fatty acid composition. The higher oxygen consumption rate of VM-M3 cells incubated in no glucose medium is correlated with a mature CL molecular species profile. 25
40 Introduction The Warburg effect and Crabtree effect: cardiolipin in vitro As stated in Chapter one, Kiebish et al. observed that mitochondria isolated from brain tumors in vivo had an abnormal cardiolipin profile that was associated with significant reductions in ETC activity, thus providing a structural basis for the Warburg effect (4). CL, a phospholipid found primarily in the inner mitochondrial membrane of mammalian cells, contains two phosphate head groups, three glycerol moieties, and four fatty acyl chains (Figure 6). CL is involved in maintaining mitochondrial function and membrane integrity (Figure 7). CL binds complexes I, III, IV, V and the supercomplexes I/III/IV and II/III/IV of the ETC and is essential for their catalytic activity (22, 23) (Figure 7). CL also serves as a proton sink by restricting protons within its head group domain, thus functioning to maintain the mitochondrial proton gradient and provide protons for ATP synthase (24, 25). Both CL content and fatty acid composition have been directly linked to the activities of the respiratory enzyme complexes (22, 25 27). A loss of CL content or alterations in its acyl chain composition have been associated with mitochondrial dysfunction in many tissues and several pathological conditions including Barth syndrome, ischemia, hypothyroidism, aging, heart failure, and brain cancer (4, 28, 29). CL is synthesized through the condensation of phosphatidylglycerol (PG) and CDP-diacylglycerol to produce immature cardiolipin molecules that contain short-chain saturated fatty acid chains. Immature CL is then remodeled to mature CL by lipases, acyltranferases, and transacylases, which remove and transfer long-chain unsaturated fatty acids from choline and ethanolamine glycerophospholipids to the CL molecule (30). 26
41 A mature, long-chain, unsaturated CL fatty acid profile is associated with higher respiratory chain complex activity, while an immature, short-chain, saturated CL fatty acid profile is associated with low respiratory chain complex activity (4, 29, 31). Barth Syndrome (BTHS) is one of the best examples of the importance of CL remodeling within metabolic diseases. Barth syndrome is an X-linked recessive disorder characterized by cardiomyopathy, skeletal myopathy, growth retardation, and neutropenia (32). BTHS is caused by mutations in the tafazzin (TAZ) gene, which encodes an acyltransferase involved in the remodeling of CL. Cells from patients with BTHS contain decreased CL content, reduced incorporation of lineoleic acid (18:2) into CL, as well as decreased levels of the CL precursor PG (31, 32). Furthermore, patients affected with Barth syndrome showed respiratory abnormalities in isolated skeletal muscle including diminished concentrations of cytochromes c 1 + c, b, and aa 3 compared to control skeletal muscle mitochondria (32). In cancer tissues, Kiebish et al. showed in vivo that mitochondria isolated from several brain tumors had an abnormal and immature CL fatty acid profile compared to the mature CL profile of mitochondria isolated from normal synergistic host brain tissue (4). However, in vitro, mitochondria isolated from brain tumor cell lines, such as the VM-M3 cell line, and non-tumorigenic cultured astrocytes both displayed abnormal and immature CL profiles. It was expected that the non-tumorigenic astrocytes would display a mature CL profile similar to the normal synergistic host brain tissue. This discrepancy between the CL composition of non-tumorigenic cells in vitro and in vivo may result from the in vitro Crabtree effect. The suppression of respiration by glucose may result in changes to the content and composition of the CL molecule. However, the Crabtree effect may also 27
42 be responsible for the immature CL profile of the tumorigenic cell lines in vitro. Tumorigenic cells have also been shown to display the Crabtree effect. The present study examined how the in vitro growth environment could influence the content and composition of CL in the tumorigenic and highly metastatic VM-M3 cell line. It was hypothesized that CL content in the no glucose condition would be greater than that of the glucose condition. Glucose represses respiration and a low respiration is associated with low CL content. It was further hypothesized that VM-M3 cells incubated in no glucose media would contain CL molecules with a greater amount of longer-chain unsaturated fatty acids. Such CL molecules would support the higher respiration of VM- M3 cells in the no glucose condition compared to the glucose condition. 28
43 Materials and Methods Reagents HPLC grade chloroform and methanol were purchased from Sigma-Aldrich (St. Louis, MO, USA). Cell Lines and Culture Conditions The VM-M3 cell line was previously established from the flank-grown spontaneous VM-M3 tumor isolated from the cerebellum of a VM/Dk strain mouse (33). The cells were maintained in Dulbecco s Modified Eagle s Medium (DMEM, Sigma, St. Louis, MO) with high glucose (25mM) and supplemented with 10% fetal bovine serum (FBS, Sigma) and 50µg/ml penicillin-streptomycin (Sigma), and phenol red (Sigma) (DMEM complete media). The cells were maintained in a humidified incubator at 37ºC/5% CO 2 /95% air. Measurement of Oxygen Consumption and Extracellular Acidification in VM-M3 Cells OCR and ECAR measurements were determined using the Seahorse XF96 Extracellular Flux Analyzer. All steps in the preparation of the assay were performed at Boston College and the Seahorse assay was performed at Berg (Framingham, MA). VM-M3 cells were platted in XF96 cell culture plates (Seahorse Bioscience, North Billerica, MA, USA) at near confluence. The cells were incubated for 12 hours in DMEM complete media. The medium was then changed to the appropriate Seahorse media containing no sodium bicarbonate or phenol red: 29
44 Glucose Seahorse Media No Glucose Seahorse Media DMEM DMEM 10mM glucose 0mM glucose 2 mm glutamine 2 mm glutamine 0.5 mg/ml Albumax I 0.5 mg/ml Albumax I 5 mm HEPES 5 mm HEPES 50 µg/ml penicillin-streptomycin 50 µg/ml penicillin-streptomycin VM-M3 cells were incubated in the absence of CO 2 for 3 h in their respective medium. The medium was changed to glucose seahorse medium directly before inserting the assay into the Seahorse XF96 Extracellular Analyzer. The XF analyzer was programmed to take 7-min measurements with a 1-min mix and 1-min equilibration period before each measurement. VM-M3 Cell Growth Conditions for Lipid Analysis VM-M3 cells were incubated in media containing glucose media or no glucose media for 4 h (media composition below). In contrast to the above Seahorse media, sodium bicarbonate was included since the cells were incubated in the presence of CO 2. The cells were washed 3x with dpbs and counted using a TC20 automated cell counter. Cell pellets were frozen at -80 C for 1 h and then lyophilized overnight for 16 hours. Glucose Media No Glucose Media DMEM DMEM 10mM Glucose 0mM 2 mm Glutamine 2 mm Glutamine 0.5mg/mL Albumax I 0.5mg/mL Albumax I Sodium Bicarbonate Sodium Bicarbonate 50 µg/ml penicillin-streptomycin 50 µg/ml penicillin-streptomycin 30
45 Lipid isolation Total lipids were isolated and purified from lyophilized cell pellets. Total lipids were extracted with 5 ml of CHCl 3 and CH 3 OH (1:1, v/v) and 0.5 ml of dh 2 O. The solution was briefly sonicated and then centrifuged for 10 min at 1,200 x g. The supernatant containing the total lipids was removed and the cell pellet was washed with 2 ml of CHCl 3 /CH 3 OH (1:1, v/v). The combined supernatants were converted to a CHCl 3 /CH 3 OH/dH 2 O ratio of 30:60:8 (solvent A) through adding 2.5 ml of CHCl 3, 8.5 ml of CH 3 OH, and 1.6 ml of dh 2 O. Column chromatography The separation of neutral and acidic lipids was performed using DEAE-Sephadex (A-25; Pharmacia Biotech, Uppsala, Sweden) column chromatography as previously described (34). DEAE-Sephadex was prepared by washing the resin three times with solvent B (CHCl 3 /CH 3 OH/0.8 M Na + acetate, 30:60:8, v/v), equilibrating in solvent A overnight, followed by washing three times with solvent A. The total lipid extract, which was suspended in solvent A, was applied to a DEAE-Sephadex column that has been equilibrated with solvent A. The column was washed twice with 20 ml of solvent A, and the neutral lipids, consisting of the initial eluate from the column and washes, were collected. Total acidic lipids were then eluted from the column using 40 ml Solvent B. Acidic lipid purification The total acidic lipid fraction was dried by rotary evaporation and separated into acidic lipids and gangliosides by the Folch partitioning procedure as described previously 31
46 (35, 36). The lower organic phase, containing the acidic lipids: cardiolipin, phosphatidylserine, phosphatidylinositol, phosphatidic acid, sulfatides, and free fatty acids, was dried under nitrogen and re-suspended in 1 ml CHCl 3 :CH 3 OH 1:1 (v/v). High-performance thin-layer chromatography Acidic lipids were qualitatively analyzed using high-performance thin-layer chromatography (HPTLC) with modifications as previously described (34) (36). Acidic lipids were spotted on 10 x 10 cm silica gel 60 HPTLC plates using the Camag Linomat V auto-tlc spotter (Camag Scientific Inc., Wilmington, NC, USA). The amount of acidic lipids spotted on the HPTLC plate was equivalent to that from 2 x 10 6 VM-M3 cells. An internal standard (oleyl alcohol) was added to the acidic lipid samples as a control for the amount of lipids spotted. Acidic lipid standards were purchased from Matreya and Sigma (Pleasant Gap, PA; St. Louis, MO). The cardiolipin standard (Sigma C-0563) is isolated from the cardiolipin of bovine heart and has a composition of >80% linoleic acid (18:2). The acidic HPTLC plate was developed and visualized as described previously (36). Gas chromatography: cardiolipin fatty acid analysis Preparative high performance thin-layer chromatography (20 X 20 cm) was used to separate CL from the other acidic lipids in VM-M3 cells. A CL standard (Sigma) was used to identify the CL bands in the cell samples. CL was visualized by spraying the HPTLC plate with a 5% primulin solution (80:20 acetone: water vol/vol) and exposure to Ultraviolet Light. The CL band was then scraped from the HPTLC plate, 10µg of 32
47 heptadecanoic acid (17:0) internal standard was added, and the solution was transesterified with acetyl chloride in methanol (50:1 vol/vol) for 45 min in a sealed borosilicate tube under nitrogen at 85 C. The samples were cooled on ice and a 6 % potassium carbonate solution in dh 2 O (6:94 vol/vol) was added to quench the transesterification reaction. Fatty acid methyl esters were separated from this solution using hexane. A gas chromatograph (HP 6890) equipped with flame ionization detector and split less injector was used for the analysis of CL fatty acid methyl esters. The fatty acids were resolved using a 30 m X 0.25mm X 0.25µM Omegawax 250 fused silica capillary column (Supelco). The temperature program was set to ramp from 150 to 220 C at 4 C per minute and was held constant at 220 C for 20 min. The flow rate was set to 0.5 ml/min. Mass spectrometry (MS) analysis Lipid extraction using a modified Bligh and Dyer procedure and mass spectrometry analysis of CL fatty acid composition in VM-M3 cells was performed by Berg, LLC in Framingham, MA (37). MS analysis was performed using an Ab Sciex TripleTOF System. 33
48 Results Oxygen consumption rate and extracellular acidification rate of VM-M3 cells in glucose and no glucose media The VM-M3 cells line, established in Dr. Seyfried s laboratory from a spontaneous brain tumor, was previously used by Kiebish et al. for analysis of CL content and composition in vivo and in vitro (38, 39). However, analysis of both the tumorigenic VM-M3 cell line and non-tumorigenic astrocytes displayed an immature CL profile in vitro. It was expected that the non-tumorigenic cell line would display a mature CL profile in vitro similar to non-tumorigenic brain tissue in vivo. The immature CL profile of the astrocytes in vitro may result from the Crabtree effect. In addition, the immature CL profile of the tumorigenic VM-M3 cell line may also be influenced by the Crabtree effect. Therefore, this study examined the possible influence of the Crabtree effect on the immature CL profile of the tumorigenic VM-M3 cells line in vitro. The VM-M3 cells display a robust Crabtree effect in vitro (Figure 5). The oxygen consumption rate (OCR) of cells incubated in glucose media for 2 h was significantly lower than the OCR of cells grown in no glucose media. In addition, the extracellular acidification rate (ECAR) of VM-M3 cells grown in glucose media was significantly higher than the ECAR of cells incubated in no glucose media (Figure 5). Acidic lipid profile of VM-M3 cells in glucose and no glucose growth conditions 34
49 The CL content of VM-M3 cells grown in glucose media for 4 h was not significantly different from the CL content of VM-M3 cells grown in no glucose for 4 h (Figure 8; Table I). However, the content of phosphatidylglycerol (PG) was significantly decreased in the no glucose condition compared to the glucose condition (Figure 8; Table 1). No other acidic lipids analyzed were significantly different in their content between VM-M3 cells incubated in glucose and VM-M3 cells incubated in no glucose media (Figure 8; Table 1). Cardiolipin composition of VM-M3 cells in glucose and no glucose growth conditions: gas chromatography (GC) Since VM-M3 cells grown in glucose and no glucose media for 4 h did not display a significant difference in CL content, the fatty acid compositions of the CL molecules were analyzed by GC. Palmitoleic Acid (C16:1) was the only fatty acid species in the VM-M3 cells that had a significantly higher percent composition in the no glucose condition compared to the glucose condition (Table II). The ratio of monounsaturated fatty acids (MUFA: C16:1 and C18:1) to polyunsaturated fatty acids (PUFA: C18:2n-6, C18:3, C20:3, and C20:4n-6) was not significantly different between the glucose and no glucose conditions (Table II). However, the ratio of short chain fatty acid species (SCFA: C16-18) to long chain fatty acid species (LCFA: C20) was significantly higher in the glucose condition compared to the no glucose condition. The percentage of longer chain fatty acids was therefore higher in the no glucose condition compared to the glucose condition. A trend toward a greater long-chain unsaturated fatty acid composition of VM- M3 cells grown in no glucose media compared to VM-M3 cells grown in glucose media 35
50 was observed. Increasing the time of incubation in glucose and no glucose media past 4 h may result in a significantly greater percent composition of longer unsaturated fatty acid species in the no glucose condition compared to the glucose condition. The kinetics of CL remodeling in the VM-M3 cells under the conditions analyzed has not been analyzed. Cardiolipin composition of VM-M3 Cells in glucose and no glucose growth conditions: MS Mass Spectrometry was also used as a more sensitive and powerful means of analyzing the differences in fatty acid composition of VM-M3 cells grown in glucose and no glucose conditions for 4 hours. The CL lipodome displays that, overall, VM-M3 cells incubated in no glucose media (blue) contain a greater amount of longer-chain, unsaturated CL molecular species compared to VM-M3 cells incubated in glucose media (red) (Figure 9). However, a limited number of CL molecular species were significantly different between VM-M3 cells grown in glucose media and no glucose media (Figure 9). Therefore, increasing the limited sample size in these conditions may result in a more statistically significant difference in CL composition between the two conditions studied. Furthermore, modulating the time the cells are incubated in each condition may also influence the CL profile depending on the turnover rate of CL fatty acid species in these specific conditions. Proliferation of VM-M3 cells in glucose and no glucose condition There was no significant difference in the proliferation or observed morphology of VM-M3 cells grown in 10 mm glucose and no glucose conditions for 4 h (Figure 10). 36
51 Discussion In addition to the RAW and BV-2 macrophage cells, the VM-M3 cells also displayed a robust Crabtree effect in vitro. However, the assessment of the VM-M3 Crabtree effect was not performed in real-time. As an extension of the effect of glucose and no glucose conditions on oxygen consumption and extracellular acidification rates of the VM-M3 cells, the underlying structural differences that may exist between these two culture conditions were also studied. Such structural changes included the content and composition of the phospholipid cardiolipin. CL is highly enriched in the inner mitochondrial membrane and provides structure to the complexes of the electron transport chain. The content and fatty acyl composition of CL have been directly linked to the activities of the respiratory enzyme complexes (22, 25 27). Greater CL content and longer-chain unsaturated CL molecular species have been associated with higher respiration (4, 29, 31). Therefore, since the respiration of VM-M3 cells increased in no glucose media compared to glucose (10 mm) media, it was expected that the CL content would increase and the CL molecules would contain longer and unsaturated fatty acyl chains in VM-M3 cells incubated in no glucose media compared to glucose media. Although the content of CL did not significantly change when VM-M3 cells were incubated in glucose (10 mm) and no glucose media for 4 h, the molecular species of CL did change significantly. Gas chromatography analysis of the CL fatty acid species showed that VM-M3 cells grown in no glucose media for four hours had a significantly greater percent composition of palmitoleic acid (C16:1) and a lower SCFA/ LCFA ratio compared to the glucose condition. Although not robust, these changes support previous studies showing that CL 37
52 fatty acid species are more saturated and have longer chain lengths in cells with a high respiration (4, 29, 31). These changes in fatty acid composition also display a dynamic nature of CL remodeling in response to different energy substrates in vitro. A more robust change in CL composition between VM-M3 cells incubated in glucose and no glucose for four hours was observed using a more sensitive MS analysis of CL molecular species. The CL lipidome of VM-M3 cells incubated in no glucose media, overall, contained a longer-chain and more unsaturated fatty acid profile compared to VM-M3 cells incubated in glucose media. This data further supports the association of higher respiration with a longer-chain unsaturated CL molecular species profile and the dynamic CL remodeling that occurs when VM-M3 cells, grown previously in glucose media, are incubated in media lacking glucose. The number of VM-M3 cells incubated in media devoid of glucose for 4 h was not statistically significant from VM-M3 cells grown in 10 mm glucose media. This suggests that the absence of glucose had no affect on cell viability over the course of a 4 h incubation period. Therefore, the changes in CL molecular species detected by both GC and MS were not a result of a change in proliferation rate. However, a long-term growth analysis of VM-M3 cells in glucose media and low glucose media showed large differences in the growth potential of VM-M3 cells in low, 0.05mM glucose and 10mM glucose media. VM-M3 cells in low glucose media did not proliferate over a seven-day time period, while VM-M3 cells in glucose media displayed high proliferation (data not shown). When the VM-M3 cells in low glucose media were transitioned to 10mM galactose media, the cells proliferated slowly. VM-M3 cell number generally doubled over the seven-day period in galactose media. Similar results were 38
53 seen in HeLa cells (14). HeLa cells grown in galactose media had a significantly higher doubling time than HeLa cells grown in glucose media (14). The slower growth or absence of growth of VM-M3 cells in low glucose and galactose media shows that VM- M3 cells cannot support a high proliferation in vitro without a large concentration of glucose. Just as cancer cells preferentially utilize glucose for growth in vivo, VM-M3 tumor cells require glucose in vitro in order to sustain a high proliferation. Furthermore, the changes in VM-M3 proliferation rate and viability must also be considered when analyzing the CL content and composition in glucose and no glucose conditions for more than 4 h. 39
54 Figure 5. Oxygen consumption rate and extracellular acidification rate of VM-M3 cells. A. The oxygen consumption rate (OCR) of VM-M3 cells incubated for 2 hours in glucose and no glucose media was recorded using the Seahorse XF96 Flux analyzer. Results are presented as the mean nanomoles of O 2 consumed per hour per mg protein ± Standard Deviation (SD). B. The extracellular acidification rate (ECAR) of VM-M3 cells incubated for 2 h in glucose and no glucose media was recorded using the Seahorse XF96 Flux analyzer. Results are presented as the mean milli-ph per hour per mg protein ± standard deviation (SD). n=8 for both the glucose and no glucose conditions. ** indicates p <


55 A B 41
56 Figure 6. The structure of cardiolipin (CL). Tetralinoleoyl cardiolipin is one of several species of CL found in the VM-M3 cells. Adapted from LIPID MAPS Lipidomics Gateway. Common name: CL(1'[18:2(9Z,12Z)/18:2(9Z,12Z)],3'[18:2(9Z,12Z)/18:2(9Z,12Z)]) 42
57 O H O P O O O O P O O H O O H O O O O O O O 43
58 Figure 7. The association of cardiolipin (CL) with the electron transport chain (ETC). The enzymes associated with oxidative phosphorylation (OXPHOS) and ATP synthesis are located in the inner mitochondrial membrane of eukaryotes. The electrons that are delivered to complex I or II of the ETC are transferred by the lipid-soluble carrier ubiquinone (Q), complex III, and cytochrome c (cyt c) to complex IV. The electrons are then transferred to molecular oxygen producing H 2 O. Complexes I, III, and IV pump protons from the mitochondrial matrix into the intermembrane space (IMS) thus creating a ph gradient and establishing a membrane potential. The ph gradient is used by ATPsynthase (complex V) to synthesize ATP from ADP and organic phosphate. All of the enzymes of the ETC are bound to or associated with CL. The electron carrier cytochrome c has also been shown to be associated with CL. Abbreviations: OM: outer mitochondrial membrane; IMS: mitochondrial intermembrane space; IM: inner mitochondrial membrane. Adapted from R.K. Houtkooper and F.M. Vaz, 2008 (40). 44


59 45
60 Figure 8. High performance thin-layer chromatogram (HPTLC) of acidic lipids in VM-M3 cells grown in the presence (Glc +) and absence (Glc ) of 10mM glucose for 4 hours. Three individual VM-M3 cell populations grown in 10mM glucose (Glc +) and 0mM glucose (Glc ) were analyzed. The abbreviations used are as follows: O, origin; PS, phosphatidylserine; PI, phosphatidylinositol; PG, phosphatidylglycerol; PA, phosphatidic acid; CL, cardiolipin; IS, internal standard (oleyl alcohol); FFA, free fatty acid; and SF, solvent front of the first developing solvent system. 46

61 10mM Glucose 47
62 Table I Acidic lipid distribution of VM-M3 cells cultured in the presence and absence of glucose Acidic Lipids b Glc + a VM-M3 Cells Glc a Cardiolipin (CL) 2.9 ± ± 0.2 Phosphatidic acid (PA) 1.5 ± ± 0.2 Phosphatidylglycerol (PG) 0.5 ± ± 0.1* Phosphatidylserine (PS) 4.9 ± ± 0.4 Phosphatidylinositol (PI) 5.1 ± ± 0.3 a Values are expressed as the mean ± SD (n = 3 independent samples) b Determined from densitometric scanning of HPTLC as shown in Fig. 1; values are expressed as µg lipid/ 2 million cells * Indicates statistical significance between VM-M3 cells cultured in DMEM supplemented with 10mM glucose (Glc +) and VM-M3 cells cultured in DMEM without glucose (Glc -) at p < 0.05 as determined by an independent samples t-test 48
63 Table II- Fatty acid composition of cardiolipin in VM-M3 cells cultured in the prescence and absence of glucose FAME VM-M3 Cells Glc + Glc -! C16: ± ± 2.0 C16:1 2.2 ± ± 0.8* C18: ± ± 1.7 C18: ± ± 1.6 C18:2n ± ± 2.5 C18:3 4.0 ± ± 1.3 C20:3 1.8 ± ± 1.5 C20:4n ± ± 0.5 MUFA/PUFA a 2.0 ± ± 0.1 SCFA/LCFA b 14.8 ± ± 1.8* Values are expressed as the mean mole percent distribution of fatty acid methyl ester ± SD (n = 3) * Indicates significance of VM-M3 cells incubated in glucose media from no glucose media at p < 0.05 a MUFA represents C16:1, C18:1. PUFA represents C18:2n-6, C18:3, C20:3, C20:4n-6 ; p = b SCFA (shorter chain fatty acids: C16-C18). LCFA (longer chain fatty acids: C20) 49
64 Figure 9. Cardiolipin lipidome of VM-M3 cells cultured in 10 mm glucose (+ glucose) and no glucose ( glucose) conditions for 4 h. The graph is organized so that the length and saturation of the CL fatty acid species increases from left to right. Therefore, shorter-chain saturated fatty acid species are on the left side of the graph, while longer-chain unsaturated fatty acid species are on the right side of the graph. Data is displayed as the moles of CL/ mg protein. n=3 independent samples for each condition. Yellow stars indicate a significant difference in the content of the CL fatty acid species indicated between the glucose and no glucose condition at p >
65 51
66 Figure 10. Proliferation of VM-M3 cells grown in the presence (Glc +) and absence (Glc ) of 10 mm glucose for 4 h. VM-M3 cells were cultured in DMEM media containing 10mM glucose or 0mM glucose for 4 h. The individual cell populations were analyzed for both conditions (n=3). After 4 h, the VM-M3 cells were counted using a TC20 Automated Cell Counter. Cell numbers are expressed as the mean cell number ± SD. 52

67 Glc + Glc - 53
68 CHAPTER 3 METABOLISM OF ACTIVATED MACROPHAGES Link to Previous Chapter: Chapter 1 focused on the in vitro mitochondrial energy metabolism of the RAW macrophage cell line and BV-2 microglia cell line under nonactivated conditions. Therefore, this study aimed to analyze the effect of macrophage activation on the energy metabolism of RAW and BV-2 cells. Background: It has been previously shown that immune cells change their core metabolism from oxidative phosphorylation to glycolysis upon activation. Underlying this change in metabolism is the production of the metabolite nitric oxide (NO). NO has been shown to inhibit cytochrome c oxidase activity resulting in the stabilization of HIF- 1α and activation of glycolysis. Methodology and Principle Observations: The effect of LPS-activation on the respiration of RAW and BV-2 cells was analyzed using the Seahorse XF96 instrument. LPS-activation significantly decreased the respiration of both RAW and BV-2 cells in a concentration dependent manner. This decrease in respiration is seemingly modulated in part by NO production. The scavenging of NO with L-NAME significantly increased the respiration of RAW cells, but had no effect on the respiration of BV-2 cells at a concentration of 1µM. Overall, the BV-2 cells did not respond as robustly to LPS activation or L-NAME treatment compared to the RAW cells. A diminished response to LPS activation has previously been characterized in BV-2 cells in comparison to primary murine microglia (PM) cells (19). Conclusions and Significance: Both RAW and BV-2 cells display a concentration dependent decrease in OCR and increase in ECAR following LPS-activation. Furthermore, the immediate increase in OCR and decrease in ECAR following treatment of LPS-activated cells with the inos inhibitor L-NAME suggests that the OCR and ECAR of LPS-activated cells are mediated in by nitric oxide and are reversible in realtime. Interestingly, the Warburg effect that is observed upon LPS-activation of RAW and BV-2 cells is concomitant with a decrease in cell proliferation. Whereas, cancer cells typically display a Warburg effect with a concomitant increase in cell proliferation. 54
69 Introduction: The Warburg effect and activated macrophages I. The Warburg effect and activated immune cells As stated previously, Warburg observed that in the presence of oxygen tumor cells consume less oxygen and more glucose than normal untransformed cells (1 3). The reduced oxygen consumption of cancer cells that Warburg observed was concomitant with an increase in lactate fermentation (glycolysis) (1 3). This observation has been termed aerobic glycolysis or the Warburg effect. In 1970, G.C. Hard showed that a similar change in metabolism was evidenced in activated murine peritoneal macrophages, which had lower levels of oxygen consumption and higher levels of lactate production compared to resting macrophages (41). This study provided the first evidence of the metabolic change that occurs in macrophages following activation. Recently, the change in core metabolism from oxidative phosphorylation to glycolysis in activated monocytes, macrophages, dendritic cells, and T cells has been increasingly studied (Figure 7) (42 44). Specifically, Tannahil et al. showed that bone marrow-derived macrophages (BMDMs) activated by the gram negative bacterial product lipopolysaccharide (LPS) change their metabolism from oxidative phosphorylation to glycolysis (43). The LPS activated macrophages showed an up-regulation of glycolytic and down-regulation of mitochondrial genes and metabolites in addition to an increase in the TCA cycle intermediate succinate (43). Succinate was produced primarily through glutaminedependent anerplerosis with the contribution of the agmma-aminobutyric Acid (GABA)- shunt. This increase in succinate resulted in the stabilization of hypoxia-inducible factor 1α (HIF-1α), which induced interleukin 1β (IL-1β) production. 55
70 II. Activated macrophages and nitric oxide (NO) production The activation of macrophages results in a change in metabolism from oxidative phosphorylation to glycolysis. This metabolic change in activated macrophages is accompanied by the induction of inducible NO synthase (inos) and the generation of nitric oxide (NO), a molecule that inhibits cellular respiration (45). NO, produced from L-arginine by inos, reversibly inhibits cytochrome c oxidase in competition with oxygen, which results in the stabilization of HIF-1α and activation of glycolysis (45, 46). The production of NO, a lipid- and water-soluble radical gas, is a principle cytotoxic mechanism of activated macrophages. In order to study the effects of NO on the OCR and ECAR, NO production may be competitively inhibited by the L-arginine analog N-nitro-L-arginine methyl ester (L- NAME). In the present study, the effect of different concentrations of LPS on the oxygen consumption rate and extracellular acidification rate was evaluated in RAW and BV-2 macrophage cell lines. The effect of L-NAME, an inos inhibitor, on the oxygen consumption rate and extracellular acidification rate was studied in real-time. 56
71 Materials and Methods Reagents Lipopolysaccharide (LPS) and the L-arginine analog N-nitro-L-arginine methyl ester (L-NAME) were obtained from Sigma-Aldrich (St. Louis, MO, USA). Measurement of Oxygen Consumption and Extracellular Acidification Rates of RAW and BV-2 Cells OCR and ECAR measurements were obtained using the Seahorse XF96 Extracellular Flux Analyzer. All steps in the preparation of the assay were performed at Boston College and the Seahorse assay was performed at Berg, LLC (Framingham, MA). BV-2 and RAW246.7 cells were seeded at near confluence in Seahorse 96 well culture plates. The cells were allowed to seed for three hours in DMEM complete media (See Chapter 1 Materials and Methods for its composition). The media was then changed and the cells were incubated for 12 h in DMEM complete media with no LPS, or 1, 10, or 100 ng/ml LPS. The media was than changed to glucose seahorse media (See Chapter 1 Materials and Methods for composition) and incubated in a non-co 2 incubator for 2 h before the assay was inserted into the Seahorse XF96 analyzer. The XF analyzer was programmed to take 2-minute measurements with a 1-min mix and 2-min equilibration period before each measurement. 1mM L-NAME in glucose seahorse media was injected into the assay through drug port A when indicated. RAW264.7 cell growth assay The growth of RAW cells was assessed by dry weight. An initial dry-weight of the 30 million cells seeded was determined. 30 million RAW cells were washed 3X with 57
72 PBS, incubated at -80 C for 1 hour, and then lyophilized overnight for 18 h before being weighed. 30 million RAW cells were seeded in 150mm dishes in DMEM media containing 10% FBS for 3 h. The cells were then washed 3X with PBS and incubated in 10 mm glucose media with or without 50 ng/ml LPS for 72 hours. The RAW cells were then scraped, washed 3X with PBS, and the cell pellets were incubated at -80 C for 1 hour. The cell pellets were then lyophilized overnight for 18 h and the final dry-weight was determined. Statistics Statistical analyses were performed on all data using IBM SPSS 21 Statistics Software. Two-tailed t-tests were performed and the significance values were determined where indicated. 58
73 Results OCR and ECAR of LPS-activated RAW cells The OCR of RAW cells activated with 1 ng/ml (220 ± 36 pmol/min), 10ng/ml (134 ± 12 pmol/min), and 100 ng/ml LPS (113 ± 9 pmol/min) displayed significantly lower oxygen consumption rates compared to non-activated RAW cells (479 ± 19) (Figure 11 A,B) and showed a dose-dependent response to LPS over the range of LPS concentrations analyzed. RAW cells treated with 10 and 100 ng/ml LPS for 12 h had significantly lower OCR measurements compared to cells treated with 1 ng/ml LPS (Figure 11B). However, there was no significant difference in OCR between RAW cells treated with 10 and 100 ng/ml LPS (Figure 11B). Therefore, a maximal decrease in OCR is obtained between LPS concentrations of ng/ml when treated for 12 h. In agreement with the significant decrease in OCR upon LPS activation, the ECAR of RAW cells treated with 1 ng/ml (65 ± 6 mph/min), 10 mg/ml (68 ± 7 mph/min), and 100ng/ml (68 ± 3 mph/min) LPS significantly increased in each of these conditions compared to the non-activated RAW cells (34 ± 3mpH/min) (Figure 12A,B). However, a dose-dependent response in the OCR of RAW cells to LPS was not evidenced in the ECAR data (Figure 12B). The ECAR values of RAW cells treated with 1, 10, and 100ng/ml LPS were not significantly different from each other (Figure 12B). The activation of RAW cells with LPS causes the cells to release nitric oxide (NO), which is a known inhibitor of respiration. In order to study the reversibility of the inhibition of respiration by NO, L-NAME, an L-arginine analog that competitively inhibits the production of NO, was used. The effect of NO on the inhibition of respiration was analyzed in real-time using the injection ports on the XF96 Seahorse Extracellular 59
74 Flux Analyzer. Glucose seahorse media containing 4uM of L-NAME was injected through each port in order to obtain a final L-NAME concentration of 1 µm for each condition in the assay. In order to insure that any changes in OCR or ECAR were the result of L-NAME and not an increase in media volume, both activated (1,10, and 100 ng/ml LPS) and non-activated RAW cell conditions were injected with media containing no L-NAME. The addition of media did not significantly influence the OCR or ECAR in these conditions (data not shown). Following the addition of L-NAME to activated RAW cells, there was a significant increase in OCR and a significant decrease in ECAR (Figure 11C; 12C). However, the OCR values remained significantly lower than the OCR of non-activated RAW cells and the ECAR remained significantly higher than the ECAR of non-activated RAW cells (Figure 11B; 12B). Therefore, the addition of L-NAME and quenching of NO production did not result in the ability of the activated RAW cells to respire to the same degree as non-activated RAW cells. Interestingly, the addition of L-NAME to nonactivated RAW cells significantly decreased the OCR, but did not affect the ECAR (Figure 11C; 12C). Furthermore, after the addition of L-NAME to the RAW cells, the dose-dependent response of the RAW cell OCR to LPS was maintained (Figure 11B). LPS-activated RAW cell growth In order to understand the effect of LPS on RAW cell proliferation, a long-term (72 h) growth assay was performed. An LPS concentration of 50 ng/ml was chosen to ensure a maximum decrease in OCR for activated RAW cells. After 72 h, the activated 60
75 RAW cells had a significantly lower total cell dry weight than RAW cells incubated in DMEM containing 10 mm glucose (Figure 13). OCR and ECAR of LPS-activated BV-2 cells BV-2 cell activated with 10 ng/ml (195 ± 14 pmole/min) displayed a significantly lower oxygen consumption rate compared to non-activated BV-2 cells (221 ± 7 pmol/min) as well as BV-2 cells activated with 1ng/ml LPS (224 ± 7 pmol/min) (Figure 14A,B). There was no difference in OCR between BV-2 cells activated with 1ng/ml LPS and non-activated BV-2 cells (Figure 14A,B). Interestingly, both BV-2 cells treated with 1ng/ml LPS (24 ± 2 mph/min) and 10 ng/ml LPS (25 ± 2 mph/min) had significantly higher extracellular acidification rates (ECAR) compared to the non-activated BV-2 cells (21± 1 mph/min) (Figure 15A,B). The 1 ng/ml LPS condition thus had a significantly higher ECAR, but not a significantly lower OCR in the BV-2 cells. Following the addition of L-NAME to the BV-2 cells, there was no significant difference in OCR or ECAR for both activated and non-activated BV-2 cells (Figure 14B,C; Figure 15B,C). It was also confirmed in the BV-2 cells that the addition of L- NAME was influencing any possible changes in OCR and ECAR and not the added media (Data not shown). Overall, the BV-2 cells did not respond as robustly to activation by LPS or inhibition of nitric oxide (NO) production by L-NAME as the RAW cells (Figure 16). Using the OCR/ECAR ratio, RAW cells and BV-2 cells may be compared. A greater decrease in the OCR/ECAR ratio from the corresponding non-activated cells is seen in 61
76 the RAW cells activated with 10 ng/ml LPS (green) compared to the BV-2 cells activated with 10 ng/ml LPS (blue) (Figure 16B). Furthermore, RAW cells activated with 10 ng/ml LPS display a significant increase in the OCR/ECAR when L-NAME is added, while BV-2 cells activated with 10 ng/ml LPS display no significant change in the OCR/ECAR when L-NAME is added (Figure 16C). This suggests that RAW cells are more sensitive to a 1 µm L-NAME concentration than BV-2 cells, as assessed by the change in the OCR/ECAR ratio. 62
77 Discussion Both the RAW264.7 macrophage cell line and BV-2 microglia cell line display a Warburg effect when activated with LPS. In RAW cells, a significant decrease in oxygen consumption rate and increase in extracellular acidification rate is observed when cells are activated with LPS. These data suggest that the respiration of LPS-activated RAW cells is lower than non-activated RAW cells, while the glycolytic activity is higher in LPS-activated RAW cells compared to non-activated RAW cells. The decrease in oxygen consumption rate and increase in extracellular acidification rate in RAW cells activated with LPS was concentration dependent. These data are similar to the findings of Tannahil et al. (43). Tannahil showed that bone marrow-derived macrophages (BMDMs) activated by the Gram negative bacterial product lipopolysaccharide (LPS) change their core metabolism from oxidative phosphorylation to glycolysis (43). The addition of L-NAME to inhibit the production of nitric oxide (NO), an inhibitor of respiration, significantly increased the OCR and significantly decreased the ECAR of RAW cells at all concentrations of LPS analyzed in real-time. This suggests that NO is responsible for the inhibition of respiration and increase in glycolysis seen in RAW cells activated with LPS. However, a 1µM concentration of NO was not sufficient to return the OCR and ECAR measurements of RAW cells treated with 1,10, and 100 ng/ml LPS to the same OCR and ECAR measurements of non-activated RAW cells. The effect of greater concentrations of NO on both OCR and ECAR at each dose of LPS, in addition to the amount of NO in the culture media, must be analyzed before the effect of NO on LPS-activated RAW cell respiration and glycolytic activity can be fully assessed. 63
78 Interestingly, the addition of 1 µm L-NAME to non-activated RAW cells significantly decreased the OCR, but had no effect on ECAR. Therefore, the compound L-NAME may have an effect on RAW cell respiration in the absence of nitric oxide (NO) production. The growth of LPS-activated RAW cells was also found to be significantly lower than non-activated cells. Since the maximal decrease in respiration of LPS-activated RAW cells is between 10 and 100 ng/ml LPS, a 50ng/mL LPS concentration was used for the 72 h growth analysis of activated and non-activated RAW cells. The slower growth of LPS-activated RAW compared to non-activated RAW cells shows that activated RAW cells demonstrate a Warburg effect without the concomitant high proliferation seen in most cancer cells in vitro. In BV-2 cells, a significant decrease in oxygen consumption rate is observed only when cells are activated with 10 ng/ml LPS. Whereas, a significant increase in the extracellular acidification rate is observed in BV-2 cells activated with both 1 and 10 ng/ml LPS. Furthermore, BV-2 cells did not respond to the addition of L-NAME. Therefore, BV-2 cells do not appear to be as responsive to LPS-activation as RAW264.7 cells. Comparisons between RAW and BV-2 cells using the OCR/ECAR ratio further elucidate the seemingly higher response of RAW cells to LPS activation and NO production inhibition with L-NAME, as assessed by OCR and ECAR measurements. A weaker response to LPS activation has also been characterized in BV-2 cells in comparison to primary murine microglia (PM) cells (19). BV-2 cells displayed an overall lower expression profile of genes associated with inflammation compared to primary murine microglia (19). Therefore, BV-2 cells may have a high basal activation state which would weaken the response of BV-2 cells to LPS activation. This may explain 64
79 why BV-2 cells did not display as robust of a response in OCR and ECAR to LPS activation and NO inhibition with L-NAME as the RAW264.7 cells. In summary and in agreement with previous studies, the data suggest that both RAW264.6 and BV-2 cells change their core metabolism from oxidative phosphorylation to glycolysis upon LPS-activation in vitro. This change in metabolism in the RAW264.7 cells is mediated in part by the production of nitric oxide (NO). Interestingly, the data suggest that the BV-2 cells are already activated without the addition of LPS (high basal activation state). Therefore, the suitability of BV-2 cells as a non-activated macrophage control cell line must be questioned. This is especially important when conducting studies on the metabolism of BV-2 cells in their non-activated state, as a suppression of oxygen consumption may result from their basal activation and production of NO, a respiratory inhibitor. 65
80 Figure 11. Oxygen consumption rate (OCR) of RAW264.7 cells treated with LPS and L-NAME. RAW264.7 cells were treated with 1, 10, and 100 µg/ml LPS in Seahorse media for 12 hours before initiating OCR measurements using the XF96 Extracellular Flux Analyzer. Basal OCR measurements were obtained before adding 25 µl of 4 µm L-NAME media at 16 min to each condition to obtain a final L-NAME concentration of 1 µm. All data points in the assay are presented in (A) as the mean OCR ± S.D. OCR measurements from the data point before the addition of L-NAME and the data point after the addition of L-NAME are presented in bar graph format as the mean OCR ± S.D. for each condition (B). The effect of L-NAME on the OCR for each condition is depicted in (C) and expressed as the mean OCR ± S.D. In each condition n = 12. * indicates p < 0.05 compared to the No LPS condition or condition indicated and indicates p < 0.05 compared to 1ng/ml LPS. 66

81 A B C 67
82 Figure 12. Extracellular acidification rate (ECAR) of RAW264.7 cells treated with LPS and L-NAME. RAW264.7 cells were treated with 1, 10, and 100 µg/ml LPS in Seahorse media for 12 hours before initiating ECAR measurements using the XF96 Extracellular Flux Analyzer. Basal ECAR measurements were obtained before adding 25 µl of 4 µm L-NAME media at 16 min to each condition to obtain a final L-NAME concentration of 1 µm. All data points in the assay are presented in (A) as the mean ECAR ± S.D. ECAR measurements from the data point before the addition of L-NAME and the data point after the addition of L-NAME are presented in bar graph format as the mean ECAR ± S.D. for each condition (B). The effect of L-NAME on the ECAR for each LPS concentration analyzed is depicted in (C) and expressed as the mean ECAR ± S.D. In each condition n = 12. * indicates p < 0.05 compared to the No LPS condition or condition indicated. 68

83 A B C 69
84 Figure 13. RAW264.7 growth in glucose (10mM) and glucose (10mM) + LPS (50 ng/ml) media. RAW264.7 cells were treated with LPS for 72 hours. The initial and final dry weight of the lyophilized cell pellet was recorded. * indicates p <0.05. n = 5 independent cell populations per group. 70


85 71
86 Figure 14. OCR of BV-2 cells treated with LPS and L-NAME. BV-2 cells were treated with 1 and 10 µg/ml in glucose media for 12 h before initiating OCR measurements using the XF96 Extracellular Flux Analyzer. Basal OCR measurements were obtained before adding 25 µl of 4 µm L-NAME media at 29 min to each cell sample to obtain a final L-NAME concentration of 1 µm. All data points in the assay are presented in (A) as the mean OCR ± S.D. OCR measurements from the data point before the addition of L-NAME and the data point after the addition of L-NAME are presented in bar graph format as the mean OCR ± S.D. for each condition (B). The effect of L- NAME on the OCR for each LPS condition analyzed is depicted in (C) and expressed as the mean OCR ± S.D. n, the number of replicates for each sample was 5 or 10. * indicates p < 0.05 compared to the no LPS condition or condition indicated and indicates p < 0.05 compared to 1 ng/ml LPS condition. 72

87 A B C 73
88 Figure 15. Extracellular acidification rate (ECAR) of BV-2 cells treated with LPS and L-NAME. RAW264.7 cells were treated with 1 and 10 ug/ml LPS in glucose media for 12 h before initiating ECAR measurements using the XF96 Extracellular Flux Analyzer. Basal ECAR measurements were obtained before adding 25 µl of 4 µm L- NAME media at 29 min to each condition to obtain a final L-NAME concentration of 1 µm. All data points in the assay are presented in (A) as the mean ECAR ± S.D. ECAR measurements from the data point before the addition of L-NAME and the data point after the addition of L-NAME are presented in bar graph format as the mean ECAR ± S.D. for each condition (B). The effect of L-NAME on the ECAR for each LPS concentration analyzed is depicted in (C) and expressed as the mean ECAR ± S.D. Five or ten replicates were done for each LPS condition. * indicates p < 0.05 compared to the No LPS condition or condition indicated. 74
89 A B C 75
90 Figure 16. OCR/ECAR Ratio in non-activated and 10ng/ml LPS-activated RAW and BV-2 cells. All data points in the assay are presented in (A) as the mean OCR/ECAR ± S.D. OCR/ECAR ratios from the data point before the addition of L-NAME is presented in bar graph format as the mean OCR/ECAR ± S.D. for each condition (B). The effect of L-NAME on the ECAR for the 10 ng/ml LPS concentration is depicted in (C) and expressed as the mean OCR/ECAR ± S.D. * indicates p < 0.05 compared to the no LPS condition. 76

91 A B C 77
92 CHAPTER 4 THE IN VITRO NEUTRAL AND ACIDIC LIPID PROFILES OF RAW264.7 CELLS IN GLUCOSE, NO GLUCOSE, AND LPS ACTIVATED CONDITIONS Link to Chapters 1 and 3: Chapters 1 and 3 studied the mitochondrial energy metabolism of RAW cells under in vitro conditions with glucose, without glucose, and LPS. This chapter presents and analyzes the neutral and acidic lipid profiles of the RAW cells in conditions similar to those studied above. Background: The lipid of interest in this study was cardiolipin since this lipid is associated with energy metabolism. CL, an acidic phospholipid localized in the inner mitochondrial membrane, is integral in maintaining mitochondrial function and membrane integrity. Both CL content and fatty acid composition have been directly linked to the activities of the respiratory enzyme complexes. High respiratory enzyme activity and oxygen consumption has been associated with high CL content, while low respiratory enzyme activity and oxygen consumption has been associated with low CL content. Methodology and Principle Observations: The neutral and acidic lipid profiles of RAW cells were studied following incubation in different medias for 72 h in order to determine long-term changes in lipid composition. Due to the long incubation period, fetal bovine serum was added to the medium, which resulted in the removal of the no glucose condition and addition of a low glucose condition. The lipid profile of RAW cells showed a significantly higher CL percent distribution in the low glucose condition compared to the glucose condition. Conclusions and Significance: Previous data showed that the level of cellular respiration activity is directly correlated with the level of CL content. Previous data in this manuscript showed that RAW cells incubated in media containing no glucose displayed a significantly higher oxygen consumption rate (respiration) than RAW cells incubated in glucose media. Therefore, RAW cells incubated in glucose media show a low respiratory capacity and CL content, which is in agreement with previous data. 78
93 Introduction: Lipid profile of RAW264.7 cells As previously discussed, RAW cells dynamically change their metabolism in response to different energy substrates, as well as LPS-stimulated activation. In addition to the study of energy metabolism, the lipid profiles of RAW cells in similar no glucose, glucose, and LPS culture conditions were also analyzed. However, the lipid analysis was performed after RAW cells were incubated in their respective culture conditions for 72 h in order to identify long-term lipid changes that may occur. Since RAW cells were incubated over a long time period, FBS was added to the media, and this contained glucose. Therefore, the lipid profile of a low glucose condition was studied and not a no glucose condition. The lipid of interest in this study was cardiolipin since this lipid is associated with energy metabolism. CL, an acidic phospholipid localized in the inner mitochondrial membrane, is integral in maintaining mitochondrial function and membrane integrity. Both CL content and fatty acid composition have been directly linked to the activities of the respiratory enzyme complexes, as discussed in Chapter 1. A high respiratory enzyme activity and oxygen consumption has been associated with high CL content, while a low respiratory enzyme activity and oxygen consumption has been associated with low CL content (22, 26, 27, 40, 47, 48). Therefore, it was hypothesized that, in RAW cells, the high oxygen consumption rate of cells grown in no glucose would be associated with high CL content, while the a low oxygen consumption rate of cells grown in glucose or treated with LPS would be associated with low CL content. A galactose condition was also included since previous studies have shown that the complete replacement of glucose by galactose significantly increases respiration in several different cell types (14, 21, 49, 79
94 50). Therefore, although not confirmed in this study, it was hypothesized that RAW cells grown in galactose media would display a high oxygen consumption rate or high respiration and would, therefore, have high CL content similar to cells grown in low glucose. Interestingly, another lipid of interest that presented itself in this study was phosphtidylserine (PS). PS is the most abundant negatively charged phospholipid in eukaryotic membranes and is found primarily in the inner leaflet of the plasma membrane (51) (Figure 22). The loss of this PS asymmetry in the membrane is associated with the recognition of apoptosis as well as blood coagulation (51). PS became a major lipid of interest after confirmation that three (or two) distinct lipid bands migrating at and near the PS standard were each confirmed to be PS (Figure 15, 17, 20). The variable migration of these three (or two) bands suggests that each band contains PS with fatty acyl chains of different lengths and degrees of saturation. However, the length and saturation of PS was not determined in this study. Only the content of PS and other lipids in RAW cells was analyzed. In this study, the lipid profiles of the following culture conditions were studied: glucose (10 mm), low glucose (0.05 mm), galactose (10 mm), and glucose (10 mm) + LPS (50 ng/ml), with particular focus on the CL content in each condition. 80
95 Materials and Methods Reagents HPLC grade methanol and chloroform were purchased from Sigma (St. Louis, MO, USA). DMEM, glucose, and glutamine were purchased from Sigma (St. Louis, MO, USA). Cell culture grade AlbuMAX I (lipid rich bovine serum albumin) was obtained from Gibco by Life Technologies (Grand island, NY, USA). Cell lines and culture conditions The murine macrophage RAW264.7 cell line was purchased from the American Type Culture Collection (Manassas, VA). The RAW cell line was maintained in Dulbecco s Modified Eagle s Medium (DMEM, Sigma, St. Louis, MO) with high glucose (25 mm) and supplemented with 10% fetal bovine serum (FBS, Sigma) and 50 µg/ml penicillin-streptomycin (Sigma). The cells were maintained in a humidified incubator at 37ºC with 5% CO 2. When the cells reached ~80% confluence they were counted using a TC20 and 30 million cells were seeded in five 150mm culture dishes for each condition. The RAW cells were allowed to seed for 3 h and were then washed 3x with dpbs. 15 ml of culture media for each of the four conditions was added. The four culture conditions are as follows: 81
96 1. Glucose (10mM) 2. Low Glucose 3. Galactose 4. Glucose (10mM) (0.05mM) (10mM) +LPS (50ng) DMEM (Sigma) DMEM (Sigma) DMEM (Sigma) DMEM (Sigma) 10mM glucose 10mM glucose 10mM galactose 2mM glutamine 2mM glutamine 2mM glutamine 2mM glutamine sodium bicarbonate (3.7 g/l) 0.5 mg/ml Albumax 50 µg/ml penicillinstreptomycin 2% FBS (0.05 mm glucose) sodium bicarbonate (3.7 g/l) 0.5 mg/ml Albumax 50 µg/ml penicillinstreptomycin 2% FBS (0.05mM glucose) sodium bicarbonate (3.7 g/l) 0.5 mg/ml Albumax 50 µg/ml penicillinstreptomycin 2% FBS (0.05mM glucose) sodium bicarbonate (3.7 g/l) 0.5 mg/ml Albumax 50 µg/ml penicillinstreptomycin 2% FBS (0.05mM glucose) 50 ng/ml LPS After incubation for 72 h, the medium was removed from the RAW cells and the cells were scraped and washed 3x with dpbs. The cell pellet was then placed at -80 C for 1 h and lyophilized overnight for 16 h. The lyophilized cell pellets were weighed. Lipid isolation Total lipids were isolated and purified from 20mg lyophilized cell pellets. Lipid isolation was performed as described in Chapter 1. Column chromatography Performed as described in Chapter 2. 82
97 Neutral lipid purification Following the separation of neutral and acidic lipids, the neutral lipids were dried in a Genevac EZ-2 evaporator (Genevac SP Scientific, Stone Ridge, NY). The dried neutral lipid fraction was suspended in 8 ml of CHCl 3 /CH 3 OH (1:1, v/v). The neutral lipid samples were then dried under a stream of nitrogen and suspended in 2 ml of CHCl 3 /CH 3 OH (1:1 v/v). Acidic lipid purification Performed as described in Chapter 2. HPTLC Neutral and acidic lipids were qualitatively analyzed using high-performance thin-layer chromatography (HPTLC) with modifications as previously described (34) (36). Neutral and acidic lipids were spotted on 10 x 10 cm Silica gel 60 HPTLC plates using the Camag Linomat V auto-tlc spotter (Camag Scientific Inc., Wilmington, NC, USA). The amount of neutral and acidic lipids spotted on the HPTLC was equivalent to 70µg and 400µg of cell dry weight, respectively. An internal standard (oleyl alcohol) was added to the acidic lipid samples as a control for the amount of lipids spotted. Acidic and neutral lipid standards were purchased from Matreya (Pleasant Gap, PA). The neutral and acidic HPTLC plate was developed and visualized as described previously (36). 83
98 Identification of PS on HPTLC PS was detected on HPTLC by ninhydrin reagent. The ninhydrin reagent was prepared by agitating 200mL of butanol with 200mL of dh 2 O in a 400mL separatory funnel. The lower aqueous phase was discarded and the upper phase collected. 0.2g of ninhydrin was dissolved in 100 ml of the butanol saturated with water and the reagent was put in a spray bottle. The HPTLC plate was developed as previously described. The plate was allowed to dry for 15 minutes and then sprayed with the 0.2% ninhydrin reagent. The HPTLC plate was then placed face-up and heated at 100 C for 2 minutes until red-violet spots appeared. Statistics Statistical analyses were performed on all data using IBM SPSS 21 Statistics Software. Two-tailed t-tests were performed and the significance values were determined where indicated. 84
99 Results Acidic lipids RAW cells were incubated for 72 h in media containing glucose (10 mm), low glucose (0.05 mm), galactose (10 mm), and glucose (10 mm) + LPS (50 ng/ml). The acidic lipid profile from the RAW cells in these conditions showed that RAW cells in the low glucose condition had a significantly higher percent distribution of CL (21.3 ± 2.7 %) compared to the content of CL in the 10mM glucose sample (14.0 ± 0.9 %) (Figure 17; Table III). The percent composition of CL was also significantly higher in the galactose (20.6 ± 2.4 %) and glucose + LPS (18. 7 ± 0.6 %) condition compared to the glucose condition (14.0 ± 0.9 %) (Table III). There were no significant differences in CL percent distribution when comparing the galactose and LPS conditions to the low glucose condition (Table III). Interestingly, PS contained three bands in the glucose and glucose + LPS samples, two bands in the galactose sample, and two bands with a faint third band low glucose sample (Figure 17, 19). The characterization of each of these bands as PS was confirmed using ninhydrin reagent (Figure 22). Ninhydrin reagent detects the free amino group on the PS lipid molecule (Figure 21). Additionally, the differential migration of phosphatidic acid (PA) was also noted when comparing the acidic lipid profiles of each growth condition. PA appeared to migrate a greater distance from the origin in the low glucose and galactose conditions compared to the glucose and glucose + LPS conditions (Figures 17,19). Further analysis of the fatty acid composition of PA would need to be performed in order to better understand these differences in migration on HPTLC. 85
100 Neutral lipids The neutral lipid profile of RAW cells incubated for 72 hours in media containing glucose (10 mm), low glucose (0.05 mm), galactose (10 mm), and glucose (10 mm) + LPS (50 ng/ml) was also analyzed (Figures 18,20). The percent composition of phosphatidylcholine (PC) was significantly greater in the low glucose condition (35.7 ± 0.6 %) in comparison to the glucose sample (33.0 ± 0.4 %) (Table IV). The PC content in the galactose sample was not significantly different from the glucose sample (Table IV). While, the percent composition of PC in the glucose + LPS sample was significantly lower (31.8 ± 0.3 %) than the PC content in the glucose sample (33.0 ± 0.4 %) (Table IV). The percent composition of phosphatidylethanolamine (PE) in both the low glucose and galactose conditions were significantly higher than the glucose and glucose + LPS conditions (Table IV). The percent composition of cholesterol (C) was significantly lower in both the low glucose and galactose conditions in comparison to the glucose and glucose + LPS conditions (Table IV). Interestingly, there was a trace amount of sphingomyelin (SPM) lipid in the lipid fraction isolated from the galactose grown cells (Table IV). RAW Cell Growth The growth of RAW cells incubated for 72 h in media containing glucose (10 mm), low glucose (0.05 mm), galactose (10 mm), and glucose (10 mm) + LPS (50 ng/ml) was also analyzed (Figure 23). Growth was assessed by cell dry weight. The low glucose, galactose, and glucose + LPS condition dry weights were significantly lower 86
101 than the glucose dry weight after 72 h (Figure 23). The galactose and no glucose condition cell dry weights were significantly lower than the glucose + LPS cell dry weight after 72 h (Figure 23). Additionally, the no glucose cell dry weight was significantly lower compared to the galactose dry weight (Figure 23). 87
102 Discussion Cardiolipin content RAW cells display a robust Crabtree effect in vitro. RAW cells incubated in glucose media had a significantly lower oxygen consumption rate (OCR) and significantly higher extracellular acidification rate (ECAR) compared to RAW cells incubated in no glucose media (Figure 1 and 2). However, these metabolic measurements were obtained over a short, two hour time period. In order to study possibly more dramatic changes in the lipid composition of RAW cells that may occur over a longer time period, RAW cell lipid analysis was performed after a 72 h incubation period. Since cells were incubated for 72 h, fetal bovine serum (FBS) was added to the media to support cell viability. Since 2% FBS, which contained glucose, was added to the media, a low glucose condition was studied instead of a strictly no glucose condition. The lipid of interest in this study was CL since its content has been associated with the level of cellular respiration. It was previously shown that RAW cells incubated in no glucose media have a higher respiration than RAW cells incubated in glucose media. Therefore, it was expected that RAW cells incubated in low glucose media would have a significantly higher CL content than RAW cells incubated in glucose media. These expectations were confirmed in this study. The data, therefore, correlate with previous data showing a direct relationship between CL content and respiration level (22, 26, 27, 40, 47, 48). RAW cells were also incubated in media containing galactose for 72 h to study the replacement of glucose with an energy substrate found to increase respiration. Previous studied showed that several different cell types (fibroblasts, cancer cells, and 88
103 myotubes (developing skeletal muscle fiber)) grown in galactose media show significantly increased oxygen consumption rates and a decreased glycolytic rate compared to cells cultured in high glucose medium (14, 21, 49, 50). RAW cells incubated in galactose media for 72 h displayed a significantly higher CL content compared to RAW cells incubated in glucose. In order to determine if this increase in CL content is concomitant with an increase in respiration, an assay determining OCR and ECAR measurements of RAW cells in galactose media must be performed. RAW cells activated with 50 ng/ml LPS also showed higher CL content compared to non-activated RAW cells. LPS-activation was previously shown to decrease RAW cell respiration, therefore, it was expected that LPS-activation would decrease CL content. However, the long, 72-hour duration of RAW cell incubation in 50 ng/ml LPS may have diminished the effect of LPS on cellular respiration and CL content. Phosphatidylserine (PS) and phosphatidylethanolamine (PE) content A major lipid of interest that presented itself in this study was PS, which displayed a variable migration pattern in response to different energy substrates or LPSactivation. RAW cells incubated in 10 mm glucose media and RAW cells activated with LPS showed three distinct PS lipid bands, while RAW cells incubated in low glucose and galactose media showed two distinct PS lipid bands. It has been previously found in the yeast Saccharomyces cerevisiae that the level of CHO1 mrna, encoding the PS synthase enzyme, decreases when cells transition from fermentation in glucose media to respiration in glycerol media (52). CHO1 mrna levels have also been shown to increase in response to oxygen deprivation (53). Therefore, a decrease in mitochondrial respiration 89
104 results in an increase in CHO1 transcript levels and, presumably, an increase in the number of PS molecules. In agreement with these data, RAW cells incubated in fermentative cell culture conditions, such as glucose, displayed higher PS content compared to RAW cells incubated in respiratory cell culture conditions, such as low glucose and galactose. However, the synthesis of PS is different in prokaryotes and the yeast Saccharomyces cerevisiae compared to mammalian cells. In Saccharomyces cerevisiae, all PS is synthesized by a PS synthase that uses CDP-diacylglycerol and L-serine as substrates. While, in mammalian cells PS is synthesized by calcium-dependent baseexchange reactions in which the polar head-group (choline or ethanolamine) of a preexisting phospholipid (PC or PE, respectively) is exchanged for L-serine (54). Furthermore, prokaryotes and S. cerevisiae contain a single PS synthase, while mammalian cells express two PS synthase enzymes (PSS1 and PSS2) that are encoded by two different genes (54). Therefore, the transcriptional response of PSS1 and PSS2 to the metabolism of different energy substrates by mammalian cells must be studied to be able to determine if mammalian cells also increase transcription of their PS synthases in response to a decrease in mitochondrial respiration. Additionally, further analysis of the PS fatty acid composition must be performed since each condition studied showed variable migration of PS on HPTLC. The fatty acid chain composition may be an important consideration in the synthesis of PE though the decarboxylation of PS in the mitochondria by PS decarboxylase (PSD). Mitochondrial PE deficiency has been shown to result in the alteration of mitochondrial morphology, decreased ATP production, decreased oxygen consumption, and altered activity of the 90
105 electron transport chain enzymes (55, 56). Therefore, similar to CL, the fatty acid composition of PE, inherited from PS through its decarboxylation, may also affect mitochondrial function. Furthermore, in agreement with the above PE data, a decrease in PE content was seen in RAW cells incubated in glycolytic conditions (glucose and LPSactivation), while a significantly higher PE content was seen in RAW cells incubated in respiratory conditions (low glucose and galactose). 91
106 Figure 17. HPTLC of acidic lipids in RAW cells incubated for 72 h in glucose (10 mm) and low glucose (0.05 mm) media. Five individual glucose (10 mm) and low glucose (0.05 mm) RAW cell populations were analyzed. The abbreviations used are as follows: O, origin; PS, phosphatidylserine; PI, phosphatidylinositol; Sulf, sulfatides (doublet); PA, phosphatidic acid; CL, cardiolipin; IS, internal standard (oleyl alcohol); FFA, free fatty acid; and SF, solvent front of the first developing solvent system. 92

107 93
108 Figure 18. HPTLC of neutral lipids in RAW cells incubated for 72 h in glucose (10 mm) and low glucose (0.05 mm) media. Five individual glucose (10 mm) and low glucose (0.05 mm) RAW cell populations were analyzed. The abbreviations used are as follows: O, origin; SPM, sphingomyelin; PC, phosphatidylcholine; PE, phosphatidylethanolamine; CB, cerebrosides (doublet); CM, ceramide; C, cholesterol; IS, internal standard (oleyl alcohol); TG, triglycerides; CE, cholesterol ester; and SF, solvent front of the first developing solvent system. 94

109 95
110 Figure 19. HPTLC of acidic lipids in RAW cells incubated for 72 h in galactose (10 mm) and glucose (10 mm) + LPS (50 ng/ ml) media. Five individual galactose (10 mm) and glucose (10 mm) + LPS (50 ng/ml) RAW cell populations were analyzed. The abbreviations used are as follows: O, origin; PS, phosphatidylserine; PI, phosphatidylinositol; Sulf, sulfatides (doublet); PA, phosphatidic acid; CL, cardiolipin; IS, internal standard (oleyl alcohol); FFA, free fatty acid; and SF, solvent front of the first developing solvent system. 96

111 SF 97
112 Figure 20. HPTLC of neutral lipids in RAW cells incubated for 72 h in galactose (10 mm) and glucose (10 mm) + LPS (50 ng/ml) media. Five individual galactose (10 mm) and glucose (10 mm) + LPS (50 ng/ml) RAW cell populations were analyzed. The abbreviations used are as follows: O, origin; SPM, sphingomyelin; PC, phosphatidylcholine; PE, phosphatidylethanolamine; CB, cerebrosides (doublet); CM, ceramide; C, cholesterol; IS, internal standard (oleyl alcohol); TG, triglycerides; CE, cholesterol ester; and SF, solvent front of the first developing solvent system. 98


113 99
114 Table III. Percent Distribution of Acidic Lipids in RAW264.6 Cells Acidic Lipids b RAW264.7! Cells!!!!! Glucose (10mM) a Low Glucose (0.05mM) a Galactose (10mM) a Glucose (10mM) + LPS (50ng) a Phosphatidylinositol (PI) 27.1 ± ± 1.8 * 19.7 ± 0.6 * 23.4 ± 0.9 * Phosphatidylserine (PS) 36.6 (3) ± (2*) ± 2.2 * 25.0 (2) ± 2.3 * 30.7 (3) ± 1.2 * Phosphatidic Acid (PA) 22.4 ± ± ± 0.6 * 27.3 ± 1.5 * Cardiolipin (CL) 14.0 ± ± 2.7 * 20.6 ± 2.4 * 18.7 ± 0.6 * a Values are expressed as the mean percent distribution ± SD (n = 5 independent samples)!!!!!! b Determined from densitometric scanning of HPTLC as shown in Fig. 15 and 17!!!!!! * Indicates significance of the indicated culture condition from the Glucose (10mM) culture condition in RAW!!!!! cells at p < 0.05 as determined by independent-samples T Test!!!! (2/3) indicates the number of PS lipid bands; (2*) indicates a faint 3rd band in this condition!!!!!!!!!!!!!!!!!!!!!!!!! Table IV. Percent Distribution of Neutral Lipids in RAW264.6 Cells! RAW264.7! Cells!!!! Neutral Lipids b Glucose (10mM) a Low Glucose (0.05mM) a Galactose (10mM) a Glucose (10mM) + LPS (50ng) a Sphingomelin (SPM) Trace Phosphatidylcholine (PC) 33 ± ± 0.6 * 32.7 ± ± 0.3 * Phosphatidylethanolamine (PE) 24.6 ± ± 2 * 28.6 ± 1.7 * 23.9 ± 1.4 Cholesterol (C) 42.5 ± ± 1.4 * 39.5 ± 1.4 * 43.6 ± 0.9! Values are expressed as the mean percent distribution ± SD (n! = 5 independent!! samples)!!!!!!!!! b Determined from densitometric scanning of HPTLC as shown in Fig. 16 and 18!!!!!! * Indicates significance of the indicated culture condition from the Glucose (10mM) culture condition in RAW!! cells at p < 0.05 as determined by independent-samples T Test!!!!!!!!!!!!!! 100
115 Figure 21. Structure of phosphatidylserine. Phosphatidylserine (PS) is a phosphoglyceride containing a phosphorylserine head group. PS(10:0/10:0) is one of many PS molecular species. Adapted from LIPID MAPS Lipidomics Gateway. 101
116 O O NH 3 H O O P O O H O O O O 102
117 Figure 22. Identification of PS. HPTLC plates were spotted and developed as discussed in the Materials and Methods. The HPTLC plate was then sprayed with a 0.02% ninhydrin in butanol solution and heated. The detection of PS was confirmed using a PS standard. 103

118 104
119 Figure 23. RAW cell growth in glucose (10 mm), low glucose (0.05 mm), galactose (10 mm), and glucose (10mM) + LPS (50 ng/ml) media for 72 h. Cell growth was analyzed by cell dry weight using the average dry weight of 30 million cells (five replicates) * indicates significance of p < 0.05 compared to the glucose (10 mm) condition. indicates significance of p < 0.05 compared to the glucose (10 mm) + LPS (50 ng/ml) condition. ψ indicates significance of p < 0.05 of the low glucose (0.05 mm) condition compared to the galactose (10 mm) condition. 105

120 106
121 CHAPTER 5 CONSIDERATIONS FOR IN VIVO STUDIES USING THE VM-M3 METASTATIC CANCER MODEL Connection to Chapter 2: As discussed in Chapter 2, the Crabtree effect and CL profile of the VM-M3 cells were studied in vitro. An in vivo extension of this study would utilize the VM-M3 mouse model of metastatic cancer. However, a better understanding of the variable tumor growth and/or metastasis within the VM-M3 mouse model needs to be established before such studies are performed. Background: The VM-M3 mouse model is a powerful synergistic model of metastatic cancer. The subcutaneous injection of the VM-M3 cell line into the flank of the VM/Dk synergistic host results in primary tumor formation and systemic metastasis to multiple organ systems (liver, lung, spleen, kidney, and brain). The VM-M3 cells are transduced with a lentiviral vector expressing luciferase (VM-M3/Fluc) so the progression of primary tumor growth and systemic metastasis can be monitored by bioluminescence imaging (BLI). However, when the same number of VM-M3 cells is inoculated subcutaneously into the flanks of a cohort of age and sex matched VM mice, the whole body photon flux of each animal on a specified day can be exceedingly different. Methodology and Principle Observations: The aim of this study was to determine if a cohort of age and sex matched VM mice inoculated with VM-M3 cells could be divided into high whole body bioluminescence or fast progression and low whole body bioluminescence or slow progression groups using whole body bioluminescence, and whether the mice within each group would display similar metastasis bioluminescence and primary tumor weight at the termination of the study. Overall, the aim of this study was not supported by the data collected in this experiment. Conclusions and Significance: The proposed screen was not predictive of both ex vivo metastasis and primary tumor wet weight at the termination of the study. Therefore, a new method of understanding the variation in VM-M3 tumor progression, invasion, and metastasis must be established. Understanding such variation in VM-M3 tumor progression is essential for determining if a particular treatment shows efficacy in the VM-M3 model or if some of the treated mice inherently have slower growing primary tumors and/or a slower metastatic progression. 107
122 Introduction: In vivo VM-M3 metastatic cancer model screen As discussed in Chapter 2, the Crabtree effect and CL profile of the VM-M3 cells were studied in vitro. An in vivo extension of this study would utilize the VM-M3 mouse model of metastatic cancer. However, a better understanding of the variable tumor growth and/or metastasis within the VM-M3 mouse model needs to be established before such studies are performed. Therefore, the final chapter of this thesis discusses a screening technique for the VM-M3 mouse model as a possible means of better organizing experimental groups for studies using this in vivo cancer model. Mouse preclinical models of cancer Mouse models of cancer are invaluable tools for studying the molecular basis of cancer and the development of new cancer therapies. However, many mouse models of cancer, including human tumor xenograft models and genetically engineered mouse models (GEMMs), are limited to modeling the initiation and progression of primary tumor growth (57). Systemic metastasis, or the spread of tumor cells to multiple organ systems, is responsible for the majority of cancer deaths. The VM-M3 metastatic cancer mouse model is such a model in which implanted cells invade locally from the implanted tissue site and spread to multiple organ systems within 2-4 weeks time. The VM-M3 model represents a more natural model of metastatic cancer and displays many of the growth characteristics of human metastatic cancers. The VM/Dk (VM) mouse strain has a high incidence of spontaneous brain tumor formation (1.5%) with most brain tumors being classified as gliomas (33). The VM-M3 mouse model was generated from the spontaneous brain tumor of a VM mouse detected 108
123 during the routine examination of the colony between The tumor-bearing mouse presented cranial swelling and lethargy. The tumor was passaged both intracerebrally (i.c.) and subcutaneously (s.c) before a cell line was established from the tumor and classified as VM-M3. The subcutaneous injection of the VM-M3 cell line into the flank of the VM/Dk synergistic host results in primary tumor formation and systemic metastasis to multiple organ systems (liver, lung, spleen, kidney, and brain). Furthermore, since the VM-M3 cells are transduced with a lentiviral vector expressing luciferase (VM-M3/Fluc), the progression of primary tumor growth and systemic metastasis is able to the monitored in the VM-M3 model by bioluminescence imaging (BLI) using luciferin. The VM-M3 mouse model is a powerful synergistic model of metastatic cancer. Mouse cancer model variability In addition to the type of cancer model used in preclinical studies, the variability of tumor take and tumor growth within the model must also be considered. Several models of cancer have wide ranges of tumor cell take rate, growth, and metastatic capacity (58 60). Therefore, studies often stratify the mice into treatment groups to obtain similar average tumor sizes in each group or restrict the mice enrolled in the study to those that have a specific primary tumor size range (60). In such studies, the mice are screened prior to the initiation of the experiment. This screening procedure may remove mice from the study to develop homogenous treatment populations. However, the addition of these mice to the study may better model human cancers, as human cancer 109
124 cohorts are heterogeneous. However, including mice of variable tumor size may interfere in determining if a treatment shows statistical significance in a preclinical model. VM-M3 model variability Since the progression of primary tumor growth and systemic metastasis is able to the monitored in the VM-M3 model by bioluminescence imaging (BLI), the growth of the VM-M3 tumors can be assessed before palpable tumors are detected and metastatic spread can be monitored. Bioluminescence of the VM-M3 mice may be obtained on any day following the inoculation of VM-M3 cells. However, it has been observed that when the same number of VM-M3 cells is inoculated subcutaneously into the flanks of a cohort of age and sex matched VM mice, the whole body photon flux of each animal on a specified day can be exceedingly different. Some animals display high bioluminescence while other animals display very little bioluminescence on, for example, day 6 post inoculation. This indicates that there is differential tumor take, growth, and/or metastasis within the VM-M3 model. Therefore, it becomes difficult to assess whether a treatment has efficacy or the particular mouse being treated has an underlying propensity to develop VM-M3 tumors and metastasis at a slower rate. Therefore, the aim of this study was to determine if a cohort of age and sex matched VM mice inoculated with VM-M3 cells could be divided into high whole body bioluminescence or fast progression and low whole body bioluminescence or slow progression groups using whole body bioluminescence. And, whether the mice within each group would display similar metastasis bioluminescence and primary tumor weight at the termination of the study. 110
125 Materials and Methods Mice Mice of the VM/Dk strain were originally obtained from H. Fraser (University of Edinburgh) and from G. Carlson (McLaughlin Research Institute, Great Falls, Montana). The mice were housed and bred in the Boston College Animal Care Facility. The mice were group housed (4 mice/ cage) in plastic cages with filter tops containing Sani-Chip bedding (P.J. Murphy Forest Products Corp., Montville, NJ, USA). The room was maintained at 22 C on a 12-h light/dark cycle. Food (PROLAB R/M/H/3000 Laboratory Chow, Agway, St Louis, MO, USA) and water were provided ad libitum. All animal procedures were in strict accordance with the NIH Guide for the Care and Use of Laboratory Animals and were approved by the Institutional Animal Care and Use Committee (IACUC). VM-M3 cell line The VM-M3 cell line was previously established from the flank-grown spontaneous VM-M3 tumor isolated from the cerebellum of a VM/Dk strain mouse (33). The cells were maintained in Dulbecco s Modified Eagle s Medium (DMEM, Sigma, St. Louis, MO) with high glucose (25 mm) and supplemented with 10% FBS (Sigma) and 50 µg/ml penicillin-streptomycin (Sigma), and phenol red (Sigma) (DMEM Complete media). The cells were maintained in a humidified incubator at 37ºC with 5% CO h prior to inoculation into the VM Mice, the VM-M3 cells were serum starved. 111
126 Tumor cell inoculation VM-M3 cells were re-suspended in dpbs at a density of 4 x 10 6 cells/ml. Mice were anesthetized with isoflourane and injected subcutaneously with 2 x 10 6 cells in dpbs (500 µl) using a 28-gauge insulin syringe. In vivo bioluminescence imaging Mice were imaged with the Xenogen IVIS system (Xenogen, Hopkington, MA) to quantify the bioluminescence signal from the VM-M3/Fluc tumors. The IVIS Lumina cooled CCD camera system was used for light acquisition. The Xenogen system is coupled to a PC with LivingImage TM software for data acquisition and analysis (Xenogen). For in vivo imaging, mice received an i.p. injection of d-luciferin (50 or 150 mg/kg, Promega). Eight minutes after the luciferin injection, mice were anesthetized in a clear plastic chamber filled with a 2% isoflourane/air mixture. Isoflourane anesthesia was maintained using a nose cone delivery system during image acquisition. Two mice were imaged together using black plastic dividers to prevent the penetration of light photons from one mouse to another. A grey scale body image was first collected followed by the acquisition of the pseudocolor image showing the distribution of photon counts emerging from the luciferase vectors within the mouse. The photon flux is proportional to the number of luciferase expressing VM-M3 cells in the mouse. The grey scale and pseudocolor image are overlaid in each picture analyzed. An integration time of 1 min was used for bioluminescent image acquisition. Mice were imaged on both the dorsal side (back) and lateral left side. Signal intensity was quantified as the sum of all detected photon counts within a region of interest (ROI) covering the whole mouse body or specific regions using the LivingImage software. 112
127 Ex vivo bioluminescence imaging After sacrifice by CO 2, the liver, lung, brain, kidneys, and spleen were harvested from each mouse. The tissues were rinsed in PBS and then placed in a 50mL conical with 10mL of D-Luciferin (300 µg/ml) in dpbs for 10 minutes. Each tissue was then arranged on four petri dishes and imaged using the Xenogen IVIS system. An integration time of 1 min was used for bioluminescent image acquisition. Animal survival The health and behavior of the mice was assessed daily. Mice were humanely euthanized by CO 2 according to approved IACUC guidelines upon presentation of the defined criteria associated with tumor burden and disease progression. Such behaviors include abnormal feeding, diminished response to stimuli and failure to thrive. Primary tumor wet weight Primary tumors were harvested from each mouse after sacrifice by CO 2 and flashfrozen in liquid nitrogen. The wet weight of each tumor was then determined. Statistics Statistical analyses were performed on all data using IBM SPSS 21 Statistics Software. Two-tailed t-tests were performed and the significance values were determined where indicated. Survival was analyzed by Kaplan-Meier. 113
128 Results Variable tumor growth/ metastasis in the VM-M3 mouse model VM mice inoculated with the VM-M3 cell lines display variable rates of disease progression. When inoculated with 2 x 10 6 VM-M3 cells, some mice display high whole body bioluminescence during imaging time points throughout VM-M3 tumor progression, while others display low bioluminescence. In a representative image of this phenomenon, mouse 1 displayed similar bioluminescence as mouse 2 on days 9 and 18 post inoculation. However, on day 28, mouse 1 displayed a greater bioluminescence compared to mouse 2 (Figure 24A). Mouse 1 and 2 were both males of the same age. This suggests that the growth and invasion of the VM-M3 cells throughout the body of mouse 1 is much greater than that of mouse 2 at 29 days post inoculation. Although both mouse 1 and mouse 2 appear to have a similar rate of disease progression on days 9 and 18, the disease progression of mouse 1 accelerates much faster than mouse days post inoculation. The rate of disease progression in the VM-M3 metastatic cancer model can also be analyzed by survival. The survival of 11 female VM mice of similar age (5 months) inoculated with 2 x 10 6 VM-M3 cells is depicted in Figure 24 B and C. The mean survival was 35 ± 6 days (Figure 24B,C). The high standard deviation indicates that the survival rates have a wide spread. In fact, the range of the survival data was 22 days. These data suggest that the rate of disease progression in VM-M3 metastatic model, when assessed by survival, is variable among a cohort of animals of a similar age and sex. In light of these data, it was hypothesized that a cohort of sex and age matched VM-M3 mice could be divided into two individual groups (screened) based upon a 114
129 slow and fast progression of disease. Once divided, the groups may be analyzed at the conclusion of the study for metastatic progression and primary tumor weight in order to assess if such a screen is predictive of similar metastatic spread and/or tumor size within the slow progression or fast progression groups. D-Luciferin dose for bioluminescence imaging Before bioluminescence studies are performed, the dose of luciferin used must be considered in terms of finding a dose that saturates most luciferase vectors and can be tolerated during repeated bioluminescence imaging. Most companies that produced d- luciferin recommend a dose of 150 mg/kg in mice (Perkin Elmer, Caliper, Promega, Gold Biotechnology). However, as seen in Figure 27, a higher 300 mg/kg dose of luciferin results in an overall higher photon flux compared to 150 and 50 mg/kg. Therefore, in the particular mouse model tested by Xenogen, 150 mg/kg is not a saturating dose of luciferin. However, the high cost of d-luciferin must also be taken into account when determining luciferin dose. Therefore, even though 150 or 50 mg/kg may not saturate all luciferase vectors, these doses are chosen in the interest of cost. Comparisons of control and experimental groups within a study are based upon administration of the same dose of luciferin to each mouse. Furthermore, the transfection of tumor cells with a luciferase vector allows for the monitoring of tumor growth over time through repeated bioluminescence imaging of tumor-bearing mice. Therefore, the tolerance of luciferin is also an important consideration when determining the best luciferin dose. Dosages of 300mg/kg and up to 750mg/kg have been shown to be well tolerated in mice (61). Such high dosages were 115
130 necessary when studying tumors implanted in the brain due to the tissue light absorbance from hemoglobin and melanin as well as the reduction in diffusion of luciferin through the blood brain barrier (61). In this study, a comparison of the 50mg/kg luciferin dose, previously used in VM- M3 studies, and the standard 150mg/kg luciferin dose was performed. However, prior to bioluminescence imaging of mice at these luciferin doses, the kinetics of each dose in the tumor bearing VM-M3 model was determined since a new anesthesia method was performed in the study. Luciferin kinetic curve Previously, in vivo bioluminescence imaging of the VM-M3 mice was performed using avertin as the anesthetic. Avertin was administered at the same time as d-luciferin. However, since avertin anesthesia is unable to be controlled when the mice are in the Xenogen machine, a kinetic curve of d-luciferin in the VM-M3 model was not obtained. It is important to obtain a kinetic curve of d-luciferin in a specific mouse model because even though the biodistribution of luciferin is rapid, the kinetics of the luciferase reaction with luciferin are tissue dependent (62). Therefore, since the Xenogen system is equipped with nose cones for isoflourane administration during imaging, a kinetic curve of d- luciferin at both 50 and 150 mg/kg was obtained in the VM-M3 model using two mice for each dose. The kinetic curves of luciferin in the VM-M3 mice were generated 3 days post inoculation. It was found that a maximum photon flux was detected min after the i.p. administration of 150 mg/kg d-luciferin (Figure 25A). Furthermore, the photon flux min post d-lucirferin administration displayed a gradual increase (Figure 25B). The 116
131 photon flux min after luciferin injection was relatively constant (Figure 25C). Therefore, a bioluminescence imaging protocol was established in which all bioluminescence measurements were obtained min after luciferin injection. For all bioluminescence imaging using 150 mg/kg d-luciferin, the dorsal side was imaged 18:00 min post luciferin administration, the lateral left side imaged at 19:30, the ventral side imaged at 21:00, and the lateral right side imaged at 22:30 min. A 1.5-min delay between image acquisitions was established in order to allow time to change position and grey scale image the mouse. For the 50 mg/kg dose of luciferin, the maximal photon flux occurred around 10 min and rapidly decreased thereafter (data not shown). Therefore, for all bioluminescence imaging using a 50 mg/kg dose of d-luciferin, the dorsal side was imaged 9:00 min post luciferin administration, the lateral left side imaged at 10:30, the ventral side imaged at 12:00, and the lateral right side imaged at 13:30 min. The time of the maximal photon flux detected in the VM-M3 mouse model following i.p. injection of both 50 and 150 mg/kg d-luciferin is similar to that detected by the Xenogen Corporation in the mouse model utilized for kinetic analysis of luciferin at different concentrations (63). VM-M3 Screen: bioluminescence 5 and 8 days Post inoculation After determining the kinetics of luciferin in the VM-M3 model, the screen was initiated. 26 VM mice were inoculated with 2 x 10 6 cells subcutaneously in the left flank. The whole body bioluminescence of 16 mice was obtained using the recommended 150 mg/kg luciferin dose on days 5 and 8 post inoculation (Figure 26 and 27). The whole 117
132 body bioluminescence of 10 mice was obtained using the 50mg/kg dose on days 5 and 8 post inoculation (Figure 26 and 27). Overall, the mice imaged using 150mg/kg luciferin displayed a higher photon flux than mice injected with 50mg/kg luciferin (Figure 26 and 27). Therefore, the higher 150mg/kg dose of luciferin saturates more luciferase vectors and gives a more sensitive quantification of VM-M3 cells in the VM mouse. A comparison of the day 5 and day 8 data also displays variation in the growth and/or invasion of VM-M3 cells. For example, mouse 2.4 on day 5 displayed moderate whole body bioluminescence in comparison to the other mice imaged using the 150mg/kg luciferin dose (Figure 26). However, on day 8, mouse 2.4 had the highest whole body bioluminescence of all mice imaged using the 150 mg/kg luciferin dose (Figure 27). Overall, mouse 2.4 showed a large increase in whole body bioluminescence between days 5 and 8 post inoculation. Mouse 3.4 on day 5 displayed the second highest whole body bioluminescence of all mice imaged using the 150 mg/kg luciferin dose (Figure 26). And, on day 8, this mouse displayed the sixth highest whole body bioluminescence of all mice imaged using the 150 mg/kg luciferin dose (Figure 27). Overall, mouse 3.4 showed a small increase in bioluminescence between days 5 and 8 post inoculation. Therefore, the large increase in bioluminescence of mouse 2.4 suggested that VM-M3 cells injected into this particular mouse showed accelerated growth and/or invasion compared to mouse 3.4. VM-M3 screen: bioluminescence 13 days post inoculation The bioluminescence of all 26 VM mice bearing VM-M3 tumors was obtained using 150mg/kg luciferin 13 days post inoculation (Figure 28A). The mice were divided into low whole body bioluminescence and high whole body bioluminescence groups 118
133 (Figure 28B). The high whole body bioluminescence group had an average bioluminescence of 143 x 10 6 photons/ second, while the low whole body bioluminescence group had an average bioluminescence of 73 x 10 6 photons/ second (Figure 28B). Nine mice were chosen to continue in the screen study with three mice in the low and six mice in the high whole body bioluminescence groups (Figure 29A). It was determined that the mice were screened according to primary tumor size. A comparison between primary tumor bioluminescence and metastasis bioluminescence revealed that the majority of whole body bioluminescence was being generated by the primary tumor (Figure 30A). The primary tumors of each mouse in the screen were defined using the LivingImage software ROI tools (Figure 34). Metastasis bioluminescence was defined as the primary tumor bioluminesce subtracted from the whole body bioluminescence (Figure 34). End of study: primary tumor wet weight Mice were sacrificed by CO 2 29 days after inoculation. The primary tumor wet weight was obtained. The average primary tumor wet weight, although lower in the low whole body bioluminescence group, was not significantly different from the high whole body bioluminescence group (Figure 30A and B). The high whole body bioluminescence group had large variation as shown by the high standard deviation of the data (Figure 31B). However, the high whole body bioluminescence group did have a higher percentage (66.6%) of tumor wet weights over 0.3 grams (Figure 30C). Therefore, even though the primary tumor wet weights were not significantly different between groups, a 119
134 higher proportion of tumors were larger in the high whole body bioluminescence group compared to the low whole body bioluminescence group. End of study: metastasis The ex vivo bioluminescence of the kidney, lung, liver, spleen, and brain were also obtained (Figure 31). The bioluminescence of both sides of each organ was summed to determine the metastatic load of each mouse at the conclusion of the study (Figure 31B). The ex vivo metastasis bioluminescence, although lower in the low whole body bioluminescence group, was not statistically different from the high whole body bioluminescence group (Figure 31C). The high whole body bioluminescence group had a large standard deviation showing a large variation in metastasis within this group (Figure 31C). However, the high whole body bioluminescence group did have a higher percentage (80%) of metastasis bioluminescence above 2 x 10 7 photons/second (Figure 31D). Therefore, even though the metastasis bioluminescence was not significantly different between groups, a larger number of mice in the high whole body bioluminescence group had greater metastasis compared to the low whole body bioluminescence group. Correlation between day 13 primary tumor bioluminescence and primary tumor wet weight There was a strong positive linear correlation between the day 13 primary tumor bioluminescence and the day 29 primary tumor wet weight in the low whole body 120
135 bioluminescence group (r 2 = ) (Figure 32). No correlation was shown in the high whole body bioluminescence group (Figure 32). Correlation between day 13 whole body bioluminescence and day 29 metastasis There was a strong correlation between the whole body bioluminescence on day 13 and the end of study (day 29) metastasis bioluminescence in the low whole body luminescence group (r 2 = ) (Figure 33). However, this was a negative correlation, indicating that a lower whole body bioluminescence on day 13 was correlated with a high metastasis bioluminescence on day 29. No correlation between day 13 whole body bioluminescence and end of study (day 29) metastasis bioluminescence was shown in the high whole body bioluminescence group (Figure 33). 121
136 Discussion The goal of this study was to determine if a cohort of age and sex matched VM mice inoculated with VM-M3 cells could be divided into high whole body bioluminescence or fast progression and low whole body bioluminescence or slow progression groups using whole body bioluminescence analysis. The whole body bioluminescence of each mouse was analyzed 3, 5, and 13 days post inoculation. On days 3 and 5, whole body bioluminescence showed that a 150mg/kg luciferin dose, overall, saturated more luciferase vectors than the 50mg/kg dose. The 150mg/kg dose provided a more accurate overview of VM-M3 tumor growth and/or invasion/metastasis within the VM mouse. The organization of mice into high whole body bioluminescence and low whole body bioluminescence groups was performed following analysis of day 13 post inoculation whole body bioluminescence data. Nine mice were selected to continue in the screen study with 3 mice in the low whole body bioluminescence group and 6 mice in the high whole body bioluminescence group. At the conclusion of the study, it was found that there was not a statistically significant difference in both metastasis luminescence and primary tumor wet weight between the high and low bioluminescence groups. The high primary tumor bioluminescence group had highly variable tumor wet weights and metastasis luminescence. Therefore, screening mice into low and high bioluminescence on day 13 post inoculation was not predictive of low and high metastasis bioluminescence or low and high primary tumor wet weight at the end of the study. Since it was determined that the majority of bioluminescent signal was emerging from the primary tumor at day 13, a comparison between the day 13 primary tumor bioluminescence and day 29 (end of 122
137 study) tumor wet weight was performed using a linear regression model. It was found that a positive linear correlation between day 13 primary tumor bioluminescence and day 29 primary tumor wet weight existed only in the low whole body bioluminescence group. Therefore, if studying primary tumor growth, including only animals with low bioluminescence may reduce variation. However, the focus of the VM-M3 preclinical mouse model is metastasis, since metastasis is the primary cause of death in cancer patients. A linear correlation did not exist between day 13 whole body bioluminescence and metastasis bioluminescence in the high whole body luminescence group. While, interestingly, a negative linear correlation was demonstrated by the low whole body luminescence group, showing that the higher the whole body bioluminescence was 13 days post inoculation, the lower the final ex vivo metastasis bioluminescence. However, since the majority of the bioluminescence signal emerges from the primary tumor 13 days post inoculation, whole body bioluminescence on day 13 is seemingly not predictive of metastatic progression in the VM-M3 model. Since the proposed screen was not predictive of both ex vivo metastasis and primary tumor wet weight at the termination of the study, a new method of understanding the variation in VM-M3 tumor progression, invasion, and metastasis must be established. Understanding such variation in VM-M3 tumor progression is essential for determining if a particular treatment shows efficacy in the VM-M3 model or if some of the treated mice inherently have slower growing primary tumors and/or a slower metastatic progression. Other cancer models that have variable tumor growth attempt to classify treatment efficacy or slow tumor progression using mathematical modeling (64). However, such models have limitations. 123
138 As a means of understanding both primary tumor growth and metastatic progression in each mouse in a study, each mouse may be used as their own control. Whole body bioluminescence can be compared before treatment and after treatment in each mouse individually. However, it may still be difficult to determine if the slow disease progression of a treated mouse is due to the treatment or due an inherent tendency of the mouse to progress more slowly in tumor growth and/or metastasis. Perhaps such an inherently slow progression needs to be analyzed on the molecular level. 124
139 Figure 24. Growth and metastasis of the VM-M3/Fluc tumor with bioluminescence imaging (A) and VM-M3 metastatic cancer model survival (B and C). A. 2 x 10 6 VM-M3 cells were injected subcutaneously into the flank of the VM mouse. Dorsal images were taken on day 9, 18, and 29 post inoculation as described in Materials and Methods. The dorsal bioluminescence images of two representative mice ( Mouse 1 and Mouse 2 ) are pictured. B and C. 11 VM mice were inoculated subcutaneously into the flank with 2 x 10 6 VM-M3 cells. The survival of the 11 mice is displayed as a Kaplan- Meir plot (B) and timeline (C). 125


140 A B C 126
141 Figure 25. Luciferin kinetic curves. A. Two mice were administered 150mg/kg d- luciferin in dpbs. The mice were anesthetized by isoflourane and imaged at the indicated times following luciferin administration. The photon flux from the whole body of the VM mouse was quantified using LivingImage software. The gold star indicates the time point at which a maximal photon flux was detected. The same two mice are pictured in A, B and C (labeled Mouse 1 and Mouse 2 ). A. Time period when a maximal photon flux was detected. B. Time period before the maximal photon flux. C. Time period after the maximal photon flux. 127


142 A B 128

143 C 129
144 Figure 26. Whole body bioluminescence day 5 post inoculation. 26 VM mice were inoculated with 2 x 10 6 VM-M3 cells and their whole body bioluminescence was analyzed 5, 8, and 13 days after inoculation. 16 mice were imaged using 150 mg/kg luciferin and 10 mice were imaged using 50 mg/kg luciferin. Each number represents a single mouse (e.g. 5.1). The photon flux for each mouse is presented as the summation of the total flux (photons/second) of the dorsal and lateral left side whole body images. Each tumor was implanted subcutaneously on the left flank of the mouse. 130


145
146 Figure 27. Whole body bioluminescence day 8 post inoculation. 26 VM mice were inoculated with 2 x 10 6 VM-M3 cells and their whole body bioluminescence was analyzed 5, 8, and 13 days after inoculation. 16 mice were imaged using 150 mg/kg luciferin and 10 mice were imaged using 50 mg/kg d-luciferin. Each number represents a single mouse (e.g. 5.1). The photon flux for each mouse is presented as the summation of the total flux (photons/second) of the dorsal and lateral left side whole body images. Each tumor was implanted subcutaneously on the left flank of the mouse. 132


147
148 Figure 28. Whole body bioluminescence day 13 post inoculation. 26 VM mice were inoculated with 2 x 10 6 VM-M3 cells and their whole body bioluminescence was analyzed 5,8, and 13 days after inoculation. This figure displays the bioluminescence of all mice on day 13 post inoculation. The whole body bioluminescence of all 26 mice was analyzed using 150 mg/kg d-luciferin. Each number represents a single mouse (e.g. 5.1). The photon flux for each mouse is presented as the summation of the total flux (photons/second) of the dorsal (back) and lateral left side whole body images. Each tumor was implanted subcutaneously on the left flank of the mouse. A. The bioluminescence of each mouse is organized by mouse number. B. The bioluminescence of each mouse in A is organized from low to high photon flux. The cutoff for screening mice into a low whole body luminescence group and a high whole body luminescence group is indicated by a solid vertical line. 134


149 A B 135
150 Figure 29. Screen whole body bioluminescence day 13 post inoculation. 3 VM-M3 mice from the low whole body bioluminescence group and 6 VM-M3 mice from the high whole body luminescence group (Figure 29) were selected to continue in the screen. A. Day 13 whole body bioluminescence of the 9 mice chosen for the screen study from Figure 29. B. Lateral left whole body bioluminescence of the same 9 mice as A divided into Primary Tumor Bioluminescence (grey) and Metastasis Bioluminescence (red). 136


151 A B 137
152 Figure 30. Screen primary tumor wet weight day 29 post inoculation. A. Primary tumor wet weight of each mouse in the screen study. B. Average primary tumor wet weight of 6 mice in the high whole body bioluminescence group and 3 mice in the low whole body bioluminescence. Data are represented as the mean primary tumor wet weight ± S.D. C. Percent of primary tumors above 0.3g. The red dashed line in A. indicates the 0.3g primary tumor wet weight cutoff. 138


153 A B C 139
154 Figure 31. Metastatic spread to the lung, liver, kidney, brain, and spleen. A. The bioluminescence of both sides of the lung, liver, kidney, brain, and spleen was added and presented as a single measure of metastasis for each mouse. B. Example of ex vivo metastasis bioluminescence. C. Average ex vivo metastasis bioluminescence for the 3 mice in the low whole body bioluminescence and 6 mice in the high whole body bioluminescence. Data are presented as the mean photon flux ± S.D. D. Percent of ex vivo bioluminescence above 2 x 10 7 photons/ second. The red dashed line in A indicates the 2 x 10 7 photons/ second cutoff. 140


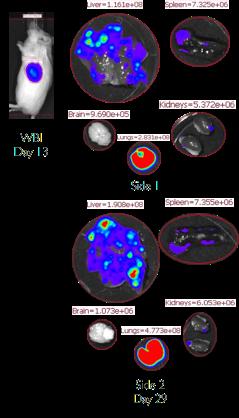

155 A Mouse 5.4 Ex-vivo Imaging B C 141


156 D 142
157 Figure 32. Correlation between primary tumor bioluminescence on day 13 and primary tumor wet weight at the termination (day 29) of the study. A linear correlation between day 13 primary tumor bioluminescence and day 29 primary tumor wet weight was determined for both the A. High whole body bioluminescence group and the B. Low whole body bioluminescence group. R 2 values are shown. High whole body bioluminescence n = 6, low whole body bioluminescence n =


158 A B 144
159 Figure 33. Correlation between whole body bioluminescence on day 13 and metastasis at the termination (day 29) of the study. A linear correlation between the day 13 whole body bioluminescence and day 29 metastasis bioluminescence was determined for the A. High whole body bioluminescence group and B. Low whole body bioluminescence group. R 2 values are shown. High whole body bioluminescence n = 5, low whole body bioluminescence n =


160 A B 146
161 Figure 34. Differentiating primary tumor bioluminescence from metastasis bioluminescence. Primary tumor bioluminescence was determined by defining a region of interest (ROI) surrounding the primary tumor bioluminescence. Metastasis bioluminescence was determined by defining a region of interest (ROI) surrounding the whole mouse body and subtracting the primary tumor bioluminescence from the whole body bioluminescence. 147

162 148

, the citric acid cycle, the electron transport chain (ETC), fatty acid synthesis (FAS), and fatty acid oxidation (FAO).")

163 Appendix I Glucose% Extracellular%% Cytoplasm%% Glucose767P% Pentose%% Phosphate%% Pathway% Malonyl%CoA% Acetyl7CoA% ATP% Glycolysis% FASN% Citrate% Oxaloacetate% Malate% Pyruvate% Lactate% Lactate% Fa#y%Acids%% Fa#y%Acids%% Pyruvate% Acetyl7CoA% Mitochondria%% CPT71% Fa#y%Acids%% TCA% Glutamine% FADH 2 % +% NADH% Outer%Mitochondrial% Membrane%% Inner%Mitochondrial% Membrane%% FAO% Acetyl7CoA% ETC% O 2 %!%2H 2 O % H +% +%ATP%%% FADH 2 % +% NADH% H + % H + % H + % A schematic representation of the major metabolic pathways in a representative eukaryotic cell. The metabolic pathways include glycolysis, the pentose phosphate pathway (PPP), the citric acid cycle, the electron transport chain (ETC), fatty acid synthesis (FAS), and fatty acid oxidation (FAO). The main energy substrates include fatty acids, glucose, and glutamine. Fatty acids from the cytosol are transported into the mitochondria through the activity of CPT-1. The fatty acids for fatty acid ß-oxidation can be derived either exogenously from the extracellular environment or endogenously through the metabolism of triglycerides stored in lipid droplets or through fatty acid synthesis catalyzed by the fatty acid synthase (FASN) enzyme. Glucose is imported from the extracellular space by the glucose transporters (GLUTs) and is then metabolized through glycolysis to produce pyruvate. Under aerobic conditions in normal cells, pyruvate is oxidized to acetyl-coa and enters the TCA cycle in order to produce the reducing equivalents necessary for oxidative phosphorylation. When oxygen is low in normal cells, pyruvate is reduced to lactate and the oxidizing agent NAD +. The Pentose Phosphate Pathway (PPP) contributes to cell growth and proliferation through the generation of pentose sugars, for nucleic acid synthesis, and NADPH. The neutral amino acid glutamine is imported into the cell through uniport mechanisms. Glutamine provides ATP through substrate level phosphorylation in the TCA cycle when oxidative phosphorylation is deficient. 149
Application Note. Introduction
 Simultaneously Measuring Oxidation of Exogenous and Endogenous Fatty Acids Using the XF Palmitate-BSA FAO Substrate with the Agilent Seahorse XF Cell Mito Stress Test Application Note Introduction The
Agilent Technologies: Seahorse XF Introduction
 Agilent Technologies: Seahorse XF Introduction Tools for investigating cell metabolism diagnostic procedures. 1 The Engines Cells Generate Energy via Two Metabolic Pathways Glycolysis [ H + ] Respiration
Identifying Metabolic Phenotype Switches in Cancer Cells Using the Agilent Seahorse XF Analyzer in an Hypoxic Environment
 Identifying Metabolic Phenotype Switches in Cancer Cells Using the Agilent Seahorse XF Analyzer in an Hypoxic Environment Application Note Introduction Decreased oxygen levels, or hypoxia, and hypoxic-mediated
In glycolysis, glucose is converted to pyruvate. If the pyruvate is reduced to lactate, the pathway does not require O 2 and is called anaerobic
 Glycolysis 1 In glycolysis, glucose is converted to pyruvate. If the pyruvate is reduced to lactate, the pathway does not require O 2 and is called anaerobic glycolysis. If this pyruvate is converted instead
Metabolism Energy Pathways Biosynthesis. Catabolism Anabolism Enzymes
 Topics Microbial Metabolism Metabolism Energy Pathways Biosynthesis 2 Metabolism Catabolism Catabolism Anabolism Enzymes Breakdown of complex organic molecules in order to extract energy and dform simpler
Respiration. Respiration. How Cells Harvest Energy. Chapter 7
 How Cells Harvest Energy Chapter 7 Respiration Organisms can be classified based on how they obtain energy: autotrophs: are able to produce their own organic molecules through photosynthesis heterotrophs:
Metabolism. Chapter 8 Microbial Metabolism. Metabolic balancing act. Catabolism Anabolism Enzymes. Topics. Metabolism Energy Pathways Biosynthesis
 Chapter 8 Microbial Metabolism Topics Metabolism Energy Pathways Biosynthesis Catabolism Anabolism Enzymes Metabolism 1 2 Metabolic balancing act Catabolism and anabolism simple model Catabolism Enzymes
Unit 2: Metabolic Processes
 How is energy obtained biologically? Recall: Red Ox Reactions Unit 2: Metabolic Processes Oxidation Is the chief mechanism by which chemical potential energy is released This energy comes from reduced
How Cells Release Chemical Energy. Chapter 7
 How Cells Release Chemical Energy Chapter 7 7.1 Overview of Carbohydrate Breakdown Pathways All organisms (including photoautotrophs) convert chemical energy of organic compounds to chemical energy of
3.7.1 Define cell respiration [Cell respiration is the controlled release of energy from organic compounds in cells to form ATP]
![3.7.1 Define cell respiration [Cell respiration is the controlled release of energy from organic compounds in cells to form ATP]](/thumbs/72/66350985.jpg "3.7.1 Define cell respiration [Cell respiration is the controlled release of energy from organic compounds in cells to form ATP]") 3.7 Cell respiration ( Chapter 9 in Campbell's book) 3.7.1 Define cell respiration [Cell respiration is the controlled release of energy from organic compounds in cells to form ATP] Organic compounds store
3.7 Cell respiration ( Chapter 9 in Campbell's book) 3.7.1 Define cell respiration [Cell respiration is the controlled release of energy from organic compounds in cells to form ATP] Organic compounds store
ANSC/NUTR 618 Lipids & Lipid Metabolism
 I. Overall concepts A. Definitions ANC/NUTR 618 Lipids & Lipid Metabolism 1. De novo synthesis = synthesis from non-fatty acid precursors a. Carbohydrate precursors (glucose, lactate, and pyruvate) b.
Class XI Chapter 14 Respiration in Plants Biology. 1. It is a biochemical process. 1. It is a physiochemical process.
 Question 1: Differentiate between (a) Respiration and Combustion (b) Glycolysis and Krebs cycle (c) Aerobic respiration and Fermentation (a) Respiration and combustion Respiration Combustion 1. It is a
2. What are the products of cellular respiration? Include all forms of energy that are products.
 Name Per Cellular Respiration An Overview Why Respire Anyhoo? Because bucko all cells need usable chemical energy to do work. The methods cells use to convert glucose into ATP vary depending on the availability
Enzymes what are they?
 Topic 11 (ch8) Microbial Metabolism Topics Metabolism Energy Pathways Biosynthesis 1 Catabolism Anabolism Enzymes Metabolism 2 Metabolic balancing act Catabolism Enzymes involved in breakdown of complex
How Cells Harvest Energy. Chapter 7. Respiration
 How Cells Harvest Energy Chapter 7 Respiration Organisms classified on how they obtain energy: autotrophs: produce their own organic molecules through photosynthesis heterotrophs: live on organic compounds
 Question 1: Differentiate between (a) Respiration and Combustion (b) Glycolysis and Krebs cycle (c) Aerobic respiration and Fermentation (a) Respiration and combustion Respiration Combustion 1. It is a
Rapid Analysis of Glycolytic and Oxidative Substrate Flux of Cancer Cells in a Microplate
 Rapid Analysis of Glycolytic and Oxidative Substrate Flux of Cancer Cells in a Microplate Lisa S. Pike Winer, Min Wu* Seahorse Bioscience Inc., North Billerica, Massachusetts, United States of America
Name Class Date. 1. Cellular respiration is the process by which the of "food"
 Name Class Date Cell Respiration Introduction Cellular respiration is the process by which the chemical energy of "food" molecules is released and partially captured in the form of ATP. Carbohydrates,
Biology Chapter-7 Cellular Respiration
 Biology-1406 Chapter-7 Cellular Respiration Energy is stored in Chemicals Catabolism- the breaking down of complex molecules, such as glucose, to release their stored energy. Catabolism may or may not
Mitochondria and ATP Synthesis
 Mitochondria and ATP Synthesis Mitochondria and ATP Synthesis 1. Mitochondria are sites of ATP synthesis in cells. 2. ATP is used to do work; i.e. ATP is an energy source. 3. ATP hydrolysis releases energy
Cell Metabolism Assays. for. Immunology. Research
 the immunity-metabolism link Cell Metabolism Assays for Immunology Research GOLD STANDARD ASSAYS FOR MEASURING METABOLIC RePROGRAMMING Metabolic Signatures Cell activation, amplification, and effector
Glycolysis. Cellular Respiration
 Glucose is the preferred carbohydrate of cells. In solution, it can change from a linear chain to a ring. Energy is stored in the bonds of the carbohydrates. Breaking these bonds releases that energy.
Roles of Lipids. principal form of stored energy major constituents of cell membranes vitamins messengers intra and extracellular
 Roles of Lipids principal form of stored energy major constituents of cell membranes vitamins messengers intra and extracellular = Oxidation of fatty acids Central energy-yielding pathway in animals. O
New tools bring greater understanding to cellular metabolism research
 New tools bring greater understanding to cellular metabolism research Mourad Ferhat, Ph.D, 7 Juin 2017 FDSS Users Meeting, Hamamatsu mourad.ferhat@promega.com Today s talk : focus on new cell-based assays
Chemical Energy. Valencia College
 9 Pathways that Harvest Chemical Energy Valencia College 9 Pathways that Harvest Chemical Energy Chapter objectives: How Does Glucose Oxidation Release Chemical Energy? What Are the Aerobic Pathways of
Ch 9: Cellular Respiration
 Ch 9: Cellular Respiration Cellular Respiration An overview Exergonic reactions and catabolic pathway Energy stored in bonds of food molecules is transferred to ATP Cellular respiration provides the energy
Cellular Respiration. Cellular Respiration. C 6 H 12 O 6 + 6O > 6CO 2 + 6H energy. Heat + ATP. You need to know this!
 Cellular Respiration LISA Biology Cellular Respiration C 6 H 12 O 6 + 6O 2 - - - - - > 6CO 2 + 6H 2 0 + energy You need to know this! Heat + ATP 1 Did that equation look familiar? * The equation for cellular
Energy Transformation: Cellular Respiration Outline 1. Sources of cellular ATP 2. Turning chemical energy of covalent bonds between C-C into energy
 Energy Transformation: Cellular Respiration Outline 1. Sources of cellular ATP 2. Turning chemical energy of covalent bonds between C-C into energy for cellular work (ATP) 3. Importance of electrons and
Lecture Sixteen: METABOLIC ENERGY: [Based on GENERATION Chapter 15
 Lecture Sixteen: METABOLIC ENERGY: [Based on GENERATION Chapter 15 AND STORAGE Berg, (Figures in red are for the 7th Edition) Tymoczko (Figures in Blue are for the 8th Edition) & Stryer] Two major questions
Energy Production In A Cell (Chapter 25 Metabolism)
") Energy Production In A Cell (Chapter 25 Metabolism) Large food molecules contain a lot of potential energy in the form of chemical bonds but it requires a lot of work to liberate the energy. Cells need
Energy Production In A Cell (Chapter 25 Metabolism) Large food molecules contain a lot of potential energy in the form of chemical bonds but it requires a lot of work to liberate the energy. Cells need
A cell has enough ATP to last for about three seconds.
 Energy Transformation: Cellular Respiration Outline 1. Energy and carbon sources in living cells 2. Sources of cellular ATP 3. Turning chemical energy of covalent bonds between C-C into energy for cellular
2/4/17. Cellular Metabolism. Metabolism. Cellular Metabolism. Consists of all of the chemical reactions that take place in a cell.
 Metabolism Cellular Metabolism Consists of all of the chemical reactions that take place in a cell. Can be reactions that break things down. (Catabolism) Or reactions that build things up. (Anabolism)
Chapter 8. Metabolism. Topics in lectures 15 and 16. Chemical foundations Catabolism Biosynthesis
 Chapter 8 Topics in lectures 15 and 16 Metabolism Chemical foundations Catabolism Biosynthesis 1 Metabolism Chemical Foundations Enzymes REDOX Catabolism Pathways Anabolism Principles and pathways 2 Enzymes
Chapter 7 Cellular Respiration and Fermentation*
 Chapter 7 Cellular Respiration and Fermentation* *Lecture notes are to be used as a study guide only and do not represent the comprehensive information you will need to know for the exams. Life Is Work
BIO16 Mapua Institute of Technology
 BIO16 Mapua Institute of Technology The Marathon If somebody challenged you to a run a race, how should you prepare to win? 1. Practice 2. Eat the right foods 3. Drink the right liquids Energy All living
Metabolism. Chapter 5. Catabolism Drives Anabolism 8/29/11. Complete Catabolism of Glucose
 8/29/11 Metabolism Chapter 5 All of the reactions in the body that require energy transfer. Can be divided into: Cell Respiration and Metabolism Anabolism: requires the input of energy to synthesize large
MIDDLETOWN HIGH SCHOOL SOUTH BIOLOGY
 MIDDLETOWN HIGH SCHOOL SOUTH BIOLOGY BOOKLET 10 NAME: CLASS: 1 S.Tagore Middletown South High School March 2013 LEARNING OUTCOMES The role and production of ATP (a) Importance, role and structure of ATP
MitoXpress FAO Assay. For the measurement of Fatty Acid Oxidation
 MitoXpress FAO Assay For the measurement of Fatty Acid Oxidation Companion Kit to be used in combination with Luxcel s MitoXpress Xtra - Oxygen Consumption Assay ILLUMINATING DISCOVERY TABLE OF CONTENTS
Oxidation of Long Chain Fatty Acids
 Oxidation of Long Chain Fatty Acids Dr NC Bird Oxidation of long chain fatty acids is the primary source of energy supply in man and animals. Hibernating animals utilise fat stores to maintain body heat,
Respiration. Respiration. Respiration. How Cells Harvest Energy. Chapter 7
 How Cells Harvest Energy Chapter 7 Organisms can be classified based on how they obtain energy: autotrophs: are able to produce their own organic molecules through photosynthesis heterotrophs: live on
Fatty Acid and Triacylglycerol Metabolism 1
 Fatty Acid and Triacylglycerol Metabolism 1 Mobilization of stored fats and oxidation of fatty acids Lippincott s Chapter 16 What is the first lecture about What is triacylglycerol Fatty acids structure
Chapter 5. Microbial Metabolism
 Chapter 5 Microbial Metabolism Metabolism Collection of controlled biochemical reactions that take place within a microbe Ultimate function of metabolism is to reproduce the organism Metabolic Processes
Phospholipids Metabolism
 Chapter VI: Phospholipids Metabolism Dr. Sameh Sarray Hlaoui Phospholipids Features: Amphipatic: - Hydrophobic head: fatty acids - Hydropholic head: P group+ alcohol Composed of alcohol attached by a phosphodiester
Chapter 9: Cellular Respiration: Harvesting Chemical Energy
 AP Biology Reading Guide Name: Date: Period Chapter 9: Cellular Respiration: Harvesting Chemical Energy Overview: Before getting involved with the details of cellular respiration and photosynthesis, take
Metabolism. Topic 11&12 (ch8) Microbial Metabolism. Metabolic Balancing Act. Topics. Catabolism Anabolism Enzymes
 Microbial Metabolism. Metabolic Balancing Act. Topics. Catabolism Anabolism Enzymes") Topic 11&12 (ch8) Microbial Metabolism Topics Metabolism Energy Pathways Biosynthesis 1 Catabolism Anabolism Enzymes Metabolism 2 Metabolic Balancing Act Catabolism Enzymes involved in breakdown of complex
Topic 11&12 (ch8) Microbial Metabolism Topics Metabolism Energy Pathways Biosynthesis 1 Catabolism Anabolism Enzymes Metabolism 2 Metabolic Balancing Act Catabolism Enzymes involved in breakdown of complex
Plant Respiration. Exchange of Gases in Plants:
 Plant Respiration Exchange of Gases in Plants: Plants do not have great demands for gaseous exchange. The rate of respiration in plants is much lower than in animals. Large amounts of gases are exchanged
3.2 Aerobic Respiration
 3.2 Aerobic Respiration Aerobic Cellular Respiration Catabolic pathways Breaks down energy-rich compounds to make ATP Requires oxygen Occurs in different parts of the cell C 6 H 12 O 6 (s) + 6O 2 (g) 6CO
Fatty Acid Oxidation Assay on the XF24 Analyzer
 Fatty Acid Oxidation Assay on the XF24 Analyzer Mitochondria oxidize a variety of fuels to generate ATP through oxidative phosphorylation. Cells can utilize fatty acid, glucose and amino acids as their
MULTIPLE CHOICE. Choose the one alternative that best completes the statement or answers the question.
 Respiration Practice Name MULTIPLE CHOICE. Choose the one alternative that best completes the statement or answers the question. 1) Which of the following statements describes NAD+? A) NAD+ can donate
ADP, ATP and Cellular Respiration
 ADP, ATP and Cellular Respiration What Is ATP? Energy used by all Cells Adenosine Triphosphate Organic molecule containing highenergy Phosphate bonds Chemical Structure of ATP Adenine Base 3 Phosphates
Review. Respiration. Glycolysis. Glycolysis is the decomposition (lysis) of glucose (glyco) to pyruvate (or pyruvic acid).
 of glucose (glyco) to pyruvate (or pyruvic acid).") Review Photosynthesis is the process of incorporating energy from light into energy-rich molecules like glucose. Respiration is the opposite process extracting that stored energy from glucose to form ATP
Review Photosynthesis is the process of incorporating energy from light into energy-rich molecules like glucose. Respiration is the opposite process extracting that stored energy from glucose to form ATP
MULTIPLE CHOICE QUESTIONS
 MULTIPLE CHOICE QUESTIONS 1. Which of the following statements concerning anabolic reactions is FALSE? A. They are generally endergonic. B. They usually require ATP. C. They are part of metabolism. D.
Ch. 9 Cell Respiration. Title: Oct 15 3:24 PM (1 of 53)
") Ch. 9 Cell Respiration Title: Oct 15 3:24 PM (1 of 53) Essential question: How do cells use stored chemical energy in organic molecules and to generate ATP? Title: Oct 15 3:28 PM (2 of 53) Title: Oct 19
Ch. 9 Cell Respiration Title: Oct 15 3:24 PM (1 of 53) Essential question: How do cells use stored chemical energy in organic molecules and to generate ATP? Title: Oct 15 3:28 PM (2 of 53) Title: Oct 19
Quantifying Cellular ATP Production Rate Using Agilent Seahorse XF Technology
 White Paper Quantifying Cellular ATP Production Rate Using Agilent Seahorse XF Technology Authors Natalia Romero George Rogers Andy Neilson Brian P. Dranka Agilent Technologies, Inc., Lexington, MA, USA
Name: Date: Per: Enzymes Review & Using text to understand ATP & Cellular Respiration
 Name: Date: Per: Enzymes Review & Using text to understand ATP & Cellular Respiration Read this: Digestive enzymes are protein-based biological catalysts that play important roles in our lives. They help
Cellular Metabolism. Biology 105 Lecture 6 Chapter 3 (pages 56-61)
") Cellular Metabolism Biology 105 Lecture 6 Chapter 3 (pages 56-61) Metabolism Consists of all the chemical reactions that take place in a cell! Cellular Metabolism Aerobic cellular respiration requires
Cellular Metabolism Biology 105 Lecture 6 Chapter 3 (pages 56-61) Metabolism Consists of all the chemical reactions that take place in a cell! Cellular Metabolism Aerobic cellular respiration requires
Cellular Respiration Harvesting Chemical Energy ATP
 Cellular Respiration Harvesting Chemical Energy ATP 2009-2010 Ch.8.3 Section Objectives: Compare and contrast cellular respiration and fermentation. Explain how cells obtain energy from cellular respiration.
BCM 221 LECTURES OJEMEKELE O.
 BCM 221 LECTURES BY OJEMEKELE O. OUTLINE INTRODUCTION TO LIPID CHEMISTRY STORAGE OF ENERGY IN ADIPOCYTES MOBILIZATION OF ENERGY STORES IN ADIPOCYTES KETONE BODIES AND KETOSIS PYRUVATE DEHYDROGENASE COMPLEX
Cellular Pathways That Harvest Chemical Energy. Cellular Pathways That Harvest Chemical Energy. Cellular Pathways In General
 Cellular Pathways That Harvest Chemical Energy A. Obtaining Energy and Electrons from Glucose Lecture Series 12 Cellular Pathways That Harvest Chemical Energy B. An Overview: Releasing Energy from Glucose
10/31/2016 CHAPTER 9 RESPIRATION I. RESPIRATION II. ENERGY FOR LIFE A. DEFINITION-THE TOTAL CHEMICAL BREAK DOWN OF GLUCOSE WITH OXYGEN
 CHAPTER 9 RESPIRATION KENNEDY BIOL. 1AB I. RESPIRATION A. DEFINITION-THE TOTAL CHEMICAL BREAK DOWN OF GLUCOSE WITH OXYGEN II. ENERGY FOR LIFE ALL THE ENERGY FOR LIFE COMES FROM THE METABOLISM OF GLUCOSE
Harvesting energy: photosynthesis & cellular respiration
 Harvesting energy: photosynthesis & cellular respiration Learning Objectives Know the relationship between photosynthesis & cellular respiration Know the formulae of the chemical reactions for photosynthesis
Biological Science 101 General Biology
 Lecture Seven: Cellular Respiration Ch. 9, Pgs. 163-181 Figs. 9.2-9.20 Biological Science 101 General Biology Cellular Respiration: - A series of processes that is involved in converting food to energy
Biology 30 Structure & Function of Cells (Part 2) Bioenergetics: Energy: Potential energy: Examples: Kinetic energy. Examples:
 Bioenergetics: Energy: Potential energy: Examples: Kinetic energy. Examples:") Biology 30 Structure & Function of Cells (Part 2) Bioenergetics: Energy: Potential energy: Examples: Kinetic energy Examples: Energy can be transformed: Thermodynamics: First law of Thermodynamics: Second
Biology 30 Structure & Function of Cells (Part 2) Bioenergetics: Energy: Potential energy: Examples: Kinetic energy Examples: Energy can be transformed: Thermodynamics: First law of Thermodynamics: Second
Cellular Metabolism. Biol 105 Lecture 6 Read Chapter 3 (pages 63 69)
") Cellular Metabolism Biol 105 Lecture 6 Read Chapter 3 (pages 63 69) Metabolism Consists of all of the chemical reactions that take place in a cell Metabolism Animation Breaking Down Glucose For Energy
Cellular Metabolism Biol 105 Lecture 6 Read Chapter 3 (pages 63 69) Metabolism Consists of all of the chemical reactions that take place in a cell Metabolism Animation Breaking Down Glucose For Energy
How Cells Harvest Chemical Energy
 How Cells Harvest Chemical Energy Chapter 6 Introduction: How Is a Marathoner Different from a Sprinter? Individuals inherit various percentages of the two main types of muscle fibers, slow and fast The
Introduction to Metabolism Cell Structure and Function
 Introduction to Metabolism Cell Structure and Function Cells can be divided into two primary types prokaryotes - Almost all prokaryotes are bacteria eukaryotes - Eukaryotes include all cells of multicellular
Growth. Principles of Metabolism. Principles of Metabolism 1/18/2011. The role of ATP energy currency. Adenosine triphosphate
 Metabolism: Fueling Cell Growth Principles of Metabolism Cells (including your own) must: Synthesize new components (anabolism/biosynthesis) Harvest energy and convert it to a usable form (catabolism)
4. Which step shows a split of one molecule into two smaller molecules? a. 2. d. 5
 1. Which of the following statements about NAD + is false? a. NAD + is reduced to NADH during both glycolysis and the citric acid cycle. b. NAD + has more chemical energy than NADH. c. NAD + is reduced
XF Data Normalization by the Agilent Seahorse XF Imaging and Normalization System
 Application Note Normalization XF Data Normalization by the Agilent Seahorse XF Imaging and Normalization System Authors Yoonseok Kam Kellie Chadwick Ned Jastromb Brian P. Dranka Agilent Technologies,
Muscle Metabolism. Dr. Nabil Bashir
 Muscle Metabolism Dr. Nabil Bashir Learning objectives Understand how skeletal muscles derive energy at rest, moderate exercise, and strong exercise. Recognize the difference between aerobic and anaerobic
Cellular Respiration
 Cellular I can describe cellular respiration Cellular respiration is a series of metabolic pathways releasing energy from a foodstuff e.g. glucose. This yields energy in the form of ATP adenosine P i P
Cellular Respiration
 Cellular Respiration C 6 H 12 O 6 + 6O 2 -----> 6CO 2 + 6H 2 0 + energy (heat and ATP) 1. Energy Capacity to move or change matter Forms of energy are important to life include Chemical, radiant (heat
Cellular Metabolism 6/20/2015. Metabolism. Summary of Cellular Respiration. Consists of all the chemical reactions that take place in a cell!
 Cellular Metabolism Biology 105 Lecture 6 Chapter 3 (pages 56-61) Metabolism Consists of all the chemical reactions that take place in a cell! Cellular metabolism: Aerobic cellular respiration requires
Lesson Overview. Cellular Respiration: An Overview. 9.2 process of cell respiration
 9.2 process of cell respiration Glycolysis During glycolysis, glucose is broken down into 2 molecules of the 3-carbon molecule pyruvic acid. Pyruvic acid is a reactant in the Krebs cycle. ATP and NADH
Integration Of Metabolism
 Integration Of Metabolism Metabolism Consist of Highly Interconnected Pathways The basic strategy of catabolic metabolism is to form ATP, NADPH, and building blocks for biosyntheses. 1. ATP is the universal
III. 6. Test. Respiració cel lular
 III. 6. Test. Respiració cel lular Chapter Questions 1) What is the term for metabolic pathways that release stored energy by breaking down complex molecules? A) anabolic pathways B) catabolic pathways
 What is Respiration? The process of respiration is where organisms convert chemical energy into cellular energy, which is known as ATP. Adenine Ribose P P P Cellular Respiration high energy sugar low energy
E.coli Core Model: Metabolic Core
 1 E.coli Core Model: Metabolic Core 2 LEARNING OBJECTIVES Each student should be able to: Describe the glycolysis pathway in the core model. Describe the TCA cycle in the core model. Explain gluconeogenesis.
What s the point? The point is to make ATP! ATP
 2006-2007 What s the point? The point is to make ATP! ATP Glycolysis 2 ATP Kreb s cycle 2 ATP Life takes a lot of energy to run, need to extract more energy than 4 ATP! There s got to be a better way!
Fatty acid breakdown
 Fatty acids contain a long hydrocarbon chain and a terminal carboxylate group. Most contain between 14 and 24 carbon atoms. The chains may be saturated or contain double bonds. The complete oxidation of
Living organisms obtain energy by breaking down organic molecules during cellular respiration.
 Section 3: Living organisms obtain energy by breaking down organic molecules during cellular respiration. K What I Know W What I Want to Find Out L What I Learned Essential Questions What are the stages
Cellular Metabolism 9/24/2013. Metabolism. Cellular Metabolism. Consists of all the chemical reactions that take place in a cell!
 Cellular Metabolism Biology 105 Lecture 6 Chapter 3 (pages 56-61) Metabolism Consists of all the chemical reactions that take place in a cell! Cellular Metabolism Aerobic cellular respiration requires
Structure of the Mitochondrion. Cell Respiration. Cellular Respiration. Catabolic Pathways. Photosynthesis vs. Cell Respiration ATP 10/14/2014
 Structure of the Mitochondrion Cellular Respiration Chapter 9 Pgs. 163 183 Enclosed by a double membrane Outer membrane is smooth Inner, or cristae, membrane is folded - this divides the mitochondrion
Electron transport chain chapter 6 (page 73) BCH 340 lecture 6
 BCH 340 lecture 6") Electron transport chain chapter 6 (page 73) BCH 340 lecture 6 The Metabolic Pathway of Cellular Respiration All of the reactions involved in cellular respiration can be grouped into three main stages
Electron transport chain chapter 6 (page 73) BCH 340 lecture 6 The Metabolic Pathway of Cellular Respiration All of the reactions involved in cellular respiration can be grouped into three main stages
BIOLOGY - CLUTCH CH.9 - RESPIRATION.
 !! www.clutchprep.com CONCEPT: REDOX REACTIONS Redox reaction a chemical reaction that involves the transfer of electrons from one atom to another Oxidation loss of electrons Reduction gain of electrons
Independent Study Guide Metabolism I. Principles of metabolism (section 6.1) a. Cells must: (figure 6.1) i. Synthesize new components
 a. Cells must: (figure 6.1) i. Synthesize new components") Independent Study Guide Metabolism I. Principles of metabolism (section 6.1) a. Cells must: (figure 6.1) i. Synthesize new components (anabolism/biosynthesis) ii. Harvest energy and convert it to a usable
Independent Study Guide Metabolism I. Principles of metabolism (section 6.1) a. Cells must: (figure 6.1) i. Synthesize new components (anabolism/biosynthesis) ii. Harvest energy and convert it to a usable
Metabolism of Herpes Simplex Virus 1 infected RAW macrophages
 Metabolism of Herpes Simplex Virus 1 infected RAW 264.7 macrophages A thesis submitted in partial fulfillment of the requirements for the degree of Master of Science By Mary Kathryn Jenkins B.S., Bowling
9.2 The Process of Cellular Respiration
 9.2 The Process of Cellular Respiration Oxygen Carbon 2 2 Dioxide 34 Water Glycolysis Glycolysis is the first stage of cellular respiration. During glycolysis, glucose is broken down into 2 molecules of
Chapter 7 How Cells Release Chemical Energy
 Chapter 7 How Cells Release Chemical Energy 7.1 Mighty Mitochondria More than forty disorders related to defective mitochondria are known (such as Friedreich s ataxia); many of those afflicted die young
LIPID METABOLISM. Sri Widia A Jusman Department of Biochemistry & Molecular Biology FMUI
 LIPID METABOLISM Sri Widia A Jusman Department of Biochemistry & Molecular Biology FMUI Lipid metabolism is concerned mainly with fatty acids cholesterol Source of fatty acids from dietary fat de novo
BIOCHEMISTRY. Glycolysis. by Dr Jaya Vejayan Faculty of Industrial Sciences & Technology
 BIOCHEMISTRY Glycolysis by Dr Jaya Vejayan Faculty of Industrial Sciences & Technology email: jayavejayan@ump.edu.my Chapter Description Overview This chapter is related to carbohydrate catabolism. It
Background knowledge
 Background knowledge This is the required background knowledge: State three uses of energy in living things Give an example of an energy conversion in a living organism State that fats and oils contain
ANSC/NUTR 618 LIPIDS & LIPID METABOLISM. Fatty Acid Elongation and Desaturation
 ANSC/NUTR 618 LIPIDS & LIPID METABOLISM I. Fatty acid elongation A. General 1. At least 60% of fatty acids in triacylglycerols are C18. 2. Free palmitic acid (16:0) synthesized in cytoplasm is elongated
Higher Biology. Unit 2: Metabolism and Survival Topic 2: Respiration. Page 1 of 25
 Higher Biology Unit 2: Metabolism and Survival Topic 2: Respiration Page 1 of 25 Sub Topic: Respiration I can state that: All living cells carry out respiration. ATP is the energy currency of the cell
How Cells Harvest Chemical Energy
 How Cells Harvest Chemical Energy Global Athlete Outreach Program US CytoThesis Systems Medicine Center www.cytothesis.us US OncoTherapy Systems BioMedicine Group CytoThesis Bioengineering Research Group
Chemistry 1120 Exam 4 Study Guide
 Chemistry 1120 Exam 4 Study Guide Chapter 12 12.1 Identify and differentiate between macronutrients (lipids, amino acids and saccharides) and micronutrients (vitamins and minerals). Master Tutor Section
Fatty Acid and Triacylglycerol Metabolism 1
 Fatty Acid and Triacylglycerol Metabolism 1 Mobilization of stored fats and oxidation of fatty acids Lippincott s Chapter 16 What is the first lecture about What is triacylglycerol Fatty acids structure
Cellular Respiration Checkup Quiz. 1. Of the following products, which is produced by both anaerobic respiration and aerobic respiration in humans?
 1. Of the following products, which is produced by both anaerobic respiration and aerobic respiration in humans? I. Pyruvate II. III. ATP Lactate A. I only B. I and II only C. I, II and III D. II and III
PHOSPHOLIPIDS METABOLISM. BY Dr. Walid Said Zaki Dr. Marwa Ali LECTURER OF BIOCHEMISTRY AND MOLECULAR BIOLOGY
 PHOSPHOLIPIDS METABOLISM BY Dr. Walid Said Zaki Dr. Marwa Ali LECTURER OF BIOCHEMISTRY AND MOLECULAR BIOLOGY 1. State the definition and classification of Phospholipids. 2. Describe the general structure
Cellular Respiration
 Cellular Respiration I. The Importance of Food A. Food provides living things with the: B. Food serves as a source of: C. Food serves as a source of: II. Chemical Energy and ATP A. Inside living cells,