1.4 Cannabis Market Summary trend overview
|
|
|
- Poppy Wilcox
- 6 years ago
- Views:
Transcription
1 1.4 Cannabis Market Summary trend overview Cannabis is the largest illicit drug market by far and its size is one of its most important characteristics. Its consumer market is large, roughly 16 million people; its production centres are widely dispersed, existing in almost every country in the world and its factors of production can be both flexible, rudimentary and small scale and permanent, highly technical and large scale. The widespread nature of production and consumption make it very difficult to define and quantify. The consumer market for cannabis is also different. The size of the consumer market for cannabis could imply that consumers are more varied. Production is pervasive. A total of 82 countries explicitly reported the illicit cultivation of cannabis on their territory over the period. In addition, Member States identified 134 source countries for the production of cannabis. Moreover, 146 countries reported seizing cannabis plants over the period, which is an indirect indicator for the existence of cannabis plant production in a country, as cannabis plants are usually not trafficked across borders (only the end-products; cannabis herb, cannabis resin or cannabis oil). Combining these data suggests that cannabis production is taking place in at least 172 countries and territories. Although the insidiousness of cannabis renders effective monitoring of the supply side difficult, it is probable that the expansion of cannabis production ceased in 25. Indications of an overall stabilisation in the market are extremely encouraging but whether this is sustainable or not will need to be confirmed with data from the next few years. Some aspects of this market are evolving. Indoor cultivation is expanding in general and as this occurs several consumer countries have emerged as important cannabis producing countries supplying their local markets (at least to a limited extent). As this happens, the overall potency of cannabis (i.e. the THC content as engineered through horticultural innovations) has been rising in several countries. The production of cannabis resin, also known as hashish is concentrated in North Africa (Morocco) and in the South-West-Asia / Middle East region, particularly in Afghanistan and Pakistan. In Morocco, UNODC surveys, conducted in collaboration with the authorities, revealed a fall in the area of cannabis resin cultivation from a peak of 134, ha in 23 to 76,4 ha in 25. Moroccan cannabis resin production, for years the main source of hashish for Western Europe, declined even more strongly, from 3,7 mt in 23 to 1,7 mt by 25. Cannabis herb seizures continue to be mainly concentrated in North America (66% of global seizures in 25), followed by Africa (16%). Global seizures of cannabis herb showed a strong increase over the 2-24 period, a probable reflection of rising cannabis herb production, trafficking and consumption. However, in 25, cannabis herb seizures declined substantially to the levels reported back in 2. The decline was reported across all continents. The factors which provoked this decline are not fully known; but eradication seems to have played a critical role. Global cannabis resin seizures also declined in 25 due to lower production of cannabis resin in Morocco. The world s largest cannabis resin seizures continued to be reported by Spain (52% of global hashish seizures in 25), followed by Pakistan (7%) and Morocco (7%). The consumer markets in North America appear to have contracted, but there has been an increase of cannabis use in Africa and in most countries of South America. The situation in Europe is mixed. A decline of cannabis use was found in the Oceania region, which has the world s highest levels of prevalence rates for cannabis. Countries of East & South-East Asia showed stable or declining cannabis consumption trends while in South-Asia, South-West Asia and Central Asia the reported trends suggest an increase. The number of countries reporting increases in cannabis use fell from 56 per cent in 2 to 49 per cent in 25, while the number of countries reporting declines increased from 11 per cent in 2 to 18 per cent in
2 World Drug Report Production Cannabis cultivation remains pervasive throughout the globe The pervasiveness of cannabis persists. Between , 82 countries provided UNODC with cannabis cultivation or production estimates. Unfortunately, reporting on cannabis cultivation is complex and resource intensive for a number of reasons and many countries do not have the capacity or resources ot make estimations. Consequently, UNODC also analyses seizure reports which sometimes identify the source of cannabis trafficked in a country. On this basis, 134 producer countries were identified over the period. A third list of producer countries was generated by singling out those that reported the seizure of cannabis plants. The inefficiency of transporting whole plants internationally (as only some parts are useable as a drug) means that when whole plants are seized, it is very likely that they were locally produced. Seizures of whole cannabis plants were reported in 146 countries over the period. Combining the three lists of estimates, 172 countries and territories can be identified where cannabis is pro- Cannabis continues to be the most widely produced, trafficked and consumed drug worldwide. It is produced for basically three different end products: Cannabis herb is comprised of the flowering tops and leaves of the plant, which are smoked like tobacco using a variety of techniques. Depending on the region, cannabis herb is known under many different names, including 'marijuana' (Americas; also referred to as 'grass', 'weed', 'ditch' or 'dope'), 'ganja' (South-Asia / Jamaica), 'dagga' (South Africa), 'dimba' (West Africa) or 'chira' (North Africa; usually cannabis resin powder). A very potent form of cannabis herb is sinsemilla, the flowerinng tops the unpollinated female plant. Cannabis herb accounted for 77 per cent of global cannabis seizures in 25. Cannabis resin consists of the secretions of the plant emitted in the flowering phase of its development. Depending on the region, cannabis resin is known as 'hashish' (North Africa / Europe) or as 'charas' (South-Asia). It accounted for close to 23 per cent of global cannabis seizures in 25. Cannabis oil (hashish oil) is an oily mixture resulting from extraction or distillation of THC rich parts of the cannabis plant. It is less widely used, accounting for.1 per cent of all cannabis seizures in 25. In addition, a number of cannabis combinations are found on the markets, such as: 'Kif' (North-Africa), often understood to mean the chopped flowering tops of the female cannabis plant, mixed with tobacco, or 'Bhang' (South-Asia), often understood as a beverage prepared by grinding cannabis leaves in milk and boiling it with spices and other ingredients; or 'White pipe' (South Africa), the smoking of cannabis herb in combination with tobacco and Mandrax (consisting of methaqualone as the active ingredient and antihistamines). Various combinations of cannabis with other drugs such as cannabis/cocaine and cannabis/amphetamine, are reported inter alia from Eastern Africa. The combinations usually carry region/country specific or local names. 1 1 In some parts of North America, for instance, the following combinations are found: 'Candy sticks: cannabis herb cigarettes laced with cocaine; 'Buddha': cannabis herb spiked with opium; 'Ace' or ' Zoom' : cannabis herb mixed with PCP, etc.; use of cannabis in food items (e.g. in North Africa'); 'Marijuana brownies' (e.g. in North America); as well as frequent use of both cannabis and alcohol (often reported from Europe and Australia). 96
3 1. Trends in world drug markets Cannabis market Fig.71: Number of countries/territories identified as cannabis producers ( ): N = 172 Fig. 72: Estimates of global cannabis herb production, , A Metric tons 4, 3, B C 2, 1, A: 82 countries/territories providing cultivation/production estimates 1988/ / B: 134 countries/territories identified as source countries for cannabis that was trafficked C: 146 countries reporting the seizure of whole cannabis plants Sources: UNODC, Annual Reports Questionnaire Data and Govt. reports. duced, equivalent to close to 9 per cent of the countries & territories which receive UNODC s Annual Reports Questionnaire (19-195). 2 The analysis of the reported source countries (ARQ, period) suggests that cannabis resin production takes place in some 58 countries while cannabis herb (marijuana) production occurs in at least 116 countries. The caveat here is that cannabis herb is thought to be produced even in countries where the main supply concentrates on resin. Cannabis herb production is globally far more dispersed than global cannabis resin production Cannabis herb production Global production of cannabis herb is estimated to have declined to 42, mt in 25 Based on information collected from Member States, UNODC estimates global cannabis herb production at 42, metric mt in 25, dwarfing global heroin production (472 mt in 25) or global cocaine production (98 mt in 25). This represents a decline of almost 3, mt (-7%) over 24. While these data must be interpreted with caution, they seem to signal, that the upward trend in herb production observed since the early 199s, may be coming to a halt. The cannabis herb estimate suggests that 1.6 per cent of cannabis herb production was seized in 25. The area under cannabis cultivation is estimated to have amounted to 53, ha in 25, which was again far more than the area under poppy cultivation (151,5 ha) or the area under coca cultivation (159,6 ha in 26). 3 The yields reported by Member States varied substantially, from as low as 5 kg/ha to 17,5 kg/ha. This is a reflection of the wide ranges of cannabis yields, e.g. from wild cannabis to hydroponically grown cannabis. Within reported estimates the median cannabis yield was 73 kg/ha and the (unweighted) average yield was 2,7 kg/ha. Despite the large difference, such yield fig- 2 Cannabis production estimates must be viewed with caution: Although, production estimates for cannabis are systematically collected by UNODC from Member States as part of the replies to the annual reports questionnaire (ARQ), the lack of clear geographical concentrations of cannabis production (as with opium poppy or coca bush) makes it impracticable to introduce scientifically reliable crop monitoring systems. The fact that cannabis is a plant that grows in virtually every inhabited region of the world, that it can be cultivated with little maintenance on small plots, and that it can be also grown indoors, complicates matters. Resulting variations in cannabis yields are also huge. The majority of individual country estimates are thus still based on expert opinion, rather than on the results of scientific crop monitoring systems. Nonetheless, given a number of innovative approaches introduced by UNODC in recent years to arrive at estimates for countries that did not provide any estimates (see section on methodology), the resulting global estimates should provide, at least, reasonable orders of magnitude of the problem. As the methodology used to arrive at the estimates has remained basically the same in recent years, and as one should not under-rate the expertise of the authorities to come up with reasonable estimates (even without detailed surveys), one may assume that resulting changes in the global production estimates basically reflect underlying changes in cultivation and production. The fact that global cannabis production estimates largely mimic global seizures tends to support this view. 3 The estimate of area under cultivation for cannabis herb includes some, but not all, wild cannabis. Were there any practical way to measure wild cannabis this figure would be much higher. 97
4 World Drug Report 27 Fig. 73: Breakdown of global cannabis herb produc tion in 25 (N = 42, ) Oceania 1% Africa 26% Asia 22% ures are consistent with those reported in UNODC s last extensive survey of the global cannabis market 4. That study suggested that typical yields for cultivated outdoor cannabis range from 47 kg/ha in non-irrigated areas to 5, kg/ha in well tended gardens, with figures around 2, kg/ha typical for the situation in the USA 5, and levels around 1, kg/ha typical for the situation in developing countries. In contrast, the yields of hydroponically grown cannabis ranged from 15, to 3, kg per hectare. In 25 the bulk of cannabis herb was produced in the Americas (46%) and in Africa (26%), followed by countries in Asia and in Europe. Internationally, most cannabis herb was produced for the domestic market and/or for exports to neighbouring countries. Countries in which cannabis is produced for extra regional export are limited. They include a number of West, South and North African countries (including South Africa, Nigeria and Morocco) and few East, West and Central Asian countries (including Thailand, Pakistan and Kazakhstan). Most of these exports are destined for Europe. Production by region Europe 5% North America 23% Central / South America and the Caribbean 23% Sources: UNODC, Annual Reports Questionnaire Data and Govt. reports. The largest producers in North America continue to be Mexico and the United States of America followed by Canada. Estimates made available to UNODC suggest that Mexico and the USA may be the world s largest cannabis herb producers. Production in Mexico is mainly concentrated in states along the Pacific coast (Sinaloa, Miachoacán, Guerrero, Jalisco, Oaxana and Nayarit) which account for about 53 per cent of total cannabis eradication, and in the Center/North region (Chihuahua, and Baja California), where 42 per cent of cannabis eradication took place in 25. Cannabis production in the USA is particularly widespread in the states of California, Kentucky, Tennessee, Hawaii, and Washington. 6 Cannabis production in Canada is mainly concentrated in British Colombia (4%), Ontario (25%) and Quebec (25%). Cannabis production takes place in practically all countries in South America and the Caribbean. The largest producers in South America are Paraguay, followed (now) at far lower levels, by Colombia, Brazil and the Caribbean region. Declines of cannabis production in Colombia in recent years appear to have been offset by increases in other parts of South America, notably in Paraguay. Though Brazil is an important cannabis producer, it is not self-sufficient so that large quantities are trafficked from Paraguay into that country. Frequently mentioned source countries in the Caribbean region are St. Vincent & the Grenadines as well as Jamaica. Guatemala is frequently cited as a source country for cannabis from Central America. Cannabis is grown in almost all of the countries of Africa. The largest cannabis herb producers in Africa include South Africa (as well as a number of other countries in the region, including Malawi, Zambia and Swaziland), Nigeria, Ghana & several other West- African countries (including Benin and Togo), the Democractic Republic of the Congo in central Africa, Tanzania in eastern Africa as well as Morocco in northern Africa (though the latter country is mainly known as a cannabis resin producer). Despite growing levels of domestic production, Europe remains a region which still relies, to a significant extent, on the importation of cannabis. The largest cannabis producers in Europe are Albania and the Netherlands, though significant amounts are also being produced in most other European countries, including Germany, Switzerland and the UK. The largest cannabis producers among the C.I.S countries are Kazakhstan, the Russian Federation and Kyrgyzstan. The Russian Federation and Kazakhstan contain the world s largest areas of wild cannabis. The largest producers in the Near East & South-West Asia region are Afghanistan, followed by Lebanon and 4 5 UNODC, 26 World Drug Report, Vol. 1, pp UNODC, 26 World Drug Report, Vol. 1, pp As identified through the analysis of data from court cases 6 National Drug Intelligence Center, National Drug Threat Assessment 27, October 26 98
5 1. Trends in world drug markets Cannabis market Pakistan (in all of these countries, however, cannabis herb production is far less important than the production of cannabis resin). Important producers in South- Asia are India, Nepal and Sri Lanka; and important producers in South & South-East Asia include the Philippines and Indonesia, followed, at lower levels, by Thailand. The largest cannabis producer in the Oceania region is Australia. Fig. 75: Area under cannabis cultivation in Mexico, , 3, Changes in the regional breakdown suggest that cannabis production increased in Asia, Europe and South America (including Central America and the Carribean) but declined in North America and in Africa. Hectares 2, 3,845 3,886 29,928 The decline of cannabis production in North America was mainly due to lower cannabis production levels in Mexico, which reflect the strong eradication efforts made in that country. Mexico has been extremely efficient in eradicating cannabis, having eradicated some 85 per cent of the area under cultivation. The net area under cultivation thus declined by 23 per cent in 25 (from 7,5 to 5,8 ha) with a further decline reported 1, 7,5 5, Net area under cultivation Eradication Fig. 74: Regional breakdown of global cannabis herb production in 24 and in 25 Sources: US State Dept., 27 International Narcotics Control Strategy Report and UNODC, Annual Reports Questionnaire Data. Metric tons 5, 4, 3, 2, 1, - 45, 42, Africa North America South America (incl. Central America & Caribbean) Oceania Europe Asia Sources: UNODC, Annual Reports Questionnaire Data and Govt. reports for the year 26 (to 5,6 ha). Given differences in yield estimates, production estimates for Mexico range from 4,48 mt to 1,1 mt 7 (for 25). In parallel, cannabis eradication efforts in the USA were significantly stepped up in recent years. According to data of the Domestic Cannabis Eradication/Suppression Program the number of eradicated cannabis plants in the USA rose from 3.2 million in 24 to 4.2 million in 25 (+31%) and 4.9 million plants (+17%) in 26. Including eradication efforts made by other government agencies, total eradication amounted to 6.3 million plants in the USA in 26. Applying the DEA estimate of, on average, 1 pound of cannabis herb per plant 8, eradication may have removed some 2,825 mt from the US market in 26, i.e. more than is produced in most other countries of the world. Law enforcement reports indicate that between 3 and 5 per cent of all cannabis grown in the USA is now being eradicated. 7 No official Mexican cannabis production estimates exist. The first estimate is based on INCSR cultivation estimates and a yield figure of 8 kg/ha, provided to UNODC by the Mexican authorities; the second figure reflects the US INCSR estimate for cannabis production in the year 25. (US State Department, International Narcotics Control Strategy Report, March 27). 8 The DEA (US Drug Enforcement Agency) ratio of 1 pound (448 grams) per plant has been widely used in the USA. In contrast, the United States Sentencing Commission has identified a 1 grams a plant figure to be more appropriate when looking at mixed gender crops. The one plant = 1 grams of marijuana equivalency used by the Commission for offenses involving fewer than 5 marihuana plants was selected as a reasonable approximation of the actual yield of marihuana plants taking into account (1) studies reporting the actual yield of marijuana plants... (2) that all plants regardless of size are counted for guideline purposes (while, in actuality, not all plants will produce useable marijuana)...; and (3) that male plants, which are counted for guideline purposes, are frequently culled because they do not produce the same quality of marijuana as do female plants. Federal Register 6 (May 1, 1995): This figure was extended to all crops, including those involving more than 5 plants. See also United States Sentencing Commission, 1995 Annual Report, p USSG SS 1B1.1, 2D1.1(c)(E) (Nov. 1995). DEA and the National Drug Intelligence Center of the US Department of Justice, however, continue using a yield figure of 1 pound per plant. (U.S. Department of Justice, National Drug Intelligence Center, Domestic Cannabis Cultivation Assessment 27.) 99
6 World Drug Report 27 Table. 1: Number of cannabis plants eradicated in the USA, Outdoor a 2,597,798 3,68,632 3,128,8 3,427,923 2,996,225 3,938,151 4,83,433 Indoor a 217,15 236, ,4 223,183 23,896 27,935 43,322 Total a 2,814,93 3,34,74 3,341,84 3,651,16 3,2,121 4,29,86 4,486,755 Outdoor b ,546,59 5,91,8 Indoor b ,935 43,322 Total b ,817,444 6,35,22 Source: a Domestic Cannabis Eradication/Suppression Program. Source: b Domestic Cannabis Eradication/Suppression Program & U.S. Department of the Interior & U.S. Department of Agriculture and Forest Service. Rising levels of eradication in the USA have been interpreted by some analysts as an indication of growing levels of cannabis cultivation 9. There has been an increase in indoor cultivation, with the proportion of eradicated indoor cannabis rising from 4.7 per cent in 25 to 6.4 per cent of all eradicated cannabis in 26. Taking only the data from the DEA s Domestic Cannabis Eradication/Suppression (DCE/SP) Program, the proportion of indoor cultivation rose from 6.4 per cent in 25 to 9 per cent in 26. Moreover, the actual identified locations where cannabis is grown (and eradicated) suggest that cannabis cultivation has been spreading to more remote areas, including national parks. In fact, the DEA s DCE/SP program has forced many traffickers to abandon large outdoor marijuana plots in favour of smaller, better concealed illicit gardens 1. Rapidly rising levels of eradication thus may have contributed to a stabilization, or even a reduction, in overall US cannabis production. While US seizure data for the period point to a stabilization, US demand data indicate a reduction. Published US cannabis production estimates also point to a stabilization or reduction. Estimates for the year 22 suggested that cannabis herb production ranged from 5,58 to 16,73 mt 11 with a mid-range estimate of 11,15 mt. After deducting eradication, this would leave net production of close to 1, mt. The 26 estimates ranged from 5,65 to 9,42 mt with a mid range estimate of some 7,53 mt. Estimates of net production (after eradication) ranged from 2,83 to 6,59 mt 12 with a mid-range estimate of 4,71 mt. In 25, following several years of strong increases, the US authorities also reported slightly less trafficking of cannabis via Canada into the USA. 13 This could indicate that cannabis production stabilized, or even declined slightly, in Canada, following large production increases in previous years: between 2 and 24 production in Canada more than doubled 14. The Royal Canadian Mounted Police estimate a marijuana production of 8 to 2, mt 15. Other estimates see the level of cannabis herb production at between 96 and 2,4 mt in Canada. 16 All of these estimates suggest that while 9 U.S. Department of Justice, National Drug Intelligence Center, Domestic Cannabis Cultivation Assessment ONDCP, National Drug Control Strategy, Feb. 27. Drug Availability Steering Committee, Drug Availability Estimates in the United States, December 22 and Office on National Drug Control Policy, National Drug Control Strategy, Feb. 23. U.S. Department of Justice, National Drug Intelligence Center, Domestic Cannabis Cultivation Assessment 27. The total marijuana seizures in the northern border states of the USA increased from 13.6 mt in 22 to 31.4 mt in 24 but then declined again to 26.4 mt in 25. See National Drug Intelligence Centre, 27 National Drug Threat Assessment, Oct. 26 According to Government of Canada estimates, cited by the US Drug Intelligence Centre, production in Canada more than doubled from 2 through 24 (National Drug Intelligence Centre, 27 National Drug Threat Assessment, Oct. 26). There estimates were, inter alia, based on seizures of, on average, 1.1 million cannabis plants per year; see Royal Canadian Mounted Police, Drug Situation in Canada in 23, Ottawa, July 24; see also National Drug Intelligence Centre, National Drug Threat Assessment 25, Feb. 25. Public Safety Canada, Canada-United States Border Drug Threat Assessment, Oct
7 1. Trends in world drug markets Cannabis market cannabis production in Canada is important it remains significantly lower than in the USA or in Mexico. Canada is, however, an important source country for high THC cannabis consumed and trafficked into the USA. Such cannabis production in Canada is controlled by Asian crime groups (often ethnic Chinese and Vietnamese). Some of these groups are thought to have relocated their indoor activities into the US 17 Pacific Northwest and to California 18, in order to avoid tightened border controls. Despite some increase of cannabis herb production in South America (including Central America and the Caribbean), the overall proportion of cannabis herb production in the Americas declined from 54 per cent to 47 per cent of global production in 25. This pattern of growing production in South America and declining production in North America is inconsistent with the long-term trend which shows strong increases in the North American proportion of global production. Cannabis production in Africa appears to have declined slightly in 25. This is also in contrast to a long-term trend which showed strong increases of cannabis production in that continent. The current estimate suggests that Africa accounts for 25 per cent of global cannabis herb production in 25, slightly down from 26 per cent in 24. The decline of cannabis cultivation in Africa has been mainly due to reductions reported from Morocco (though most of this cannabis is used for cannabis resin production). The area under cannabis cultivation in Morocco, as identified in joint UNODC and Government of Morocco surveys (based on remote sensing techniques), declined by 37 per cent on a year earlier in 25. This followed a decline of 1 per cent in 24. In addition, eradication efforts in Nigeria, one of the main cannabis producing countries in Western Africa, dramatically increased. After having eradicated 255 ha of cannabis in 24, the Nigerian authorities reported the eradication of 14,316 ha in 25 - which is close to half the size of the eradications reported from Mexico. This downward trend is not uniform in Africa with several other countries reporting increases. Overall cannabis production in Africa is expected to resume its expansionary trend shortly. Cannabis production reported from Asia is increasing. The proportion of Asia in global cannabis production increased from 15 per cent in 24 to 22 per cent in 25, with a significant increase reported from Afghanistan, where the area under cannabis cultivation is partially surveyed as a part of UNODC s annual opium surveys. Results are based on farmers reports of the areas cultivated. Most of the cannabis cultivation in Afghanistan is produced as cannabis resin. Cannabis herb production also increased in Europe, with Europe s share in global cannabis herb production rising from 3 per cent in 24 to 5 per cent in 26. The increase in domestic production of cannabis herb in Europe seems to have offset some of the decline of cannabis resin imports from Morocco. Understanding how this happened could yield some interesting and important information on the cannabis market Cannabis resin production Geographically, the production of cannabis resin is far more concentrated than production of cannabis herb. The world s largest cannabis resin producer continues to be Morocco, supplying the illicit markets of North Africa and Western Europe. Western Europe is the world s largest market for cannabis resin, accounting for some 7 per cent of global resin seizures in 25; North Africa accounts for another 8 per cent. The importance of Morocco as a source country for cannabis resin is, however, declining. In 23, the year of the first UNODC/Government of Morocco survey total resin production amounted to 3,6 mt, cultivated on 134, ha of land in the Rif region of northern Morocco by some 96,6 families. The 24 survey showed a 1 per cent decline in land under cannabis cultivation (12,5 ha), with an estimated production of 2,76 mt. 19 In 25 cultivation declined further to 72,5 ha, and production fell to 1,66 mt 2, reflecting the intensified efforts of the Moroccan authorities to eliminate cannabis production from their territory. Cannabis resin production in Morocco is concentrated in the provinces of Chefchaouen (56 % of total in 25), Taunate (17 %) and Al Hoceima (16 %). 17 U.S. Department of Justice, National Drug Intelligence Center, Domestic Cannabis Cultivation Assessment 27, Oct. 26 and ONDCP, National Drug Control Strategy, Feb U.S. State Department, 27 International Narcotics Control Strategy Report, March Some of the decline appears to have been a consequence of an earthquake, resulting in increased attention being given by the national authorities and the international community to the region concerned. 2 UNODC, Morocco Cannabis Survey 25, Executive Summary 25, June
8 World Drug Report 27 Fig. 76: Morocco cannabis cultivation and production, Hectares 14, 12, 1, 8, 6, 4, ,5 72,5 tonnes , cultivation production Source: UNODC/Government of Morocco, Maroc, Cannabis Survey 25, Jan. 27 and previous years. The decline of the importance of Morocco is also reflected in the number of countries citing Morocco as the source country of the cannabis resin found on their markets. Over the period 31 per cent of countries reporting the origin of cannabis resin cited Morocco as the origin of the hashish found on their markets. By 25, the proportion of Morocco (including the subsequent transit countries, Spain and Portugal) fell to 2 per cent, reflecting the massive decline of Moroccan cannabis resin production in recent years. Reports of country of origin are based on the information from 4 countries responding to this part of the Annual Reports Questionnaire in 25. In order to expand the information base for the analysis of the importance of less frequently mentioned producer countries, the time period was increased to the 23-5 period. This raised the information base to a sample of 61 countries (equivalent to almost a third of all countries). Considering the broader period, 27 per cent 22 of countries cited Morocco as the main source country of the cannabis resin encountered on their domestic market. The next most frequently mentioned countries were Afghanistan/Pakistan, accounting for 8 per cent of such mentions. Overwhelmingly, cannabis cultivation in these countries is for the production of cannabis resin. UNODC s estimates suggest that the area under cannabis cultivation in Afghanistan increased from 3, ha in 24/5 to 5, ha in 25/6 - equivalent to 3 per cent the area under opium poppy cultivation. 23 The next most frequently mentioned source countries for cannabis resin are Nepal/India (mentioned by 7 per Fig. 77: Area under cannabis cultivation in Afghanistan* and Morocco, Hectares 14, 12, 1, 8, 6, 4, 2, - 12,5 76,4 Morocco 3, , Afghanistan * data for Afghanistan refer to 24/5 and 25/6 Sources: UNODC, 26 Afghanistan Opium Survey (and previous years) and UNODC/Government of Morocco, Maroc, Cannabis Survey 25, Jan UNODC, 25 World Drug Report, Volume I. 22 Over the 23-5 period, Morocco was mentioned 48 times as a source country for cannabis resin in replies by member states to UNODC s ARQ. Including Spain and Portugal, which are mainly transit countries of Moroccan hashish, the number of mentions increases to 7. The total number of all mentions of source countries (by the 61 reporting countries) amounted to 257. (Countries can mention more than one country as a source country). The proportion of Morocco (including the mentions of Spain and Portugal) was thus 27.2 per cent in all mentions. 23 UNODC, Afghanistan Opium Survey 26, October
9 1. Trends in world drug markets Cannabis market cent of the countries) and the Central Asian and other C.I.S. countries (5%), reflecting large areas of cannabis in Kazakhstan (mainly wild cannabis) and Kyrgyzstan. Significant levels cannabis production exist in the Chuy valley and around the Lake Issyk-Kul in Kyrgyzystan and in Zhambyl province of Kazakhstan bordering Kyrgyzstan. Both cannabis herb and resin are produced in these areas. The Netherlands is also frequently mentioned as a country of origin (5% of global mentions). It is, however, not clear to what extent the cannabis resin actually originates in the Netherlands and to what extent it is smuggled into the country (from Morocco and other countries) for subsequent re-export. Though the Netherlands is an important producer of cannabis herb, other information suggests that resin production is limited. Similarly, the situation for Albania is not straightforward. This country is also frequently mentioned as a cannabis resin source country (5% of all mentions, mainly from neighbouring countries). What seems to be clear, however, is that Albania s role as a cannabis herb producer clearly exceeds its role as cannabis resin producer. The most important cannabis resin producer in the Americas continues to be Jamaica (3% of global mentions), followed by Paraguay. Overall, production (and consumption) of cannabis resin in the Americas remains limited. The most important cannabis resin producer in the Near East remains Lebanon (2% of global mentions). Following successful eradication campaigns, production in Lebanon is drastically down as compared to the early 199s. Production of cannabis resin in Lebanon is concentrated in the Bekaa valley. Global cannabis resin production estimated at around 6,6 mt Tentative estimates suggest that some 6,6 mt of 24 cannabis resin were produced in 25 (range: 3,8-9,5). The previous year s estimate, based on the same methodology, resulted in an estimate of some 7,5 mt (range: 4,2-1,7), indicating that, following years of increases, global cannabis resin production actually declined in 25. The decline was largely due to the lower cannabis resin production reported from Morocco. A production of some 6,6 mt of cannabis resin results in a calculated cannabis resin interception rate of close to 2 per cent. Fig. 78: Main source countries of cannabis resin, (based on information from 61 countries) Morocco* Afghanistan / Pakistan Nepal / India Central Asia & other C.I.S. Netherlands Albania Jamaica Paraguay Lebanon** / Egypt 4.7% 3.1% 2.7% 2.3% 7.8% 6.6% 5.4% 5.4% % 5% 1 % 15 % 2 % 25 % 27.2% 3 % * including mentions of the transit countries Spain and Portugal; ** including mentions of Syria number of times countries were identified as source countries as a proportion of countries reporting Source: UNODC, Annual Reports Questionnaire Data. Fig. 79: Global cannabis resin production estimates, 22/3 25 1, 8, 6, 4, 2, 6,3 7,5 6,6 22/ Sources: UNODC and Govt. of Morocco, Cannabis Surveys 23, 24 and 25 and UNODC, Annual Reports Questionnaire Data. 24 Which are based on extrapolating the results from Moroccan cannabis resin production data and extrapolating global resin production from herb production estimates with the help of seizure statistics 13
10 World Drug Report 27 Table 11: Tentative estimates of global cannabis resin production, Estimate based on Moroccan cannabis resin production 25 and seizures Seizures in tons (25) Estimated proportion of seizures related to cannabis resin originating in Morocco Estimated proportion from 25 harvest Potential seizures in tons related to Moroccan cannabis resin production in 25 Cannabis resin production estimates West & Central Europe % 5% North Africa % 5% Seizures related to Moroccan cannabis resin Other seizures Global seizures , in % % - Cannabis resin production in Morocco (25) in tons 1,7 Global cannabis resin production estimate I 3, Estimate based on cannabis herb production estimates and seizures Cannabis herb Cannabis resin Proportion Cannabis resin production estimates Seizures in tons (25) 4,472 1,299 23% Global cannabis production estimate II 42, 23% 9, Combined estimate 6,613 Rounded 6,6 14
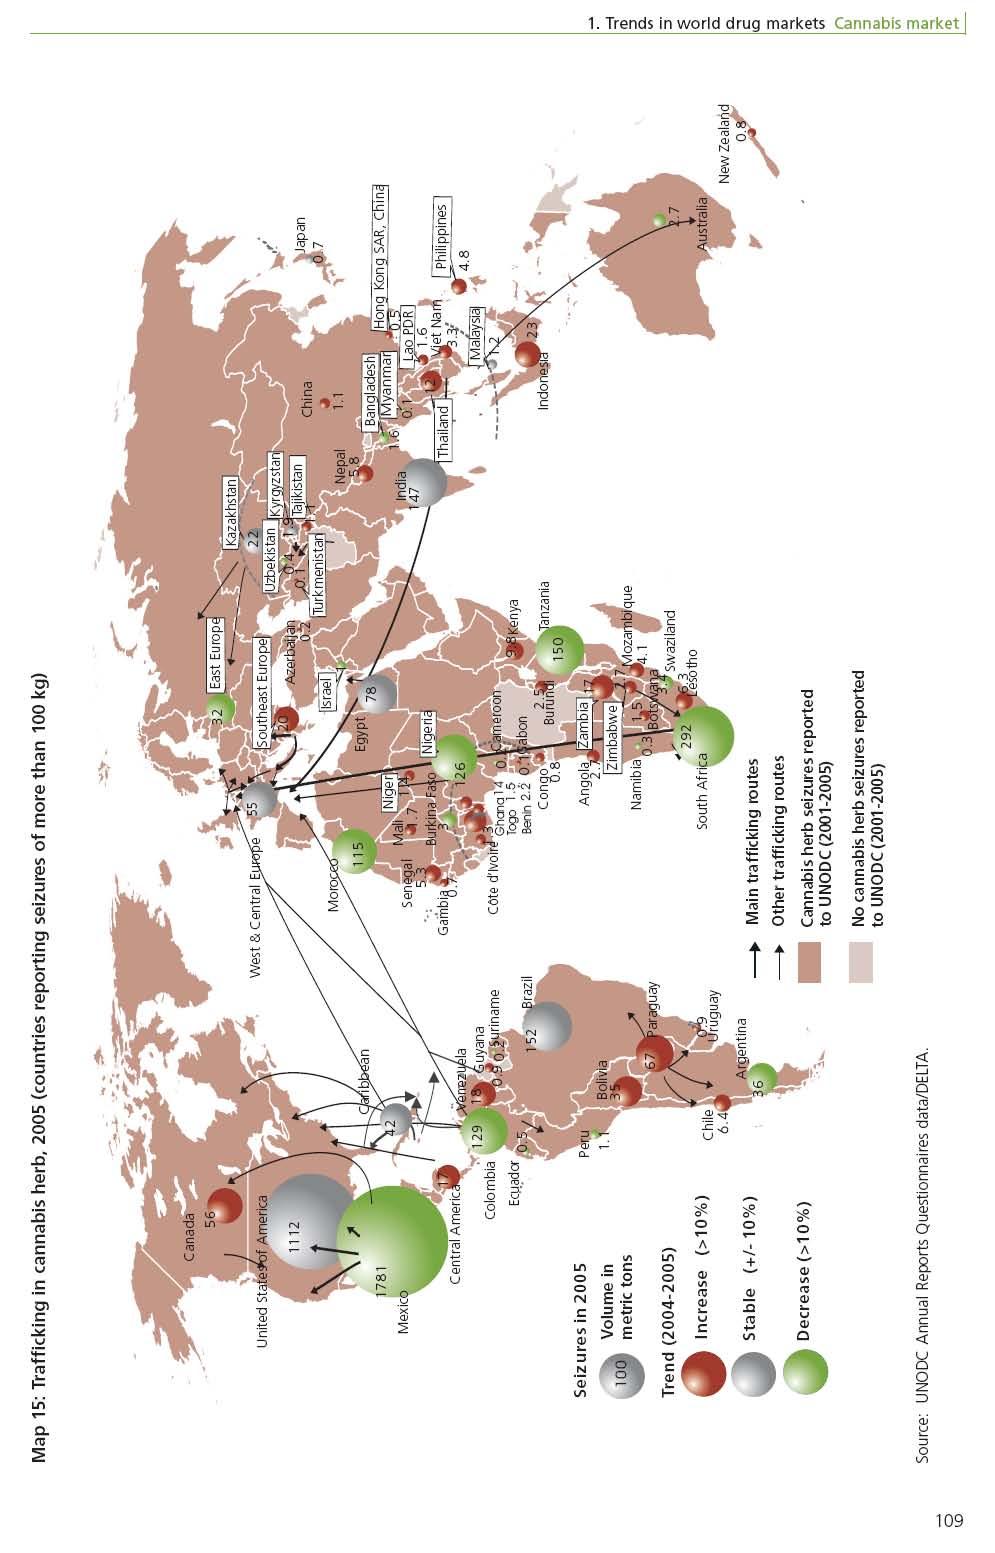
11 1. Trends in world drug markets Cannabis market Trafficking Seizures of both cannabis herb and resin decline in 25 Cannabis products remained the most widely trafficked drugs worldwide in 25, accounting for 57 per cent of all global seizure cases (856, out of 1.5 million). Practically all countries in the world are affected by cannabis trafficking. Out of 165 countries and territories which reported seizures to UNODC, 99 per cent reported seizures of cannabis. Cannabis herb seizures amounted to 4,6 mt and cannabis resin seizures to 1,3 mt in 25. Small quantities of cannabis oil (7 litres) were also seized. Seizures of all three products declined in 25 as compared to a year earlier, thus reversing the upward trend observed until 24. Herb seizures dropped by 35 per cent, resin seizures by 11 per cent and cannabis oil seizures by 15 per cent. While changes in law enforcement priorities in some countries may have played a role, for the majority of countries lower seizures meant less trafficking as compared to the previous year. Taken together, cannabis herb and resin seizures are now back to the levels reported over the 2-22 period. Most cannabis herb seizures in 25 were reported from Mexico (38% of the world total), followed by the Fig. 8: Cannabis seizures, Metric tons 9, 8, 7, 6, 5, 4, 3, 2, 1, Cannabis resin Trend Cannabis herb Source: UNODC, Annual Reports Questionnaire Data / DELTA United States (24%), South Africa (6%), Brazil (3%), Tanzania (3%) and India (3%). Most seizures of cannabis resin were made by Spain (51%), followed by Pakistan and Morocco (7% each), France (6%), Iran (5%), the UK (5% in 24) and Afghanistan (3%). Most cannabis oil seizures were made in the Russian Federation (34%) and the Ukraine (1%), followed by Canada (7%) and Morocco ( 5%). Cannabis herb remains by far the most widely trafficked drug Despite of the strong decline in global seizures (-35%), cannabis herb remains the most widely trafficked substance in terms of volume and geographic spread. Ninety per cent of all countries reporting seizures (148 out of 165 countries) seized some cannabis herb. In contrast to other drugs, trafficking in cannabis herb is primarily intra-regional, not inter-regional. Exceptions to this are cannabis herb exports: from Africa (mainly western and southern Africa) to West and Central Europe; from South-East Asia (mainly Thailand) and South-West Asia (mainly Pakistan) to Europe (mainly the Netherlands); from Central Asia to East Europe (notably the Russian Federation); and from South America (mostly Colombia) to North America (mainly the USA). Close to two thirds of global cannabis herb seizures were made in North America (64%) in 25, notably by the authorities of Mexico (1,781 mt) and the United States (1,112 mt). This reflects the magnitude of the North American cannabis market, both in terms size and of enforcement effort. The next largest cannabis herb seizures were made in Africa, accounting for 18 per cent of global seizures. The largest seizures here were reported by South Africa (292 mt), Tanzania (15 mt) and Nigeria (126 mt). South America, including the Caribbean and Central America, accounted for 11 per cent of global cannabis herb seizures. The main seizures in this region were reported by Brazil (152 mt), Colombia (129 mt) and Paraguay (67 mt). Cannabis herb seizures made in Asia accounted for 5 per 15
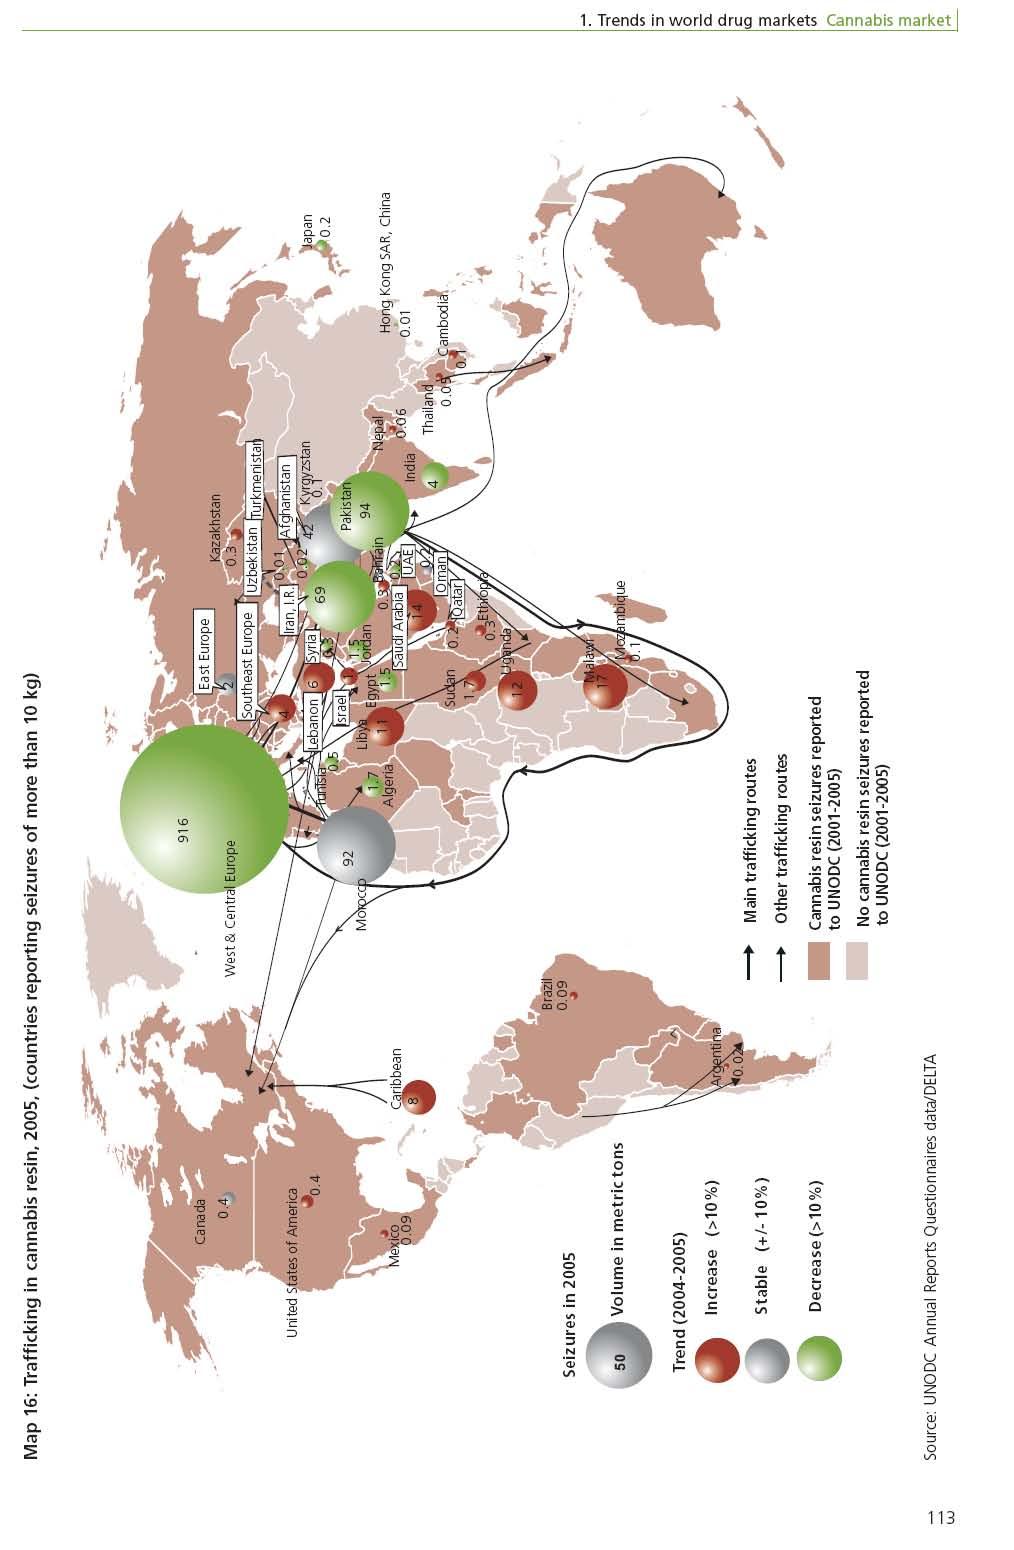
12 World Drug Report 27 Fig. 81: Distribution of global cannabis herb seizures in 25 (N=4,644 ) Fig. 82: Regional breakdown of cannabis herb seizures, Asia 5% Africa 18% Oceania Europe % 2% 8, 7, 6, 5, 4, 3, 2, 1, Metric tons South America ('non-nafta') 11% North America ('NAFTA') 64% Africa Asia Oceania Europe South America ('non-nafta') North America ('NAFTA') Trend Source: UNODC, Annual Reports Questionnaire Data / DELTA Source: UNODC, Annual Reports Questionnaire Data / DELTA. cent of the world total. The largest seizures here were reported by India (147 mt), Indonesia (23 mt) and Kazakhstan (22 mt). Europe s cannabis herb seizures were equivalent to 2 per cent of the world total. The largest seizures were made by the Russian Federation (3 mt) and the UK (21 mt) 1. Europe is the only region which also imports significant amounts of cannabis from other regions. The overall decline of cannabis herb seizures in 25 (- 35%) meant that they were at their lowest level since A decline in cannabis herb seizures was reported from several regions: Oceania (-6%), North America (- 11%), Europe (-39%) and Africa (-71%). Seizures were reported to be increasing, however, by countries of South America (+4%) and Asia (+9%). Trafficking in cannabis resin Global cannabis resin seizures decline, notably in West and Central Europe In terms of quantities seized (13 mt in 25), cannabis resin is the second most widely trafficked drug worldwide, after cannabis herb. Resin seizures were reported in 14 countries in 25, which is 63 per cent of all countries reporting seizures to UNODC. The geographical scope of cannabis resin trafficking is thus more limited than for herb trafficking. In contrast to herb, trafficking in resin is not intraregional but, significantly inter-regional. This applies, in particular, to trafficking of resin from North Africa (Morocco) to West and Central Europe, from Central Asia to East Europe (notably the Russian Federation) and from the Caribbean (notably Jamaica) to North America (notably Canada). Global cannabis resin seizures declined by 11 per cent in 25. Most of the decline, in absolute terms, was due to lower seizures reported by countries of West & Central Europe (-15%). This was linked to the decline of cannabis resin production in Morocco in 24 and 25. Data on individual seizures collected by the World Customs Organization (WCO) 2 in West Europe show that resin seizures declined by a further 3 per cent in 26. Most of the decline, in both 25 and 26, was reported from Spain and France. In 25 Cannabis resin seizures made in North Africa increased slightly on a year earlier (+6%), but were still 5 per cent lower than in 23 and 25 per cent lower than in 2. For 26, WCO data on individual seizures 3 suggest that resin seizures declined by 18 per cent. 1 Data for 24; no UK seizure data for the year 25 are available as yet.xxxxxxxxxxxxxxxxxxxxxxxxxxxxxxxxxxxxxxxxxxxxxxxxxxxxxxxxxxxxxxxxxxxx 2 World Customs Organization, Individual Drug Seizure Database, 27 April World Customs Organization, Individual Drug Seizure Database, 27 April
13 1. Trends in world drug markets Cannabis market Fig. 83: Global seizures of cannabis herb, , 7,5 7, 6,5 6, 5,5 5, 4,5 4, 3,5 3, 2,5 2, 1,5 1, Year Metric tons SEIZURES OF CANNABIS HERB in % of world total and kg- HIGHEST RANKING COUNTRIES , 4, 6, 8, 1,, 1,2, 1,4, 1,6, 1,8, 2,, Mexico 38% 1,781,64 USA South Africa 6% 292,187 24% 1,112,7 Brazil Tanzania, U.R. India Colombia Nigeria Morocco Egypt Paraguay Canada Argentina Bolivia Russian Federation Indonesia Kazakhstan United Kingdom Venezuela Jamaica Zambia Ghana (a) 3% 151,632 3% 15,45 3% 147,336 3% 128,957 3% 125,989 3% 115, 2% 78,84 South America 447,127 (1%) 66,964 56,226 36,482 34,557 3,618 22,836 21,733 21,491 18,28 17,654 17, 14,285 SEIZURES OF CANNABIS HERB in kg and % - BY REGION - 25 North America - Southern Africa 33,242 North Africa 193,84 East Africa 162,876 West and Central Africa 161,616 (4%) South Asia 154,79 (3%) West & Central Europe 54,842 East and South-East Asia 48,651 Caribbean 42,415 East Europe 31,82 Central Asia and Transcaucasian countries 25,636 Southeast Europe Central America Oceania Near and Middle East /South-West Asia 19,756 17,428 3,514 1,23 5, 1,, 1,5, 2,, 2,5, (7%) (4%) (4%) 3,, 3,5, 2,949,297 (64%) (a) data refer to 24 17
14 World Drug Report 27 Fig. 84: Global seizures of cannabis herb, CANNABIS HERB INTERCEPTED - WORLD CANNABIS HERB INTERCEPTED - ASIA CANNABIS HERB INTERCEPTED - AMERICAS CANNABIS HERB INTERCEPTED - EUROPE CANNABIS HERB INTERCEPTED - AFRICA CANNABIS HERB INTERCEPTED - OCEANIA
15
16 World Drug Report 27 Seizures also declined in the Near & Middle East / South-West Asia sub-region (-16% in 25). In contrast, there was an almost tenfold increase of cannabis resin seizures in the Americas (notably in the Caribbean). But, as a whole, the Americas still account for less than 1 per cent of world resin seizures. but West and Central Europe remains the largest cannabis resin market The world s largest cannabis resin market continues to be West and Central Europe, with the bulk of global seizures (71%) made there. Spain accounts for 73 per cent of all European cannabis resin seizures, ahead of France (9%), the UK (7% in 24), Portugal (3%) and Italy (2½ %). Spain plays a key role in limiting the supply of cannabis resin for the European market. The next largest resin seizures were made in the Near & Middle East / South-West Asia region (18% of the world total). The largest seizures here were reported by Pakistan (4% of all Asian cannabis resin seizures), followed by Iran (3%) and Afghanistan (18%). The Near East (defined as the Arabian peninsula, Lebanon, Syria, Jordan, Israel and Iraq) accounted for 1 per cent of cannabis resin seizures made in Asia; the remaining 2 per cent were made in other parts of Asia. North Africa accounted for 8 per cent of global seizures. Including other parts of Africa, total cannabis resin seizures in Africa add up to 1 per cent of the world total. The largest seizures here were reported by Fig. 87: Regional breakdown of cannabis resin seizures, Metric tons 1,5 1, Other Near & Middle East /South-West Asia North Africa West & Central Europe Source: UNODC, Annual Reports Questionnaire Data / DELTA. 25 Morocco, accounting for 67 per cent of all African cannabis resin seizures or 85 per cent of all cannabis resin seizures made in North Africa in 25. Fig. 86: Distribution of global cannabis resin seizures in 25 (N = 1,32 ) North Africa 8% Near & Middle East /South-West Asia 18% Southern Africa 1% West & Central Europe 71% Other 4% East Africa 1% Caribbean 1% Other 1% Source: UNODC, Annual Reports Questionnaire Data / DELTA. 11
17 1. Trends in world drug markets Cannabis market Fig. 88: Global seizures of cannabis resin, Year Metric tons SEIZURES OF CANNABIS RESIN in % of world total and kg- HIGHEST RANKING COUNTRIES , 2, 3, 4, 5, 6, 7, 8, Spain Pakistan Morocco France Iran United Kingdom (a) 7% 93,539 7% 92,423 6% 83,471 5% 68,836 5% 64,96 Afghanistan 3% 42,389 Portugal Italy Malawi Saudi Arabia Netherlands Uganda Libya 2% 28,258 2% 23,185 16,853 13,575 12,9 12, 11,321 Greece Ireland 1,29 8,639 Belgium 6,394 Lebanon 5,945 Netherlands Antilles Turkey India Germany Bahamas Russian Federation Algeria Sudan Egypt Jordan Denmark Norway Sweden 5,484 4,72 3,964 3,637 2,389 2,11 1,68 1,663 1,529 1,485 1,46 1,352 1,266-1, 2, 3, 51% 4, 5, West & Central Europe Near and Middle East /South-West Asia 227,933 (17%) North Africa Southern Africa East Africa Caribbean Southeast Europe South Asia East Europe North America Central Asia and Transcaucasian countries East and South-East Asia South America Oceania West and Central Africa 19,145 16,948 12,334 7,879 4,167 4,29 2, (8%) Central America 6, 7, 669,74 SEIZURES OF CANNABIS RESIN in kg and % - BY REGION , 9, 1,, 915,665 (7%) (a) data refer to
18 World Drug Report 27 Fig. 89: Global seizures of cannabis resin, CANNABIS RESIN INTERCEPTED - WORLD CANNABIS RESIN INTERCEPTED - ASIA CANNABIS RESIN INTERCEPTED - AMERICAS CANNABIS RESIN INTERCEPTED - EUROPE CANNABIS RESIN INTERCEPTED - AFRICA CANNABIS RESIN INTERCEPTED - OCEANIA
19
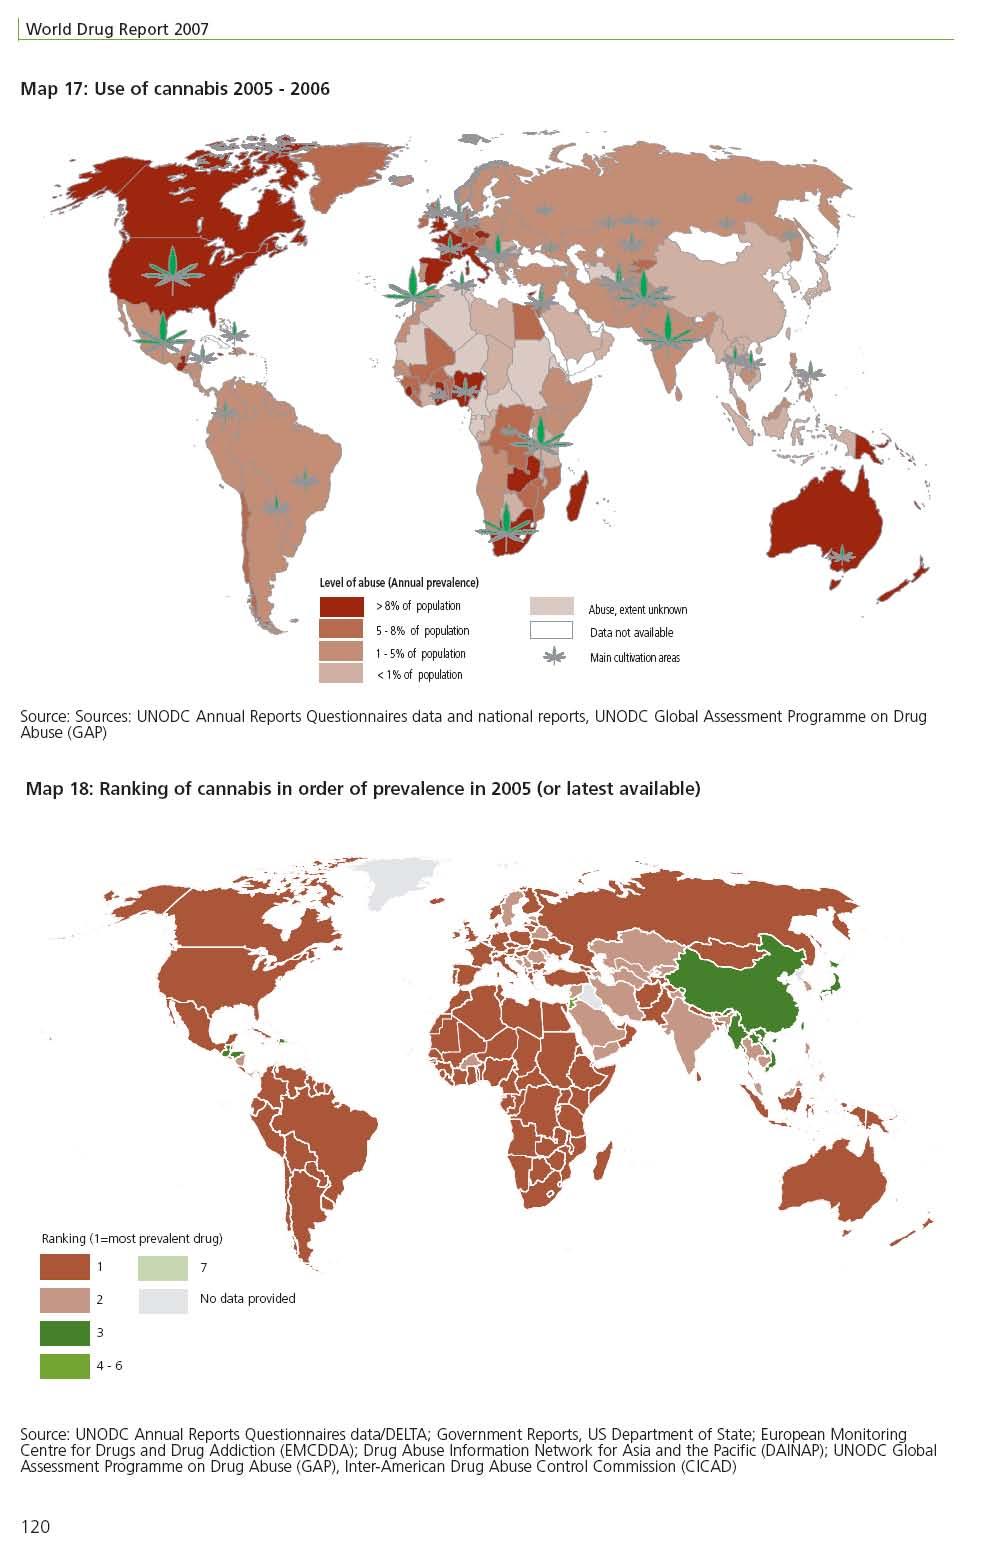
20 World Drug Report Abuse Cannabis remains the most widely used drug worldwide... Fig. 9: Cannabis consumption in 25 regional breakdown (N = million) Cannabis remains by far the most commonly used drug in the world. Almost 16 million people used cannabis in 25, equivalent to 3.8 per cent of the global population aged 15 to 64. Europe 19% Oceania 2% Asia 31% In relative terms, cannabis use is most prevalent in Oceania (15.8%), followed by North America (1.7%), Africa (7.7%) and West and Central Europe (7.4%). The highest rates within Africa are found in West and Central Africa (13%) and in southern Africa (8.5%). Asia has the lowest prevalence rates (1.9%), reflecting low levels reported from East and South-East Asia (.9%). For South Asia, estimates show an average prevalence rate of 3.2 per cent; for the Near and Middle East region 3.5 per cent and for Central Asia 4.2 per cent, i.e. all regions in Asia, except for East-South-East Asia, are close to the global average. Americas 24% Africa 24% Sources: UNODC, Annual Reports Questionnaire Data, UNODC Field Offices, UNODC Drug Abuse Information Network for Asia and the Pacific (DAINAP), UNODC Global Assessment Programme on Drug Abuse (GAP), Govt. reports, EMCDDA, CICAD, HONLEA reports, local studies, UNODC estimates. Fig. 12: Annual prevalence of cannabis use, 25 or latest year available No. of users in % of population years EUROPE 3,5, 5.6 West & Central Europe 23,4, 7.4 South-East Europe 1,7, 2. Eastern Europe 5,4, 3.8 AMERICAS 37,6, 6.5 North America 3,9, 1.7 South America 6,7, 2.3 ASIA 49,1, 1.9 OCEANIA 3,4, 15.8 AFRICA 38,2, 7.7 GLOBAL 158,8, 3.8 Above global average Around global average Below global average Sources: UNODC, Annual Reports Questionnaire Data, UNODC Field Offices, UNODC Drug Abuse Information Network for Asia and the Pacific (DAINAP), UNODC Global Assessment Programme on Drug Abuse (GAP), Govt. reports, EMCDDA, CICAD, HONLEA reports, local studies, UNODC estimates. 114
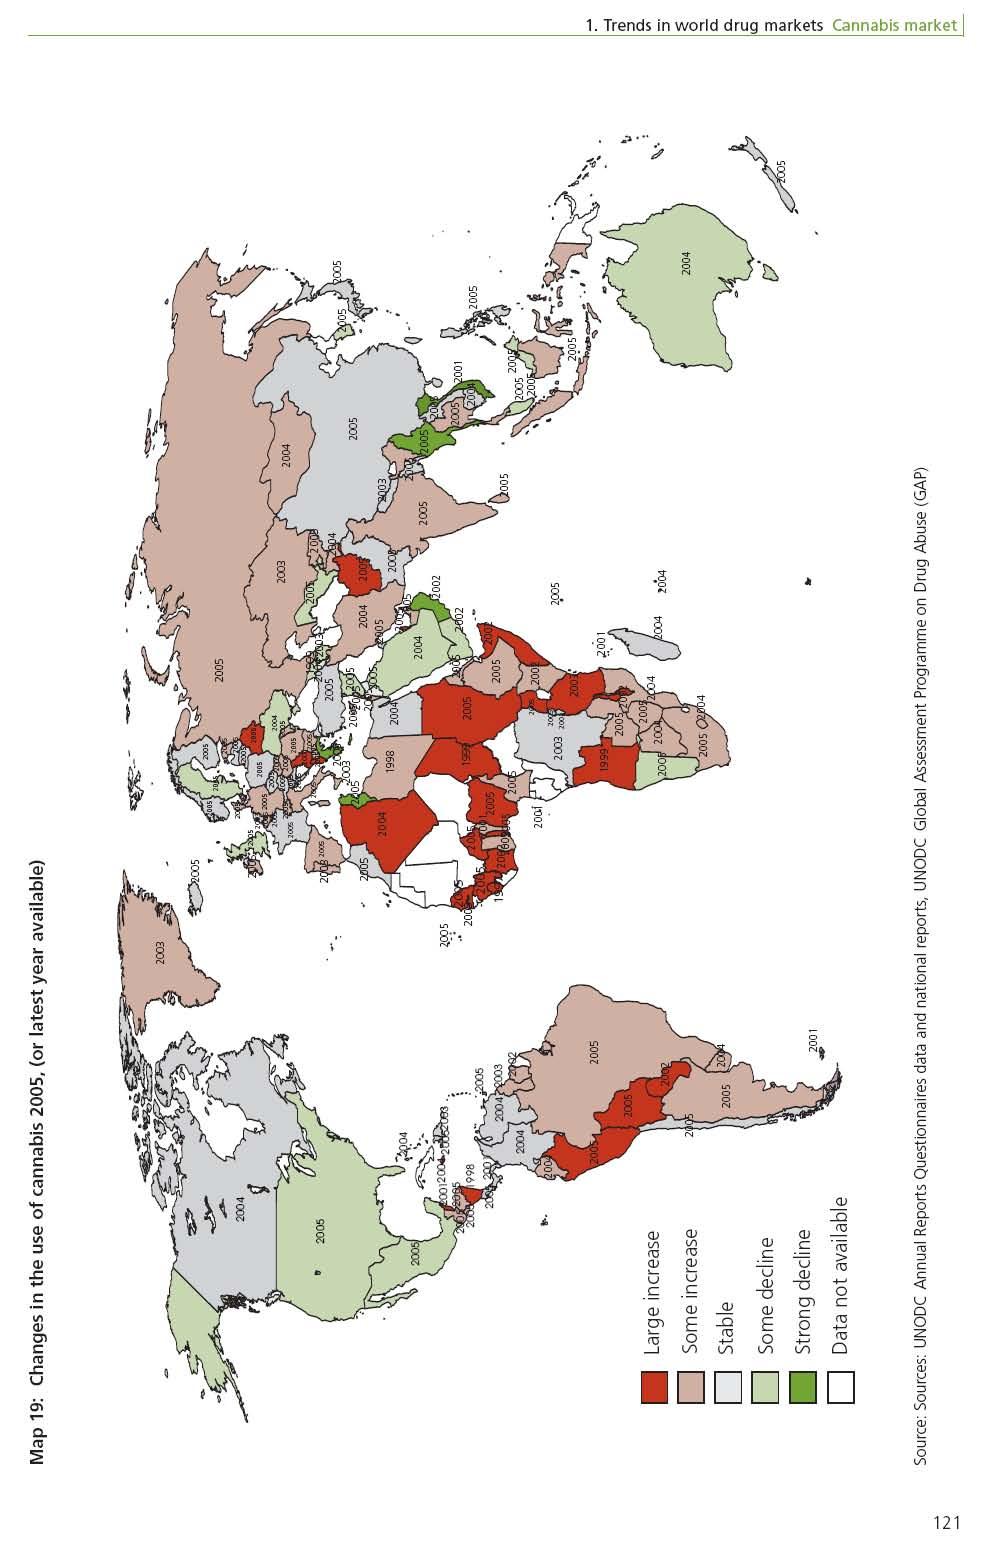
21 1. Trends in world drug markets Cannabis market In absolute terms, 49 million cannabis users, almost a third of the estimated total, live in Asia. Africa, with 38 million and the Americas, also with 38 million, each account for a about a quarter of global cannabis use. Europe, with about 3 million users, accounts for a fifth of global cannabis use and Oceania for 2 per cent. but the recent trend is difficult to measure After years of increases, this year s cannabis use estimates of 159 million people are slightly lower than those published in last year s World Drug Report (162 million). It would be premature, however, to categorize this as a downward trend. Some of the lower figures come from a few new household surveys. They replace previous UNODC estimates which were slightly higher. At the same time, the new survey results did not, in general, show a further growth in cannabis use. There thus appears to be a general stabilization in cannabis use. In contrast to this, the trend indicator, which shows the perceptions of experts and officials in Member States, suggests that cannabis use continued to grow in 25. It is difficult to evaluate the accuracy of these perceptions. It can be argued that it is harder to report against a long-standing and generally accepted trend in this case the trend of virtually universal increases in cannabis use over the last decade. Such perceptions do not change easily, even when new data, for instance from household surveys, would appear to indicate an improving situation. There could be thus some bias towards reporting an ongoing increase in cannabis use, and this has to be taken into account when interpreting the perception trend indicator for cannabis. The general rise in the cannabis trend indicator was due to increasing cannabis use perceived by the authorities in most of Africa, several parts of Asia (South-Asia, South-West Asia and Central Asia) and most of South America. This more than offset declines perceived in North America and some European countries, as well as the stabilization or declines perceived in several countries of East and South-East Asia. Trend data for Oceania suggest stabilization at lower levels, after cannabis use had fallen for several years, though there are some indications that the downward trend in the region actually continued. Cannabis use trends in Europe showed a mixed picture, with increases perceived in East and South-East Europe and stabilization or decline reported from several West European countries. Over the 1992 to 25 period, the cannabis trend indicator shows that the rates of increase were similar in the Americas, in Europe and in Africa. Over time, however, the patterns differed. Following increases in the Americas in the 199s, the trend stabilized and a net decline Fig. 91: Cannabis use trends as perceived by experts: regional contribution to global change, Baseline: 1992 = Americas Europe Oceania Africa Asia Sources: UNODC, Annual Reports Questionnaire Data, UNODC Field Offices, UNODC Drug Abuse Information Network for Asia and the Pacific (DAINAP), UNODC Global Assessment Programme on Drug Abuse (GAP), Govt. reports, EMCDDA, CICAD, HONLEA reports, local studies,unodc estimates. Fig. 92: Cannabis use trends as perceived by experts - regional changes, Baseline: 1992 = Americas Europe Asia 24 Africa Oceania Global Sources: UNODC, Annual Reports Questionnaire Data, UNODC Field Offices, UNODC Drug Abuse Information Network for Asia and the Pacific (DAINAP), UNODC Global Assessment Programme on Drug Abuse (GAP), Govt. reports, EMCDDA, CICAD, HONLEA reports, local studies,unodc estimates. 115
22 World Drug Report 27 was reported for 25. Europe and Africa showed an upward trend throughout the period with Africa showing higher growth rates in recent years. For Asia, the indicator shows, in contrast, lower than average increases. This was due to an apparent decline in the popularity of cannabis in the late 199s. In the new millennium this changed and Asia, together with Africa, showed some of the strongest increases in recent years. Starting from high levels, Oceania showed higher than average increases in the 199s, but a clear downward trend thereafter. Oceania is thus the only region in the world where the cannabis consumption fell back to levels reported in the early 199s. Cannabis use continues declining in North America Cannabis use among 12 th graders in the USA declined by 18 per cent between 1997 and 26 and is significantly lower than three decades ago (-29%). As compared to the peak in 1979, annual prevalence data for 12 th graders show a decline of 38 per cent. A strong decline in cannabis use was also reported among high-school students in Ontario (-19% over the period). The previous upward trend was thus reversed. A decline was also noticed for cannabis use among the general population. General population household survey data show that cannabis use in the USA declined from 11 per cent in 22 to 1.4 per cent in As compared to the peak in 1979 (16.6%) 2, cannabis use is 37 per cent lower. Declines in cannabis use were also reported from Mexico for the year 25. but increases in South America A clear increase in cannabis use was reported from countries in South America. Seven countries reported rising use in 25 and only one country reported a decline. Nine countries described the situation as stable. The rate of increase thus appears to have declined: a year earlier 11 countries reported rising levels of cannabis use. The most important increase though starting from very low levels was reported from the continent s largest country, Brazil. This probably reflects increased availability of cannabis products from neighbouring Paraguay. The annual prevalence of cannabis use increased from 1 per cent in 21 to 2.6 per cent in and shows a mixed picture in Europe with stabilization/decline in the main West European markets The majority of countries of West and Central Europe (14) reported cannabis use has stabilized. Nonetheless, Fig. 93: Annual prevalence among high-school students in the USA and in Ontario, Canada, Annual prevalence in per cent Ontario 7-11th graders USA 12th graders Sources: NIDA, Monitoring the Future, 26 and CAMH, Ontario Drug Use Survey SAMHSA, 25 National Survey on Drug Use & Health, Rockville MD, Sept. 26. xxxxxxxxxxxxxxxxxxxxxxxxxxxxxxxxxxxxxxxxxxxxxxxxxxxxx 2 Data quoted in SAMHSA, Preliminary Results from the 1996 Household Survey on Drug Abuse, August CEBRID, Il Levantamento Domiciliar sobre o Use de Drogas Psicotrópicas no Basil: Estudo Envolvendo as 17 Maiores Cidades do País, Sao Paolo 22; CEBRID, Il Levantamento Domiciliar sobre o Uso de Drogas Psicotrópicas no Basil: Estudo Envolvendo as 18 Maiores Cidades do Pais, Sao Paolo
23 1. Trends in world drug markets Cannabis market Fig. 94: Spain: annual prevalence of cannabis use among the general population (age 15-64), Fig. 96: France: annual prevalence of cannabis use among the general population (age 15-64), Annual prevalence in per cent Annual prevalence in per cent cannabis Trend cannabis Trend Sources: EMCDDA and UNODC, Annual Reports Questionnaire Data. Sources: EMCDDA and UNODC, Annual Reports Questionnaire Data. the number of countries reporting increases (11) was still nearly double those reporting declines (6). In Europe s main cannabis markets, however, cannabis has now either stabilized or started to decline. Growing awareness of the negative effects of the high THC cannabis found in many European markets seems to have contributed to this stabilization/decline. The authorities in Spain, one of Europe s largest cannabis markets, still reported some increase in cannabis use for the year This perception, however, may be too pessimistic. Household survey data actually indicate stabilization of the market from 23 to 25 (11.3% in 23 and 11.2% in 25), following strong growth over the period. The stabilization went in parallel with a growing awareness of the dangers of cannabis use among young people in Spain. 5 Authorities in France reported a stabilization of cannabis use. Analysis of national household surveys in Fig. 95: England & Wales: annual prevalence of cannabis use among the general population (age 16-59) and among youth (16-24), Annual prevalence in per cent 3.% 27.% 26.% 26.2% 28.2% 25.% 27.3% 25.3% 23.6% 2.% 21.4% 15.% 1.5% 1.9% 9.5% 9.7% 1.% 1.3% 1.6% 1.8% 8.7% 5.%.% Source: UK Home Office, British Crime Survey, 25/6, London 26. Youth (age 16-24) General population (age 15-64) 4 UNODC, Annual Reports Questionnaire Data for the year 25 for Spain. XXXXXXXXXXXXXXXXXXXXXXXXXXXXXXXXXXXXXXXXXX 5 A study done by Eurobarometer among year olds in Spain found the perception that occasional use of cannabis was harmless falling from 44 per cent in 22 to 31 per in cent in 24. European Commission, Eurobarometer, Young people and drugs, Brussels, June 24). 117
24 World Drug Report 27 the country suggests, however, that cannabis use declined. Annual prevalence fell from 9.8 per cent in 22 to 8.6 per cent in 25 and is almost back to the levels reported at the beginning of the new millennium. The decline in France also went in parallel with a growing awareness of the dangers of cannabis use among young people. 6 For the United Kingdom, which was Europe s largest cannabis market for many years, cannabis use is now showing a downward trend. Use among the general population (age 16-59) declined in England and Wales from 1.8 per cent in 23/4 to 8.7 per cent in 25/6. Including data from Scotland and Northern Ireland, the UK has now a prevalence rate of 8.4 per cent and thus ranks behind Spain and France. The downward trend among young people in England and Wales appears to have started shortly after 1998, as the UK drug prevention budget was expanded and a number of new activities targeting youth became operational. The trend then became more pronounced in the new millennium, probably because extensive discussion about re-scheduling cannabis brought new scientific findings on the potential harm of cannabis into the Fig. 97: Sweden: life-time prevalence of cannabis use among military recruits Prevalence in per cent Source: Swedish Council on Information on Alcohol and other Drugs (CAN). limelight. Growing awareness of the dangers of cannabis use among young people 7 went in parallel with declining cannabis use. Most of the stabilization or decline in Europe was in the mature and saturated cannabis markets. There have also been some positive exceptions, notably among the Nordic countries. Data for Finland show stabilization of cannabis use among the general population at a level of 2.9 per cent between 22 and 24. Similarly, in Norway cannabis use remained de-facto unchanged in recent years (4.5% in 1999, 4.6% in 24). Even though Sweden already has among the lowest levels of cannabis use in Europe, data show some declines. Lifetime prevalence of cannabis use among military recruits (typically age 18), declined from 16.7 per cent in 22 to 12.6 per cent in 25. Annual prevalence of cannabis use among the general population declined from 2.2 per cent in 24 to 2. per cent in 25. Cannabis use shows an upward trend in Africa... A total of 17 African countries reported rising levels of cannabis use in 25, and only 4 countries saw a decline; a further 4 countries described the cannabis situation as stable. As compared to a year earlier, the upward trend appears to have lost at least some of its momentum. For 24, 2 countries saw cannabis use rising, only 3 reported a decline and 4 reported stabilization. while the situation in Asia is more complex The cannabis trend indicator, weighted by the cannabis using population, showed a clear upward trend for Asia in 25. In terms of the number of countries reporting changes in cannabis use, however, the picture is more complex. In fact, only 8 countries reported rising cannabis use for 25, while 12 reported a decline and a further 12 saw their cannabis markets as stable. Data from Thailand, one of the few countries in the region which conducts regular household surveys, show that the annual prevalence of cannabis use among the general population (age 12-65) declined from 1.5 per cent in 21 to.9 per cent in Several other countries in East and South-East Asia may well have similar patterns. 6 A study done by Eurobarometer among year olds in France found the perception that occasional use of cannabis was harmless falling from 48 per cent in 22 to 3 per in cent in 24, the strongest decline observed in Europe. (European Commission, Eurobarometer, Young people and drugs, Brussels, June 24.) 7 While 47 per cent of youth (age 15-24) in the UK considered the occasional use of cannabis to be harmless in 22, this proportion declined to 4 per cent by 24. (European Commission, Eurobarometer, Young people and drugs, Brussels, June 24.) 8 UNODC (Regional Centre for East Asia and the Pacific), Amphetamine-type Stimulants in East Asia and the Pacific: Analysis of 23 Regional ATS Questionnaire, Bangkok 24 and UNODC (Regional Centre for East Asia and the Pacific), Drug Abuse Information Network for Asia and the Pacific (DAINAP),
25 1. Trends in world drug markets Cannabis market Fig. 98: Australia: annual prevalence of cannabis use among the general population (age 14+), Fig. 99: Australia: cannabis use among secondary school students (age 12-17) in Australia, Annual prevalence in per cent of population Source: Australian Institute of Health and Welfare, The 24 National Drug Strategy Household Survey. Prevalence in % Life-time prevalence Past month prevalence Trend - life-time prevalence Trend - past month prevalence Source: The Cancer Council Victory, Australian secondary school students' use of over-the-counter and illicit substances in 25, June 26 7 and a clear downward trend is observed in Oceania The Australian Household Survey data show that cannabis use declined by some 37 per cent between 1998 and 24 and use levels are now below those in Though changes in the methodology may, to some extent, hinder direct comparison between 1998 and 21, there is hardly any doubt that a significant decline has occurred since the late 199s. Student surveys, conducted in regular intervals between 1996 and 25, show an even stronger decline, from a monthly prevalence rate of 18 per cent in 1996 to 7 per cent in 25, which would indicate that school prevention programmes have been working. While general population data show that cannabis use is still marginally higher in Australia than in the USA (1.6% in 24), Australian school survey data 9 show that cannabis prevalence among high-school students is lower than in the USA (31.8% life-time and 13.9% monthly prevalence among 8-12th graders in the USA, 25; 18% life-time and 7% monthly prevalence among secondary school students aged in Australia, 25). The opposite was true a decade earlier. Though there are no definitive explanations for the decline, it appears that, as in other parts of the world, cannabis is beginning to loose some of its benign image among young people. 9 The Cancer Council Victoria, Report for Drug Strategy Branch, Dept of Health and Ageing, Government of Australia, Australian secondary school students use of over-the-counter and illicit substances in 25, June
26
27
1.4 Cannabis Market Summary Trend Overview
 1.4 Cannabis Market 1.4.1 Summary Trend Overview The cannabis market has remained basically stable overall, but is experiencing some interesting developments. While estimates for cannabis herb production
World Drug Report 2008: Paraguay
 World Drug Report 2008: Paraguay p. 73 Seizures fell in South America and the Caribbean in 2006 Large seizures in South America are also undertaken by Venezuela (39 mt), Ecuador (34 mt), Peru (19 mt) and
WORLD DRUG REPORT 2011
 WORLD DRUG REPORT 2011 EXECUTIVE SUMMARY Global developments in illicit drug consumption, production and trafficking Consumption Globally, UNODC estimates that, in 2009, between 149 and 272 million people,
1.1 Overview Evolution of the World Drug Problem
 1.1 Overview 1.1.1 Evolution of the World Drug Problem Vigilance is needed to respond to year-onyear expansion in some market sectors The long-term stabilization which occurred in drug markets continued
C. CANNABIS MARKET. Global cannabis cultivation and production
 24 1. RECENT STATISTICS AND TREND ANALYSIS OF ILLICIT DRUG MARKETS from Thailand and Uganda also indicate trafficking of amphetamine from West Africa via Ethiopia, raising the possibility of a parallel
Economic and Social Council
 United Nations Economic and Social Council Distr.: General 17 December 2003 E/CN.3/2004/6 Original: English Statistical Commission Thirty-fifth session 2-5 March 2004 Item 3 (e) of the provisional agenda*
Part 1 RECENT STATISTICS AND TREND ANALYSIS OF ILLICIT DRUG MARKETS A. EXTENT OF ILLICIT DRUG USE AND HEALTH CONSEQUENCES
 References to Brazil Part 1 RECENT STATISTICS AND TREND ANALYSIS OF ILLICIT DRUG MARKETS A. EXTENT OF ILLICIT DRUG USE AND HEALTH CONSEQUENCES The global picture Cocaine In 2010, the regions with a high
PREFACE. Antonio Maria Costa Executive Director United Nations Office on Drugs and Crime
 EXECUTIVE SUMMARY GLOBAL ILLICIT DRUG TRENDS 2003 PREFACE At the twentieth special session of the General Assembly in, States Members agreed to make significant progress towards the control of supply
1.3 Coca / Cocaine Market
 1.3 Coca / Cocaine Market 1.3.1 Summary Trend Overview Although the coca/cocaine market is stable overall, it has experienced considerable fluctuations over the 26/7 period. On the supply side, coca cultivation
The Drugs Scenario - Global, Regional and National
 The Drugs Scenario - Global, Regional and National 1. The growing demand for narcotic drugs and psychotropic substances in the world is being met by an increase in their production through a proliferation
EMBARGOED UNTIL 22 JUNE PM CEST (GMT+2)
") FACT SHEET ON STATISTICS AND TRENDS IN ILLICIT DRUGS Global estimates of drug use All illicit drug use Problem drug use** Annual prevalence (%)* 5.3 (3.3-7.3) 0.6 (0.3-0.9) Number of users (millions)*
FACT SHEET ON STATISTICS AND TRENDS IN ILLICIT DRUGS Global estimates of drug use All illicit drug use Problem drug use** Annual prevalence (%)* 5.3 (3.3-7.3) 0.6 (0.3-0.9) Number of users (millions)*
E. COCAINE: OVERVIEW. Cultivation and production. Seizures
 34 1. RECENT STATISTICS AND TREND ANALYSIS OF THE ILLICIT DRUG MARKET limited data are available. In Afghanistan, a survey in urban households showed that over half the women surveyed who reported opioid
Executive Summary. 1. Trends in World Drug Markets
 1. Trends in World Drug Markets 1.1 Overview Evolution of the world drug problem The world s drug problem is being contained. In 2005/06, the global markets for the main illicit drugs the opiates, cocaine,
References to Argentina Part 1 RECENT STATISTICS AND TREND ANALYSIS OF ILLICIT DRUG MARKETS
 References to Argentina Part 1 RECENT STATISTICS AND TREND ANALYSIS OF ILLICIT DRUG MARKETS A. EXTENT OF ILLICIT DRUG USE AND HEALTH CONSEQUENCES The global picture Cocaine In 2010, the regions with a
REGIONAL HIGHLIGHTS AFRICA AMERICAS. Central America and the Caribbean. INTERNATIONAL NARCOTICS CONTROL BOARD Report 2017
 REGIONAL HIGHLIGHTS AFRICA Increase in drug use: while Africa remains a key transit region for drug trafficking, the use of various types of drugs, including cocaine, opioids, amphetamine-type stimulants,
WORLD DRUG REPORT 2004 WORLD DRUG REPORT. presented by Thomas Pietschmann UNODC, Research and Analysis Section
 WORLD DRUG REPORT 2004 presented by Thomas Pietschmann UNODC, Research and Analysis Section 1 OVERVIEW: ALL DRUGS CONSUMPTION 2 Estimates of annual prevalence of drug use at the global level in the late
STATISTICS AND ANALYSIS ON SUPPLY OF AND TRAFFICKING IN NARCOTIC DRUGS AND PSYCHOTROPIC SUBSTANCES 1996
 STATISTICS AND ANALYSIS ON SUPPLY OF AND TRAFFICKING IN NARCOTIC DRUGS AND PSYCHOTROPIC SUBSTANCES 1996 The United Nations International Drug Control Programme wishes to express its appreciation for responses
Drug Prices Report Opioids Retail and wholesale prices * and purity levels,by drug, region and country or territory (prices expressed in US$ )
") 1 / 11 Region/Subregion/ Country Africa Eastern Africa Kenya Madagascar Mauritius Uganda United Republic of Tanzania Northern Africa Algeria Egypt Libya Morocco Sudan Southern Africa Botswana Burkina Faso
1 / 11 Region/Subregion/ Country Africa Eastern Africa Kenya Madagascar Mauritius Uganda United Republic of Tanzania Northern Africa Algeria Egypt Libya Morocco Sudan Southern Africa Botswana Burkina Faso
Angela Me Chief Statistics and Survey Section UNODC
 European Parliament Special Committee on organized crime, corruption and money laundering Brussels, 11-12 July 2012 Angela Me Chief Statistics and Survey Section UNODC No significant change in global status
Introduction Overview of the status quo
 Introduction Whenever we learn that a government has prohibited the use or sale of certain goods, there is one thing we can be sure of - sooner or later, people willing to break the law will take advantage
310,891 ha million. 526 tons 7,554 tons million. Global cultivation. Global seizures. Potential production. Global number of users
 Opiates 41 G. MARKET ANALYSIS BY TYPE OPIATES Key figures Global cultivation change from previous year 5% 634 tons Global seizures five-year change 47% 5% Stable morphine opium heroin most recent estimate
Executive Summary. 1. Trends in World Markets. 1.1 Overview
 Executive Summary 1. Trends in World Markets 1.1 Overview The long-term stabilization of world drug markets continued into 2007, although notable exceptions occurred in some critical areas. As long term
Drug Use Around the World
 Special Agents U.S. DRUG ENFORCEMENT AGENCY STAFFING AND BUDGETS 1975 2000 10000 5000 Total Employees 8000 6000 4000 3000 2000 4000 1975 1980 1985 1990 1995 2000 1000 1975 1980 1985 1990 1995 2000 Support
References to Uruguay
 References to Uruguay Part 1 RECENT STATISTICS AND TREND ANALYSIS OF ILLICIT DRUG MARKETS A. EXTENT OF ILLICIT DRUG USE AND HEALTH CONSEQUENCES The global picture Regional trends in illicit drug use South
World Drug Report 2018 Methodology Report. Research and Trend Analysis Branch UNODC, Vienna
 World Drug Report 2018 Methodology Report Research and Trend Analysis Branch UNODC, Vienna Table of Contents 1. Introduction... 1 Sources of information... 1 2. Data on drug use and health consequences
Drug Money: the illicit proceeds of opiates trafficked on the Balkan route. Executive summary
 Drug Money: the illicit proceeds of opiates trafficked on the Balkan route Executive summary 2015 Executive summary The cultivation, production and trafficking of illicit opiates accounted for almost
Seizures of ATS (excluding ecstasy ), 2010
, 2010") Seizures of ATS (excluding ecstasy ), 2010 (countries and territories reporting seizures* of more than 10 kg) 9 5.1 8.7 12.9 Ghana Armenia 0.7 9.9 1 2.1 Syrian Arab Republic Korea (Republic of) Iraq Islamic
Seizures of ATS (excluding ecstasy ), 2010 (countries and territories reporting seizures* of more than 10 kg) 9 5.1 8.7 12.9 Ghana Armenia 0.7 9.9 1 2.1 Syrian Arab Republic Korea (Republic of) Iraq Islamic
Lima - Peru, August 18-22, 2014
 2014 GLOBAL SYNTHETIC DRUGS ASSESSMENT Amphetamine-type stimulants and new psychoactive substances Lima - Peru, August 18-22, 2014 Juan Carlos Araneda Ferrer Project Coordinator Global SMART Programme
Annual prevalence estimates of cannabis use in the late 1990s
 Cocaine abuse in most east European countries, by contrast, is still far less widespread and less of a problem. A majority of countries in eastern Europe either did not report on cocaine at all, or they
: UNODC Cooperation on Drugs and Crime in the Islamic Republic of Iran
 History and Achievements 1999-2004: Beginning of UNODC Cooperation with the Islamic Republic of Iran The United Nations Office on Drugs and Crime in the Islamic Republic of Iran established a country office
THE CARE WE PROMISE FACTS AND FIGURES 2017
 THE CARE WE PROMISE FACTS AND FIGURES 2017 2 SOS CHILDREN S VILLAGES INTERNATIONAL WHERE WE WORK Facts and Figures 2017 205 58 79 families and transit 31 Foster homes 162 8 3 173 214 2 115 159 136 148
Methodology World Drug Report 2017
 Methodology World Drug Report 2017 Considerable efforts have been made over the years to improve the estimates presented in the World Drug Report, which rely, to a large extent, on information submitted
EMBARGOED UNTIL 26 JUNE AM EDT (5 PM CEST)
") B. COCAINE Global cultivation change from previous year 36% Global seizures change from previous year 23% most recent estimate () 213, ha coca bush = 298, x 1,129 tons cocaine purity as seized Global production
B. COCAINE Global cultivation change from previous year 36% Global seizures change from previous year 23% most recent estimate () 213, ha coca bush = 298, x 1,129 tons cocaine purity as seized Global production
World Drug Report 2017
 World Drug Report 2017 DEMAND Global trends in estimated number of drug users and people with drug user disorders, 2006-2015 Global trends in the estimated prevalence of drug use and prevalence of people
Methodology. Sources and limitations of data on the supply side
 Considerable efforts have been made over the last few years to improve the estimates presented in this report. Nonetheless, the data must still be interpreted with caution because of the clandestine nature
EMBARGOED UNTIL 26 JUNE AM EDT (5 PM CEST)
") WORLD DRUG REPORT 218 C. CANNABIS Global seizures change from previous year -1% herb 6% resin Global number of users 4.682 tons cannabis herb Note: Data refer to 216. 1.631 tons cannabis resin 216 192.2
WORLD DRUG REPORT 218 C. CANNABIS Global seizures change from previous year -1% herb 6% resin Global number of users 4.682 tons cannabis herb Note: Data refer to 216. 1.631 tons cannabis resin 216 192.2
Epidemiology of non medical use of prescription drugs. Kamran Niaz, Survey and Statistics Section, Policy Analysis and Research Branch
 Epidemiology of non medical use of prescription drugs Kamran Niaz, Survey and Statistics Section, Policy Analysis and Research Branch Monitoring of the drug use situation: Annual reports questionnaire
The Global S.M.A.R.T. Programme: Synthetics Monitoring: Analysis, Reporting and Trends. ATS trends, programme progress and planned expansion
 The Global S.M.A.R.T. Programme: Synthetics Monitoring: Analysis, Reporting and Trends ATS trends, programme progress and planned expansion Regional SMART Workshop, Bangkok, 5-6 August 2010 Beate Hammond,
Tobacco: World Markets and Trade
 United States Department of Agriculture Foreign Agricultural Service Circular Series FT -09-05 Sep. 2005 List of Tables Tobacco: World Markets and Trade Table 2 U.S. Tobacco Trade: 2004-2005 Table 3 Unmanufactured
1.6 Amphetamine-type stimulants
 1.6 Amphetamine-type stimulants 1.6.1 Production Global ATS production estimated at some 48 metric tons The group of amphetamine-type stimulants (ATS) encompasses amphetamines (amphetamine, methamphetamine),
Overview of ATS trends in East and Southeast Asia
 Overview of ATS trends in East and Southeast Asia Presentation to Global SMART Programme Regional Workshop Shawn Kelley Research Analyst Global SMART Programme Phnom Penh, Cambodia 24 July 2012 Structure
1. Background 2. The Big Picture 3. Global trends 4. Regional trends E/SE Asia 5. Effective responses
 Simultaneous launches: Vienna and Bangkok 13 Sep 2011 1. Background 2. The Big Picture 3. Global trends 4. Regional trends E/SE Asia 5. Effective responses The international drug control system 1. Based
Royal Internal Congress. Colegio Real de Panamá. Security council. Drug traffic on a worldwide scale. Joshua Harris Moderador
 Royal Internal Congress Colegio Real de Panamá Security council Drug traffic on a worldwide scale Joshua Harris Moderador Gabriel Garcia Co-Moderador 5 y 6 de Octubre de 2017 1 Dear delegates, Welcome
Drug Trafficking and Abuse - Impediments to development - Akira Fujino United Nations Office on Drugs and Crime (UNODC)
") Drug Trafficking and Abuse - Impediments to development - Akira Fujino United Nations Office on Drugs and Crime (UNODC) Shanghai, 1909 Early days 1920s-30s Century of Drug Control BACKGROUND 19th century:
Drug Trafficking and Abuse - Impediments to development - Akira Fujino United Nations Office on Drugs and Crime (UNODC) Shanghai, 1909 Early days 1920s-30s Century of Drug Control BACKGROUND 19th century:
Report 2016 REGIONAL HIGHLIGHTS AFRICA AMERICAS. Central America and the Caribbean INTERNATIONAL NARCOTICS CONTROL BOARD
 REGIONAL HIGHLIGHTS AFRICA Africa not only a trafficking hub: Africa continues to be one of the main drug trafficking transit regions: while the continent is a main transit region for drug trafficking,
Launch of the INCB Annual Reports 2015
 Launch of the INCB Annual Reports 2015 Werner Sipp, INCB President 2 March 2016 1 The 3 Reports 2 Mandate of INCB Promote and monitor compliance with the 3 international drug control conventions by: Annual
I. INTERDICTIONS OF ILLICIT DRUGS AND FIREARMS SMUGGLING IN 2008
 I. INTERDICTIONS OF ILLICIT DRUGS AND FIREARMS SMUGGLING IN 28 1. Number of Interdictions (1) Summary The number of interdictions for smuggling cases for illicit drugs in 28 was 293 (82% of the previous
Undiscovered progress in. in maternal mortality.
 CHAPTER 1 Undiscovered progress in maternal mortality During the early 1980s, a half-million women died every year during pregnancy, childbirth, or the postpartum period a stunning figure in a world that
Presidential Determination -- Major Drug Transit or Major Illicit Drug Producing Countries for Fiscal Year 2017
 Obama Admits Mexico and Red China Play Major Roles in International Narcotics Trafficking to the United States The White House Office of the Press Secretary For Immediate Release September 12, 2016 Presidential
Methodology World Drug Report 2010
 Methodology World Drug Report 2010 Considerable efforts have been made over the years to improve the estimates presented in this report. Nonetheless, challenges remain in making such estimates because
2. CANNABIS: WHY WE SHOULD CARE
 2. CANNABIS: WHY WE SHOULD CARE 2. Cannabis: Why we should care 2.1. Introduction The global community is confused about cannabis. On the one hand, cannabis is controlled with the same degree of severity
FACT SHEET 1 IRAN (ISLAMIC REPUBLIC OF)
") FACT SHEET 1 IRAN (ISLAMIC REPUBLIC OF) Territory: Borders: 1,648,195 sq. km. Azerbaijan (432 km/268 mi) and Armenia (35 km/22 mi) to the north-west; Turkmenistan (992 km/616 mi) to the north-east; Pakistan
FACT SHEET 1 IRAN (ISLAMIC REPUBLIC OF) Territory: Borders: 1,648,195 sq. km. Azerbaijan (432 km/268 mi) and Armenia (35 km/22 mi) to the north-west; Turkmenistan (992 km/616 mi) to the north-east; Pakistan
EU Market Situation for Poultry. Committee for the Common Organisation of the Agricultural Markets 20 April 2017
 EU Market Situation for Poultry Committee for the Common Organisation of the Agricultural Markets 2 April 217 -9.% -11.% -5.% -.1% -.7% -2.2% 3.% 1.7% 1.2%.8%.6%.%.%.% 7.9% 7.% 6.4% 6.2% 6.% 5.5% 5.3%
MYANMAR. Emerging trends and concerns
 MYANMAR MYANMAR Emerging trends and concerns Myanmar remains a major source of methamphetamine pills and opiates in South-East Asia, most of which are manufactured in Shan State in the eastern part of
CND UNGASS FOLLOW UP
 CND UNGASS FOLLOW UP INCB follow-up activities on Chapter 2. Operational recommendations on ensuring the availability of and access to controlled substances exclusively for medical and scientific purposes,
FACT SHEET TAJIKISTAN (REPUBLIC OF)
") FACT SHEET TAJIKISTAN (REPUBLIC OF) Territory: 142,600 sq. km. Source: Tajikistan in Figures 2014, Agency on Statistics under the President of the Republic of Tajikistan, 2014 Borders: Afghanistan - 1,344
FACT SHEET TAJIKISTAN (REPUBLIC OF) Territory: 142,600 sq. km. Source: Tajikistan in Figures 2014, Agency on Statistics under the President of the Republic of Tajikistan, 2014 Borders: Afghanistan - 1,344
Statistics on drug trafficking trends in East, South-East and South Asia, Oceania and worldwide
 15 November 2010 Original: English Thirty-fourth Meeting of Heads of National Drug Law Enforcement Agencies, Asia and the Pacific Bangkok, Thailand 30 November-3 December 2010 Item 3 of the provisional
OPIUM IN AFGHANISTAN. Prepared for: Connect Model United Nations 2012 United Nations Office on Drugs and Crime Director: Geena Lee INTRODUCTION
 UNITED NATIONS OFFICE ON DRUGS AND CRIME TOPIC A B ACKGROUNDER OPIUM IN AFGHANISTAN Prepared for: Connect Model United Nations 2012 United Nations Office on Drugs and Crime Director: Geena Lee INTRODUCTION
2.3 Coca/cocaine. Cultivation
 2.3 Coca/cocaine 2.3.1 Cultivation Production The global area under coca cultivation decreased by 5% from 167,6 ha in 28 to 158,8 ha in 29, mainly due to a significant decrease in Colombia, which was not
A. Africa. 2. Regional cooperation. 1. Major developments
 44 INCB REPORT 2014 A. Africa 1. Major developments 269. Parts of the African continent continue to struggle to overcome the effects of armed conflict, long-term instability and persistent threats to peace
3.5 Consumption Annual Prevalence Opiates
 3.5 Consumption 3.5.1 Annual Prevalence 3.5.1.1 Opiates EUROPE Western and Central Europe OPIATES AMERICA Central America Estonia, 2004 1.5 Panama** 0.2 Luxembourg, 2000 0.9 Honduras*, 2005 0.2 Latvia,
Copyright 2011 Joint United Nations Programme on HIV/AIDS (UNAIDS) All rights reserved ISBN
 All rights reserved ISBN") UNAIDS DATA TABLES 2011 Copyright 2011 Joint United Nations Programme on HIV/AIDS (UNAIDS) All rights reserved ISBN 978-92-9173-945-5 UNAIDS / JC2225E The designations employed and the presentation of
UNAIDS DATA TABLES 2011 Copyright 2011 Joint United Nations Programme on HIV/AIDS (UNAIDS) All rights reserved ISBN 978-92-9173-945-5 UNAIDS / JC2225E The designations employed and the presentation of
Global Measles and Rubella Update. April 2018
 Global Measles and Rubella Update April 218 Measles Number of Reported Measles by WHO Regions 218 Region Member States* Suspected cases Measles cases Clin Epi Lab Jan Feb Mar Apr May Jun Jul Aug Sep Oct
Main global and regional trends
 I N T R O D U C T I O N Main global and regional trends Promising developments have been seen in recent years in global efforts to address the AS epidemic, including increased access to effective treatment
Recipients of development assistance for health
 Chapter 2 Recipients of development assistance for health Both low- and middle-income countries are eligible for development assistance for health (DAH). In addition to income, burden of disease, which
Taking Stock of the 2009 PoA Research and Trend Analysis Branch
 Taking Stock of the 2009 PoA Research and Trend Analysis Branch Eliminate or reduce significantly and measurably: The five targets Illicit cultivation of opium, coca, cannabis Illicit demand of drugs and
FACT SHEET IRAN (ISLAMIC REPUBLIC OF)
") FACT SHEET IRAN (ISLAMIC REPUBLIC OF) Territory: Borders: 1,648,195 sq. km. Azerbaijan (432 km/268 mi) and Armenia (35 km/22 mi) to the north-west; Turkmenistan (992 km/616 mi) to the north-east; Pakistan
FACT SHEET IRAN (ISLAMIC REPUBLIC OF) Territory: Borders: 1,648,195 sq. km. Azerbaijan (432 km/268 mi) and Armenia (35 km/22 mi) to the north-west; Turkmenistan (992 km/616 mi) to the north-east; Pakistan
HIV and Harm Reduction in Prisons
 HIV and Harm Reduction in Prisons School of Public Health and Community Medicine Professor Kate Dolan Program of International Research and Training National Drug and Alcohol Research Centre UNSW, Sydney,
Illicit drug markets in Asia: Focus on East and SE Asia
 Illicit drug markets in Asia: Focus on East and SE Asia Presentation to 16 th ADEC, Tokyo Gary Lewis UNODC Regional Representative for East Asia and the Pacific 22 February 2010 Presentation Structure
Main developments in past 24 hours
 ECDC DAILY UPDATE Pandemic (H1N1) 2009 Update 02 October 2009, 09:00 hours CEST Main developments in past 24 hours Weekly Influenza Surveillance Overview to be published today; Media highlights and Eurosurveillance
3.1 PHASE 2 OF THE GLOBAL PROJECT
 RESULTS CHAPTER 3 3.1 PHASE 2 OF THE GLOBAL PROJECT (1996 1999) This new report of the Global Project provides data on anti-tuberculosis drug resistance from 58 geographical settings. Of these, 28 provided
Economic and Social Council
 UNITED NATIONS Economic and Social Council Distr. GENERAL 1 March 1996 ORIGINAL: ENGLISH COMMISSION ON NARCOTIC DRUGS Thirty-ninth session Vienna, 16-25 April 1996 Item 5 of the provisional agenda* ILLICIT
Global EHS Resource Center
 Global EHS Resource Center Understand environmental and workplace safety requirements that affect your global operations. 800.372.1033 bna.com/gelw Global EHS Resource Center This comprehensive research
Acetic Anhydride Trafficking to Afghanistan. - UNODC Afghan Opiate Trade Project -
 Acetic Anhydride Trafficking to Afghanistan - UNODC Afghan Opiate Trade Project - November 2011 Heroin production process Two main inputs: 1. Opium; and 2. Acetic anhydride World opium production, 1990-
Current State of Global HIV Care Continua. Reuben Granich 1, Somya Gupta 1, Irene Hall 2, John Aberle-Grasse 2, Shannon Hader 2, Jonathan Mermin 2
 Current State of Global HIV Care Continua Reuben Granich 1, Somya Gupta 1, Irene Hall 2, John Aberle-Grasse 2, Shannon Hader 2, Jonathan Mermin 2 1) International Association of Providers of AIDS Care
Global Measles and Rubella Update November 2018
 Global Measles and Rubella Update November 218 Measles Number of Reported Measles by WHO Regions 218 Region Member States* Suspected cases Measles cases Clin Epi Lab Jan Feb Mar Apr May Jun Jul Aug Sep
Fact Sheet: Drug Data Summary
 UNUM OF NATIONAL D R UG CONTR OL Office of National Drug Control Policy Drugs & Crime Clearinghouse OF THE PRESIDENT OFFICE E PLURIBUS EXECUTIVE OFFICE OF THE UNITED STATES POLICY Drugs & Crime Data Fact
Overview of ATS trends in East and Southeast Asia
 Overview of ATS trends in East and Southeast Asia Shawn Kelley Presentation to Global SMART Programme Regional Workshop Research Analyst, Global SMART Programme, UNODC East Asia and the Pacific, Bangkok
E/INCB/2009/1 D. Europe 1. Major developments 106
 HIV/AIDS infection were identified from January 1986 to March 2009, up to 7 per cent of those individuals being female. Drug abuse by injection remains the most prevalent factor in HIV transmission in
1. THE WORLD DRUG PROBLEM: A STATUS REPORT
 1. THE WORLD DRUG PROBLEM: A STATUS REPORT 1.1. The policy landscape The multilateral drug control system is a very valuable piece of political capital, agreed upon through an incremental process spanning
Author: Laura A Scott and Lucy Burns, National Drug and Alcohol Research Centre, University of New South Wales
 EDRS april 2011 Author: Laura A Scott and Lucy Burns, National Drug and Alcohol Research Centre, University of New South Wales Suggested citation: Scott, L. A. & Burns, L. (2011). Has ecstasy peaked? A
Country-wise and Item-wise Exports of Animal By Products Value Rs. Lakh Quantity in '000 Unit: Kgs Source: MoC Export Import Data Bank
 Country-wise and Item-wise Exports of Animal By Products Value Rs. Lakh Quantity in '000 Unit: Kgs Source: MoC Export Import Data Bank Country CAPEXIL Description HS Code Value 2010-2011 Quantity 2010-2011
Undetectable = Untransmittable. Mariah Wilberg Communications Specialist
 Undetectable = Untransmittable Mariah Wilberg Communications Specialist Undetectable=Untransmittable PLWH who get and stay undetectable have effectively no risk of transmitting HIV to their sex partners
Influenza Update N 176
 Update N 176 04 January 2013 Summary Reporting of influenza activity has been irregular in the past two weeks due to the holiday season in many countries. As a result, overall virus detections have dropped
Annex 2 A. Regional profile: West Africa
 Annex 2 A. Regional profile: West Africa 355 million people at risk for malaria in 215 297 million at high risk A. Parasite prevalence, 215 Funding for malaria increased from US$ 233 million to US$ 262
OIE Situation Report for Highly Pathogenic Avian Influenza
 OIE Situation Report for Highly Pathogenic Avian Influenza Latest update: 31/05/2018 The epidemiology of avian influenza (AI) is complex. The AI virus constantly evolves by mutation and re-assortment with
Drugs and violence. Dr. Angela Me Chief Research UNODC
 Drugs and violence Dr. Angela Me Chief Research UNODC Summary Is there a link between drugs and violence? Yes, but there is not a binary and causal relationship. Drugs may not be associated to violence
Terms and Conditions. VISA Global Customer Assistance Services
 Terms and Conditions VISA Global Customer Assistance Services Visa Global Customer Assistance Services (VGCAS) 1 The Visa Global Customer Assistance Services are co-ordinated by the Global Assistance Centre
Summary. 10 The 2007 ESPAD Report
 The main purpose of the European School Survey Project on Alcohol and Other Drugs (ESPAD) is to collect comparable data on substance use among 15 16 year-old European students in order to monitor trends
Global market for synthetic stimulants expanding
 (d) Cross-cutting issues: new challenges, threats and realities in preventing and addressing the world drug problem in compliance with relevant international law, including the three drug control conventions;
SUPPLY OF OPIATE RAW MATERIALS AND DEMAND FOR OPIATES FOR MEDICAL AND SCIENTIFIC PURPOSES
 SUPPLY OF OPIATE RAW MATERIALS AND DEMAND FOR OPIATES FOR MEDICAL AND SCIENTIFIC PURPOSES Introduction 1. The International Narcotics Control Board (INCB), in fulfilment of the functions assigned to it
The Transatlantic Cocaine Market. Research Paper
 The Transatlantic Cocaine Market Research Paper April 2011 ACKNOWLEDGEMENTS This report was prepared by the Studies and Threat Analysis Section in collaboration with the Regional Office in Senegal and
INTERNATIONAL NARCOTICS CONTROL BOARD Annual Report Press Release No. 3
 page 1 REGIONAL HIGHLIGHTS Africa A particularly worrisome development in Africa is the large-scale trafficking in cocaine. Both the number of couriers apprehended and the volume of bulk seizures of cocaine
Prohibition of importation, manufacturing and sale of Smokeless Tobacco products.
 Prohibition of importation, manufacturing and sale of Smokeless Tobacco products www.untobaccocontrol.org/kh/smokeless-tobacco/ BACKGROUND. Over the past decade, the WHO FCTC has served as a powerful tool
Non-Technical Summary of: The War on Illegal Drug Production and Trafficking: An Economic Evaluation of Plan Colombia 1
 Non-Technical Summary of: The War on Illegal Drug Production and Trafficking: An Economic Evaluation of Plan Colombia 1 by: Daniel Mejía and Pascual Restrepo Fedesarrollo and Universidad de los Andes Original
Indonesia Situation Assessment on Amphetamine-Type Stimulants
 Indonesia Situation Assessment on Amphetamine-Type Stimulants Tun Nay Soe Programme Coordinator, Global SMART Programme (East Asia) UNODC Regional Office for Southeast Asia and the Pacific 20 February
MARKET NEWS for pig meat
 MARKET NEWS for pig meat Market analysis 16 April 2018 Week 16 MARKET SITUATION Europe: Trading in fresh legs is at unchanged prices. As regards other cuts, there is increasing interest in BBQ products.
Global Measles and Rubella Update October 2018
 Global Measles and Rubella Update October 218 Measles Number of Reported Measles Cases by WHO Regions 218 Region Member States* Suspected cases Measles cases Clin Epi Lab Jan Feb Mar Apr May Jun Jul Aug
2007 WORLD DRUG REPORT
 2007 WORLD DRUG REPORT Preface Something new and significant is going on in the world drugs market. In last year's World Drug Report we made the argument that drug control is working and the world drug
1. Overview of global and regional drug trends and patterns
 1. Overview of global and regional drug trends and patterns The following chapter first draws together information on the global drug problem in its three main sectoral dimensions production, trafficking