2.3 Coca/cocaine. Cultivation
|
|
|
- Peregrine Franklin Cannon
- 6 years ago
- Views:
Transcription

1 2.3 Coca/cocaine Cultivation Production The global area under coca cultivation decreased by 5% from 167,6 ha in 28 to 158,8 ha in 29, mainly due to a significant decrease in Colombia, which was not offset by increases in Peru and the Plurinational State of Bolivia. This is about the same level of cultivation as during the period 23 to 26. Colombia remained the country with the largest area under coca cultivation but the distance to the second largest, Peru, has shrunk due to two consecutive years of decreases in Colombia and increases in Peru over the same period. In Colombia, the area under coca cultivation decreased for a third year to 68, ha, a 16% decrease over 28. Most of the reduction took place in the departments of Putumayo, Nariño and Antioquía. In 29, coca cultivation in Peru increased by 7% from 28 and reached 59,9 ha. Peru remained the second largest coca cultivating country, after Colombia. This is the country s third consecutive increase in three years. The cultivation level is 55% or 21,2 ha more than in 1999, when coca cultivation was at its lowest level in the last two decades at 38,7 ha. The area under cultivation in the three main growing regions Alto Huallaga, Apurímac-Ene and La Convención-Lares, where large parts are already covered with coca plantations, increased only slightly. Most of the increase in absolute and percentage terms took place in smaller growing regions such as Aguaytía, Inambari-Tambopata and Palcazú-Pichis- Pachitea, which have seen a considerable expansion of the area under coca cultivation since 24. Coca cultivation in the Plurinational State of Bolivia in 29 remained by and large at the 28 level with only a slight increase of 1% to 3,9 ha. The increase took place in both large growing regions, the Yungas of La Paz and Chapare. Eradication reports from Ecuador indicated the existence of small-scale coca cultivation. However, surveys implemented by UNODC in cooperation with the Government of Ecuador in 26 and 28 confirmed that the level of coca cultivation was insignificant. 1 Hectares Fig. 132: Global coca bush cultivation (ha), Source: see Table Global illicit cultivation of coca bush and production of coca leaf and cocaine, , 2, 175, 15, 125, 1, 75, 5, 25, Colombia Peru Bolivia 1 The surveys covered provinces in the north of Ecuador bordering Colombia. 161
2 World Drug Report 21 Table 19: Global illicit cultivation of coca bush and production of coca leaf and cocaine, CULTIVATION OF COCA BUSH IN HECTARES (a) Bolivia (b) 48,6 48,1 45,8 38, 21,8 14,6 19,9 21,6 23,6 27,7 25,4 27,5 28,9 Colombia (c) 5,9 67,2 79,4 11,8 16,1 163,3 144,8 12, 86, 8, 86, 78, 99, Peru (d) 115,3 94,4 68,8 51, 38,7 43,4 46,2 46,7 44,2 5,3 48,2 51,4 53,7 Total 214,8 29,7 194, 19,8 22,6 221,3 21,9 17,3 153,8 158, 159,6 156,9 181,6 167,6 158,8 POTENTIAL PRODUCTION OF DRY COCA LEAF IN METRIC TONS (e) Bolivia (f) 85, 75,1 7,1 52,9 22,8 13,4 2,2 19,8 27,8 38, 28,2 33,2 36,4 Colombia (g) 8,9 18,9 129,5 165,9 261, 266,2 236, 222,1 186,5 164,28 164,28 154,13 154, Colombia (fresh coca leaf) (h) 552,8 Peru (i) 183,6 174,7 13,6 95,6 69,2 46,2 49,3 52,5 72,8 11, 97, 15,1 17,8 POTENTIAL MANUFACTURE OF COCAINE IN METRIC TONS (j) Bolivia (b) Colombia (k) Peru (l) Total ,48 1,2 1,34 1, * * Due to the ongoing review of conversion factors, no point estimate of the level of cocaine production could be provided for 29. Because of the uncertainty on the level of total potential cocaine production, the 29 figure was estimated as a range (842-1,111 mt). For more detailed information, see Statistical Annex (4.1.1). It should be noted that the trend estimate of cocaine production between 28 and 29 indicate a stable situation. a) Potentially harvestable, after eradication. (b) Sources: : CICAD and US Department of State, International Narcotics Control Strategy Report. For the region Yungas of La Paz since 22, for all regions since 23: National Illicit Crop Monitoring System supported by UNODC. Cocaine production: Before 23, CICAD and US Department of State. Since 23, own calculations based on UNODC (Yungas of La Paz) and DEA (Chapare) coca leaf yield surveys and DEA conversion factors from leaf to cocaine HCl (currently under review). (c) Sources: : CICAD and US Department of State, International Narcotics Control Strategy Report; since 1999: National Illicit Crop Monitoring System supported by UNODC. (d) Sources: : CICAD and US Department of State, International Narcotics Control Strategy Report; since 2: National Illicit Crop Monitoring System supported by UNODC. (e) Refers to the potential coca leaf production available for cocaine production, i. e. after deducting the amount, which Governments report as being used for traditional or other purposes allowed under national law. In the absence of a standard definition of "dry coca leaf" and given considerable differences in the processing of the fresh coca leaf harvested, the figures may not always be comparable across countries. (f) Since 25, potential sun-dried coca leaf production available for cocaine production, estimated by the National Illicit Crop Monitoring System supported by UNODC. This figure does not include the estimated amount of coca leaf produced on 12, ha in the Yungas of La Paz where coca cultivation is authorized under national law. (g) Sources: : CICAD and US Department of State, International Narcotics Control Strategy Report. Since 23, potential coca leaf production available for cocaine production estimated by the National Illicit Crop Monitoring System supported by UNODC. Figures refer to oven-dried coca leaf equivalents. (h) Since 24, fresh coca leaf production figures are available based on coca leaf yield studies done by UNODC and the Government of Colombia. Similar to potential cocaine production, fresh coca leaf production in Colombia is calculated based on two-year area averages. (i) Since 23, potential sun-dried coca leaf production available for cocaine production, estimated by the National Illicit Crop Monitoring System supported by UNODC. For the calculation of coca leaf available for cocaine production, 9, mt of sun-dried coca leaf were deducted, which, according to Government sources, is the amount used for traditional purposes. (j) Potential manufacture refers to the amount of 1% pure cocaine that could be produced if all coca leaves harvested from an area under coca cultivation in one year were processed into cocaine, based on the information on cocaine alkaloid content of coca leaves and efficiency of clandestine laboratories. Estimates for Bolivia and Peru take into account that not all coca leaf production is destined for cocaine production. (k) Since 24, cocaine manufacture is calculated based on the average area under coca cultivation of the reporting year and the previous year. This is thought to be closer to the actual amount produced than a figure solely based on the year-end cultivation. Colombian cocaine manufacture estimates for 24 and later are based on new research and cannot be directly compared with previous years. For the calculation of the 29 cocaine manufacture new information on coca leaf yield available for some regions was used. Estimates from 24 to 28 were revised in 21 based on more detailed information on the average cocaine base purity (81%) and the cocaine base to HCl conversion ratio (1:1) available from DEA scientific studies. (l) Figures from 23 to 25 were revised in 27 based on updated information available on the amount of coca leaf necessary to produce one kilogram of cocaine HCl. Estimates based on conversion factors from leaf to cocaine HCl from DEA scientific studies (currently under review). 162
3 2. Drug statistics and trends Coca/cocaine Table 2: Reported spraying and manual eradication of coca bush (ha), Note: The Plurinational State of Bolivia: Since 26, voluntary and forced eradication. Peru: includes voluntary and forced eradication. Source: UNODC ARQ, Government reports, US Department of State (INCSR) Bolivia manual 5,493 7,512 7, 11,62 15,353 7,653 9,395 11,839 1,89 8,437 6,73 5,7 6,269 5,484 6,341 Colombia manual 1,487 4,57 2,262 3,126 1,46 3,495 1,745 2,762 4,219 6,234 31,98 43,51 66,85 95,634 6,557 spraying 23,915 18,519 41,861 66,29 43,112 58,73 94,153 13, , , , ,26 153, ,496 14,772 Peru manual 1,259 3,462 7,834 14,733 6,28 6,436 7,134 11,312 1,399 12,237 12,688 12,72 1,143 1,25 Ecuador manual Venezuela manual Production Due to the ongoing review of conversion factors from coca leaves to 1% pure cocaine HCl used to estimate the potential cocaine production in the Plurinational State of Bolivia and Peru, no point estimate of the level of cocaine production could be provided for these countries in 29. Because of this uncertainty, global cocaine production in 29 was estimated as a range (842-1,111 mt). 2 The uncertainty concerning conversion factors from leaves to cocaine affects the level of cocaine production in 29, but other years prior to 29 may be affected as well. Indeed, production figures provided by UNODC between 25 and 29 may be revised once more precise estimates can be elaborated for the conversion factors, which depend on the alkaloid content of the leaves and laboratory efficiency. They do not show major changes from one year to another. Thus, in spite of the uncertainty around the level of the 29 estimates it can be noted that the total production trend between 28 to 29 remained stable. Cocaine HCl production estimates for Colombia were revised, reflecting the availability of more detailed information on specific elements of the conversion process from the DEA scientific studies. This led to a slight increase in the estimated level of potential cocaine production since 24. However, potential cocaine production in Colombia declined by 9% from 45 mt in 28 to 41 mt in In the absence of a point estimate for the level of potential cocaine production in 29, estimates of coca leaf production can provide additional information on recent illicit production trends. To be able to compare coca leaf production across countries, fresh coca leaf production estimates were used where available (Colombia) or cal- 2 For more detailed information, see Annex The process of estimating the production of pure cocaine HCL. 3 For more details, see Ibid. Metric tons Fig. 133: Global potential production of fresh coca leaf available for cocaine production (mt), Source: National monitoring systems supported by UNODC. For more details see Table Global illicit cultivation of coca bush and production of coca leaf and cocaine, ,, 9, 8, 7, 6, 5, 4, 3, 2, 1, Colombia Peru Bolivia culated from sun-dried leaf production (Plurinational State of Bolivia and Peru) using a conversion factor. 4 Global potential production of fresh coca leaf was relatively stable between 24 and 27 at about 85, mt, but declined significantly between 27 and 28 (by 14%) and again between 28 and 29 (by 4%) to just over 7, mt. Between 24 and 29, Colombia always accounted for the largest share of coca leaf production. However, while Colombia contributed almost two thirds (63%) of total production in 24, in 29, it accounted for less than half (48%). Peru s share grew from 27% in 24 to 39% in 29, due to a decline in coca leaf production in Colombia in absolute terms and an increase in production in Peru over the same period. 4 The average weight loss from fresh to sun-dried leaf measured in UNODC s yield studies ranged from 52% (Bolivia, Yungas of La Paz) to 57% (average Peru). Only the amount of coca leaves estimated to be available for cocaine production was included in the estimate. More details see Table Global illicit cultivation of coca bush and production of coca leaf and cocaine,
4 World Drug Report 21 Measuring coca leaf yield Three elements are needed to estimate cocaine production each year: i) number of hectares under coca leaf cultivation; ii) annual coca leaf yield (quantity of leaves harvested per hectare in a year); and iii) alkaloid content of the leaves and efficiency of clandestine laboratories to extract these alkaloids, which determine the quantity of coca leaves needed to produce pure cocaine hydrochloride (HCl). Coca leaf yield is the element that probably shows the highest variation since it is affected by unpredictable factors such as weather, plant diseases, as well as eradication activities. The effect of these factors varies not only from year to year and during the course of a year but also from one cultivating region to the other. Thus, the annual coca leaf yield can be estimated with less certainty than the other elements. Since 24, UNODC, in cooperation with the respective Governments, undertook coca leaf yield studies in many coca growing regions in the Plurinational State of Bolivia, Colombia and Peru. The core element of these studies is the controlled harvest of mature coca fields. For this purpose, sample plots are selected randomly among a set of fields which are also randomly selected among all fields under coca leaf cultivation. All coca leaves in the sampled plots are harvested and weighed on the spot. In the Plurinational State of Bolivia and Peru, where farmers sun-dry coca leaves after the harvest, an additional weight measurement is taken after the sun-drying. The weight of the harvested coca leaves divided by the area of the sample plots is the yield per hectare of that plot (for one harvest). Yield measurements from all plots and fields are used to determine the per hectare yield in the studied area. The coca bush allows several harvests per year, with four being a typical number. Depending on seasonal variations, such as periods with higher precipitation or variations in farming practices (application of fertilizer and/or irrigation) or counter-narcotics activities such as spraying with herbicide, the yield varies from harvest to harvest. These variations have to be taken into account. Ideally, all harvests in the selected plots should be measured. However, often the security situation in coca cultivation regions does not allow for a return to sample fields for further measurements. Then, information from farmers interviews can be used to estimate the number and yield of past harvests. The annual yield is the sum of all coca leaf yields in the course of one year. Due to the different post-harvest processing methods in the Andean countries, coca leaf yield and production figures can be expressed in fresh, sun-dry or oven-dry leaf. Fresh coca leaf is typically used in Colombia, where the leaves are processed directly after harvesting to extract the alkaloids, often by the farmers themselves. In the Plurinational State of Bolivia and Peru, farmers dry the harvested coca leaves in a process referred to as sun- or air-drying before the alkaloids are extracted. Sun-drying is also used to produce coca leaves for traditional uses such as tea preparation and mastication (chewing). Sun-drying reduces the weight of the fresh leaves by more than 5%. It makes transportation easier and increases the shelf life of the coca leaves. Oven-dry weight is a standard that allows comparing coca leaf yields across countries with different post-harvest processing methods. Coca leaves are dried in an oven to extract moisture until their weight is stable. This method requires a scientific laboratory. After oven-drying, coca leaves have only about one third of their fresh weight. Total cocaine production can be estimated by determining the cocaine alkaloid content of coca leaves and multiplying it with the total coca leaf production estimated from yield and cultivation surveys. As clandestine laboratories are not able to extract 1% of the cocaine alkaloids contained in the leaf, a factor representing the efficiency of these laboratories is applied. Depending on the extraction method used, clandestine laboratories can extract between 4% and 8% of the alkaloids present in the coca leaves. Sources: United Nations International Drug Control Programme, Guidelines for yield assessment of opium gum and coca leaf from brief field visits New York, 21; US Government, DEA Studies, Clandestine laboratories In 28, Governments reported the detection of 9,73 clandestine installations ( laboratories ) involved in coca processing, compared to 7,245 in 27. As in past years, about 4% of the total installations detected were producing cocaine HCl. Over 99% of coca processing laboratories were located in the three coca cultivating countries, Plurinational State of Bolivia, Colombia and Peru. Over the last four years, there was a significant increase in coca processing laboratories reported destroyed in these countries and also worldwide. In 28, cocaine laboratories were also reported from other countries in South America, such as Argentina (2), the Bolivarian Republic of Venezuela (1), Chile (4) and Ecuador (3). Outside South America, Spain (25), the Netherlands (4), the Republic of Moldova (1) 164
5 2. Drug statistics and trends Coca/cocaine Table 21: Clandestine coca processing installations, Note: Previous years figures were revised based on updated information received from Governments. Source: UNODC ARQ, Government reports Cocaine paste/base producing installations 5,69 6,849 6,93 9,341 Percentage of coca processing installations detected in coca cultivating countries >99% >99% >99% >99% Cocaine HCl producing laboratories Cocaine HCl labs as % of total installations 4% 3% 4% 4% Cocaine HCl labs in coca cultivating countries Total coca processing installations detected 5,92 7,93 7,245 9,73 and Greece (1) reported the detection of cocaine laboratories. Preliminary reports from Governments of countries with coca cultivation indicate that in 29, the number of clandestine coca processing laboratories detected was almost as high as in 28, and significantly higher than
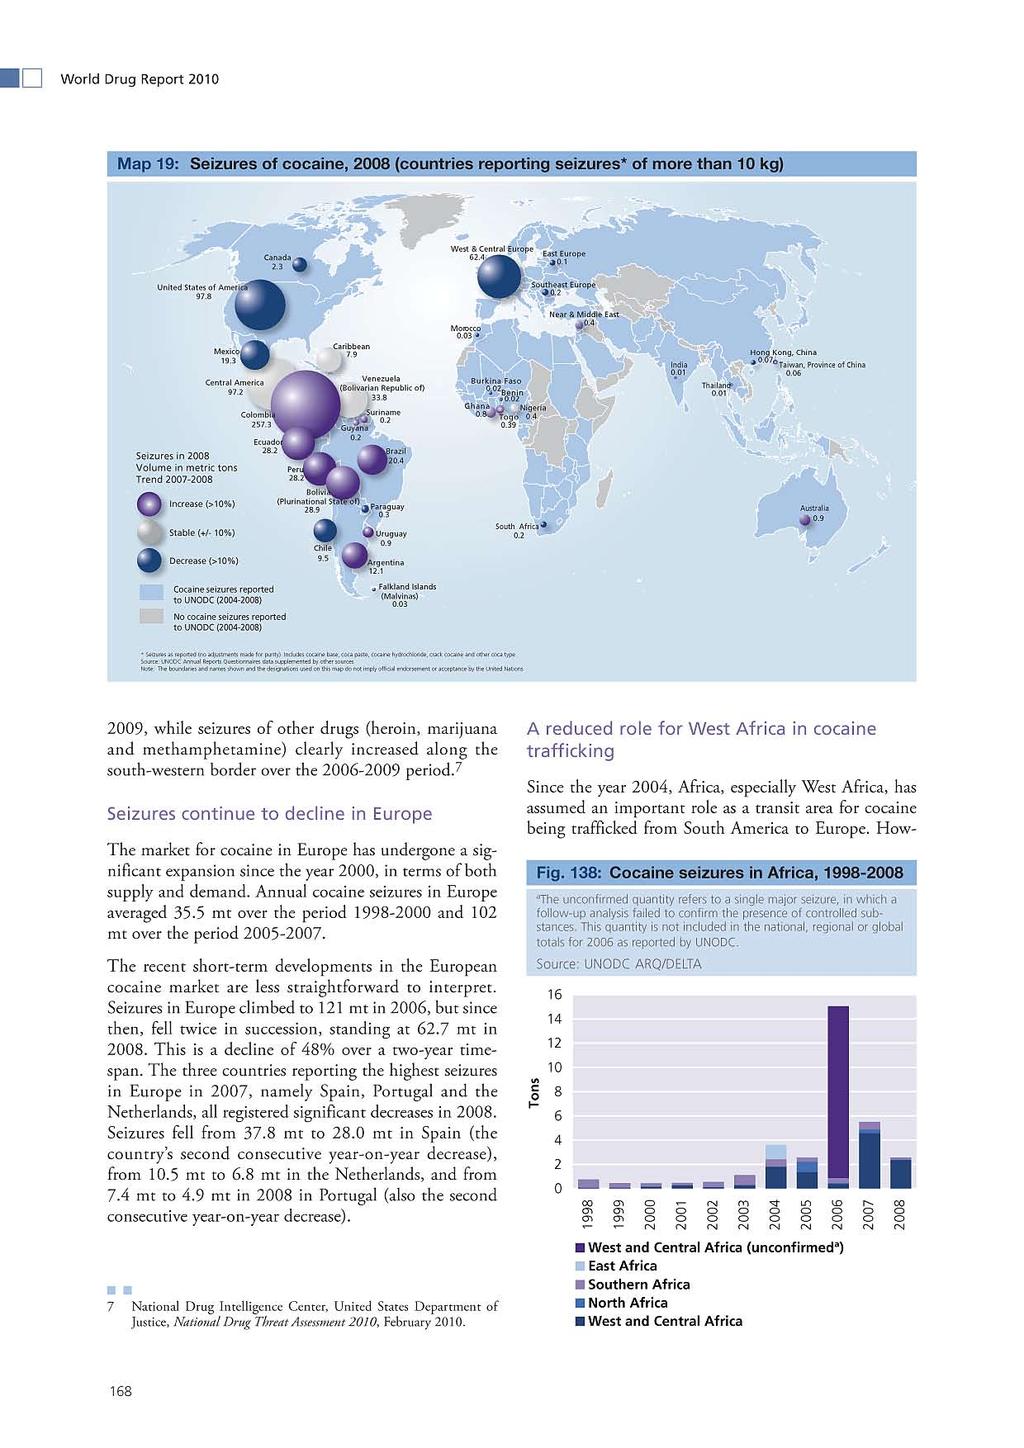
6 World Drug Report Seizures Following a significant increase over the period 22-25, global cocaine seizure totals have followed a stable trend, amounting to 712 mt in 27 and 711 mt in 28. Seizures continued to be concentrated in the Americas and Europe. However, the transition from 27 to 28 brought about a geographical shift in seizures towards the source countries for cocaine. Seizures in South America accounted for 59% of the global total for 28, compared with 45% in 27. This was mainly due to increases in several South American countries, notably Colombia, and simultaneous decreases in North America and Europe. More cocaine stopped at the source Cocaine seizures in South America reached record levels in 28, amounting to 418 mt (cocaine base and salts) almost one third more than the level in 27 (322 mt). In absolute terms, the largest increase from 27 was by far the one registered in Colombia (an increase of 61.9 mt). In relative terms, significant increases were also recorded in Peru (where seizures almost doubled), the Plurinational State of Bolivia (where seizures rose by 62%), Argentina (51%), Brazil (21%) and Ecuador (12%). One exception to the generally increasing trend Fig. 135: Trend in South American cocaine seizures (excluding Colombia), Source: UNODC ARQ/DELTA Metric tons % Venezuela +62% +12% Bolivia Ecuador +96% prevalent in South America was Chile, which registered a decrease of 12%. Seizures in the Bolivarian Republic of Venezuela remained essentially stable. Peru +21% Brazil Argentina % -12% Chile Fig. 134: Comparison of cocaine seizures in South America and other regions, 2-28 Source: UNODC ARQ/DELTA 2 South America Rest of the world North America 21 South America West and Central Europe Rest of the world 25 United States 26 Colombia Metric tons 166
7 2. Drug statistics and trends Coca/cocaine Fig. 136: Cocaine seizures in Colombia and the United States, 2-28 Source: UNODC ARQ/DELTA Tons Cocaine seized in US (tons) Line of bes t fit (2-27) Colombia United States Coc aine s eized in Colombia (tons ) From 22 onwards, Colombia and the United States consistently registered the largest and second largest annual cocaine (base and salts) seizures worldwide, respectively. Over the period, cocaine seizures in the United States, the country with the largest consumer market for cocaine, were in line with those in Colombia, the country with the largest manufacture of cocaine, to a remarkable degree (with a correlation coefficient of.96). However, the trends in the two countries diverged in 28. Seizures in Colombia reached record levels, rising from 195 mt in 27 to 257 mt 5 in 28, while seizures in the United States fell sharply, from 148 mt in 27 to 98 mt in 28 (-34%). Mexico continued to be the key transit country for large quantities of cocaine trafficked from the Andean region to the United States. In line with the trend in the United States, cocaine seizures in Mexico fell sharply in 28, amounting to 19.3 mt. Cocaine seizures by authorities in the United States along the border with Mexico followed a generally decreasing trend between the last quarter of 25 and the second quarter of 28, 6 suggesting that the amount of cocaine reaching the United States through the border with Mexico was in decline. In fact, between 26 and 28, cocaine seizures along this border fell by more than 4%. Partial data suggests that the decreased level was essentially sustained into Fig. 137: Cocaine seizures in Europe, Source: UNODC ARQ/DELTA Tons % Rest of Europe Ireland Germany Belgium Italy United Kingdom France Portugal Netherlands Spain 5 Observatorio de Drogas de Colombia. Data for Colombia from the ARQ (part III) for 28 were not available. 6 National Drug Intelligence Center, United States Department of Justice, National Drug Threat Assessment 29, December
8
9 2. Drug statistics and trends Coca/cocaine Fig. 139: Distribution of number of cocaine seizure cases in Europe, by transit/ origin country,* * This refers to the source of the cocaine as far back as it could be traced by the reporting countries. Source: UNODC Individual Drug Seizures database Percentage 1% 9% 8% 7% 6% 5% 4% 3% 2% 1% % Afric a Central America Rest of the world 16% 24 9% 25 12% 26 34% 27 Caribbean South America 2% 28 Proportion of total seizures (percentage) Fig. 14: Frequency distribution of cocaine purities in the United Kingdom, January-September 29 Source: Forensic Science Service, UK 45% 4% 35% 3% 25% 2% 15% 1% 5% % 38% 2% -9 27% 2% % 5% 5% 5% 3% 2-19 Police seizures % % 15% % 25% 6-69 Purity (percentage) 4% 23% % 15% 8-89 Border agency seizures % % 9-1 ever, seizure data suggest that this pattern may have started to subside. Cocaine seizures in West and Central Africa increased from 98 kg in 22 to 4.6 mt in 27, but in 28 declined to 2.3 mt. An analysis of cocaine consignments seized in Europe based on the UNODC individual drug seizure database confirms this picture. Among those cases in which the point of origin was identified, the proportion of cases in which African countries (or Africa as a whole) were named as the point of origin was negligible until 22, climbed to 34% by 27 but fell back to 2% in 28. Increased cocaine trafficking in Australia Cocaine seizures in Australia rose steadily over the period 25-28, from 87.5 kg in 25 to 93 kg in 28. With reference to the period 1 July 27 3 June 28, Australia 8 mentioned the threat arising from trafficking and subsequent trans-shipment of cocaine from Canada, as well as the growth in trafficking through China (including Hong Kong). China has also reported a perceived increase in the use of cocaine in 28. Interception rate Estimating the global interception rate for cocaine depends on a good understanding of the global supply of cocaine as well as the total amount of cocaine seized. 8 ARQ submitted by Australia for 28. Given the time lag incurred between cultivation of coca bush, harvesting, processing and trafficking, in a given year, supply in a consumer market such as Europe may be linked to production occurring in previous years. Moreover, the theoretical amount of pure cocaine seized can only be determined by taking into account the purity of seizures, which may vary considerably across countries and according to various factors, such as the size of the transaction (level of sale - retail versus wholesale) and the place of seizure (border versus domestic). Taking into account these considerations, UNODC estimates an interception rate range of 37%-5% 9 for cocaine in This is significantly higher than the corresponding rates for opiates, possibly due to the fact that a significant proportion of seizures is made in or close to the source countries. The range drops to 27%-33% if seizures in the three producing countries, Colombia, the Plurinational State of Bolivia and Peru are excluded. 9 This is calculated as the ratio of global seizures to global supply. Global seizures are adjusted for purity according to a weighted average, and include cocaine base, cocaine salts, coca paste and crack cocaine (but not coca leaf). Global supply is estimated by the average cocaine production in the preceding two years. The lower end of the range is obtained by considering retail purities only, and the upper end by considering wholesale purities only. 1 In previous years, UNODC estimated a single interception rate, adjusting global seizures for purity using an unweighted average of all purity data reported by Member States (retail and wholesale). This quantity was then expressed as a percentage of the cocaine production in the same year. This method produces an estimate of 42% for the year
10 World Drug Report Prices Cocaine prices in 28 reflected the well-known trafficking routes from South America to North America and Europe. The lowest wholesale prices were to be found in Peru, the Plurinational State of Bolivia and Colombia. Prices were, on average, noticeably higher in the rest of South America and slightly higher in Central America and the Caribbean. There was a clear markup in prices outside Latin America and the Caribbean. Wholesale prices in West Africa were significantly higher, but lower than prices in Europe. The wholesale price in Spain was significantly lower than the average in Europe, possibly reflecting Spain s role as a major point of entry for cocaine into the European market. Very high wholesale prices were registered in Saudi Arabia, Pakistan and the Russian Federation. The markup from wholesale to retail price can be more clearly observed when typical prices are adjusted by typical purities. A comparison of prices in the producer countries and major consumer markets shows a markup of approximately 3 times between prices of coca derivatives in the Plurinational State of Bolivia, Colombia and Peru and cocaine wholesale prices in the United States, and 6 times in the case of Europe. Fig. 141: Cocaine wholesale prices worldwide, 28 Source: UNODC ARQ Fig. 142: Comparison of coca derivative prices in producing countries and consumer markets, 2-28 (US dollars) a Weighted average of 18 countries. Sources: National monitoring systems in the Plurinational State of Bolivia, Colombia and Peru and UNODC ARQ US$/Kg (logarithmic scale) 1, 1, 1, Bolivia (Plurinational State of), street price of cocaine base in producing regions Colombia, farm-gate price of coca paste Peru, farm-gate price of coca paste (PBC) US wholesale price of cocaine US$/g Peru Bolivia Colombia Rest of South America 1 Central America Ghana 2 USA 2 Togo Canada 1 Simple average 2 Average of minimum and maximum price 3 Excluding Spain and the Russian Federation Spain Europe 1, Russian Federation Pakistan Saudi Arabia Western Europe, wholesale priceª In the United States, after a sharp increase in prices and decrease in purity, 29 brought the first signs of stabilization In the United States, price and purity data confirmed the reduced availability of cocaine. Data from the US Drug Enforcement Agency point to a distinct transition between the fourth quarter of 27 and the fourth quarter of 28, with purity dropping by 27% and the price per pure gram of cocaine rising by 72%, suggesting a shortage of cocaine in the US market. The increased price level was sustained into the third quarter of 29, 11 when it appeared to stabilize at the higher levels. 11 US Department of Justice, National Drug Threat Assessment 21. Based on data extracted from System To Retrieve Information on Drug Evidence (STRIDE). 17
11 2. Drug statistics and trends Coca/cocaine Fig. 143: Purity-adjusted and non-adjusted cocaine retail and wholesale prices in US dollars, 28 (log-log scale) Note: On a linear scale, the slope of the line of best fit (through the origin) for purity-adjusted prices is This means that, overall, there is a markup in price of 194% from wholesale to retail level. Source: UNODC ARQ Retail price, US dollars per gram, (log scale) 1, y = 2.94x y = x , Latin America and Caribbean, unadjusted (purity not available) Other countries, purity adjusted Other countries, unadjusted, purity available Other countries, unadjusted, purity not available Line of best fit (adjusted prices) Line of nil markup Wholesale price, US dollars per gram (log scale) Mean price per pure gram (US dollars) Fig. 144: Cocaine prices and purities in the United States, (STRIDE*) *STRIDE is a database of drug exhibits maintained by the US Drug Enforcement Administration. The values reported here represent averages of all cocaine purchases in the database. Although not collected as a representative sample of the US market, STRIDE data reflect the best information available available on changes in cocaine price and purity in the US market. Source: National Drug Threat Assessment 21, United States Department of Justice $25 $2 $15 $1 $5 $ Jan-Mar 6 Jul-Sep 6 Jan-Mar 7 Jul-Sep 7 61% $115 Jan-Mar 8 Jul-Sep 8 $198 45% Jan-Mar 9 $174 46% Jul-Sep 9 Mean price per pure gram (left axis) Mean purity (right axis) Mean purity (percentage) Mixed picture in Europe Prices per pure gram of cocaine for European countries were generally not available. On average, 12 European cocaine prices, expressed in euro and adjusted for inflation (but not for purity), displayed a decreasing trend over the period 26-28, at both the retail and wholesale levels. However, over the same period, prices increased when expressed in dollars and adjusted for inflation, suggesting that the trend has been more sensitive to the exchange rate between US dollar and euro than changes in the market. A comparison of purity- and inflation-adjusted prices 13 with cocaine seizures in selected European countries suggests a certain sensitivity of prices - notably at the retail level - to success in interdiction, as measured by seizure totals. In 26, European seizures peaked, along with the purity- and inflation-adjusted retail price in France, Germany and the United Kingdom. This was due to a change in purity in some cases and a change in bulk price in other cases. Since 26, the purity- and inflation-adjusted retail price declined, in line with seizure totals. One possible explanation for the correlation between the trends in price and seizures could be related to the effect of law enforcement activities: the stronger the effect of law enforcement, the higher are the amounts seized and the associated risk of trafficking which take the price to a higher level Weighted average of 18 European countries, based on ARQ, data from Europol and UNODC estimates; see UNODC, World Drug Report UNODC estimates based on reported prices and purities. 14 In contrast, over the period 2-26, rising seizures in Europe 171
12 World Drug Report 21 Fig. 145: Purity- and inflation-adjusted cocaine prices in selected European countries, in comparison with cocaine seizures Note: Purity-adjusted prices are UNODC estimates based on reported prices and purities Sources: UNODC ARQ, Europol, EMCDDA, UNODC World Drug Report Price per pure gram, 28 Euro Seizures (tons) Total cocaine seizures in Spain, France, Germany, UK Cocaine seizures - rest of Europe Spain, wholesale price France, retail price France, wholesale price Germany, retail price Germany, wholesale price UK, retail price UK, wholesale price went hand in hand with falling cocaine prices (weighted average for 18 European countries, not adjusted for purity), suggesting that seizures were reflecting the rising supply of cocaine reaching the European market. 172
13 2. Drug statistics and trends Coca/cocaine Consumption UNODC estimates that the prevalence of cocaine use worldwide in 28 ranged from.3% to.4% of the adult population, or between 15 and 19 million people who had used cocaine at least once in the previous year. Compared to 27, the range shifted to lower levels, suggesting a decrease in the global number of cocaine users. This change is due to the decrease in the number of cocaine users in North America. In addition, missing data and/or absence of recent reliable estimates affect many regions, particularly East Africa, Central Asia, the Near and Middle East and South Asia. Available qualitative information suggests that the prevalence of cocaine use is low in most parts of Asia, although Chinese experts reported a recent increase of cocaine use in their country (though starting from an almost negligible level) 15 and other countries have reported increasing trafficking of cocaine in Asia. Table 22: Estimated number of people who used cocaine at least once in the past year and prevalence among the population aged 15-64, by region, 28 Region/subregion Estimated number of users annually (lower) - Estimated number of users annually (upper) Percent of population aged (lower) - Percent of population aged (upper) Africa 1,2, - 2,67, Eastern Africa Subregional estimate cannot be calculated North Africa 3, - 5, <.1 - <.1 Southern Africa 29, - 9, West and Central Africa 64, - 83, Americas 8,72, - 9,8, Caribbean 11, - 32, Central America 12, - 14, North America 6,17, - 6,17, South America 2,33, - 2,45,.9-1. Asia 43, - 2,27, < Central Asia Subregional estimate cannot be calculated East/ South-East Asia 39, - 1,7, < Near and Middle East Subregional estimate cannot be calculated South Asia Subregional estimate cannot be calculated Europe 4,57, - 4,97, Eastern/South-East Europe 47, - 84, Western/Central Europe 4,11, - 4,13, Oceania 33, - 39, Global 15,7, - 19,38, ARQ submitted by China for
14 World Drug Report 21 Fig. 146: World annual cocaine users Source: UNODC ARQ Fig. 147: Cocaine use: lower and upper range of numbers and annual prevalence globally and by region Number of drug users in milions Lower/ Upper Prevalence Range (%) Lower/ Upper Prevalence Range (in Millions) Global Global Oceania Oceania Europe Europe Americas Americas Asia Asia Africa Africa Fig. 148: Global trend in the perception of cocaine use: unweighted average of trends as reported by national experts* * The graph measures the trend of the number of countries reporting an increase or decrease in drug use (not the trend in number of drug users). Source: UNODC ARQ Average increase over past year Baseline (if all countries had perceived 'some' increase) Cumulative unweighted average of perceived trends in cocaine use as reported by countries (54) 1999 (63) 2 (49) 21 (65) 22 (77) 23 (79) 24 (88) 25 (82) 26 (75) 27 (8) 28 (73) Year (Member State Expert Responses) 174
15 2. Drug statistics and trends Coca/cocaine Fig. 149: United States: Annual prevalence of cocaine use among the population aged 12 and older Fig. 15: Annual cocaine users in the Americas Source: UNODC ARQ Source: Substance Abuse and Mental Health Services Administration, Results from the 28 National Survey on Drug Use and Health, National Findings, Office of Applied Studies (OAS), US Department of Health and Human Services Annaul prevalence (%) Cocaine Crack Number of drug users in milions North America, the largest cocaine market, is shrinking The highest prevalence of cocaine use remains in North America, at 2% of the adult population aged 15 to 64. In the United States, many indicators show a downward trend in cocaine use over the past years, which mirrors a decreasing trend in cocaine production in Colombia, the source country of the cocaine reaching the United States, as well as increased difficulties faced by the Mexican drug cartels to have cocaine shipped from Colombia via Mexico into the United States. Data from 28 confirm the decreasing trend both in the adult and young populations. There has been a significant reduction in the use of cocaine and crack among the population aged 12 and older. The annual prevalence of cocaine use declined to 2.1% in 28 from 2.3% in 27. The perceived easy availability of cocaine among youth aged 12 to 17 also decreased significantly, from 25% in 27 to 22.1% in Fig. 151: United States: annual prevalence of cocaine use among high school students, Source: National Institute on Drug Abuse, Monitoring the Future, Overview of key findings in 29, Bethesda, Maryland, USA, 29 Annual prevalence of cocaine use (%) th grade 1th grade 12th grade 16 Substance Abuse and Mental Health Services Administration Results from the 28 National Survey on Drug Use and Health, National Findings, Office of Applied Studies (OAS), SAMHSA, US Department of Health and Human Services, September
16 World Drug Report 21 Fig. 152: Percent testing positive for cocaine in urine drug tests of the general US workforce (percent of all such tests) Source: Quest Diagnostics, Drug Testing Index Fig. 153: Annual prevalence of cocaine use among Ontario students, Source: Centre for Addiction and Mental Health, Ontario Student Drug Use and Health Survey, Drug use among Ontario students, As % of all urine tests J an-j un 29 % of cocaine use atleast once in previous year Similarly, the number of positive tests for recent use of cocaine in the general workforce in the United States dropped by 29% in 28 (a decline to.41% in 28 from.58% in 27 of all urine drug tests). The downward trend in cocaine use also continued in 29, where it was observed in tests for cocaine use among the general work force in the first six months of Similar downward trends were seen in the annual prevalence of cocaine use among high school students. The annual prevalence dropped from 2.8% in 28 to 1.6% in 29 among the 8 th graders, from 3% to 2.7% among 1 th graders and from 4.4% to 3.4% among the 12 th grade students. 18 The prevalence of positive test results for cocaine use among arrestees appears to be stable or declining across many of the US cities where the Arrestees Drug Abuse Monitoring Programme (ADAM II) has been implemented. There are statistically significant declines between 23 and 28 in two of the 1 monitored cities: Chicago and Portland. Statistically significant declines between 27 and 28 were observed in Indianapolis and Washington DC. Nonetheless, cocaine remained in 28 the second most common drug among arrestees. The number of problem cocaine users or those classified with substance dependence and abuse in the household survey declined from 1.5 million in 22 to 1.4 million in 28 among the population aged 12 or older, although none of the changes between 28 and previous years is statistically significant. Point estimates show a more noticeable decline between 26 (1.7 million) and 28 (1.4 million) Quest Diagnostics, Drug Testing Index, November National Institute on Drug Abuse, Monitoring the Future, Overview of Key Findings in 29, Bethesda, Maryland, USA, US Department of Health and Human Services, Substance Abuse The 28 Canadian survey also shows a decrease in the annual prevalence of cocaine use, falling from 2.3% of the population aged in 24 to 1.9% in The school survey conducted in Ontario, Canada s most populous province, accounting for close to 4% of Canada s total population, also indicates a decline in cocaine use among school students. The annual prevalence of cocaine use, from its peak of 4.8% in 23 has nearly halved to 2.6% in % of the students reported greater risk in trying cocaine and nearly half strongly disapproved of cocaine use. Cocaine was also reportedly less easily available than in 27 or a decade ago. 21 Cocaine use in Mexico increased over the period. The lifetime prevalence of cocaine use among the population aged 12 to 65 doubled, from 1.2% in 22 to 2.4% in The increase in the annual prevalence of cocaine use was, however, less pronounced, from.35% in 22 to.44% in 28. High prevalence rates continue to be reported in West Europe In Europe, cocaine remains the second most used illicit drug after cannabis. The annual prevalence of cocaine use in Europe ranges between.8% and.9% of the population aged 15 64, or around million people who had used cocaine in the past year in 28/29, a slight upward shift from the range reported in 27 (4.3 and Mental Health Services Administration, Results from the 28 National Survey on Drug Use and Health: National Findings, Health Canada, Canadian Alcohol and Drug Use Monitoring Survey (CADAUMS) Centre for Addiction and Mental Health, Ontario Student Drug Use and Health Survey, Drug use among Ontario students, , SALUD, Encuesta Nacional de Addicciones 28,
17 2. Drug statistics and trends Coca/cocaine Fig. 154: Europe: Increasing trends in annual prevalence of cocaine use among the adult population Source: British Crime Survey, Government reports and UNODC ARQ Annual prevalence (%) England '98 England ' England '4 England '5 England '6 England '7 England '8 England '9 Denmark ' Denmark '5 Denmark '8 Czech Rep '3 Czech Rep '4 Czech Rep '8 Portugal '1 Portugal '7-4.6 million people). An overall increase in cocaine use has been observed in Europe in the last decade. In recent years, the trend has started to stabilize in some countries, while in others it is still increasing. Higher cocaine use is reported in West and Central Europe (1.5%) than in East and South-East Europe (.3%). Cocaine use appears to be concentrated in a few countries in Europe, notably in Spain, the United Kingdom, Italy, Ireland and Denmark, where high cocaine use prevalence rates are observed. Use of cocaine is reportedly high among young males between years old. 23 Low prevalence countries in the European Union remain Romania, Greece, Hungary, Poland and the Czech Republic. In Spain and Italy, the annual prevalence rates for cocaine have stabilized at 3% and 2.2% in 27 and 28 respectively, after reaching high levels in 25. A stabilization was also reported in 27 by Germany and several other EU countries. The only major European market showing an increase is the United Kingdom. In England and Wales, cocaine prevalence rates declined in 27/28, but increased to 3% of the population aged in 28/29. The highest prevalence of cocaine use in Europe is found in Scotland (3.7% of the population aged in 28/29), even though this rate has remained stable since 26. The United Kingdom is thus overall Europe s largest cocaine market in absolute numbers with some 1.2 million users in 29. Increases Fig. 155: Europe: Stable or declining trends in annual prevalence of cocaine use among the population aged Source: Government reports and UNODC ARQ Annual prevalence (%) Scotland '3 Scotland '4 Scotland '6 Scotland '9 Spain 99 Spain '1 Spain '4 Spain '5 Spain '7 Italy '1 Italy '3 Italy '5 Italy '8 Austria '4 Austria '8 Germany '96 Germany ' Germany '3 Germany '6 Slovakia '2 Slovakia '4 Slovakia '6 Estonia '3 Estonia '8 Lithuania '3 Lithuania '4 Lithuania '8 Romania '3 Romania '4 Romania '7 23 EMCDDA, Drug Situation in Europe, Annual Report
18 World Drug Report 21 Fig. 156: United Kingdom: Cocaine-related poisoning episodes and deaths, 2-28 Source: United Kingdom, The Cocaine Trade Home Affairs Committee, Trends in Cocaine Use Number of episodes 2/1 21/2 22/3 23/4 in the annual prevalence rate were also reported in Albania, the Czech Republic and Denmark over the last period. Among the six European countries that reported updated information on cocaine use for 28, only Lithuania registered a decrease in the adult prevalence, from.3% in 24 to.2% in 28. In the United Kingdom, cocaine has been a problem drug for some time. Since 2/21, there has been a large increase in reported episodes of non-fatal hospital admissions for cocaine poisoning in England. Since 24, there has also been an upward trend of cocainerelated deaths, which accounted for 14% of all drugrelated deaths in The lifetime prevalence of cocaine use among year old school students in Europe 25 was on average 3%. Cocaine use, however, remains much lower than cannabis use. In half of the 28 reporting countries, in 27, the prevalence rate ranged between 1% and 2%. Most of the remaining countries reported prevalence levels between 3% and 4%. France, Italy and the United Kingdom reported levels around 5%. Like for most other drugs, lifetime prevalence of cocaine use among males is higher than among females. 26 The number of clients entering drug treatment with cocaine as the primary drug has been increasing in Europe for several years. Between 22 and 27, the 24 United Kingdom, The Cocaine Trade Home Affairs Committee, Trends in Cocaine Use, March European School Survey Project on Alcohol and Other Drugs (ESPAD). 26 Hibell, B., Andersson B., et al. ESPAD: The 27 ESPAD Report: Substance use among students in 35 European Countries, The Swedish Council for Information on Alcohol and other Drugs (CAN), EMCDDA, Council of Europe, Co-operation Group to Combat Drug Abuse and Illicit Trafficking in Drugs (Pompidou Group). 24/5 Non fatal admissions 25/6 26/7 Deaths 28 As % of population Fig. 157: South America: Prevalence of cocaine and pasta base use among students aged 13-17, selected countries Source: UNODC/CICAD, Informe subregional sobre uso de drogas en poblacion escolarizada, 29/ E cuador Bolivia Chile Cocaine Coca paste largest proportional increases among new clients were reported by Spain, Ireland and Italy. In those countries the number of all clients entering treatment citing cocaine as their primary drug increased as a proportion from 13% to 19%. The proportion of cocaine clients in treatment is now also increasing in other countries such as Denmark, Ireland, Greece and Portugal. 27 Increasing trends of cocaine use in most countries in South America 1.42 The annual prevalence of cocaine use in South America is between.9% and 1% of the population aged 15-64, thus comparable to cocaine use in Europe, though far lower than in North America. The aggregate annual prevalence of cocaine use in Central America ranges between.5% and.6%, and in the Caribbean, from.4% to 1.2%. In contrast to North America, national experts in South America continue to report an increasing trend in cocaine use. Increases in cocaine use in recent years were reported by the Bolivarian Republic of Venezuela, Ecuador, Brazil, Argentina and Uruguay, as well as countries in Central America (Guatemala and Honduras) and the Caribbean (Jamaica and Haiti). Compared to the previous year, new quantitative information for 28 was available only from two countries: Chile, where an increase in the annual prevalence among the adult population aged was observed (from 1.7% in 26 to 2.4% in 28) and Suriname, where there was a decrease (from.5% in 22 to.3% in 27). The highest prevalence of cocaine use in South America 27 EMCDDA, Drug Situation in Europe 29: Problem cocaine use and treatment demand,
19 2. Drug statistics and trends Coca/cocaine Fig. 158: South America: annual adult (aged 15-64) prevalence of cocaine use in selected countries, Source: UNODC/CICAD, Elementos Orientadores para las Politicas Publicas sobre Drogas en la Subregion: Primer Estudio Comparativo sobre Consumo de Drogas y Factores Asociados en Poblacion de 15 a 64 años, 28 Annual prevalence (%) Argentina Uruguay Chile Bolivia was reported from Argentina (2.7%), followed by Chile (2.4%) and Uruguay 1.4%). The annual prevalence of cocaine use in Argentina and Chile are comparable to the prevalence in United States. Brazil and Argentina constitute the biggest cocaine markets in South America in terms of absolute numbers (more than 9, and 6, users, respectively). According to the school survey conducted by UNODC and CICAD in the South American countries, the highest annual prevalence of cocaine use among students was in Chile, followed by Uruguay and Argentina. 28 The pasta base or the cocaine base is also frequently abused in South America. However, both for the student and adult populations, the use of cocaine HCl is generally higher than coca paste. In Chile, the Plurinational State of Bolivia and Peru, there were comparable rates of cocaine and pasta base use among the students surveyed. Experts are reporting rising cocaine use in Africa Cocaine HCl Coca Base Peru Ecuador For most parts of Africa, there are no recent or reliable estimates of cocaine use. Nevertheless, the annual prevalence of cocaine use in Africa is estimated at between.2% and.5% of the population aged 15 to 64. The upper bound of the estimate fell compared to last year when it was.7%. The major reason for this drop is the removal of national estimates which were more than 1 years old. However, experts from Africa report that cocaine use has increased in many parts of the continent, notably West and Central Africa. In South Africa, one of the few countries that have data to substantiate the expert perceptions, treatment demand for cocaine-related problems has shown a strong increase over the past 28 UNODC and CICAD Informe subregional sobre uso de drogas en poblacion escolarizada, 29/21. In % of all treatment Fig. 159: South Africa: Percent of all treatment admissions for cocaine, Source: Pluddemann A., Parry C., Bhana A., et al, Alcohol and Drug Abuse Trends: January-June 29 (Phase 26), South African Community Epidemiology Network on Drug Use, November a 1997b 1998a 1998b 1999a 1999b 2a 2b 21a 21b 22a 22b 23a 23b 24a 24b 25a 25b 26a 26b 27a 27b 28a 28b 29a 1 years, where it has increased from 5% of treatment demand in 1998 to 8% in the first half of 29. However, there has been a declining trend in treatment demand for cocaine since For large parts of Asia and the Near and Middle East, there are no recent or reliable estimates available on cocaine use. In Asia, the annual prevalence of cocaine use is estimated at maximum.1%, or between 43, and 2.3 million cocaine users. Hong Kong, China is the only territory in Asia reporting new information in 28, revealing an increase in the estimated annual adult prevalence rate from.3% in 23 to.3% in In Hong Kong, China, there are indications of increasing availability and decreasing prices of cocaine since In the school survey conducted in Hong Kong, China in 28/29, the lifetime prevalence of cocaine and ecstasy use among students was 13.8%, compared to 11.3% in 24/ Pluddemann A., Parry C., Bhana A., et al, Alcohol and Drug Abuse Trends: January June 29 (Phase 26), South African Community Epidemiology Network on Drug Use, November Data extrapolated from the results of a school survey. 31 Narcotics Bureau, Hong Kong Police, Drug Situation Report Hong Kong Special Administrative Region of the People s Republic of China, January Narcotics Division, Security Bureau, The 28/29 Survey of Drug Use among Students,

20

21
Part 1 RECENT STATISTICS AND TREND ANALYSIS OF ILLICIT DRUG MARKETS A. EXTENT OF ILLICIT DRUG USE AND HEALTH CONSEQUENCES
 References to Brazil Part 1 RECENT STATISTICS AND TREND ANALYSIS OF ILLICIT DRUG MARKETS A. EXTENT OF ILLICIT DRUG USE AND HEALTH CONSEQUENCES The global picture Cocaine In 2010, the regions with a high
References to Argentina Part 1 RECENT STATISTICS AND TREND ANALYSIS OF ILLICIT DRUG MARKETS
 References to Argentina Part 1 RECENT STATISTICS AND TREND ANALYSIS OF ILLICIT DRUG MARKETS A. EXTENT OF ILLICIT DRUG USE AND HEALTH CONSEQUENCES The global picture Cocaine In 2010, the regions with a
References to Uruguay
 References to Uruguay Part 1 RECENT STATISTICS AND TREND ANALYSIS OF ILLICIT DRUG MARKETS A. EXTENT OF ILLICIT DRUG USE AND HEALTH CONSEQUENCES The global picture Regional trends in illicit drug use South
1.3 Coca / Cocaine Market
 1.3 Coca / Cocaine Market 1.3.1 Summary Trend Overview Although the coca/cocaine market is stable overall, it has experienced considerable fluctuations over the 26/7 period. On the supply side, coca cultivation
E. COCAINE: OVERVIEW. Cultivation and production. Seizures
 34 1. RECENT STATISTICS AND TREND ANALYSIS OF THE ILLICIT DRUG MARKET limited data are available. In Afghanistan, a survey in urban households showed that over half the women surveyed who reported opioid
EMBARGOED UNTIL 26 JUNE AM EDT (5 PM CEST)
") B. COCAINE Global cultivation change from previous year 36% Global seizures change from previous year 23% most recent estimate () 213, ha coca bush = 298, x 1,129 tons cocaine purity as seized Global production
B. COCAINE Global cultivation change from previous year 36% Global seizures change from previous year 23% most recent estimate () 213, ha coca bush = 298, x 1,129 tons cocaine purity as seized Global production
WORLD DRUG REPORT 2011
 WORLD DRUG REPORT 2011 EXECUTIVE SUMMARY Global developments in illicit drug consumption, production and trafficking Consumption Globally, UNODC estimates that, in 2009, between 149 and 272 million people,
World Drug Report 2017
 World Drug Report 2017 DEMAND Global trends in estimated number of drug users and people with drug user disorders, 2006-2015 Global trends in the estimated prevalence of drug use and prevalence of people
PREFACE. Antonio Maria Costa Executive Director United Nations Office on Drugs and Crime
 EXECUTIVE SUMMARY GLOBAL ILLICIT DRUG TRENDS 2003 PREFACE At the twentieth special session of the General Assembly in, States Members agreed to make significant progress towards the control of supply
Lima - Peru, August 18-22, 2014
 2014 GLOBAL SYNTHETIC DRUGS ASSESSMENT Amphetamine-type stimulants and new psychoactive substances Lima - Peru, August 18-22, 2014 Juan Carlos Araneda Ferrer Project Coordinator Global SMART Programme
Economic and Social Council
 United Nations Economic and Social Council Distr.: General 17 December 2003 E/CN.3/2004/6 Original: English Statistical Commission Thirty-fifth session 2-5 March 2004 Item 3 (e) of the provisional agenda*
REGIONAL HIGHLIGHTS AFRICA AMERICAS. Central America and the Caribbean. INTERNATIONAL NARCOTICS CONTROL BOARD Report 2017
 REGIONAL HIGHLIGHTS AFRICA Increase in drug use: while Africa remains a key transit region for drug trafficking, the use of various types of drugs, including cocaine, opioids, amphetamine-type stimulants,
Drug Money: the illicit proceeds of opiates trafficked on the Balkan route. Executive summary
 Drug Money: the illicit proceeds of opiates trafficked on the Balkan route Executive summary 2015 Executive summary The cultivation, production and trafficking of illicit opiates accounted for almost
World Drug Report 2008: Paraguay
 World Drug Report 2008: Paraguay p. 73 Seizures fell in South America and the Caribbean in 2006 Large seizures in South America are also undertaken by Venezuela (39 mt), Ecuador (34 mt), Peru (19 mt) and
1.1 Overview Evolution of the World Drug Problem
 1.1 Overview 1.1.1 Evolution of the World Drug Problem Vigilance is needed to respond to year-onyear expansion in some market sectors The long-term stabilization which occurred in drug markets continued
10% stable million. 120,800 ha tons. Global cultivation. Global seizures. Global number of users. Potential manufacture.
 5 COCAINE Key figures most recent estimate Global cultivation change from previous year 2,8 ha = % Potential manufacture change from previous year stable 7, x 687 tons cocaine Global seizures five-year
WORLD DRUG REPORT 2004 WORLD DRUG REPORT. presented by Thomas Pietschmann UNODC, Research and Analysis Section
 WORLD DRUG REPORT 2004 presented by Thomas Pietschmann UNODC, Research and Analysis Section 1 OVERVIEW: ALL DRUGS CONSUMPTION 2 Estimates of annual prevalence of drug use at the global level in the late
EMBARGOED UNTIL 22 JUNE PM CEST (GMT+2)
") FACT SHEET ON STATISTICS AND TRENDS IN ILLICIT DRUGS Global estimates of drug use All illicit drug use Problem drug use** Annual prevalence (%)* 5.3 (3.3-7.3) 0.6 (0.3-0.9) Number of users (millions)*
FACT SHEET ON STATISTICS AND TRENDS IN ILLICIT DRUGS Global estimates of drug use All illicit drug use Problem drug use** Annual prevalence (%)* 5.3 (3.3-7.3) 0.6 (0.3-0.9) Number of users (millions)*
World Drug Report 2018 Methodology Report. Research and Trend Analysis Branch UNODC, Vienna
 World Drug Report 2018 Methodology Report Research and Trend Analysis Branch UNODC, Vienna Table of Contents 1. Introduction... 1 Sources of information... 1 2. Data on drug use and health consequences
Angela Me Chief Statistics and Survey Section UNODC
 European Parliament Special Committee on organized crime, corruption and money laundering Brussels, 11-12 July 2012 Angela Me Chief Statistics and Survey Section UNODC No significant change in global status
The Transatlantic Cocaine Market. Research Paper
 The Transatlantic Cocaine Market Research Paper April 2011 ACKNOWLEDGEMENTS This report was prepared by the Studies and Threat Analysis Section in collaboration with the Regional Office in Senegal and
Executive Summary. 1. Trends in World Drug Markets
 1. Trends in World Drug Markets 1.1 Overview Evolution of the world drug problem The world s drug problem is being contained. In 2005/06, the global markets for the main illicit drugs the opiates, cocaine,
Methodology World Drug Report 2017
 Methodology World Drug Report 2017 Considerable efforts have been made over the years to improve the estimates presented in the World Drug Report, which rely, to a large extent, on information submitted
Introduction Overview of the status quo
 Introduction Whenever we learn that a government has prohibited the use or sale of certain goods, there is one thing we can be sure of - sooner or later, people willing to break the law will take advantage
Methodology. Sources and limitations of data on the supply side
 Considerable efforts have been made over the last few years to improve the estimates presented in this report. Nonetheless, the data must still be interpreted with caution because of the clandestine nature
The Drugs Scenario - Global, Regional and National
 The Drugs Scenario - Global, Regional and National 1. The growing demand for narcotic drugs and psychotropic substances in the world is being met by an increase in their production through a proliferation
310,891 ha million. 526 tons 7,554 tons million. Global cultivation. Global seizures. Potential production. Global number of users
 Opiates 41 G. MARKET ANALYSIS BY TYPE OPIATES Key figures Global cultivation change from previous year 5% 634 tons Global seizures five-year change 47% 5% Stable morphine opium heroin most recent estimate
Cocaine. Key Points 60 ILLICIT DRUG DATA REPORT
 Cocaine Key Points The total weight of cocaine detected at the border in 2006 07 increased by over 600 percent. However, it is still lower than the peak detected weight recorded in 2001 02. More than half
Drug Prices Report Opioids Retail and wholesale prices * and purity levels,by drug, region and country or territory (prices expressed in US$ )
") 1 / 11 Region/Subregion/ Country Africa Eastern Africa Kenya Madagascar Mauritius Uganda United Republic of Tanzania Northern Africa Algeria Egypt Libya Morocco Sudan Southern Africa Botswana Burkina Faso
1 / 11 Region/Subregion/ Country Africa Eastern Africa Kenya Madagascar Mauritius Uganda United Republic of Tanzania Northern Africa Algeria Egypt Libya Morocco Sudan Southern Africa Botswana Burkina Faso
E. COCAINE MARKET. Global trends in the main supply indicators. Cultivation, production and manufacture of cocaine
 E. Cocaine market 37 in Mexico at 12, hectares, 81 with a correspondingly higher potential production of heroin. 82 It is unclear how Colombia, given its much lower potential production, could supply larger
Methodology World Drug Report 2010
 Methodology World Drug Report 2010 Considerable efforts have been made over the years to improve the estimates presented in this report. Nonetheless, challenges remain in making such estimates because
Author: Laura A Scott and Lucy Burns, National Drug and Alcohol Research Centre, University of New South Wales
 EDRS april 2011 Author: Laura A Scott and Lucy Burns, National Drug and Alcohol Research Centre, University of New South Wales Suggested citation: Scott, L. A. & Burns, L. (2011). Has ecstasy peaked? A
2016 National Drug Price and Purity Data
 DEA Intelligence Report Brief 2016 National Drug Price and Purity Data DEA-DCW-DIR-023-18 July 2018 1 Executive Summary The following charts provide an update on national-level price and purity data for
Non-Technical Summary of: The War on Illegal Drug Production and Trafficking: An Economic Evaluation of Plan Colombia 1
 Non-Technical Summary of: The War on Illegal Drug Production and Trafficking: An Economic Evaluation of Plan Colombia 1 by: Daniel Mejía and Pascual Restrepo Fedesarrollo and Universidad de los Andes Original
C. CANNABIS MARKET. Global cannabis cultivation and production
 24 1. RECENT STATISTICS AND TREND ANALYSIS OF ILLICIT DRUG MARKETS from Thailand and Uganda also indicate trafficking of amphetamine from West Africa via Ethiopia, raising the possibility of a parallel
OPIUM GLOBAL ILLICIT CULTIVATION OF OPIUM POPPY AND PRODUCTION OF OPIUM, HEROIN
 5. PRODUCTION 3.1. Production: Opium/heroin 3.1 Opium/heroin OPIUM GLOBAL ILLICIT CULTIVATION OF OPIUM POPPY AND PRODUCTION OF OPIUM, 1990-2005 1990 1991 1992 1993 1994 1995 1996 1997 1998 1999 2000 2001
Prices. Peru, potential cocaine production (mt), 1994 to Peru, monthly farm-gate prices of sun-dried coca leaf and coca paste (US$/kg)
, 1994 to Peru, monthly farm-gate prices of sun-dried coca leaf and coca paste (US$/kg)") World Drug Report 2009 Metric tons Peru, potential cocaine production (mt), 1994 to 2008 Sources: US Dept. of State (1994-1999), National monitoring system supported by UNODC (since 2000) based on conversion
World Drug Report 2009 Metric tons Peru, potential cocaine production (mt), 1994 to 2008 Sources: US Dept. of State (1994-1999), National monitoring system supported by UNODC (since 2000) based on conversion
3. The coca/cocaine market
 3. The coca/cocaine market 3.1 Introduction Most indicators and research suggest that cocaine is after heroin the second most problematic drug worldwide in terms of negative health consequences and probably
STATISTICS AND ANALYSIS ON SUPPLY OF AND TRAFFICKING IN NARCOTIC DRUGS AND PSYCHOTROPIC SUBSTANCES 1996
 STATISTICS AND ANALYSIS ON SUPPLY OF AND TRAFFICKING IN NARCOTIC DRUGS AND PSYCHOTROPIC SUBSTANCES 1996 The United Nations International Drug Control Programme wishes to express its appreciation for responses
1. Background 2. The Big Picture 3. Global trends 4. Regional trends E/SE Asia 5. Effective responses
 Simultaneous launches: Vienna and Bangkok 13 Sep 2011 1. Background 2. The Big Picture 3. Global trends 4. Regional trends E/SE Asia 5. Effective responses The international drug control system 1. Based
1.6 Amphetamine-type stimulants
 1.6 Amphetamine-type stimulants 1.6.1 Production Global ATS production estimated at some 48 metric tons The group of amphetamine-type stimulants (ATS) encompasses amphetamines (amphetamine, methamphetamine),
Drug Trafficking and Abuse - Impediments to development - Akira Fujino United Nations Office on Drugs and Crime (UNODC)
") Drug Trafficking and Abuse - Impediments to development - Akira Fujino United Nations Office on Drugs and Crime (UNODC) Shanghai, 1909 Early days 1920s-30s Century of Drug Control BACKGROUND 19th century:
Drug Trafficking and Abuse - Impediments to development - Akira Fujino United Nations Office on Drugs and Crime (UNODC) Shanghai, 1909 Early days 1920s-30s Century of Drug Control BACKGROUND 19th century:
1.4 Cannabis Market Summary Trend Overview
 1.4 Cannabis Market 1.4.1 Summary Trend Overview The cannabis market has remained basically stable overall, but is experiencing some interesting developments. While estimates for cannabis herb production
: UNODC Cooperation on Drugs and Crime in the Islamic Republic of Iran
 History and Achievements 1999-2004: Beginning of UNODC Cooperation with the Islamic Republic of Iran The United Nations Office on Drugs and Crime in the Islamic Republic of Iran established a country office
Colombian Cocaine Production Expansion Contributes to Rise in Supply in the United States
 DEA Intelligence Brief Colombian Cocaine Production Expansion Contributes to Rise in Supply in the United States DEA-DCT-DIB-014-17 August 2017 (U) This product was prepared by the DEA Strategic Intelligence
Main developments in past 24 hours
 ECDC DAILY UPDATE Pandemic (H1N1) 2009 Update 02 October 2009, 09:00 hours CEST Main developments in past 24 hours Weekly Influenza Surveillance Overview to be published today; Media highlights and Eurosurveillance
Drug Use Around the World
 Special Agents U.S. DRUG ENFORCEMENT AGENCY STAFFING AND BUDGETS 1975 2000 10000 5000 Total Employees 8000 6000 4000 3000 2000 4000 1975 1980 1985 1990 1995 2000 1000 1975 1980 1985 1990 1995 2000 Support
INTERNATIONAL NARCOTICS CONTROL BOARD Annual Report Press Release No. 3
 page 1 REGIONAL HIGHLIGHTS Africa A particularly worrisome development in Africa is the large-scale trafficking in cocaine. Both the number of couriers apprehended and the volume of bulk seizures of cocaine
Statistics on drug trafficking trends in East, South-East and South Asia, Oceania and worldwide
 15 November 2010 Original: English Thirty-fourth Meeting of Heads of National Drug Law Enforcement Agencies, Asia and the Pacific Bangkok, Thailand 30 November-3 December 2010 Item 3 of the provisional
2.5 Amphetamine-type stimulants
 2.5 Amphetamine-type stimulants 2.5. Manufacture Synthetic drug manufacture dominated by ATS, methamphetamine The majority (99%) of the detected clandestine synthetic drugs laboratories process amphetamine-type
Annual prevalence estimates of cannabis use in the late 1990s
 Cocaine abuse in most east European countries, by contrast, is still far less widespread and less of a problem. A majority of countries in eastern Europe either did not report on cocaine at all, or they
Fact Sheet: Drug Data Summary
 UNUM OF NATIONAL D R UG CONTR OL White House Office of National Drug Control Policy ONDCP Drug Policy Information Clearinghouse OF THE PRESIDENT OFFICE E PLURIBUS EXECUTIVE OFFICE OF THE UNITED STATES
Presidential Determination -- Major Drug Transit or Major Illicit Drug Producing Countries for Fiscal Year 2017
 Obama Admits Mexico and Red China Play Major Roles in International Narcotics Trafficking to the United States The White House Office of the Press Secretary For Immediate Release September 12, 2016 Presidential
Epidemiology of non medical use of prescription drugs. Kamran Niaz, Survey and Statistics Section, Policy Analysis and Research Branch
 Epidemiology of non medical use of prescription drugs Kamran Niaz, Survey and Statistics Section, Policy Analysis and Research Branch Monitoring of the drug use situation: Annual reports questionnaire
Seizures of ATS (excluding ecstasy ), 2010
, 2010") Seizures of ATS (excluding ecstasy ), 2010 (countries and territories reporting seizures* of more than 10 kg) 9 5.1 8.7 12.9 Ghana Armenia 0.7 9.9 1 2.1 Syrian Arab Republic Korea (Republic of) Iraq Islamic
Seizures of ATS (excluding ecstasy ), 2010 (countries and territories reporting seizures* of more than 10 kg) 9 5.1 8.7 12.9 Ghana Armenia 0.7 9.9 1 2.1 Syrian Arab Republic Korea (Republic of) Iraq Islamic
OPIUM IN AFGHANISTAN. Prepared for: Connect Model United Nations 2012 United Nations Office on Drugs and Crime Director: Geena Lee INTRODUCTION
 UNITED NATIONS OFFICE ON DRUGS AND CRIME TOPIC A B ACKGROUNDER OPIUM IN AFGHANISTAN Prepared for: Connect Model United Nations 2012 United Nations Office on Drugs and Crime Director: Geena Lee INTRODUCTION
Tobacco: World Markets and Trade
 United States Department of Agriculture Foreign Agricultural Service Circular Series FT -09-05 Sep. 2005 List of Tables Tobacco: World Markets and Trade Table 2 U.S. Tobacco Trade: 2004-2005 Table 3 Unmanufactured
The Global S.M.A.R.T. Programme: Synthetics Monitoring: Analysis, Reporting and Trends. ATS trends, programme progress and planned expansion
 The Global S.M.A.R.T. Programme: Synthetics Monitoring: Analysis, Reporting and Trends ATS trends, programme progress and planned expansion Regional SMART Workshop, Bangkok, 5-6 August 2010 Beate Hammond,
Global Trade in Lightweight Coated Writing Paper TradeData International Pty Ltd (www.tradedata.net) Page 1 5/18/2015
 Page 1 5/18/2015") Page 1 5/18/2015 An Analysis of Global Trade in Lightweight paper, coated with inorganic substances, used for writing etc., of which more than 10% by weight of total fibre content consists of fibres obtained
Page 1 5/18/2015 An Analysis of Global Trade in Lightweight paper, coated with inorganic substances, used for writing etc., of which more than 10% by weight of total fibre content consists of fibres obtained
Executive Summary. 1. Trends in World Markets. 1.1 Overview
 Executive Summary 1. Trends in World Markets 1.1 Overview The long-term stabilization of world drug markets continued into 2007, although notable exceptions occurred in some critical areas. As long term
Global EHS Resource Center
 Global EHS Resource Center Understand environmental and workplace safety requirements that affect your global operations. 800.372.1033 bna.com/gelw Global EHS Resource Center This comprehensive research
E/INCB/2009/1 D. Europe 1. Major developments 106
 HIV/AIDS infection were identified from January 1986 to March 2009, up to 7 per cent of those individuals being female. Drug abuse by injection remains the most prevalent factor in HIV transmission in
1.1 Introduction. Global potential opium production, Source: UNODC 10, :+ 78% in the world. Other countries Afghanistan 9,000
 1.1 Introduction Since the 1960s, and in a context of rapid and deep socioeconomic changes throughout the world, the international drug control system has succeeded in containing the spread of annual illicit
MARKET NEWS for pig meat
 MARKET NEWS for pig meat Market analysis 17 September 2018 Week 38 MARKET SITUATION Europe: Trading in fresh legs is at slightly falling prices this week. Trading in other cuts is at largely unchanged
MARKET NEWS for pigmeat
 MARKET NEWS for pigmeat Market analysis 12 February 2018 Week 7 MARKET SITUATION Europe: Trading in fresh legs is at increasing prices. With regard to other cuts, trading is at slightly increasing prices.
INTER-AMERICAN DRUG ABUSE CONTROL COMMISSION C I C A D
 INTER-AMERICAN DRUG ABUSE CONTROL COMMISSION C I C A D Secretariat for Multidimensional Security FIFTY-EIGHTH REGULAR SESSION November 11-13, 2015 Trujillo, Perú OEA/Ser.L/XIV.2.58 CICAD/doc.2201/15 27
Overview of ATS trends in East and Southeast Asia
 Overview of ATS trends in East and Southeast Asia Presentation to Global SMART Programme Regional Workshop Shawn Kelley Research Analyst Global SMART Programme Phnom Penh, Cambodia 24 July 2012 Structure
Statistics on Drug Misuse: England, 2007
 Statistics on Drug Misuse: England, 2007 Summary For the first time, this annual statistical bulletin presents information on drug misuse among both adults and children. The topics covered include: Prevalence
Global drug trends and sustainable development
 Lau Global drug trends and sustainable development Chloé Carpentier Chief, Drug Research Section UNODC Göteborg, 15 November 2017 Global trends in estimated number of drug users and people with drug user
Fact Sheet: Drug Data Summary
 UNUM OF NATIONAL D R UG CONTR OL Office of National Drug Control Policy Drugs & Crime Clearinghouse OF THE PRESIDENT OFFICE E PLURIBUS EXECUTIVE OFFICE OF THE UNITED STATES POLICY Drugs & Crime Data Fact
Taking Stock of the 2009 PoA Research and Trend Analysis Branch
 Taking Stock of the 2009 PoA Research and Trend Analysis Branch Eliminate or reduce significantly and measurably: The five targets Illicit cultivation of opium, coca, cannabis Illicit demand of drugs and
1.4 Cannabis Market Summary trend overview
 1.4 Cannabis Market 1.4.1 Summary trend overview Cannabis is the largest illicit drug market by far and its size is one of its most important characteristics. Its consumer market is large, roughly 16 million
Report 2016 REGIONAL HIGHLIGHTS AFRICA AMERICAS. Central America and the Caribbean INTERNATIONAL NARCOTICS CONTROL BOARD
 REGIONAL HIGHLIGHTS AFRICA Africa not only a trafficking hub: Africa continues to be one of the main drug trafficking transit regions: while the continent is a main transit region for drug trafficking,
FACT SHEET 1 IRAN (ISLAMIC REPUBLIC OF)
") FACT SHEET 1 IRAN (ISLAMIC REPUBLIC OF) Territory: Borders: 1,648,195 sq. km. Azerbaijan (432 km/268 mi) and Armenia (35 km/22 mi) to the north-west; Turkmenistan (992 km/616 mi) to the north-east; Pakistan
FACT SHEET 1 IRAN (ISLAMIC REPUBLIC OF) Territory: Borders: 1,648,195 sq. km. Azerbaijan (432 km/268 mi) and Armenia (35 km/22 mi) to the north-west; Turkmenistan (992 km/616 mi) to the north-east; Pakistan
Hong Kong. Livestock and Products Annual. Annual
 THIS REPORT CONTAINS ASSESSMENTS OF COMMODITY AND TRADE ISSUES MADE BY USDA STAFF AND NOT NECESSARILY STATEMENTS OF OFFICIAL U.S. GOVERNMENT POLICY Required Report - public distribution Hong Kong Livestock
A Preliminary Report on Trends and Impact. Mike McGrath. January Montana Attorney General
 Methamphetamine in Montana A Preliminary Report on Trends and Impact January 2007 Mike McGrath Montana Attorney General 1 Methamphetamine in Montana A Preliminary Report on Trends and Impact January 2007
Identifying Europe s information needs for effective drug policy Lisbon, EMCCDA
 Cannabis Market in Europe: A Growing Domestic Market (First Results) Jean-Michel Costes, Christian Ben Lakhdar OFDT 3 avenue du Stade de France 93218 Saint-Denis La Plaine cedex Tel : 01 41 62 77 16 Fax
Is Fighting Terrorism Undermining the Drug War Effort? Eduardo A. Gamarra Director
 Is Fighting Terrorism Undermining the Drug War Effort? Eduardo A. Gamarra Director Twenty five years after the declaration of the War on Drugs, the policy record is mixed Drugs are still widely available
MYANMAR. Emerging trends and concerns
 MYANMAR MYANMAR Emerging trends and concerns Myanmar remains a major source of methamphetamine pills and opiates in South-East Asia, most of which are manufactured in Shan State in the eastern part of
Underage drinking in Europe
 Underage drinking in Europe There are two major studies on underage drinking which are published every 4 years: HBSC (Health Behaviour in School-aged Children) and ESPAD (The European School survey Project
MARKET NEWS for pig meat
 MARKET NEWS for pig meat Market analysis 7 May Week 19 MARKET SITUATION Europe: Trading in fresh legs is at falling prices. As regards other cuts, trading is largely at unchanged prices. Growing demand
Economic and Social Council
 UNITED NATIONS Economic and Social Council Distr. GENERAL 1 March 1996 ORIGINAL: ENGLISH COMMISSION ON NARCOTIC DRUGS Thirty-ninth session Vienna, 16-25 April 1996 Item 5 of the provisional agenda* ILLICIT
MARKET NEWS for pig meat
 MARKET NEWS for pig meat Market analysis 4 April 2016 Week 14 MARKET SITUATION Europe: Pork legs and other cuts were traded at largely unchanged prices this week. UK: the bacon market is stable. Third
FACT SHEET IRAN (ISLAMIC REPUBLIC OF)
") FACT SHEET IRAN (ISLAMIC REPUBLIC OF) Territory: Borders: 1,648,195 sq. km. Azerbaijan (432 km/268 mi) and Armenia (35 km/22 mi) to the north-west; Turkmenistan (992 km/616 mi) to the north-east; Pakistan
FACT SHEET IRAN (ISLAMIC REPUBLIC OF) Territory: Borders: 1,648,195 sq. km. Azerbaijan (432 km/268 mi) and Armenia (35 km/22 mi) to the north-west; Turkmenistan (992 km/616 mi) to the north-east; Pakistan
Research paper: Legal treatment of the use of cannabis for medical purposes in the member states of the European Union
 Parliament of Montenegro Parliamentary Institute Research Centre Research paper: Legal treatment of the use of cannabis for medical purposes in the member states of the European Union Podgorica, December
Global market for synthetic stimulants expanding
 (d) Cross-cutting issues: new challenges, threats and realities in preventing and addressing the world drug problem in compliance with relevant international law, including the three drug control conventions;
INTER-AMERICAN DRUG ABUSE CONTROL COMMISSION C I C A D
 INTER-AMERICAN DRUG ABUSE CONTROL COMMISSION C I C A D Secretariat for Multidimensional Security FIFTY-SECOND REGULAR SESSION November 28-30, 2012 San José, Costa Rica OEA/Ser.L/XIV.2.52 CICAD/doc.1979/12
EMBARGOED UNTIL 26 JUNE AM EDT (5 PM CEST)
") WORLD DRUG REPORT 218 C. CANNABIS Global seizures change from previous year -1% herb 6% resin Global number of users 4.682 tons cannabis herb Note: Data refer to 216. 1.631 tons cannabis resin 216 192.2
WORLD DRUG REPORT 218 C. CANNABIS Global seizures change from previous year -1% herb 6% resin Global number of users 4.682 tons cannabis herb Note: Data refer to 216. 1.631 tons cannabis resin 216 192.2
Launch of the INCB Annual Reports 2015
 Launch of the INCB Annual Reports 2015 Werner Sipp, INCB President 2 March 2016 1 The 3 Reports 2 Mandate of INCB Promote and monitor compliance with the 3 international drug control conventions by: Annual
D. Europe. 5. Abuse and treatment. 1. Major developments
 CHAPTER III. ANALYSIS OF THE WORLD SITUATION 83 5. Abuse and treatment 584. Nearly 20 per cent of the world s opiate abusers reside in West Asia, as increasing production of opium in Afghanistan has resulted
EU Market Situation for Poultry. Committee for the Common Organisation of the Agricultural Markets 20 April 2017
 EU Market Situation for Poultry Committee for the Common Organisation of the Agricultural Markets 2 April 217 -9.% -11.% -5.% -.1% -.7% -2.2% 3.% 1.7% 1.2%.8%.6%.%.%.% 7.9% 7.% 6.4% 6.2% 6.% 5.5% 5.3%
MARKET NEWS for pig meat
 MARKET NEWS for pig meat Market analysis 8 April 2019 Week 15 MARKET SITUATION Europe: Trading in legs and other cuts is at slightly increasing prices this week. UK: Sales are at increasing prices Demand
D. Europe. 1. Major developments
 691. The prevalence rates for abuse of opiates remained low in the countries on the Arabian Peninsula, with heroin being the main opiate abused. Opiates were also the main substances causing drug-related
Overview of drug-induced deaths in Europe - What does the data tell us?
 Overview of drug-induced deaths in Europe - What does the data tell us? João Matias, Isabelle Giraudon, Julián Vicente EMCDDA expert group on the key-indicator Drug-related deaths and mortality among drug
Annual prevalence estimates of amphetamines use in the late 1990s
 Estimates - Consumption Even though in the USA, the world s largest cannabis market, cannabis use increased slightly in compared to a year earlier (both annual and monthly prevalence rates were going upwards)
Access to treatment and disease burden
 Access to treatment and disease burden Robert Flisiak Department of Infectious Diseases and Hepatology Medical University in Białystok, Poland Moulin de Vernègues, 27-29 August 2015 Disclosures Advisor
SUPPLY OF OPIATE RAW MATERIALS AND DEMAND FOR OPIATES FOR MEDICAL AND SCIENTIFIC PURPOSES
 SUPPLY OF OPIATE RAW MATERIALS AND DEMAND FOR OPIATES FOR MEDICAL AND SCIENTIFIC PURPOSES 1. The International Narcotics Control Board (INCB), in fulfilment of the functions assigned to it under the Single
1. Overview of global and regional drug trends and patterns
 1. Overview of global and regional drug trends and patterns The following chapter first draws together information on the global drug problem in its three main sectoral dimensions production, trafficking
UNODC United Nations Office on Drugs and Crime. drugsmonitoring.unodc-roca.org
 UNODC ABOUT THE DRUGS MONITORING PLATFORM The Drugs Monitoring Platform is a unique global online tool for collecting, monitoring and sharing drug-related data. Initiated jointly by the Paris Pact Initiative,
MARKET NEWS for pig meat
 MARKET NEWS for pig meat Market analysis 23 July 2018 Week 30 MARKET SITUATION Europe: Trading in fresh legs and other cuts is at unchanged prices. UK: Prices are under slight pressure. Sales are reported