Economic Development Master Plan. Town of Foxborough, MA McCabe Enterprises Team
|
|
|
- Ginger Jefferson
- 6 years ago
- Views:
Transcription
1 Economic Development Master Plan Town of Foxborough, MA 2013 McCabe Enterprises Team
2
3 Economic Development Master Plan Town of Foxborough, MA 2013 McCabe Enterprises Team
4 Acknowledgements Foxborough Planning Board Kevin Weinfeld, Chairman William Grieder, Vice-Chairman Gordon Greene, Member Ronald P. Bressé, Member Shannon McLaughlin, Member ( ) John Rhoads, Member Gary Whitehouse, Associate Member ( ) Sharon Wason, Town Planner Gabriela Jordon, Secretary The Foxborough Planning Board, the Planning Department staff and the consultant team wish to thank the many residents and businesses of Foxborough who participated by coming to public meetings, offering comments and suggestions, and answering surveys, and most of all demonstrated a profound desire and commitment to make Foxborough a better place. Planning occurs in a dynamic environment where change and sought-after improvements may happen during the course of developing and writing the plan and strategy. The plan s analysis and public discussion often influence and shape public policy during plan development, as well. Such is the case with the Foxborough Economic Development Master Plan. Notable changes have included moving forward on sewer service, local approval of the Inter-Municipal Agreement for sewer, Invensys becoming Schneider Electric, and Meditech locating in Foxborough. Since change is a constant, specific changes that have occurred during the development of the Master Plan have not always been noted in the text. McCabe Enterprises Team McCabe Enterprises J Mecca Design Paul Lukez Architecture Pare Corporation iv FOXBOROUGH
5 I TABLE OF CONTENTS 1. INTRODUCTION 1 Economic Profile Quick Facts Strategic Location Regional Growth Projections Development Over Time Community Engagement 2. EXISTING CONDITIONS 15 Labor Force Employment Trends Business Establishments Taxes Regional Real Estate Context Commercial/industrial Trends 3. GROWTH SCENARIOS 47 Future Growth Scenarios Scenario 1: Decentralization Scenario 2: Small Rural Town Scenario 3: Growth Nodes Scenario 4: Route 1 Growth Corridor Comparative Evaluation of Scenarios 4. THE GROWTH NODES 61 Growth Nodes Downtown Node Route 1 Node Chestnut Green Node South Route 140/ Foxborough Boulevard Node The Growth Potential of Foxborough s Growth Nodes 5. RECOMMENDATIONS 73 Economic Development Master Plan Goals Recommendations Partnerships and Opportunities 6. APPENDIX 87 A. Metro South/West Workforce Area B. Age Cohort Tables C. Timeline Aerials - Presentation Boards D. Regional Trends Economic Development Master Plan v
6 vi FOXBOROUGH
7 1 INTRODUCTION VISION: The Town of Foxborough is characterized by its rich history, small town traditions and familycentered neighborhoods located at the crossroads of southern Massachusetts. It has many natural resources including beautiful forests, lakes and rivers, a world-class athletic attraction and a picturesque town center. The Foxborough Master Plan seeks to protect this balance and provide for a dynamic local economy and an environmentally sustainable future. Introduction Economic development issues and the desire for a revitalized Downtown Foxborough has been the impetus for a new master plan in Foxborough, the first in nearly fifty years. Town residents as part of the larger vision are seeking a future Foxborough with a dynamic local economy which complements and supports Foxborough s desire to be a small town, family-oriented community. The recent debate over a possible destination resort casino on Route 1 precipitated Foxborough s a vigorous discussion of the Town s economic future. The Foxborough electorate weighed in and decided against any future scenarios with a casino or gaming. The economic development element of the master plan examines the economic development planning context, existing economic conditions in Foxborough both locally and in a regional context, the commercial and industrial areas of Economic Development Master Plan 1
8 Economic Profile Quick Facts Employment of Foxborough Residents 74% of residents 16 and older are in the work force, and one-quarter of them work in the education and health care fields labor force: 9,065 workers unemployment rate: 5.7% 424 Foxborough residents worked at home in 2010, 4.7% of the working population. 7.4% of Foxborough work force is self-employed in 2011 in 684 unincorporated businesses. Income of Foxborough Residents Median household income is $92,370 in % of Foxborough residents live below the poverty line, including 7.2% of residents 65 years and over, and 18.4% of families with related children under 5 years of age. Businesses and Employees (2011) 676 employers are in Foxborough. 12,310 people work in Foxborough. The Employment-Resident ratio is 1.26 jobs for every resident in the labor force. 18% of jobs are in the Arts, Entertainment and Recreation section, which includes the NFL football team, the New England Patriots. 14.2% of jobs are in accommodations and food services sector. 12.3% of jobs are in professional and technical services sector. 10% of jobs are in retail trade sector. 9 % of jobs are in the wholesale trade sector. 37% of jobs are in other sectors average annual wage for Foxborough jobs: $59,384. Total wages paid by Foxborough employers in 2011 totaled: $730.8 million. Financial Bond rating: AA+ by Standard & Poor s and Aa2 by Moody s. 22% of Foxborough s assessed valuation is from the commercial and industrial sectors totaling $ 570,543,312 in FY2012. $15.13 per thousand dollars of assessed valuation is the FY2013 tax rate for commercial and industrial properties. 2 FOXBOROUGH

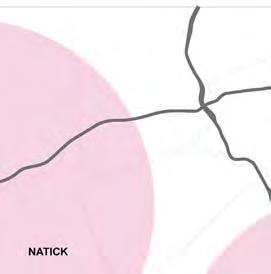
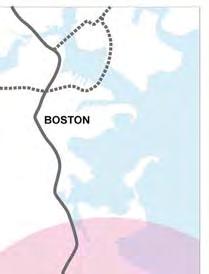
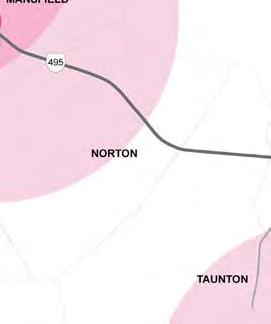
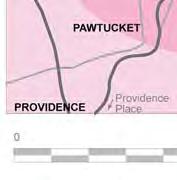
9 town, and future directions. An extensive survey of town residents and a separate business survey were undertaken. The results are discussed in the next sections and are detailed in the Appendix. Strategic Location The Town of Foxborough is strategically located between New England s three largest cities Boston, Providence and Worcester. Foxborough is 29 miles from Boston; 22 miles from Providence and 47 miles from Worcester. (Figure 1.1) Although public transportation is not immediately available in Foxborough, some Foxborough residents take advantage of commuter rail service to Boston boarding at stops in adjacent communities of Mansfield or Sharon. Foxborough has ready highway access to each of these metro areas. I-95 running north and south to Boston and Providence has 3 Foxborough exits, two of which are situated in Foxborough. I-495, the outer circumferential around the Boston metropolitan area is readily available with access from I-95 and Route 1 which connects to Cape Cod and the MassPike westward to Westborough (34 miles) and Worcester. Route 1, which is essentially the historic Boston-Providence Turnpike, traverses the western portion of Foxborough. The strategic location enables Foxborough residents to readily access three different employment centers, which is particularly useful for dual-career couples. Foxboroughbased employers also have the advantage of accessing three different labor markets, drawing upon a larger talent pool. Although Foxborough is considered part of the BOSTON WORCESTER 29 MILES 47 MILES FOXBOROUGH 22 MILES PROVIDENCE Figure 1-1: Proximity of Foxborough to major urban areas. Economic Development Master Plan 3
10 Boston-Cambridge-Quincy metropolitan area and the Metro Southwest Workforce Incentive Area (WIA), its proximity to Providence and Rhode Island enables employers to easily draw upon this labor market, which has had a much higher unemployment rate and somewhat lower hourly wages. The minimum wage is Massachusetts is $8.00 per hour, which is twenty-five cents higher than Rhode Island s minimum wage rate of $7.75 per hour. The 2012 annual unemployment rate in Rhode Island was 10.4%. In contrast, the annual Massachusetts unemployment rate in 2012 was 6.7%. Annual 2012 unemployment rates for Boston- Cambridge-Quincy NECTA area was 6.1% and Foxborough was 5.7%. Regional Growth Projections Foxborough is one of the 101 cities and towns served by the Metropolitan Area Planning Council (MAPC), which adopted a long-term regional plan for 2030, called Metro Futures. Metro Futures is based on six principles: sustainable growth patterns; housing choices; healthy communities; regional prosperity; transportation choices; and healthy environment. Foxborough was classified in Metro Futures as a developing suburb. Foxborough possesses features of both a developing suburb and a maturing suburb under the Metro Futures framework. Under the developing suburb framework, Foxborough is along the I-495 corridor area and enjoys significant open space. Maturing suburb attributes that Foxborough embraces include a sense of community, safety, a majority of single-family homes with yards, and is looking to revitalize its historic town center. MAPC estimates that Foxborough has 2,943 acres of buildable land area, exclusive of wetlands. This is approximately twenty-three percent of the land area in Foxborough, and could entail either prospective commercial or residential development. As part of Metro Futures, MAPC projected population growth and job growth with a 2000 year base-line for the year MAPC developed two future scenario growth projections one based on current practices and a second based on the Metro Futures principles. The population and job growth projections for Foxborough are shown in Tables 1-1 and 1-2. Foxborough s population growth since 2000 has aligned with the population estimates prepared by MAPC. Foxborough s population annual growth rate of 0.4% from 2000 to 2010 is midway between the current trend projection and the Metro Futures scenario projection by MAPC. 4 FOXBOROUGH
11 Despite the Great Recession of when thousands of jobs were lost nationally and in Massachusetts, the number of jobs in Foxborough over the past decade has increased by 30.4%, to 12,310 jobs in This exceeds both the 2030 current trends and Metro Futures projections. In 2011, Foxborough had 892 more jobs than the highest 2030 projection by MAPC. Jobs grew at an annual rate of 3% in Foxborough, which is attributable in part to the development of Patriot Place in past decade, and the growth of Invensys (now Schneider Electric). Employment and job trends are discussed in further detail in Chapter 2: Existing Conditions. Table 1-1. Foxborough Population Projections 2000 Baseline 2010 Actual 2030 Current Trends Projection 2030 Metro Futures Projection Foxborough 16,246 16,865 18,880 17,889 Rate of Annual Change 0.4% 0.5% 0.3% Rate of Decennial Change 3.8% 5.4% 3.4% Sources: Metropolitan Area Planning Commission; US Census; McCabe Enterprises. Table 1-2. Foxborough Job Projections 2000 Baseline 2010 Actual 2011 Actual 2030 Current Trends Projection 2030 Metro Futures Projection Foxborough 9,167 11,951 12,310 9,976 11,418 Rate of Annual Change 3.0% 3.0% 0.3% 0.8% Rate of Decennial Change 30.4% 2.9% 8.2% Sources: Metropolitan Area Planning Commission; ES202; McCabe Enterprises. Economic Development Master Plan 5


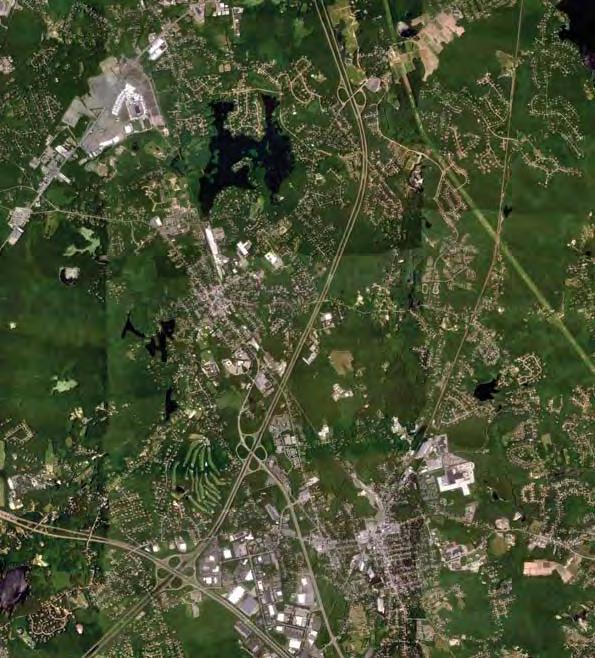
12 Development Over Time The last Foxborough Master Plan was undertaken in 1971, the same year the new, Shaefer Stadium, home of the New England Patriots, was opening. Over the past thirty years, Foxborough has undergone significant change as a suburban community from its historic roots in an agrarian and industrial village structure, to a town with both a local perspective and large regional-serving assets, such as Gillette Stadium, Patriot Place and the Bass Pro Shop. While the population of Foxborough may have increased by only 17% since 1970, the number of and type of businesses and economic activities have grown significantly. Aerial photographs of Foxborough over the last 50 years illustrate decentralized development and opportunity-driven land-use patterns typical of many suburban Massachusetts towns. The downtown commercial core, centered around a town green, has lost it s vitality. (See Figure 1-5.) Growth of multiple small commercial nodes in numerous zones within the town have led to a decrease in physical density and variety of uses in the downtown, decreasing the importance of the once strong, small town character. Parallel to this, residential and commercial growth have spread across the town, leading to a general decrease in the amount of natural open space, farmland and forested area. Figure 1-2: 1965 Aerial Map of Foxborough Gillette Stadium RT-1 Chestnut Green Town Common I FOXBOROUGH
13 Foxborough 1965 In 1965, large portions of the town are largely undeveloped with the majority of built areas concentrated along a central north-south swath axis and on major arterial roads connecting Foxborough with surrounding communities. (Figure 1-2). Route 1 Foxboro Raceway is one of the few developed areas along Route 1. Pre-Shaefer Stadium Construction. Area surrounding raceway is largely wooded and undeveloped. Much of Route 1 frontage is primarily wooded and undeveloped; some suburban residential development and a few pad businesses exist to north. Chestnut Green Some commercial development surrounds the State Hospital buildings. Most development fronts Chestnut Street and stretches down Bakers Street and Railroad Avenue to the Foxborough Company property. Downtown The town Common is the nexus of roads connecting Foxborough with surrounding communities to the north, south and west. As the core of the town, lots surrounding the Common show a dense, finegrained urban fabric a pattern of commercial typical of a New England suburban town. Foxborough 1990 Increased suburban development is scattered across the town by 1990 and numerous small commercial sub-centers have been built along major routes and intersections. Areas to the southeast, east and north, previously undeveloped, now have networks of single family residential development tracts. (Figure 1-3). Route 1 Foxboro Stadium, an open air stadium (originally named Schaefer Stadium). Foxboro Raceway remains to the east. Large areas of parking now cover the area surrounding the stadium; the bulk of stadium-related development remains to the south of Route 1. Suburban residential neighborhoods ringing the stadium property have grown. Commercial development on lots fronting Route 1 has spread north and south of the stadium site. Economic Development Master Plan 7


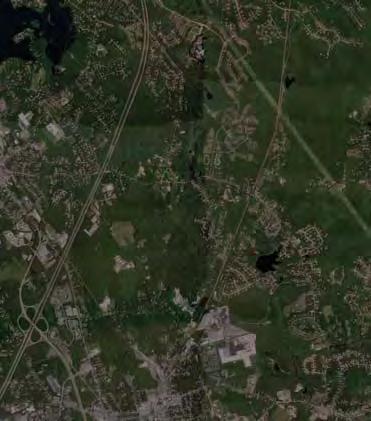
14 Figure 1-3: 1990 Aerial Map of Foxborough Gillette Stadium RT-1 Chestnut Green Town Common I Figure 1-4: 2012 Aerial Map of Foxborough Gillette Stadium Rt 1 Chestnut Green Town Common I FOXBOROUGH
15 Chestnut Green Commercial development around the State Hospital has grown, creating a new node in the town, stretching northward toward the stadium, and along Main Street.. Downtown In the town core, some buildings have given way to parking lots. New commercial development has shifted southward toward I-95 and the Mansfield town line. Foxborough 2012 Continued increase in suburban residential development is evident. Growth of small commercial sub-centers along major routes and intersections increased and a new node has grown at the Mansfield town line, near the Mansfield Crossing commercial area. (Figure 1-4). Route 1 Gillette Stadium, built on a new location in Patriot Place restaurant / retail, built in 2007; the outdoor pedestrian mall is separated from Route 1 by large areas of parking. Restaurant and retail pad buildings now define the edge between the stadium parking and open space/ agricultural land to the south. Significant areas of stadium-related parking have been developed on the northern side of Route 1. Commercial development and parking areas now front the majority of Route 1; little open space remains undeveloped. Chestnut Green Chestnut Green has developed as a sizeable commercial and residential node, stretching the length of Chestnut Street from the resavoir to Main Street. The Fire Station has been relocated to Chestnut Street, serving to further decentralization of the town core. Downtown Buildings in downtown core have been demolished, creating missing teeth in street edge facing the Common and on major arteries leading to downtown. There are an increased number of large parking lots in the core. Key buildings, such as the former Fire Station are now vacant. Retail an commercial development continue to stretch southward toward I-95 and Mansfield. Economic Development Master Plan 9


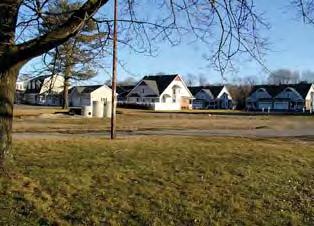
16 Figure 1-5: Comparison of Key Nodes in Foxborough Over Time. Route 1 / Stadium Area Chestnut Green Area Town Center Area PHOTOS OF CURRENT SITUATION Map of Gillette Stadium Area Map of Gillette Stadium Area Map of Gillette Stadium Area Map of Chestnut Green Area Map of Chestnut Green Area Map of Chestnut Green Area Map of Town Center Area Map of Town Center Area Map of Town Center Area 10 FOXBOROUGH


17 Community Engagement The Foxborough Planning Board organized and facilitated the involvement of several hundred residents and business people during the economic development master planning process. A 48-hour open house to kick-off the economic development planning process was held to outreach to the business and residential communities, which drew downtown business and property owners. Three large-scale public forums were held in May 2012, June 2012 and September 2012 throughout Foxborough at the McGuinty Room at the Foxborough Public Safety Building, at the Foxborough High School Library, and the Foxborough Senior Citizens Center. Special outreach was done to the business community, including meetings with the Town s two largest employers, the Kraft Group and Invensys, as well as Route One property owners. Since sewer was identified as a key constraint in business and economic development, especially for the Downtown, a special public meeting on sewer and wastewater issues was held, as well. A focus group of high school students was held to include input from younger residents, as well. Two town-wide surveys were undertaken in spring These surveys were available in both hard copy and electronically to facilitate a wide response. The Tri-Town Chamber of Commerce assisted with the distribution to their business members in Foxborough. Figure 1-6 to 1-9: Photos from the Open House, Town-Wide Plan and Downtown focus community meetings, Economic Development Master Plan 11

18 Responses to Open House Questions During the Economic Development Master Plan Open House in March 2012 persons were asked to identify their favorite place in Foxborough; to identify places that are problematic or need improvement; and to respond to the question If I had a magic wand for Foxborough, I would. The responses were tabulated and the leading responses are noted here. Photographs of people s favorite places in Foxborough are also being shown on the project s web site as Leading Points of Improvement Downtown Traffic Walkability No Casino Foxfield Plaza Sewer Foxboro Plaza Favorite Places in Foxborough Natural areas, forest and conservation land Town Common Library YMCA Hiking Downtown/Town Center Leading Wishes for Foxborough Improve Downtown No Casino Sewer Expanded recreational opportunities Walkability (better sidewalks, walking areas, walking trails) Bike Paths and Trails Restaurant Downtown 12 FOXBOROUGH
19 Economic Development Master Plan 13
20 14 FOXBOROUGH
21 2 EXISTING CONDITIONS. Existing Conditions Economic development entails many aspects of a community its people, businesses, land and natural resources, the transportation network and utilities, as well as its tax and business climate. A strong prosperous local economy relies on the talents and labor of local residents, the business acumen of local entrepreneurs and businesspeople, the availability of suitably zoned land, a good transportation network and utility infrastructure, and local policies which support and encourage business growth and development in balance with the overall quality of community life. To better understand Foxborough in context, the review of existing conditions includes regional comparisons to Foxborough s seven immediately abutting municipalities of Mansfield, Norfolk, North Attleborough, Plainville, Sharon, Walpole and Wrentham, as well as to Norfolk County. The second ring of munici- Economic Development Master Plan 15
22 palities which are one-town away and within 20 minutes driving time include Attleboro, Bellingham, Canton, Dover, Easton, Franklin, Medfield, Medway, Millis, Norton, Norwood, Stoughton, Westwood in Massachusetts and Cumberland in Rhode Island. In this section, the existing conditions in Foxborough pertaining to its residents the local labor force, employment trends, businesses in Foxborough, local wages, commercial real estate trends, the tax environment, and zoning for business development. Transportation and utility infrastructure are discussed in detail in the transportation and infrastructure elements. Labor Force The labor force refers to persons living in Foxborough who are 16 years and older. This is the potential segment of the population that is eligible to work. Amongst Foxborough s 16,865 residents, 13,199 are over 16 years of age or 78.3% of town residents. 9,763 persons in 2011 were part of the labor force for a 74.0% labor participation rate. Persons not participating in the labor force include retirees and people choosing not to work in the labor force, such as stay-at-home parents or persons with physical and mental challenges. The labor force participation rate for women in Foxborough is 70.6%. Table 2-1 shows Foxborough, its population and the potential labor force in regional context. Although, Foxborough is a small community, it is the center of a regional population of 438,000 people. Foxborough is a community that is focused on families. There are 1,076 families with children under 6 years of age in town. Both parents work in over two-thirds (71.9%) of families with young children in Foxborough. There are another 2,912 families with children and youth age 6 to 17 years. Both parents work in almost three-quarters (73.7%) of families with school-aged children in Foxborough. Educational Attainment Educational attainment is correlated with income potential. Today s economy is increasingly reliant on talent and intellectual capital. Computers and technology are a part of nearly every occupation today, requiring additional training and education. Foxborough overall is competitive with its neighboring communities (abutting and second ring), as well as the Commonwealth as to education attainment. 94.7% of Foxborough 16 FOXBOROUGH
23 Population Population 18 years & older Population 65 & Over Labor Force Population 18 and Under Foxborough 16,865 12,785 2,305 9,763 4,080 Percent of Population; Labor Force Participation Rate 75.8% 13.7% 74.0% 24.2% Abutting Towns (7) 124,024 91,711 14,198 64,790 32,313 Percent of Population; Labor Force Participation Rate 73.9% 11.4% 70.7% 26.1% One Town Away (14) 297, ,194 40, ,086 78,014 Percent of Population; Labor Force Participation 73.8% 13.7% 73.5% 26.2% Rate Total 438, ,690 57, ,799 78,014 Percent of Population; Labor Force Participation Rate 73.9% 13.0% 72.5% 26.2% Sources: 2010 US Censes for population; American Community Survey (ACS) 2009, 5 year estimates for labor force for regional data and ACS 2011, 5 year estimates for labor force in Foxborough; McCabe Enterprises. residents over 25 years of age have a high school degree or higher, and 42.4% have a bachelor s degree or higher. Norfolk County, as well as the seven abutting municipalities to Foxborough, have a higher percentage of persons with a bachelor s degree or higher than Foxborough amongst persons 25 years and older, with Norfolk County at 46.9% and the abutting towns in aggregate at 45.4%. Foxborough has the highest proportion of residents over 25 years, 18.1%, who have completed some college. Examining the proportion of residents with bachelor s degree or higher by age cohort in Foxborough reveals that the proportion of persons with a bachelor s degree in the age 25 to 34 years cohort is only 22.4%. This is a lower college graduation attainment rate amongst this age cohort in Norfolk County (38.7%) and statewide (30.9%). More critically, this is a lower college graduation attainment rate amongst older age cohorts in Foxborough, as well. Foxborough residents, 35 to 44 years have a 31.8% rate, and residents, 45 to 64 years have at 25.7% rate of obtaining a bachelor s degree. See Table 2-2 and Figures 2-1 through 2-5 on the following pages. Economic Development Master Plan 17

24 Although this 25 to 34 age cohort has a comparable attainment of graduate degrees as to Norfolk County and a higher graduate degree rate than the state, this does not explain the differential in achievement of bachelor degrees. Other possible causes for the lower attainment of college graduate rate are the higher cost of college, the limited availability of financial aid for college, the decrease in employer-benefits for college tuition, and the possible impacts of the Great Recession. Nonetheless, the next generation of Foxborough residents is not surpassing the educational attainment of the older cohorts. This underscores the need for the Foxborough community to explore the need for satellite higher education classes and continuing education initiatives, perhaps in Downtown Foxborough to address this need. Figure 2-1. Educational Attainment of Persons 25 Years & Older in Foxborough & Region. Source: American Community Survey, 2009, 5 year estimates; McCabe Enterprises. 18 FOXBOROUGH

25 Figure 2-2. Educational Attainment by Age Cohorts in Foxborough. Figure 2-3. Age Cohorts by Educational Attainment in Foxborough. Sources: American Community Survey, 2009, 5 year estimates; McCabe Enterprises. Economic Development Master Plan 19
26 Table 2-2. Educational Attainment by Age Cohort for Foxborough, Norfolk County & Massachusetts Foxborough, MA Norfolk County, MA 18 To to to to and Over Total 18 To to 34 Less than 9th grade th to 12th grade, no diploma ,786 2,065 High school graduate, GED, or alternative , ,214 16,542 12,196 Some college, no degree ,373 20,982 10, ,017 1,455 4, , ,969 11,150 28,562 Graduate or professional degree , ,080 TOTAL 1,168 1,375 2,866 4,662 2,126 12,197 56,024 73,726 Foxborough Percent of Age Cohort Norfolk County 18 To to to to and Over Total 18 To to 34 Less than 9th grade 0.0% 1.9% 0.6% 0.0% 4.6% 1.2% 0.3% 1.2% 9th to 12th grade, no diploma 12.9% 3.5% 3.6% 1.9% 9.7% 4.9% 8.5% 2.8% High school graduate, GED, or alternative 36.7% 17.5% 15.7% 26.4% 40.7% 26.4% 29.5% 16.5% Some college, no degree 31.2% 19.0% 15.9% 21.4% 13.7% 19.5% 37.5% 13.8% 3.9% 16.0% 9.4% 8.5% 4.1% 8.3% 2.6% 6.5% 12.8% 22.4% 31.8% 25.7% 18.9% 24.3% 19.9% 38.7% Graduate or professional degree 2.6% 19.8% 22.9% 16.1% 8.3% 15.5% 1.7% 20.5% TOTAL 100.0% 100.0% 100.0% 100.0% 100.0% 100.0% 100.0% 100.0% Source: American Community Survey, 2009, 5 year estimate; and McCabe Enterprises. 20 FOXBOROUGH
27 35 to to and Over Massachusetts Total 18 To to to to and Over 1,386 4,018 5,478 11,934 10,706 21,200 29,855 76,478 90, ,496 2,727 6,725 8,387 24,690 70,951 44,621 51,694 98, , ,543 Total 19,121 39,431 33, , , , , , ,760 1,395,097 14,232 28,598 14,363 88, , , , , , ,552 9,277 16,416 5,141 37,079 22,413 54,509 86, ,460 40, ,899 30,563 45,769 13, ,060 86, , , , ,738 1,044,456 24,488 41,471 12,421 94,405 6, , , , , , , ,428 92, , , , ,711 1,730, ,710 5,061,250 Percent of Age Cohort Massachusetts Percent of Age Cohort 35 to to and Over Total 18 To to to to and Over 1.4% 2.2% 5.9% 2.4% 1.7% 2.5% 3.1% 4.4% 10.4% 4.5% 2.7% 3.7% 9.1% 4.9% 11.0% 5.3% 5.3% 5.7% 11.7% 7.3% Total 18.8% 21.6% 36.4% 23.9% 30.2% 21.9% 25.6% 26.1% 36.2% 27.6% 14.0% 15.7% 15.5% 17.4% 39.2% 16.4% 15.6% 16.7% 13.7% 18.8% 9.1% 9.0% 5.6% 7.3% 3.5% 6.5% 8.8% 8.9% 4.7% 7.1% 30.0% 25.1% 14.1% 25.5% 13.4% 30.9% 24.6% 20.6% 11.8% 20.6% 24.1% 22.7% 13.4% 18.6% 1.0% 16.4% 17.0% 17.7% 11.6% 14.2% 100.0% 100.0% 100.0% 100.0% 100.0% 100.0% 100.0% 100.0% 100.0% 100.0% Economic Development Master Plan 21

28 Figure 2-4. Educational Attainment by Age Cohort in Norfolk County. Figure 2-5. Educational Attainment by Age Cohort in Massachusetts Sources: American Community Survey, 2009, 5 year estimates; McCabe Enterprises. 22 FOXBOROUGH
29 Occupations & Industries Nearly half (49.3%) of Foxborough residents are employed today in management, business, science and the arts. The number of residents employed in management, business, science and the arts increased by 12.1% since The proportion of Foxborough residents employed in management, business, science and the arts is comparable to residents of Norfolk County (51.2%), and higher than the Commonwealth (43.1%) overall as noted in Table 2-3. The largest shift in occupations amongst Foxborough residents was a 45.9% increase in service employment in 2011 over Residents of Norfolk County and Massachusetts residents were also employed in greater numbers in the service sector, increase of 17.0% and 23.7% respectively. The increase in the service sector employment in Foxborough was nearly three times Norfolk County s and almost doubles the state s rate of increase in service sector employment. Today, 1,525 Foxborough residents work in the service sector. The proportion of Foxborough residents employed in the sales and office sector, the natural resources, construction, and maintenance sector, and the production, transportation, & material moving sector all declined from 2000 to The sales and office sector continues to provide jobs to 22.2% of Foxborough residents. Foxborough residents are employed in a wide range of industries, as illustrated in Table 2-4. The five leading industries employing Foxborough residents in 2011 were in rank order: 1. Education, Health and Social Services (2,309 jobs); 2. Finance, Insurance Real Estate, & Rental and Leasing (1,085 jobs); 3. Manufacturing (1,077 jobs); 4. Professional, scientific, management, administrative, & waste management services ( 1,005 jobs); and 5. Retail (912 jobs). Employment by Foxborough residents in the Finance, Insurance, Real Estate, and Rental & Leasing (FIRE) grew the most between 2000 and 2011, increasing 33.6%. Employment in the FIRE sector fell statewide and in Norfolk County. The education, health and social service sector employed 27.8% more Foxborough residents in 2011 than in Employment amongst Foxborough residents in the education and health sector grew 50% more than Norfolk County and the Commonwealth, which saw increase of 18.9% and 18.2%, respectively. Economic Development Master Plan 23
30 Table 2-3. Change of Occupations, 2000 to 2011 of Foxborough, Norfolk County & Massachusetts Inhabitants. Occupations Foxborough Norfolk County Massachusetts Change Percent Change Change Percent Change Change Percent Change Management, 4,547 4, % 172, ,518 9, % 1,415,385 1,298, , % Business, Science & Arts Percent of Total 49.3% 46.9% 2.4% 50.2% 48.1% 2.1% 43.1% 41.1% 2.1% Service 1,525 1, % 44,379 37,928 6, % 549, , , % Percent of Total 16.5% 12.1% 4.4% 13.0% 11.2% 1.7% 16.8% 14.1% 2.7% Sales & Office 2,050 2, % 84,796 90,565 5,769) -6.4% 784, ,844 (34,399) -4.2% Percent of Total 22.2% 24.7% -2.5% 24.7% 26.8% -2.1% 23.9% 25.9% -2.0% Natural % 21, (1,498) -6.5% 235, ,518 (7,070) -2.9% Resources, Construction, & Maintenance 1 Percent of Total 5.3% 7.5% -2.2% 6.3% 6.9% -0.5% 7.2% 7.7% -0.5% Production, % 19,746 23,349 (3,603) -15.4% 295, ,723 (61,245) -17.2% Transportation, & Material Moving Percent of Total 6.7% 8.8% -2.2% 5.8% 6.9% -1.2% 9.0% 11.3% -2.3% TOTAL Employed Civilian Population Over 16 Yrs 9,232 8, % 342, ,538 5, % 3,280,503 3,161, , % Sources: 2000 Census; 2011 American Community Survey, 5 year estimates; McCabe Enterprises. The manufacturing sector is an important employer of Foxborough residents, in large part since Invensys, one of Foxborough s two major employers is a manufacturer. Although the number of Foxborough residents working in manufacturing declined 5.1% over the past decade, the declines in Norfolk County and statewide were significantly steeper, -16.0% and -21.7%, respectively. Invensys recently committed to a $33 million major reinvestment program in capital facilities at the Neponset and Cocasset campuses near Downtown Foxborough. 1 The Natural Resources, Construction, and Maintenance occupation category is a merger of two occupational categories from 2000 Census data namely the Farming, Fishing and Forestry occupations and the Construction, Extraction and Maintenance occupations. Although these occupational categories reported separately in 2000, they are combined for purposes of comparison with 2011 data. 24 FOXBOROUGH
31 Table 2-4. Industries Employing the Residents of Foxborough, Norfolk County & Massachusetts, 2000 and Industry Agriculture, forestry, fishing and hunting, and mining Foxborough Norfolk County Massachusetts Change Percent Change Change Percent Change Change Percen Change % % 13,127 12, % Construction % 18,155 18, % 184, , % Manufacturing 1,077 1, % 24,264 28, % 317, , % Wholesale trade % 8,652 12, % 84, , % Retail trade 912 1, % 35,231 36, % 356, , % Transportation % 12,227 12, % 122, , % warehousing, & utilities Information % 9,555 14, % 83, , % Finance, insurance, 1, % 38,513 40, % 260, , % real estate, & rental and leasing Professional, scientific, management, administrative, & waste management services 1,005 1, % 50,178 46, % 422, , % Educational, health & 2,309 1, % 94,404 79, % 887, , % social services Arts, entertainment, % 23,207 19, % 263, , % recreation, accommotion & food services Other services (except % 13,986 13, % 149, , % public administration) Public administration % 13,556 13, % 134, , % TOTAL EMPLOYED 9,232 8, % 342, ,538 5, % 3,280,503 3,161, , % Unemployment Over the past decade Foxborough consistently has a lower average annual unemployment rate than the Commonwealth and the US. In 2012, the Foxborough unemployment rate was 5.6%. (See Table 2-5.) In most years over the past decade, Foxborough has tracked fairly closely the unemployment rates of Norfolk County and the Boston Metro area (Boston-Cambridge-Quincy MSA) fairly closely. (See Figure 2-6). The unemployment rate Metro South West Workforce Investment Area (WIA) 2 has been fairly constantly lower than Foxborough and Norfolk County unemployment rates, in part because this area includes the high tech belt communities along Route 128 and Route 2. The Metro Southwest WIA includes Foxborough at the southeastern edge, as well as most municipalities along the I-495 corridor south of Route 2 to Foxborough and Route 128. (See the Appendix for a map of the Metro Southwest WIA area.) 2 The Metro SouthWest Workforce Investment Area is one of sixteen WIAs across Massachusetts created in 1998 as part of the state s response to the federal Workforce Investment Act to have a coordinated system of workforce services. Each WIA has a Regional Employment Board composed of employers identifying workforce needs and issues, as well as One-Stop Career Centers dedicated to assisting individuals who are unemployed and looking for work, as well as employer outreach. Economic Development Master Plan 25
32 Table 2-5. Foxborough Unemployment Rate, 2000 to Year Labor Force Employed Unemployed ,486 8, % ,461 8, % ,449 8, % ,449 8, % ,188 8, % ,075 8, % ,956 8, % ,132 8, % ,100 8, % ,154 8, % ,251 8, % ,250 8, % ,161 8, % Unemployment Rate Source: LAUS, MA Department of Employment & Training; McCabe Enterprises. Figure 2-6. Unemployment Rate, 2000 to FOXBOROUGH

33 Commuting Foxborough has more jobs within its borders than residents in the work force. The employment resident ratio for Foxborough is 1.26 in 2011, which is an increase from the 2000 ratio of Thus, the daytime population of Foxborough is higher than the evening population. Approximately 18.5% of Foxborough residents work in Foxborough. The balance, 81.5% -- or approximately 8,050 residents, of Foxborough s residential labor force, commutes to work beyond Foxborough. Figure 2-7. Commuting Time Changes from 2000 to 2010 by Foxborough Residents. Data Sources: US Census 2000; American Community Survey 2010, 5 year estimates; McCabe Enterprises. Foxborough residents commute and spend on average over an hour a day commuting (30.4 minutes per one-way trip to work). This is the equivalent of over six full weeks of forty-hour work weeks. The change in commuting times amongst Foxborough residents is depicted in Figure 2-7. In general, commuting time to work has generally increased for Foxborough residents over the past decade. Foxborough residents spend more time commuting than their counterparts elsewhere in Massachusetts and the US. Although Norfolk County residents on average spend a comparable time commuting. Economic Development Master Plan 27
34 Foxborough residents rely on their personal vehicles for traveling to work. Although a small minority of residents use public transportation, typically catching the commuter rail service to Boston in nearby Mansfield or Sharon, the vast majority of Foxborough residents use their individual car, and a few carpool. Women tend to choose driving alone to work more frequently than men. This may be attributable to the need to add family-type trips to, before, or after work commutes, such as pick-up and drop-off children from day care or school, grocery shopping, etc. (Table 2-8.) Table 2-6. Mean Travel Time To Work. Mean Travel Time to Work US Massachusetts Norfolk County Foxborough Minutes Data Source: American Community Survey 2010, 5 year estimates. In addition to the 8,050 Foxborough residents commuting beyond Foxborough to work, there are approximately, 10,157 persons who commute to Foxborough for work. Again, in-bound commuters rely principally on their private automobiles to commute to work, since there is no regular work-day public transit in Foxborough. Alternative modes, such as bicycling, are limited as well, although some employers do report that they have employees who bicycle to work. Commuting Time by Foxborough Residents to Work Less than 10 minutes 14.2% 12.1% 10 to 14 minutes 12.0% 13.2% Less than 15 minutes 26.2% 25.2% 15 to 19 minutes 9.6% 10.9% 20 to 29 minutes 18.5% 16.0% 15 to 29 minutes 28.1% 26.8% 30 to 44 minutes 21.2% 21.2% 30 to 44 minutes 21.2% 21.2% 45 to 59 minutes 11.3% 14.0% Over 60 minutes 13.2% 12.8% 45 minutes plus 24.5% 26.7% Data Sources: US Census 2000; American Community Survey 2010, 5 year estimates; McCabe Enterprises. 28 FOXBOROUGH
35 Table 2-8. Travel Mode Choice to Work by Gender All Workers Men Women Car, Truck or Van Drove Alone US Massachusetts Norfolk County Foxborough 76.0% 72.5% 71.4% 83.7% Car Pooled 10.4% 8.3% 6.8% 4.2% Public Transportation 4.9% 9.1% 13.1% 4.2% Car, Truck or Van 75.7% 73.0% 72.5% 81.4% Drove Alone Car Pooled 10.7% 8.3% 6.6% 5.7% Public Transportation 4.6% 8.6% 12.8% 5.0% Car, Truck or Van 76.3% 72.1% 70.2% 86.1% Drove Alone Car Pooled 9.9% 8.2% 7.0% 2.6% Public Transportation 5.3% 9.5% 13.5% 3.4% Data Source: American Community Survey 2010, 5 year estimates. Figure 2-8, the commuting-shed of workers working in Foxborough prepared by the Metropolitan Area Planning Commission illustrates the distance and concentration of persons commuting to Foxborough to work. The largest segment of persons working in Foxborough lives in Foxborough, followed by workers who reside in the neighboring towns of Mansfield, Attleboro, and North Attleborough. The next tier of municipalities with workers who are commuting to Foxborough, ranging from approximately 200 to 300 workers from each community, include Boston, Cambridge, Franklin, Norton, Norwood, Sharon, Taunton, Walpole and Wrentham. Work At Home Foxborough have a small number of residents who do not commute, and rather work at home. 424 persons work at home, which constitutes 4.7% of the working population in Foxborough, according to the 2010 American Community Survey (5 year estimates). Work at home includes persons who perhaps are operating home-base businesses, whether it is independent professions, sales people or persons working in the trades who may use their garage as a business office. It also includes persons who telecommute full-time from their jobs, who may be working full-time for major corporations or for small ventures. Economic Development Master Plan 29
 from the Town Clerk.")
36 Self-Employment Foxborough residents are self-employed operating 684 unincorporated businesses. Approximately 130 individuals obtained business registrations ( Doing Business As registrations for unincorporated businesses) from the Town Clerk. Self-employed individuals are a separate category and are not included in employer data, which is reviewed in the next section on employment trends and businesses. Figure 2-8. Commuting-Shed to Foxborough. 30 FOXBOROUGH
37 Livable Wage For a Foxborough resident to earn sufficient money to live in the community and raise a family, a review of what might constitute a livable wage in Foxborough was undertaken. Four hypothetical households are depicted, namely a two adult household with no children; a two adult household with one teen-age child; a two-adult household with two children, one pre-school child and a school-age child; and a one-adult household with a school-age child. These are fairly typical family households found in Foxborough. It is assumed that each adult in the household will be working full-time. For two adults to reside in Foxborough, each must earn at least $10.44/hour as of 2013, which is $2.44 higher than the minimum wage. For families with children, costs rise. A two-adult household with a teenager, each adult needs to earn $12.59/hour. The scenario with two-adult household with two children, a preschooler and child in school, each adult must earn at least $19.93/hour. Single adult households with a school-age child face greater economic challenges, and need to earn $25.03/hour to cover basic cost of living. The specific estimated costs and needed income are found in Table 2-9. Fortunately, most Foxborough households are not struggling to generate adequate income to cover living costs. However, some are. 2.9% of Foxborough residents live below the poverty line, including 7.5% of persons over 65 years of age. The livable wage is a useful tool to evaluate prospective proposals for projects highlighting new job creation. As an attractive community, the employees of local businesses are likely in-time to consider locating in Foxborough. Two Adults with No Children 2 Adults with 1 Teen-age Child 2 Adults with 1 Preschool Child and 1 School Age Child 1 Adult with 1 School-Age Child Monthly Living Expenses Housing $997 $ 1,171 $ 1,171 $1,171 Utilities $166 $195 $195 $195 Food $570 $ 814 $901 $536 Transportation $429 $473 $ 473 $259 Child Care $ - $1,929 $694 Personal & Household Needs $393 $494 $514 $431 Health Care $ 387 $567 $569 $360 Taxes $691 $753 $1,449 $844 Tax Credit (-)* $ - $ (84) $ (267) $134 Required Earnings for a Livable Income Hourly (per adult) $10.44 $12.59 $19.93 $25.03 Monthly (per adult) $1,817 $2,192 $3,467 $4,356 Annual (per household) $43,596 $52,596 $ 83,208 $52,272 Table 2-9. Livable Wages for Foxborough Residents in Source: Crittenden Women s Union. Economic Development Master Plan 31

38 Employment Trends Foxborough is home to two world renowned entities the New England Patriots (the Kraft Group) and Invensys (the Foxboro Company). These two firms are the largest employers in Foxborough. Invensys has 960 permanent positions in Foxborough, and the Kraft Group employs over 500 people. For most of the twentieth century the fortunes of the Foxboro Company defined Foxborough. With the construction of Shafer Stadium, the forerunner to Gillette Stadium, and the New England Patriots football team making Foxborough its home, recreation, entertainment and shopping have became a larger part of the local economy. These two companies are major employers and have a significant impact on the local economy. In addition to Invensys and the New England Patriots, there are 674 additional businesses operating in Foxborough, for a total of 676 establishments in 2011 employing 12,310 people. Employment at Foxborough-based employers has steadily increased over the past decade, except for a small reduction in 2005 to 2006, as shown in Figure 2-9. Figure 2-9. Employment by Foxborough Establishments, Data Sources: ES202 reports; McCabe Enterprises. 32 FOXBOROUGH
39 A review of the rate of growth in employment levels by Foxborough establishments in comparison to the growth rates of employment by Norfolk County and Massachusetts businesses shows that stronger rates of change, both growth and some losses that the county and state. Foxborough s growth rate of employment has been stronger than the Norfolk County and the Commonwealth. Although Foxborough may have spikes, it has been for the most part it has had positive growth over the past decade. The actual numbers of people employed by Foxborough establishments has steadily increased, although the rate of growth is dynamic. Figure Rate of Employment Growth, , for Foxborough, Norfolk County and Massachusetts. Data Sources: ES 202; McCabe Enterprises The leading sectors ranked by the number of employees are arts, entertainment and recreation; accommodations and food services; professional, technical, and management of firms; wholesale trade and warehousing, followed by education, health care and social assistance. Retail comes in as a close sixth. Economic Development Master Plan 33


40 Figure Foxborough Employment by Industry Sector Data Sources: ES 202 and McCabe Enterprises. Figure Foxborough Employment by Sector, Data Sources: ES202; and McCabe Enterprises. 34 FOXBOROUGH
41 Table Foxborough, Norfolk County & Massachusetts Employment and Establishment Data, EMPLOYMENT Actual Foxborough 9,434 9,804 9,580 10,169 9,937 10,131 10,333 11,316 11,291 11,948 12,310 Norfolk County 327, , , , , , , , , , ,418 Massachusetts 3,276,103 3,202,323 3,142,281 3,139,629 3,161,766 3,197,325 3,236,118 3,245,755 3,136,539 3,150,955 3,191,604 Rate of Change Foxborough 3.9% -2.3% 6.1% -2.3% 2.0% 2.0% 9.5% -0.2% 5.8% 3.0% Norfolk County -1.7% -1.5% -0.1% 0.3% 0.9% 1.4% 0.0% -4.2% 0.8% 0.9% Massachusetts -2.3% -1.9% -0.1% 0.7% 1.1% 1.2% 0.3% -3.4% 0.5% 1.3% ESTABLISHMENTS Actual Foxborough Norfolk County 20,655 21,192 21,628 22,102 21,543 21,495 22,530 24,042 23,433 24,389 24,038 Massachusetts 193, , , , , , , , , , ,093 Rate of Change Foxborough 4.1% 4.9% 4.3% 0.2% 0.7% 3.6% 3.4% -0.2% 6.2% 0.9% Norfolk County 2.6% 2.1% 2.2% -2.5% -0.2% 4.8% 6.7% -2.5% 4.1% -1.4% Massachusetts 3.5% 2.9% 3.2% -2.3% 0.5% 1.4% 1.0% 0.0% 3.7% 1.9% Data Sources: ES202 and McCabe Enterprises. Economic Development Master Plan 35


42 Business Establishments Similar to employment levels, the number of business establishments also grew steadily over the past decade in Foxborough, as noted in Figure Figure Growth in Number of Foxborough Business Establishments 2001 to 2011 Data Sources: ES202; and McCabe Enterprises. Figure Foxborough Number of Establishments by NAICS Code in 2010 Sources: ES202 data 2010; McCabe Enterprises. NAICS is the North American Industrial Classification System and used by the US Bureau of Labor Statistics to identify the primary industry of each business. 36 FOXBOROUGH

43 Figure Foxborough Establishments in 2010 by NAICS Category Sources: ES202 data 2010; McCabe Enterprises. Large employers are an important part of the community s economic spine. Foxborough has two large employers, and many mid-size employers. The numbers of large employers in the neighboring communities as well as the WIA district were examined. Table Larger Employers in Greater Foxborough, 2010 Area Data Source: InfoUSA. # of Companies with Employees Ranked in Top 200 of WIA District Foxborough 2 Adjacent Municipalities 35 One Town Away 98 Municipalities Walpole, Sharon, Mansfield, North Attleborough, Plainville, Wrentham, Norfolk Norwood, Canton, Stoughton, Easton, Norton, Attleboro, Cumberland RI, Bellingham, Franklin, Medway, Millis, Medfield, Dover, Westwood Economic Development Master Plan 37
44 Figure Foxborough Area: Business Sector of Large Employers Data Sources: InfoUSA, Mass DET; McCabe Enterprises. Table Foxborough Businesses Foxborough Sectors with Greatest # of Establishments Sectors with Greatest # of Employees Sectors with Highest Average Weekly Wage Establishments Professional & Technical Services (87) Arts, Entertainment & Recreation (2700) Spectator Sports ($15,852) Employment 12,936 2 Construction (82) Performing Arts & Spectator Sports (2,520) Financial Investments & Related ($4,122) Average Weekly Wage $ 1,296 3 Retail Trade (80) Accommodations & Food Services (1862) Lessors of Real Estate ($3,966) 4 Accommodations & Food Service (61) Profl & Technical Services ( 1,531) Computer Systems Design ($2276) 5 Wholesale Trade (61) Retail Trade (1171) Software Publishers ($2,189) 6 Other Services (81) Wholesale Trade (1045) Profl & Technical Services ( $1,937) 7 Admin & Waste SUVs (43) Educational Services (751) Machinery & Supply Merchant Wholesalers ($1,843) 8 Health Care & Social Assistance (41) Manufacturing (739) Specialty Trade Contractors ($1,830) 38 FOXBOROUGH
45 Taxes The total assessed valuation of properties in Foxborough is $2.6 billion in Commercial and industrial values constitute just over one-fifth (21.8%) of the overall assessed valuation of properties in Foxborough, which totals $2.6 billion dollars. Commercial and industrial properties constitute just under a quarter (22.3%) of the total tax levy assessed valuation. Foxborough in Fiscal Year 2012 adopted a split commercial and residential tax rate for the first time. Generally, split tax rates are sometimes used to gauge the perception of business-friendly policies of the community. In the survey of business and commercial/ industrial property owners, 48.8% indicated that the Town was overly reliant on commercial and industrial taxes. A comparable proportion, 48.6% of Foxborough residents thought the balance between commercial and residential taxes was about right. Amongst the immediately adjacent municipalities, four of the seven have split tax rates, as indicated in Table Real estate taxes are based on the rate per $1, of assessed valuation. Table Tax Rates in Foxborough and Adjacent Towns Tax Rates 2012 Residential Commercial & Industrial Foxborough $ $ Mansfield $ $ Norfolk $ $ North Attleborough $ $ Plainville $ $ Sharon $ $ Walpole $ $ Wrentham $ $ Data Source: Massachusetts Department of Revenue Residential Commercial & Industrial Data Sources: Massachusetts Department of Revenue and Foxborough town records. Economic Development Master Plan 39
46 Figure 2-17: Share of Commercial & Industrial Valuations in Foxborough Tax Base Data Sources: Massachusetts Department of Revenue; McCabe Enterprises. The overall assessed valuation of commercial properties in Foxborough has been steadily rising over the past decade. There was a small decrease in the overall commercial valuation in 2012, which is probably reflective of the decrease in commercial real estate values as a result of the Great Recession. Real estate taxes are a lagging indicator, so valuation changes often take two or more years to appear in the town s overall valuation. Similarly, the proportional share of the commercial class of real properties to Foxborough s tax base has been steadily rising over the past decade. However, the share of industrial class properties has been steadily declining, as shown in Figure This is indicative of the transformation from manufacturing and warehousing to retail and office uses. Table Assessed Value Per SF of Land in Commercial Districts. Chestnut Green Downtown Route 1 All Commercial & Industrial Parcels Data Sources: 2012 Assessed Valuation, Town of Foxborough; McCabe Enterprises. Limited Industrial Mean $ $ $ $ Median $ $ $ 5.50 $ 7.57 High $ $ $ $ Low $ 3.54 $ 5.03 $ 4.53 $ FOXBOROUGH
47 A review of the commercial districts and the total assessed value per square foot of land was undertaken, and reported in Table The concentrated development in Downtown generates a higher per SF of assessed valuation than Foxborough s other districts. Properties on average in Downtown generate $39.46 of assessed value per SF of land, compared with $13.36 along Route 1. Regional Real Estate Context Foxborough is located in the I-495 south/southwest suburban marketplace. I-495 is easily accessed from Foxborough via I-95 and Route 1. The stature and widespread familiarity of the New England Patriots makes Foxborough a household name in the greater Boston and the New England area. Consequently, the heighten place-recognition causes some to perceive Foxborough as part of the Boston/Route 128/south suburban market place. Office and industrial space in Foxborough, particularly along Route 1, as well as Foxborough Boulevard/South Route 140, serve a regional market. Overall, office space in the south suburban and south 495 market place has a higher vacancy and availability rate than most Boston submarkets. Availability rates range from 13.6 to 47% with sublets. Triple-net rents in the I-495 and south suburban office market range from $14.43 to $23.00 per SF, depending upon the quality of the office space. The I-495 South and south suburban industrial market is improving. Rental rates have increased slightly, and now range from $4.93 to $7.15 per SF. Availability rates are 15.1%. One-third of the Greater Boston metropolitan region s industrial space is situ- Table Regional Commercial Real Estate Market AREA TOTAL SF AVAILABILITY RENTS PER SF NNN OFFICE MARKET South million SF 22.3%; 40.3% with sublets 13.8%; 47.1% with sublets $ $19.88 $14.43 $21.00 South Suburban /Rte 128 South 13. million SF 26.9% 15.2% to 26.0% $18.29 $ $23.00 INDUSTRIAL MARKET Route 495 South 27.9 million SF 17.8% 15.1% $5.44 $ $7.15 Sources: Commercial Real Estate Brokers Jones Lang LaSalle, Cushman Wakefield, Hunneman; NAIOP; McCabe Enterprises. Economic Development Master Plan 41
48 ated in the I-495 south and south suburban marketplaces. Table 2-16 provides an overview of the regional office and industrial real estate markets. Recent Local Commercial Real Estate Activity Foxborough over the past eighteen months has experienced changes in some prominent commercial properties. Several vacancies have been filled, most notably the 200,000 SF vacant office building on Constitution Way in the south Route 140 corridor area. Meditech is planning on basing its training facility at its new Foxborough facility. Meditech is a privately-held Massachusetts-based company with $500 million of annual revenues and over 3,400 employees. Meditech is a software provider in the health care infomatics industry, including electronic health records, medical-record imaging, networking and storage. Meditech purchased the building and is renovating the facility. Other noteworthy changes include the opening of a 16,000 SF Trader Joe s grocery store at Patriot Place in the row of large stand-alone retailers in fall The former vacant 14,000 SF Piccadilly Pub restaurant on Route 140, was renovated and became Jake n Joes restaurant-bar filling a highly visible 3.9 acre site on Foxborough Boulevard. In addition, the Kraft Group is permitting some pad site development as part of the Patriot Place property, which will include some retail and a hotel. Table Overview of Land Areas and Existing Build-out as to Land That is Zoned Commercial in Foxborough May 3, 2012 Zoning Classification Economic Development Area Size Acres # of Land Parcels # of Land Owners # of Property owners (land + condo) Assessed Valuation LAND Assessed Valuation BUILDING Assessed Valuation Out Bldg Assessed Valuation Extra Features Assessed Valuation TOTAL ,198, ,205,900 7,701,000 1,781, ,886,700 General Business ,334,800 26,917, , ,500 43,292,100 General Industrial ,925,900 25,567,700 1,213, ,900 45,611,300 Highway Business ,063,600 19,692, , ,800 42,633,400 Limited Industrial ,085, ,575,600 2,548,000 2,435, ,644,900 Neighborhood Business ,639,100 16,552, , ,800 27,401,000 Special Use ,077, ,716,900 10,738,900 2,499, ,032,400 TOTAL 1, $ 315,324,400 $ 910,229,200 $ 24,224,500 $ 8,723,700 $ 1,258,501,800 Data Source: Foxborough 2012 Assessment Records 42 FOXBOROUGH
49 Invensys, Foxborough s largest employer, announced that it will be renovating its Neponset and Cocasset campuses. Invensys plans to make $33 million investment in upgrading its facilities and new equipment, including a $4 million renovation of 38 Neponset Avenue and a $26 million renovation of 70 Mechanic Street. Foxborough Town Meeting authorized its first Tax Increment Financing (TIF) deal with a real estate tax incentive for Invensys over the next twenty years based on its prospective $33 million investment. 3 As part of Invensys investment and upgrade plans, the company plans to vacate the Bristol Campus at 33 Commercial Street in 2015, which is currently leased office space. The office complex at 33 Commercial Street consists of multiple buildings consisting of 78,000 SF on a 41 acre site. This represents a major new office leasing opportunity for Foxborough. The US Post Office (USPS) also announced that it is consolidating its mail sorting operations, some of which are currently handled at 35 Wall Street in Downtown. As a result, the USPS is seeking to a retail space for postal service. USPS intends to dispose of its 25,000 SF facility on nearly three acres Downtown. Vacant Parcels (no bldg) Land Area of Vacant Parcels (acres) Gross Building Area SF Net Building Area SF (livable) Mean Average Parcel Size SF Largest Parcel by SF Smallest Parcel by SF* Median Size Parcel SF Town Owned , ,139 2,628,193 6,114,517 70,132 2,164, , ,033 29, ,323 2,699 13, ,343,218 1,173, ,752 1,400,454 3,485 62, , , , ,750 12,294 89, ,186,791 1,875, ,124 1,805, , , , , ,942 1,635 19, ,638,170 1,487, ,930 6,114,517 1, , ,144,807 5,972,883 3,750,645 17,366,501 92,565 2,594,405 3 Schneider Electric, a French firm, announced its intentions to buy Invensys, a publicly-traded British-based company in July 2013, and finalized acquisition in early Schneider Electric confirmed that the $33 million reinvestment in the Foxborough facilities was continuing with the new ownership. Economic Development Master Plan 43
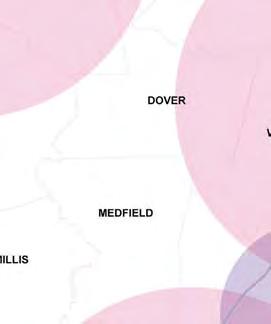
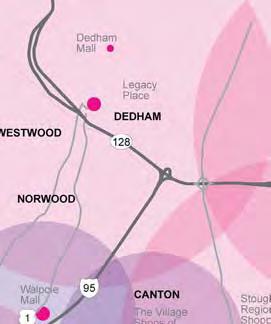
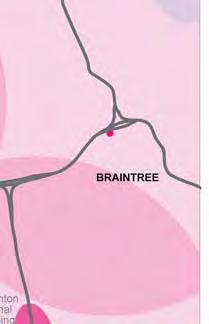
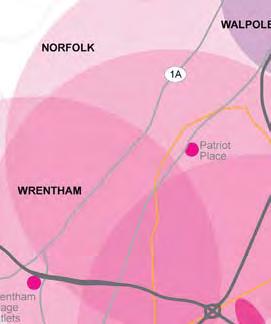
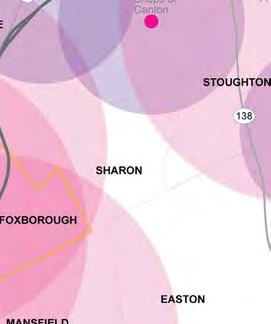
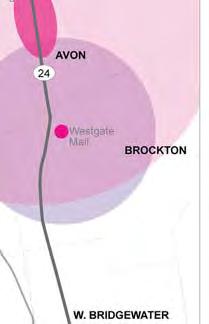
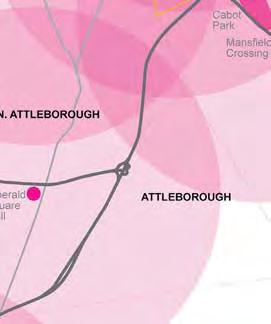
50 These recent real estate transactions and announcements of investments indicate that Foxborough is an attractive locus for businesses and there is an active commercial real estate market. The Great Recession precipitated some business closings and vacancies. Many of these have been since filled, although some remain. Retail Commercial Areas Foxborough has principally four commercial retail areas, namely Downtown, Foxborough Plaza on Commercial Street in the South Route 140 area, Foxfield Plaza on Central Street on the Foxborough-Mansfield town line, and Route 1, which includes Patriot Place and an eclectic mix of strip commercial with service and retail, office buildings, motels and distribution facilities.. Revitalization of Downtown Foxborough has been identified as a leading priority by residents and community leaders. This will require policies that reinforce the concentration of civic and governmental activities and community-serving retail and service establishments in the Downtown. Foxborough operates in a highly competitive retail environment as illustrated in Figure 2-18, which depicts regional retail centers near Foxborough. There are several infill and redevelopment opportunities in Downtown Foxborough. In addition to the US Postal Service site Downtown, there are the Fire Station/ Funeral Home 21,948 SF parcel at the corner of School Street and Rock Hill, the vacant site on School Street, and under-utilized properties along Wall Street. Although, there are no vacancies at Foxborough Plaza and Foxfield Plaza, these two shopping areas are perceived to be under-performing. However, many active small independent businesses now fill these retail storefronts. Both shopping malls were created over forty-years ago, have lost their initial anchor businesses, and have not been upgraded or renovated. Both are candidates for redevelopment. Future redevelopment and renovation of these two strip centers will need to complement Downtown. Efforts are needed to avoid the continued dispersion of commercial activity, which weakens all of the existing retail areas in Foxborough. Supply of Commercially-Zoned Property in Foxborough Foxborough presently, has 1,730 acres of land zoned commercial. This includes 121 vacant parcels encompassing 666 acres. At present, there are 7.1 million SF of buildings on commercially-zoned land in Foxborough. Figure 2-18: Regional Retail Centers 44 FOXBOROUGH


51 Economic Development Master Plan 45
52 46 FOXBOROUGH
53 3 GROWTH SCENARIOS Future Growth Scenarios To identify potential development scenarios for future town growth development trends, connectivity, history and market conditions were reviewed. These contextual conditions were considered with the desired goals and preferences voiced by residents at the open house. To gain an understanding of conditions effecting Foxborough s growth, the reviewed were reviewed: Current patterns of development in Foxborough and surrounding communities Current trends including population growth, jobs and employment The place of Foxborough within the regional commercial and retail marketplace (See Appendix D: Regional Trends) Historical growth of the town (See page 10: Development Over Time) Existing assets and opportunities within the Town These conditions were considered with the values and principles for growth that were voiced at the open house: sustainability, livability, fiscal responsibility, small town ambiance, agrarian history, community connection, and a vibrant town center. Economic Development Master Plan 47


54 After examining current trends and growth patterns, four plausible scenarios for future growth and development over the next twenty years were identified. Scenarios range from maintaining current development patterns, to limitations on growth, to concentration of development in key areas. Scenario 1 is Decentralization, which is a continuation of the current pattern of growth in Foxborough. Scenario 2 is the Small Rural Town with a strong compact downtown. Scenario 3 is Growth Nodes, which connect and concentrate growth in existing commercial areas, namely Route 1, Chestnut-Green, Downtown, and the southern node around Route 140. Scenario 4 is Route 1 Growth Area which promotes and focuses new growth and development in the Route 1 corridor. Scenario 1: Decentralization Scenario 1: Decentralization represents a growth pattern where development is allowed to continue along its current trajectory. It projects a pattern of growth consistent with development trends in Foxborough over the last 30 years: the decentralization of commercial development and construction as businesses move out of the downtown core. Figure 3-1. Scenario 1 Sewer: Minimal Change A key aspect in Scenario 1 is making a commitment to relocate remaining town government offices and facilities to Chestnut Green, including Foxborough Town Hall. Essentially this scenario completes the trend initiated with the relocation of the fire station, and solidifies Chestnut Green as a new heart for Foxborough. Residential growth in Scenario 1 would continue unbridled in the R-40 and more rural areas of Foxborough due to the limited sewer capacity in the downtown areas. At the periphery of the town, growth would continue as businesses located close to the town perimeter in order to maximize their trade areas, and in response to outside regional pressures: along the Route 1 regional entertainment and commercial corridor on the northern edge, and at the Mansfield Crossing commercial/ retail center to the south. In the town center, no change to existing sewer capacity will restrict redevelopment opportunities when aging septic systems no longer are viable. Route 1 to add capacity on a site-by-site basis. All other locations to use existing capacity and infrastructure or build septic systems as allowed. Sewer The main factor impacting growth patterns in the Decentralization scenario is the lack of sewer capacity in the town. As mentioned above, residential growth most likely would continue in the more rural, undeveloped portions of town. In this scenario, existing sewer capacity at Cannon 48 FOXBOROUGH


55 Figure 3-2. Scenario 1: Decentralization Table 3-1. Scenario 1 Data today estimated 2030 population 16,865 18,880 persons under 18 yrs 4,080 3,958 households 6,251 7,600 employment in town 12,936 9,976 today estimated 2030 sewer capacity costs high water capacity costs 1.5 million gal/ day high open space (acres) 3,448 same Economic Development Master Plan 49


56 Forge could be tapped for development on nearby property. In the downtown, new development, redevelopment and change of use on existing businesses/ properties would be constrained due to the limited capacity available. Further pressure on capacity would increase as the smaller lots in the downtown, with aging septic systems will need to convert to the sewer system due to the inability to create new septic systems on constrained lot sizes. Chestnut Green currently has significant capacity available, however connections are limited to the Chestnut Green area. This would most likely serve as a catalyst for increased development in the immediate area. Along Route 1, sewer capacity continues to be an ongoing issue as well. Capacity for growth in this scenario would need to be addressed on a site-by-site basis. Figure 3-3: Continue development of Chestnut Green area by relocating Foxborough Town Hall there. Figure 3-4: Route 1 will continue along current development patterns. Connectivity In this scenario, roads, pathways and access remain as they are at present. Open Space Scenario 1 projects little or no change to existing patterns of open space in the Foxborough. The one recommended addition to current open space is the designation of a buffer zone between the growing uses on Route 1 and the wetlands and residential areas along North Street and Pine Acres Road to the south. Scenario 2: Small Rural Town The premise of the Small Rural Town scenario is to restrict development and prioritize open space, in keeping with Foxborough s tradition as an agrarian community. Incremental growth is provided for in limited areas of the town and attention is paid to preserving existing open space. In order to maintain the character of Foxborough as a small rural town, measures would need to be taken to guide development within defined areas such as downtown and Route 1. This scenario assumes that there would be incremental growth in the Route 1 corridor associated with its current regional use focus. 50 FOXBOROUGH


 3,448")
57 Figure 3-5. Scenario 2: Small Rural Town Table 3-2. Scenario 2 Data today estimated 2030 population 16,865 17,889 persons under 18 yrs 4,080 3,736 households 6,251 7,100 employment in town 12,936 11,418 sewer capacity costs water capacity costs today estimated million gal/ day medium medium open space (acres) 3,448 slight increase Economic Development Master Plan 51


58 Sewer The main goal of Scenario 2 is to focus new sewer capacity in already developed areas as a means of protecting open space by concentrating growth. To manage sewer capacity problems, Scenario 2 envisions creating some additional capacity using existing infrastructure. Capacity would be focused on the downtown area and Route 1, with limited new capacity available for Foxborough and Foxfield Plazas. The town would implement a future flow swap with Chestnut Green whereby the town would use excess capacity at the existing Chestnut Green plant in the short-term to meet critical needs in the downtown. The town would then increase capacity at it s treatment plant at a future date to replace the borrowed capacity from Chestnut Green. Additional capacity could be acquired from Cannon Forge. At Route 1, new capacity would be created incrementally by each new development. Figure 3-6. Sewer: New Capacity/ Existing Infrastructure Connectivity Scenario 2 proposes the addition of bicycle/ pedestrian paths within the core area of the town. East- West connections would serve to tie the Gilbert State Forest to the Foxborough Common and Downtown. They would also strengthen mobility for students between the high school on the west and YMCA to the east. An additional North-South bicycle path would connect the Common to Mansfield Crossing to the south. Focus sewer in currently developed areas as a means of protecting open space. Outside the downtown residential / commercial zone, generate new revenue stream to fund sewer system improvements. Open Space Open space is a town-wide priority in Scenario 2. First, as with Scenario 1, a buffer zone is created between the existing Route 1 regional uses and the residential and wetlands areas immediately adjacent to the south side of the stadium property. Additionally, provisions are made in this scenario for protecting additional open space areas in the south, particularly adjacent to the Gilbert State Forest and on either side of the I-95 corridor. As mentioned above, implementation of a bicycle/ pedestrian pathway system is recommended as a means of connecting open space assets and promoting a walkable, small town environment. 52 FOXBOROUGH


59 Scenario 3: Growth Nodes As with Scenario 2, the Growth Nodes scenario seeks to concentrate new development for maximum benefit with minimum impact to resources and town character. The Growth Nodes scenario proposes concentrating development in distinct locations, or nodes, that mirror the historic pattern of development along the rail line. In this scenario increased connectivity is proposed via a north-south corridor, trolley or bicycle/pedestrian focused, linking points within the town and tying the town to market areas in adjacent communities and potentially beyond. Concentrating growth in areas adjacent to a transportation corridor or pedestrian way promotes a pattern of development -- transit-oriented development -- that reinforces the walkable commercial center Foxborough residents desire to reactivate. The primary nodes identified for focused growth would be the Downtown Growth Node and the North Growth Node, which includes the area of the Route 1 corridor surrounding the rail line. Secondary growth nodes include Chestnut Green Growth Node and the Southern Growth Node, encompassing the Foxborough/ Foxfield Plaza areas. Figure 3-7. Sewer: Growth Node Districts Sewer Similar to Scenario 2, the Growth Nodes scenario focuses new sewer capacity in already developed areas as a means of concentrating growth and preserving town character. However, to manage sewer capacity issues, Scenario 3 envisions creating additional capacity and providing new infrastructure in select locations to limit growth to the already developed areas identified as growth nodes. As a first priority, new capacity would be focused on the downtown area. As with Scenario 2, the first effort to increase sewer capacity would include Implementation of a future flow swap with Chestnut Green, allowing the town would use excess capacity at the existing Chestnut Green plant in the short-term to meet critical needs in the downtown. The town would then increase capacity at it s treatment plant at a future date to replace Create additional sewer capacity and provide infrastructure in select locations that limit growth to already developed areas at new transit nodes. Create new central sewer district to share capacity until future treatment facility can be built. Create new Route 1 sewer district. Economic Development Master Plan 53


60 the borrowed capacity from Chestnut Green. Additional capacity could be acquired from Cannon Forge. At Route 1, Scenario 3 proposes creation of a new Route 1 Sewer District with the existing treatment plant at its center. The Route 1 treatment plant would provide capacity for the North Growth Node. Connectivity With new development both residential and commercial, concentrated in the designated growth nodes, connectivity becomes a key component of implementing Scenario 3. Two new systems promote connectivity within the town: a proposed north-south transportation connection along the existing rail right-of-way, and a new network of bicycle/ pedestrian paths to promote movement throughout the town in a safe manner. Similar to a traditional streetcar suburb model, Scenario 3 concentrates development at specific points along a transportation way. In this case, the existing rail corridor running from Walpole in the north, to Mansfield Crossing in the south is re-invented as a local spine connecting the North Growth Node at Route 1 with Downtown Foxborough and the Common. As a potential long-term consideration, the rail corridor could be used as a trolley link to the MBTA Commuter rail line in Walpole. New technologies and trends in transportation could be implemented, with hybrid, electric and light rail bus-type shuttles that make use of the existing right-of-way with minimal environmental impact on abutting properties. The implementation of a north-south and an east-west network of bicycle/ pedestrian paths is seen as an important component of economic growth in newly defined nodes. These trails not only serve to help residents move more readily between residential and commercial centers, but they likewise promotes the opportunity to connect regional visitors to the state forest with the downtown core, increasing the potential market for business growth. Figure 3-8: Single-family infill housing scaled to surrounding neighborhood. Figure 3-9: Bedford Depot Park, Bedford MA: outdoor recreation and activities for families. Open Space The Growth Nodes strategy, as with the Small Rural Town scenario, seeks to concentrate growth as a means 54 FOXBOROUGH

61 Figure Scenario 3: Growth Nodes Table 3-3. Scenario 3 Data today estimated 2030 population 16,865 18,880 persons under 18 yrs 4,080 3,958 households 6,251 7,700 employment in town 12,936 14,689 today estimated 2030 sewer capacity costs medium-high water capacity costs 1.5 million gal/ day high open space (acres) 3,448 moderate to major increase Economic Development Master Plan 55


62 of preserving open space. Scenario 3 likewise makes provisions for protecting additional open space areas. As part of an effort to increase connectivity between growth nodes in the town, the implementation of a bicycle/ pedestrian pathway system is a key component of the plan. It serves as a means of promoting a walkable, small town environment, allowing for mobility of residents of all ages, and serves to connect open space assets for residents and visitors alike. Scenario 4: Route 1 Growth Corridor The fourth scenario proposes the creation of a Route 1 Growth Corridor as the key commercial development zone within the town. In this scenario, development in the town center would also be a priority, but primarily with a residential focus. This scenario suggests that growth areas in the town along Route 1, as well as around Commercial Street on the southern edge of town, are more aligned with connections to adjacent communities and the region, and less with the core of the town. The majority of the town in this scenario remains a strong residential-based community with supportive local service commercial. In defining the Route 1 Growth Corridor, Scenario 4 chooses to promote the stadium and Route 1 industrial/ commercial zone as an area of focus in providing regional connections as a means for generating economic growth. To this end, Scenario 4 suggests the potential for increased rail service to the stadium area, exploiting the current connection between the Gillette Stadium MBTA stop and Walpole Station on the Franklin/ Forge Park line. Figure 3-11: North American research headquarters for EMD Serrano, Billerica, MA Figure 3-12: Federal Way Transit Center, Seattle WA Sewer In Scenario 4, the primary focus of new sewer capacity is in supporting commercial growth on the Route 1 corridor as a primary growth zone, and providing additional capacity in the town center area for increased residential growth. Similar to Scenario 3, envisions implementation of a future flow swap with Chestnut Green, allowing the town would use excess capacity at the existing Chestnut 56 FOXBOROUGH


63 Figure Scenario 4: Route 1 Growth Area Table 3-4. Scenario 4 Data today estimated 2030 population 16,865 19,142 persons under 18 yrs 4,080 4,156 households 6, employment in town 12,936 14,941 today estimated 2030 sewer capacity costs high water capacity costs 1.5 million gal/ day very high open space (acres) 3,448 moderate to major increase Economic Development Master Plan 57

64 Figure Sewer: Districts - Cooperation & Capacity Green plant in the short-term to meet critical needs in the downtown. The town would then increase capacity at it s treatment plant at a future date to replace the borrowed capacity from Chestnut Green. Capacity could be acquired from Cannon Forge. Additionally, capacity would be increased at the treatment plant to accommodate future growth on Rte 140 and in the town center. At Route 1, Scenario 4 proposes creation of a new Route 1 Sewer District with the existing treatment plant at its center, or, the development of a regional strategy for creating an MWRA connection. Focus additional sewer capacity and infrastructure on Rte 1 development area and new transit node. To allow for town center residential growth create new central sewer district to share capacity until future treatment facility can be built. Connectivity The primary consideration for connectivity in Scenario 4 is providing access for residents to the Route 1 commercial areas in the north. In recognizing the potential for growth on Route 1 as part of a regional network, Scenario 4 suggests the potential for enhanced commuter rail service to the stadium/ Route 1 area. This service would be an augmentation of the current use for game-day service, allowing for the connectivity needed for transit-oriented development to occur in the Growth Corridor area. Open Space In Scenario 4, the primary north-south connection is through a bicycle/ pedestrian path that takes advantage of the existing rail right-of-way between Route 1 and the Foxborough Town Common, and provides a connection through school property in the south. An east-west pathway connects increased residential uses in the downtown with the state forest to the west and the YMCA to the east. An increase in open space preserves are shown in the southwestern area of the town, particularly adjacent to the state forest areas. Scenario Comparison On the following page (Table 3-5) is a comparison of attributes and constraints of the four scenarios. 58 FOXBOROUGH
65 Table 3-5. Comparative Evaluation of Scenarios 1 Decentralization 2 Small Rural Town 3 Growth Nodes 4 Route 1 Growth Area Buffer stadium uses Buffer stadium uses Add transportation connection (rail or alternative growth corridor Capitalize on Route 1 vehicle) Current sewer service remains unchanged; growth is limited by current treatment capacity and private control unused allocations Relocate Town Hall to Chestnut Green Continues residential growth trend in the R-40, more rural sections of Town due to limited sewer capacity at the center. Additional capacity created but with existing infrastructure, focusing growth in town center and route 1, and limited growth at Foxboro/Foxfield plaza area Focus on WWTP capacity at downtown and desired growth ; keep existing collection system Create distinct development nodes along transit stops Create additional sewer capacity and provide select infrastructure improvements to guide development around transit nodes Create incentives for development in growth nodes Increase rail service to stadium station stop to build transit-oriented community Create infill housing within downtown core Additional capacity and new infrastructure focussed on Rte 1 commercial and town center residential growth. Attributes Trend to build and operate business at the perimeter continues. Constraints Sewer connections constrained by existing infrastructure locations Excess capacity will be needed to support aging septic systems in the center of town (on smaller lots, as systems age and fail, they will need hook-up to sewer.) Sanitary sewer capacity limits development in center of Town and forces development to Chestnut Green and the edges of town. Parking requirements constrain small scale shop development. None - continuation of business and growth as is. Existing zoning has higher parking requirements for smaller businesses. Current excess sewer capacity is controlled by multiple private entities. Current sewer rate base is too small to fund meaningful system improvements to infrastructure. Sanitary sewer infrastructure and treatment capacity Stronger nodes will require increased housing and employment. Lack of transit service in Foxborough. Weak welcoming image today at many existing commercial areas in Foxborough. Water capacity may become an issue. Portions of the commercial area along the southern area of Route 1 are in a Zone 2 well head protection area. Need sewer strategy and commitment to an implementation time line. Creation of a Route 1 Wastewater Management District. Active facilitation of Route 1 Sewer/Wastewater Collection/Mgmt District Prerequisites Need Town-Center/Downtown focused Development Policy Requires a commitment to Downtown reinvestment and revitalization Recommended bike trail connectivity with residential, recreational areas, and Downtown Policies to protect open space and discourage additional outer development Creation of a Downtown- Chestnut Hill-Neponset Sewer District area to enable an initial shared resolution of sanitary sewer services. Commitment to increase wastewater treatment capacity and improve sewer collection system in designated growth nodes. Alignment of utility expansion policy with land use growth policy. Design Guidelines for Route 1 and commercial development to promote appropriate scale and design. Appropriate buffer and access between Route 1 and the Town Better gateways to Foxborough are suggested Alternative transportation links (bike, transit) are needed. Economic Development Master Plan 59
66 60 FOXBOROUGH
67 4 THE GROWTH NODES. Growth Nodes Examining current land use and growth patterns in Foxborough, four plausible scenarios for future growth and development over the next twenty years were identified. Scenario 1 is Decentralization, which is a continuation of the current pattern of growth in Foxborough. Scenario 2 is the Small Rural Town with a strong compact downtown. Scenario 3 is Growth Nodes which connects and concentrates growth in the existing commercial nodes, namely Route 1, Chestnut-Green, Downtown, and the southern node around Route 140. Scenario 4 is the Route 1 Growth Area. The scenarios are detailed in prior section 3. These four scenarios were discussed and evaluated as to alignment with Foxborough s vision, as to livability, economic sustainability, and personal preference by citizens at the town-wide master planning workshop and youth at Foxborough High School. Residents favored a Small Rural Town citing the vision, livability, and personal preference. The Growth Nodes scenario was viewed as more economically sustainable for the future of Foxborough. Youth favored the Growth Nodes scenario as to vision, economic sustainability and personal preference. Slightly more youth believed that the Small Rural Town scenario was more livable. The Decentralized and Route 1 Growth Area scenarios were rejected. This section reviews each of the four growth nodes: the Downtown Node; the Route 1 Node; the Chestnut-Green Node; and the South Route 140/ Foxborough Boulevard Node. Economic Development Master Plan 61
68 Figure 4-1. Multi-modal Connectivity Using Existing Rail Right-of-Way Table 4-1. Growth Node Scenario Data today estimated 2030 population 16,865 18,880 persons under 18 yrs 4,080 3,958 households 6,251 7,700 employment in town 12,936 14,689 today estimated 2030 sewer capacity costs medium-high water capacity costs 1.5 million gal/ day high open space (acres) 3,448 moderate to major increase 62 FOXBOROUGH


69 Figure 4-2. Growth Node Areas Downtown Node A vibrant, livable and walkable downtown Foxborough is the social, cultural, and civic heart of the community. It provides services and goods for local residents, area employees and visitors to Town. Redevelopment, new developments and improvements to the Town Center will be compatible with the scale, character, and architecture of the Town s historic and small town, rural patterns. The Downtown and the Town Common are the heart of the Foxborough community. The Downtown Strategy entails enhancing and activating the Town Common with improved pedestrian access and a Farmers Market. The Downtown Strategy recommends better parking management and shared parking, and the following development priorities for strengthening Foxborough s core: Figure 4-3: The fire station site is a potential redevelopment site for an education, youth or cultural use. Retain Town Hall Downtown Fire Station site redeveloped Post Office site re-purposed Economic Development Master Plan 63
70 Figure 4-4. Downtown Node CHESTNUT STNU ST tie to regional trail system connect to chestnut green and route 1 node beyond multi-modal path/ trolley line create trolley stop or point on multi-modal path develop infill housing sites YMCA / Middle School DO DO OWNTOWN TO N focus sewer where needed in downtown to foster development Gilbert State Forest create bicycle connections between downtown and recreational spaces maintain town hall Create a Bike Hub Downtown Housing: - Upper level, mixed use - Cottage infill surrounding Downtown. Foxborough has excellent interstate and arterial road access. Improving pedestrian access and walkability in the Downtown vicinity is an important next step in enhancing Foxborough s transportation network. As Foxborough repairs and repaves its streets and roads, a green, complete streets approach that support cars, sidewalks and bicycles along with trees and best management practices for storm water should be implemented. The addition of transit service and development of a multi-modal parallel path for bicycles, pedestrians, bus or trolley, to the CSX rail line connecting the growth nodes should be explored. Foxborough s scenic roads reinforce the Town s rural character and should be protected. Business retention, recruitment and development of desired new businesses, such as a bakery, restaurant or cafe in Downtown and within the growth nodes is significantly constrained by the lack of wastewater treatment capacity. Downtown is situated in a 64 FOXBOROUGH

71 designated critical needs wastewater treatment area. Action on the resolution of sewer treatment issues is a prerequisite for Downtown revitalization and economic development, and important for protection of the existing homes that need to upgrade aging and failing septic systems where there are critical constraints. Route 1 Node Route One has many faces Foxborough s front door; a world-class athletic attraction with dining and entertainment; nationally and regionally-recognized businesses and services; corporate offices and retail services; natural areas and open space. In addition, Figure 4-5: Route 1 Corridor, Foxborough, MA Route One is home of a variety of distribution-related businesses and services capitalizing on easy access to I-495, Providence and Boston. The vision for the Route One Node reflects the Town s self-image as a family-oriented community that values natural areas and open space, quality jobs and businesses. Route One should be a high-quality front- Figure 4-6. Route 1 Node reserve area north of Route 1 for campus-style development commercial office create trolley stop or point on multi-modal path ROUTE 1 door to Foxborough, that is well-designed, serves the region and Foxborough while maintaining the balance multi-modal path/ trolley line with nature and development, with minimal intrusion into the day-to-day residential life of Foxborough, capitalizing on rail and highway access. A more focused study of and plan for the Route 1 concentrate entertainment activities Foxboro Stadium Growth Node is needed. The framework of the existconnect to chestnut green and downtown ing Highway Business zone along the length of the Route 1 corridor and the Economic Development Overlay District (the Special Use S-1 district) merits pedestrian path/ access buffer between uses a detailed and careful review so that the desired, appropriate growth and design is facilitated. The Town playfields wishes to provide opportunities for both small and larger property and business owners to grow and expand in a manner compatible with good design and CHESTNUT existing physical parameters. Economic Development Master Plan 65


72 Chestnut Green Node Figure 4-7. Chestnut Green Chestnut Green is the new redevelopment of the former multi-modal path/ trolley line Foxborough State Hospital grounds that was closed in Redevelopment into a mixed-use development open space with housing and a neighborhood convenience retail center with banking, child care center, restaurants, playfields and a drug store began in Midway between the Downtown and the Route 1/ Stadium area, Chestnut create trolley stop or point on multi-modal path CHESTNUT Green has been a natural development node. To ensure balanced growth, care should be taken to ensure that further development in this area is complementary Chestnut Green Invensys Property to and supportive of a healthy Downtown core. Proximity to existing play fields and opens space along the lake, in conjunction with current residential development trends at Chestnut Green, have the potential for connect to Downtown building a strong residential neighborhood. Increased residential construction in this node would create a stronger base to support recent existing commercial/ retail development. Creation of a trolley line or multimodal path along the existing rail right-of-way would provide a convenient connection between Chestnut Green residential development and commercial employment centers at Route 1 to the north, and Invensys and Downtown to the south. Figure 4-8: Chestnut Green mixed-use redevelopment includes office, residential and retail uses. Figure 4-9: View of Chestnut Green area. 66 FOXBOROUGH


73 South Route 140/ Foxborough Boulevard Node The South Route 140/Foxborough Boulevard is a commercial node marked with two aging commercial shopping plazas, Foxboro Plaza and Foxfield Plaza, and a commercial office area along Foxborough Boulevard. Both shopping plaza are fully occupied with primarily small local retailers and service establishments. The shopping areas appear tired and in need of an upgrade. In contrast, Foxborough Boulevard is lovely landscaped lane with major office tenants, along with a restaurant and a Courtyard hotel. Steward s Norwood Hospital Cancer Care Center is found on Walnut Street in this node. The Great Recession precipitated some business closures and vacancies in this area. Meditech in 2013 located its training facility and conference center here. At the northern edge of the South Route 140 Growth Node is the Bristol campus of Invensys, which is being vacated in 2015 with the reinvestment and upgrade of their Neponset and Cocasset campuses near Downtown Foxborough. This 41.5 acre corporate office campus built in the 1980s consists of two office buildings, each approximately 44,000 SF with Figure South Route 140/ Foxborough Boulevard Node TO DOWNTOWN Figure 4-11 and 4-12: General Electric and Iconics offices in the South Route 140/ Foxborough Boulevard area. Bristol Campus school playfields Foxboro Plaza PLAZA Growth Area Foxfield Plaza MANSFIELD Economic Development Master Plan 67
74 parking and landscaped areas. Although an attractive setting, the property will likely require internal upgrades for telecommunications and internet to be competitive in today s office market. This site with its easy access to I-95 and I-495 provides an opportunity for Foxborough to work with the Massachusetts Office of Business Development to recruit a significant corporate campus user. This growth node has a healthy mix of uses, residential, retail, services, health care, corporate office tenants, hotels and some restaurants. The primary mode of access is by car. Although some office workers bicycle to work accessing the area by Central Street. The South Route 140/Foxborough Boulevard growth node is significantly influenced by the Route 140 exit and entrance to I-95 and is a major gateway into Foxborough. A major need is to enhance this gateway, particularly the entry to Foxborough Boulevard at Forbes Boulevard, which is dominated by the image of the rear of the aging Foxfield Plaza. A key challenge for this growth node is to sustain the small town image and appearance desired by Foxborough residents as potential development and redevelopment takes advantage of this propitious location. The following tables for each of the four growth nodes highlights the number of parcels, owners, acreage and potential build-out for each of the growth nodes. Overall, there are 1,280.1 acres, just over two square miles of land exclusive of streets, found in the four growth nodes. This provides ample opportunity for commercial and industrial growth. There are 95 vacant land parcels within the 4 nodes, with Route 1 having nearly two-thirds (63) of vacant land parcels. Two of the nodes, Route 1 and the South Route 140/Foxborough Boulevard are situated on the western and eastern edges of Foxborough and capitalize on highway and interstate access. These two growth nodes are the largest, 840 acres along Route 1 and acres in the South Route 140/Foxborough Boulevard node. Traffic generated by business and activities in these nodes will likely be regional and draw on the regional roadway system. Creating alternative transportation modes, such as transit or bicycling, will create options that will mitigate potential congestion generated by these two growth nodes. Connecting the growth nodes will enable each node to have its own distinct identity and provide complementary services. 68 FOXBOROUGH
75 A maximum build-out analysis, based on the maximum permissible development as to Foxborough s zoning by-law of each of the four nodes indicates a potential for nearly $30 million SF of development. Most of this potential growth is along Route 1. Although this maximum build-out scenario is unlikely because it assumes additional build-out where there is already existing development, it clearly suggests that Foxborough has more than adequate land zoned for commercial and industrial use just in the four growth nodes. Figure 4-13: Downtown Commercial Area Overview - Land Value Downtown Summary All Parcels General Business Number of Land Parcels Acreage Gross SF of Building 613, ,233 Total Assessed Value $ 41,080,100 $ 41,080,100 # of Vacant Parcels 9 9 Vacant Acreage Number of Owners Estimated Additional Build-Out under existing zoning setbacks & bldg height (SF.) Zoning analysis; no market considerations. Less Parking Requirements -- Assumed Office or Retail > SF Estimated Additional Build-Out under existing zoning setbacks & bldg height (SF.) -- Assumed Retail less than SF 276, , , ,532 Note only 5 parcels >10, SF build out; 18 parcels > 5000 SF build out Note only 5 parcels > 10,000 SF build out; 14 parcels > 5000 SF build out Acres Acres Smallest Parcel Largest Parcel Mean Median SF SF Smallest Parcel 2,699 2,699 Largest Parcel 129, ,809 Mean 19,119 19,119 Median 11,326 11,326 Data Sources: Foxborough Assessor records and plat maps; 2012 assessed valuation data. NOTE: The existing build-out on 23 parcels in Downtown Foxborough exceeds zoning limits. Economic Development Master Plan 69
76 The major constraint regarding growth is utility capacity, particularly water and sewer. Foxborough with the recent commitments to enter into an inter-municipal agreement with Mansfield and Norton to increase sanitary sewer capacity will have the potential for continued modest incremental growth within the growth nodes. Water conservation, water recycling and the prudent, judicious use of water and protection of existing water resources will continue to be important. Recruitment of businesses should focus on companies with low water usage. Figure 4-14: Route One Commercial Area Overview - Land Value Route One Summary All Parcels General Industrial Zone Limited Industrial Zone Highway Business Zone Special Use Zone Economic Development Overlay District (Part of the Special- Use Zone) Number of Land Parcels Acreage Gross SF of Building 2,314, , , ,301 1,657, ,082 Total Assessed Value $ 756,398,900 $ 8,073,000 $ 8,246,900 $ 15,143,600 $ 724,935,400 $ 661,545,800 # of Vacant Parcels Vacant Acreage Number of Owners Estimated Additional Build-Out under existing zoning setbacks & bldg height (SF.) Zoning analysis; no market considerations. Less Parking Requirements -- Assumed Office or Retail > SF 25,675, ,078 2,022,379 1,313,853 22,092,703 Acres Acres Acres Acres Acres Acres Smallest Parcel Largest Parcel Mean Median SF SF SF SF SF SF Smallest Parcel 1,600 60, ,453 12,294 1,600 15,682 Largest Parcel 6,114, ,030 1,373, ,184 6,114,517 6,114,517 Mean 309, , , , , ,088 Median 95,396 95, ,204 76, , ,587 Data Sources: Foxborough Assessor records and plat maps; 2012 assessed valuation data. 70 FOXBOROUGH
77 Figure 4-15: Chestnut Green Commercial Area Overview - Land Value Chestnut Green Summary All Parcels Neighborhood Business* General Business Number of Land Parcels Acreage Gross SF of Building 214, ,536 17,133 Total Assessed Value $ 29,580,100 $ 27,401,000 $ 2,179,100 # of Vacant Parcels Vacant Acreage Number of Owners Estimated Additional Build-Out under existing zoning setbacks & bldg height (SF.) Zoning analysis; no market considerations. Less Parking Requirements -- Assumed Office or Retail > SF Estimated Additional Build-Out under existing zoning setbacks & bldg height (SF.) -- Assumed Retail less than SF 1,051, , , , , ,781 Acres Acres Acres Smallest Parcel Largest Parcel Mean Median Smallest Parcel 1,634 1,634 6,551 Largest Parcel 6, , ,323 Mean 112, , ,581 Median 39,260 55,539 28,533 Data Sources: Foxborough Assessor records and plat maps; 2012 assessed valuation data. *Does not include Assessed Valuation or gross bldg area of Foxborough Auditorium. Economic Development Master Plan 71
78 Figure 4-16: South Route 140 Commercial Area Overview - Land Value South Route 140/ Foxborough Blvd. Node Limited Industrial Zone Highway Business Zone Total Commercial Residential Zone Publicly Owners Number of Land Parcels Acreage Gross SF of Buildings 160,000,000 1,095, ,778 1,521,266 77,450 0 Total Assessed Value $160,000,000 $ 123,749,900 $ 27,100,000 $ 150,849,900 $ 7,587,800 $ 5,512,800 Building SF/Acre 4,438 6,154 7,241 6,424 2,556 - # of Vacant Parcels Vacant Acreage Number of Owners* Estimated Additional Building under existing zoning setbacks & bldg. height (SF). Zoning Analysis; no market considerations. Less Parking Requirements-- Assumed Office or Retail > SF Estimated Additional Build-Out under existing zoning setbacks & bldg. height (SF). Assume retail less than SF 4,480,000 1,394,000 5,874,000 2,000, ,600 2,622,600 Acres Acres Acres Acres Acres Smallest Parcel Largest Parcel Mean Median SF SF SF SF SF SF Smallest Parcel ,344 10,000 10, ,100 Largest Parcel 2,323,851 1,807, ,992 1,807, ,548 2,323,851 Mean 241, , , ,576 57, ,778 Median 68, ,398 64,904-20, ,034 Data Sources: Foxborough Assessor records and plat maps; 2012 assessed valuation data. * Some owners own property in multiple zoning classifications Most publicly owned parcels are zoned; some are not & are part of I-95 extended r-o-w. 72 FOXBOROUGH
79 5 RECOMMENDATIONS Economic Development Master Plan Goals The following sets forth the vision, principles and goals for guiding future development in Foxborough s designated growth nodes. The companion report, Foxborough Downtown Strategy, provides further detailed recommendations for the Downtown node. Town-wide Vision The Town of Foxborough is characterized by its rich history, small town traditions, family-centered neighborhoods and quality schools located at the crossroads of southern Massachusetts. It has many natural resources including beautiful forests, lakes and rivers, a picturesque town center, and a world-class athletic attraction. The Foxborough Master Plan seeks to protect this balance and provide for a dynamic local economy and an environmentally sustainable future. Values & Principles Sustainability Livability Fiscal Responsibility Economic Development Master Plan 73
80 Community Connection Small Town Vibrant Town Center I. To revitalize Downtown Foxborough as the government, civic and cultural center of Foxborough offering a range of services and goods to serve the Foxborough community. II. III. IV. To preserve Foxborough s natural assets and protect open space by concentrating growth and development. To focus economic development and growth within four growth nodes Route 140/Foxborough Boulevard; Downtown; Chestnut-Green; and Route 1. To support the development of sufficient and appropriate utilities and services to support economic development in the growth nodes, including sewer and water capacity, stable reliable source of electrical services, and multi-modal transportation connections. V. To foster and enhance the redevelopment of existing properties and the filling of vacancies within the growth nodes to diversify and strengthen Foxborough s tax base. VI. VII. VIII. IX. To support a diverse array of independent businesses in Foxborough. To capitalize on Foxborough s tradition of innovation to support the existing businesses and the creation of new businesses, their growth and development to be good employers and corporate citizens of Foxborough. To work with area schools and higher education institutions to develop advance training and education opportunities in Foxborough to sustain and ensure a high quality work force. To foster business growth that enhances the character of livable, walkable growth nodes (Downtown and neighborhoods). X. Provide for balanced growth of regional nodes while preserving small town atmosphere and amenities. XI. To promote multi-modal connectivity between growth nodes in Foxborough through pedestrian, bicycle and transit connectivity. 74 FOXBOROUGH
81 Downtown Vision A vibrant, livable and walkable downtown Foxborough is the social, cultural, and civic heart of the community. It provides services and goods for local residents, area employees and visitors to Town. Redevelopment, new developments and improvements to the Town Center will be compatible with the scale, character, and architecture of the Town s historic and rural patterns. Prerequisites and Challenges Downtown Foxborough faces some key challenges in revitalization, namely sewer and market issues. Resolution of the sewer issue is a prerequisite, and the over arching challenge is strengthening the customer base for Downtown. Both must be addressed with immediate, short-term actions as well as longer-term solutions. a. Short-term and long-term resolution of the sewer issues, namely wastewater treatment services for Downtown properties and businesses. b. Strengthen and build the customer base for Downtown. Principles To achieve revitalization and successfully implement the vision for Downtown Foxborough, six principles to guide future improvements to Downtown Foxborough are: Reinforce and support the Downtown Welcoming Walkability Mixed-use Compact Quality I. To reinforce and strengthen Downtown as the government, civic and cultural center of Foxborough offering a range of services and goods to serve the Foxborough community. II. To provide adequate utilities, especially sanitary sewer services, to Downtown, to enable small businesses to remain and prosper in Foxborough, to foster re-use of existing vacant buildings and properties and promote economic revitalization. Economic Development Master Plan 75
82 III. IV. To improve the economic viability and prosperity of Downtown Foxborough by fostering a mix of uses in Downtown, including education, arts and culture, housing, and upper-story re-use; and concentrating new retail and commercial development in the Town s growth nodes. To enhance Downtown as a place for all ages by providing for activities, amenities and housing for a range of age groups. V. To make Downtown more walkable and accessible to all by providing opportunities for multi-modal access. VI. VII. VIII. IX. To redevelop existing vacant properties and buildings Downtown. To preserve and enhance the historic character and prominence of the Foxborough Town Common, Memorial Hall, the historic properties and nearby Historic District. To broaden the customer base for Downtown Foxborough by providing uses and services that draw Foxborough residents, workers of areas businesses and visitors to Downtown Foxborough. To institute marketing and promotions program for Downtown Foxborough. X. To organize the Town, residents, business and property owners to work together to implement a program to improve and enhance Downtown Foxborough. Strategies There are three over-arching strategies to strengthening and building the customer base for Downtown Foxborough. They are: Increase the number of residents, visitors, and area employees coming to Downtown Foxborough. Create attractions and a reason to come to Downtown Foxborough. Pursue redevelopment opportunities. Route 1 Node Vision Route One has many faces Foxborough s front door; a world-class athletic attraction with dining and entertainment; nationally and regionally-recognized businesses and services; corporate offices and retail services; natural areas and open space. In addition, 76 FOXBOROUGH
83 Route One is home of a variety of distribution-related businesses and services capitalizing on easy access to I-495, Providence and Boston. Foxborough s vision for the Route One Node reflects the Town s self-image as a familyoriented community that values natural areas and open space, quality jobs and businesses. Route One should be a high-quality front-door to Foxborough, that is welldesigned, serves the region and Foxborough while maintaining the balance with nature and development, with minimal intrusion into the day-to-day residential life of Foxborough, capitalizing on rail and highway access. Principles Good Neighbor Good Design and Attractive Accessible and Multi-modal Sustainable economically; environmentally as to use of land and water resources; energy; and equity long-term and short-term. Green Goals I. To solidify and strengthen the commercial tax base component for the Town for the long-term benefit and support to the Town. II. III. IV. To support appropriate concentrated growth and development in the designated EDA area and growth node. To encourage expansion of regular transit service, such as a trolley or bus, connecting Foxborough s growth nodes with a stop serving the Route One Node at Gillette Stadium. To support selected infrastructure investment to guide development around major transit stops. V. To encourage mixed-use development on the land between the CSX rail line, transit stop and the EDA area, thereby strengthening the connection and utilizing transit-oriented development principles. VI. To reserve the large parcels on the west side of Route One for a planned large single corporate development users using a campus-style development. The west side of Route 1 should focus on non-residential development, since access to schools and recreation by children and families is difficult with Route 1. Economic Development Master Plan 77
84 VII. VIII. IX. To foster development that is respectful of the precious water resources in Foxborough and utilizes innovative and best practices in water, wastewater, and energy conservation. To explore the formation of a Route One Wastewater Management District (services area) where land use and utility service plans are aligned. To concentrate development along Route One to avoid sprawl and costly service and utility extensions and investigate utilizing a program of Transfer Development Rights. X. To provide for a pedestrian and bicycle connection between the residential area of Foxborough and Patriot Place, while developing and maintaining a buffer between Route One development and the residential, agricultural and natural areas of Foxborough. Recommendations Following on Table 5-1, are town-wide recommendations that support the vision, principles and goals for guiding Foxborough s economic growth. 78 FOXBOROUGH
85 Table 5-1. Recommendations for Foxborough Town-wide Recommendations for Foxborough Master Plan Economic Development Downtown Rte 1 Transportation Water Sewer Land Use Housing Community Facilities Open Space & Recreation Natural Areas Energy Other 1 Planning Board and Select Board adopt the Vision, Principles and Goals for the future of Foxborough. X 2 Develop an Economic Development web site for the Town of Foxborough, indicating priority development areas and Downtown opportunities. X 3 The Town s Economic Development web site should include an online permitting guide. Many of the boards and departments have already scanned and posted application forms online. Upgrading these scanned forms to online filing or ability to fill-in the blanks using a computer in either MS Word or Acrobat is the next step forward. X 4 The Town through its Planning Board should advise the Executive Office of Housing & Economic Development and the 495 Partnership that Downtown is a priority development area for Foxborough, as well as Route 1. The Economic Development Master Plan and Downtown Strategy should be shared with both organizations. X X 5 The Town should have a single point of contact for Economic Development and joint briefings for applicable permitting boards and Town officials involved in permitting and review for major projects. X 6 The Town should work to improve its image as business friendly and to improve the business environment. X 7 The Town should institute a business-visitation/business call program, visiting businesses annually to let them know Foxborough appreciates them and to determine what, if anything the Town can do to assist them. X 8 A business gardening program should be initiated to support and encourage new business ventures and small businesses to guide growth to priority areas. X 9 Create distinct development nodes Route 140 Southern Node (Foxborough Boulevard; Foxfield Plaza; Foxborough Plaza; Walnut Street); Downtown & Invensys; Chestnut-Green; Route One. X X X X X 10 Focus business development efforts in the downtown and the growth nodes. Downtown is the priority Growth Node. X X X X A detailed plan for the redevelopment of the Foxborough Boulevard, Foxfield Plaza, and Foxborough Plazas should be prepared. Mixed-use development including housing should be encouraged within the growth nodes, especially downtown with mixed-use commercial first floors and upper-story residential. X X X X 13 Enhance the gateways to Foxborough X x a: Route 1 at North Street. Consider redeveloping the former gas station into an information center. b: The view from Route 140 (Commercial Street) at Forbes Boulevard north to Foxborough Boulevard. X X X 14 Add public transportation connection (trolley or bus) connecting the growth nodes. X X 15 Create incentives for development in growth nodes. X Economic Development Master Plan 79
86 Recommendations for Foxborough Town-wide Recommendations for Foxborough Master Plan Economic Development Downtown Rte 1 Transportation Water Sewer Land Use Housing Community Facilities Open Space & Recreation Natural Areas Energy Other a: Create an Economic Opportunity Area for Downtown. X X X b: Use of Tax Increment Financing, where appropriate. X c: Intensity (density) and permitting bonuses for Downtown. X X X d: Consider the use of DIF -- District Improvement Financing. X X X X X X e: Consider the use of Transfer Development Rights along Route One and redirect growth into the growth nodes. X X X 16 Investigate creating a Route 1 Wastewater District. X X X 17 The Town should consider purchasing excess wastewater treatment capacity from Chestnut-Green to address the immediate redevelopment needs of Downtown. X X 18 Align utility (waste water and water) expansion with land use growth policy -- the Growth Nodes. X X X X The Town should committee to increased wastewater treatment capacity and sewer collection system improvements in designated growth areas. The Town working with GATRA and CSX should undertake a feasibility study to consider trolley, bus and alternative modal connections through Foxborough connecting the growth nodes with commuter rail in Mansfield, Walpole and Franklin, which may include utilizing the CSX right-of-way. The Town should amend its contract with GATRA to extend service from downtown Foxborough to Mansfield (in lieu of just the parking lot on County Street.) The Town should support further investigation by the MBTA and regional transportation planners to consider establishing commuter rail stops in Foxborough at Route 1 (Gillette Stadium) and in Downtown Foxborough with the station stop at Bird Street. X X X X X X X X X X X X X X X X 23 Wastewater Treatment Recommendations: X a. Align wastewater service areas, expansion plans to land use plan. b. Connect the elderly housing on Baker/Chestnut Street to the Chestnut Green WW Treatment Plant; X X X X X c. Allocate capacity to Downtown to enable revitalization X X X d. Perform an Infiltration and Inflow (InI) study to recapture capacity within the existing infrastructure; e. Implement a robust water conservation program, using requirements and incentives for Watersense certified products, such as low-flow toilets, showerhead and faucet aerators, and low flow irrigation, thereby reducing amount of wastewater needing treatment. X X X X X X X X X f. Work with existing Mansfield customers (in Foxborough) to buy unused capacity and reallocate it to the Downtown area; and X X X 80 FOXBOROUGH
87 Recommendations for Foxborough Town-wide Recommendations for Foxborough Master Plan Economic Development Downtown Rte 1 Transportation Water Sewer Land Use Housing Community Facilities Open Space & Recreation Natural Areas Energy Other g. Work toward a long-term expansion of Mansfield s treatment plant that will meet the long-term needs of the Town X X X h. Solve the Downtown Sewer Problem X X i. Consider Short-term solution with Chestnut-Green. Explore potential to increase Chestnut-Green capacity through expanded leaching fields X X j. Add WWTP capacity and expand infrastructure to address critical needs area. Expand sewer capacity for Downtown X X X X k. Allow new downtown connections where infrastructure already exists X X X l. Centralize allocation of wastewater services X X X m. condo-ized WWTP capacity needs to be re-aggregated under Town s control; Town should acquire/purchase unused allocations from private entities. X X n. Implement sewer solution incrementally. Don t wait for the perfect solution. X X X o. Consider using other wastewater assets in Town (High School; Land on Center Street) as part of a comprehensive solution. p. Institute a commercial and residential water conservation program (water flow restrictors & aerators on faucets and showers; water conservation/green toilets) X X X X X X X 24 Concentrate growth in four specific nodes as a strategy to preserve open space and rural character within the town of Foxborough. Growth nodes are: Route 140 Southern Node(Foxborough Blvd., Foxfield Plaza, Foxborough Plaza, Walnut Street); Downtown &Invensys; Chestnut Green; and Route One. X X 25 Support development of growth nodes by creating a new transit/ access route connecting areas of concentrated development. Transit stops create natural points for concentration of new development, unlike the sprawl of car-centric development patterns. X X X X X 26 At Foxborough Stadium, concentrate new development along the rail line to take advantage of potential transit connections to the MBTA; northsouth access through town along the existing rail line; and the potential for pedestrian connections to open space at the Ernie George Field and the Lane Property just to the south. X X X X X 27 Create a stronger connection between downtown activities and business, and Chestnut Green housing. X X 28 Concentrate growth to preserve existing open space. X X X X X X Protect additional open space south of I-95 and in the southwest area of the town. Create a green buffer to the south of growth areas along Route 1, particularly between Main Street and Keith Road. This buffer should be inclusive of the Cranberry Bog and Nature Trail. X X X X X X Economic Development Master Plan 81
88 Recommendations for Foxborough Town-wide Recommendations for Foxborough Master Plan Economic Development Downtown Rte 1 Transportation Water Sewer Land Use Housing Community Facilities Open Space & Recreation Natural Areas Energy Other Consider a phased approach to the north-south route. A new bicycle path along the right away could be easily achieved while planning for a potentially larger system such as a tram, trolley or light-rail system. Adopt and implement a green roads policy providing for multi-modal use of Town right-of-way, including provisions for sidewalks within a mile of Downtown and area schools. To enhance and improve the pedestrian connections between Chestnut- Green and Downtown. X X X X X X X X X X 34 To enable easier access to Patriot Place by Foxborough residents, X X a: Provide bicycle and pedestrian access to Patriot Place from North Street. b: Non-commercial vehicle access to Patriot Place from North Street. X X X X X 35 Formulate an Urban Growth Boundary X X X X X X 36 Develop and implement a Transfer Develop Rights for commercial properties focusing new growth in the growth nodes. X X X X 37 Consider becoming a Green Community. X X 38 West side along Route 1 should be set aside for a large single-user, such as a corporate campus, using a Planned Development permit. X X X 39 Encourage planting of trees within the 300 feet setback along Route 1. X X X 40 More focused study of Route One. X X New construction at Patriot Place and Gillette Stadium should focus on area between the stadium and the Commuter Rail station. Develop bicycle/pedestrian connections to link natural amenities, playgrounds and parks, schools and town activity centers. A more focused study and development plan for Foxborough Boulevard/Route 140 should be undertaken. Foxborough should explore work with its neighboring municipalities along Route 1 and major property owners for a Route One corridor study examining the need for multi-modal transportation and traffic improvements, roadway enhancements, economic development and land preservation opportunities, and development guidance. X X X X X X X X X X X X X X X X X X X X X X X X X 82 FOXBOROUGH
89 Partnerships and Opportunities Successful economic development is often undertaken in partnership with regional partners and neighboring communities. Businesses draw workers from the region, including Foxborough and adjacent communities. Businesses often look at general geographic locale, and make final site selection based on specific available sites. Resolution of the major challenge inhibiting economic development and revitalization, namely wastewater treatment and sewer capacity is underway using a regional approach. The Massachusetts Office of Business Development is the lead state agency on business development, typically focusing on larger business development opportunities. MOBD is a key player and the Town needs a strong working relationship with MOBD. The 495/MetroWest Partnership based in Westborough is one of the leading regional economic development organizations. Foxborough is at the southern edge of its service area. The Tri-Town Chamber of Commerce, based in Mansfield, serves Foxborough, Mansfield and Norton, focuses on businesses in these three communities, particularly around the Route 140 corridor. The Neponset Valley Chamber of Commerce, based in Norwood, includes Foxborough in its service area, as well, focusing along the Route 1 corridor. For the most part, the 495 MetroWest Partnership and the Chambers of Commerce focus on larger businesses. Foxborough needs working relationships with these entities to partner on economic development initiatives and to leverage its limited staff and volunteer leadership resources. The Massachusetts Alliance for Economic Development, often referred to as MassEcon, operates a statewide site finder service. Foxborough should encourage property owners and brokers to list larger available sites and commercial and industrial spaces, either for lease or for sale, with the state s site finder service. Foxborough is a member of the I-495/95 South Regional Technology Economic Target Area (ETA), which includes the towns of Bellingham, Franklin, Mansfield, Medway, Norfolk, North Attleborough, Plainville, Walpole, Wrentham, as well as Foxborough. Membership in an ETA enables Foxborough to use the state s Economic Development Incentive Program and offer expanding companies local tax incentives through the Tax Increment Financing (TIF) and Special Tax Assessment (STA) tools. In cases of job creation, particularly with manufacturing, additional state tax incentives may be available on a competitive basis. Economic Development Master Plan 83
90 Small Business Growth & Support Foxborough has 684 unincorporated businesses. The 2007 Economic Census reports that there are 1,263 business firms in Foxborough without employees. Many of the 686 employers in Foxborough are small businesses, with fewer than fifty employees. There is a clear need for small business assistance to support business owners and entrepreneurs who wish to grow. Foxborough has a legacy of cottage industries that have spawned innovation and grown to be large employers, notably the Union Straw Works. Economic gardening, supporting local businesses who wish to grow to grow and expand is an economic development strategy that could build upon this tradition and spawn the next generation of economic activity. Regional partnerships with local colleges and economic development entities to develop an economic gardening initiative to support local business growth should be undertaken. Economic Gardening is an economic development approach that supports and grows the local economy by focusing on small local businesses who wish to grown with the support and tools they need to be successful in today s marketplace. The concept was developed in 1989 in Littleton, Colorado, in response to relocation of a major employer to outside the region. Research indicates that the majority of jobs in most communities are created by existing, high-growth small businesses. Hence, economic gardening works to nurture existing small businesses into becoming a successful larger venture and local employer. Typically, economic gardening initiatives focus on businesses with three to 100 employees and revenue between $600,000 and $50 million. Economic gardening helps these companies identify and tap growth potential. Foxborough should work with its economic development partners to inaugurate an economic gardening program that supports local business growth and development. Small Business Assistance. Existing and aspiring small businesses can often benefit from small business training, lending and assistance. Foxborough s local financial institutions, Foxboro Federal Savings, Rockland Trust, BankAmerica and TD Bank, all offer small business lending and could be a resource in supporting local entrepreneurs in Downtown Foxborough. The Southeastern Economic Development Corporation, or SEED Corp., based in Taunton provides small business assistance and SBA-guaranteed loans, often partnering with local lenders. In addition, SEED provides micro-loans for entrepreneurs and small business training to their borrowers. The Center for Women and Enterprise provides training and assistance to women who are thinking about starting a business. Accion USA is the pioneer in micro-lending providing loans from $200 up to $50,000 to all types of small businesses. The Massachusetts Small Business Development Cen- 84 FOXBOROUGH
91 ters which are affiliated with the state university system, and have offices in Boston and Fall River which can serve Foxborough can be a small business training and connection resource. Both centers have extensive online resources as well. Implementing Economic Development Locally Revitalization of Downtown Foxborough is the leading economic development priority and will require concerted time and leadership. Foxborough should organize a standing Downtown Committee, composed of interested citizens, property and business owners, as well as town leaders, to undertake and advocate for Downtown revitalization activities. Formation of a Business Improvement District (BID) for Downtown Foxborough should be considered to establish the requisite organizational framework necessary for sustained downtown revitalization. A Business Improvement District establishes a plan of action, drawing upon the Foxborough Downtown Strategy, where at least 51% of the property owners must agree to self-assess a small fee to help implement the district s work plan. The work plan could include physical improvements, marketing, clean-up and physical improvements. Formation of a BID can provide the needed additional capacity to the local economic development effort. Additional staffing resources for downtown revitalization with interns, volunteers or part-time staff should be explored, as well. An economic development point person is needed in Foxborough. The Town Manager has previously served in this role. Foxborough undergoing a town manager transition. With a new town manager, the Town should consideration as to who should assume this role. The economic development point person needs to be a strong communicator and collaborator drawing upon the expertise and knowledge of staff and volunteer boards. At present, development is informed and guided by several boards and different Town professionals. Although Foxborough boards tend to be collaborative, at times they have differing perspectives on economic development, which can be confusing to business. The Board of Selectmen, the Planning Board, and the Water & Sewer Board all address economic development issues and need to continue working in close collaboration and alignment. Business, however, needs a single point of initial contact and coordination. Desired economic development and activity that provides jobs and an economic base with a high quality of life just doesn t happen. It requires leadership, sustained effort and attention to details, and inclusion of local values to guide new development. Supporting private initiative is critical within Foxborough s vision for its future. Economic Development Master Plan 85
92 86 FOXBOROUGH
93 6 APPENDIX A. Metro South/West Workforce Area B. Age Cohort Tables C. Timeline Aerials - Presentation Boards D. Regional Trends Economic Development Master Plan 87
94 Appendix A: Metro South/West Workforce Area 3 NECTAs The Metro South/West Workforce Area comprises 43 cities and towns in the following 3 NECTAs LITTLETON CARLISLE The Metro South/West Workforce Area is served by a Workforce Investment Board (WIB) known as the Partnerships for a Skilled Workforce. Partnerships for a Skilled Workforce, like other WIBs, represent the private sector, labor, higher education, business and industry associations, economic development and workforce organizations. They provide leadership in workforce development. Partnerships for a Skilled Workforce is the lead entity for the 43-town Metro South/West Workforce Area. BEDFORD BOXBOROUGH ACTON CONCORD LEXINGTON STOW MAYNARD LINCOLN HUDSON WALTHAM SUDBURY WAYLAND WESTON MARLBOROUGH NEWTON BROOKLINE FRAMINGHAM SOUTHBOROUGH WELLESLEY NATICK NEEDHAM ASHLAND DEDHAM SHERBORN DOVER HOPKINTON WESTWOOD HOLLISTON MILLIS MEDFIELD NORWOOD CANTON MEDWAY WALPOLE NORFOLK SHARON FRANKLIN BELLINGHAM WRENTHAM FOXBOROUGH PLAINVILLE Boston-Cambridge-Quincy, MA NECTA Div. Framingham, MA NECTA Div. Prov.-Fall River-Warwick, RI-MA Metro NECTA Prepared by Massachusetts Department of Workforce Development Economic Analysis Office NECTA stands for New England City and Town Area, which is a geographic term used by the federal government for statistical and analytical purposes for regions in New England. 88 FOXBOROUGH


95 Appendix B: Age Cohort Tables Foxborough Projected Population Change by Age Cohorts 2010 and 2030 Foxborough Population Projection, 2010 to 2030 Labor Force Years Economic Development Master Plan 89


96 Appendix C: Timeline Aerials - Presentation boards Foxborough Maps 2012 Aerial Map & Photos Presented by: McCabe Enterprises Team PARE Corporation Map of Gillette Stadium Area J. Mecca Paul Lukez Architecture, Inc Scale: Photos of Current Gillette Stadium Area May 24th, 2012 Foxborough Maps 1990 Aerial Map & Photos Presented by: McCabe Enterprises Team PARE Corporation Map of Gillette Stadium Area J. Mecca Paul Lukez Architecture, Inc Scale: May 24th, FOXBOROUGH


97 Foxborough Maps 2012 Aerial Map & Photos Presented by: McCabe Enterprises Team PARE Corporation Map of Chestnut Green Area J. Mecca Paul Lukez Architecture, Inc Scale: Photos of Current Chestnut Green Area May 24th, 2012 Foxborough Maps 1990 Aerial Map & Photos Presented by: McCabe Enterprises Team PARE Corporation Map of Chestnut Green Area J. Mecca Paul Lukez Architecture, Inc Scale: May 24th, 2012 Economic Development Master Plan 91


98 Foxborough Maps 2012 Aerial Map & Photos Presented by: McCabe Enterprises Team PARE Corporation Map of Town Center Area J. Mecca Paul Lukez Architecture, Inc Scale: Photos of Current Town Center Area May 24th, 2012 Foxborough Maps 1990 Aerial Map & Photos Presented by: McCabe Enterprises Team PARE Corporation Map of Town Center Area J. Mecca Paul Lukez Architecture, Inc Scale: May 24th, FOXBOROUGH


99 Appendix D: Regional Trends - Grocery Locations Appendix D drawings illustrate general regional trends for Foxborough. The first diagram indicates locations of grocery and food related retail stores in surrounding towns, the bulk of which are clustered on major arterials and are located just beyond the Foxborough town line. Regionally, large scale commercial developments are also clustered along major highways and routes. Here, the bulk of new commercial development is found along I-95, Route 1/ 1A and the 495 loop. Economic Development Master Plan 93


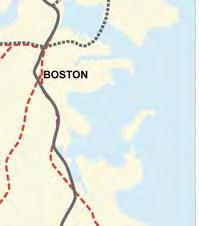


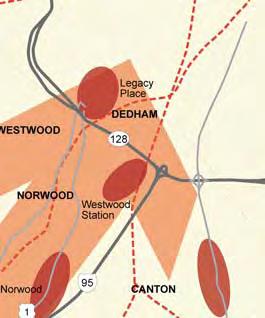


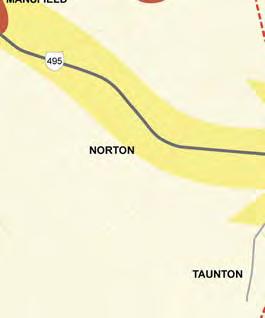
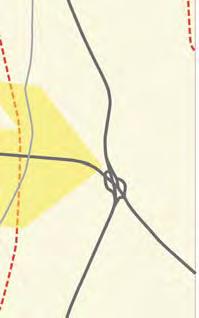
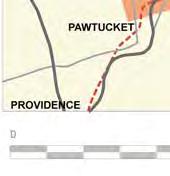


100 Appendix D: Regional Trends - Commercial Growth Patterns 94 FOXBOROUGH
101
102 About the McCabe Enterprises Team McCabe Enterprises provides strategic solutions in public financing, community planning and economic development to public and private sector clients with innovative and award-winning work. A wholly woman-owned consulting firm founded by Kathleen McCabe, AICP, EDP, McCabe Enterprises works with clients to develop customized solutions addressing the unique needs of each client and community. Our approach encompasses planning and economic analysis, financing, community consultation, with a focus on implementation. Our work includes market analysis, feasibility studies, downtown revitalization, public funding, urban renewal, neighborhood planning, industrial retention and redevelopment. McCabe Enterprises can be reached at mccabe@plan-do.com or McCabe Enterprises team members on the Foxborough Downtown Strategy include Kathleen McCabe, AICP, EDP; Jennifer Mecca, R.A. of J Mecca Design; John Shevlin, PE and Tim Thies, PE of Pare Corporation; and Paul Lukez, FAIA and LEED AP of Paul Lukez Architecture. J Mecca Design is headed by Jennifer Mecca, RA, an architect and experienced urban designer whose work includes downtown revitalization, neighborhood planning and redevelopment projects. She brings a breadth of redevelopment experience and work to enable communities to understand proposed redevelopment plans and their impacts. Pare Corporation is a regional multi-disciplinary firm of engineers, environmental and wetland scientists, and GIS/CAD specialists specializing in transportation, environmental, geo-technical and sustainable design with offices in Foxborough and Lincoln RI. John Shevlin, PE, Senior Vice President for Transportation oversaw the transportation components of the Downtown Strategy. Tim Thies, PE, Managing Engineer served as the lead on utility issues, particularly sanitary sewer challenges facing Downtown Foxborough. Paul Lukez Architecture is an internationally recognized design firm led by Paul Lukez, FAIA, LEED AP, a thought-leader on suburban development. Paul Lukez Architecture contributed the visualization of and design plans for future redevelopment in Downtown Foxborough to this Strategy. Beverly Kunze Photography provided the photographs of Foxborough for this report.
103 MCCABE ENTERPRISES 12 Primrose, Boston, MA


104 Economic Development Master Plan Town of Foxborough, MA McCabe Enterprises Team
Proposed Foxborough Service Pilot
 Proposed Foxborough Service Pilot Need and Opportunity Presented by Town of Foxborough Fiscal Management and Control Board July 31, 2017 1 Why the Foxborough Service Pilot? Transportation options in Foxborough
Who is TOD in Metro Denver? April Employee Survey Report. Appendix C: Responses to Survey Questions by Business Type
 Who is TOD in Metro Denver? April 2010 Benchmarking the Evolution of TOD in Metro Denver Employee Survey Report Appendix C: Responses to Survey Questions by Business Type DRCOG Who is TOD in Metro Denver?
Manufacturing Sector Profile for the Shreveport RLMA Parishes. Employment and Wage Trends 4 th Quarter 2015 for the Manufacturing Sector by Parish
 Manufacturing Sector Profile for the Shreveport RLMA Parishes The Labor Market information (LMI) division of Research and Statistics helps provide information on various sectors in the regional economy.
2911 w. 70th street. Powered by CLIFT MARKETING INC.
 2911 w. 70th street Broker Contact Information *Please contact local Broker Paul Draper 315 Fannin Street, Suite 200 Shreveport, LA 71101 Cell: paul@walkeralley.com Managed by: 155 West New York Avenue
Halton Region Transportation Master Plan 2031 The Road to Change December 1,
 Halton Region Transportation Master Plan 2031 The Road to Change December 1, 2009 1 1 Public Information Centre No. 1 March 2010 Halton Region Transportation Master Plan 2031 The Road to Change December
Journey to Work Patterns in Regional Victoria: Analysis of Census Data: 1996, 2001, 2006 and 2011
 Journey to Work Patterns in Regional Victoria: Analysis of Census Data: 1996, 2001, 2006 and 2011 Christina Inbakaran 1 and Erwin Lagura 2 1 Department of Transport, Planning and Local Infrastructure 2
Policy Research CENTER
 TRANSPORTATION Policy Research CENTER Value of Travel Time Knowingly or not, people generally place economic value on their time. Wage workers are paid a rate per hour, and service providers may charge
Introducing Patheon in Milton Park
 Introducing Patheon in Milton Park SCOTLAND ABERDEEN GLASGOW EDINBURGH NORTHEN IRELAND BELFAST LEEDS DUBLIN MANCHESTER LIVERPOOL WALES SHEFFIELD ENGLAND CAMBRIDGE OXFORD CARDIFF BRISTOL MILTON PARK LONDON
New England Sports Village Attleboro, MA
 New England Sports Village Attleboro, MA Mission: To develop a world-class community center that will provide athletes of all ages and abilities a safe and state of the art environment that will help them
ABSOLUTE NNN LEASE 19 Years Remaining 8815 Stagecoach Rd. Little Rock, AR 72210
 ABSOLUTE NNN LEASE 19 Years Remaining 8815 Stagecoach Rd. Little Rock, AR 72210 Price- $6,330,275 Cap Rate-5.45% Absolute Net Lease with 19 Years Remaining on Initial Lease Term. Lease Guaranteed by Walgreen
DRONE FOOTAGE AVAILABLE
 WALGREENS 792 West Main St Rochester, NY Rite Aid #00615 Rochester Walgreens Converted Store Click here to view drone video footage of the property! DRONE FOOTAGE AVAILABLE Click here to view drone photos
Hyattsville Residential Area (68-010)
") Hyattsville Residential Area (68-010) The Hyattsville Residential Area is an excellent example of the many residential subdivisions that emerged in Prince George s County in the late nineteenth and early
Hyattsville Residential Area (68-010) The Hyattsville Residential Area is an excellent example of the many residential subdivisions that emerged in Prince George s County in the late nineteenth and early
WALGREENS DRONE FOOTAGE AVAILABLE. Absolute NNN Lease Investment Opportunity. 758 N Ellington Parkway Lewisburg, TN
 WALGREENS 758 N Ellington Parkway Lewisburg, TN Absolute NNN Lease Investment Opportunity Click here to view drone footage of the property! DRONE FOOTAGE AVAILABLE STUART FRANKEL PRESIDENT NET LEASED DIVISION
Commercial Redevelopment Study
 Commercial Redevelopment Study Impact on Sanibel of Immediate Off-Island Development January 22, 2013 Commercial Redevelopment Study To date, Council has approved a vision statement and identified Sanibel
Social Profile of Burlington, 2006 Initial Findings. November 28, 2008
 Social Profile of Burlington, 2006 Initial Findings November 28, 2008 What has changed since 2001? +13,500 persons (+9%) + 4,900 seniors (+24%)
938 SAN PABLO AVENUE, ALBANY
 938 SAN PABLO AVENUE, ALBANY For Sale: Mixed-Use Property in High-Traffic Location LEASED INVESTMENT WITH OPPORTUNITY FOR OWNER OCCUPANCY PRICE: $1,300,000 (price/sqft: $326) CONTACT: Robert Loebl 510
The association of the built environment with how people travelled to work in Halton Region in 2006:
 The association of the built environment with how people travelled to work in Halton Region in 2006: a geographical area level analysis Halton Region Health Department September 25 2014 Author Fabio Cabarcas,
FREESTANDING RESTAURANT PAD BUILDING OF 11,200 SF AVAILABLE FOR LEASE
 FOR LEASE (DO NOT DISTURB TENANT) RESTAURANT OPPORTUNITY FREESTANDING RESTAURANT PAD BUILDING OF 11,200 SF AVAILABLE FOR LEASE 29540 RANCHO CALIFORNIA ROAD, TEMECULA CA The Promenade Abbot Vascular (164,000
Your Community in Profile: Halton-Peel
 Your Community in Profile: Halton-Peel Peel Halton Building healthy and vibrant communities The Ontario Trillium Foundation is an agency of the Government of Ontario. Table of Contents Introduction...4
HIGHLANDS COMMUNITY DEVELOPMENT DISTRICT
 SIXTH SUPPLEMENTAL ENGINEER S REPORT (Phase 3C Assessment Area) HIGHLANDS COMMUNITY DEVELOPMENT DISTRICT Prepared For: Board of Supervisors Highlands Community Development District Prepared By: Landmark
DRONE FOOTAGE AVAILABLE
 RITE AID 535 Portland Avenue Rochester, NY Rite Aid #03597 Rochester Click here to view drone video footage of the property! DRONE FOOTAGE AVAILABLE Click here to view drone photos of the property! TABLE
WELCOME TO THE ENGINEERING SUCCESS IN THE GREATER TORONTO AREA WEBINAR. Presented by
 WELCOME TO THE ENGINEERING SUCCESS IN THE GREATER TORONTO AREA WEBINAR Presented by Sept. 15 2015 1. Introduction AGENDA 2. Keynote Speaker: 3. Halton Region Case Study: 4. Wrap-up & Video Carl Bodimeade,
The Proposed Pilot Extension of MBTA Commuter Rail Service to Foxborough Response to Questions Posed by the Fiscal & Management Control Board
 The Proposed Pilot Extension of MBTA Commuter Rail Service to Foxborough Response to Questions Posed by the Fiscal & Management Control Board 1. Please provide the documents regarding the Fairmont Line
Silicon Valley Housing and Economic Outlook
 White Paper Silicon Valley Housing and Economic Outlook Santa Clara County, San Mateo County Prepared by John Burns Real Estate Consulting for Pacific Union 11.5.2014 Santa Clara County The booming tech
Braintree District Ward Profiles Braintree West Ward May
 Braintreee District Ward Profiles Braintree West Ward May 2015 1 2 Contents Introduction... 4 About Braintree West Ward... 5 Local Governance... 5 Community Facilities... 5 Schools... 6 Major Businesses,
Regional Municipality of Halton: Economic Development Strategy Discussion Paper #5
 Regional Municipality of Halton: Economic Development Strategy 2011-2021 Discussion Paper #5 Business Growth: Quality of Place and its Influence on Economic Development PREFACE This series of Discussion
The following is a chronological list of ordinances pertaining to the off-sale of alcohol:
 COUNCIL AGENDA: 6/2/15 ITEM: 4.2 CITY OF SAN JOSE CAPITAL OF SILICON VALLEY TO: HONORABLE MAYOR AND CITY COUNCIL SUBJECT: SEE BELOW Memorandum FROM: Harry Freitas DATE: June 1,2015 Approved Date COUNCIL
NET LEASE INVESTMENT OFFERING RITE AID PHARMACY
 RITE AID PHARMACY 11702 Lorain Avenue Cleveland, OH 44111 TABLE OF CONTENTS TABLE OF CONTENTS I. Executive Profile Executive Summary Investment Highlights Property Overview II. Location Overview Photographs
2014 Quality Of Life Survey Statistical Analysis
 2014 Quality Of Life Survey Statistical Analysis May 2014 Derek L. Doughty, P.E. Chair Mitch Thrower Vice Chair Bowen A. Arnold Member at Large Stephanie A. Agliano Stephen L. Benson, AICP Theodore Trent
FANNO CREEK PARK & PLAZA Master Plan. Tigard, Oregon. Final Draft January 29, Prepared by
 FANNO CREEK PARK & PLAZA Master Plan Tigard, Oregon Final Draft January 29, 2008 Prepared by Significance of the Master Plan The master plan provides for the restoration of Fanno Creek Park (from Hall
North Miami-Dade County Retail/Flex Space For Lease First Year Rent Starting at $11.50/SF, Gross
 North Miami-Dade County Retail/Flex Space For Lease First Year Rent Starting at $11.50/SF, Gross Fully Air Conditioned 44,000 SF Retail/Flex Center ± 2,543 Sq. Ft. Showroom/Warehouse Full Glass Window
MAY 17, 2016 CITY COUNCIL STUDY SESSION POLICY DISCUSSION ON MEDICAL CANNABIS CULTIVATION FACILITIES
 MAY 17, 2016 CITY COUNCIL STUDY SESSION POLICY DISCUSSION ON MEDICAL CANNABIS CULTIVATION FACILITIES Staff Presentation 1. Overview of Ordinance 1083 and 1084 and discussion on allowing medical cannabis
Northern Rivers Public Transport Commuter Bus Plan
 Lismore Sustainable Transport Group Commuter Bus Plan 2016 TRANSPORT DEVELOPMENT PROJECT REPORT Northern Rivers Public Transport Commuter Bus Plan Northern Rivers Social Development Council ABN: 77 398
Proposed Foxborough Service Pilot
 Proposed Foxborough Service Pilot Service Pilot Evaluation Recap and Additional Information MBTAFiscal Management and Control Board August 14, 2017 1 Proposed Foxborough Service Pilot: Background March
Rockford Health Council
 2010 Healthy Community Study Rockford Area Early Learning Council Becky Cook Kendall April 12, 2011 Rockford Health Council Community-based healthy community collaborative Formed in 1982 as the Rockford
Public Hearing Summary Report
 Public Hearing Summary Report SH 288 Direct Connectors To the Texas Medical Center Area City of Houston Harris County, Texas CSJ: 0598-01-095 Prepared for Texas Department of Transportation- Houston District
Enabling Cannabis Retail Stores and Facilities Land Use Bylaw
 2018 February 21 Page 1 of 12 EXECUTIVE SUMMARY This report proposes new rules to regulate the retail sale of cannabis in the Land Use Bylaw (LUB). The goal is to provide broad opportunities for cannabis
HCC s 2014 Report to the County Commissioners and Budget Request for FY 15
 HCC s 2014 Report to the County Commissioners and Budget Request for FY 15 Addressing Opportunities and Challenges Presented at a Special Meeting of the HCC Board of Trustees and the County Commissioners
Extremely Rare 24 hour Store Huntington Beach, CA
 Extremely Rare 24 hour Store Huntington Beach, CA Actual Store Exclusively Listed Investment Offering Absolute NNN Walgreens in Huntington Beach, CA. High traffic location with average household income
Halton Region. Business Conditions
 Halton Region Business Conditions 2014 Message from Regional Chair Gary Carr Time and again, innovative business owners in Halton tell me that Halton is a great place to live and work because we offer
Cycle Elements Amended Goals, Objectives, and Policies ESR (Effective August 13, 2018) County Ordinance No City Ordinance No.
 County Ordinance No City Ordinance No.") Tallahassee-Leon County Comprehensive Plan: Table of Amended Policies, 1991-2018 (in reverse order) Cycle Elements Amended Goals, Objectives, and Policies 2018-2 ESR (Effective August 13, 2018) County
Tallahassee-Leon County Comprehensive Plan: Table of Amended Policies, 1991-2018 (in reverse order) Cycle Elements Amended Goals, Objectives, and Policies 2018-2 ESR (Effective August 13, 2018) County
Moving Rural Tennessee Forward: Policy Outlooks for Health and the Economy
 Moving Rural Tennessee Forward: Policy Outlooks for Health and the Economy Rural Health Association of Tennessee 24th Annual Rural Health Conference November 14, 2018 Creating Civic and Economic Opportunity
A Snapshot: Medical Marijuana in Rural New Mexico & Benefits of Legalizing Adult Use of Marijuana in Rural New Mexico
 A Snapshot: Medical Marijuana in Rural New Mexico & Benefits of Legalizing Adult Use of Marijuana in Rural New Mexico A presentation to: NM Legislative Economic & Rural Development Committee November 6,
PARKWAY BUSINESS CENTER
 PARKWAY BUSINESS CENTER 119-123 CANAL STREET POOLER, GA 31322 Adam Bryant, CCIM Partner 912.667.2740 adam.bryant@svn.com SVN GASC 6001 Chatham Center Drive, Suite 120, Savannah, GA 31405 LEASE BROCHURE
KAISER PERMANENTE OF GEORGIA COMMUNITY BENEFIT REPORT
 2016 KAISER PERMANENTE OF GEORGIA COMMUNITY BENEFIT REPORT Partnering to Build Healthy Communities At Kaiser Permanente Georgia, our commitment to improving health has been going strong for more than 30
Most recently amended on January 12, 2010 by resolution 10-R Originally adopted on September 6, 1977, by Resolution No. 77-R-5705.
 CIRCULATION Most recently amended on January 12, 2010 by resolution 10-R-12725. Originally adopted on September 6, 1977, by Resolution No. 77-R-5705. Table of Contents Overview... 103... 113 CIR 1 Circulation
A Guide to MOVING TO SANIBEL
 A Guide to MOVING TO SANIBEL Are You Ready for Island Living? Sanibel Island is one of Southwest Florida s most picturesque island escapes. Here, residents are surrounded by the natural beauty of the island
The Mapping and Analysis of Transportation Needs in Haliburton County Analytical Report. Breanna Webber Viyanka Suthaskaran
 The Mapping and Analysis of Transportation Needs in Haliburton County Analytical Report Breanna Webber Viyanka Suthaskaran Host Organization: Haliburton Transportation Task Force Table Of Contents Introduction
ParkScore. Youth Physical Activity. Outdoor Spaces & Buildings
 ParkScore Borrowed from the Trust for Public Land's framework, this index measures how well cities are meeting the community s park needs. Higher scores indicate better availability of and access to quality
Walgreens. Absolute NNN Single Tenant - Bastrop, LA. Offering Memorandum. Beezie Landry
 Beezie Landry 109 Northpark Blvd., Ste. 300 Covington, LA 70433 985-898-2022 blandry@stirlingprop.com Walgreens Absolute NNN Single Tenant - Offering Memorandum 1 information to the extent such purchaser/lessee
BUILT ENVIRONMENT ACCESS TO HEALTHY FOODS
 Importance Definitions The environment in which we live often shapes the choices we make. If our built environment offers mainly fast food restaurants and liquor stores and we have limited transportation,
PARSONS PHARMACY REDEVELOPMENT
 FOR SALE PARSONS PHARMACY REDEVELOPMENT 294 NW 2nd Avenue, Canby, OR 97013 RYAN IMBRIE MANAGING DIRECTOR ryan.imbrie@svn.com O: 503.28.9403 M: 503.705.7352 The information listed above has been obtained
Family Support PACE & HOPE 2014 Annual Report
 Executive Summary Family Support PACE & HOPE 2014 Annual Report Family Support Programs, John Edmonds Supervisor edmonds.john@co.olmsted.mn.us (507) 328-6602 As part of Olmsted County s commitment to address
RITE AID PHARMACY HAMPTON, VIRGINIA SINGLE TENANT NET LEASE OFFERING
 RITE AID PHARMACY HAMPTON, VIRGINIA SINGLE TENANT NET LEASE OFFERING ONE OF RITE AID S TOP PERFORMING STORES REPRESENTATIVE PHOTO ACTUAL PROTOTYPE Fresenius Medical Center In Melbourne, FL Prime Location
Mary Kawena Pūku i, Ōlelo no eau
 Section 2: Applicability ʻIke aku, ʻike mai, kōkua aku kokua mai; pēlā iho la ka nohona ʻohana. Recognize others, be recognized, help others, be helped; such is a family relationship. Mary Kawena Pūku
Cannabis Retail Store Licensing in Ontario. General Committee December 10, 2018
 1 Cannabis Retail Store Licensing in Ontario General Committee December 10, 2018 Item 1 Item 2 Item 3 Item 4 Item 5 Item 6 Item 7 Item 8 Item 9 Item 10 Item 11 Item 12 Presentation Outline Federal Regulatory
Chapter 4 NOISE Adopted: May 7, 1996
 NOISE Adopted: May 7, 1996 Last Revised: May 7, 1996 (Council Resolution No. 8535, 1996 Series) Please see the next page. Page 4-2 Noise Element CHAPTER 4 NOISE ELEMENT TABLE OF CONTENTS INTRODUCTION...
Behavioral Healthcare Employment and Education Housing
 South Middlesex Organizing Resources for Social Change & Economic Independence Family and Nutrition Behavioral Healthcare Employment and Education Housing Family and Nutrition The family and nutrition
Transportation Sustainability Program
 Transportation Sustainability Program Photo: Sergio Ruiz San Francisco 2016 Roads and public transit nearing capacity Increase in cycling and walking despite less than ideal conditions 2 San Francisco
An asterisk (*) in a response category means that less than 0.5% of respondents chose that response category and a dash (-) represents no response.
 in a response category means that less than 0.5% of respondents chose that response category and a dash (-) represents no response.") Wyoming Statewide Survey October 9-13, 2018 N=600 Voters N=360 lands, N=240 cells Margin of Error +4.0% Sample A was asked of 1/2 of the respondents = 306 registered voters. Sample B was asked of 1/2 of
Wyoming Statewide Survey October 9-13, 2018 N=600 Voters N=360 lands, N=240 cells Margin of Error +4.0% Sample A was asked of 1/2 of the respondents = 306 registered voters. Sample B was asked of 1/2 of
Attracting Talent & Driving Growth in Wisconsin
 Attracting Talent & Driving Growth in Wisconsin v 2 nd Annual Future Wisconsin Economic Summit Kevin Conroy, Chairman & CEO December 9, 2015 WMC Foundation: Second Annual Future Wisconsin Economic Summit
Gateway Centre of Excellence in Rural Health Goderich, Ontario. A Community-Driven Centre for Rural Health Research BRIEF
 Gateway Centre of Excellence in Rural Health Goderich, Ontario A Community-Driven Centre for Rural Health Research BRIEF Health research is essential for providing people with quality health care and improving
PFAS Contamination From a Former U.S. Air Force Base Michigan Case Study
 PFAS Contamination From a Former U.S. Air Force Base Michigan Case Study Christina Bush and Sue Manente, MDHHS Highly Fluorinated Compounds Social and Scientific Discovery June 15, 2017 Former Wurtsmith
TEXAS REAL ESTATE ECONOMIC DATA 2011
 TEXAS REAL ESTATE ECONOMIC DATA 2011 Jim McAlister Sr. & Hydie H. McAlister 2211 Norfolk St., Suite 803 Houston, TX 77098 (713) 535-2276 or (713) 535-2260 www.mgcfunds.com Why Focus on Single Family Housing
Regional Profile Caerphilly
 Regional Profile Caerphilly Content Overview of Caerphilly Location of Caerphilly Workforce Skills Summary Caerphilly Overview of Caerphilly History of Caerphilly During the 1700s, Caerphilly began to
Giving and Volunteering in Quebec
 Giving and Volunteering in Quebec Results from the 1997 National Survey of Giving, Volunteering and Participating Michelle Goulbourne Research Associate Canadian Centre for Philanthropy www.nsgvp.org Giving
Smoking Cessation and the Workplace
 Smoking Cessation and the Workplace Profile of Tobacco Smokers and Workplace Smoking Cessation Policies and Programs Louise Chénier Manager, Workplace Health and Wellness Research The Conference Board
736 Front Street RARE OCEANFRONT INVESTMENT PROPERTY 736 FRONT STREET LAHAINA MAUI HAWAII
 736 Front Street RARE OCEANFRONT INVESTMENT PROPERTY 736 FRONT STREET LAHAINA MAUI HAWAII 2 THE KISHI BUILDING Located in the heart of one of the Top 10 Greatest Streets Large ground floor footprint over
MINNESOTA GERONTOLOGICAL SOCIETY ANNUAL CONFERENCE 2015 Phyllis A. Greenberg, PhD Sue Humphers-Ginther, PhD Jim Tift, M.A. Missy Reichl, B.S.
 CAREERS IN AGING MINNESOTA GERONTOLOGICAL SOCIETY ANNUAL CONFERENCE 2015 Phyllis A. Greenberg, PhD Sue Humphers-Ginther, PhD Jim Tift, M.A. Missy Reichl, B.S. 1 WHAT IS GERONTOLOGY? GERIATRICS? Aging is
Michigan Avenue Corridor Study. Joint Policy / Technical Committee Meeting Wednesday, May 11, 2016
 Michigan Avenue Corridor Study Joint Policy / Technical Committee Meeting Wednesday, May 11, 2016 Agenda 1. Welcome and Introductions 2. Project Update 3. Recap from April Joint Committee Meetings 4. Public
Foxborough Residents Survey Town of Foxborough, MA. Foxborough Master Plan. McCabe Enterprises Team
 Foxborough Residents Survey 202 Town of Foxborough, MA Foxborough Master Plan McCabe Enterprises Team On the following pages is the summary report of the residential survey undertaken at the outset of
Biennial Review of Brighton Center s Center for Employment Training s Alcohol and Drug Prevention Program
 Biennial Review of Brighton Center s Center for Employment Training s Alcohol and Drug Prevention Program 2015-2016 Wonda Winkler Vice President Talia Frye Workforce Development Director Brandon Sirbu
Ryan Smith, Community Planning Department Manager
 Report to Council Date: April 9, 2018 File: 1200-40 To: From: Subject: City Manager Ryan Smith, Community Planning Department Manager Cannabis Regulatory Options Report prepared by: Kimberly Brunet, Planner
RAZAVI RAZAVI ESMAHAN. campaign platform. The right choice for ward 6
 ESMAHAN RAZAVI ESMAHAN campaign platform The right choice for ward 6 RAZAVI The right choice for ward 6 campaign platform ABOUT ESMAHAN RAZAVI Since the beginning of the downturn I noticed Calgarians becoming
Trends in Ohioans Health Status and Income
 October 200 Trends in Ohioans Health Status and Income Since 2005, household incomes in Ohio have steadily declined. In 2005, 65% of Ohio adults were living in households with an annual income over 200%
NOVARE EQUITY PARTNERS
 NOVARE EQUITY PARTNERS [ BUSINESS FOCUS_NOVARE EQUITY PARTNERS ] Location, Location, Location The Novare Gateway mall in Abuja is a huge construction project. As we hear from the developer, the key to
Vestavia Hills, City of, AL
 Vestavia Hills, City of, AL 1 City of Vestavia Hills, Alabama, General Obligation Warrants, Series 2016, $11,810,000, Dated: July 14, 2016 2 City of Vestavia Hills, Alabama, General Obligation Warrants,
BERZACK. exclusive single tenant offering. 6% CAP - Walgreens. 410 Old Polk City Road Lakeland, FL WARREN BERZACK. Principal
 exclusive single tenant offering 6% CAP - Walgreens Lee & Associates LA North/Ventura, Inc. Corporate ID #01191898 A Member of the Lee & Associates Group of Companies 15250 Ventura Blvd., Suite 100 Sherman
About Washoe County WASHOE COUNTY, NEVADA POPULAR ANNUAL FINANCIAL REPORT FISCAL YEAR ENDING JUNE 30, 2014
 POPULAR ANNUAL FINANCIAL REPORT FISCAL YEAR ENDING JUNE 30, 2014 Message from Comptroller........ 2 Financial Strengths........... 2 Board of County Commissioners.... 3 Mission and Strategic Objectives...
REPORT TO THE CHIEF ADMINISTRATIVE OFFICER FROM THE DEVELOPMENT, ENGINEERING, AND SUSTAINABILITY DEPARTMENT
 April 11, 2018 REPORT TO THE CHIEF ADMINISTRATIVE OFFICER FROM THE DEVELOPMENT, ENGINEERING, AND SUSTAINABILITY DEPARTMENT ON ZONING BYLAW AMENDMENT APPLICATION NO. ZBA00094 ZONING CHANGES FOR SITING RETAIL
COMMUNITY RESOURCES: CITY OF MADISON NEIGHBORHOOD RESOURCE TEAMS
 COMMUNITY RESOURCES: CITY OF MADISON NEIGHBORHOOD RESOURCE TEAMS IMPROVING THE DELIVERY OF SERVICES AND CONNECTING CITY GOVERNMENT DIRECTLY TO MADISON NEIGHBORHOODS BY MAYOR PAUL R. SOGLIN JANUARY, 2014
Vision. Mission. Hopelink s Values. Introduction. A community free of poverty
 Vision A community free of poverty Mission Hopelink s mission is to promote self-sufficiency for all members of our community; we help people make lasting change. Hopelink s Values Growth and Human Potential
The Great Recession 1-2 Punch of Credit Crisis and Consumer Retrenchment
 San Mateo County: Economy and Labor Supply Jon Haveman Chief Economist, BAC Economic Ins2tute May, 2012 The Great Recession 1-2 Punch of Credit Crisis and Consumer Retrenchment 6 GDP Growth (SAAR) and
Public Workshop. June 5, Halton Region Transportation Master Plan 2031 The Road to Change December 1,
 Public Workshop June 5, 2010 Halton Region Transportation Master Plan 2031 The Road to Change December 1, 2009 1 1 What We Want to Achieve Today Obtain feedback on opportunities to move people and goods
Cannabis Regulations for Sonoma County Jurisdictions as of March 26, 2018
 Jurisdiction County Status License Type: Use Permit Limits on Number of Dispensaries: 9 Limits on Dispensary Size: 1000 sq. ft. Zoning: A medical cannabis dispensary proposed within the sphere of influence
The Extremes of Virginia
 The Extremes of Virginia Southwest, Southside and the Eastern Shore Two Separated and Unequal Commonwealths Rural, Poor and Largely Forgotten August Wallmeyer The 2/3s Premise That 2/3s of legislators
ReStart3:20 Business Plan
 ReStart3:20 Business Plan Prepared By: Daniel Levison 561 West Whitehall Street, SW Atlanta, Georgia 30310 404-358-3547 www.restart320.org Mission Statement ReStart is a community center which was created
Ryan Smith, Community Planning Department Manager. Zoning Bylaw Text Amendment for Cannabis Production and Retail Cannabis Sales
 Report to Council Date: August 27, 2018 File: 1250-04 To: From: Subject: Report prepared by: City Manager Ryan Smith, Community Planning Department Manager Zoning Bylaw Text Amendment for Cannabis Production
Lake Zumbro Restoration Project Timeline (Draft) Prepared by Terry Lee, Olmsted Water Resources Manager June 25, 2015
 Prepared by Terry Lee, Olmsted Water Resources Manager June 25, 2015") Lake Zumbro Restoration Project Timeline 2005-2015 (Draft) Prepared by Terry Lee, Olmsted Water Resources Manager June 25, 2015 2005 3/31/05 Lake Zumbro Improvement Association appointed a Lake Restoration
Lake Zumbro Restoration Project Timeline 2005-2015 (Draft) Prepared by Terry Lee, Olmsted Water Resources Manager June 25, 2015 2005 3/31/05 Lake Zumbro Improvement Association appointed a Lake Restoration
Grants West. Note that we only work for nonprofits based inside the United States. We lack the expertise to help organizations in other countries.
 Grants West The Centerville Community Center received grant awards from multiple sources as a result of this proposal. The proposal was prepared by Grants West, which has raised $165 million for nonprofit
Where are moonlighters found?
 Moonlighting: A growing way of life Deborah Sussman Moonlighting is becoming a way of life for an increasing number of Canadian workers. In the last 20 years, the number of multiple jobholders or moonlighters
Anatomy of Traffic Safety Pierce County Bureau of Transportation Safety
 Anatomy of Traffic Safety Pierce County Bureau of Transportation Safety Revised: 12/16/16 1 Characteristics of the County and the Road Network Pierce County is a metropolitan county with a population of
a home where hearts are transformed w w w. e d e n s g l o r y. o r g
 a home where hearts are transformed w w w. e d e n s g l o r y. o r g about human trafficking Human trafficking is a form of modern day slavery. Women, children, and men are held by force, unable to walk
2017 Neighborhood Annual Report SurveyMonkey. Page 2: 2017 Community Participation Program Annual ReportOrganization Information - please confirm
 #68 COMPLETE Collector: Web Link 1 (Web Link) Started: Tuesday February 20 2018 7:59:03 PM Last Modified: Thursday May 17 2018 8:14:48 AM Time Spent: Over a month IP Address: 173.22.159.196 Page 2: 2017
The financial factors that have been considered in this analysis are as follows:
 5. Cost Structure This section assesses the competitive positioning of Halton in the GGH with specific regard to the cost structures that influence the location decisions of the non-retail, non-residential
NEW HAVEN WORKS 2014 ANNUAL REPORT. Works for business. Works for New Haven. 1
 COMMUNITY LABOR EMPLOYERS GOVERNMENT NEW HAVEN WORKS 2014 ANNUAL REPORT Works for business. Works for New Haven. 1 Dear Friends, We are proud to partner with New Haven Works to increase the economic vitality
Walgreens Pharmacy 2551 W. Main Street Alhambra, CA $10,300,000
 Walgreens Pharmacy 2551 W. Main Street Alhambra, CA 91801 $10,300,000 INVESTMENT HIGHLIGHTS Rare LA County, Walgreens Net Leased Offering Population in Excess of 265,328 Within 3 Miles Located Blocks Away
14. EMPLOYMENT Occupational segregation Commonwealth Employment by industry for males and females who identify as
 14. EMPLOYMENT Occupational segregation Commonwealth Employment by industry for males and females who identify as Annex 3 Issues 14 to 16 Indigenous, Other than Main English Speaking (OTMESC), or 55 years
Lewis & Clark National Estimation and Awareness Study
 Lewis & Clark National Estimation and Awareness Study Prepared by for the Institute for Tourism and Recreation Research and Montana's Tourism Advisory Council Institute for Tourism and Recreation Research
City Council Agenda Report Meeting Date: March 7, 2017
 City Council Agenda Report TO: CC: FROM: BY: RE: Honorable Mayor and City Council Mark Orme, City Manager Debbie Presson, City Clerk Vincent C. Ewing, City Attorney Norma Copado, Deputy City Attorney City