SUPPLEMENTAL FILE. mir-22 and mir-29a are members of the androgen receptor cistrome modulating. LAMC1 and Mcl-1 in prostate cancer
|
|
|
- Evan Webster
- 5 years ago
- Views:
Transcription
1 1 SUPPLEMENTAL FILE 2 3 mir-22 and mir-29a are members of the androgen receptor cistrome modulating LAMC1 and Mcl-1 in prostate cancer Lorenza Pasqualini 1, Huajie Bu 1,2, Martin Puhr 1, Narisu Narisu 3, Johannes Rainer 4, Bettina Schlick 1,5, Georg Schäfer 1,6, Mihaela Angelova 7, Zlatko Trajanoski 7, Stefan T. Börno 8, Michal R. Schweiger 8,9, Christian Fuchsberger 10, Helmut Klocker Department of Urology, Division of Experimental Urology, Medical University of Innsbruck, Innsbruck, Austria 2 Research Institute for Biomedical Aging Research, University of Innsbruck, Innsbruck, Austria 3 Medical Genomics and Metabolic Genetics Branch, National Human Genome Research Institute, National Institutes of Health, Bethesda, Maryland, USA 4 Biocenter Innsbruck, Section for Molecular Pathophysiology, Medical University of Innsbruck, Innsbruck, Austria. 5 Oncotyrol, Center for Personalized Cancer Medicine, Innsbruck, Austria 6 Department of Pathology, Medical University of Innsbruck, Innsbruck, Austria 7 Biocenter Innsbruck, Division of Bioinformatics, Medical University of Innsbruck, Innsbruck, Austria. 8 Max Planck Institute for Molecular Genetics, Berlin, Germany 9 Cologne Center for Genomics, University of Cologne, Germany; 10 Department of Biostatistic,, University of Michigan, Ann Arbor, USA Abbreviated Titel: Androgen regulation of mir-22 and mir-29a 25 Pasqualini et al. Androgen regulation of mir-22 and mir-29a Supplement 1
2 Supplemental Table 1 Predicted androgen responsive elements (AREs) within the androgen receptor binding sites (ARBSs) of mir-22, mir29a and mir cluster ARBSs Detailed Matrix Information Number of predicted AREs Matrix similarity Predicted Sequence mir-22 ARBS_1 AR binding site tcggggctttctgtcctca mir-22 ARBS_2 AR binding site tgggaacagcttgtgctgc mir-22 ARBS_3 AR binding site acagagctttctgtccctg mir-29a ARBS_1 AR binding site ttgggccttagtgttctca mir cluster ARBS_2 AR binding site taagaactctgggttctcc Detection of androgen responsive elements in the ChIP-seq-identified ARBSs of mir-22, mir-29a and mir cluster using MatInspector software. A matrix similarity score of 1.00 indicates a perfect match to the matrix, implying that the candidate ARBS genomic sequences include well conserved AREs. Additionally, the highly conserved base pairs are marked in bold and the ones in capital letters represent the core sequence used by MatInspector. 36 Pasqualini et al. Androgen regulation of mir-22 and mir-29a Supplement 2
3 Supplemental Figure 1 Schematic depiction of the genomic organization of mir-22, mir-29a and mir cluster sites. Indicated are the genomic position of mir-22, mir-29a and the mir cluster along with ARBSs and the adjacent genes localization according to UCSC Genome Browser on human Feb (GRCh37/hg19) assembly. Red triangles represent ARBSs, their size reflects the extent of AR enrichment for each binding site according to ChIP-seq sequence reads. For the mir cluster, triangles with the same color represent mirnas which share a similar sequence. 46 Pasqualini et al. Androgen regulation of mir-22 and mir-29a Supplement 3
4 Supplemental Fig.2 Androgen regulation of mir-22 and mir-29a in PC3-AR cells (A) Relative expression of androgen receptor protein in PC3-AR cells in comparison with its parental AR negative cell line PC3 and the AR positive LNCaP cells, used as positive control. Protein values were normalized to GAPDH and quantified using the Odyssey IR Imaging System. (B) Real-time PCR analysis of androgen induced up-regulation of mir-22 and MIR22HG in PC3-AR cells. This cell line was established by stable overexpression of wild-type AR in the AR negative PC3 cell line. Cells were treated either with 1nM R1881 or equivalent vehicle (Ctrl) for 24 and 48 h before mrna/mirnas isolation. mirna expression was normalized to the small nucleolar RNA, SNORD44. FKBP5 was utilized as positive control and TBP was chosen as normalizer for AR and FKBP5 gene expression. Each bar represents mean values + SEM of at least three independent experiments, (Unpaired Student st-test, * P <0.05; ** P<0.01; *** P<0.001). 61 Pasqualini et al. Androgen regulation of mir-22 and mir-29a Supplement 4
5 Supplemental Figure 3 mir-22 and mir-29a levels in malignant and non-malignant prostate tissue based on mirna-seq data extracted from The Cancer Genome Atlas (TCGA). (A) Comparison of mirna expression levels in 52 matched cancer-benign tissue samples obtained from primary tumors. DESeq statistical tool was used and log 2 values are shown in the graph, (* P <0.05; ** P<0.01; *** P<0.001). (B) A total of 324 patients were classified into subgroups according to the Gleason score (low 6, medium =7, high >7) and the different expression levels of mir-22 and mir-29a were evaluated by means of ANOVA statistical test, (* P <0.05; ** P<0.01; *** P<0.001). 71 Pasqualini et al. Androgen regulation of mir-22 and mir-29a Supplement 5
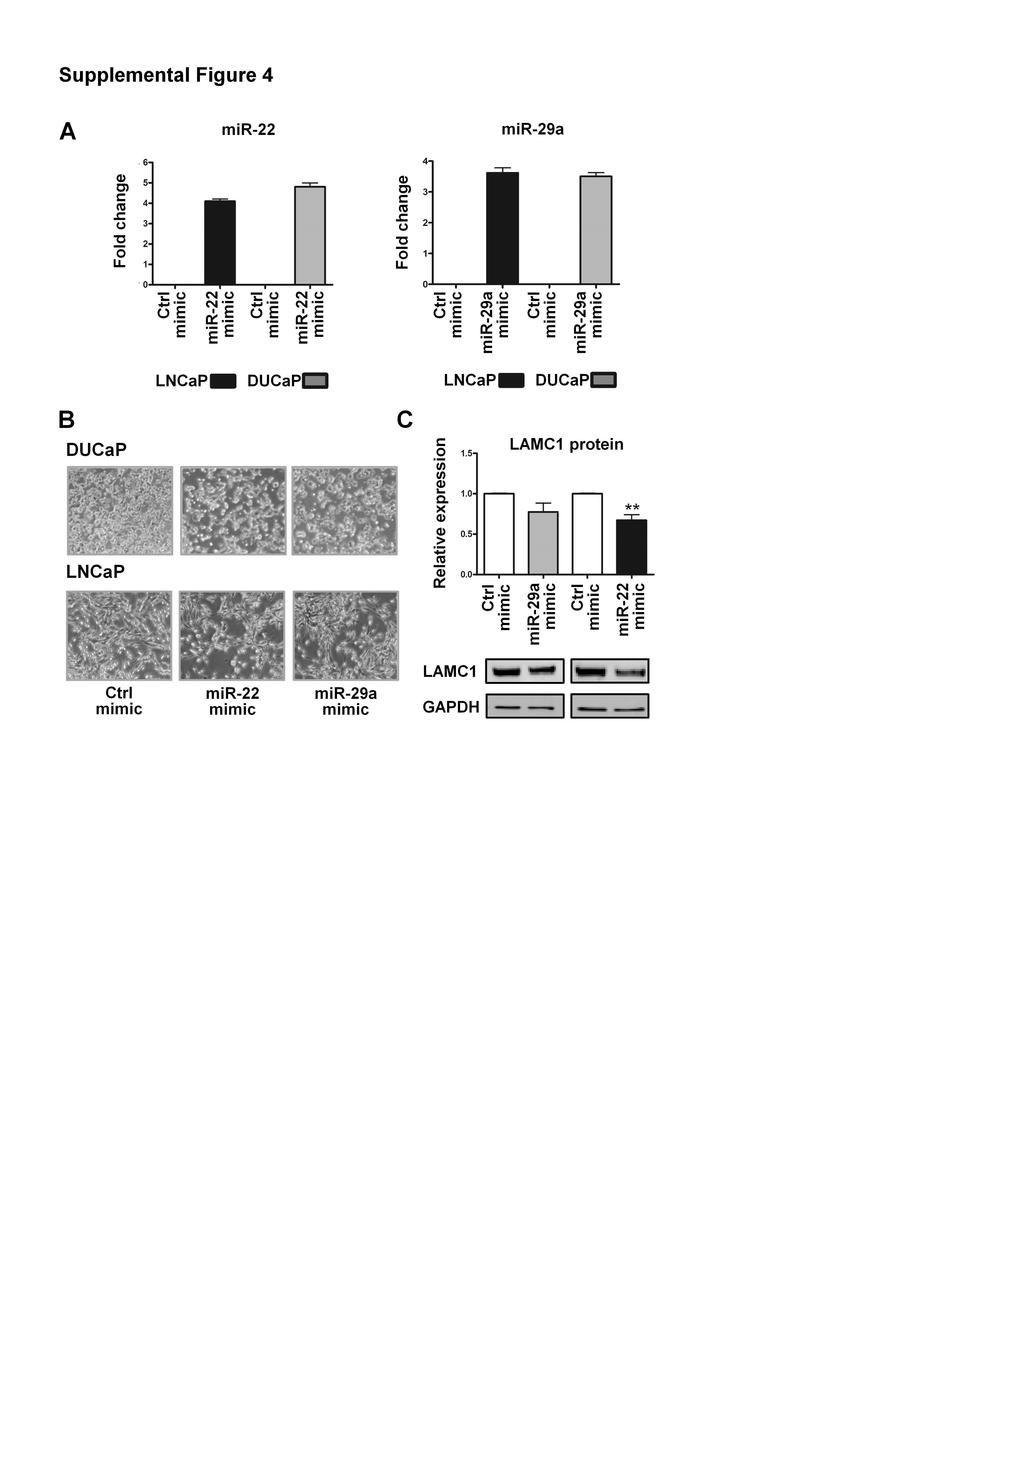
6 Supplemental Figure 4 (A) mir-22 and mir-29a levels in LNCaP and DUCaP cells transfected for 48 h with mir-22 or mir-29a mimics were measured by real-time PCR. mirnas expression was normalized to the small nucleolar RNA, SNORD44 and levels are depicted in a log 10 scale. (B) Representative cell culture images of mir-22/mir-29a mimics treated DUCaP and LNCaP cells. Rounding and detachment of cells is recognizable, in particular after treatment with mir-22 due to the expected downregulation of the basement membrane protein LAMC1. (C) Relative expression of LAMC1 protein in DUCaP cells transfected with mir-22 or mir- 29a mimics for 48 h. Protein content was quantified using the Odyssey IR Imaging System and normalized to GAPDH. Values are expressed relative to the mimic Ctrl and each bar represents the mean value + SEM of at least three independent experiments, (Unpaired Student s T-test, * P <0.05; ** P<0.01; *** P<0.001). 85 Pasqualini et al. Androgen regulation of mir-22 and mir-29a Supplement 6
7 Supplemental Figure 5 Differential DNA methylation or AR target genomic loci in cell lines. MeDIP-seq data obtained for a panel of prostate cancer cell lines was analyzed for the differential DNA methylation of mir-22 and mir-29a genomic loci encompassing the ARBSs. Depicted are the MeDIP-seq values (rpm). The plots show an elevated DNA methylation for the AR positive cell lines LNCaP and VCaP having low basal levels of both mirnas and a minimal DNA methylation in the AR negative cell lines PC3 and DU145 displaying high basal mirnas expression. MeDIP-seq values of DNA derived from benign and malignant prostate tissue samples are included for comparison. Pasqualini et al. Androgen regulation of mir-22 and mir-29a Supplement 7
8
9
10
11
12
Androgens and the androgen receptor (AR) are indispensable
 are indispensable") ORIGINAL RESEARCH mir-22 and mir-29a are members of the androgen receptor cistrome modulating LAMC1 and Mcl-1 in prostate cancer Lorenza Pasqualini 1, Huajie Bu 1,2, Martin Puhr 1, Narisu Narisu 3, Johannes
ORIGINAL RESEARCH mir-22 and mir-29a are members of the androgen receptor cistrome modulating LAMC1 and Mcl-1 in prostate cancer Lorenza Pasqualini 1, Huajie Bu 1,2, Martin Puhr 1, Narisu Narisu 3, Johannes
a) List of KMTs targeted in the shrna screen. The official symbol, KMT designation,
 List of KMTs targeted in the shrna screen. The official symbol, KMT designation,") Supplementary Information Supplementary Figures Supplementary Figure 1. a) List of KMTs targeted in the shrna screen. The official symbol, KMT designation, gene ID and specifities are provided. Those highlighted
Supplementary Information Supplementary Figures Supplementary Figure 1. a) List of KMTs targeted in the shrna screen. The official symbol, KMT designation, gene ID and specifities are provided. Those highlighted
Supplementary Figure 1. HeliScope CAGE revealed androgen-regulated signaling and differentially regulated promoters in hormone-refractory prostate
 Supplementary Figure 1. HeliScope CAGE revealed androgen-regulated signaling and differentially regulated promoters in hormone-refractory prostate cancer cells. (a) Cell proliferation of BicR cells in
Molecular Heterogeneity of High Gleason Prostate Cancer
 Molecular Heterogeneity of High Gleason Prostate Cancer Aliccia Bollig-Fischer, PhD Assistant Professor Department of Oncology Karmanos Cancer Institute Wayne State University Detroit, Michigan, USA Disclosure
7SK ChIRP-seq is specifically RNA dependent and conserved between mice and humans.
 Supplementary Figure 1 7SK ChIRP-seq is specifically RNA dependent and conserved between mice and humans. Regions targeted by the Even and Odd ChIRP probes mapped to a secondary structure model 56 of the
Comparison of open chromatin regions between dentate granule cells and other tissues and neural cell types.
 Supplementary Figure 1 Comparison of open chromatin regions between dentate granule cells and other tissues and neural cell types. (a) Pearson correlation heatmap among open chromatin profiles of different
Supplementary Figure S1. Gene expression analysis of epidermal marker genes and TP63.
 Supplementary Figure Legends Supplementary Figure S1. Gene expression analysis of epidermal marker genes and TP63. A. Screenshot of the UCSC genome browser from normalized RNAPII and RNA-seq ChIP-seq data
Supplementary Figure 1
 Supplementary Figure 1 Supplementary Figure 1 Schematic depiction of the tandem Fc GDF15. Supplementary Figure 2 Supplementary Figure 2 Gfral mrna levels in the brains of both wild-type and knockout Gfral
HALLA KABAT * Outreach Program, mircore, 2929 Plymouth Rd. Ann Arbor, MI 48105, USA LEO TUNKLE *
 CERNA SEARCH METHOD IDENTIFIED A MET-ACTIVATED SUBGROUP AMONG EGFR DNA AMPLIFIED LUNG ADENOCARCINOMA PATIENTS HALLA KABAT * Outreach Program, mircore, 2929 Plymouth Rd. Ann Arbor, MI 48105, USA Email:
Bhatnagar et al, 2010 Cell Death and Disease Manuscript # CDDIS T
 Bhatnagar et al, Cell Death and Disease Manuscript # CDDIS--98-T Supplemental Materials. Supplemental Figure Legends Supplemental Figure (A) WPE-NA and WPE-NB6 cells were treated with 4 nm of Docetaxel
Lentiviral Delivery of Combinatorial mirna Expression Constructs Provides Efficient Target Gene Repression.
 Supplementary Figure 1 Lentiviral Delivery of Combinatorial mirna Expression Constructs Provides Efficient Target Gene Repression. a, Design for lentiviral combinatorial mirna expression and sensor constructs.
Nature Structural & Molecular Biology: doi: /nsmb.2419
 Supplementary Figure 1 Mapped sequence reads and nucleosome occupancies. (a) Distribution of sequencing reads on the mouse reference genome for chromosome 14 as an example. The number of reads in a 1 Mb
MicroRNA expression profiling and functional analysis in prostate cancer. Marco Folini s.c. Ricerca Traslazionale DOSL
 MicroRNA expression profiling and functional analysis in prostate cancer Marco Folini s.c. Ricerca Traslazionale DOSL What are micrornas? For almost three decades, the alteration of protein-coding genes
Supplementary Figures
 Supplementary Figures Supplementary Figure 1. Confirmation of Dnmt1 conditional knockout out mice. a, Representative images of sorted stem (Lin - CD49f high CD24 + ), luminal (Lin - CD49f low CD24 + )
Nature Immunology: doi: /ni Supplementary Figure 1. RNA-Seq analysis of CD8 + TILs and N-TILs.
 Supplementary Figure 1 RNA-Seq analysis of CD8 + TILs and N-TILs. (a) Schematic representation of the tumor and cell types used for the study. HNSCC, head and neck squamous cell cancer; NSCLC, non-small
SUPPLEMENTARY INFORMATION
 doi:.38/nature8975 SUPPLEMENTAL TEXT Unique association of HOTAIR with patient outcome To determine whether the expression of other HOX lincrnas in addition to HOTAIR can predict patient outcome, we measured
Supplemental Figure S1. Tertiles of FKBP5 promoter methylation and internal regulatory region
 Supplemental Figure S1. Tertiles of FKBP5 promoter methylation and internal regulatory region methylation in relation to PSS and fetal coupling. A, PSS values for participants whose placentas showed low,
Supplementary Figure 1. IDH1 and IDH2 mutation site sequences on WHO grade III
 Supplementary Materials: Supplementary Figure 1. IDH1 and IDH2 mutation site sequences on WHO grade III patient samples. Genomic DNA samples extracted from punch biopsies from either FFPE or frozen tumor
Supplementary Figures
 Supplementary Figures Supplementary Figure 1 Characterization of stable expression of GlucB and sshbira in the CT26 cell line (a) Live cell imaging of stable CT26 cells expressing green fluorescent protein
Supplementary Figure 1 IMQ-Induced Mouse Model of Psoriasis. IMQ cream was
 Supplementary Figure 1 IMQ-Induced Mouse Model of Psoriasis. IMQ cream was painted on the shaved back skin of CBL/J and BALB/c mice for consecutive days. (a, b) Phenotypic presentation of mouse back skin
Santulli G. et al. A microrna-based strategy to suppress restenosis while preserving endothelial function
 ONLINE DATA SUPPLEMENTS Santulli G. et al. A microrna-based strategy to suppress restenosis while preserving endothelial function Supplementary Figures Figure S1 Effect of Ad-p27-126TS on the expression
A Practical Guide to Integrative Genomics by RNA-seq and ChIP-seq Analysis
 A Practical Guide to Integrative Genomics by RNA-seq and ChIP-seq Analysis Jian Xu, Ph.D. Children s Research Institute, UTSW Introduction Outline Overview of genomic and next-gen sequencing technologies
mir-7a regulation of Pax6 in neural stem cells controls the spatial origin of forebrain dopaminergic neurons
 Supplemental Material mir-7a regulation of Pax6 in neural stem cells controls the spatial origin of forebrain dopaminergic neurons Antoine de Chevigny, Nathalie Coré, Philipp Follert, Marion Gaudin, Pascal
Nature Immunology: doi: /ni Supplementary Figure 1. Characteristics of SEs in T reg and T conv cells.
 Supplementary Figure 1 Characteristics of SEs in T reg and T conv cells. (a) Patterns of indicated transcription factor-binding at SEs and surrounding regions in T reg and T conv cells. Average normalized
Figure S1. Reduction in glomerular mir-146a levels correlate with progression to higher albuminuria in diabetic patients.
 Supplementary Materials Supplementary Figures Figure S1. Reduction in glomerular mir-146a levels correlate with progression to higher albuminuria in diabetic patients. Figure S2. Expression level of podocyte
April 5, :45 AM 1:45 PM MARRIOTT MARQUIS HOTEL & MARINA, MIRAMAR VIGNETTE 1 VIGNETTE 2 VIGNETTE 3* VIGNETTE 4* VIGNETTE 5*
 April 5, 2016 11:45 AM 1:45 PM MARRIOTT MARQUIS HOTEL & MARINA, MIRAMAR CHAIR: DANNY A. MILNER, JR., BRIGHAM & WOMEN S HOSPITAL, BOSTON, MA VIGNETTE 1 VIGNETTE 2 VIGNETTE 3* VIGNETTE 4* VIGNETTE 5* *VIGNETTES
High Throughput Sequence (HTS) data analysis. Lei Zhou
 data analysis. Lei Zhou") High Throughput Sequence (HTS) data analysis Lei Zhou (leizhou@ufl.edu) High Throughput Sequence (HTS) data analysis 1. Representation of HTS data. 2. Visualization of HTS data. 3. Discovering genomic
High Throughput Sequence (HTS) data analysis Lei Zhou (leizhou@ufl.edu) High Throughput Sequence (HTS) data analysis 1. Representation of HTS data. 2. Visualization of HTS data. 3. Discovering genomic
SUPPLEMENTARY FIGURE LEGENDS
 SUPPLEMENTARY FIGURE LEGENDS Supplementary Figure 1 Negative correlation between mir-375 and its predicted target genes, as demonstrated by gene set enrichment analysis (GSEA). 1 The correlation between
SUPPLEMENTAL DATA AGING, July 2014, Vol. 6 No. 7
 SUPPLEMENTAL DATA Figure S1. Muscle mass changes in different anatomical regions with age. (A) The TA and gastrocnemius muscle showed a significant loss of weight in aged mice (24 month old) compared to
Soft Agar Assay. For each cell pool, 100,000 cells were resuspended in 0.35% (w/v)
") SUPPLEMENTARY MATERIAL AND METHODS Soft Agar Assay. For each cell pool, 100,000 cells were resuspended in 0.35% (w/v) top agar (LONZA, SeaKem LE Agarose cat.5004) and plated onto 0.5% (w/v) basal agar.
SUPPLEMENTARY MATERIAL AND METHODS Soft Agar Assay. For each cell pool, 100,000 cells were resuspended in 0.35% (w/v) top agar (LONZA, SeaKem LE Agarose cat.5004) and plated onto 0.5% (w/v) basal agar.
TITLE: MiR-146-SIAH2-AR Signaling in Castration-Resistant Prostate Cancer
 AWARD NUMBER: W81XWH-14-1-0387 TITLE: MiR-146-SIAH2-AR Signaling in Castration-Resistant Prostate Cancer PRINCIPAL INVESTIGATOR: Dr. Goberdhan Dimri, PhD CONTRACTING ORGANIZATION: George Washington University,
Discovery of Novel Human Gene Regulatory Modules from Gene Co-expression and
 Discovery of Novel Human Gene Regulatory Modules from Gene Co-expression and Promoter Motif Analysis Shisong Ma 1,2*, Michael Snyder 3, and Savithramma P Dinesh-Kumar 2* 1 School of Life Sciences, University
Large conserved domains of low DNA methylation maintained by Dnmt3a
 Supplementary information Large conserved domains of low DNA methylation maintained by Dnmt3a Mira Jeong# 1, Deqiang Sun # 2, Min Luo# 1, Yun Huang 3, Grant A. Challen %1, Benjamin Rodriguez 2, Xiaotian
Supplemental Figure 1. Small RNA size distribution from different soybean tissues.
 Supplemental Figure 1. Small RNA size distribution from different soybean tissues. The size of small RNAs was plotted versus frequency (percentage) among total sequences (A, C, E and G) or distinct sequences
Gene-microRNA network module analysis for ovarian cancer
 Gene-microRNA network module analysis for ovarian cancer Shuqin Zhang School of Mathematical Sciences Fudan University Oct. 4, 2016 Outline Introduction Materials and Methods Results Conclusions Introduction
Supplemental Figure 1. Genes showing ectopic H3K9 dimethylation in this study are DNA hypermethylated in Lister et al. study.
 mc mc mc mc SUP mc mc Supplemental Figure. Genes showing ectopic HK9 dimethylation in this study are DNA hypermethylated in Lister et al. study. Representative views of genes that gain HK9m marks in their
injected subcutaneously into flanks of 6-8 week old athymic male nude mice (LNCaP SQ) and body
 and body") SUPPLEMENTAL FIGURE LEGENDS Figure S1: Generation of ENZR Xenografts and Cell Lines: (A) 1x10 6 LNCaP cells in matrigel were injected subcutaneously into flanks of 6-8 week old athymic male nude mice (LNCaP
SUPPLEMENTAL FIGURE LEGENDS Figure S1: Generation of ENZR Xenografts and Cell Lines: (A) 1x10 6 LNCaP cells in matrigel were injected subcutaneously into flanks of 6-8 week old athymic male nude mice (LNCaP
Supplementary Figures
 Supplementary Figures Supplementary Figure 1. Pan-cancer analysis of global and local DNA methylation variation a) Variations in global DNA methylation are shown as measured by averaging the genome-wide
Supplementary Figure 1. mir124 does not change neuron morphology and synaptic
 Supplementary Figure 1. mir124 does not change neuron morphology and synaptic density. Hippocampal neurons were transfected with mir124 (containing DsRed) or DsRed as a control. 2 d after transfection,
Supplementary Material
 Supplementary Material The Androgen Receptor is a negative regulator of eif4e Phosphorylation at S209: Implications for the use of mtor inhibitors in advanced prostate cancer Supplementary Figures Supplemental
Nature Immunology: doi: /ni Supplementary Figure 1 33,312. Aire rep 1. Aire rep 2 # 44,325 # 44,055. Aire rep 1. Aire rep 2.
 a 33,312 b rep 1 rep 1 # 44,325 rep 2 # 44,055 [0-84] rep 2 [0-84] 1810043G02Rik Pfkl Dnmt3l Icosl rep 1 [0-165] rep 2 [0-165] Rps14 Cd74 Mir5107 Tcof1 rep 1 [0-69] rep 2 [0-68] Id3 E2f2 Asap3 rep 1 [0-141]
SUPPLEMENTARY FIGURES
 SUPPLEMENTARY FIGURES Figure S1. Clinical significance of ZNF322A overexpression in Caucasian lung cancer patients. (A) Representative immunohistochemistry images of ZNF322A protein expression in tissue
A prostate cancer susceptibility allele at 6q22 increases RFX6 expression by modulating HOXB13 chromatin binding
 Supplementary Information A prostate cancer susceptibility allele at 6q22 increases RFX6 expression by modulating HOXB13 chromatin binding Qilai Huang 1,2*, Thomas Whitington 3,4*, Ping Gao 1,2, Johan
Nature Immunology: doi: /ni Supplementary Figure 1. Transcriptional program of the TE and MP CD8 + T cell subsets.
 Supplementary Figure 1 Transcriptional program of the TE and MP CD8 + T cell subsets. (a) Comparison of gene expression of TE and MP CD8 + T cell subsets by microarray. Genes that are 1.5-fold upregulated
cis-regulatory enrichment analysis in human, mouse and fly
 cis-regulatory enrichment analysis in human, mouse and fly Zeynep Kalender Atak, PhD Laboratory of Computational Biology VIB-KU Leuven Center for Brain & Disease Research Laboratory of Computational Biology
Supplementary Materials for
 www.sciencesignaling.org/cgi/content/full/7/310/ra11/dc1 Supplementary Materials for STAT3 Induction of mir-146b Forms a Feedback Loop to Inhibit the NF-κB to IL-6 Signaling Axis and STAT3-Driven Cancer
Supplementary Figure 1: Features of IGLL5 Mutations in CLL: a) Representative IGV screenshot of first
 Representative IGV screenshot of first") Supplementary Figure 1: Features of IGLL5 Mutations in CLL: a) Representative IGV screenshot of first intron IGLL5 mutation depicting biallelic mutations. Red arrows highlight the presence of out of phase
Supplementary Figure 1: Features of IGLL5 Mutations in CLL: a) Representative IGV screenshot of first intron IGLL5 mutation depicting biallelic mutations. Red arrows highlight the presence of out of phase
SUPPLEMENTARY FIGURES
 SUPPLEMENTARY FIGURES 1 Supplementary Figure 1, Adult hippocampal QNPs and TAPs uniformly express REST a-b) Confocal images of adult hippocampal mouse sections showing GFAP (green), Sox2 (red), and REST
Clasificación Molecular del Cáncer de Próstata. JM Piulats
 Clasificación Molecular del Cáncer de Próstata JM Piulats Introduction The Gleason score is the major method for prostate cancer tissue grading and the most important prognostic factor in this disease.
Supplementary Figure 1: Experimental design. DISCOVERY PHASE VALIDATION PHASE (N = 88) (N = 20) Healthy = 20. Healthy = 6. Endometriosis = 33
 (N = 20) Healthy = 20. Healthy = 6. Endometriosis = 33") DISCOVERY PHASE (N = 20) Healthy = 6 Endometriosis = 7 EAOC = 7 Quantitative PCR (mirnas = 1113) a Quantitative PCR Verification of Candidate mirnas (N = 24) VALIDATION PHASE (N = 88) Healthy = 20 Endometriosis
DISCOVERY PHASE (N = 20) Healthy = 6 Endometriosis = 7 EAOC = 7 Quantitative PCR (mirnas = 1113) a Quantitative PCR Verification of Candidate mirnas (N = 24) VALIDATION PHASE (N = 88) Healthy = 20 Endometriosis
TITLE: The Role of HOX Proteins in Androgen-Independent Prostate Cancer
 AD Award Number: W81XWH-6-1-64 TITLE: The Role of HOX Proteins in Androgen-Independent Prostate Cancer PRINCIPAL INVESTIGATOR: Sunshine Daddario, B.A. CONTRACTING ORGANIZATION: University of Colorado Health
 DOI: 10.1038/ncb2210 b. ICAM1 ng ml -1 P = 0.0001 Small RNA (15-30nts) ng ml -1 Cell Lysate Exosome HDL Plasma HDL Normal Human HDL mirnas R = 0.45 P < 0.0001 Normal Human Exosome mirnas Figure S1. Characterization
Supplementary. properties of. network types. randomly sampled. subsets (75%
 Supplementary Information Gene co-expression network analysis reveals common system-level prognostic genes across cancer types properties of Supplementary Figure 1 The robustness and overlap of prognostic
SUPPLEMENTARY INFORMATION
 doi:10.1038/nature10866 a b 1 2 3 4 5 6 7 Match No Match 1 2 3 4 5 6 7 Turcan et al. Supplementary Fig.1 Concepts mapping H3K27 targets in EF CBX8 targets in EF H3K27 targets in ES SUZ12 targets in ES
Circular RNAs (circrnas) act a stable mirna sponges
 act a stable mirna sponges") Circular RNAs (circrnas) act a stable mirna sponges cernas compete for mirnas Ancestal mrna (+3 UTR) Pseudogene RNA (+3 UTR homolgy region) The model holds true for all RNAs that share a mirna binding
Circular RNAs (circrnas) act a stable mirna sponges cernas compete for mirnas Ancestal mrna (+3 UTR) Pseudogene RNA (+3 UTR homolgy region) The model holds true for all RNAs that share a mirna binding
Profiles of gene expression & diagnosis/prognosis of cancer. MCs in Advanced Genetics Ainoa Planas Riverola
 Profiles of gene expression & diagnosis/prognosis of cancer MCs in Advanced Genetics Ainoa Planas Riverola Gene expression profiles Gene expression profiling Used in molecular biology, it measures the
Supplementary Information Titles Journal: Nature Medicine
 Supplementary Information Titles Journal: Nature Medicine Article Title: Corresponding Author: Supplementary Item & Number Supplementary Fig.1 Fig.2 Fig.3 Fig.4 Fig.5 Fig.6 Fig.7 Fig.8 Fig.9 Fig. Fig.11
A Normal Exencephaly Craniora- Spina bifida Microcephaly chischisis. Midbrain Forebrain/ Forebrain/ Hindbrain Spinal cord Hindbrain Hindbrain
 A Normal Exencephaly Craniora- Spina bifida Microcephaly chischisis NTD Number of embryos % among NTD Embryos Exencephaly 52 74.3% Craniorachischisis 6 8.6% Spina bifida 5 7.1% Microcephaly 7 1% B Normal
Nature Genetics: doi: /ng Supplementary Figure 1. SEER data for male and female cancer incidence from
 Supplementary Figure 1 SEER data for male and female cancer incidence from 1975 2013. (a,b) Incidence rates of oral cavity and pharynx cancer (a) and leukemia (b) are plotted, grouped by males (blue),
Bmi-1 regulates stem cell-like properties of gastric cancer cells via modulating mirnas
 Wang et al. Journal of Hematology & Oncology (2016) 9:90 DOI 10.1186/s13045-016-0323-9 RESEARCH Bmi-1 regulates stem cell-like properties of gastric cancer cells via modulating mirnas Open Access Xiaofeng
SUPPLEMENTAY FIGURES AND TABLES
 SUPPLEMENTAY FIGURES AND TABLES Supplementary Figure S1: Validation of mir expression by quantitative real-time PCR and time course studies on mir- 29a-3p and mir-210-3p. A. The graphs illustrate the expression
Supplementary Figure 1 IL-27 IL
 Tim-3 Supplementary Figure 1 Tc0 49.5 0.6 Tc1 63.5 0.84 Un 49.8 0.16 35.5 0.16 10 4 61.2 5.53 10 3 64.5 5.66 10 2 10 1 10 0 31 2.22 10 0 10 1 10 2 10 3 10 4 IL-10 28.2 1.69 IL-27 Supplementary Figure 1.
BRaf V600E cooperates with Pten silencing to elicit metastatic melanoma (Nature Genetics Supplementary Information)
") BRaf V600E cooperates with Pten silencing to elicit metastatic melanoma (Nature Genetics Supplementary Information) David Dankort, David P. Curley, Robert A. Cartlidge, Betsy Nelson, Anthony N. Karnezis,
BRaf V600E cooperates with Pten silencing to elicit metastatic melanoma (Nature Genetics Supplementary Information) David Dankort, David P. Curley, Robert A. Cartlidge, Betsy Nelson, Anthony N. Karnezis,
Nature Structural & Molecular Biology: doi: /nsmb Supplementary Figure 1
 Supplementary Figure 1 Effect of HSP90 inhibition on expression of endogenous retroviruses. (a) Inducible shrna-mediated Hsp90 silencing in mouse ESCs. Immunoblots of total cell extract expressing the
SUPPLEMENTARY INFORMATION
 -. -. SUPPLEMENTARY INFORMATION DOI: 1.1/ncb86 a WAT-1 WAT- BAT-1 BAT- sk-muscle-1 sk-muscle- mir-133b mir-133a mir-6 mir-378 mir-1 mir-85 mir-378 mir-6a mir-18 mir-133a mir- mir- mir-341 mir-196a mir-17
Nature Genetics: doi: /ng Supplementary Figure 1. Clinical timeline for the discovery WES cases.
 Supplementary Figure 1 Clinical timeline for the discovery WES cases. This illustrates the timeline of the disease events during the clinical course of each patient s disease, further indicating the available
Supplemental Figure S1. PLAG1 kidneys contain fewer glomeruli (A) Quantitative PCR for Igf2 and PLAG1 in whole kidneys taken from mice at E15.
 Quantitative PCR for Igf2 and PLAG1 in whole kidneys taken from mice at E15.") Supplemental Figure S1. PLAG1 kidneys contain fewer glomeruli (A) Quantitative PCR for Igf2 and PLAG1 in whole kidneys taken from mice at E15.5, E18.5, P4, and P8. Values shown are means from four technical
Supplemental Figure S1. PLAG1 kidneys contain fewer glomeruli (A) Quantitative PCR for Igf2 and PLAG1 in whole kidneys taken from mice at E15.5, E18.5, P4, and P8. Values shown are means from four technical
ONLINE SUPPLEMENTAL INFORMATION
 1 ONLINE SUPPLEMENTAL INFORMATION Small trna-derived RNAs are increased and more abundant than micrornas in chronic hepatitis B and C Sara R. Selitsky 1-3, Jeanette Baran-Gale 1,2, Masao Honda 4, Daisuke
Supplementary Figure 1 ITGB1 and ITGA11 increase with evidence for heterodimers following HSC activation. (a) Time course of rat HSC activation
 Time course of rat HSC activation") Supplementary Figure 1 ITGB1 and ITGA11 increase with evidence for heterodimers following HSC activation. (a) Time course of rat HSC activation indicated by the detection of -SMA and COL1 (log scale).
Supplementary Figure 1 ITGB1 and ITGA11 increase with evidence for heterodimers following HSC activation. (a) Time course of rat HSC activation indicated by the detection of -SMA and COL1 (log scale).
Computer Science, Biology, and Biomedical Informatics (CoSBBI) Outline. Molecular Biology of Cancer AND. Goals/Expectations. David Boone 7/1/2015
 Outline. Molecular Biology of Cancer AND. Goals/Expectations. David Boone 7/1/2015") Goals/Expectations Computer Science, Biology, and Biomedical (CoSBBI) We want to excite you about the world of computer science, biology, and biomedical informatics. Experience what it is like to be a
Goals/Expectations Computer Science, Biology, and Biomedical (CoSBBI) We want to excite you about the world of computer science, biology, and biomedical informatics. Experience what it is like to be a
microrna Therapeutics Harnessing the power of micrornas to target multiple pathways of disease
 microrna Therapeutics Harnessing the power of micrornas to target multiple pathways of disease January 2018 Safe Harbor Statement Statements contained in this presentation regarding matters that are not
Analysis of Massively Parallel Sequencing Data Application of Illumina Sequencing to the Genetics of Human Cancers
 Analysis of Massively Parallel Sequencing Data Application of Illumina Sequencing to the Genetics of Human Cancers Gordon Blackshields Senior Bioinformatician Source BioScience 1 To Cancer Genetics Studies
Supplementary Figure 1: Digitoxin induces apoptosis in primary human melanoma cells but not in normal melanocytes, which express lower levels of the
 Supplementary Figure 1: Digitoxin induces apoptosis in primary human melanoma cells but not in normal melanocytes, which express lower levels of the cardiac glycoside target, ATP1A1. (a) The percentage
Exploring TCGA Pan-Cancer Data at the UCSC Cancer Genomics Browser
 Exploring TCGA Pan-Cancer Data at the UCSC Cancer Genomics Browser Melissa S. Cline 1*, Brian Craft 1, Teresa Swatloski 1, Mary Goldman 1, Singer Ma 1, David Haussler 1, Jingchun Zhu 1 1 Center for Biomolecular
Mechanisms underlying epigene2c effects of endocrine disrup2ve chemicals. Joëlle Rüegg
 Mechanisms underlying epigene2c effects of endocrine disrup2ve chemicals Joëlle Rüegg 2 EDCs and human health Bisphenol A Epigenetic mechanisms Behavioural and psychiatric disorders Phthalates DNA methylation
SUPPLEMENTARY INFORMATION
 SUPPLEMENTARY INFORMATION Implication of Long noncoding RNAs in the endothelial cell response to hypoxia revealed y RNAsequencing. Voellenkle C., Garcia-Manteiga J. M., Pedrotti S., Perfetti A., De Toma
Supplementary Figure 1
 Supplementary Figure 1 a Location of GUUUCA motif relative to RNA position 4e+05 3e+05 Reads 2e+05 1e+05 0e+00 35 40 45 50 55 60 65 Distance upstream b 1: Egg 2: L3 3: Adult 4: HES 4e+05 3e+05 2e+05 start
EPIGENETIC RE-EXPRESSION OF HIF-2α SUPPRESSES SOFT TISSUE SARCOMA GROWTH
 EPIGENETIC RE-EXPRESSION OF HIF-2α SUPPRESSES SOFT TISSUE SARCOMA GROWTH Supplementary Figure 1. Supplementary Figure 1. Characterization of KP and KPH2 autochthonous UPS tumors. a) Genotyping of KPH2
MicroRNAs Modulate the Noncanonical NF- B Pathway by Regulating IKK Expression During Macrophage Differentiation
 MicroRNAs Modulate the Noncanonical NF- B Pathway by Regulating IKK Expression During Macrophage Differentiation Tao Li 1 *, Michael J. Morgan 1 *, Swati Choksi 1, Yan Zhang 1, You-Sun Kim 2#, Zheng-gang
Inhibition of fatty acid oxidation as a therapy for MYC-overexpressing triplenegative
 SUPPLEMENTARY INFORMATION Inhibition of fatty acid oxidation as a therapy for MYC-overexpressing triplenegative breast cancer Roman Camarda, Alicia Y. Zhou, Rebecca A. Kohnz, Sanjeev Balakrishnan, Celine
Personalized Therapy for Prostate Cancer due to Genetic Testings
 Personalized Therapy for Prostate Cancer due to Genetic Testings Stephen J. Freedland, MD Professor of Urology Director, Center for Integrated Research on Cancer and Lifestyle Cedars-Sinai Medical Center
Dominic J Smiraglia, PhD Department of Cancer Genetics. DNA methylation in prostate cancer
 Dominic J Smiraglia, PhD Department of Cancer Genetics DNA methylation in prostate cancer Overarching theme Epigenetic regulation allows the genome to be responsive to the environment Sets the tone for
PREPARED FOR: U.S. Army Medical Research and Materiel Command Fort Detrick, Maryland
 AD Award Number: W81XWH-1-1-176 TITLE: Suppression of BRCA2 by Mutant Mitochondrial DNA in Prostate Cancer PRINCIPAL INVESTIGATOR: Hsieh, Jer-Tsong CONTRACTING ORGANIZATION: University of Texas Southwestern
SUPPLEMENTARY INFORMATION
 doi:10.1038/nature12215 Supplementary Figure 1. The effects of full and dissociated GR agonists in supporting BFU-E self-renewal divisions. BFU-Es were cultured in self-renewal medium with indicated GR
RNA-Seq Preparation Comparision Summary: Lexogen, Standard, NEB
 RNA-Seq Preparation Comparision Summary: Lexogen, Standard, NEB CSF-NGS January 22, 214 Contents 1 Introduction 1 2 Experimental Details 1 3 Results And Discussion 1 3.1 ERCC spike ins............................................
microrna-200b and microrna-200c promote colorectal cancer cell proliferation via
 Supplementary Materials microrna-200b and microrna-200c promote colorectal cancer cell proliferation via targeting the reversion-inducing cysteine-rich protein with Kazal motifs Supplementary Table 1.
Supplementary Figure 1. Using DNA barcode-labeled MHC multimers to generate TCR fingerprints
 Supplementary Figure 1 Using DNA barcode-labeled MHC multimers to generate TCR fingerprints (a) Schematic overview of the workflow behind a TCR fingerprint. Each peptide position of the original peptide
SUPPLEMENTARY INFORMATION
 DOI:.38/ncb3399 a b c d FSP DAPI 5mm mm 5mm 5mm e Correspond to melanoma in-situ Figure a DCT FSP- f MITF mm mm MlanaA melanoma in-situ DCT 5mm FSP- mm mm mm mm mm g melanoma in-situ MITF MlanaA mm mm
Session 4 Rebecca Poulos
 The Cancer Genome Atlas (TCGA) & International Cancer Genome Consortium (ICGC) Session 4 Rebecca Poulos Prince of Wales Clinical School Introductory bioinformatics for human genomics workshop, UNSW 20
DNA methylation in Uropathology
 DNA methylation in Uropathology Clinical significance Rui Henrique, MD, PhD Director, Department of Pathology Difrector, Department of Education Senior Researcher, Cancer Biology and Epigenetics Group
sirna count per 50 kb small RNAs matching the direct strand Repeat length (bp) per 50 kb repeats in the chromosome
 per 50 kb repeats in the chromosome") Qi et al. 26-3-2564C Qi et al., Figure S1 sirna count per 5 kb small RNAs matching the direct strand sirna count per 5 kb small RNAs matching the complementary strand Repeat length (bp) per 5 kb repeats
Qi et al. 26-3-2564C Qi et al., Figure S1 sirna count per 5 kb small RNAs matching the direct strand sirna count per 5 kb small RNAs matching the complementary strand Repeat length (bp) per 5 kb repeats
TEB. Id4 p63 DAPI Merge. Id4 CK8 DAPI Merge
 a Duct TEB b Id4 p63 DAPI Merge Id4 CK8 DAPI Merge c d e Supplementary Figure 1. Identification of Id4-positive MECs and characterization of the Comma-D model. (a) IHC analysis of ID4 expression in the
From reference genes to global mean normalization
 From reference genes to global mean normalization Jo Vandesompele professor, Ghent University co-founder and CEO, Biogazelle qpcr Symposium USA November 9, 2009 Millbrae, CA outline what is normalization
Table S1. Relative abundance of AGO1/4 proteins in different organs. Table S2. Summary of smrna datasets from various samples.
 Supplementary files Table S1. Relative abundance of AGO1/4 proteins in different organs. Table S2. Summary of smrna datasets from various samples. Table S3. Specificity of AGO1- and AGO4-preferred 24-nt
Supplemental Data. TGF-β-mediated mir-181a expression promotes breast cancer metastasis by targeting Bim.
 Supplemental Data TGF-β-mediated mir-181a expression promotes breast cancer metastasis by targeting Bim. Molly A. Taylor 1, Khalid Sossey-Alaoui 2, Cheryl L. Thompson 3, David Danielpour 4, and William
Nature Neuroscience: doi: /nn Supplementary Figure 1. Neuron class-specific arrangements of Khc::nod::lacZ label in dendrites.
 Supplementary Figure 1 Neuron class-specific arrangements of Khc::nod::lacZ label in dendrites. Staining with fluorescence antibodies to detect GFP (Green), β-galactosidase (magenta/white). (a, b) Class
SSM signature genes are highly expressed in residual scar tissues after preoperative radiotherapy of rectal cancer.
 Supplementary Figure 1 SSM signature genes are highly expressed in residual scar tissues after preoperative radiotherapy of rectal cancer. Scatter plots comparing expression profiles of matched pretreatment
Supplementary Information. Induction of p53-independent apoptosis by ectopic expression of HOXA5
 Supplementary Information Induction of p53-independent apoptosis by ectopic expression of in human liposarcomas Dhong Hyun Lee 1, *, Charles Forscher 1, Dolores Di Vizio 2, 3, and H. Phillip Koeffler 1,
Chapter 2. Investigation into mir-346 Regulation of the nachr α5 Subunit
 15 Chapter 2 Investigation into mir-346 Regulation of the nachr α5 Subunit MicroRNA s (mirnas) are small (< 25 base pairs), single stranded, non-coding RNAs that regulate gene expression at the post transcriptional
ChromHMM Tutorial. Jason Ernst Assistant Professor University of California, Los Angeles
 ChromHMM Tutorial Jason Ernst Assistant Professor University of California, Los Angeles Talk Outline Chromatin states analysis and ChromHMM Accessing chromatin state annotations for ENCODE2 and Roadmap